Embed Size (px)
Citation preview

Eric Grodsky Sociology 360 Spring 2001 1
Lecture 14: probability and the binomial distribution
Review: bias and efficiency Review: probability rules More probability rules Estimating counts: the binomial distribution
• The binomial coefficient
• Parameters for the binomial distribution

Eric Grodsky Sociology 360 Spring 2001 2
Bias
Bias refers to the difference between the mean of the sampling distribution and the parameter of interest
xbias

Eric Grodsky Sociology 360 Spring 2001 3
Efficiency
Efficiency refers to the sampling variance of the estimator
Efficiency is relative-- estimators are more or less efficient than one another
is more efficient than if1x 2x
22
21 xxss

Eric Grodsky Sociology 360 Spring 2001 4
Efficiency
Efficiency is influenced by sample size• Given two estimates of from the same sample
design and the same population, the estimate based on the larger sample will be more efficient
ns
x

Eric Grodsky Sociology 360 Spring 2001 5
Review
The distribution of x and the sampling distribution are different things• A distribution of x has only one
• A distribution of has many
• The mean of x is , but the mean of is
x
x x
x x
x

Eric Grodsky Sociology 360 Spring 2001 6
Review
The central limit theorem is about shape• The shape of any sampling distribution approaches
normality as n increases The law of large numbers is about efficiency
• As n increases, x-bar tends to get closer to Know the difference between the two

Eric Grodsky Sociology 360 Spring 2001 7
Review of probability rules
0P(A) 1 P(S)=1 P(not A)=1-P(A)
• P(not A)+P(A)=1
• P(A)=1-P(not A) P(A) and P(not A) are disjoint

Eric Grodsky Sociology 360 Spring 2001 8
Review of probability rules
If events A and B are disjoint:• P(A or B)=P(A) + P(B)
• P(A and B)=0

Eric Grodsky Sociology 360 Spring 2001 9
P(A and B)
If two events, A and B, are independent:• P(A and B)=P(A)P(B)

Eric Grodsky Sociology 360 Spring 2001 10
P(Chip votes Bush, Lynne votes Bush)
Chip and Lynne are independent observations P(Bush)=0.50, P(Gore)=0.40 P(Bush and Bush)=P(Bush)P(Bush) P(Bush and Bush)=(0.5)(0.5)=0.25 P(Bush and Gore)=(0.5)(0.4)=0.20

Eric Grodsky Sociology 360 Spring 2001 11
Extending the multiplication rule
What is the probability that, given three independently chosen voters, the first two vote for Bush and the last votes for Gore?
P(Bush)=0.5, P(Gore)=0.4

Eric Grodsky Sociology 360 Spring 2001 12
Probability of contraceptive failure
Studies suggest that the failure rate for male condoms is 1.5%
What is the probability of having 0 breaks for 100 condoms used?
What is the probability of having at least one break for 100 condoms used?

Eric Grodsky Sociology 360 Spring 2001 13
Probability of HS dropout
In the 1996-97 school year, approximately 5% of 18-24 year olds enrolled in the 10th through 12th grades dropped out of high school.
What is the probability that two randomly chosen students from this population dropped out?

Eric Grodsky Sociology 360 Spring 2001 14
The general addition rule
For any two events A and B, the probability of A or B occurring is:• P(A or B)=P(A)+P(B)-P(A and B)
This rule holds regardless of whether or not A an B are disjoint

Eric Grodsky Sociology 360 Spring 2001 15
The general addition rule
Why isn’t P(A or B)=P(A) + P(B) when A and B are not disjoint?

Eric Grodsky Sociology 360 Spring 2001 16
Nancy Reagan hypothesis revisited
What is the probability that a randomly selected high school student has tried smoking cigarettes or has tried LSD?
P(smoked or used LSD)=P(smoked)+P(used LSD)-P(smoked and used LSD)

Eric Grodsky Sociology 360 Spring 2001 17
Smoked and used LSD
| Ever smoked Ever used | cigarettes LSD | no yes | Total-----------+----------------------+---------- no | 6049 8153 | 14202 | 38.76 52.24 | 91.00 -----------+----------------------+---------- yes | 65 1340 | 1405 | 0.42 8.59 | 9.00 -----------+----------------------+---------- Total | 6114 9493 | 15607 | 39.17 60.83 | 100.00

Eric Grodsky Sociology 360 Spring 2001 18
Education and income
What is the probability that a randomly chosen adult will have at least a college education or will be in the top income quartile?

Eric Grodsky Sociology 360 Spring 2001 19
Education and income
income | education (categorical)
quartile | < HS HS some coll college > college | Total
-----------+-------------------------------------------------------+----------
1 | 278 395 294 215 85 | 1267
| 5.49 7.80 5.81 4.25 1.68 | 25.03
-----------+-------------------------------------------------------+----------
2 | 242 402 329 226 75 | 1274
| 4.78 7.94 6.50 4.47 1.48 | 25.17
-----------+-------------------------------------------------------+----------
3 | 229 411 321 209 96 | 1266
| 4.52 8.12 6.34 4.13 1.90 | 25.01
-----------+-------------------------------------------------------+----------
4 | 227 347 338 232 110 | 1254
| 4.49 6.86 6.68 4.58 2.17 | 24.78
-----------+-------------------------------------------------------+----------
Total | 976 1555 1282 882 366 | 5061
| 19.28 30.73 25.33 17.43 7.23 | 100.00

Eric Grodsky Sociology 360 Spring 2001 20
Estimating frequencies
The binomial distribution can be useful for estimating counts or frequencies
The distribution may apply if the following conditions are met:• The measure x is dichotomous (success or failure)
• There are a fixed number n of observations
• The n observations are independent
• The probability of success is uniform across observations

Eric Grodsky Sociology 360 Spring 2001 21
Estimating frequencies
What sort of things does this apply to?• Number of students who matriculate at a
university
• Number of contraceptive failures
• Number of cars on which a fuel tank will rupture on a 25 MPH rear impact

Eric Grodsky Sociology 360 Spring 2001 22
The binomial distribution
To identify the binomial distribution for the frequency of some event x, two parameters are necessary:• The number of observation n
• The probability of success p The point is to estimate the probability of
some number of successes or failures
Eric Grodsky Sociology 360 Spring 2001 23
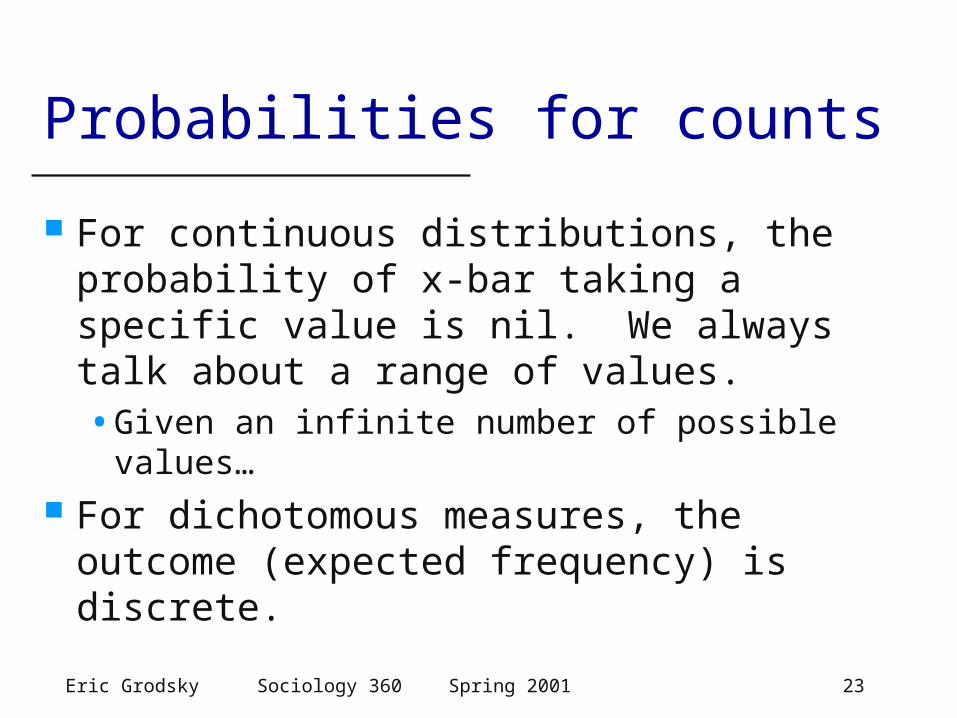
Probabilities for counts
For continuous distributions, the probability of x-bar taking a specific value is nil. We always talk about a range of values.• Given an infinite number of possible values…
For dichotomous measures, the outcome (expected frequency) is discrete.

Eric Grodsky Sociology 360 Spring 2001 24
Building on probability math
What is the probability that 2 out of 5 randomly chosen condoms fails?• We know how to estimate the probability that the
first and fifth condom fail, given P(failure)=0.015
• P(FSSSF)=P(F)*P(S)*P(S)*P(S)*P(F)
• P(FSSSF)=P(F)2*P(S)3= (0.015)2*(0.985)3=0.000215

Eric Grodsky Sociology 360 Spring 2001 25
Contraceptive failure
This gives the probability that a particular 2 of five condoms fails (3 successes)
P(k successes, n-k failures)=pk(1-p)n-k
Next, we need to know how many such combinations there are

Eric Grodsky Sociology 360 Spring 2001 26
How many patterns in 5 trials?
Looking for 2 failures and 3 successes
FSSSF SFSSF SSFFS
FSSFS SFSFS SSSFF
FSFSS SFFSS
FFSSS SSFSF There are ten such combinations

Eric Grodsky Sociology 360 Spring 2001 27
Contraceptive failure
Now that we know the probability of 2 failures in a particular order and the number of combinations of two failures, we can answer the question
P(2 failures in 5 trials)=P(2 failures, 3 successes)*count(combinations with 2 failures, 3 successes)
P(2 failures in 5 trials)=.000215*10=.00215

Eric Grodsky Sociology 360 Spring 2001 28
Estimating the number of combinations
Finding this by hand for 2 successes and 3 failures is not too bad
This gets unwieldly for a larger number of trials
Fortunately, there is a formula for figuring out how many combinations there are

Eric Grodsky Sociology 360 Spring 2001 29
The binomial coefficient
You want to know how many combinations there are of k successes in n independent trials• This is like wanting to count the number of events
in the sample space of n trials for which there are k successes and n-k failures
Eric Grodsky Sociology 360 Spring 2001 30
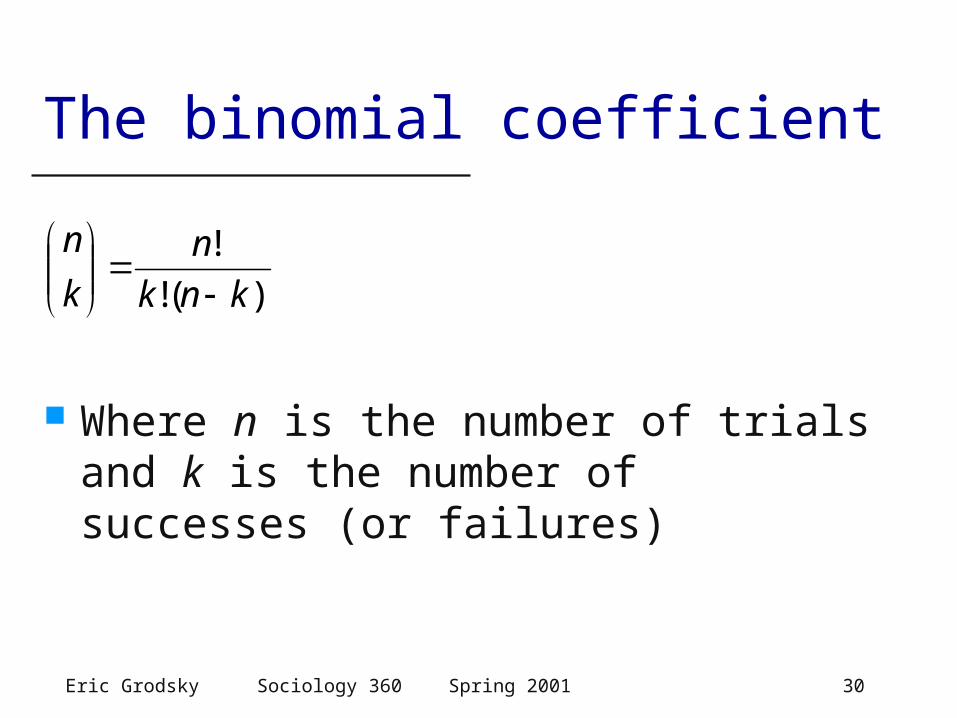
The binomial coefficient
Where n is the number of trials and k is the number of successes (or failures)
)!(!
!
knk
n
k
n

Eric Grodsky Sociology 360 Spring 2001 31
What is n! ?
n! is “n factorial” n!=n*(n-1)*(n-2)*…*1 5!=5*4*3*2*1=120 0!=1 by definition

Eric Grodsky Sociology 360 Spring 2001 32
Contraceptive failure
How many patterns of 3 failures out of 10 condoms are there?

Eric Grodsky Sociology 360 Spring 2001 33
Estimating probabilities with the binomial distribution
Same idea we have already talked about• Probability is number of combinations times
probability for one of those combinations
knk ppk
nkXP
)1()(

Eric Grodsky Sociology 360 Spring 2001 34
Binomial probabilities
What is the probability of one contraceptive failure in 12 condoms?
111211 )985.01(985.011
12)11(
XP

Eric Grodsky Sociology 360 Spring 2001 35
Aid for low income college
What is the probability that 11 of 13 people randomly selected support government aid for low income college students?
n=13, p=0.862
111311 )862.01(862.011
13)11(
XP

Eric Grodsky Sociology 360 Spring 2001 36
Characterizing the binomial distribution
Like other distributions, the binomial can be characterized by its mean and standard deviation
These are characteristics of the theoretical distribution for binomial counts
)1( pnp
np

Eric Grodsky Sociology 360 Spring 2001 37
The binomial distribution
What is the sampling distribution for an SRS of 10 individuals on the college aid question?
p=0.86, n=10 so =10(0.86)=8.6
097.1)14.0)(86.0(10

Eric Grodsky Sociology 360 Spring 2001 38
The binomial distribution (n=10)
Estimate of number supporting aid, using binomial distribution500 samples of 10 observations each
Fra
ctio
n
mu=8.621, sigma=1.0974 5 6 7 8 9 10
0
.2
.4
.6

Eric Grodsky Sociology 360 Spring 2001 39
The binomial distribution (n=10)
count | Freq. Percent Cum.
------------+-----------------------------------
3 | 1 0.20 0.20
5 | 2 0.40 0.60
6 | 20 4.00 4.60
7 | 53 10.60 15.20
8 | 132 26.40 41.60
9 | 172 34.40 76.00
10 | 120 24.00 100.00
------------+-----------------------------------
Total | 500 100.00

Eric Grodsky Sociology 360 Spring 2001 40
Binomial distribution (n=100)Estimate of number supporting aid, using binomial distribution500 samples of 100 observations each
Fra
ctio
n
mu=86.2, sigma=3.47075 80 85 90 95
0
.1
.2

Eric Grodsky Sociology 360 Spring 2001 41
Binomial distribution (n=100) 7* | 7 7* | 8888 7* | 99999999 8* | 00000000000000000 8* | 111111111111111111 8* | 2222222222222222222222 8* | 33333333333333333333333333333333333333333333333333 8* | 44444444444444444444444444444444444444444444444444444 8* | 555555555555555555555555555555555555555 8* | 6666666666666666666666666666666666666666666666666666666666 8* | 777777777777777777777777777777777777777777777777777777777777 8* | 8888888888888888888888888888888888888888888888888 8* | 99999999999999999999999999999999999999999999 9* | 00000000000000000000000000000000000 9* | 11111111111111111111 9* | 22222222222 9* | 333333 9* | 4444 9* | 5

Eric Grodsky Sociology 360 Spring 2001 42
The normal approximation
As n increases, the binomial distribution approximates the normal distribution
Can use the normal approximation (CLT) Formally, as n gets larger, the binomial
distribution is approximately N(np, )
Closer p is to 0.5, closer binomial is to normal
)1( pnp

Eric Grodsky Sociology 360 Spring 2001 43
The binomial and the normal
How close is close enough?• Rule of thumb from Moore is if np10 and
n(1-p)10, the binomial distribution approximates the normal distribution
This shows the importance of p close to 0.5 and of larger n

Eric Grodsky Sociology 360 Spring 2001 44
The binomial and the normal
For n==30
p np n(1-p)
.1 3 27
.3 9 21
.5 15 15
.7 21 9
.9 27 3

Eric Grodsky Sociology 360 Spring 2001 45
The binomial and the normal
For p==.25
n np n(1-p)
10 2.5 7.5
20 5 15
30 7.5 22.5
40 10 30
50 12.5 37.5

Eric Grodsky Sociology 360 Spring 2001 46
The binomial and CLT go to court
Hazelwood School District v. United States (433 U. S. 299. 1977)• A largely rural district in northern St. Louis county
• U. S. government alleges that Hazelwood is guilty of employment discrimination
• Of 405 teachers hired by Hazelwood in the 1972 and 1973 school years, 15 were black

Eric Grodsky Sociology 360 Spring 2001 47
The binomial and CLT go to court
Of all teachers in the St. Louis County employment market, 5.7% were black at that time
If you include the city of St. Louis, 15.5% were black
Under each scenario, what is the probability that by chance only 15 of 405 teachers hired would be black?

Eric Grodsky Sociology 360 Spring 2001 48
Homework due 4/4
Moore: 5.2,3,7,13,16,22,25,29
Project: Analysis plan. Due 3/29. Respond informally in writing to my comments, telling us what analyses you plan to include in your paper and why. Turn this in with your assignment 4. Should be no more than a page or two.