Embed Size (px)
DESCRIPTION
ERES Doctoral Session: Capitalization rates as risk indicator for (non-)efficient properties?. Elaine Wilke Real Estate Management Institute EBS Universität für Wirtschaft und Recht Söhnleinstraße 8d 65201 Wiesbaden. - PowerPoint PPT Presentation
Citation preview

ERES Doctoral Session:
Capitalization rates as risk indicator for (non-)efficient properties?
Elaine Wilke
Real Estate Management InstituteEBS Universität für Wirtschaft und RechtSöhnleinstraße 8d65201 Wiesbaden

Agenda:Capitalization rates as risk indicators for (non-) efficient properties?
2
1.0 Introduction / Research objective
2.0 Data and Research Method
3 .0 Results
4.0 Conclusion
Elaine WilkeREMI, 2010-06-23

3
1.0 Introduction
• Risk of (non-)efficient properties
• so far only research and publications from the investors’ perspective
• But: most sustainability aspects influence the operating and occupancy costs of the occupier;
these costs are not taken into consideration when calculating the NOI
• how are the results going to change if also the occupiers’ goals are considered?
• investors: higher net rents and/or higher returns
• occupiers: reduced operation and occupancy costs
• both perspectives interact in the valuation process:
sustainable (efficient) properties realize higher Capital Values than non-sustainable (efficient) properties,
as sustainability (efficiency) reduces the property specific risk
• Hypothesis:
The capitalization rate as all risks yield interacts as indicator for the risk of (non-) efficient properties
higher risk premiums for non-efficient properties!
Elaine WilkeREMI, 2010-06-23

Capitalization rates as risk indicators for (non-) efficient properties?
4Elaine Wilke
REMI, 2010-06-23
1.0 Introduction / Research objective
2.0 Data and Research Method
3 .0 Results
4.0 Conclusion
5
2.1 Data
Data from Investors and Occupiers:
IPD Investment Property Databank UK IPD Occupiers Databank UK
Sample size n = 47 objects (in both databanks for 2007 and 2008)
Elaine WilkeREMI, 2010-06-23

6
2.2 Research Method
Partial Least Squares (PLS) – method (according to Wold)
causal relationships between (in)dependant (latent) variables also available for smaller sample sizes any measurement levels separate calculation for 2007 and 2008
Illustration of the cause-effect relations (directions and sings) between the hypothesis and the latent variables.
Elaine WilkeREMI, 2010-06-23
7
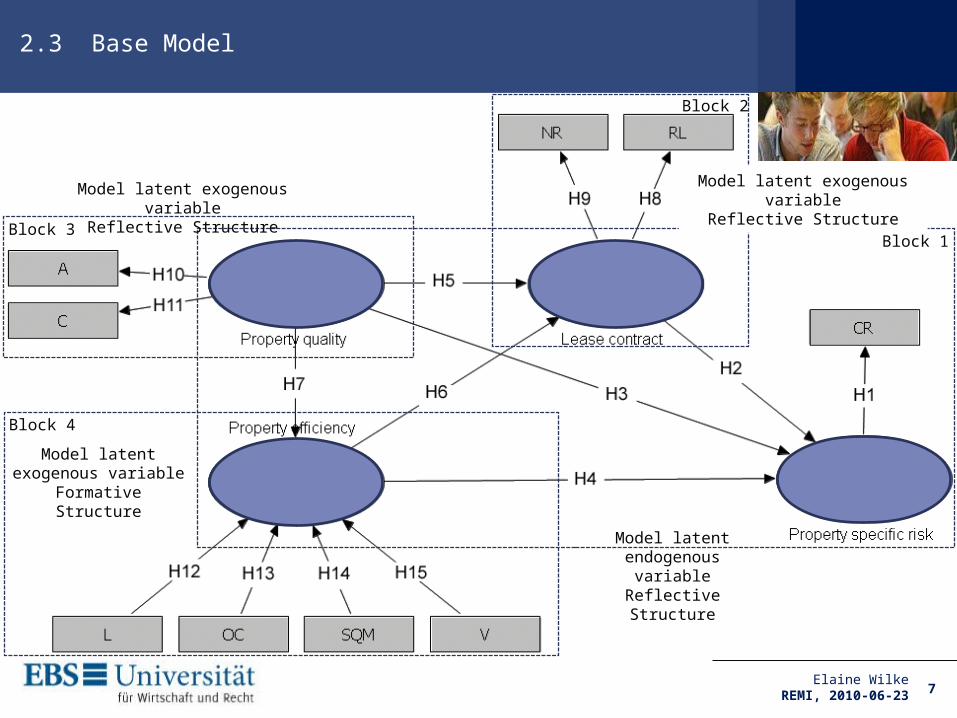
2.3 Base Model
Elaine WilkeREMI, 2010-06-23
Block 1
Block 2
Block 3
Block 4
Model latent exogenous variable
Reflective Structure
Model latent exogenous variable
Reflective Structure
Model latent exogenous variable
Formative Structure
Model latent endogenous variableReflective Structure
8
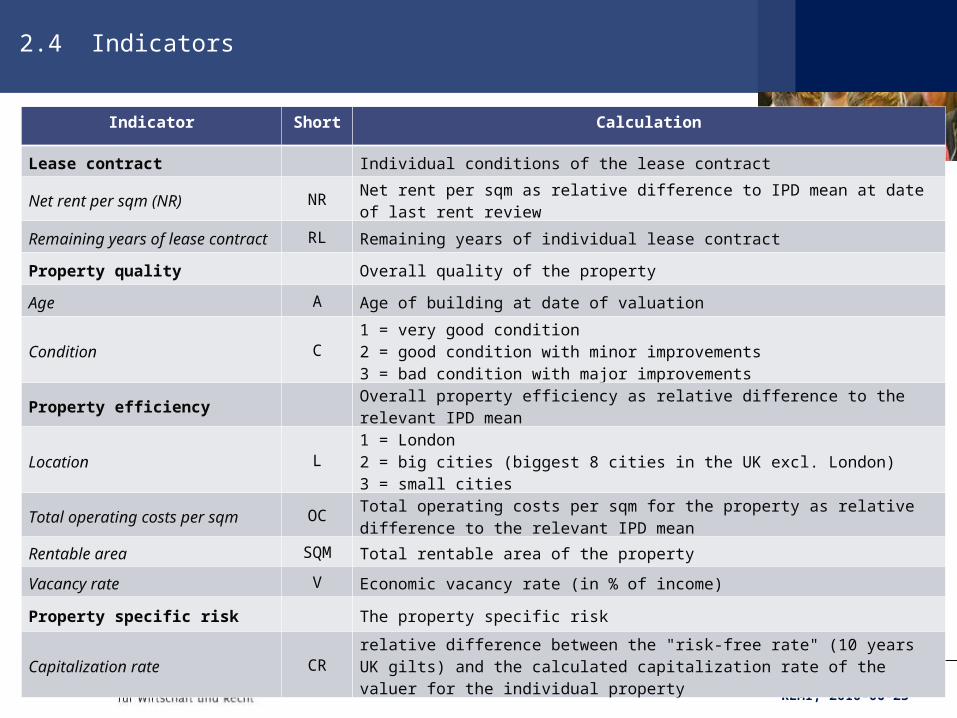
2.4 Indicators
Elaine WilkeREMI, 2010-06-23
Indicator Short Calculation
Lease contract Individual conditions of the lease contract
Net rent per sqm (NR) NR Net rent per sqm as relative difference to IPD mean at date of last rent review
Remaining years of lease contract RL Remaining years of individual lease contract
Property quality Overall quality of the property
Age A Age of building at date of valuation
Condition C1 = very good condition2 = good condition with minor improvements3 = bad condition with major improvements
Property efficiency Overall property efficiency as relative difference to the relevant IPD mean
Location L1 = London2 = big cities (biggest 8 cities in the UK excl. London)3 = small cities
Total operating costs per sqm OCTotal operating costs per sqm for the property as relative difference to the relevant IPD mean
Rentable area SQM Total rentable area of the property
Vacancy rate V Economic vacancy rate (in % of income)
Property specific risk The property specific risk
Capitalization rate CRrelative difference between the "risk-free rate" (10 years UK gilts) and the calculated capitalization rate of the valuer for the individual property

9
2.4 Indicator - Total Operating Costs per sqm
IPD International Total Occupancy Cost Code (ITOCC):
Source: IPD ITOCC 4th edition
Elaine WilkeREMI, 2010-06-23
Elements of the IPD Total Operating Costs per sqm:
consolidated service charge insurance internal repair and maintenance M&A repair and maintenance external/structural repair and maintenance minor improvements internal moves reinstatement security cleaning waste disposal internal plants and flowers ground maintenance water, sewerage energy

Capitalization rates as risk indicators for (non-) efficient properties?
10Elaine Wilke
REMI, 2010-06-23
1.0 Introduction / Research objective
2.0 Data and Research Method
3 .0 Results
4.0 Conclusion

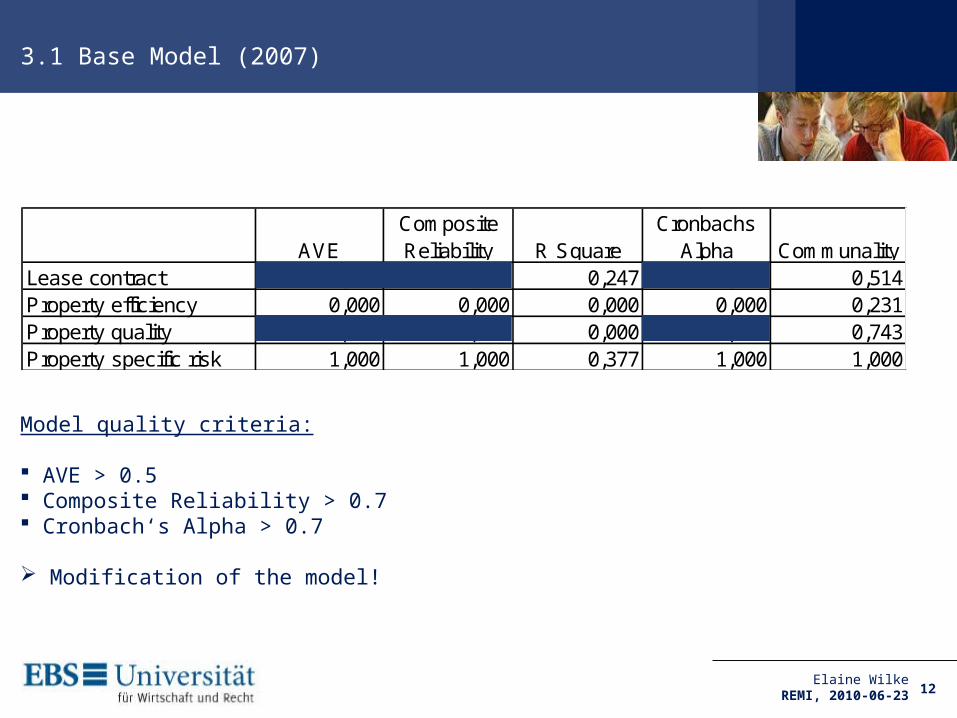
3.1 Base Model (2007)
11Elaine Wilke
REMI, 2010-06-23
R²
AVEComposite Reliability R Square
Cronbachs Alpha Communality
Lease contract 0,514 0,363 0,247 -0,152 0,514Property efficiency 0,000 0,000 0,000 0,000 0,231Property quality 0,743 0,851 0,000 0,674 0,743Property specific risk 1,000 1,000 0,377 1,000 1,000
3.1 Base Model (2007)
12
Model quality criteria: AVE > 0.5 Composite Reliability > 0.7 Cronbach‘s Alpha > 0.7
Modification of the model!
Elaine WilkeREMI, 2010-06-23

13
3.2 Model – modified (2007)
Elaine WilkeREMI, 2010-06-23
R²
AVEComposite Reliability R Square
Cronbachs Alpha Communality
Property efficiency 0,00 0,00 0,08 0,00 1,00Property quality 0,75 0,86 0,00 0,67 0,75Property specific risk 1,00 1,00 0,28 1,00 1,00

14
3.2 Model – modified (2007)
Discriminant Validity
Outer Loadings > 0.7 support validation of reflective model
Cross Loadings < Outer Loadings no multicollinearity
degree to which two measures designed to measure similar or conceptually related constructs:√AVE > Latent Variable Correlation no relation
Elaine WilkeREMI, 2010-06-23
Property efficiency
Property quality
Property specific risk
A 0,00 0,90 0,00C 0,00 0,83 0,00CR 0,00 0,00 1,00V 1,00 0,00 0,00
Property efficiency
Property quality
Property specific risk
A -0,16 0,90 -0,52C -0,33 0,83 -0,30CR -0,06 -0,49 1,00V 1,00 -0,28 -0,06
Property efficiency
Property quality
Property specific risk
Property efficiency 0,000 0,000 0,000Property quality -0,275 0,867 0,000Property specific risk -0,058 -0,485 1,000

Original
Sample (O)Sample
Mean (M)Standard Deviation
Standard Error
T Statistics (|O/STERR|)
A <- Property quality 0,899 0,900 0,012 0,012 74,650C <- Property quality 0,833 0,833 0,024 0,024 35,420CR <- Property specific risk 1,000 1,000 0,000 0,000 0,000V -> Property efficiency 1,000 1,000 0,000 0,000 0,000
15
3.2 Model – modified (2007) - Bootstrapping
Estimating the distribution of the statistic by using the bootstrapping method The calculation is based on 300 cases and 500 samples
standard errors with values < 0.04 suggest a low level of uncertainty
T Statistics indicate a good fit of the model explaining the degree of variability of the dependent variable
Elaine WilkeREMI, 2010-06-23

16
3.2 Model – modified (2007)
bigger role in explaining than in predicting as q² <f²
The effect size (f²) with a value of 0.088 has to be interpreted according to Cohen as a low to medium effect with f² <0.15.
Q² with 0.267 implies predictive relevance
The calculated GoF (.401) is higher than the marginal value of > .275 indicating that the model strongly fits the set of observations.
R² = 27,53%
GoF = 0,401
Elaine WilkeREMI, 2010-06-23
T-Statistics f² q²Property efficiency 5,542Property quality 13,454
0,0883 0,0879

17
3.3 Model – modified (2008)
Elaine WilkeREMI, 2010-06-23
R²
AVEComposite Reliability R Square
Cronbachs Alpha Communality
Property efficiency 0,00 0,00 0,05 0,00 1,00Property quality 0,69 0,81 0,00 0,67 0,69Property specific risk 1,00 1,00 0,11 1,00 1,00
Capitalization rates as risk indicators for (non-) efficient properties?
18Elaine Wilke
REMI, 2010-06-23
1.0 Introduction / Research objective
2.0 Data and Research Method
3 .0 Results
4.0 Conclusion

19
4.0 Conclusion
Elaine WilkeREMI, 2010-06-23
Type of Hypothesis Supported Not supported
Indicators -> latent variable
H1: Property specific risk-> CRH10: A->Property qualityH11: C->Property qualityH15: V->Property efficiency
H8: Lease contract-> RLH9: Lease contract-> NRH12: L->Property efficiencyH13: OC->Property efficiencyH14: SQM->Property efficiency
Exogenous -> exogenous variable
H7: Property quality->Property efficiency
H5: Property quality->Lease contractH6: Property efficiency-> Lease contract
Exogenous -> endogenous variable
H3: Property quality-> Property specific riskH4: Property efficiency-> Property specific risk
H2: Lease contract-> Property specific risk

20
4.0 Base Model
Elaine WilkeREMI, 2010-06-23
Block 1
Block 2
Block 3
Block 4
Model latent exogenous variable
Reflective Structure
Model latent exogenous variable
Reflective Structure
Model latent exogenous variable
Formative Structure
Model latent endogenous variableReflective Structure

21
4.0 Conclusion
so far only minor consideration of property characteristics in the derivation of the cap rate
changes in the (economic) environment dominate the choice of the risk premium
no integration of use efficiency
occupiers’ perspectives are ignored
future consideration of (non-)efficiency ?
review of the interrelations with bigger sample sizes
Elaine WilkeREMI, 2010-06-23

Capitalization rates as risk indicators for (non-) efficient properties?
22
Thank you!
Elaine WilkeREMI, 2010-06-23