Embed Size (px)
Citation preview
ERD
C/CR
REL
TR
-06
-13
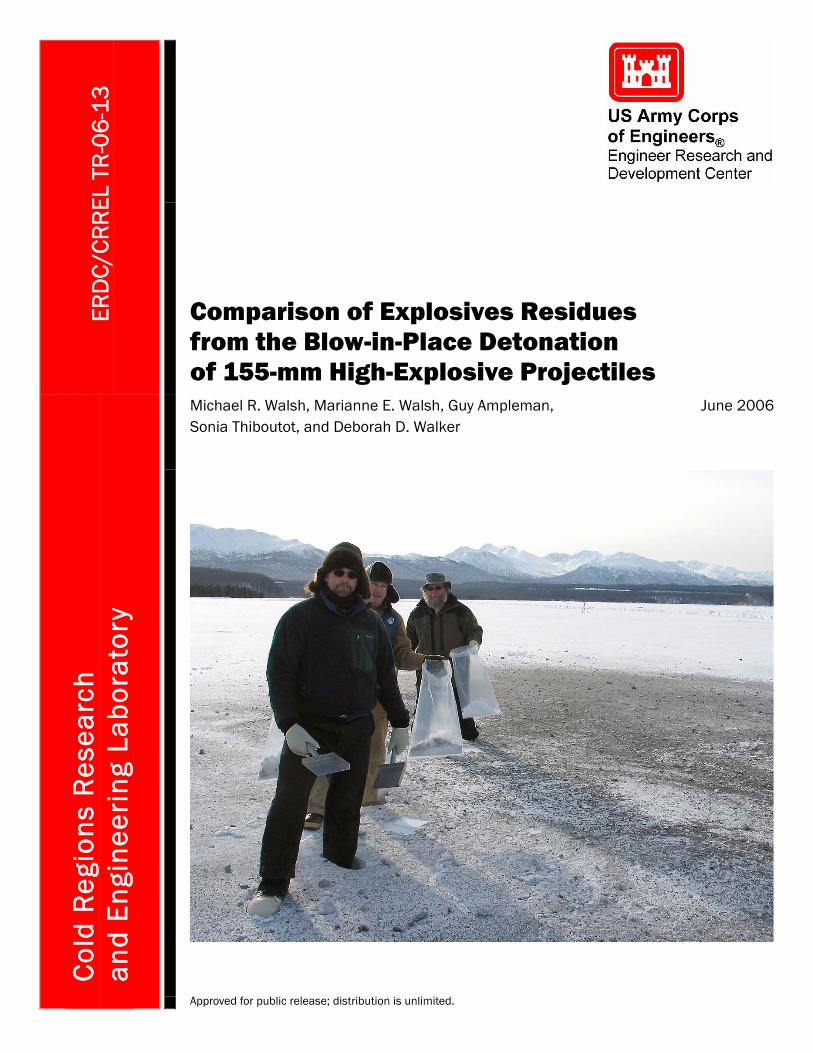
Comparison of Explosives Residues from the Blow-in-Place Detonation of 155-mm High-Explosive Projectiles
Michael R. Walsh, Marianne E. Walsh, Guy Ampleman, Sonia Thiboutot, and Deborah D. Walker
June 2006
Col
d R
egio
ns
Res
earc
h
and
En
gin
eeri
ng
Lab
orat
ory
Approved for public release; distribution is unlimited.

COVER: Multi-increment sampling of a blow-in-place detonation plume on snow-covered ice, Fort Richardson, Alaska. (Photo by D.D. Walker, 19 March 2004)
ERDC/CRREL TR-06-13 June 2006
Comparison of Explosives Residues from the Blow-in-Place Detonation of 155-mm High-Explosive Projectiles
Michael R. Walsh Marianne E. Walsh
Cold Regions Research and Engineering Laboratory U.S. Army Engineer Research and Development Center 72 Lyme Road Hanover, New Hampshire 03755-1290
Guy Ampleman Sonia Thiboutot
Defence Research and Development Center–Valcartier 2459 Pie-XI Boulevard North Québec G3J 1X5 Canada
Deborah D. Walker
Military Munitions Center of Expertise U.S. Army Engineering and Support Center U.S. Army Corps of Engineers P.O. Box 1600 Huntsville, Alabama 35807-4301
Final report
Approved for public release; distribution is unlimited.
Prepared for Strategic Environmental Research and Development Program (SERDP) Arlington, Virginia 22203
ii ERDC/CRREL TR-06-13
ABSTRACT
The disposal of unexploded ordnance is a potential source of explosives resi-dues on ranges. Blow-in-place detonation of munitions currently is done to clear these areas for safety without an emphasis on the consumption of the explosive load. The general testing method is to detonate the horizontal fuzed projectile with one block of C4 explosive. Explosives residues from blow-in-place disposal were examined using several different detonation configurations. Seven 155-mm fuzed high-explosive projectiles were detonated on a snow-and-ice-covered range on Fort Richardson, Alaska, to obtain baseline data on the current testing method. Tests were then conducted using the same type of projectiles in three configura-tions: fuzed rounds vertically oriented, fuzed rounds horizontally oriented with two donor charges, and a non-fuzed horizontal round with one donor charge. Recovered energetic residues indicate explosive load consumption in excess of 99.998% for all tests, ranging from 12 to 62 mg per round. This compares to 0.31 mg per round for live-fire detonation of the same-type rounds. Although two orders of magnitude higher, residue quantities for proper blow-in-place detona-tion of these munitions are quite small and are unlikely to result in significant explosives residues on ranges when compared to low-order or unaddressed unexploded ordnance.
DISCLAIMER: The contents of this report are not to be used for advertising, publication, or promotional purposes. Citation of trade names does not constitute an official endorsement or approval of the use of such commercial products. All product names and trademarks cited are the property of their respective owners. The findings of this report are not to be construed as an official Department of the Army position unless so designated by other authorized documents.
DESTROY THIS REPORT WHEN NO LONGER NEEDED. DO NOT RETURN IT TO THE ORIGINATOR.
Comparison of Explosives Residues iii
CONTENTS
Preface .................................................................................................................. v 1 Introduction ..................................................................................................... 1 2 Field Tests ....................................................................................................... 3
Field Site ......................................................................................................... 3 Munitions ........................................................................................................ 4 Tests ................................................................................................................ 5 Sampling Method ............................................................................................ 8 Sample Processing and Analysis ..................................................................... 9 Quality Control Procedures ........................................................................... 11
3 Results ........................................................................................................... 12 Baseline Samples........................................................................................... 12 Alternative BIP Samples ............................................................................... 16
4 Conclusions ................................................................................................... 22 References............................................................................................................ 23 Appendix A: Munitions Data............................................................................... 25 Appendix B: Baseline Test Data.......................................................................... 26 Appendix C: Alternative BIP Test Data .............................................................. 28
ILLUSTRATIONS
Figure 1. Eagle River Flats impact area................................................................. 3 Figure 2. 155-mm projectile used in baseline and alternative BIP tests ................ 4 Figure 3. Test configurations for 155-mm alternative BIP tests............................ 6 Figure 4. Snow sampling tools .............................................................................. 9 Figure 5. Sample filtration setup.......................................................................... 10 Figure 6. Layout of baseline detonation test ........................................................ 13 Figure 7. Layout of alternative BIP detonation test ............................................. 17
iv ERDC/CRREL TR-06-13
TABLES
Table 1. Physical data for plumes: Baseline tests ................................................ 12 Table 2. Mass of HMX, RDX, and TNT estimated in plumes: Baseline tests..... 15 Table 3. Physical data for plumes: Alternative BIP tests..................................... 16 Table 4. Analytical data for plumes: Alternative BIP tests.................................. 18 Table 5. Background and processing QC test data .............................................. 19 Table 6. Comparison of results of blow-in-place detonation tests....................... 20 Table 7. Detonation efficiencies of the BIP tests................................................. 21
Comparison of Explosives Residues v
PREFACE
This report was prepared by Michael R. Walsh, Engineering Resources Branch, U.S. Army Engineer Research and Development Center (ERDC), Cold Regions Research and Engineering Laboratory (CRREL), Hanover, New Hampshire; Marianne E. Walsh, Environmental Sciences Branch, ERDC-CRREL; Dr. Sonia Thiboutot and Dr. Guy Ampleman, Defence Research and Development Canada–Valcartier, PQ, Canada; and Deborah D. Walker, Military Munitions Center of Expertise, Huntsville, Alabama.
Field work on active impact ranges is a difficult and complicated matter and requires the cooperation and assistance of many people. The authors thank the soldiers and officers of the 4th Battalion, 11th Infantry Brigade, for their assistance with the detonation of the test rounds. The authors also thank George Alexion and L.D. Fleshman of USARAK Range Control for granting access to the range. The field crew for this work included Dr. Jon Zufelt, Charles M. Collins, Dr. Thomas A. Douglas, Kevin Bjella, and Ronald N. Bailey of CRREL; Thomas E. Berry, Jr., of ERDC’s Environmental Lab; and James Ratcliff of Clearwater Environmental. JoAnn Walls of Alaska District, U.S. Army Corps of Engineers, provided valuable technical contracting assistance. Internal manu-script review was provided by Dr. Susan Taylor and Kevin Bjella of CRREL. Funding was provided jointly by the USARAK Soil and Water Fund through Charles Collins, SERDP Project ER-1155 through Dr. Thomas Jenkins and Dr. Judith Pennington, and the Huntsville Munitions Center of Expertise, with additional support from the U.S. Army Alaska Garrison Command.
This report was prepared under the general supervision of Dr. Lance D. Hansen, Deputy Director, CRREL; and James L. Wuebben, Acting Director, CRREL.
The Commander and Executive Director of the Engineer Research and Development Center is Colonel James R. Rowan. The Director is Dr. James R. Houston.
Comparison of Explosives Residues from the Blow-in-Place Detonation
of 155-mm High-Explosive Projectiles
MICHAEL R. WALSH, MARIANNE E. WALSH, GUY AMPLEMAN, SONIA THIBOUTOT, AND DEBORAH D. WALKER
1 INTRODUCTION
Firing ranges provide soldiers the opportunity to train using a variety of munitions. However, live-fire training results in unexploded ordnance, low- order detonations with a significant fraction of the high explosive remaining unconsumed, and small quantities of explosives residues from fully functioning high-order detonations. All of these sources may contaminate the soil and the groundwater, thereby threatening human health and the environment, and result in loss of use of the facility.
Hundreds of thousands of rounds are fired into military impact ranges each year (Foster 1998). The majority of these rounds detonate cleanly and efficiently and deposit very little explosives residue (Hewitt et al. 2003, Taylor et al. 2004, Walsh et al. 2005a, b). However, a small percentage of the ordnance, estimated to be less than 2%, does not function properly, resulting in unexploded ordnance (Dauphin and Doyle 2000). Unexploded ordnance (UXO) is a serious range safety hazard. Along with low-order detonations, in which only part of the filler is consumed, UXO is the most significant point source for high-explosive (HE) contamination on the range. Range closures due to contamination have driven the military toward more thorough range maintenance, including clearance of UXO. Studies show that the disposal of these items in situ (blow-in-place [BIP]) is not as efficient as live-fire detonation of munitions and may result in the deposition of significant quantities of explosives on the range (Walsh et al. 2005b).
Few test data existed on BIP residues, including data on residues resulting from variations of detonation methods. A method of determining residues resulting from blow-in-place operations of UXO was needed. Methods developed by Jenkins et al. (2000) and Walsh et al. (2005a) on snow-covered ice for both live-fire and BIP detonations allow the isolation of detonation residues from
2 ERDC/CRREL TR-06-13
previous range activities, the effective demarcation of the residue plume, and the efficient collection of residues for analysis. BIP tests were conducted on a variety of rounds using the “standard” method of detonating the round, a 0.57-kg block of C4 explosive adjacent to the nose of a horizontal fuzed round. One of the findings of this research and the work of other organizations and explosive ordnance disposal technicians is that a standard method of UXO disposal does not exist.
In 2004, we conducted a series of BIP tests on 155-mm howitzer projectiles. Seven of these projectiles were detonated using the standard BIP method described above. Field conditions were ideal for these tests (very little wind, overcast skies, subfreezing temperatures, and no precipitation), and with several rounds remaining following these tests, we conducted a test using alternative BIP methods. For this test, we sampled the residue from seven Composition B-filled 155-mm artillery projectiles detonated in various configurations with C4 donor charges to determine whether there is a significant difference in residues resulting from these different methods. These configurations have been used in the past by other research groups. The study objective is to determine whether the results from tests done by these means are comparable to the results from the standard BIP method used in CRREL’s research.
Comparison of Explosives Residues 3
2 FIELD TESTS
Field Site
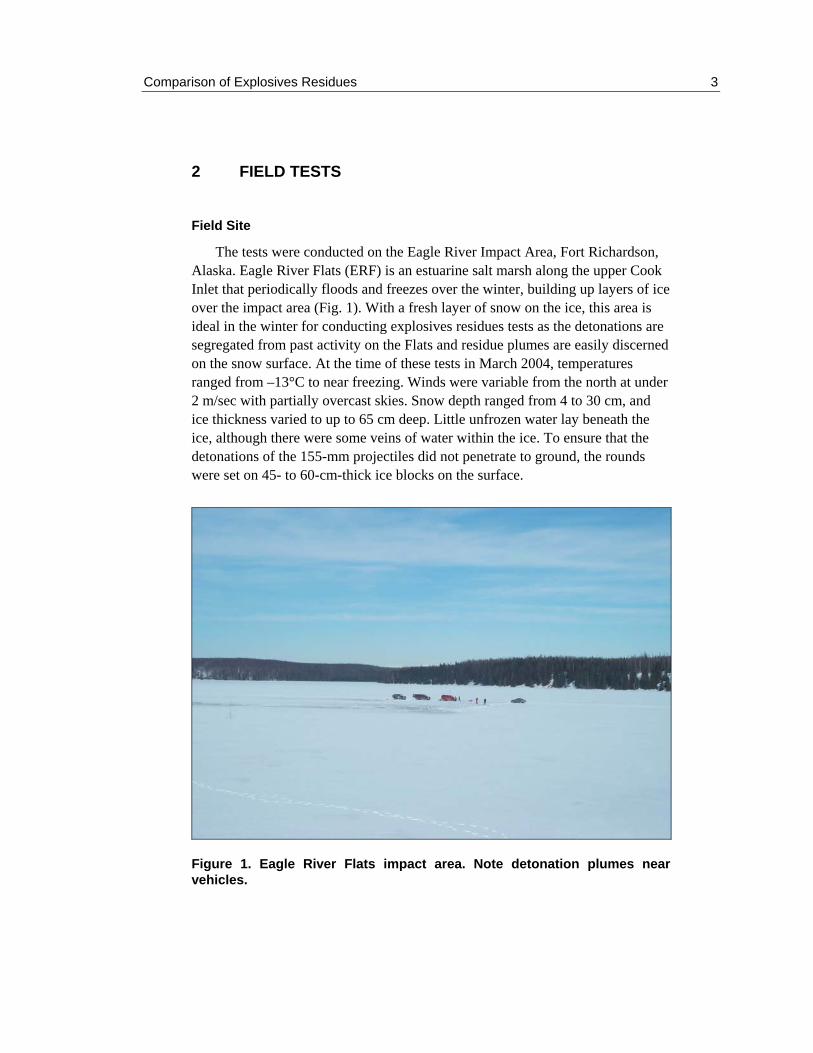
The tests were conducted on the Eagle River Impact Area, Fort Richardson, Alaska. Eagle River Flats (ERF) is an estuarine salt marsh along the upper Cook Inlet that periodically floods and freezes over the winter, building up layers of ice over the impact area (Fig. 1). With a fresh layer of snow on the ice, this area is ideal in the winter for conducting explosives residues tests as the detonations are segregated from past activity on the Flats and residue plumes are easily discerned on the snow surface. At the time of these tests in March 2004, temperatures ranged from –13°C to near freezing. Winds were variable from the north at under 2 m/sec with partially overcast skies. Snow depth ranged from 4 to 30 cm, and ice thickness varied to up to 65 cm deep. Little unfrozen water lay beneath the ice, although there were some veins of water within the ice. To ensure that the detonations of the 155-mm projectiles did not penetrate to ground, the rounds were set on 45- to 60-cm-thick ice blocks on the surface.
Figure 1. Eagle River Flats impact area. Note detonation plumes near vehicles.
4 ERDC/CRREL TR-06-13
Munitions
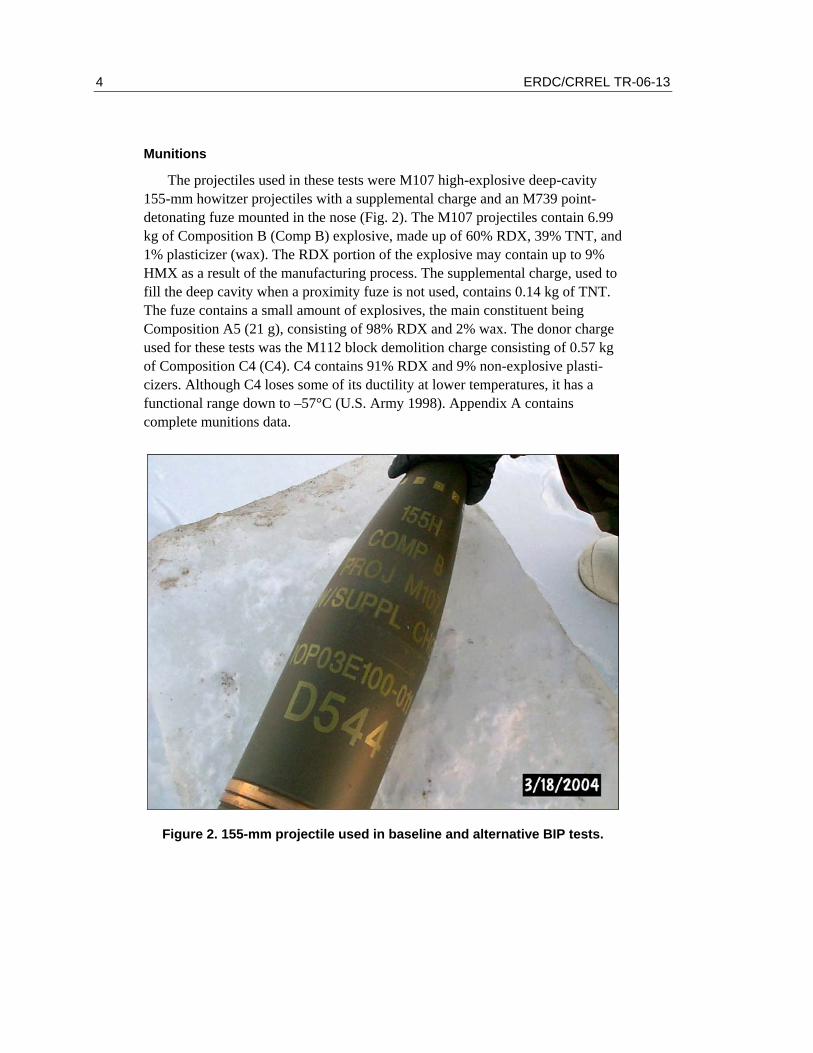
The projectiles used in these tests were M107 high-explosive deep-cavity 155-mm howitzer projectiles with a supplemental charge and an M739 point-detonating fuze mounted in the nose (Fig. 2). The M107 projectiles contain 6.99 kg of Composition B (Comp B) explosive, made up of 60% RDX, 39% TNT, and 1% plasticizer (wax). The RDX portion of the explosive may contain up to 9% HMX as a result of the manufacturing process. The supplemental charge, used to fill the deep cavity when a proximity fuze is not used, contains 0.14 kg of TNT. The fuze contains a small amount of explosives, the main constituent being Composition A5 (21 g), consisting of 98% RDX and 2% wax. The donor charge used for these tests was the M112 block demolition charge consisting of 0.57 kg of Composition C4 (C4). C4 contains 91% RDX and 9% non-explosive plasti-cizers. Although C4 loses some of its ductility at lower temperatures, it has a functional range down to –57°C (U.S. Army 1998). Appendix A contains complete munitions data.
Figure 2. 155-mm projectile used in baseline and alternative BIP tests.
Comparison of Explosives Residues 5
Tests
Two tests were conducted in March 2004. The first test was conducted on 17 March with seven projectiles detonated, each using one block of C4 attached with duct tape to the fuzed nose of the round. The results are reported in Walsh et al. (2005a) and serve as the baseline for comparison to the alternative BIP tests.
Based on the observed results of the baseline tests, we discussed possible alternative BIP methods that would allow direct comparisons to be made with tests conducted using different initiation protocols. Two methods used in prior tests by other labs included detonation of unfuzed rounds using a single M112 charge near the nose cavity of the projectile (Dube et al. 2004) and the use of two M112 charges on the fuzed M107 projectile (Walker et al. 2004). Both these tests were conducted with the round lying on its side (horizontal). Tests were conducted by CRREL in February 2002 at Camp Ethan Allen, Vermont, using eight unfuzed TNT-filled M107 projectiles hung nose-up from framing (Hewitt et al. 2003). Windy conditions limited the quality of the tests, so we decided to con-duct a similar test with fuzed vertical rounds at the Flats.
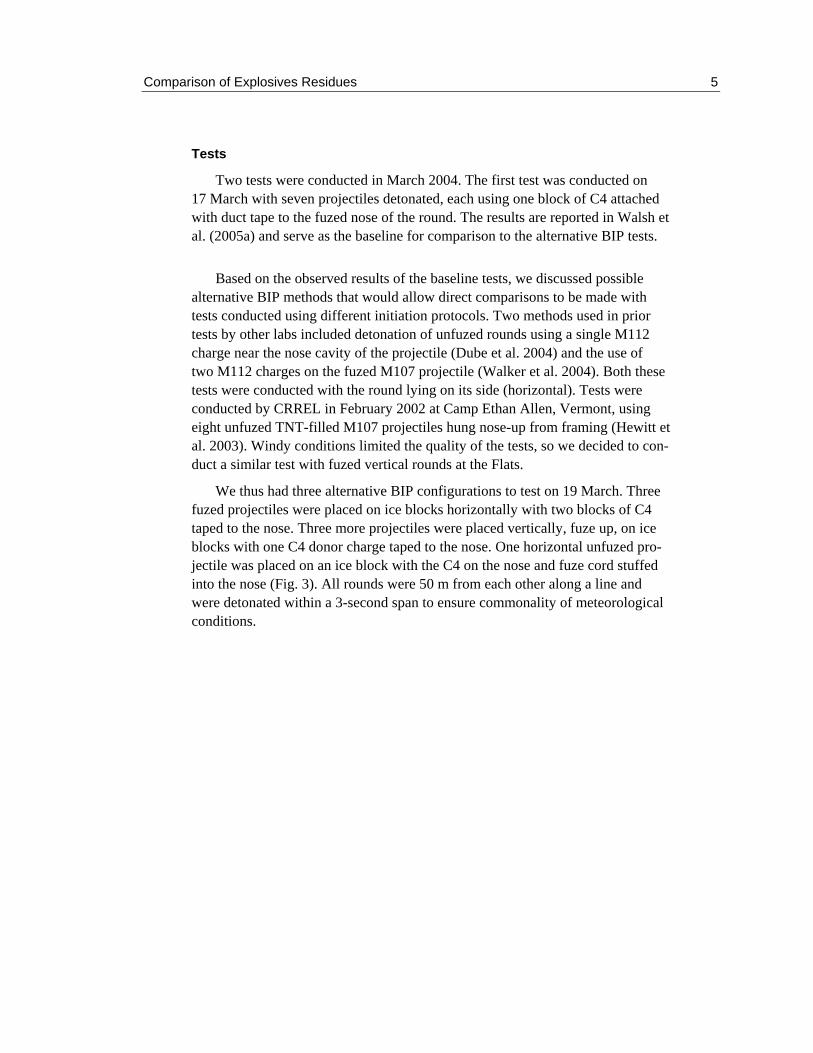
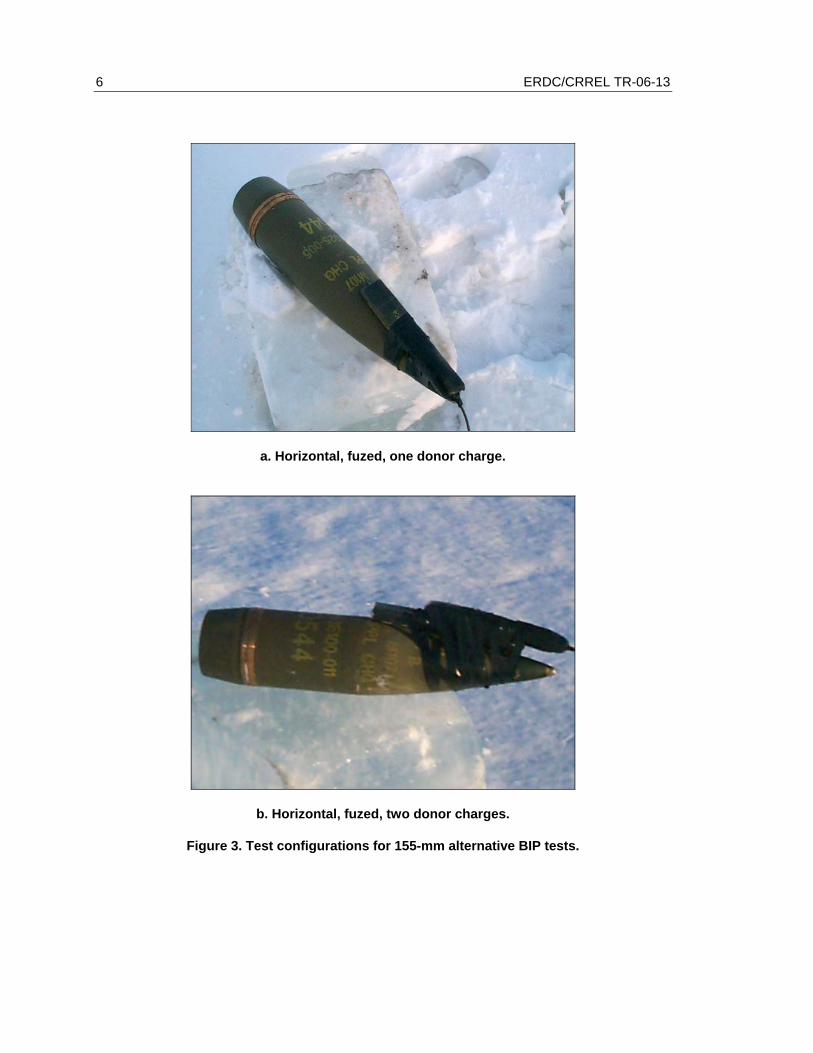
We thus had three alternative BIP configurations to test on 19 March. Three fuzed projectiles were placed on ice blocks horizontally with two blocks of C4 taped to the nose. Three more projectiles were placed vertically, fuze up, on ice blocks with one C4 donor charge taped to the nose. One horizontal unfuzed pro-jectile was placed on an ice block with the C4 on the nose and fuze cord stuffed into the nose (Fig. 3). All rounds were 50 m from each other along a line and were detonated within a 3-second span to ensure commonality of meteorological conditions.
6 ERDC/CRREL TR-06-13
a. Horizontal, fuzed, one donor charge.
b. Horizontal, fuzed, two donor charges.
Figure 3. Test configurations for 155-mm alternative BIP tests.
Comparison of Explosives Residues 7
c. Vertical, fuzed, one donor charge.
d. Horizontal, no fuze, one donor charge.
Figure 3 (cont’d).
8 ERDC/CRREL TR-06-13
Sampling Method
Prior to post-detonation sampling, the plumes were visually inspected for continuity and overlap. The plumes were clearly separated, suggesting no cross-contamination between detonations. They were visually demarcated and physi-cally delineated by walking along the edge. The criterion used was a thinning of the plume from black to the point of difficulty in discerning any discoloration of the snow surface. The area was then recorded using a global positioning system (Trimble GPS Pathfinder Pro XR, ± 1-m accuracy).
For each detonation, we collected approximately one hundred 0.01-m2 snow samples from the entire plume and treated them as a single sample (large multi-increment sample method [LIS]). Although less total surface area is sampled than in the method originally developed by Jenkins, the large number of smaller incre-ments provides a more widespread coverage of the plume, reducing the tendency toward sampling bias and better estimating the average concentration of the HE in the plume (Jenkins et al. 2005, Walsh et al. 2005a). The total sample size for the multi-increment sampling method is ≈1 m2 compared to 5 to 17 m2 for the original sampling method. The trade-off with the LIS method comes with the small percent of area sampled, which can lead to variability between the samples. Duplicate or triplicate samples collected from each plume allowed us to test and compensate for this uncertainty. We also collected 40-increment 0.04-m2 MIS samples (medium [≈40] increment samples) from two of the baseline plumes for comparison with the LIS sampling method.
To estimate the mass of energetic residues, we need to know the area over which HE is deposited and the average concentration for that area. A critical assumption is that the plume represents the major area of deposition. The plume is composed of soot from the detonation and its depositional pattern can be affected by wind. However, because there is no other way to estimate the area of deposition, we assume that most HE residue is deposited within the plume and tested this assumption by taking multi-increment samples in concentric annuli around the outside of the plume (OTP). The objectives of OTP sampling are to ensure that the plume is adequately outlined and to determine how much, if any, of the HE is measurable outside of the plume. Samples were obtained for annuli at two distances (0–3 and 3–6 m) surrounding the plume edge.
Additional quality control work was done with the plumes. Subsurface samples were taken beneath the MIS sample locations to test whether we were sampling deep enough to recover all the residues. We also ran a three-zone gradient test (dark, medium, and light areas) on one plume to get an indication of whether the samplers were biased toward sampling the darker sections of the plume “where the good stuff is.”
Comparison of Explosives Residues 9
We used Teflon-lined aluminum scoops to collect either a 10-cm- × 10-cm- × 1-cm-deep volume of snow or a 20-cm- × 20-cm- × 1-cm-deep volume of snow (Fig. 4). All the snow samples were placed in clean, labeled polyethylene bags. Specifics of the firing point and impact point samples are given below.
Figure 4. Snow sampling tools. a. 10- × 10- × 2-cm scoop; b. 15- × 15- × 2-cm scoop; c. 20- × 20- × 2-cm scoop; d. 45-cm snow shovel (original sampling method).
Sample Processing and Analysis
The multi-increment snow samples were transferred to a lab set up nearby on post for processing. Upon arrival, the samples were double-bagged and placed in clean polyethylene tubs for thawing. Double-bagging was necessary because of the inclusion of sharp pieces of the projectile (frag) collected with the snow samples. Frag inclusions can pierce the sample bags, allowing the thawed sample to leak. Samples were shifted from warmer to cooler areas of the logistics bay of the lab to prevent over-warming of the samples (>10°C). The melted samples were then processed. Processing involves filtering the samples through a vacuum system, separating the soot fraction from the aqueous fraction (Fig. 5). The soot fraction is collected on 0.45-µm filter papers, the filters are placed in a clean
10 ERDC/CRREL TR-06-13
amber jar, and the sample is stored in a refrigerator at <5°C. Any energetic com-pounds in the water fraction are concentrated from a 500-mL aliquot to 100:1 using solid-phase extraction (SPE) following the procedures outlined by Walsh and Ranney (1998). The concentrate is split into two aliquots, 3.5 mL for pro-cessing and 1.5 mL for archiving. When processing was completed, the 3.5-mL splits and the filters were shipped to the analytical chemistry laboratory at CRREL’s main office in Hanover, New Hampshire, for final processing and analysis.
Figure 5. Sample filtration setup.
The filters containing the soot fractions were air-dried and then extracted using acetonitrile. Each sample was shaken with the solvent for 18 hours. The energetic concentrations were then determined for the water and the soot fraction using a high-performance liquid chromatography–ultraviolet detector (HPLC-UV). Detection limits for the HPLC-UV are 30 µg/L for RDX, HMX, and TNT, all in acetonitrile (AcN) extracts. To calculate the mass of unreacted energetics deposited on the snow, we multiplied the average concentration of each plume (mass/unit area basis) by the measured area of the plume (Jenkins et al. 2002, Hewitt et al. 2003).
Comparison of Explosives Residues 11
Quality Control Procedures
Quality control (QC) procedures were conducted both in the field and in the lab. Field QC, noted above, included replicate sampling of the plumes, sampling outside the demarcated plumes, using multiple sampling methods, sampling below sampled areas, and plume-gradient sampling.
We also conducted QC procedures in the processing lab. Blank samples consisting of distilled water were periodically run through a filter assembly and SPE for later analysis. This procedure is designed to determine whether cross-contamination from the filtering apparatus is occurring. Water fractions for several samples were also divided into three aliquots and run through the SPE to determine whether recovery rates from the SPE procedure are consistent. Spiked water samples (2 µg/L) also were run to determine analyte recoveries for the SPE process. These processes will be described in more detail in the Results section.
12 ERDC/CRREL TR-06-13
3 RESULTS
Baseline Samples
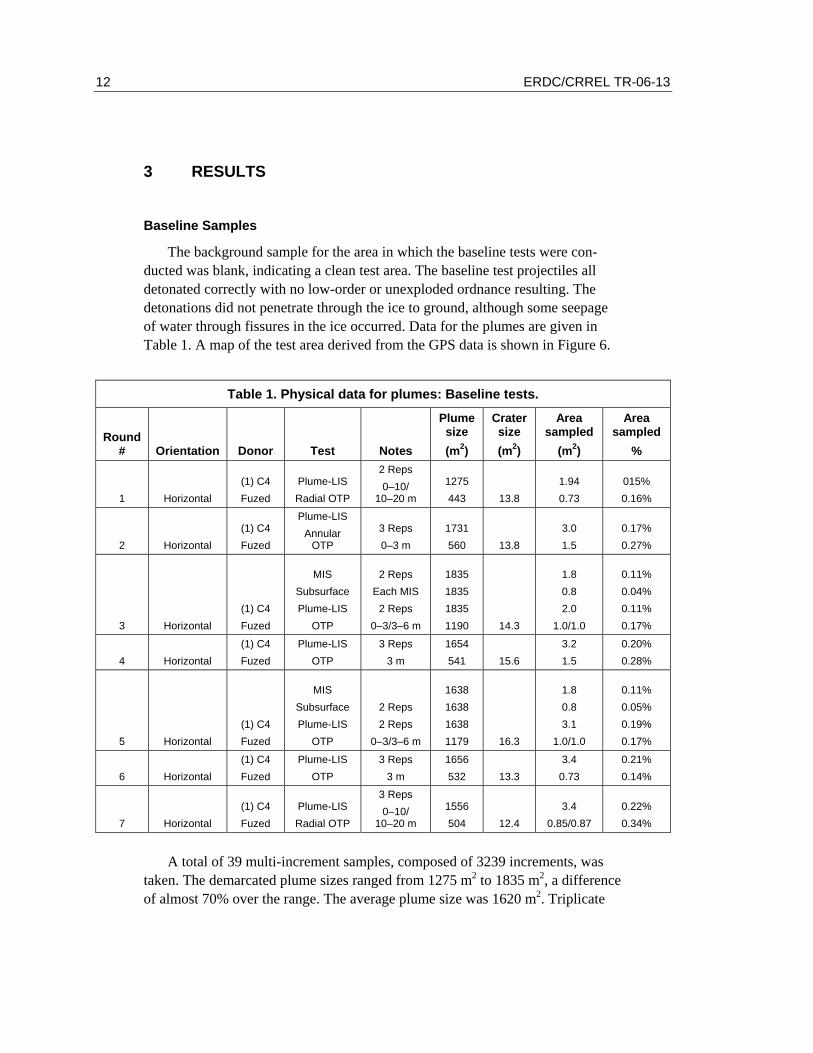
The background sample for the area in which the baseline tests were con-ducted was blank, indicating a clean test area. The baseline test projectiles all detonated correctly with no low-order or unexploded ordnance resulting. The detonations did not penetrate through the ice to ground, although some seepage of water through fissures in the ice occurred. Data for the plumes are given in Table 1. A map of the test area derived from the GPS data is shown in Figure 6.
Table 1. Physical data for plumes: Baseline tests.
Round # Orientation Donor Test Notes
Plume size (m2)
Crater size (m2)
Area sampled
(m2)
Area sampled
%
1 Horizontal (1) C4 Fuzed
Plume-LIS Radial OTP
2 Reps 0–10/
10–20 m 1275 443 13.8
1.94 0.73
015% 0.16%
2 Horizontal (1) C4 Fuzed
Plume-LIS Annular
OTP 3 Reps 0–3 m
1731 560 13.8
3.0 1.5
0.17% 0.27%
3 Horizontal (1) C4 Fuzed
MIS Subsurface Plume-LIS
OTP
2 Reps Each MIS
2 Reps 0–3/3–6 m
1835 1835 1835 1190 14.3
1.8 0.8 2.0
1.0/1.0
0.11% 0.04% 0.11% 0.17%
4 Horizontal (1) C4 Fuzed
Plume-LIS OTP
3 Reps 3 m
1654 541 15.6
3.2 1.5
0.20% 0.28%
5 Horizontal (1) C4 Fuzed
MIS Subsurface Plume-LIS
OTP
2 Reps 2 Reps
0–3/3–6 m
1638 1638 1638 1179 16.3
1.8 0.8 3.1
1.0/1.0
0.11% 0.05% 0.19% 0.17%
6 Horizontal (1) C4 Fuzed
Plume-LIS OTP
3 Reps 3 m
1656 532 13.3
3.4 0.73
0.21% 0.14%
7 Horizontal (1) C4 Fuzed
Plume-LIS Radial OTP
3 Reps 0–10/
10–20 m 1556 504 12.4
3.4 0.85/0.87
0.22% 0.34%
A total of 39 multi-increment samples, composed of 3239 increments, was taken. The demarcated plume sizes ranged from 1275 m2 to 1835 m2, a difference of almost 70% over the range. The average plume size was 1620 m2. Triplicate
Comparison of Explosives Residues 13
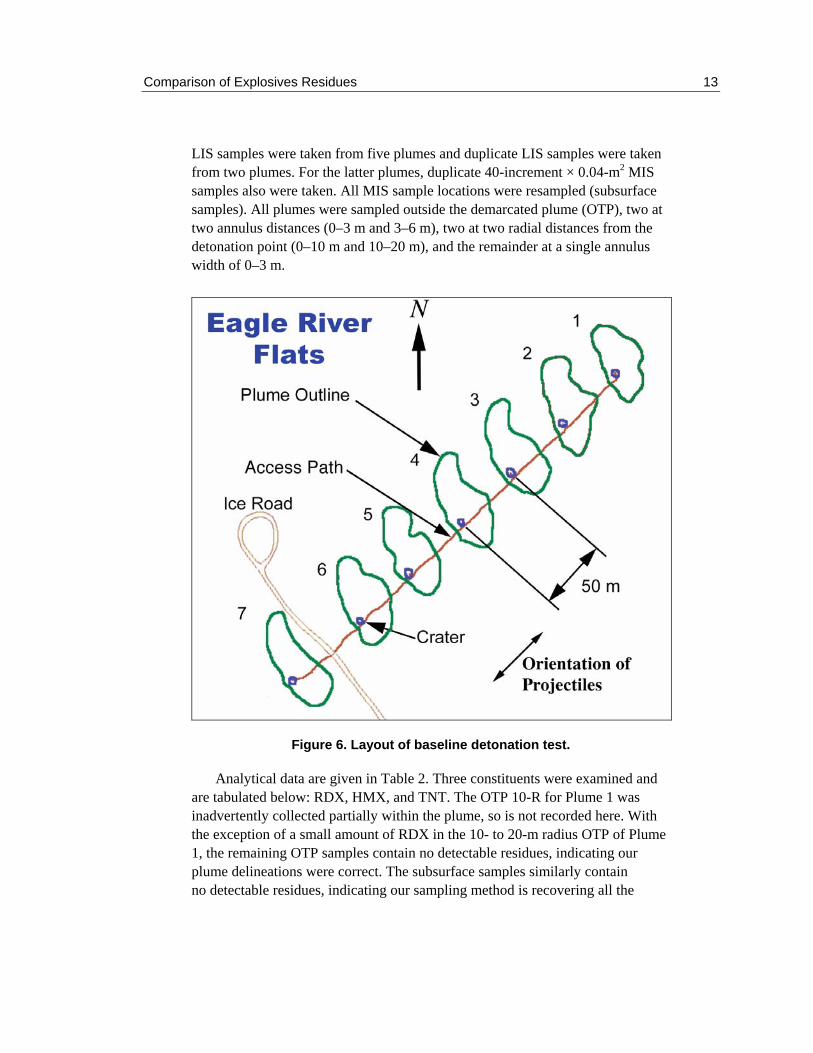
LIS samples were taken from five plumes and duplicate LIS samples were taken from two plumes. For the latter plumes, duplicate 40-increment × 0.04-m2 MIS samples also were taken. All MIS sample locations were resampled (subsurface samples). All plumes were sampled outside the demarcated plume (OTP), two at two annulus distances (0–3 m and 3–6 m), two at two radial distances from the detonation point (0–10 m and 10–20 m), and the remainder at a single annulus width of 0–3 m.
Figure 6. Layout of baseline detonation test.
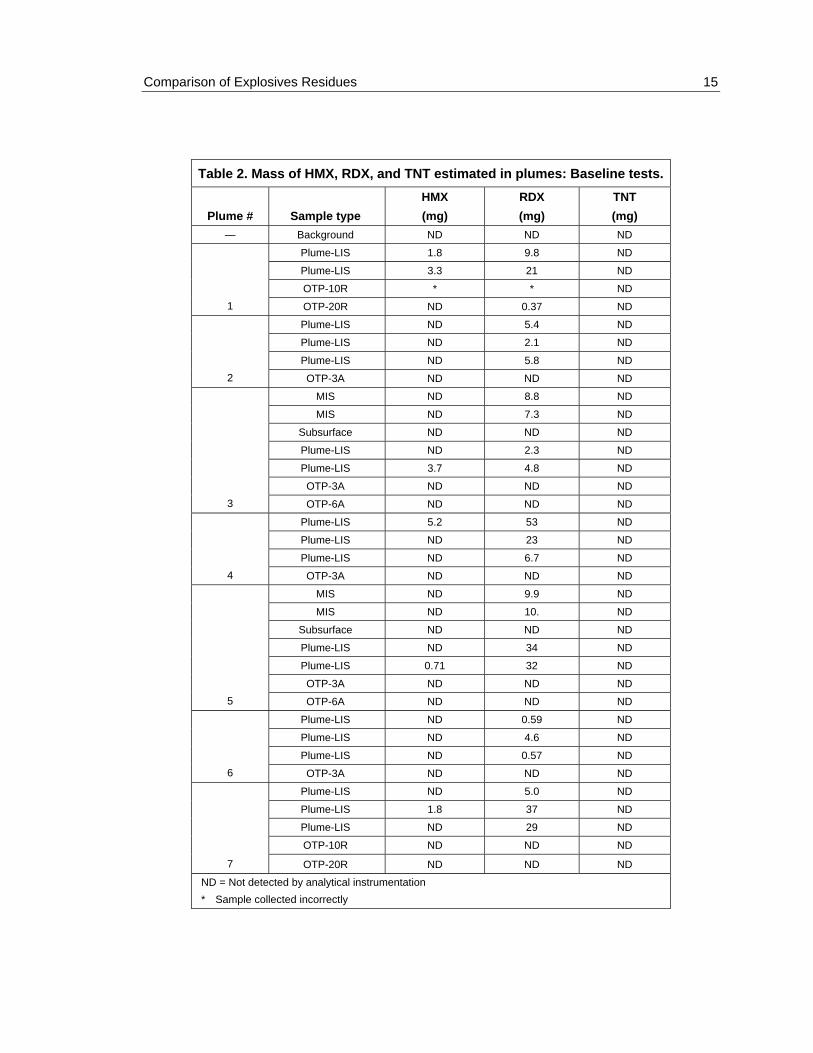
Analytical data are given in Table 2. Three constituents were examined and are tabulated below: RDX, HMX, and TNT. The OTP 10-R for Plume 1 was inadvertently collected partially within the plume, so is not recorded here. With the exception of a small amount of RDX in the 10- to 20-m radius OTP of Plume 1, the remaining OTP samples contain no detectable residues, indicating our plume delineations were correct. The subsurface samples similarly contain no detectable residues, indicating our sampling method is recovering all the
14 ERDC/CRREL TR-06-13
detectable residues at the sampling points. Agreement between MIS samples is within a factor of two. The plume samples are similarly close where detectable quantities were found, with a few exceptions. It is difficult at these residue levels to get consistent results, as many of the values are at or near the analytical instru-mentation detection limits. No TNT was detected in any plumes and little HMX was detected. Average RDX levels varied from a high of 28 mg for Plume 4 to 1.9 mg for Plume 6. MIS and LIS results varied from less than a factor of two to less than a factor of four. A more complete data set can be found in Walsh et al. (2005a) and in Appendix B.
Comparison of Explosives Residues 15
Table 2. Mass of HMX, RDX, and TNT estimated in plumes: Baseline tests.
Plume # Sample type HMX (mg)
RDX (mg)
TNT (mg)
— Background ND ND ND
Plume-LIS 1.8 9.8 ND
Plume-LIS 3.3 21 ND
OTP-10R * * ND 1 OTP-20R ND 0.37 ND
Plume-LIS ND 5.4 ND
Plume-LIS ND 2.1 ND
Plume-LIS ND 5.8 ND 2 OTP-3A ND ND ND
MIS ND 8.8 ND
MIS ND 7.3 ND
Subsurface ND ND ND
Plume-LIS ND 2.3 ND
Plume-LIS 3.7 4.8 ND
OTP-3A ND ND ND 3 OTP-6A ND ND ND
Plume-LIS 5.2 53 ND
Plume-LIS ND 23 ND
Plume-LIS ND 6.7 ND 4 OTP-3A ND ND ND
MIS ND 9.9 ND
MIS ND 10. ND
Subsurface ND ND ND
Plume-LIS ND 34 ND
Plume-LIS 0.71 32 ND
OTP-3A ND ND ND 5 OTP-6A ND ND ND
Plume-LIS ND 0.59 ND
Plume-LIS ND 4.6 ND
Plume-LIS ND 0.57 ND 6 OTP-3A ND ND ND
Plume-LIS ND 5.0 ND
Plume-LIS 1.8 37 ND
Plume-LIS ND 29 ND
OTP-10R ND ND ND
7 OTP-20R ND ND ND
ND = Not detected by analytical instrumentation * Sample collected incorrectly
16 ERDC/CRREL TR-06-13
Alternative BIP Samples
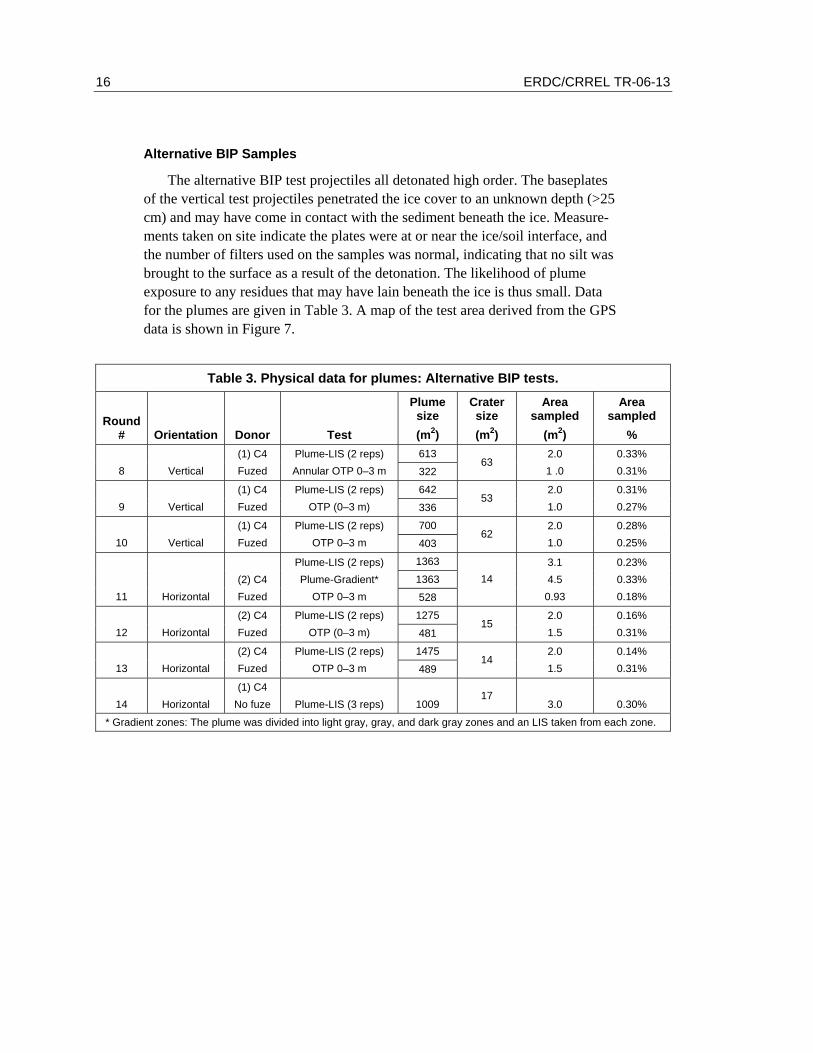
The alternative BIP test projectiles all detonated high order. The baseplates of the vertical test projectiles penetrated the ice cover to an unknown depth (>25 cm) and may have come in contact with the sediment beneath the ice. Measure-ments taken on site indicate the plates were at or near the ice/soil interface, and the number of filters used on the samples was normal, indicating that no silt was brought to the surface as a result of the detonation. The likelihood of plume exposure to any residues that may have lain beneath the ice is thus small. Data for the plumes are given in Table 3. A map of the test area derived from the GPS data is shown in Figure 7.
Table 3. Physical data for plumes: Alternative BIP tests.
Round # Orientation Donor Test
Plume size (m2)
Crater size (m2)
Area sampled
(m2)
Area sampled
% 613
8 Vertical (1) C4 Fuzed
Plume-LIS (2 reps) Annular OTP 0–3 m 322
63 2.0 1 .0
0.33% 0.31%
642 9 Vertical
(1) C4 Fuzed
Plume-LIS (2 reps) OTP (0–3 m) 336
53 2.0 1.0
0.31% 0.27%
700 10 Vertical
(1) C4 Fuzed
Plume-LIS (2 reps) OTP 0–3 m 403
62 2.0 1.0
0.28% 0.25%
1363
1363 11 Horizontal
(2) C4 Fuzed
Plume-LIS (2 reps) Plume-Gradient*
OTP 0–3 m 528
14 3.1 4.5
0.93
0.23% 0.33% 0.18%
1275 12 Horizontal
(2) C4 Fuzed
Plume-LIS (2 reps) OTP (0–3 m) 481
15 2.0 1.5
0.16% 0.31%
1475 13 Horizontal
(2) C4 Fuzed
Plume-LIS (2 reps) OTP 0–3 m 489
14 2.0 1.5
0.14% 0.31%
14 Horizontal (1) C4
No fuze Plume-LIS (3 reps) 1009 17
3.0 0.30%
* Gradient zones: The plume was divided into light gray, gray, and dark gray zones and an LIS taken from each zone.
Comparison of Explosives Residues 17
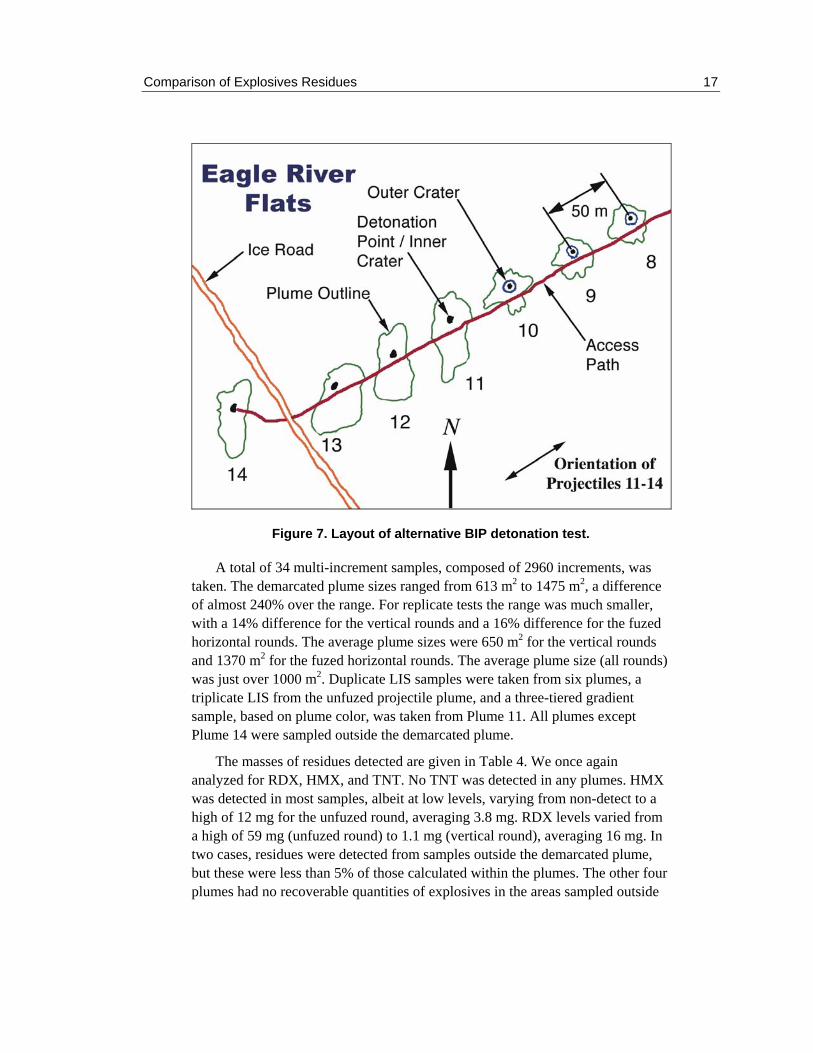
Figure 7. Layout of alternative BIP detonation test.
A total of 34 multi-increment samples, composed of 2960 increments, was taken. The demarcated plume sizes ranged from 613 m2 to 1475 m2, a difference of almost 240% over the range. For replicate tests the range was much smaller, with a 14% difference for the vertical rounds and a 16% difference for the fuzed horizontal rounds. The average plume sizes were 650 m2 for the vertical rounds and 1370 m2 for the fuzed horizontal rounds. The average plume size (all rounds) was just over 1000 m2. Duplicate LIS samples were taken from six plumes, a triplicate LIS from the unfuzed projectile plume, and a three-tiered gradient sample, based on plume color, was taken from Plume 11. All plumes except Plume 14 were sampled outside the demarcated plume.
The masses of residues detected are given in Table 4. We once again analyzed for RDX, HMX, and TNT. No TNT was detected in any plumes. HMX was detected in most samples, albeit at low levels, varying from non-detect to a high of 12 mg for the unfuzed round, averaging 3.8 mg. RDX levels varied from a high of 59 mg (unfuzed round) to 1.1 mg (vertical round), averaging 16 mg. In two cases, residues were detected from samples outside the demarcated plume, but these were less than 5% of those calculated within the plumes. The other four plumes had no recoverable quantities of explosives in the areas sampled outside

18 ERDC/CRREL TR-06-13
the plume. Again, for all tests, many of the values are near the analytical detec-tion limits, making it difficult to get consistent results between replicates. How-ever, for most of the plumes, the replicate values are within a factor of two and many are much closer. A more complete data set can be found in Appendix C.
Table 4. Analytical data for plumes: Alternative BIP tests.
Plume # Sample type HMX (mg)
RDX (mg)
TNT (mg)
— Background ND ND ND
Plume-LIS 0.81 1.7 ND
Plume-LIS 0.89 1.2 ND 8 OTP 0–3 m ND ND ND
Plume-LIS 7.1 23 ND
Plume-LIS 11 17 ND 9 OTP 0–3 m 0.59 0.74 ND
Plume-LIS 4.9 3.1 ND
Plume-LIS ND 1.1 ND 10 OTP 0–3 m ND ND ND
Plume-LIS 7.2 20 ND
Plume-LIS 5.3 18 ND
Plume-Light 0.31 0.66 ND
Plume-Gray 6.5 11 ND
Plume-Dark 0.71 1.2 ND
Plume-Total 7.5 13 11 OTP 0–3 m ND ND ND
Plume-LIS 2.4 18 ND
Plume-LIS 0.37 28 ND 12 OTP 0–3 m ND ND ND
Plume-LIS 0.82 13 ND
Plume-LIS 0.94 19 ND 13 OTP 0–3 m 0.19 0.35 ND
Plume-LIS 6.0 52 ND
Plume-LIS 12 52 ND 14 Plume-LIS 4.3 59 ND
The results of the zone-sampled areas are also shown in Table 4. For the three zones (Dark, Gray, and Light), the total estimated residues are 21 mg (HMX and RDX). This compares well with the average of the two LIS samples, 25 mg (HMX and RDX). The LIS sample residues are about 19% higher than for the combined zones in this case. This compares to about a 50% bias for the original discrete sampling method (DSM) (Walsh et al. 2005a). Although the
Comparison of Explosives Residues 19
sample pool is small, the results indicate that the LIS method is less biased than the DSM.
Table 5. Background and processing QC test data.
Test Sample # HMX mass
(µg/L) RDX mass
(µg/L) TNT mass
(µg/L) 1 ND ND ND
2 ND ND ND Background
3 ND ND ND
1 ND ND ND
2 ND ND ND
3 ND ND ND
4 ND ND ND
5 ND ND ND
Filtration blank (Distilled water)
6 ND ND ND
1 1.9 1.9 1.9
2 2.0 2.1 2.0 SPE spike
(Target: 2.0 µg/L) 3 2.1 2.1 2.0
1 ND ND ND SPE blank (Distilled water) 2 ND ND ND
600 ND 1.5 ND
600A ND 1.5 ND
600B ND 1.5 ND
606 ND 3.0 ND
606A ND 3.0 ND
606B ND 3.0 ND
618 ND 1.3 ND
618A ND 1.3 ND
618B ND 1.3 ND
628 ND 2.1 ND
628A ND 2.0 ND
Filtrate dupes (500 mL)
628B ND 2.0 ND
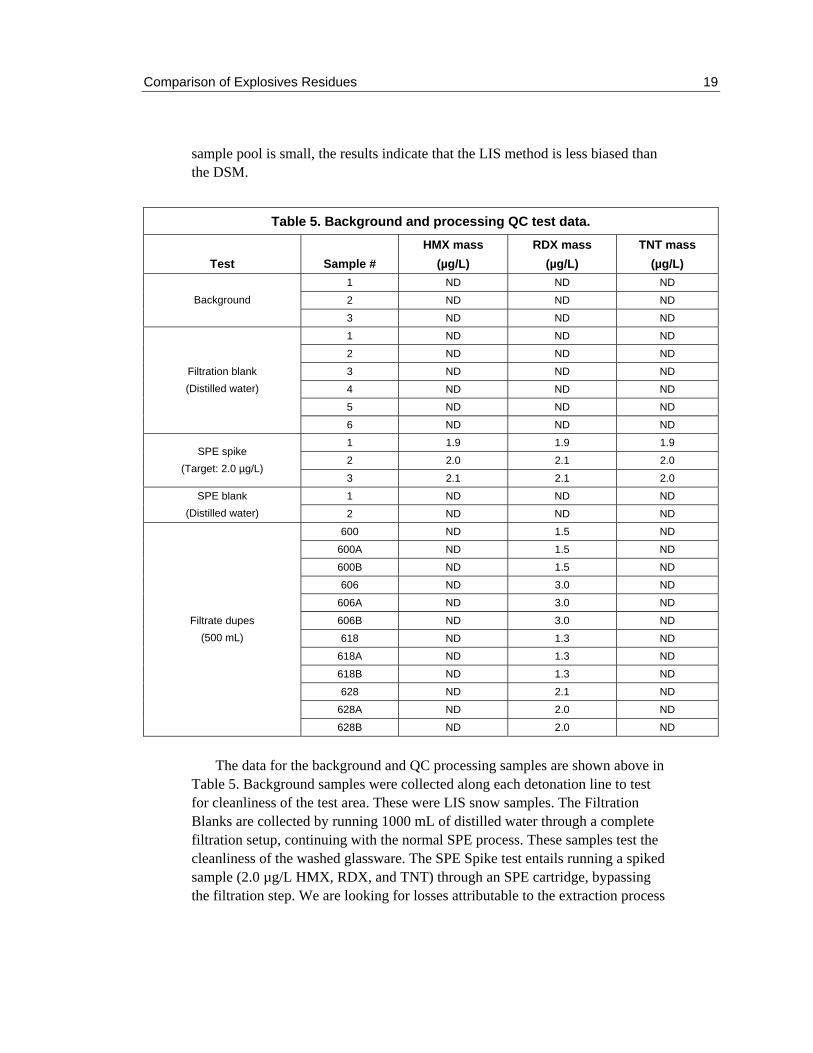
The data for the background and QC processing samples are shown above in Table 5. Background samples were collected along each detonation line to test for cleanliness of the test area. These were LIS snow samples. The Filtration Blanks are collected by running 1000 mL of distilled water through a complete filtration setup, continuing with the normal SPE process. These samples test the cleanliness of the washed glassware. The SPE Spike test entails running a spiked sample (2.0 µg/L HMX, RDX, and TNT) through an SPE cartridge, bypassing the filtration step. We are looking for losses attributable to the extraction process
20 ERDC/CRREL TR-06-13
with this test. The SPE blanks are derived from cartridges that have had 500 mL of distilled water run through them and the cartridges eluted in the normal manner. This tests the cleanliness of the concentration and elution process. Filtrate dupes are triplicate 500-mL filtrate aliquots taken from the same sample and run as regular samples after filtration. Comparing these samples gives an indication of the repeatability of the filtrate processing.
The results of the background and QC tests indicate that the area where we tested was clean prior to our work and that the processing procedures and equip-ment introduced no detectable error. Filtration blanks were clean, indicating suf-ficient cleansing of the glassware for the filtration units. The SPE blanks were clean as well, and when combined with the filtration blanks, indicate that there is no extraneous contamination in the process. Recovery from the SPE spikes ranged from 95% to 105%. The filtrate duplicates were quite consistent, with only one value in the four sets of triplicates varying by as much as 5% (using two-significant-digit accuracy). The indication from the process QC tests is that the procedures used during processing of the samples are not introducing signifi-cant error into the analyses.
Table 6. Comparison of results of blow-in-place detonation tests.
Test Number of projectiles
Number of samples
RDX mass (mg)
HMX mass (mg)
TNT mass (mg)
Estimated mass (mg)
Baseline* 7 22 14 0.84 ND 15
Vertical* 3 6 7.9 3.3 ND 11
Horizontal† 3 7 11 3.1 ND 14
Horizontal** 1 3 54 7.4 ND 61
Average 14 (total) 22 3.7 ND 25
* Fuzed, one donor charge † Fuzed, two donor charges ** Non-fuzed, one donor charge
So how do the different BIP methods compare to each other? The overall results are quite close, as shown above in Table 6. Only the values for the one non-fuzed projectile seem high initially. However, when examined from the perspective of detonation efficiency (Table 7), there is little difference. A detona-tion that consumes 99.99% or more of the HE filler is generally considered high order, so all these tests involved high-order detonations. The accuracy implied by the number of significant digits in Table 7 is not the actual accuracy of the data. We went out to that many decimal places to illustrate the closeness of the values without obscuring them by rounding. Confounding all these values is the uncon-
Comparison of Explosives Residues 21
strained donor charge, consisting of 0.57 kg of C4. The mass of the donor charge was taken into account in our analyses.
Table 7. Detonation efficiencies of the BIP tests.
Test Number of projectiles
Average efficiency Low value Median value High value
Baseline* 7 99.99979% 99.99937% 99.99966% 99.99996%
Vertical 3 99.99984% 99.99947% 99.99991% 99.99996%
Horizontal-1 3 99.99927% 99.99958% 99.99962% 99.99971%
Horizontal-2† 1 99.99884% 99.99880% 99.99882% 99.99890%
* Based on an average of the LIS samples † Values are for the three LIS samples of the one detonation.
22 ERDC/CRREL TR-06-13
4 CONCLUSIONS
A series of tests was conducted with 155-mm high-explosive projectiles to determine whether blow-in-place tests conducted using different donor charge and fuzing configurations give comparable results. The standard to which the alternative configuration blow-in-place tests were compared is a horizontal fuzed projectile with a single 0.57-kg demolition block of C4 near the nose. Seven projectiles were tested in three different configurations. These configurations were vertical orientation, fuzed, one donor charge (three projectiles); horizontal orientation, fuzed, two donor charges (three projectiles); and horizontal config-uration, no fuze, one donor charge placed near the nose (one projectile). All alternative BIP tests were conducted at the same time, within two days of the baseline test. Tests were conducted on snow-covered ice on an active impact area in Alaska.
The results indicate that the four BIP methods tested are all very close, with the consumption of the explosives load (efficiency) averaging 99.9988% to 99.9998%. This indicates both that all tests went high order (>99.99% efficiency) and that residues generated using these BIP methods in the past are comparable. Results from the replicate sampling, outside the plume sampling, and subsurface sampling indicate that the data from the tests in this report are sound.
We found that the residue mass from well-controlled BIP operations can be two orders of magnitude higher than live-fire detonation residue masses for the same-type projectiles (Walsh et al. 2005b). Live-fire residues averaged 0.30 mg per round when fired onto snow-covered ice under similar climatic conditions. To put these numbers in perspective, over 270,000 projectiles cleanly blown in place or 23 million live-fired projectiles will leave the equivalent amount of explosives residues as a single dudded round on the impact range. Low-order or inefficient BIPs will lower this ratio. Although a source of residues on the range, BIP rounds should not be the item of most concern. Care must thus be taken to ensure that these rounds are blown in place properly to minimize explosives residues.
These results are estimates of unreacted residues from activities associated with a blow-in-place exercise. They are indicators of possible residue masses that will result from such activities. For high-order detonations, many values are at or near detection limits for the analytical instrumentation and are difficult to interpret. It is important to keep in mind that there is much variability between detonations and some variability between rounds, and that these results should be considered as approximate.
Comparison of Explosives Residues 23
REFERENCES
Dauphin, L., and C. Doyle (2000) Study of ammunition dud and low-order detonation rates. U.S. Army Defense Ammunition Center–Technical Center for Explosives Safety. Technical Report written for U.S. Army Environmental Center, Aberdeen Proving Ground, Maryland.
Dube, P., S. Brochu, P. Brousseau, S. Thiboutot, G. Ampleman, J. Lewis, M. Bouchard, A. Gagnon, and A. Marois (2004) Study of environmental impacts of the blow-in-place procedure of various explosives, munitions, and charges. Chapter 7, Distribution and fate of energetics on DoD test and training ranges, Interim Report 4, U.S. Army Engineer Research and Development Center, Vicksburg, Mississippi, ERDC Technical Report ERDC TR-04-4.
Foster, J. (1998) Report of the Defense Science Board Task Force on Unexploded Ordnance (UXO) Clearance, Active Range UXO Clearance, and Explosive Ordnance Disposal (EOD) Programs.
Hewitt, A.D., T.F. Jenkins, T.A. Ranney, J.A. Stark, M.E. Walsh, S. Taylor, M.R. Walsh, D.J. Lambert, N.M. Perron, N.H. Collins, and R. Kern (2003) Estimates for explosives residues from the detonation of army munitions. U.S. Army Engineer Research and Development Center, Cold Regions Research and Engineering Laboratory, Hanover, New Hampshire, ERDC/CRREL Technical Report TR-03-16.
Jenkins, T.J., T.A. Ranney, P.H. Miyares, N.H. Collins, and A.D. Hewitt (2000) Use of surface snow sampling to estimate the quantity of explosives residues resulting from land mine detonations. U.S. Army Engineer Research and Development Center, Cold Regions Research and Engineering Laboratory, Hanover, New Hampshire, ERDC/CRREL Technical Report TR-00-12.
Jenkins, T.F., M.E. Walsh, P.H. Miyares, A.D. Hewitt, N.H. Collins, and T.A. Ranney (2002) Use of snow-covered ranges to estimate explosives residues from high-order detonations of Army munitions. Thermochimica Acta, 384: 173–185.
Jenkins, T.F., A.D. Hewitt, M.E. Walsh, T.A. Ranney, C.A. Ramsey, C.L. Grant, and K.L. Bjella (2005) Representative sampling for energetic compounds at military training ranges. Environmental Forensics, 6: 45–55.
Taylor, S., J.H. Lever, B. Bostick, M.R. Walsh, M.E. Walsh, and B. Packer (2004) Underground UXO: Are they a significant source of explosives in soil compared to low- and high-order detonations? U.S. Army Engineer Research and Development Center, Cold Regions Research and Engineering Laboratory, Hanover, New Hampshire, ERDC/CRREL Technical Report TR-04-23.
24 ERDC/CRREL TR-06-13
U.S. Army (1998) Explosives and demolitions. U.S. Army Engineer School, Fort Leonard Wood, Missouri, FM 5-250.
Walker, D.D., T.F. Jenkins, and J.C. Pennington (2004) Environmental impacts of blow-in-place detonations. In Proceedings, Conference on Sustainable Range Management, New Orleans, Louisiana, 5–8 January 2004. Columbus, Ohio: Battelle Press.
Walsh, M.E., and T.A. Ranney (1998) Determination of nitroaromatic, nitra-mine, and nitrate ester explosives in water using solid-phase extraction and GC-ECD. U.S. Army Cold Regions Research and Engineering Laboratory, Hanover, New Hampshire, Special Report 98-2.
Walsh, M.R., M.E. Walsh, C.A. Ramsey, and T.F. Jenkins (2005a) An examination of protocols for the collection of munitions-derived explosives residues on snow-covered ice. U.S. Army Engineer Research and Development Center, Cold Regions Research and Engineering Laboratory, Hanover, New Hampshire, ERDC/CRREL Technical Report TR-05-08.
Walsh, M.R., S. Taylor, M.E. Walsh, S.R. Bigl, K. Bjella, T.A. Douglas, A.B. Gelvin, D.J. Lambert, N.M. Perron, and S.P. Saari (2005b) Residues from live-fire detonations of 155-mm howitzer rounds. U.S. Army Engineer Research and Development Center, Cold Regions Research and Engineering Laboratory, Hanover, New Hampshire, ERDC/CRREL Technical Report TR-05-14.
Comparison of Explosives Residues 25
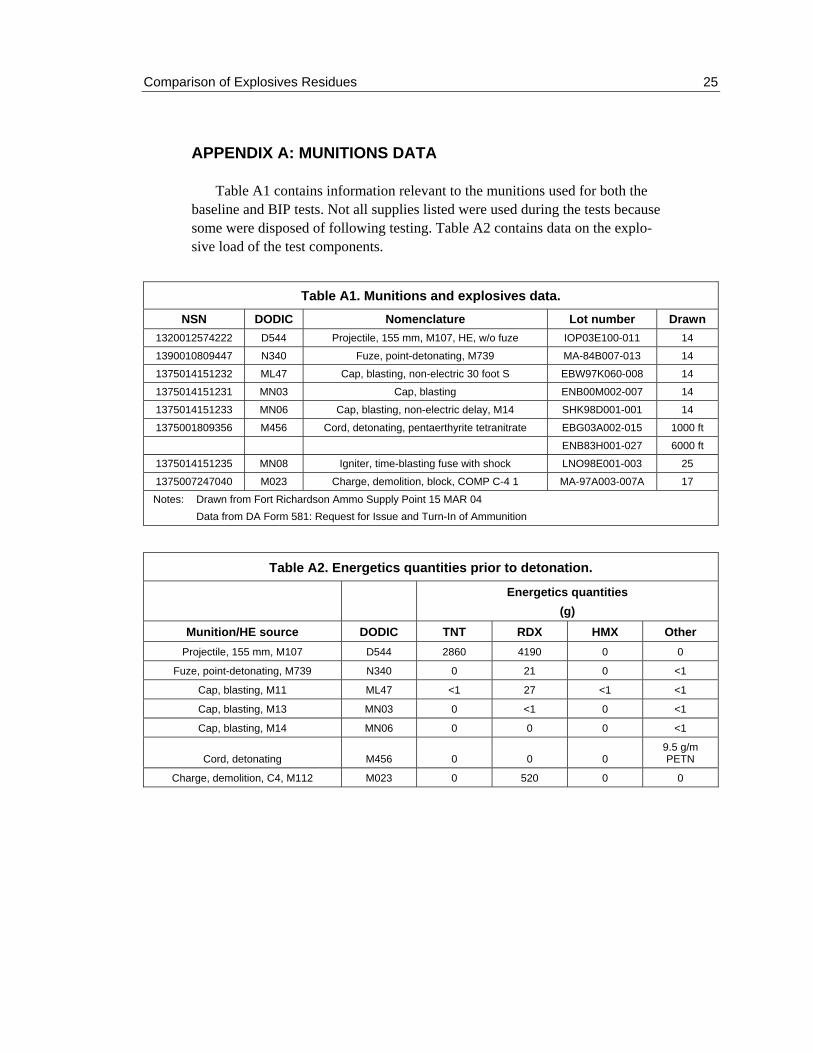
APPENDIX A: MUNITIONS DATA
Table A1 contains information relevant to the munitions used for both the baseline and BIP tests. Not all supplies listed were used during the tests because some were disposed of following testing. Table A2 contains data on the explo-sive load of the test components.
Table A1. Munitions and explosives data. NSN DODIC Nomenclature Lot number Drawn
1320012574222 D544 Projectile, 155 mm, M107, HE, w/o fuze IOP03E100-011 14
1390010809447 N340 Fuze, point-detonating, M739 MA-84B007-013 14
1375014151232 ML47 Cap, blasting, non-electric 30 foot S EBW97K060-008 14
1375014151231 MN03 Cap, blasting ENB00M002-007 14
1375014151233 MN06 Cap, blasting, non-electric delay, M14 SHK98D001-001 14
1375001809356 M456 Cord, detonating, pentaerthyrite tetranitrate EBG03A002-015 1000 ft
ENB83H001-027 6000 ft
1375014151235 MN08 Igniter, time-blasting fuse with shock LNO98E001-003 25
1375007247040 M023 Charge, demolition, block, COMP C-4 1 MA-97A003-007A 17
Notes: Drawn from Fort Richardson Ammo Supply Point 15 MAR 04 Data from DA Form 581: Request for Issue and Turn-In of Ammunition
Table A2. Energetics quantities prior to detonation.
Energetics quantities
(g)
Munition/HE source DODIC TNT RDX HMX Other Projectile, 155 mm, M107 D544 2860 4190 0 0
Fuze, point-detonating, M739 N340 0 21 0 <1
Cap, blasting, M11 ML47 <1 27 <1 <1
Cap, blasting, M13 MN03 0 <1 0 <1
Cap, blasting, M14 MN06 0 0 0 <1
Cord, detonating M456 0 0 0 9.5 g/m PETN
Charge, demolition, C4, M112 M023 0 520 0 0
26 ERDC/CRREL TR-06-13
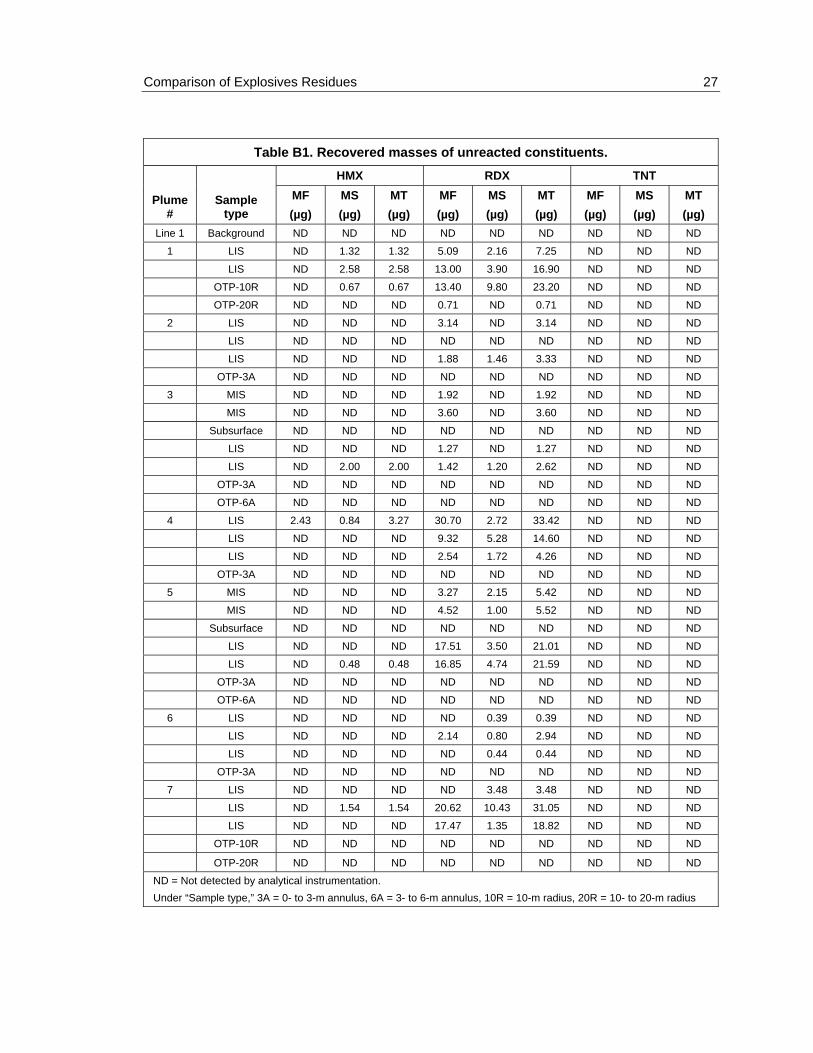
APPENDIX B: BASELINE TEST DATA
Table B1, which appears on the following page, contains the data from the analysis of the samples collected during the baseline tests of 17 March 2004. In the table, MF is mass recovered on the filter after filtration of the original sample, MS is the mass recovered from the filtrate, and MT is the total recovered mass of the constituent. To derive the total estimate residues, the total recovered residues are multiplied by the area of the decision unit (plume, OTP, etc.) and divided by the actual area sampled. This is the number that appears in Table 2 (page 15).
Comparison of Explosives Residues 27
Table B1. Recovered masses of unreacted constituents. HMX RDX TNT
Plume #
Sample type
MF (µg)
MS (µg)
MT (µg)
MF (µg)
MS (µg)
MT (µg)
MF (µg)
MS (µg)
MT (µg)
Line 1 Background ND ND ND ND ND ND ND ND ND
1 LIS ND 1.32 1.32 5.09 2.16 7.25 ND ND ND
LIS ND 2.58 2.58 13.00 3.90 16.90 ND ND ND
OTP-10R ND 0.67 0.67 13.40 9.80 23.20 ND ND ND
OTP-20R ND ND ND 0.71 ND 0.71 ND ND ND
2 LIS ND ND ND 3.14 ND 3.14 ND ND ND
LIS ND ND ND ND ND ND ND ND ND
LIS ND ND ND 1.88 1.46 3.33 ND ND ND
OTP-3A ND ND ND ND ND ND ND ND ND
3 MIS ND ND ND 1.92 ND 1.92 ND ND ND
MIS ND ND ND 3.60 ND 3.60 ND ND ND
Subsurface ND ND ND ND ND ND ND ND ND
LIS ND ND ND 1.27 ND 1.27 ND ND ND
LIS ND 2.00 2.00 1.42 1.20 2.62 ND ND ND
OTP-3A ND ND ND ND ND ND ND ND ND
OTP-6A ND ND ND ND ND ND ND ND ND
4 LIS 2.43 0.84 3.27 30.70 2.72 33.42 ND ND ND
LIS ND ND ND 9.32 5.28 14.60 ND ND ND
LIS ND ND ND 2.54 1.72 4.26 ND ND ND
OTP-3A ND ND ND ND ND ND ND ND ND
5 MIS ND ND ND 3.27 2.15 5.42 ND ND ND
MIS ND ND ND 4.52 1.00 5.52 ND ND ND
Subsurface ND ND ND ND ND ND ND ND ND
LIS ND ND ND 17.51 3.50 21.01 ND ND ND
LIS ND 0.48 0.48 16.85 4.74 21.59 ND ND ND
OTP-3A ND ND ND ND ND ND ND ND ND
OTP-6A ND ND ND ND ND ND ND ND ND
6 LIS ND ND ND ND 0.39 0.39 ND ND ND
LIS ND ND ND 2.14 0.80 2.94 ND ND ND
LIS ND ND ND ND 0.44 0.44 ND ND ND
OTP-3A ND ND ND ND ND ND ND ND ND
7 LIS ND ND ND ND 3.48 3.48 ND ND ND
LIS ND 1.54 1.54 20.62 10.43 31.05 ND ND ND
LIS ND ND ND 17.47 1.35 18.82 ND ND ND
OTP-10R ND ND ND ND ND ND ND ND ND
OTP-20R ND ND ND ND ND ND ND ND ND
ND = Not detected by analytical instrumentation. Under “Sample type,” 3A = 0- to 3-m annulus, 6A = 3- to 6-m annulus, 10R = 10-m radius, 20R = 10- to 20-m radius
28 ERDC/CRREL TR-06-13
APPENDIX C: ALTERNATIVE BIP TEST DATA
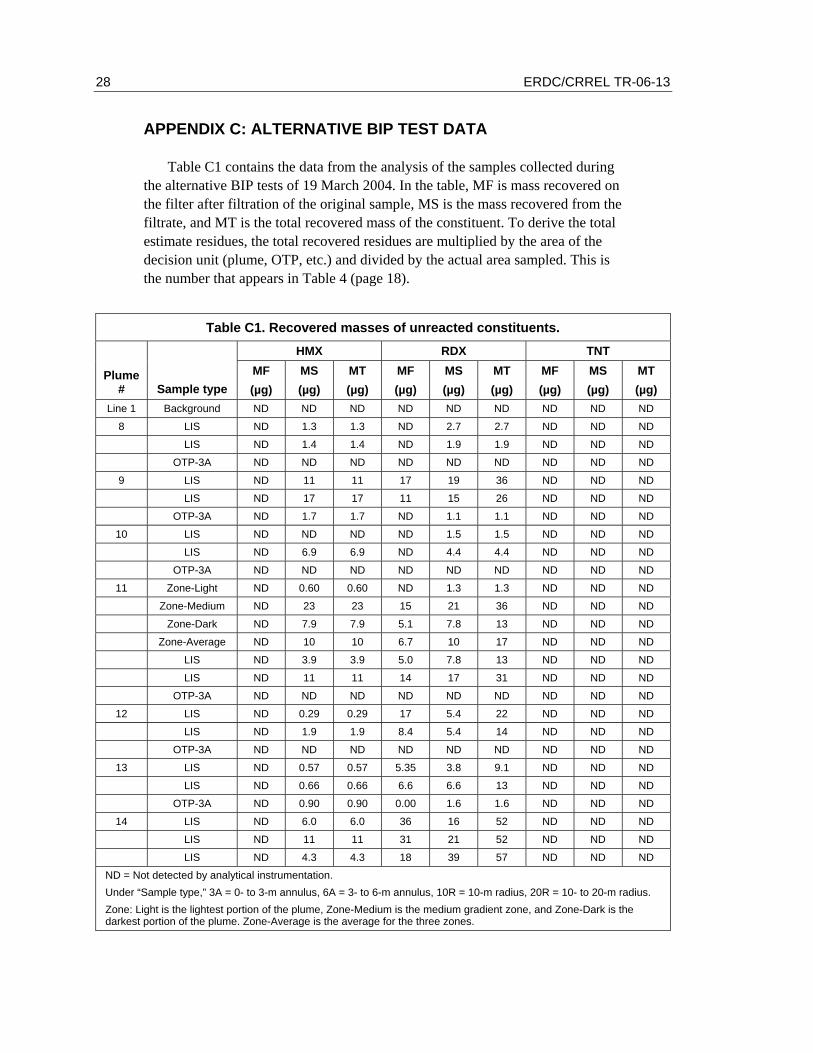
Table C1 contains the data from the analysis of the samples collected during the alternative BIP tests of 19 March 2004. In the table, MF is mass recovered on the filter after filtration of the original sample, MS is the mass recovered from the filtrate, and MT is the total recovered mass of the constituent. To derive the total estimate residues, the total recovered residues are multiplied by the area of the decision unit (plume, OTP, etc.) and divided by the actual area sampled. This is the number that appears in Table 4 (page 18).
Table C1. Recovered masses of unreacted constituents. HMX RDX TNT
Plume # Sample type
MF (µg)
MS (µg)
MT (µg)
MF (µg)
MS (µg)
MT (µg)
MF (µg)
MS (µg)
MT (µg)
Line 1 Background ND ND ND ND ND ND ND ND ND
8 LIS ND 1.3 1.3 ND 2.7 2.7 ND ND ND
LIS ND 1.4 1.4 ND 1.9 1.9 ND ND ND
OTP-3A ND ND ND ND ND ND ND ND ND
9 LIS ND 11 11 17 19 36 ND ND ND
LIS ND 17 17 11 15 26 ND ND ND
OTP-3A ND 1.7 1.7 ND 1.1 1.1 ND ND ND
10 LIS ND ND ND ND 1.5 1.5 ND ND ND
LIS ND 6.9 6.9 ND 4.4 4.4 ND ND ND
OTP-3A ND ND ND ND ND ND ND ND ND
11 Zone-Light ND 0.60 0.60 ND 1.3 1.3 ND ND ND
Zone-Medium ND 23 23 15 21 36 ND ND ND
Zone-Dark ND 7.9 7.9 5.1 7.8 13 ND ND ND
Zone-Average ND 10 10 6.7 10 17 ND ND ND
LIS ND 3.9 3.9 5.0 7.8 13 ND ND ND
LIS ND 11 11 14 17 31 ND ND ND
OTP-3A ND ND ND ND ND ND ND ND ND
12 LIS ND 0.29 0.29 17 5.4 22 ND ND ND
LIS ND 1.9 1.9 8.4 5.4 14 ND ND ND
OTP-3A ND ND ND ND ND ND ND ND ND
13 LIS ND 0.57 0.57 5.35 3.8 9.1 ND ND ND
LIS ND 0.66 0.66 6.6 6.6 13 ND ND ND
OTP-3A ND 0.90 0.90 0.00 1.6 1.6 ND ND ND
14 LIS ND 6.0 6.0 36 16 52 ND ND ND
LIS ND 11 11 31 21 52 ND ND ND
LIS ND 4.3 4.3 18 39 57 ND ND ND
ND = Not detected by analytical instrumentation. Under “Sample type,” 3A = 0- to 3-m annulus, 6A = 3- to 6-m annulus, 10R = 10-m radius, 20R = 10- to 20-m radius. Zone: Light is the lightest portion of the plume, Zone-Medium is the medium gradient zone, and Zone-Dark is the darkest portion of the plume. Zone-Average is the average for the three zones.
REPORT DOCUMENTATION PAGE Form Approved
OMB No. 0704-0188 Public reporting burden for this collection of information is estimated to average 1 hour per response, including the time for reviewing instructions, searching existing data sources, gathering and maintaining the data needed, and completing and reviewing this collection of information. Send comments regarding this burden estimate or any other aspect of this collection of information, including suggestions for reducing this burden to Department of Defense, Washington Headquarters Services, Directorate for Information Operations and Reports (0704-0188), 1215 Jefferson Davis Highway, Suite 1204, Arlington, VA 22202-4302. Respondents should be aware that notwithstanding any other provision of law, no person shall be subject to any penalty for failing to comply with a collection of information if it does not display a currently valid OMB control number. PLEASE DO NOT RETURN YOUR FORM TO THE ABOVE ADDRESS.
1. REPORT DATE (DD-MM-YYYY) June 2006
2. REPORT TYPE Technical Report
3. DATES COVERED (From - To)
5a. CONTRACT NUMBER
5b. GRANT NUMBER
4. TITLE AND SUBTITLE
Comparison of Explosives Residues from the Blow-in-Place Detonation of 155-mm High-Explosive Projectiles
5c. PROGRAM ELEMENT NUMBER
5d. PROJECT NUMBER
5e. TASK NUMBER
6. AUTHOR(S)
Michael R. Walsh, Marianne E. Walsh, Guy Ampleman, Sonia Thiboutot, and Deborah D. Walker
5f. WORK UNIT NUMBER
7. PERFORMING ORGANIZATION NAME(S) AND ADDRESS(ES) 8. PERFORMING ORGANIZATION REPORT NUMBER
U.S. Army Engineer Research and Development Center Cold Regions Research and Engineering Laboratory 72 Lyme Road Hanover, New Hampshire 03755-1290
ERDC/CRREL TR-06-13
9. SPONSORING / MONITORING AGENCY NAME(S) AND ADDRESS(ES) 10. SPONSOR/MONITOR’S ACRONYM(S)
SERDP 11. SPONSOR/MONITOR’S REPORT NUMBER(S)
Strategic Environmental Research and Development Program Arlington, Virginia 22203
12. DISTRIBUTION / AVAILABILITY STATEMENT Approved for public release; distribution is unlimited. Available from NTIS, Springfield, Virginia 22161. 13. SUPPLEMENTARY NOTES
14. ABSTRACT The disposal of unexploded ordnance is a potential source of explosives residues on ranges. Blow-in-place detonation
of munitions currently is done to clear these areas for safety without an emphasis on the consumption of the explosive load. The general testing method is to detonate the horizontal fuzed projectile with one block of C4 explosive. Explosives resi-dues from blow-in-place disposal were examined using several different detonation configurations. Seven 155-mm fuzed high-explosive projectiles were detonated on a snow-and-ice-covered range on Fort Richardson, Alaska, to obtain baseline data on the current testing method. Tests were then conducted using the same type of projectiles in three configurations: fuzed rounds vertically oriented, fuzed rounds horizontally oriented with two donor charges, and a non-fuzed horizontal round with one donor charge. Recovered energetic residues indicate explosive load consumption in excess of 99.998% for all tests, ranging from 12 to 62 mg per round. This compares to 0.31 mg per round for live-fire detonation of the same-type rounds. Although two orders of magnitude higher, residue quantities for proper blow-in-place detonation of these munitions are quite small and are unlikely to result in significant explosives residues on ranges when compared to low-order or unad-dressed unexploded ordnance. 15. SUBJECT TERMS Blow-in-place Donor charge placement Composition B Energetics
High explosives Ice High-order Low-order detonation detonation
155-mm munitions Residues Snow
16. SECURITY CLASSIFICATION OF: 17. LIMITATION OF ABSTRACT
18. NUMBER OF PAGES
19a. NAME OF RESPONSIBLE PERSON
a. REPORT
U b. ABSTRACT
U c. THIS PAGE
U U 40 19b. TELEPHONE NUMBER (include area code)
Standard Form 298 (Rev. 8-98) Prescribed by ANSI Std. 239.18