Embed Size (px)
Citation preview
ERD
C/CE
RL
TR-0
7-2
0
DoD Corrosion Prevention and Control Program
Nonhazardous Chemical Treatments and Smart Monitoring and Control System for Heating and Cooling Systems Final Report on Project AR-F-314 for FY05
Susan A. Drozdz, David W. Hurt, and Steve Maloney June 2007
Con
stru
ctio
n E
ngi
nee
rin
g R
esea
rch
Lab
orat
ory
Approved for public release; distribution is unlimited.

DoD Corrosion Prevention and Control Program
ERDC/CERL TR-07-20 June 2007
Nonhazardous Chemical Treatments and Smart Monitoring and Control System for Heating and Cooling Systems Final Report on Project AR-F-314 for FY05
Susan A. Drozdz
Construction Engineering Research Laboratory U.S. Army Engineer Research and Development Center 2902 Newmark Drive Champaign, IL 61822
David W. Hurt and Steve Maloney
Garratt Callahan Company 13721 Welch Road Farmers Branch, TX 75244-4521
Final report
Approved for public release; distribution is unlimited.
Prepared for Office of the Secretary of Defense (OUSD(AT&L)) 3090 Defense Pentagon Washington, DC 20301-3090
Under Military Interdepartmental Purchase Request MIPR MIPR5C6AG3CPC1
ERDC/CERL TR-07-20 ii
Abstract: This project developed extensive operating data on corrosion and deposition in cooling towers and steam boilers that are part of heat-ing, ventilating, and air conditioning (HVAC) systems at five military fa-cilities. Environmentally friendly water treatment formulations were in-vestigated. Smart monitoring and control technology provided continuous corrosion monitoring of all systems and also adjusted corrosion inhibitors based on actual corrosion results. This report addresses five important HVAC issues: scale protection, control of algae and bacteria, cycles of con-centration, corrosion protection, and water usage and cost. The nonhaz-ardous corrosion inhibitors and the smart control systems resulted in a longer, energy-efficient service life, lower life-cycle operating costs, and reduced risk of environmental contamination.
DISCLAIMER: The contents of this report are not to be used for advertising, publication, or promotional purposes. Citation of trade names does not constitute an official endorsement or approval of the use of such commercial products. All product names and trademarks cited are the property of their respective owners. The findings of this report are not to be construed as an official Department of the Army position unless so designated by other authorized documents. DESTROY THIS REPORT WHEN NO LONGER NEEDED. DO NOT RETURN IT TO THE ORIGINATOR.
ERDC/CERL TR-07-20 iii
Contents Figures and Tables..................................................................................................................................v
Introduction ...........................................................................................................................................vii
Executive Summary .............................................................................................................................viii
Unit Conversion Factors........................................................................................................................ix
1 Background..................................................................................................................................... 1 Overview ................................................................................................................................... 1 Smart equipment and green water treatment tests .............................................................. 3 Corrosion rate measurement................................................................................................... 5
2 Lessons Learned............................................................................................................................. 7
3 Technical Investigation................................................................................................................11 Problem statement.................................................................................................................11 Approach.................................................................................................................................11
Work plan....................................................................................................................................11 Equipment ..................................................................................................................................14 Environmental issues.................................................................................................................15 Reducing scale formation..........................................................................................................15 Control of algae and bacteria ....................................................................................................19
Effect of cycles of concentration on cooling tower operation ..............................................23 Determining the level of corrosion protection.......................................................................25 Water usage and cost ............................................................................................................29 Monthly reporting and evaluation process ...........................................................................30 Internet reporting service ......................................................................................................36 Data collection........................................................................................................................ 37
4 Metrics...........................................................................................................................................43
5 Economic Summary (Projected ROI)..........................................................................................44 Projected ROI ..........................................................................................................................44 Assumptions ...........................................................................................................................44
6 Recommendation.........................................................................................................................45
7 Implementation ............................................................................................................................46
8 Conclusions...................................................................................................................................48
Appendix A: Using LSI and RSI Indices to Choose Cooling Water Products.................................A1
Appendix B: Microbiologically Influenced Corrosion.......................................................................B1

ERDC/CERL TR-07-20 iv
Appendix C: HVAC Tip Sheet...............................................................................................................C1
Appendix D: Green Building Water Treatment Specification..........................................................D1
Appendix E: Return on Investment (ROI) Calculation......................................................................E1
Report Documentation Page
ERDC/CERL TR-07-20 v
Figures and Tables
Figures
Figure 1. Cooling tower. ............................................................................................................................. 3 Figure 2. Smart monitoring and control system...................................................................................... 4 Figure 3. Real-time corrosion operating data. ......................................................................................... 7 Figure 4. Data showing very good corrosion control during biocide feed times. The average steel corrosion rate was 1.6 mils per year (mpy), and the average copper corrosion rate was 0.11 mpy..................................................................................................................... 8 Figure 5. August 2006 data report for Fort Rucker................................................................................. 8 Figure 6. Cooling system controller......................................................................................................... 14 Figure 7. Clean tower fill...........................................................................................................................18 Figure 8. Sequencing of the chlorine chemical pump..........................................................................20 Figure 9. Monitoring cycles of concentration......................................................................................... 24 Figure 10. Rohrback AquaMate Portable Corrater................................................................................26 Figure 11. Corroded hot water supply line............................................................................................. 27 Figure 12. AquaTrack data report...........................................................................................................32 Figure 13. Corrosion rate correlation with residual chemical levels. ..................................................34 Figure 14. Average steel corrosion rates................................................................................................34 Figure 15. Average copper corrosion rates............................................................................................35 Figure 16. Copper and steel Corrater corrosion tips.............................................................................35 Figure 17. Steam boiler data input screen.............................................................................................39 Figure 18. Cooling tower data input screen...........................................................................................39 Figure 19. Hach DR890 hand-held colorimeter. ...................................................................................40 Figure 20. Heating plant at Red River Army Depot. .............................................................................. 41 Figure 21. Above-ground steam lines at Red River Army Depot. ......................................................... 41
Tables
Table 1. Pounds of steel lost per 100 linear feet at various corrosion rates........................................ 6 Table 2. Chemical levels in a cooling tower with a scale-forming condition. ...................................... 17 Table 3. Analysis plan to standardize chemical control........................................................................19 Table 4. Control levels for algae and bacteria. ......................................................................................22 Table 5. Spreadsheet for recording bacteria and biocide levels..........................................................22 Table 6. Spreadsheet for recording cycles of concentration................................................................25 Table 7. Standard corrosion control guidelines (with oxidizing biocides). ...........................................26 Table 8. Spreadsheet for recording steel corrosion rates. ................................................................... 27 Table 9. Spreadsheet for recording copper corrosion rates.................................................................28 Table 10. Spreadsheet for recording LSI and RSI. ................................................................................29

ERDC/CERL TR-07-20 vi
Table 11. Monitoring the tolytriazole performance. ..............................................................................36 Table 12. Summary of average data for each cooling tower................................................................46
ERDC/CERL TR-07-20 vii
Introduction
This demonstration was performed for the Office of the Secretary of De-fense (OSD) under Department of Defense (DoD) Corrosion Control and Prevention Project AR-F-314; Military Interdepartmental Purchase Re-quests MIPR5CCERB1011, dated 15 December 2005. The proponent was the Office of the Under Secretary of Defense for Acquisition, Technology, and Logistics. The technical monitors were Daniel J. Dunmire (OUSD(AT&L) Corrosion), Paul M. Volkman (IMPW-E), and David N. Purcell (DAIM-FDF).
The work was performed by the Materials and Structures Branch (CF-M) of the Facilities Division (CF), Construction Engineering Research Labora-tory – Engineer Research and Development Center (ERDC-CERL). The Project Officer was Vincent Hock. Portions of this work were performed under contract by Garratt-Callahan, Aquatrac, SMART Information Ser-vices, and the Illinois State Water Survey. At the time this report was pub-lished, the Chief of the ERDC-CERL Materials and Structures Branch was Vicki L. Van Blaricum (CEERD-CF-M), the Chief of the Facilities Division was L. Michael Golish (CEERD-CF), and the Technical Director for Instal-lations was Martin J. Savoie (CEERD-CV-ZT). The Deputy Director of ERDC-CERL was Dr. Kirankumar V. Topudurti, and the Director was Dr. Ilker Adiguzel.
COL Gary E. Johnston was the Commander and Executive Director of ERDC, and Dr. James R. Houston was the Director.
ERDC/CERL TR-07-20 viii
Executive Summary
This corrosion project developed extensive corrosion data on cooling tow-ers and steam boiler condensate systems that are part of heating, ventila-tion, and air conditioning (HVAC) systems. It utilized smart technology to adjust corrosion inhibitors as needed for cooling systems and steam line treatment for steam boilers with reference to national guidelines published by NACE International.
In this project a new method was developed for applying and monitoring performance of corrosion inhibitors. For example, the copper corrosion inhibitor was applied: (1) on a regularly scheduled basis to minimize cor-rosion; (2) as a preventive measure when applying biocides; and (3) on an as-needed basis when corrosion rates exceed pre-programmed set points. Data and graphs to illustrate system performance were stored in the sys-tem’s controller memory, which supports approximately 40 days of data storage before overwriting previous data. In addition to downloading these data monthly, wet chemistry test data, corrosion coupons, and measured corrosion information were developed and later transferred to an online reporting site.
A scientific approach was standardized for all facilities to uniformly track and compare key HVAC operating data. To report on these three specific areas, there was significant documentation of corrosion rates, corrosion inhibitor levels, biological activity, and water analytical tests. Ultimately, these data may be used at other facilities to establish a set of water treat-ment specifications and guidelines that could include specific corrosion inhibitor applications in heating and cooling plants, smart control equip-ment, green chemical formulations, and monitoring programs for tracking performance.
ERDC/CERL TR-07-20 ix
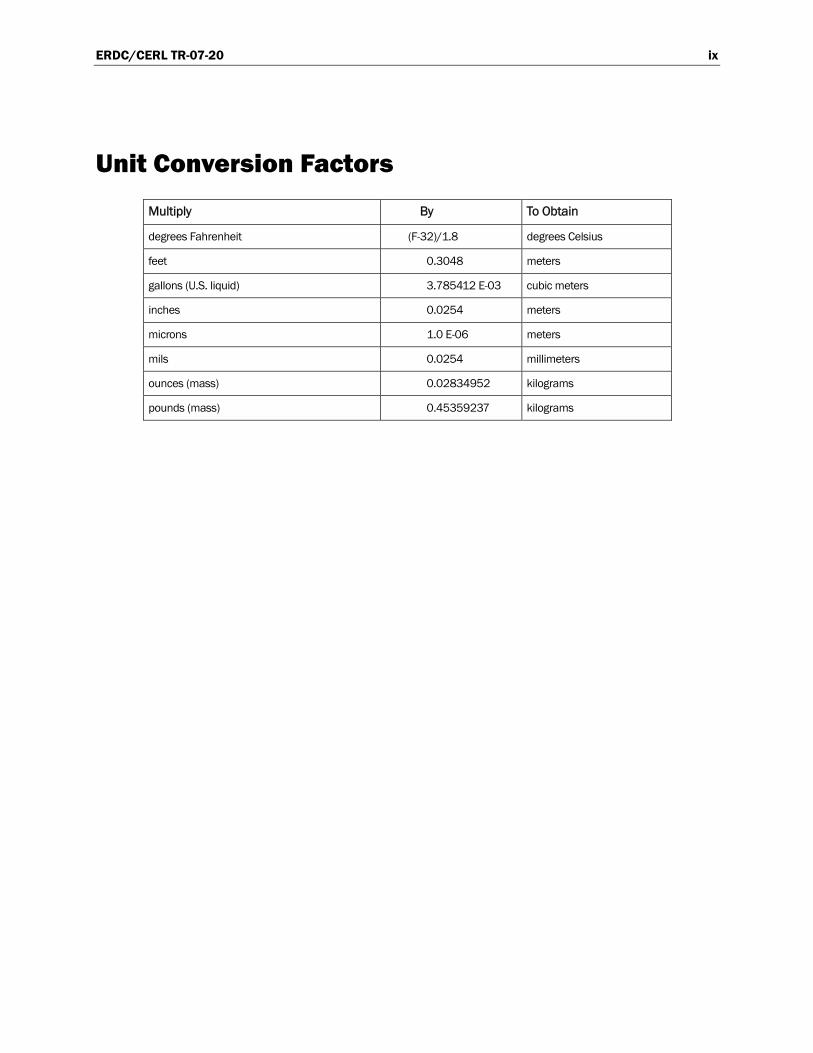
Unit Conversion Factors
Multiply By To Obtain
degrees Fahrenheit (F-32)/1.8 degrees Celsius
feet 0.3048 meters
gallons (U.S. liquid) 3.785412 E-03 cubic meters
inches 0.0254 meters
microns 1.0 E-06 meters
mils 0.0254 millimeters
ounces (mass) 0.02834952 kilograms
pounds (mass) 0.45359237 kilograms
ERDC/CERL TR-07-20 1
1 Background
Overview
The lack of current and consistent guidelines for new boiler and cooling tower water treatments has resulted in poor control of water treatment at many facilities. Poor control has resulted in reduced system reliability and efficiency. Maintenance costs have also increased because of premature failure of systems and components.
The evaluation of new formulations and the development of up-to-date se-lection and guidance are necessary to help Department of Defense (DoD) installations be informed buyers of water treatment for new and existing heating and cooling systems. This includes central plant heating and cool-ing systems and building heating, ventilating, and air-conditioning (HVAC) systems. Topics specifically needing to be addressed include treat-ment for cooling towers, steam boilers, condensate return systems, and closed heating and cooling systems. Manufacturers continue to introduce new chemicals and treatment programs onto the market, and old products have been discontinued. DoD installations may be uninformed about new treatment technologies.
A significant number of new chemical formulations have been introduced in the past several years, most notably in the areas of (1) new formulations for corrosion inhibition, (2) microbiocides for inhibition of bacteria and algae, and (3) phosphonates and phosphonate alternatives and new, highly effective polymers for scale inhibition. Interest and emphasis on environ-mentally friendly chemicals have increased. The term “environmentally friendly” refers to the environmental persistence of the chemical and the environmental impact of the production of the compound and eventual disposal of the spent chemical mixture. Chemicals are generally consid-ered more environmentally friendly when they have significantly less envi-ronmental impact and persistence than accepted conventional treatments.
The application of treatments is often inconsistent because treatment lev-els are monitored by manual chemical analysis. When treatment levels drop below lower limits, additional chemical is introduced into the system. Thus the treatment levels are inconsistent. However, smart monitoring and control systems are available to continuously monitor the treatment
ERDC/CERL TR-07-20 2
levels and introduce new product into the system exactly when needed and in the amount required. This approach results in a much more consistent rate of inhibitor application and better control of corrosion, scale, and microbiological growth.
Taken together, the nonhazardous corrosion inhibitors and the smart con-trol systems result in a longer, energy-efficient service life, lower life-cycle operating costs, and reduced risk of environmental contamination.
The purpose of this project was to obtain, analyze, and document a signifi-cant amount of quality operating data that affect corrosion and deposition in cooling towers and steam boilers. Environmentally friendly, or “green,” water treatment formulations previously evaluated by ERDC-CERL1 and found to be effective, were used to further establish their position in water treatment technologies. When these HVAC corrosion data have been thor-oughly evaluated, a pro-active design of future “smart” equipment and monitoring programs may be developed and specified for future HVAC systems.
This report focuses on practical operating information from boilers and cooling towers at five Army installations. A considerable amount of addi-tional technical information related to HVAC issues is provided in the technical articles listed in Appendices A – E. Because of variations in sup-ply water characteristics and operating loads, and the resulting difficulty in arriving at statistically valid conclusions, this report provides extensive documentation to respond to five important HVAC issues:
1. scale protection 2. control of algae and bacteria 3. cycles of concentration 4. corrosion protection 5. water usage and cost.
This project provides new insights on smart monitoring and control sys-tem and provides an extensive evaluation of green chemical performance, with approximately 600 corrosion tests in cooling and steam condensate systems.
1 U.S. Army Engineer Research and Development Center – Construction Engineering Research Labora-tory.
ERDC/CERL TR-07-20 3
Smart equipment and green water treatment tests
For this project, five independent military facilities were studied with identical control equipment provided by the Aquatrac Corporation under CERL design parameters, the use of green chemicals, and a uniform method of developing and reporting data. The project utilized established theory, developed a new chemical application process, and documented HVAC water treatment information from the five facilities, each having a different water supply and operating environment.
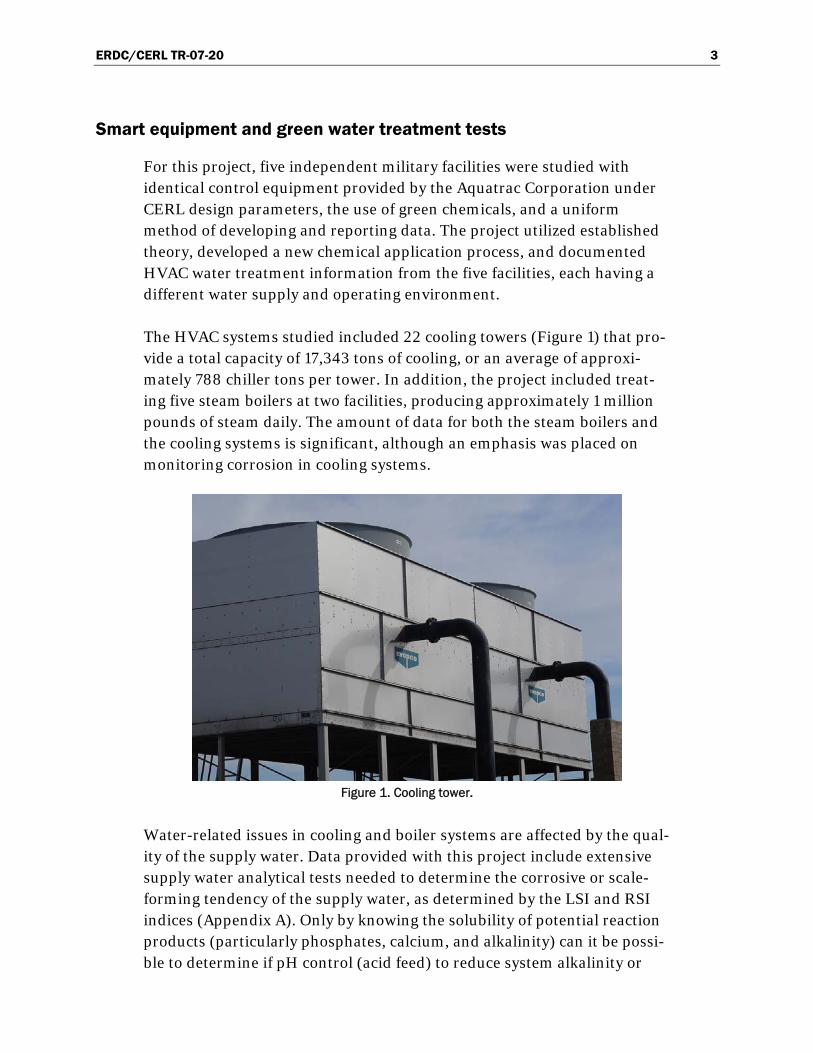
The HVAC systems studied included 22 cooling towers (Figure 1) that pro-vide a total capacity of 17,343 tons of cooling, or an average of approxi-mately 788 chiller tons per tower. In addition, the project included treat-ing five steam boilers at two facilities, producing approximately 1 million pounds of steam daily. The amount of data for both the steam boilers and the cooling systems is significant, although an emphasis was placed on monitoring corrosion in cooling systems.
Figure 1. Cooling tower.
Water-related issues in cooling and boiler systems are affected by the qual-ity of the supply water. Data provided with this project include extensive supply water analytical tests needed to determine the corrosive or scale-forming tendency of the supply water, as determined by the LSI and RSI indices (Appendix A). Only by knowing the solubility of potential reaction products (particularly phosphates, calcium, and alkalinity) can it be possi-ble to determine if pH control (acid feed) to reduce system alkalinity or
ERDC/CERL TR-07-20 4
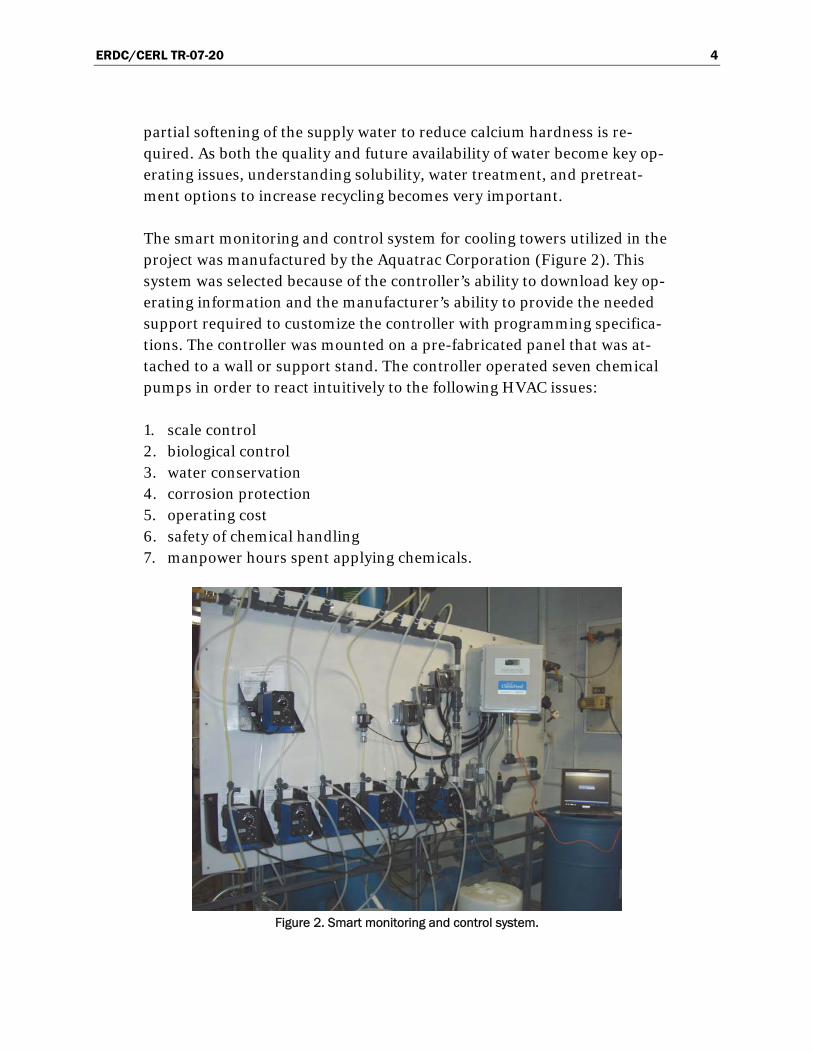
partial softening of the supply water to reduce calcium hardness is re-quired. As both the quality and future availability of water become key op-erating issues, understanding solubility, water treatment, and pretreat-ment options to increase recycling becomes very important.
The smart monitoring and control system for cooling towers utilized in the project was manufactured by the Aquatrac Corporation (Figure 2). This system was selected because of the controller’s ability to download key op-erating information and the manufacturer’s ability to provide the needed support required to customize the controller with programming specifica-tions. The controller was mounted on a pre-fabricated panel that was at-tached to a wall or support stand. The controller operated seven chemical pumps in order to react intuitively to the following HVAC issues:
1. scale control 2. biological control 3. water conservation 4. corrosion protection 5. operating cost 6. safety of chemical handling 7. manpower hours spent applying chemicals.
Figure 2. Smart monitoring and control system.
ERDC/CERL TR-07-20 5
Benefits of this technology for cooling towers include the following:
1. The controller can continuously monitor corrosion on both copper and steel.
2. The controller can apply chemical based on actual corrosion rate, re-ducing the use of toxic azole (tolytriazole or mercaptobenzyltriazole) needed for copper corrosion protection.
3. The controller can provide the capability of chemical feed verification. 4. The controller can utilize ORP sensor to automatically apply oxidizing
biocide. 5. The controller can utilize thermal flow switch for safety. 6. The controller can provide both Ethernet and modem communication. 7. The flow system can utilize a 50-micron filter for more accurate sens-
ing 8. The controller can utilize a torroidal conductivity probe for tower wa-
ter. 9. The controller can provide a second torroidal conductivity probe for
makeup. 10. The controller can utilize a pH sensor and control acid where applied. 11. The controller can provide software for charts and graphs. 12. The controller can display corrosion rate at all times.
Corrosion rate measurement
To document corrosion in this project, a portable field Corrosometer test unit was used to measure instant copper and steel corrosion rate data dur-ing the field service, while and steel and copper corrosion coupons were used to develop 30- to 90-day corrosion data. These methods of develop-ing corrosion information complement each other, and each method has advantages; overall correlation of the two readings was favorable.
When corrosion rates were established, a common time frame of 12 months was designated and noted with the documentation of mils per year (mpy). The corrosion rate noted as 1 mpy represents 1/1000th of an inch of metal loss over a 1 year interval. Corrosion rates are generally reported as a uniform process, but in actual practice, corrosion can be accelerated in specific areas. Corrosion coupons should not exceed 90 days in the sys-tem.
The data in Table 1 were developed by Corrview International (Corrview Technical Bulletin C1). It compares the pounds of steel pipe lost as corro-
ERDC/CERL TR-07-20 6
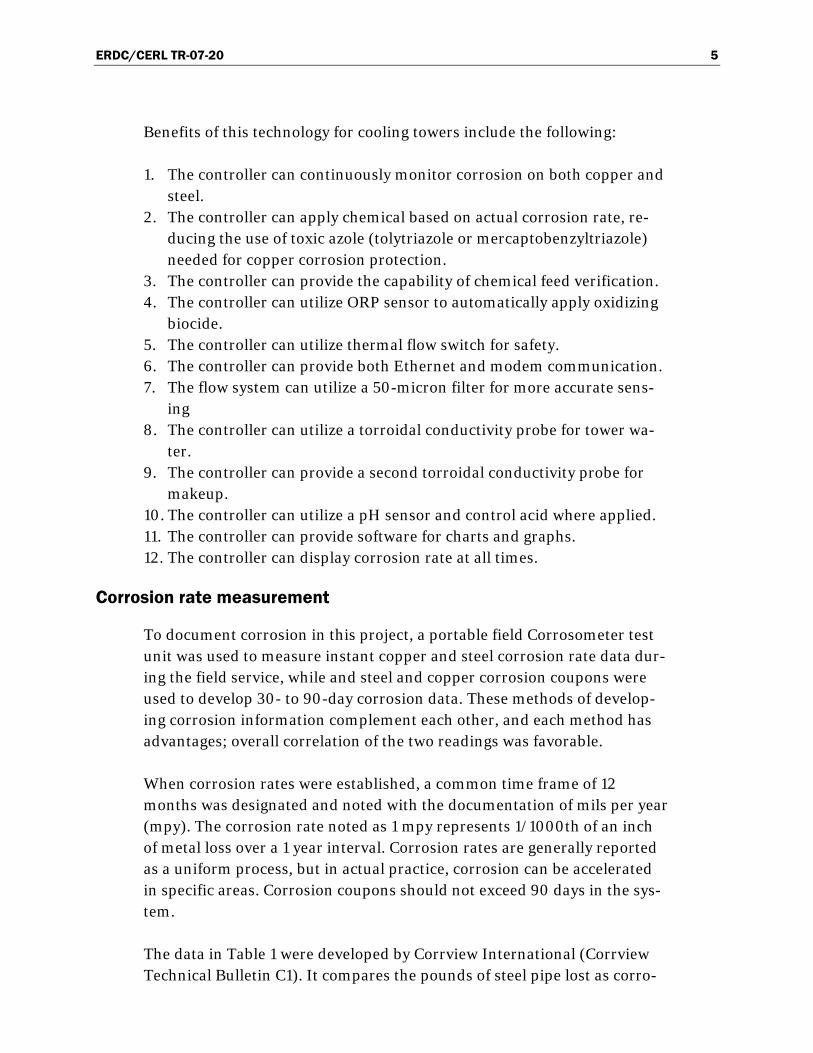
sion rates increase from 1–20 mpy in pipes sized from 2 to 24 in. Calcula-tions are loss per year for each 100 linear feet of schedule 40 pipe.
In addition to the economics of metal loss, additional chemical require-ments may be needed to address localized corrosion cells, under-deposit corrosion, recycling of tower water, filter systems, and tower cleaning. Consideration should also be given to the iron levels in the makeup supply water to cooling towers, keeping in mind that 1 ppm (part per million) ap-proximates 1.3 ounces of iron for every 10,000 gallons of makeup water.
Table 1. Pounds of steel lost per 100 linear feet at various corrosion rates.
Pipe Size (inches) 1 MPY 5 MPY 10 MPY 15 MPY 20 MPY
2 2.2 11.1 22.2 33.4 44.6
4 4.3 21.5 43.1 64.7 86.4
6 6.5 32.4 64.9 97.4 129.9
8 8.5 42.6 85.3 128.1 170.9
10 10.7 53.5 107.1 160.7 214.4
12 12.8 63.8 127.6 191.5 255.4
24 24.2 120.9 241.9 363.0 484.1
ERDC/CERL TR-07-20 7
2 Lessons Learned
This project confirmed the viable application of green chemistry despite significant differences in the supply water quality (including wastewater) and operating conditions. A close evaluation of the latest cooling tower control technology validated the hypothesis that it is possible to automati-cally adjust corrosion inhibitors based on real-time corrosion rates.
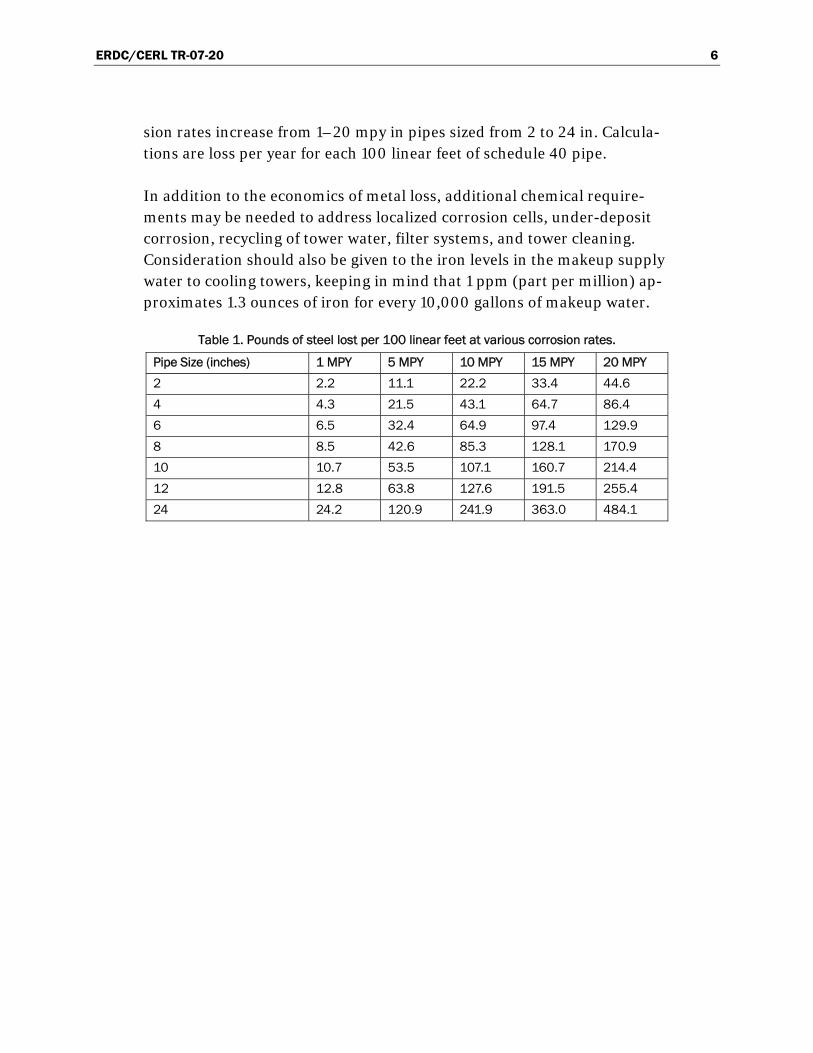
Figure 3 shows real-time operating data that confirm improved corrosion performance when applying oxidizing and non-oxidizing biocides. This illus-trates the importance of monitoring the water treatment program closely.
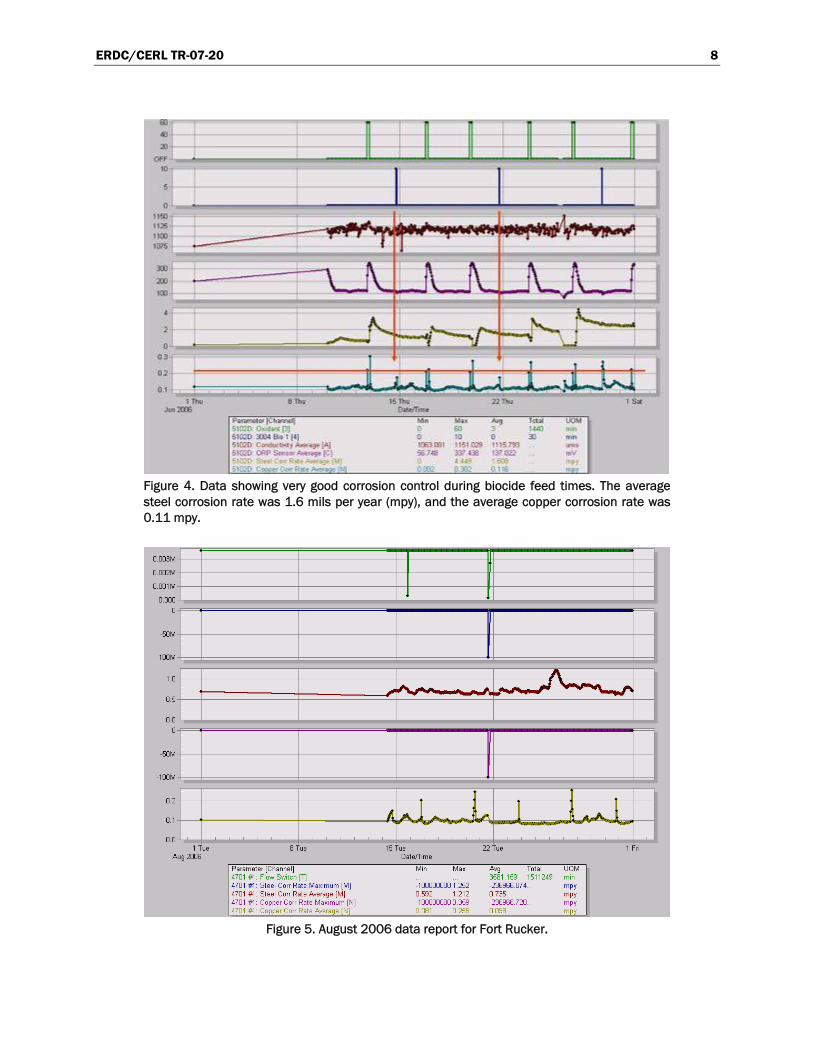
Figure 4 proves that with good control of both chlorine and tetrakis biocides, system corrosion can be controlled. It also shows the need to increase the cor-rosion inhibitors just prior to the biocide application for maximum protection.
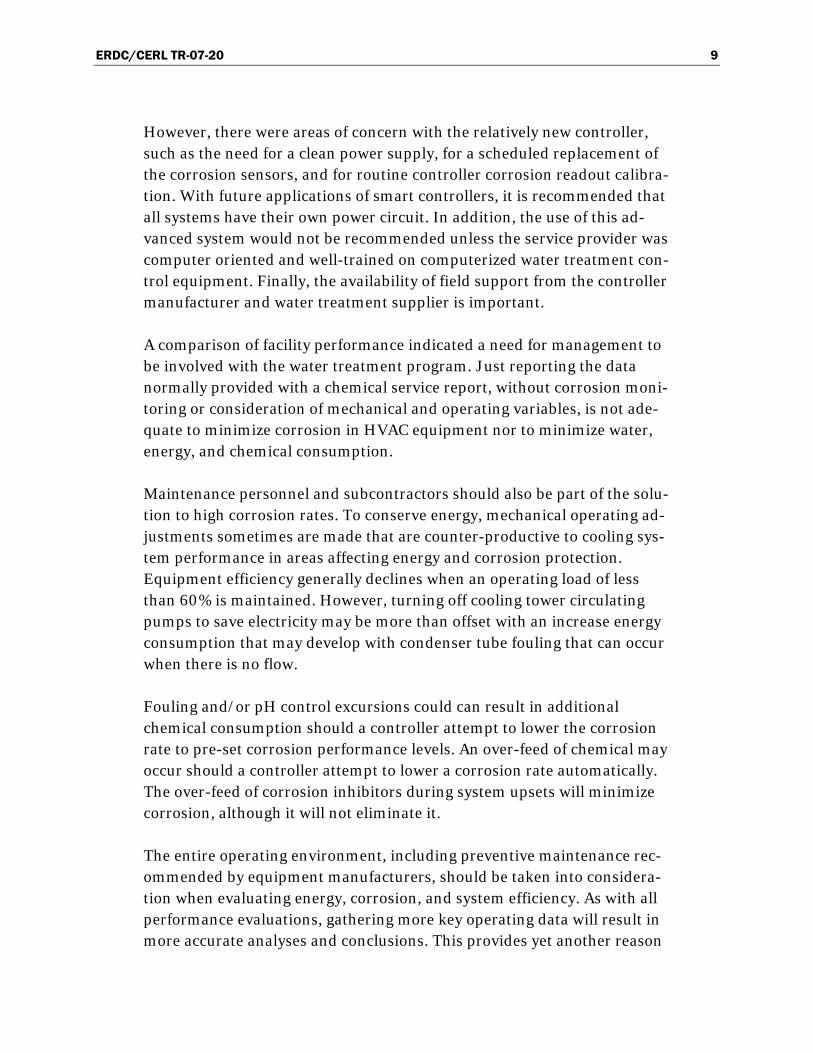
Figure 5 shows significant improvement with both steel and copper corro-sion rates. Even with 2 weeks of offline status, note the current excellent copper (0.096 mpy) and steel (0.735 mpy) corrosion rates.
Figure 3. Real-time corrosion operating data.
ERDC/CERL TR-07-20 8
Figure 4. Data showing very good corrosion control during biocide feed times. The average steel corrosion rate was 1.6 mils per year (mpy), and the average copper corrosion rate was 0.11 mpy.
Figure 5. August 2006 data report for Fort Rucker.
ERDC/CERL TR-07-20 9
However, there were areas of concern with the relatively new controller, such as the need for a clean power supply, for a scheduled replacement of the corrosion sensors, and for routine controller corrosion readout calibra-tion. With future applications of smart controllers, it is recommended that all systems have their own power circuit. In addition, the use of this ad-vanced system would not be recommended unless the service provider was computer oriented and well-trained on computerized water treatment con-trol equipment. Finally, the availability of field support from the controller manufacturer and water treatment supplier is important.
A comparison of facility performance indicated a need for management to be involved with the water treatment program. Just reporting the data normally provided with a chemical service report, without corrosion moni-toring or consideration of mechanical and operating variables, is not ade-quate to minimize corrosion in HVAC equipment nor to minimize water, energy, and chemical consumption.
Maintenance personnel and subcontractors should also be part of the solu-tion to high corrosion rates. To conserve energy, mechanical operating ad-justments sometimes are made that are counter-productive to cooling sys-tem performance in areas affecting energy and corrosion protection. Equipment efficiency generally declines when an operating load of less than 60% is maintained. However, turning off cooling tower circulating pumps to save electricity may be more than offset with an increase energy consumption that may develop with condenser tube fouling that can occur when there is no flow.
Fouling and/or pH control excursions could can result in additional chemical consumption should a controller attempt to lower the corrosion rate to pre-set corrosion performance levels. An over-feed of chemical may occur should a controller attempt to lower a corrosion rate automatically. The over-feed of corrosion inhibitors during system upsets will minimize corrosion, although it will not eliminate it.
The entire operating environment, including preventive maintenance rec-ommended by equipment manufacturers, should be taken into considera-tion when evaluating energy, corrosion, and system efficiency. As with all performance evaluations, gathering more key operating data will result in more accurate analyses and conclusions. This provides yet another reason
ERDC/CERL TR-07-20 10
for operators and management to develop an on-going log and to periodi-cally review the data and take corrective actions when necessary.
The saying “inspect what you expect” is much more than a cliché. It is nec-essary to maintain high levels of system performance. A particular concern is that one or two service calls per month may not be adequate with this advanced controller technology. Three of the facility sites had good quality control with weekly service calls, and two of the sites needed two calls per month to meet project requirements. Only one site had daily tests, and it had the best overall quality control by the mechanical subcontractor, which proved to be very helpful in documenting the performance and suc-cess of this new smart application technology.
For optimum results, water treatment and corrosion monitoring should be a supplement to other real-time monitoring programs provided in-house or with mechanical contractors, such as those developed for energy man-agement. It is important that key team members of the facility respond quickly to problems associated with the water management program. Problems as simple as a clogged drain may result in someone closing a bleed valve, which may cause condenser/chiller scale deposition and high energy consumption.
ERDC/CERL TR-07-20 11
3 Technical Investigation
Problem statement
Corrosion, scale, and biological growth in boilers, cooling towers, and dis-tribution systems result in reduced flow though pipes, reduced heat trans-fer in boilers and condensers, and pump failures. Preventive treatments for these problems are based on chemical compounds that are most often toxic and environmentally persistent. Manufacturers continue to introduce new chemicals and treatment programs onto the market, and old products have been discontinued. Many manufacturers claim that the new chemical and treatments are more environmentally friendly and safer for the plant workers and the users.
Approach
This project implemented a smart monitoring and control system to intro-duce nonhazardous corrosion, scale, and biological growth inhibitors into the boilers, cooling towers, and distribution systems at energy plants at five DoD installations. Corrosion inhibition was accomplished with a film-ing soya amine. The cooling tower biocide is formulated with tetrakis hy-droxymethyl phosphonium sulfate (THPS) as a broad-spectrum, nonfoam-ing microbiocide. The compound has an environmentally benign toxicity profile and degrades rapidly to nontoxic components upon discharge. THPS does not bioaccumulate and therefore offers a reduced risk to higher life forms. Scale inhibitors are formulated with polyaspartate (PASP), a class of water-soluble polymer compounds that inhibit the formation of calcium carbonate, calcium sulfate, and barium sulfate. It is targeted for use in place of the less environmentally friendly polyacrylates. The poly-acrylates are inexpensive and versatile but are environmentally persistent, lasting virtually forever. The PASP compounds are more environmentally acceptable on the production end, as production uses no organic solvents and is extremely efficient and virtually waste-free. They are also degrad-able over time with bacterial action.
Work plan
This project work plan was designed for a typical HVAC plant that faces many operating variables every day, not for the traditional laboratory re-search environment or for large operations such as those found in cogene-
ERDC/CERL TR-07-20 12
ration plants. For this reason, it is important to note that there is a signifi-cant difference between laboratory internally controlled variables in re-search compared to the same variables exposed to the external HVAC field variables.
For example, the use of chlorine, a strong oxidizing biocide, in cooling sys-tems has become common to reduce chemical costs and to attempt to con-trol the Legionella bacterium. Chlorine is well known for its mild steel, copper alloy, and galvanized metal corrosive potential; however, there have been few attempts to quantify corrosion rates in a wide range of op-erating conditions. It was reported that some cooling tower systems were replaced in just three to four years, resulting in premature replacement at a cost of thousands of dollars. Should the condenser and/or chiller also need replacement, a cost of at least $250,000 is common. Even temporary repair to an exchanger can cost in excess of $50,000, and in steam boilers a small retubing job can easily exceed $30,000.
One cause of accelerated corrosion is the lack of either a copper or mild steel corrosion inhibitor in water treatment formulations. A well-formulated water treatment product will contain not only scale inhibitors, which typically is the focal point, but also copper corrosion inhibitors, since most heat exchanger tubes contain copper. Usually the corrosion in-hibitor is an azole, such as tolytriazole (tta) or mercaptobenzyltriazole (mbt). Should a leak occur in heat exchanger tubes, it becomes necessary to either retube or replace the entire heat exchanger. It is critical that any heat exchanger with copper tubes be treated with a water treatment for-mulation containing an azole for corrosion protection.
When chlorine is applied to control bacteria, the azole protective film is disrupted and copper corrosion rates become excessive. There are two methods to compensate for this disruption. The first method is to overfeed the water treatment formulation so that there will be more than enough azole when the chlorine is applied. The second method is to separate the azole corrosion inhibitor from the formulation containing the scale inhibi-tor. The first method not only results in additional expense, but it also in-creases the amount of azole applied, adversely impacting the environment. This project used the second method, and separated the feed of the copper corrosion inhibitor for better control, to develop application data and to reduce chemical application cost.
ERDC/CERL TR-07-20 13
The smart automated equipment monitored corrosion and increased the azole inhibitor during the chlorine application on an as-needed basis to minimize copper corrosion rates, chemical usage and cost, and environ-mental impact.
Corrosion within the steam boiler should be minimal because of the addi-tion of water treatment formulations that remove corrosive oxygen and provide a noncorrosive highly buffered alkaline water. It is important that the oxygen scavenger be applied to the feedwater to protect the feedwater system and to minimize corrosion migration to the steam boilers.
Steam lines that distribute steam and return the heat in the form of con-densate often do not receive the desired corrosion protection. Most plants use a single amine or a blend of neutralizing amines to minimize corrosion resulting from a low pH that occurs when carbonic acid is formed in the condensate. However, neutralizing amines provide no protection from in-sidious oxygen corrosion, which is becoming much more prevalent as steam boilers are often taken off line to save energy and reduce operating costs. For oxygen corrosion protection in steam lines, filming amines may be utilized for metal passivation, although distribution of filming amines in long steam lines, particularly those with vertical risers, is much more difficult than distribution of a neutralizing amine used for pH control. Where filming amines must be used, multiple injection sites may be re-quired.
Historically, filming amines have been difficult to apply because of their high viscosity, low vaporization, and limited distribution capability. The green steam line formulation used in this study, an organic soya amine, minimizes handling issues but still is difficult to distribute evenly when there are lengthy or complex steam lines. The material has not been ap-proved by the U.S. Department of Agriculture (USDA) or the Food and Drug Adminstration (FDA), and has not been recommended for steam humidifi-cation systems. As with all filming amines, there is a period of removing ex-isting iron oxides as the film is being established on the metal surface, so startup dosages need to be very low until the condensate iron residuals are low.
To monitor the performance of this filming amine, a custom condensate piping arrangement was required to house the Corrater probe and corro-sion coupon to ensure that the condensate line was full. This piping in-
ERDC/CERL TR-07-20 14
cluded a Dole flow control valve to maintain flow requirements for meas-uring corrosion. With this arrangement, low Corrosometer corrosion read-ings were promising, although corrosion coupons were coated with the sloughed iron oxide, resulting in excessive corrosion rates caused by under-deposit corrosion on the coupon.
With most HVAC plants, it is fair to say that, while corrosion coupons may be used occasionally, extensive corrosion monitoring is not routinely per-formed as part of the water treatment or quality control program. Without documentation to track corrosion, this lack of attention often results in shortened life expectancy of the equipment and an unnecessary waste of capital for repair or replacement.
Equipment
To develop better insight into the use of corrosion inhibitors for cooling and heating systems, state-of-the-art monitoring equipment was provided to track, monitor, and adjust the corrosion inhibitors on an as-needed ba-sis. This project utilized the latest tower controller technology, with new custom programming to apply corrosion inhibitors should excessive corro-sion rates develop when applying chlorine to control Legionella bacteria or disinfect a cooling tower.
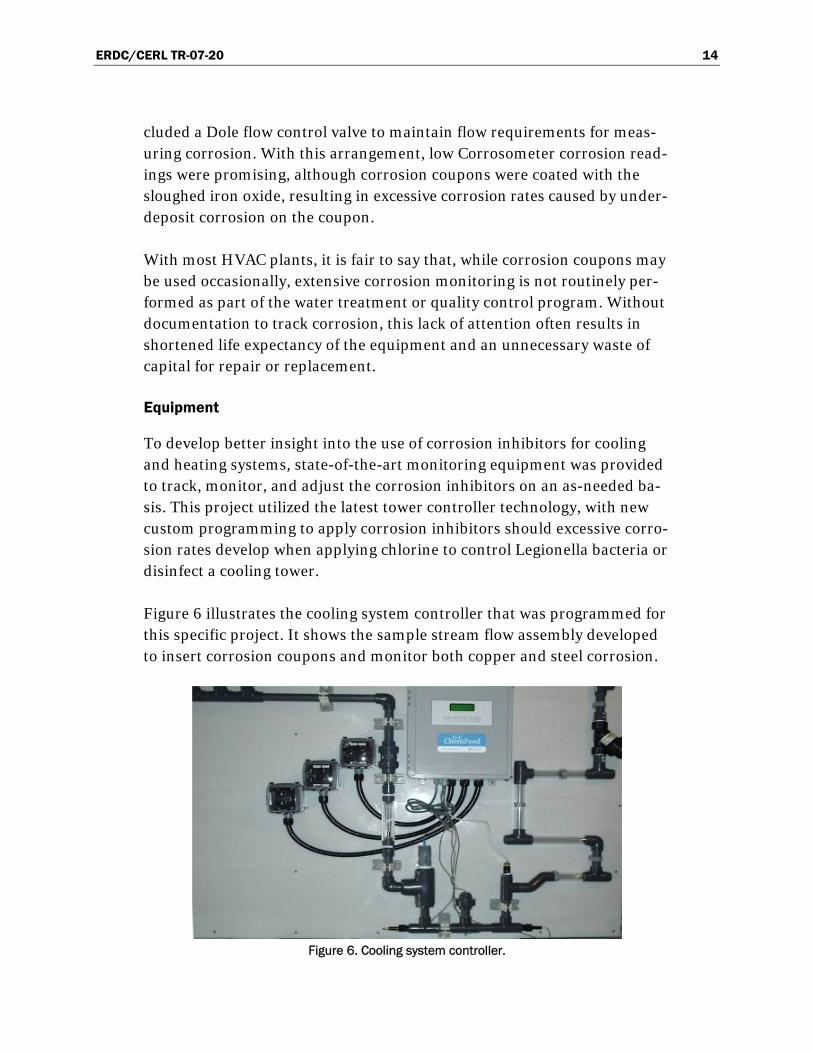
Figure 6 illustrates the cooling system controller that was programmed for this specific project. It shows the sample stream flow assembly developed to insert corrosion coupons and monitor both copper and steel corrosion.
Figure 6. Cooling system controller.
ERDC/CERL TR-07-20 15
At the bottom of Figure 6 are the copper and steel corrosion probes that provide continuous corrosion monitoring. On the right is a clear piping window for observing corrosion coupons, with a flow control valve and piping that will allow three corrosion coupons for 30- to 60-day corrosion measurements. The flow assembly has a fitting for a Corrater probe that provides corrosion data that may also be used for calibrating the Aquatrac controller corrosion monitor.
This controller will react to pre-programmed corrosion rates. If corrosion rates are excessive, one chemical pump will apply additional azole for cop-per corrosion protection on an as-needed basis, and another pump will apply additional inhibitor for steel corrosion protection. The unit was also programmed to apply additional azole during the chlorine biocide applica-tion for additional corrosion protection.
Environmental issues
In addition to measuring and minimizing corrosion, one objective of this project was to utilize green chemistry technology in the water treatment program. The DoD has a strong interest in reducing the use of toxic chemicals in its buildings by introducing chemical formulations that more easily decompose in the environment.
A previous ERDC-CERL project researched green chemistry technology and developed a water treatment specification (Appendix D) for facilities to use with future water treatment bids. The water treatment chemical ob-jectives of this project were to minimize the use of all chemicals, eliminate the use of polyacrylates, and use green raw materials such as polyaspartate (PASP), tetrakis (THPS), and, where possible, a steam line soya amine for condensate corrosion protection.
This project also addressed return-on-investment calculations with a sup-plementary report and provides up-to-date information pertaining to the use of untreated and recycled greywater as a supply source of cooling tower makeup.
Reducing scale formation
Once a system is inspected and found free of deposits, proper maintenance and an effective chemical treatment program should keep it that way. The system’s supply water has many minerals (called ions); some are more
ERDC/CERL TR-07-20 16
damaging than others because of their solubility. Every mineral has a limit as to how much can remain in solution, even with the addition of water treatment chemicals.
By knowing system temperatures and the amount of strategic ions, such as total hardness (consisting of calcium and magnesium ions), total alkalin-ity, chloride, pH, and total dissolved solids (specific conductivity), it is possible to predict whether the water is corrosive or scale forming (occa-sionally both conditions exist).
In the evaluation of corrosion tendencies, it is important to understand the effect of atmospheric gases, such as oxygen, carbon dioxide, nitrogen, and contaminants such as sulfur dioxide. This knowledge is particularly useful with systems involving higher temperatures that affect the solubility of gases. It is also important to understand how the release or absorption of gases affects water quality and metal corrosion.
The evaporation process in cooling towers uses most of the supply water. This evaporation releases pure water vapor (no minerals) to the atmos-phere. As no minerals are in the evaporated water, the minerals increase in the cooling tower water until their solubility limit is reached. At this time, scale (calcium carbonate) forms and deposits on the hottest metal area. In a cooling tower system, this hottest area is in the condenser. Eventually, unless the cause is found and corrected, the deposit will also occur in the cooling tower. When evaluating fill deposits, it is important to note the amount of water flow over the fill, as inadequate flow or no flow will con-tribute to fill deposition.
Some of these ions are much more soluble than others. For example, the chloride ion is extremely soluble (as evident in the saltiness in seawater), so it can be used as a benchmark by comparing the supply and tower water chloride. If the tower water has three times as many chloride ions as the supply water, the supply water has been cycled three times, or three cycles of concentration are being carried in the tower water. Higher cycles result in reduced bleed-off but do not affect the amount of evaporated water re-quired for cooling.
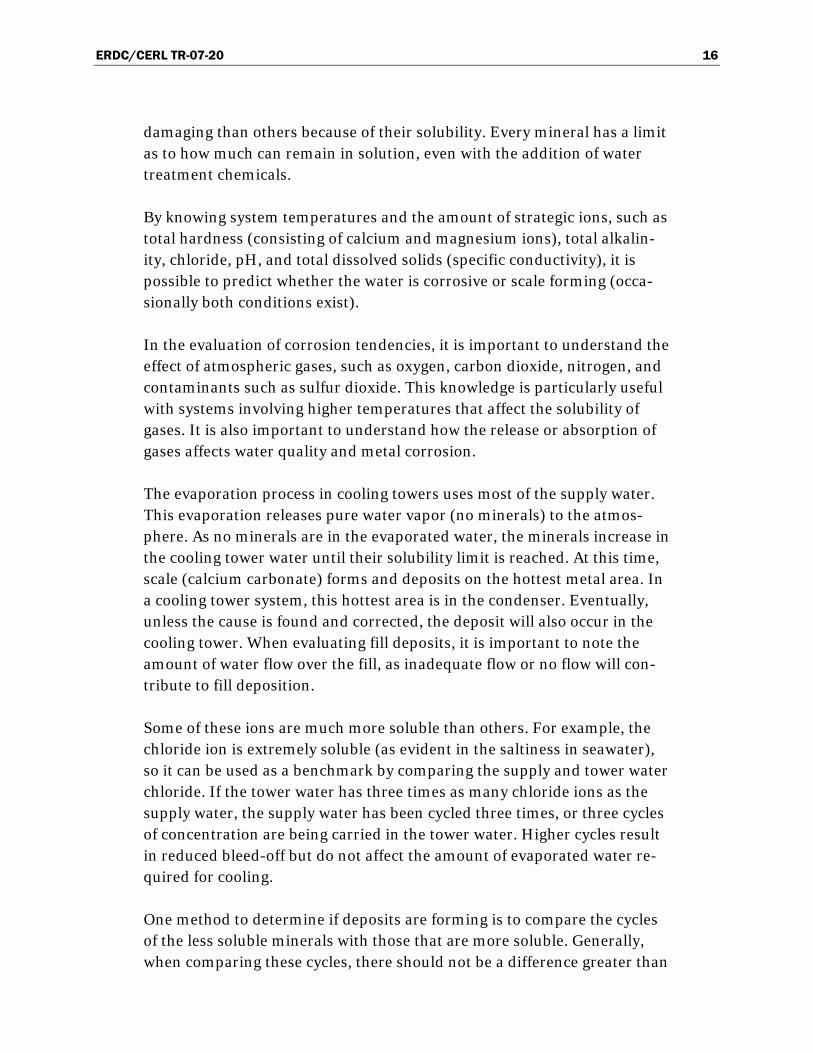
One method to determine if deposits are forming is to compare the cycles of the less soluble minerals with those that are more soluble. Generally, when comparing these cycles, there should not be a difference greater than
ERDC/CERL TR-07-20 17
10–15%. If the difference between cycles for less soluble minerals is greater than this amount, it is a good indication that the mineral has ex-ceeded saturation limits and is precipitating in the system.
The cooling tower chemical readings in Table 2 indicate a scale-forming condition because the cycles of concentration for the less soluble (scale-forming) minerals are significantly less than the cycles for the more solu-ble chloride ion.
Table 2. Chemical levels in a cooling tower with a scale-forming condition.
Chloride Calcium Hardness Total Hardness Alkalinity TDS
Supply 30 140 200 150 450
Tower 128 450 640 500 1500
CoC 4.3 3.2 3.2 3.3 3.3
In cooling systems where the makeup water supply has not been treated (i.e., greywater), the supply water phosphate residual is just as important as hardness and alkalinity and other minerals in the water and may be the limiting factor on the number of cycles that may be carried in the cooling tower.
If silica is high in the supply water, cycles should be established to main-tain a maximum silica residual of 150–160 parts per million (ppm). A sil-ica deposit in heat exchangers is difficult to remove chemically and re-quires the use of hydrofluoric acid, which is dangerous to personnel and equipment. A silica deposit will result in more than twice the energy loss when compared to a calcium carbonate deposit of the same thickness.
Maximizing cycles of concentration is important to minimize water and chemical usage. However, if excessive cycles are carried and solubility lim-its that result in deposition are exceeded, the savings in water and chemi-cal is more than offset by additional energy requirements that occur as de-posits reduce heat transfer efficiencies that increase the compressor load. Mineral deposits such as calcium carbonate, iron, or silica increase energy consumption even more than fouling contaminants.
Two primary water characteristics that create scale are calcium hardness and total alkalinity. To allow some margin of safety, the combination of these two ions should not exceed 1,000 ppm in the cooling water. If addi-tional cycles are desired to reduce water usage and/or chemical costs, it is
ERDC/CERL TR-07-20 18
necessary to improve the supply water quality by partially (not totally) sof-tening the supply water and/or reducing the supply water alkalinity.
If necessary, the supply water alkalinity may be reduced with sulfuric acid to lower the cooling tower alkalinity and the resulting pH. Unfortunately, sulfuric acid can become very corrosive and dangerous to the system if overfed or not applied correctly. In addition, the acid is very dangerous to handle and requires monthly hazardous chemical reporting. To minimize corrosive pH excursions, testing should be performed a minimum of every day when applying acid for pH control.
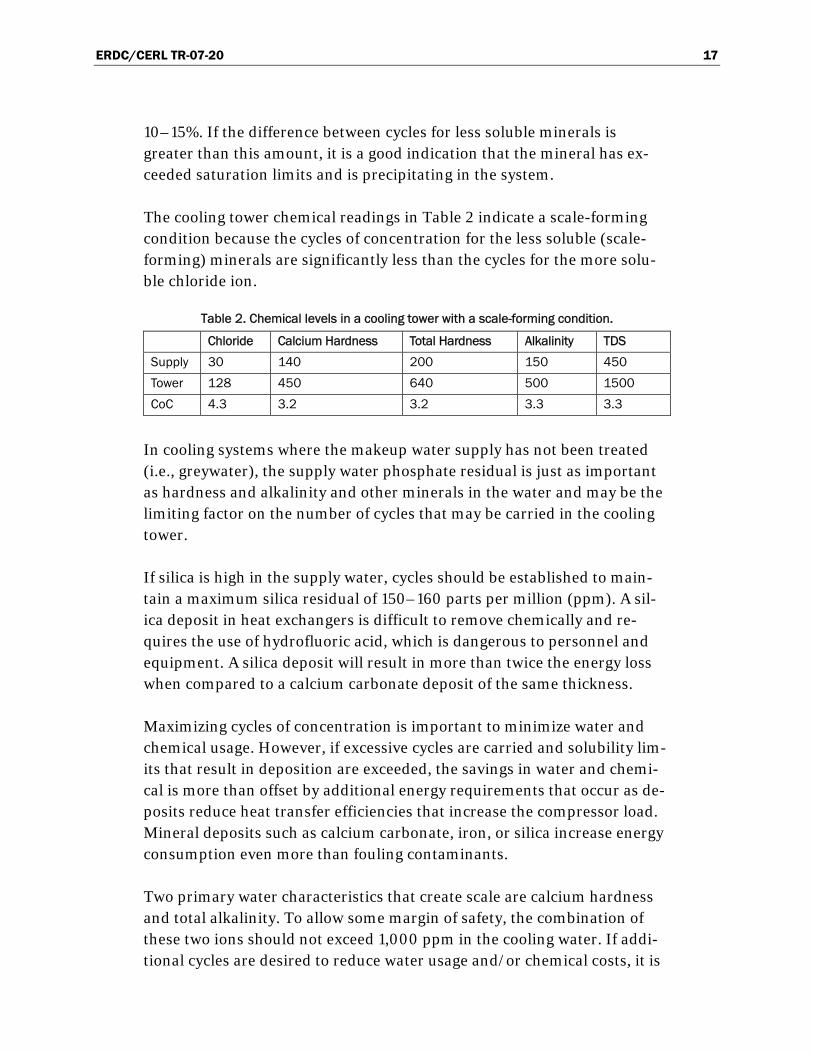
Flow, biofilm formation, startup, system lay-up, tower dirt, and debris are additional variables that need monitoring in order to provide clean heat-exchange surfaces. Inspecting the tower fill, as shown with one of the pro-ject inspections in Figure 7, is a good indicator of tower cleanliness.
Figure 7. Clean tower fill.
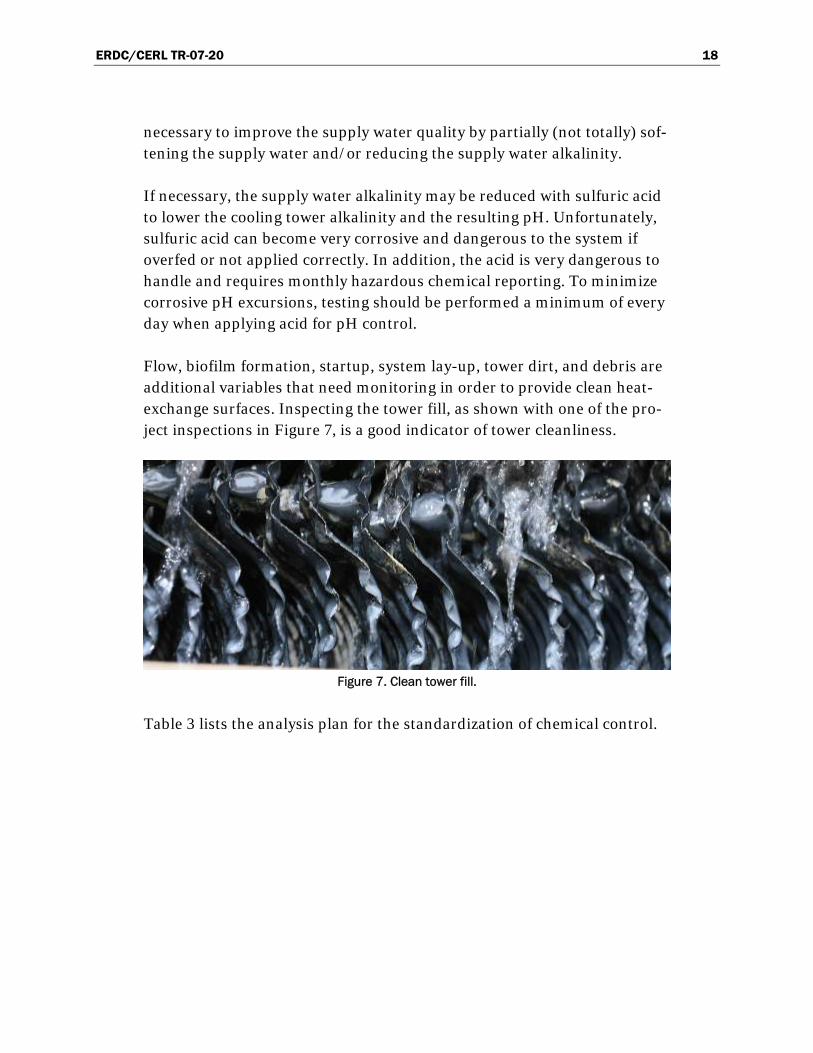
Table 3 lists the analysis plan for the standardization of chemical control.
ERDC/CERL TR-07-20 19
Table 3. Analysis plan to standardize chemical control.
Cooling Towers Test Control Range
G-C 307 or 309 Free Chlorine (4 hrs Mon. & Friday) 0.2 to 0.5 ppm
G-C 2605 Molybdate 0.5 to 0.75 ppm
G-C 2018 Azole 0.5 to 0.8 ppm
G-C 2018 Azole during Cl2 Application 1.0 to 2.0 ppm
G-C 3004 Tetrakis (Wednesday only) total ppm 125 to 150 ppm
Steam Boilers Test Control Range
G-C 4055 No test…measure dosage rate 20 to 30 ppm as G-C 4055
G-C 44 Condensate pH 7.5 to 8.5
G-C 159 Sulfite 30 to 50 ppm
G-C 1557 Phosphate 20 to 40 ppm
G-C 1100 Molybdate 1.4 to 2.3 ppm
G-C LC5 Total Alkalinity 350 to 800 ppm
Control of algae and bacteria
Because a cooling tower is a breeding ground for algae and corrosive bac-teria, it is important that bacteria be kept under control. “Under control” are the two operative words, as it is not practical, technically or economi-cally, to maintain a sanitized tower free of algae and bacteria at all times. Biofilms, dirt, and debris (referred to as fouling) contaminants harbor cor-rosive bacteria and increase operating costs.
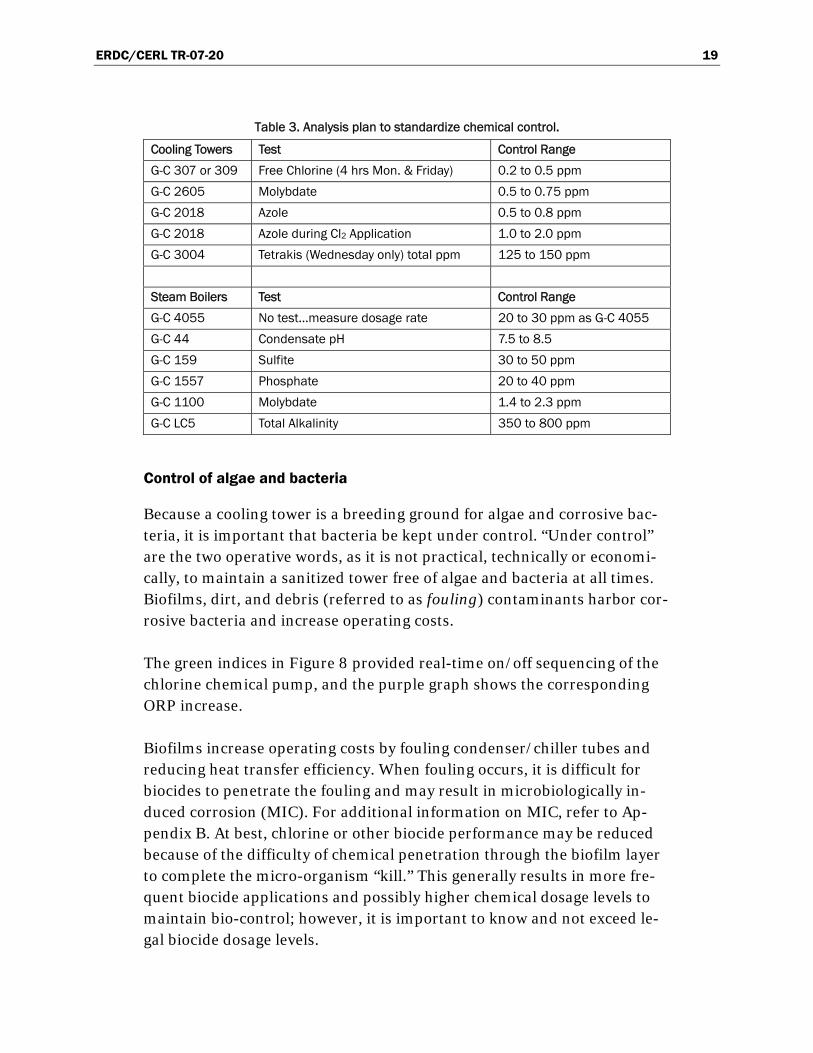
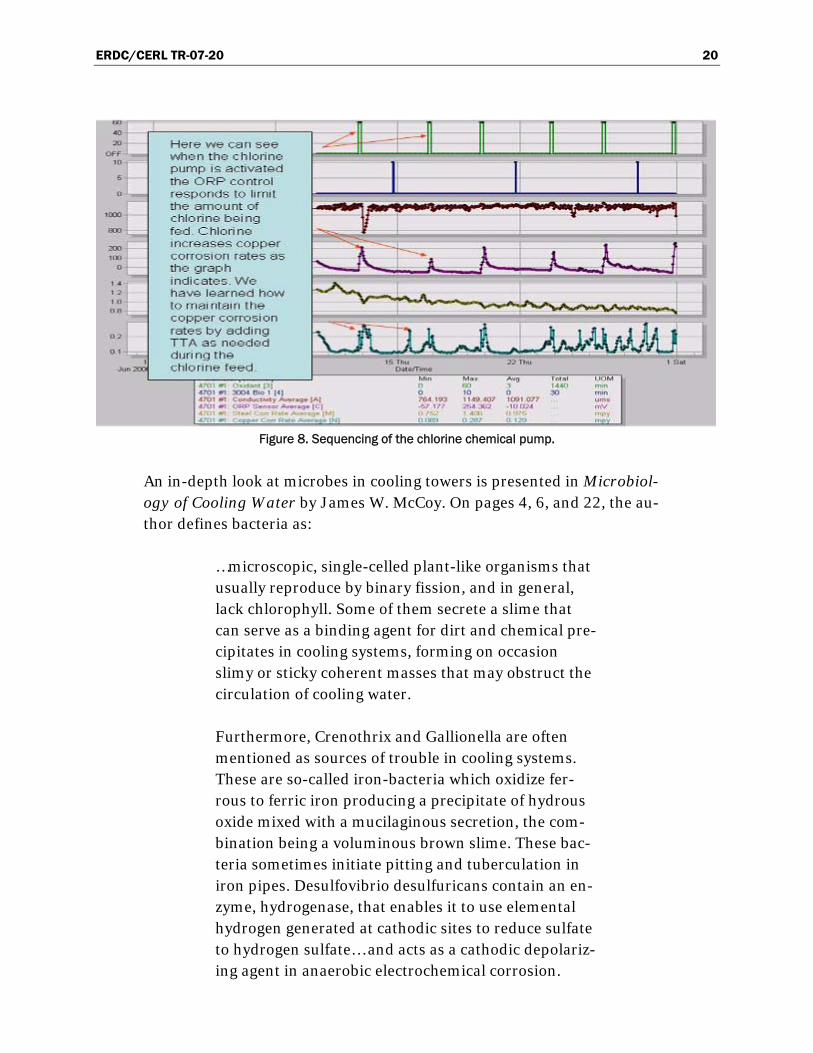
The green indices in Figure 8 provided real-time on/off sequencing of the chlorine chemical pump, and the purple graph shows the corresponding ORP increase.
Biofilms increase operating costs by fouling condenser/chiller tubes and reducing heat transfer efficiency. When fouling occurs, it is difficult for biocides to penetrate the fouling and may result in microbiologically in-duced corrosion (MIC). For additional information on MIC, refer to Ap-pendix B. At best, chlorine or other biocide performance may be reduced because of the difficulty of chemical penetration through the biofilm layer to complete the micro-organism “kill.” This generally results in more fre-quent biocide applications and possibly higher chemical dosage levels to maintain bio-control; however, it is important to know and not exceed le-gal biocide dosage levels.
ERDC/CERL TR-07-20 20
Figure 8. Sequencing of the chlorine chemical pump.
An in-depth look at microbes in cooling towers is presented in Microbiol-ogy of Cooling Water by James W. McCoy. On pages 4, 6, and 22, the au-thor defines bacteria as:
…microscopic, single-celled plant-like organisms that usually reproduce by binary fission, and in general, lack chlorophyll. Some of them secrete a slime that can serve as a binding agent for dirt and chemical pre-cipitates in cooling systems, forming on occasion slimy or sticky coherent masses that may obstruct the circulation of cooling water.
Furthermore, Crenothrix and Gallionella are often mentioned as sources of trouble in cooling systems. These are so-called iron-bacteria which oxidize fer-rous to ferric iron producing a precipitate of hydrous oxide mixed with a mucilaginous secretion, the com-bination being a voluminous brown slime. These bac-teria sometimes initiate pitting and tuberculation in iron pipes. Desulfovibrio desulfuricans contain an en-zyme, hydrogenase, that enables it to use elemental hydrogen generated at cathodic sites to reduce sulfate to hydrogen sulfate… and acts as a cathodic depolariz-ing agent in anaerobic electrochemical corrosion.
ERDC/CERL TR-07-20 21
Another bacterium that is the subject of litigation is the Legionella. While found in lakes, rivers, and supply waters, it also likes the environment of cooling towers. This bacterium may enter the cooling tower from the sup-ply water makeup, but it becomes a much greater health hazard because of the airborne mist that may contain water pathogens. It is possible that this mist may be aspirated with the tower spray, so tower placement should be away from building air intakes and, if possible, from public walkways.
According to the Centers for Disease Control and Prevention (CDC), the best defense against this strain of bacterium is to have a good biocide pro-gram, sanitize the tower two to four times per year with an oxidizing bio-cide (chlorine), and clean the tower a minimum of two times per year (quarterly is recommended or anytime dirt covers the tower basin).
To protect the health of those who may be around cooling towers and to minimize potential lawsuits, it is important to test for and control this bac-terium and log the results for future reference. Tests and documentation for this bacterium should also be run in chill water and hot water closed loops. Few laboratories have the expertise and facilities to run this test; however, one excellent source is the CDC laboratory in Atlanta, GA.
To monitor aerobic biological control, a number of companies utilize a dip slide that contains a specific auger to develop colonies of bacteria that ul-timately measures aerobic bacteria or anaerobic bacteria. There is also a dip tube test for anaerobic bacteria, such as sulfate-reducing bacteria, which are very corrosive. The box with the dip slides provides application instructions and illustrates acceptable bacteria levels.
Both dip slide and Biotrace ATP Luminometer (ATP) bio-control tests were evaluated with this project, and a Microbio control plan was devel-oped to adjust both oxidizing and non-oxidizing biocide applications (Table 4). Bio-control tests should be run on a regular schedule and peri-odically as needed to ensure that Legionella bacteria are not present. These tests should be supported with a physical inspection of the tower to check the effectiveness of the biocide program and to see if algae is ram-pant or if the tower needs to be cleaned.
ERDC/CERL TR-07-20 22
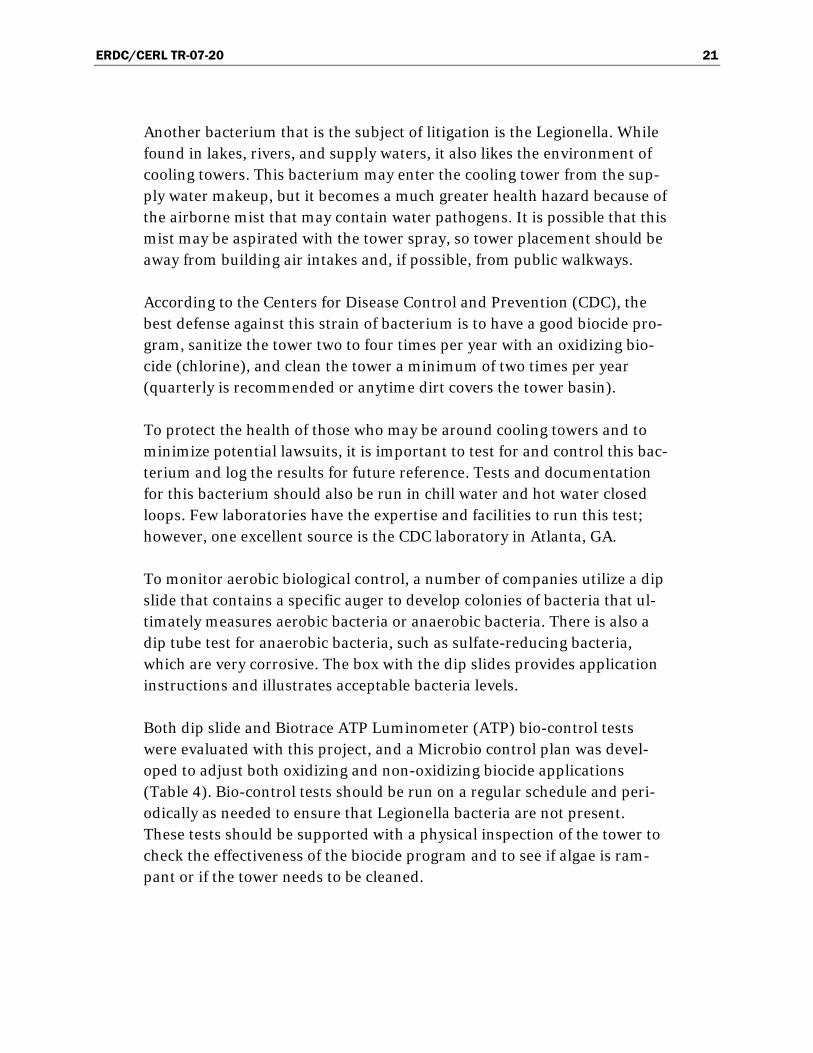
Table 4. Control levels for algae and bacteria.
TEST Excellent Control Good Control Poor Control
Biotrace ATP Planktonic 100 to 300 RLU 300 to 1000 RLU >1000 RLU
Dip Tube Anaerobic Bacteria 0 organism/mL <5 organism/mL >5 organism/ mL
Dip Slides Aerobic Bacteria <100,000 organism/mL <500,000 organism/mL >1,000,000 organism/mL
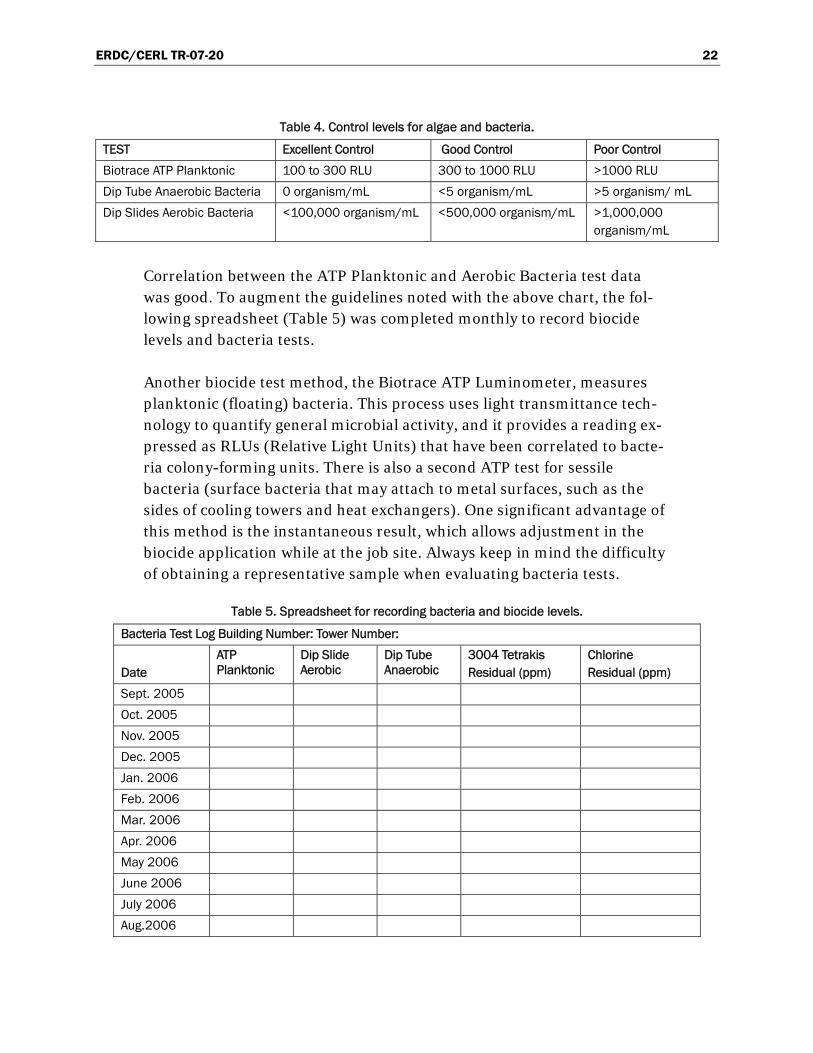
Correlation between the ATP Planktonic and Aerobic Bacteria test data was good. To augment the guidelines noted with the above chart, the fol-lowing spreadsheet (Table 5) was completed monthly to record biocide levels and bacteria tests. Another biocide test method, the Biotrace ATP Luminometer, measures planktonic (floating) bacteria. This process uses light transmittance tech-nology to quantify general microbial activity, and it provides a reading ex-pressed as RLUs (Relative Light Units) that have been correlated to bacte-ria colony-forming units. There is also a second ATP test for sessile bacteria (surface bacteria that may attach to metal surfaces, such as the sides of cooling towers and heat exchangers). One significant advantage of this method is the instantaneous result, which allows adjustment in the biocide application while at the job site. Always keep in mind the difficulty of obtaining a representative sample when evaluating bacteria tests.
Table 5. Spreadsheet for recording bacteria and biocide levels.
Bacteria Test Log Building Number: Tower Number:
Date
ATP Planktonic
Dip Slide Aerobic
Dip Tube Anaerobic
3004 Tetrakis Residual (ppm)
Chlorine Residual (ppm)
Sept. 2005
Oct. 2005
Nov. 2005
Dec. 2005
Jan. 2006
Feb. 2006
Mar. 2006
Apr. 2006
May 2006
June 2006
July 2006
Aug.2006
ERDC/CERL TR-07-20 23
Effect of cycles of concentration on cooling tower operation
A cooling tower evaporates water to cool condenser water or process wa-ter. As a general solubility rule, cooler water will have less of a tendency to develop deposits. A typical cooling tower is designed to lower the supply water going to the condensers to a maximum of 85 °F. If the tower water is above this temperature, pump screens should be checked to make sure that flow is not restricted. The condenser water temperature is increased as it exchanges heat from the chill water or manufacturing process, and it then returns to the cooling tower to again be cooled.
One way to see how evaporation affects cycles is the following exercise. Take an open 10-gallon bucket of water and place it in the hot sun. Evapo-ration will gradually cause the water will disappear. When there are 5 gal-lons left in the bucket, this is the equivalent of two cycles of concentration because the minerals are twice as concentrated in the 5 gallons as they were in 10 gallons. If evaporation continued to remove an additional 2.5 gallons, the minerals would be four times as concentrated.
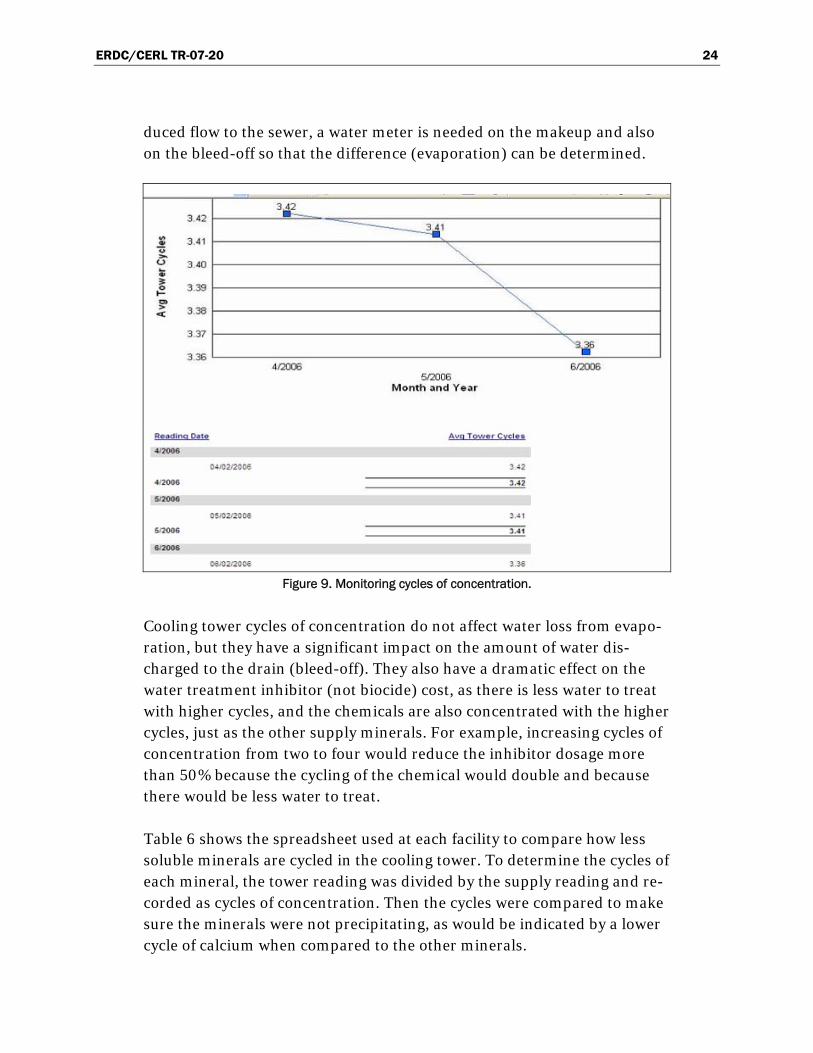
To calculate cycles of concentration, divide the 10 gallons originally in the bucket by the remaining 2.5 gallons. In this case, this would represent four cycles of concentration. To prevent minerals from exceeding solubility lim-its and precipitating, it is necessary to bleed off some of the concentrated mineral water and then make up the loss with fresh supply water that has fewer minerals. Unless this is properly done, deposition will occur, in-creasing energy consumption and potentially shutting the system down. Figure 9 shows a management tool to monitor cycles of concentration.
Understanding evaporation in the cooling process is important for pre-venting excessive discharge water cost. Typical water cost $1.50 per thou-sand gallons for supply to the facility, but it costs an additional $2.50 per thousand gallons for discharge returning to the treatment plant. (Make sure the facility is not paying the discharge cost for the total cooling tower water make-up.) In the example in Figure 9, 10 gallons out of every 13.3 gallons supplied to the tower evaporates to the atmosphere in the cooling process. Instead of a daily water cost of $76.61 ($4.00 per thousand gal-lons × 19,152 gallons per day), the discharge cost should be reduced to pay only for the 3.3 gpm bleed-off (4,752 gallons per day) instead of the total 19,152 gallons. The $2.50 discharge cost on 14,400 gallons per day (19,152 – 4,752) would be a daily savings of $36.00 per day. To document this re-
ERDC/CERL TR-07-20 24
duced flow to the sewer, a water meter is needed on the makeup and also on the bleed-off so that the difference (evaporation) can be determined.
Figure 9. Monitoring cycles of concentration.
Cooling tower cycles of concentration do not affect water loss from evapo-ration, but they have a significant impact on the amount of water dis-charged to the drain (bleed-off). They also have a dramatic effect on the water treatment inhibitor (not biocide) cost, as there is less water to treat with higher cycles, and the chemicals are also concentrated with the higher cycles, just as the other supply minerals. For example, increasing cycles of concentration from two to four would reduce the inhibitor dosage more than 50% because the cycling of the chemical would double and because there would be less water to treat.
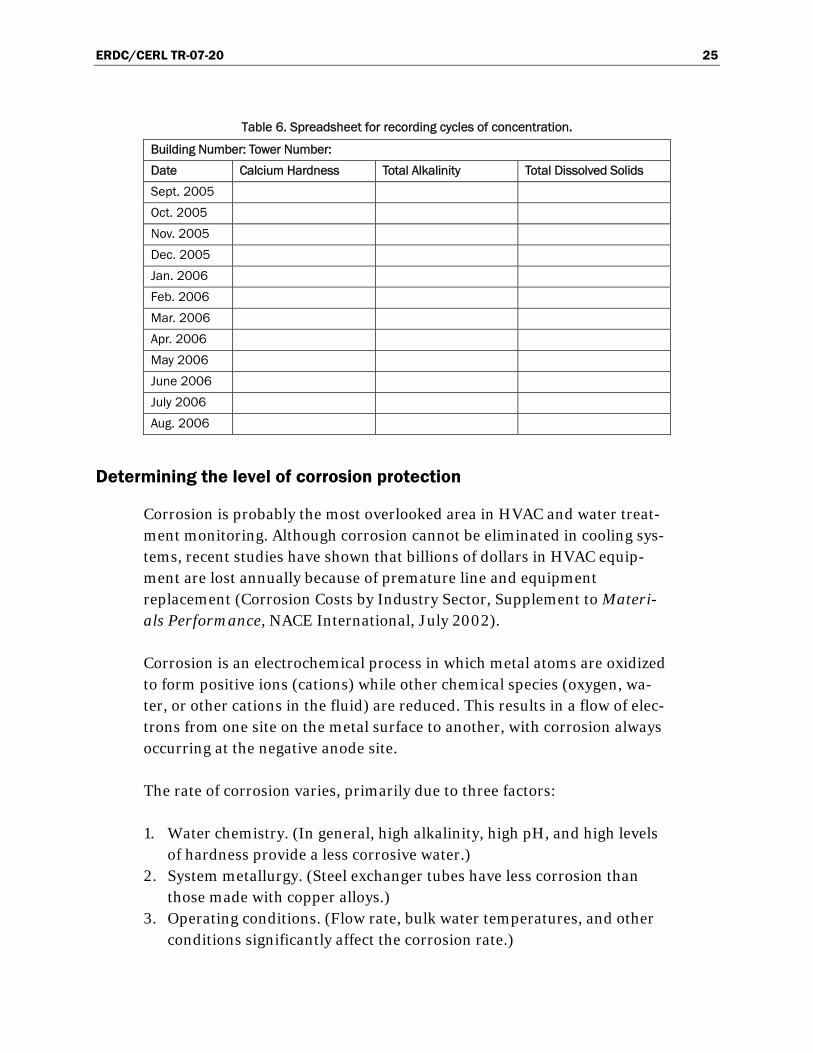
Table 6 shows the spreadsheet used at each facility to compare how less soluble minerals are cycled in the cooling tower. To determine the cycles of each mineral, the tower reading was divided by the supply reading and re-corded as cycles of concentration. Then the cycles were compared to make sure the minerals were not precipitating, as would be indicated by a lower cycle of calcium when compared to the other minerals.
ERDC/CERL TR-07-20 25
Table 6. Spreadsheet for recording cycles of concentration.
Building Number: Tower Number:
Date Calcium Hardness Total Alkalinity Total Dissolved Solids
Sept. 2005
Oct. 2005
Nov. 2005
Dec. 2005
Jan. 2006
Feb. 2006
Mar. 2006
Apr. 2006
May 2006
June 2006
July 2006
Aug. 2006
Determining the level of corrosion protection
Corrosion is probably the most overlooked area in HVAC and water treat-ment monitoring. Although corrosion cannot be eliminated in cooling sys-tems, recent studies have shown that billions of dollars in HVAC equip-ment are lost annually because of premature line and equipment replacement (Corrosion Costs by Industry Sector, Supplement to Materi-als Performance, NACE International, July 2002).
Corrosion is an electrochemical process in which metal atoms are oxidized to form positive ions (cations) while other chemical species (oxygen, wa-ter, or other cations in the fluid) are reduced. This results in a flow of elec-trons from one site on the metal surface to another, with corrosion always occurring at the negative anode site.
The rate of corrosion varies, primarily due to three factors:
1. Water chemistry. (In general, high alkalinity, high pH, and high levels of hardness provide a less corrosive water.)
2. System metallurgy. (Steel exchanger tubes have less corrosion than those made with copper alloys.)
3. Operating conditions. (Flow rate, bulk water temperatures, and other conditions significantly affect the corrosion rate.)
ERDC/CERL TR-07-20 26
NACE International has established acceptable levels of corrosion protec-tion, which varies with different metals. Table 7 lists the NACE Interna-tional guidelines, based on system metallurgy and corrosion rate in mils per year (mpy).
Table 7. Standard corrosion control guidelines (with oxidizing biocides).
Metal Good control Excellent control Out of control
Mild Steel <5.0 mpy <3.0 mpy >6.0 mpy
Copper <0.4 mpy <0.2 mpy >0.6 mpy
304 S. Steel <1.0 mpy <0.5 mpy >2.0 mpy
Aluminum <0.8 mpy <0.4 mpy >1.5 mpy
Galvanized <3.0 mpy <1.5 mpy >4.0 mpy
Corrosion coupons were used to evaluate corrosion rates. Coupons are narrow strips of various metals that are pre-weighed and put in specifically designed flow conditions for a specific number of days. At the end of the evaluation period, the coupons are removed and again weighed, with the weight loss and the number of days (typically 30 to 60 days) in the system used to calculate the corrosion rate in mils per year. NACE standards are referenced in the report.
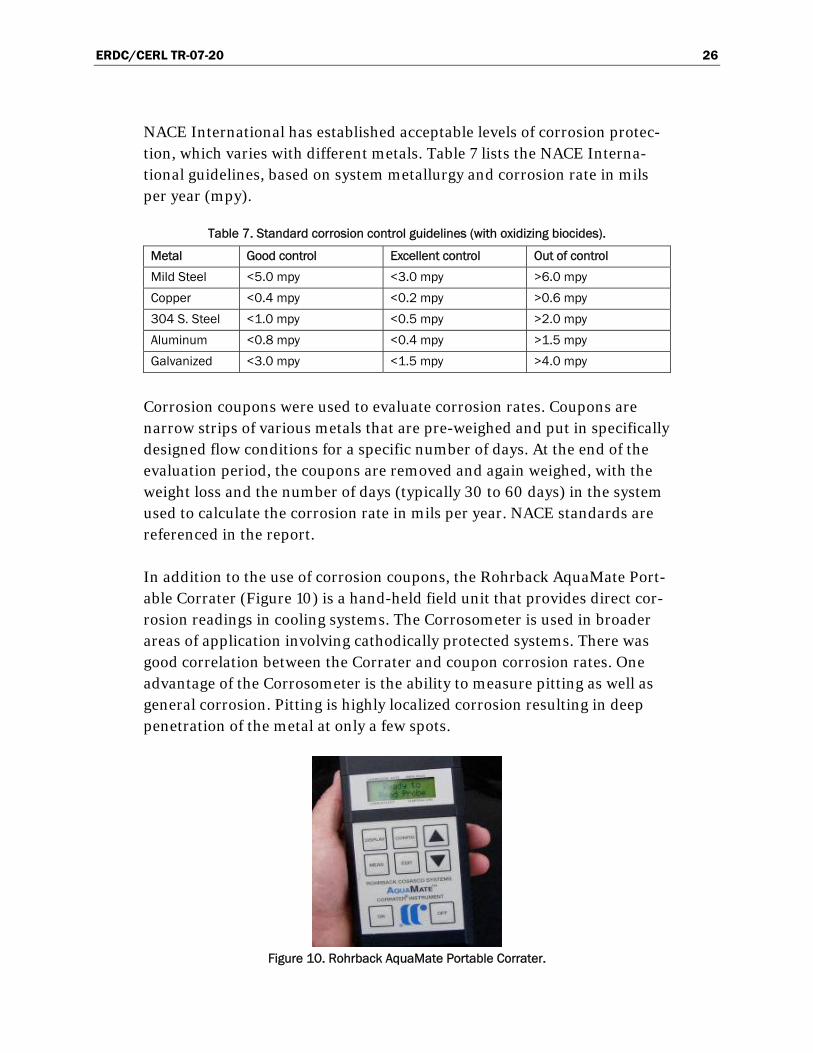
In addition to the use of corrosion coupons, the Rohrback AquaMate Port-able Corrater (Figure 10) is a hand-held field unit that provides direct cor-rosion readings in cooling systems. The Corrosometer is used in broader areas of application involving cathodically protected systems. There was good correlation between the Corrater and coupon corrosion rates. One advantage of the Corrosometer is the ability to measure pitting as well as general corrosion. Pitting is highly localized corrosion resulting in deep penetration of the metal at only a few spots.
Figure 10. Rohrback AquaMate Portable Corrater.
ERDC/CERL TR-07-20 27
The internal inspection of steam or hot water boilers is important in moni-toring corrosion. In many ways, corrosion is more damaging than scale, as scale can be removed. Once metal is lost, it can only be replaced.
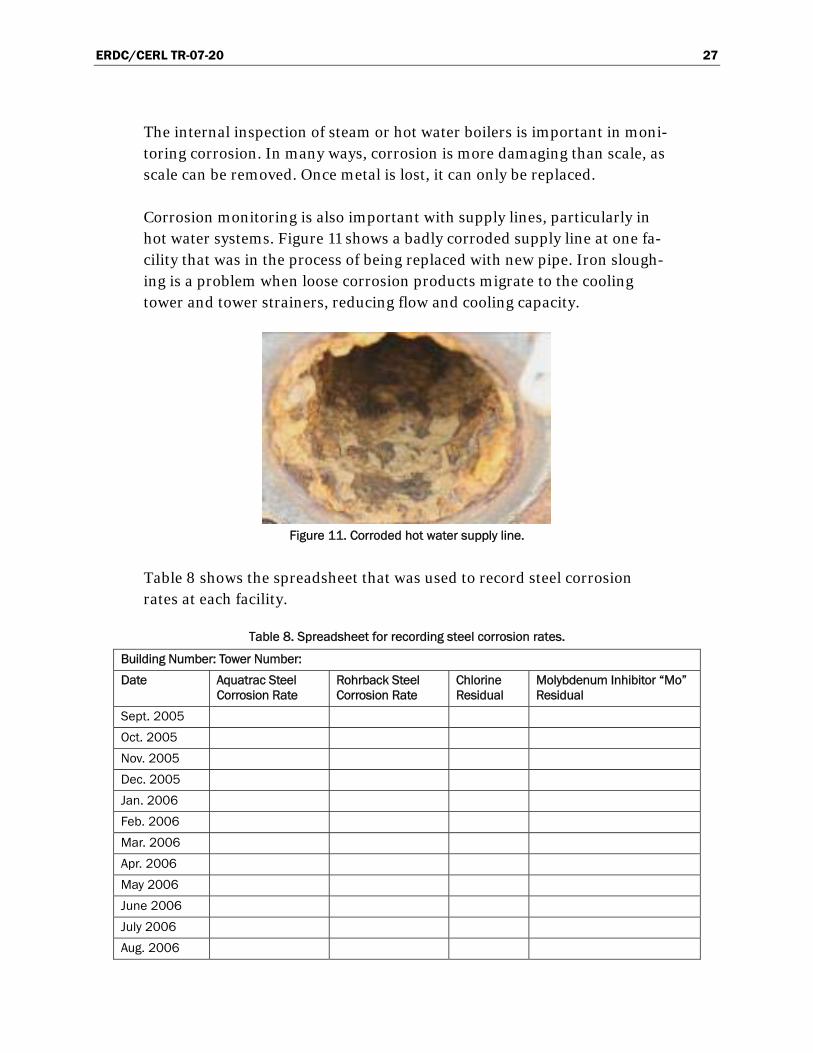
Corrosion monitoring is also important with supply lines, particularly in hot water systems. Figure 11 shows a badly corroded supply line at one fa-cility that was in the process of being replaced with new pipe. Iron slough-ing is a problem when loose corrosion products migrate to the cooling tower and tower strainers, reducing flow and cooling capacity.
Figure 11. Corroded hot water supply line.
Table 8 shows the spreadsheet that was used to record steel corrosion rates at each facility.
Table 8. Spreadsheet for recording steel corrosion rates.
Building Number: Tower Number:
Date Aquatrac Steel Corrosion Rate
Rohrback Steel Corrosion Rate
Chlorine Residual
Molybdenum Inhibitor “Mo” Residual
Sept. 2005
Oct. 2005
Nov. 2005
Dec. 2005
Jan. 2006
Feb. 2006
Mar. 2006
Apr. 2006
May 2006
June 2006
July 2006
Aug. 2006
ERDC/CERL TR-07-20 28
When an oxidizing biocide such as chlorine is applied, a protective film on any copper alloy metal surface must be established and maintained for copper corrosion protection. This water treatment chemical is of the azole family and may be mercaptobenzyltriazole, tolytriazole, or benzyltriazole.
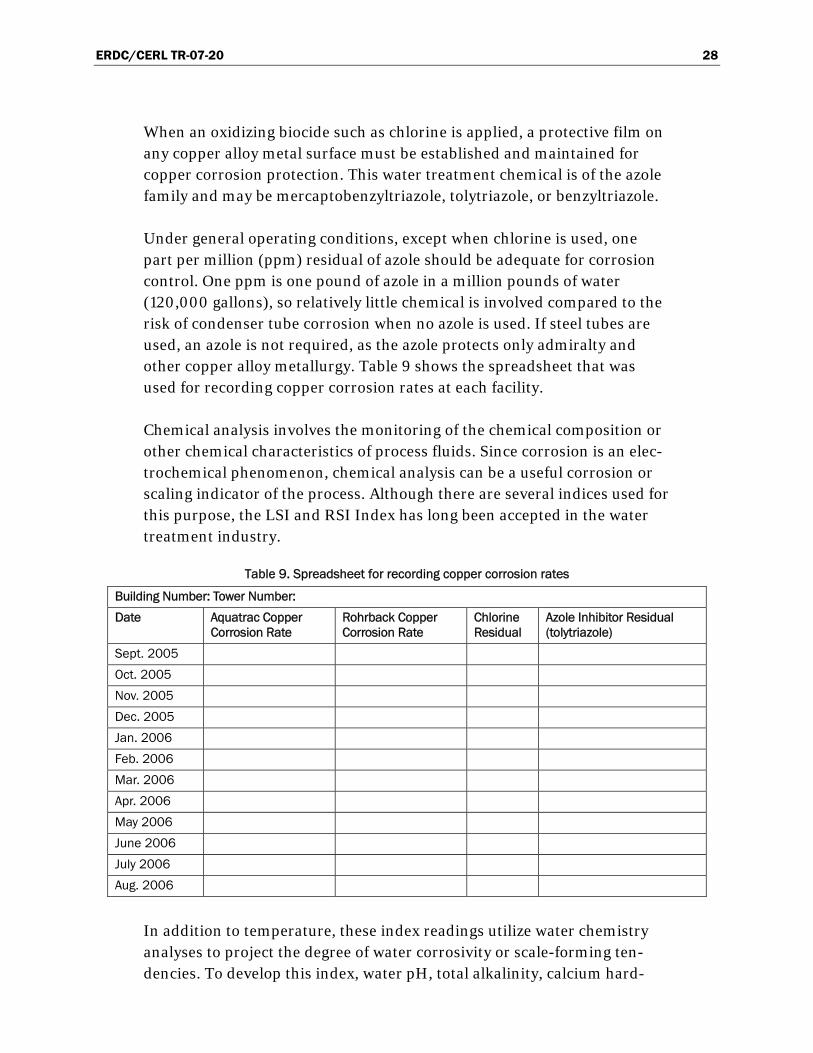
Under general operating conditions, except when chlorine is used, one part per million (ppm) residual of azole should be adequate for corrosion control. One ppm is one pound of azole in a million pounds of water (120,000 gallons), so relatively little chemical is involved compared to the risk of condenser tube corrosion when no azole is used. If steel tubes are used, an azole is not required, as the azole protects only admiralty and other copper alloy metallurgy. Table 9 shows the spreadsheet that was used for recording copper corrosion rates at each facility.
Chemical analysis involves the monitoring of the chemical composition or other chemical characteristics of process fluids. Since corrosion is an elec-trochemical phenomenon, chemical analysis can be a useful corrosion or scaling indicator of the process. Although there are several indices used for this purpose, the LSI and RSI Index has long been accepted in the water treatment industry.
Table 9. Spreadsheet for recording copper corrosion rates
Building Number: Tower Number:
Date Aquatrac Copper Corrosion Rate
Rohrback Copper Corrosion Rate
Chlorine Residual
Azole Inhibitor Residual (tolytriazole)
Sept. 2005
Oct. 2005
Nov. 2005
Dec. 2005
Jan. 2006
Feb. 2006
Mar. 2006
Apr. 2006
May 2006
June 2006
July 2006
Aug. 2006
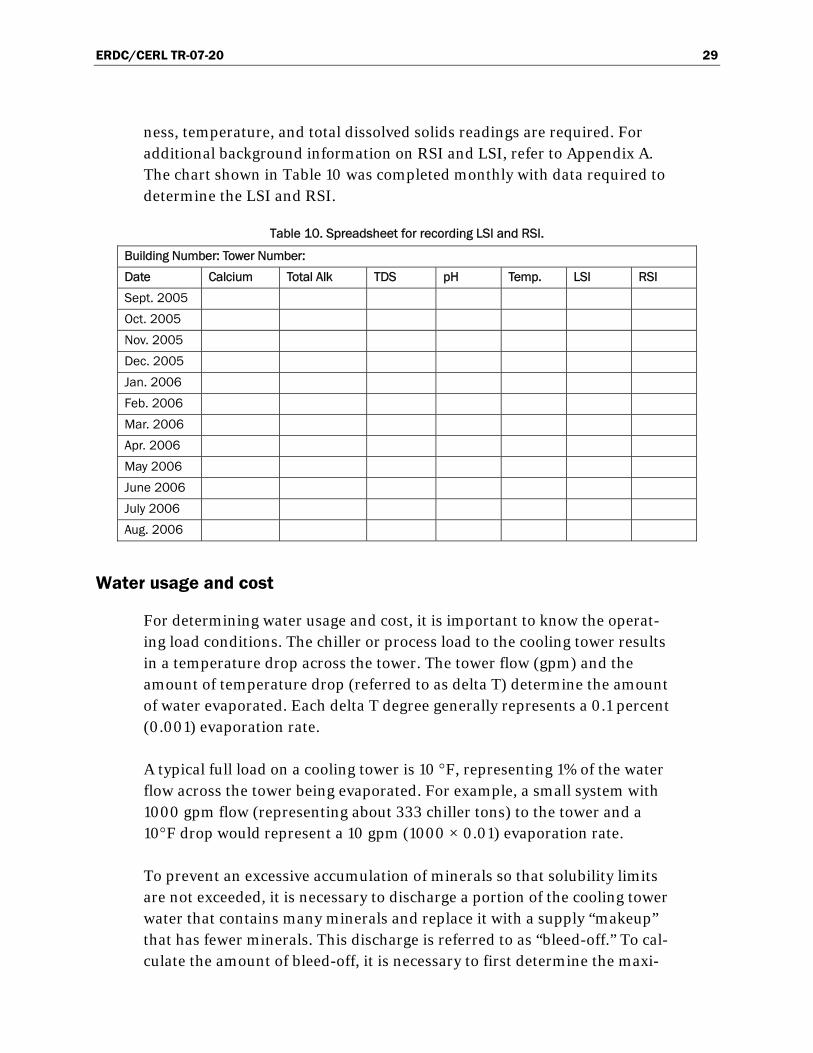
In addition to temperature, these index readings utilize water chemistry analyses to project the degree of water corrosivity or scale-forming ten-dencies. To develop this index, water pH, total alkalinity, calcium hard-
ERDC/CERL TR-07-20 29
ness, temperature, and total dissolved solids readings are required. For additional background information on RSI and LSI, refer to Appendix A. The chart shown in Table 10 was completed monthly with data required to determine the LSI and RSI.
Table 10. Spreadsheet for recording LSI and RSI.
Building Number: Tower Number:
Date Calcium Total Alk TDS pH Temp. LSI RSI
Sept. 2005
Oct. 2005
Nov. 2005
Dec. 2005
Jan. 2006
Feb. 2006
Mar. 2006
Apr. 2006
May 2006
June 2006
July 2006
Aug. 2006
Water usage and cost
For determining water usage and cost, it is important to know the operat-ing load conditions. The chiller or process load to the cooling tower results in a temperature drop across the tower. The tower flow (gpm) and the amount of temperature drop (referred to as delta T) determine the amount of water evaporated. Each delta T degree generally represents a 0.1 percent (0.001) evaporation rate.
A typical full load on a cooling tower is 10 °F, representing 1% of the water flow across the tower being evaporated. For example, a small system with 1000 gpm flow (representing about 333 chiller tons) to the tower and a 10°F drop would represent a 10 gpm (1000 × 0.01) evaporation rate.
To prevent an excessive accumulation of minerals so that solubility limits are not exceeded, it is necessary to discharge a portion of the cooling tower water that contains many minerals and replace it with a supply “makeup” that has fewer minerals. This discharge is referred to as “bleed-off.” To cal-culate the amount of bleed-off, it is necessary to first determine the maxi-
ERDC/CERL TR-07-20 30
mum allowable cycles of concentration. Then, multiply the amount of evaporation by the factor 1/(cycles –1). For example, if four cycles of con-centration were recommended, the 10-gpm evaporation × 1/3, or 3.3 gpm, represents the quantity and rate of bleed-off.
The sum of the evaporation and bleed-off is the amount of water that must be supplied to the cooling tower, in this case 13.3 gpm. This may not seem like much on a gallon per minute basis, but don’t forget there are 1,440 minutes in one day. In this case, a small, 333-ton chiller operating at a full 10 °F delta T would use 19,152 gallons per day.
Monthly reporting and evaluation process
With the operation of HVAC systems, a significant amount of technical data is developed. These data are needed to address quality control issues and to analyze water and energy consumption. It is important to have data in a format that makes them easy to use the information so that day-to-day operations can be improved.
HVAC issues are complex, whether at manufacturing plants or at facilities that provide only comfort heating and cooling. Water treatment monitor-ing and mechanical activities in the operation of steam boilers and chillers directly impact areas of energy management, water conservation, envi-ronmental concerns, and operating efficiencies that significantly impact utility cost.
Without good water treatment and operating data, operating and man-agement decisions cannot be effective. Implementing a maintenance pro-gram and operating environment to make sure equipment reaches its ex-pected life cycle, and with an efficient operation, is an ongoing challenge. Automation will reduce certain labor requirements and assist in the sys-tem efficiencies, but automation alone does not replace fundamental re-quirements for system monitoring or preventive maintenance. Nor does the automation replace the human element required to interpret data that detects changes in operating efficiency, and the commitment to prioritize daily work orders that will help minimize operating costs. Many facilities utilize outside consultants to assist in this process, but their work must be monitored. Good decisions require good operating data.
Developing benchmark operating data and comparing it to equipment de-sign is important. The HVAC survey will provide cooling and heating ca-
ERDC/CERL TR-07-20 31
pacity and can accept design operating kilowatt hour and gas cost data. As equipment design data and operating data usually differ, it is necessary to develop operating data to know if design efficiency is being obtained.
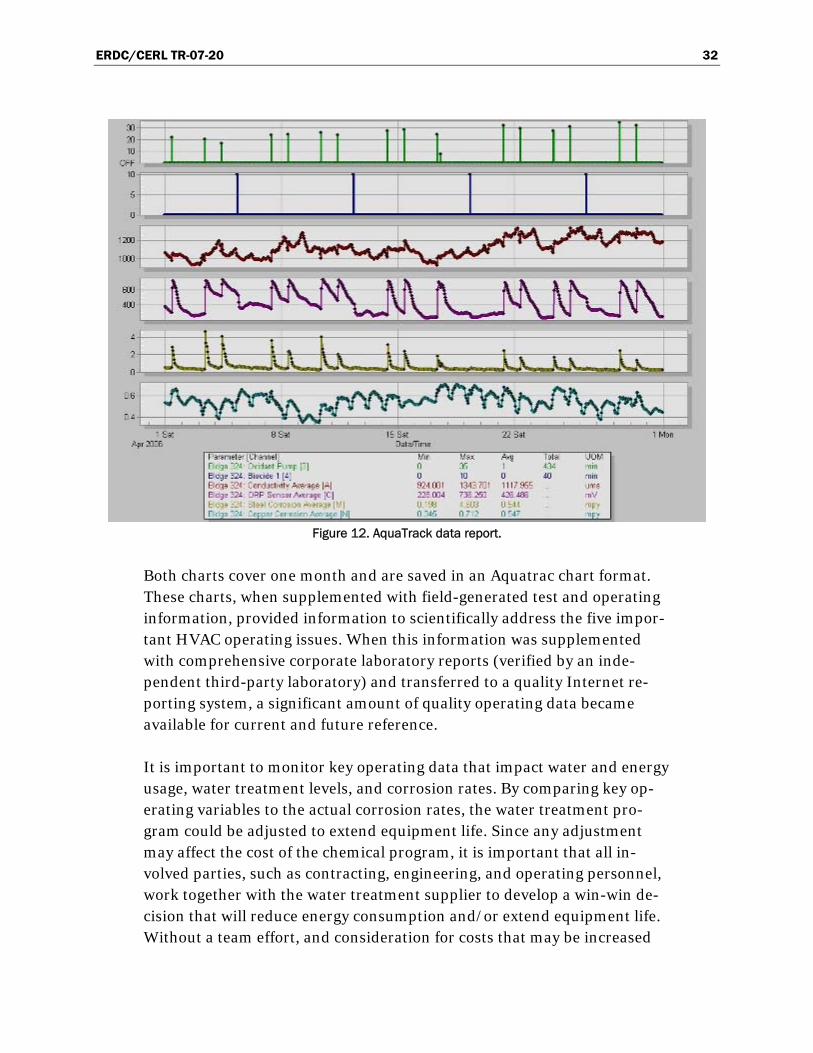
Support information will include a copy of all laboratory reports and field tests/charts provided by service representatives. There were two Aquatrac Trackster software charts downloaded from the Aquatrac Controller charts monthly for each cooling tower. The first chart (Figure 12) includes the fol-lowing variables:
1. ORP sensor average 2. oxidant 3. 3004 biocide 4. conductivity 5. average copper corrosion rate 6. average steel corrosion rate.
The second chart routinely evaluated contained the following variables:
1. average copper corrosion rate 2. maximum copper corrosion rate 3. average steel corrosion rate 4. maximum steel corrosion rate.
ERDC/CERL TR-07-20 32
Figure 12. AquaTrack data report.
Both charts cover one month and are saved in an Aquatrac chart format. These charts, when supplemented with field-generated test and operating information, provided information to scientifically address the five impor-tant HVAC operating issues. When this information was supplemented with comprehensive corporate laboratory reports (verified by an inde-pendent third-party laboratory) and transferred to a quality Internet re-porting system, a significant amount of quality operating data became available for current and future reference.
It is important to monitor key operating data that impact water and energy usage, water treatment levels, and corrosion rates. By comparing key op-erating variables to the actual corrosion rates, the water treatment pro-gram could be adjusted to extend equipment life. Since any adjustment may affect the cost of the chemical program, it is important that all in-volved parties, such as contracting, engineering, and operating personnel, work together with the water treatment supplier to develop a win-win de-cision that will reduce energy consumption and/or extend equipment life. Without a team effort, and consideration for costs that may be increased
ERDC/CERL TR-07-20 33
with newer chemical technology, it is questionable as to whether these ad-justments would be made.
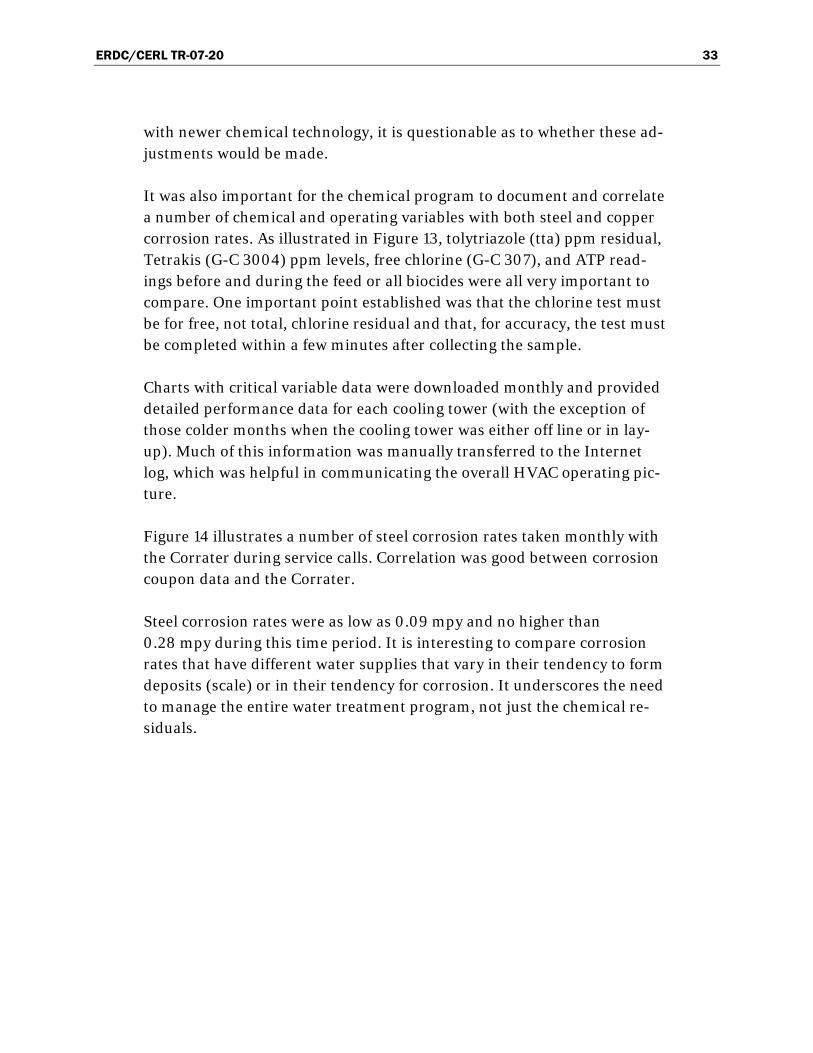
It was also important for the chemical program to document and correlate a number of chemical and operating variables with both steel and copper corrosion rates. As illustrated in Figure 13, tolytriazole (tta) ppm residual, Tetrakis (G-C 3004) ppm levels, free chlorine (G-C 307), and ATP read-ings before and during the feed or all biocides were all very important to compare. One important point established was that the chlorine test must be for free, not total, chlorine residual and that, for accuracy, the test must be completed within a few minutes after collecting the sample.
Charts with critical variable data were downloaded monthly and provided detailed performance data for each cooling tower (with the exception of those colder months when the cooling tower was either off line or in lay-up). Much of this information was manually transferred to the Internet log, which was helpful in communicating the overall HVAC operating pic-ture.
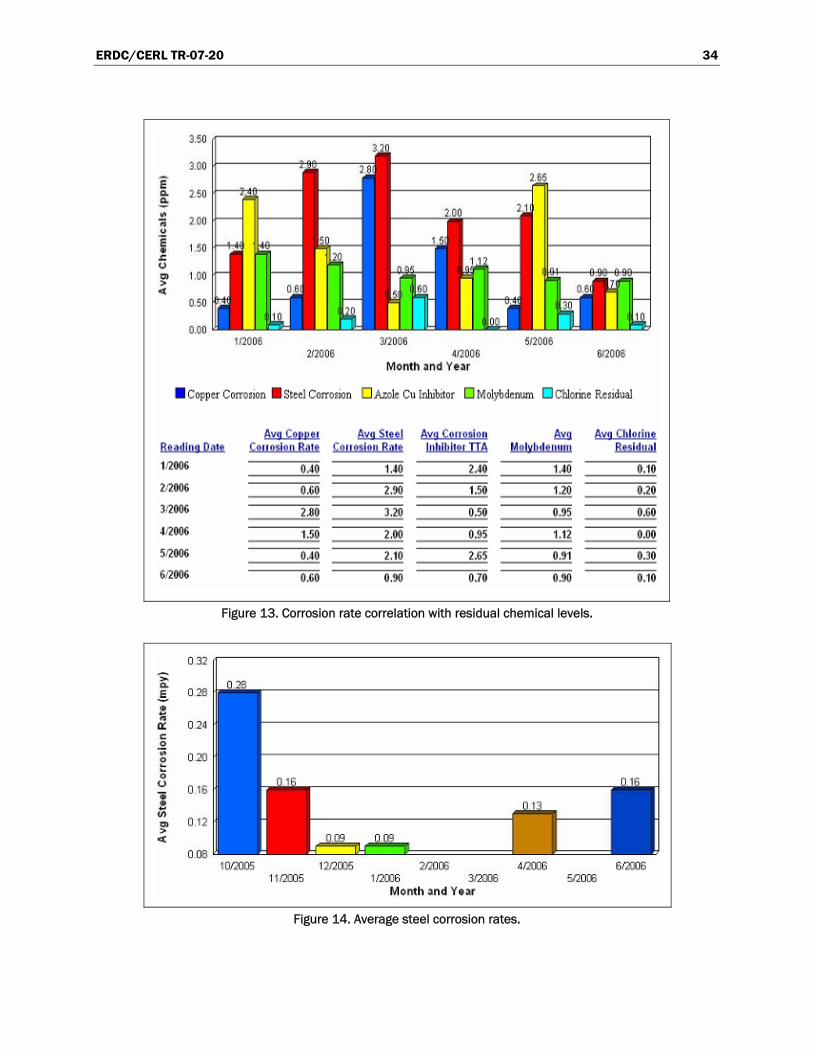
Figure 14 illustrates a number of steel corrosion rates taken monthly with the Corrater during service calls. Correlation was good between corrosion coupon data and the Corrater.
Steel corrosion rates were as low as 0.09 mpy and no higher than 0.28 mpy during this time period. It is interesting to compare corrosion rates that have different water supplies that vary in their tendency to form deposits (scale) or in their tendency for corrosion. It underscores the need to manage the entire water treatment program, not just the chemical re-siduals.
ERDC/CERL TR-07-20 34
Figure 13. Corrosion rate correlation with residual chemical levels.
Figure 14. Average steel corrosion rates.
ERDC/CERL TR-07-20 35
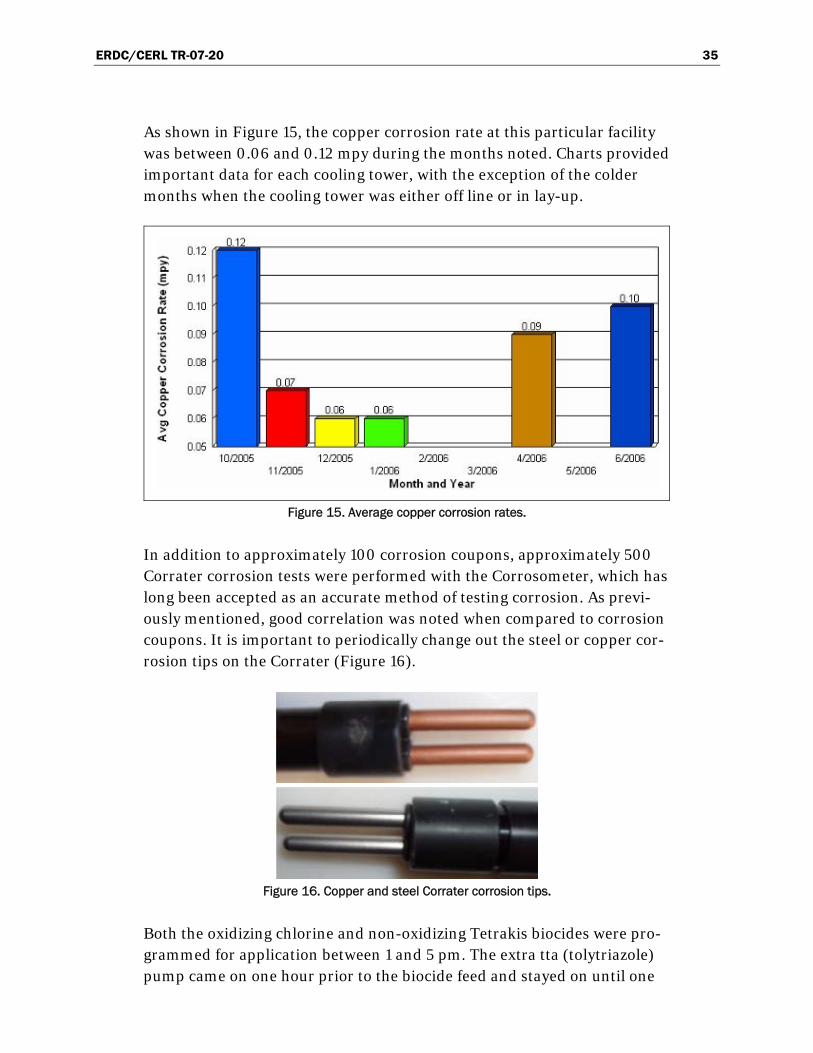
As shown in Figure 15, the copper corrosion rate at this particular facility was between 0.06 and 0.12 mpy during the months noted. Charts provided important data for each cooling tower, with the exception of the colder months when the cooling tower was either off line or in lay-up.
Figure 15. Average copper corrosion rates.
In addition to approximately 100 corrosion coupons, approximately 500 Corrater corrosion tests were performed with the Corrosometer, which has long been accepted as an accurate method of testing corrosion. As previ-ously mentioned, good correlation was noted when compared to corrosion coupons. It is important to periodically change out the steel or copper cor-rosion tips on the Corrater (Figure 16).
Figure 16. Copper and steel Corrater corrosion tips.
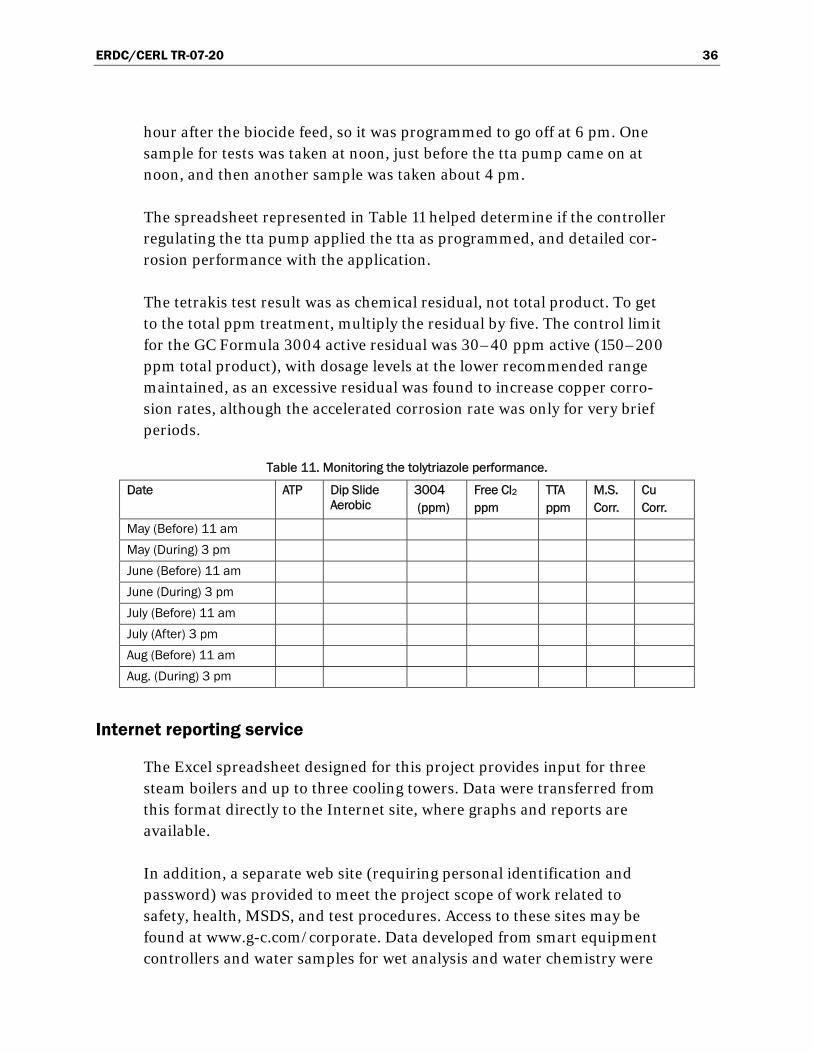
Both the oxidizing chlorine and non-oxidizing Tetrakis biocides were pro-grammed for application between 1 and 5 pm. The extra tta (tolytriazole) pump came on one hour prior to the biocide feed and stayed on until one
ERDC/CERL TR-07-20 36
hour after the biocide feed, so it was programmed to go off at 6 pm. One sample for tests was taken at noon, just before the tta pump came on at noon, and then another sample was taken about 4 pm.
The spreadsheet represented in Table 11 helped determine if the controller regulating the tta pump applied the tta as programmed, and detailed cor-rosion performance with the application.
The tetrakis test result was as chemical residual, not total product. To get to the total ppm treatment, multiply the residual by five. The control limit for the GC Formula 3004 active residual was 30–40 ppm active (150–200 ppm total product), with dosage levels at the lower recommended range maintained, as an excessive residual was found to increase copper corro-sion rates, although the accelerated corrosion rate was only for very brief periods.
Table 11. Monitoring the tolytriazole performance.
Date ATP Dip Slide Aerobic
3004 (ppm)
Free Cl2
ppm TTA ppm
M.S. Corr.
Cu Corr.
May (Before) 11 am
May (During) 3 pm
June (Before) 11 am
June (During) 3 pm
July (Before) 11 am
July (After) 3 pm
Aug (Before) 11 am
Aug. (During) 3 pm
Internet reporting service
The Excel spreadsheet designed for this project provides input for three steam boilers and up to three cooling towers. Data were transferred from this format directly to the Internet site, where graphs and reports are available.
In addition, a separate web site (requiring personal identification and password) was provided to meet the project scope of work related to safety, health, MSDS, and test procedures. Access to these sites may be found at www.g-c.com/corporate. Data developed from smart equipment controllers and water samples for wet analysis and water chemistry were
ERDC/CERL TR-07-20 37
provided monthly to the contractor-certified laboratory for analysis. For the most part, there was repeatable correlation between the dip slide tests and the ATP tests, although it is important to remember that any biologi-cal sample has limitations when attempting to represent the overall condi-tion of the cooling system. Visual inspections of the cooling tower and documentation of equipment inspections are important in evaluating per-formance.
One advantage of the ATP method is that the test can be completed within minutes of sampling, allowing on-site chemical adjustment during the ser-vice call. Also, when evaluating tuberculation or pitting corrosion, if the ATP level is low within the pitted area, it is likely that the corrosion is of galvanic nature, as compared to microbial-induced corrosion (MIC).
Data collection
The data developed with this project was provided via the Internet to all interested government agencies. Direct Internet access also provided safety- and health-related information, as required in the scope of work. In addition to the contractor’s work, there was an independent third-party verification of data by the Illinois State Water Survey, with return on in-vestment (ROI) documentation from the SurTech Corporation.
Two facilities had steam boilers, but as steam was used for direct humidifi-cation at one site, only one site used the green steam line filming treat-ment. Although the filming process provides oxygen corrosion protection that is not present with neutralizing amines, which react with carbon diox-ide, there are a number of technical issues to be aware of:
1. Filming amines have very low volatility and are too heavy to make ver-tical risers, so they must be injected into the horizontal steam header and are best applied in long horizontal piping runs.
2. Filming amines are good lubricants and can turn loose anything, such as iron corrosion products, that may be in the old condensate piping. Also, if overfed, they can plug up steam traps. This is especially true with the startup cleaning process, so the application dosage should be initially reduced to maintain steam quality, particularly with new sys-tems.
3. Filming amines, particularly if present in the boiler, may cause carry-over, so it is important to check condensate conductivity right after the
ERDC/CERL TR-07-20 38
boiler. Normally, an antifoaming agent is added when a filming amine is applied, so there is a potential additional chemical cost.
4. If there are vertical risers, multiple injection points may be required, with chemical pumps after each riser.
5. With these issues, and the fact that filming amines are difficult to test, their use is best applied with short and/or horizontal steam lines.
For steam boilers, an Excel spreadsheet was developed to log data from the field. This format was used at all facilities, but, because the quantity of data exceeding Excel program capability, the data were transferred to the Internet for all CERL and facility personnel on a “need-to-know” basis. The system was highly secured with user ID and passwords, and an indi-vidual web site was provided to address health and safety issues for each facility, with access approval from the ERDC-CERL technical POC.
The Internet reporting system has much broader reporting capability than was used with this project. This project basically used water treatment tests, corrosion data, and graphs. The program also has programs to man-age many phases of a power plant operation, including waste treatment, air quality, and project energy usage and cost. Figure 17 shows the steam boiler data included to track the steam boiler chemical application.
Because of Internet programming requirements, the steam boiler tests were segmented for pretreatment and for the boiler internal treatment. Figure 18 shows the cooling tower data input screen.
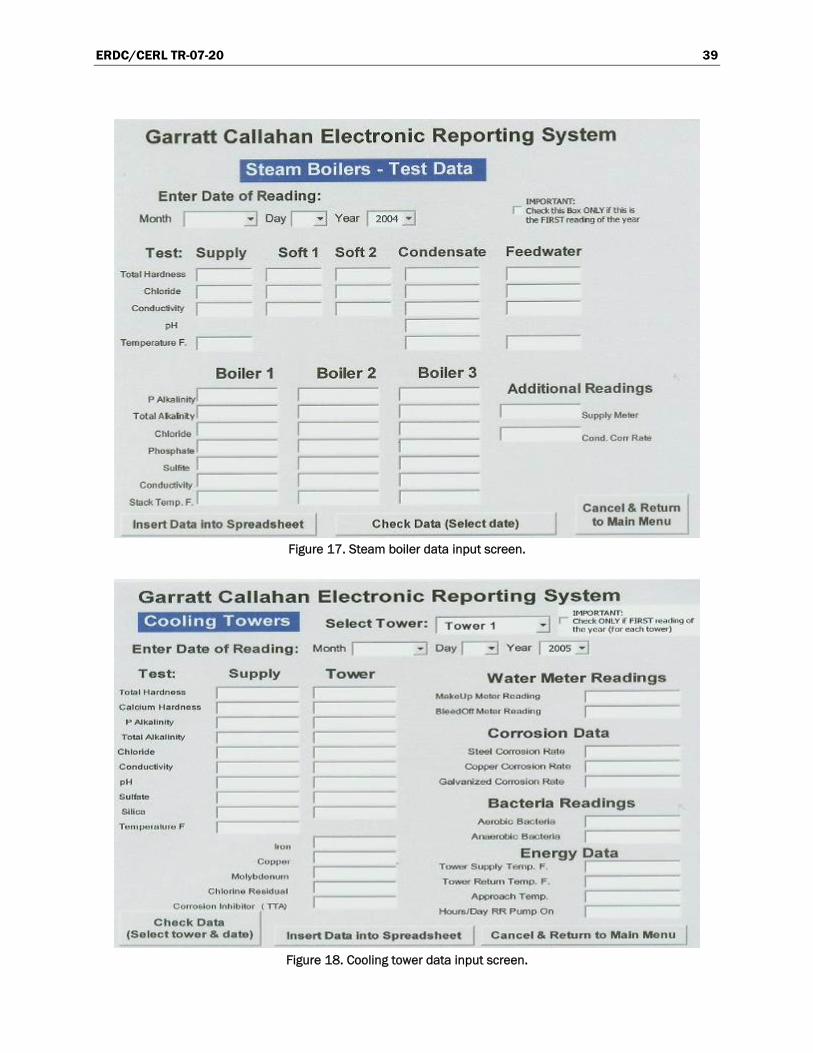
ERDC/CERL TR-07-20 39
Figure 17. Steam boiler data input screen.
Figure 18. Cooling tower data input screen.
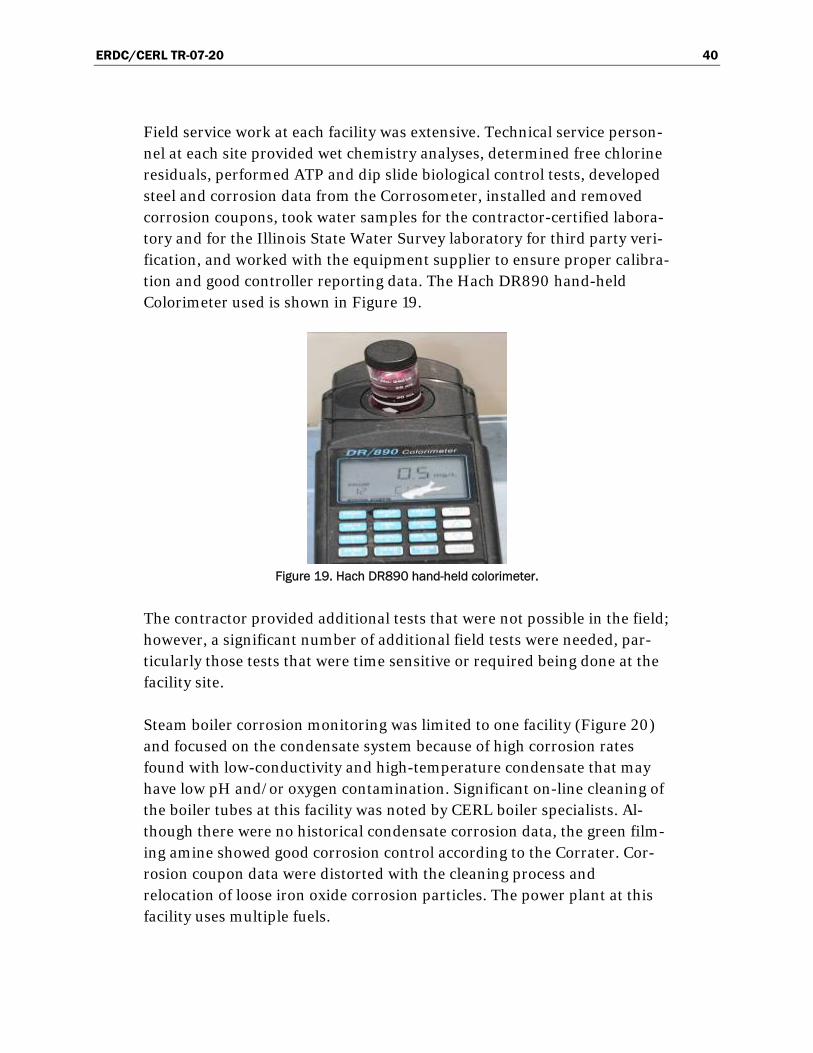
ERDC/CERL TR-07-20 40
Field service work at each facility was extensive. Technical service person-nel at each site provided wet chemistry analyses, determined free chlorine residuals, performed ATP and dip slide biological control tests, developed steel and corrosion data from the Corrosometer, installed and removed corrosion coupons, took water samples for the contractor-certified labora-tory and for the Illinois State Water Survey laboratory for third party veri-fication, and worked with the equipment supplier to ensure proper calibra-tion and good controller reporting data. The Hach DR890 hand-held Colorimeter used is shown in Figure 19.
Figure 19. Hach DR890 hand-held colorimeter.
The contractor provided additional tests that were not possible in the field; however, a significant number of additional field tests were needed, par-ticularly those tests that were time sensitive or required being done at the facility site.
Steam boiler corrosion monitoring was limited to one facility (Figure 20) and focused on the condensate system because of high corrosion rates found with low-conductivity and high-temperature condensate that may have low pH and/or oxygen contamination. Significant on-line cleaning of the boiler tubes at this facility was noted by CERL boiler specialists. Al-though there were no historical condensate corrosion data, the green film-ing amine showed good corrosion control according to the Corrater. Cor-rosion coupon data were distorted with the cleaning process and relocation of loose iron oxide corrosion particles. The power plant at this facility uses multiple fuels.
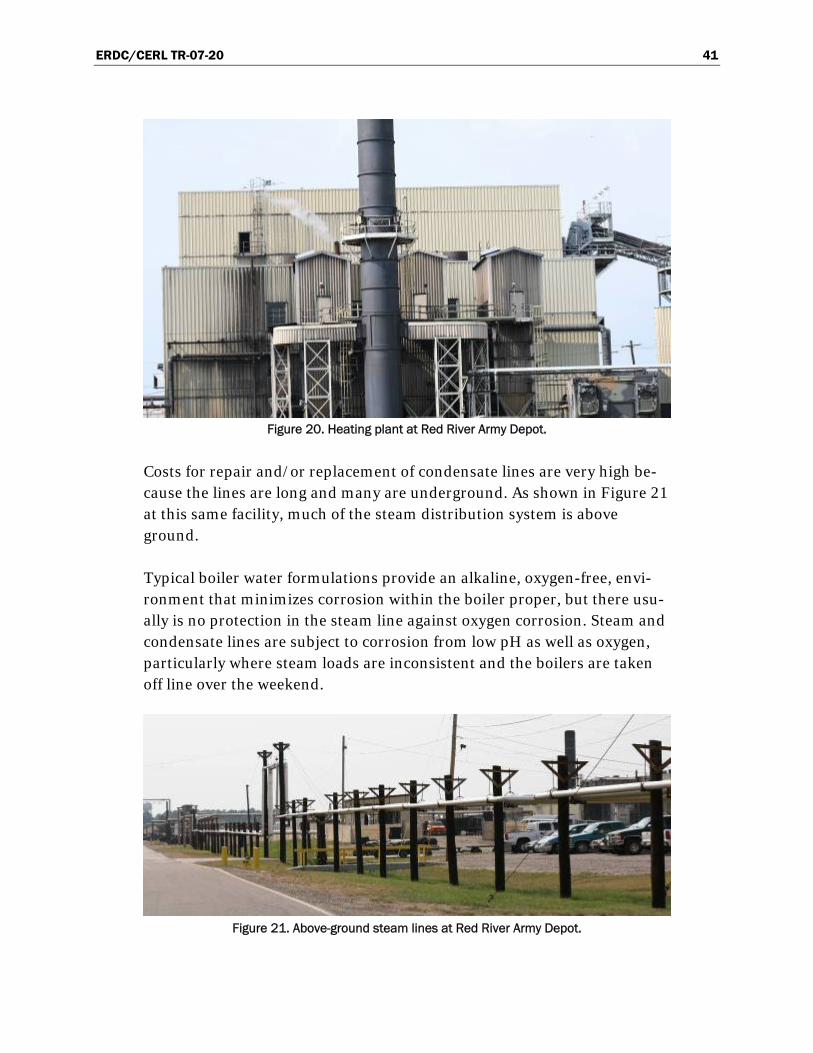
ERDC/CERL TR-07-20 41
Figure 20. Heating plant at Red River Army Depot.
Costs for repair and/or replacement of condensate lines are very high be-cause the lines are long and many are underground. As shown in Figure 21 at this same facility, much of the steam distribution system is above ground.
Typical boiler water formulations provide an alkaline, oxygen-free, envi-ronment that minimizes corrosion within the boiler proper, but there usu-ally is no protection in the steam line against oxygen corrosion. Steam and condensate lines are subject to corrosion from low pH as well as oxygen, particularly where steam loads are inconsistent and the boilers are taken off line over the weekend.
Figure 21. Above-ground steam lines at Red River Army Depot.
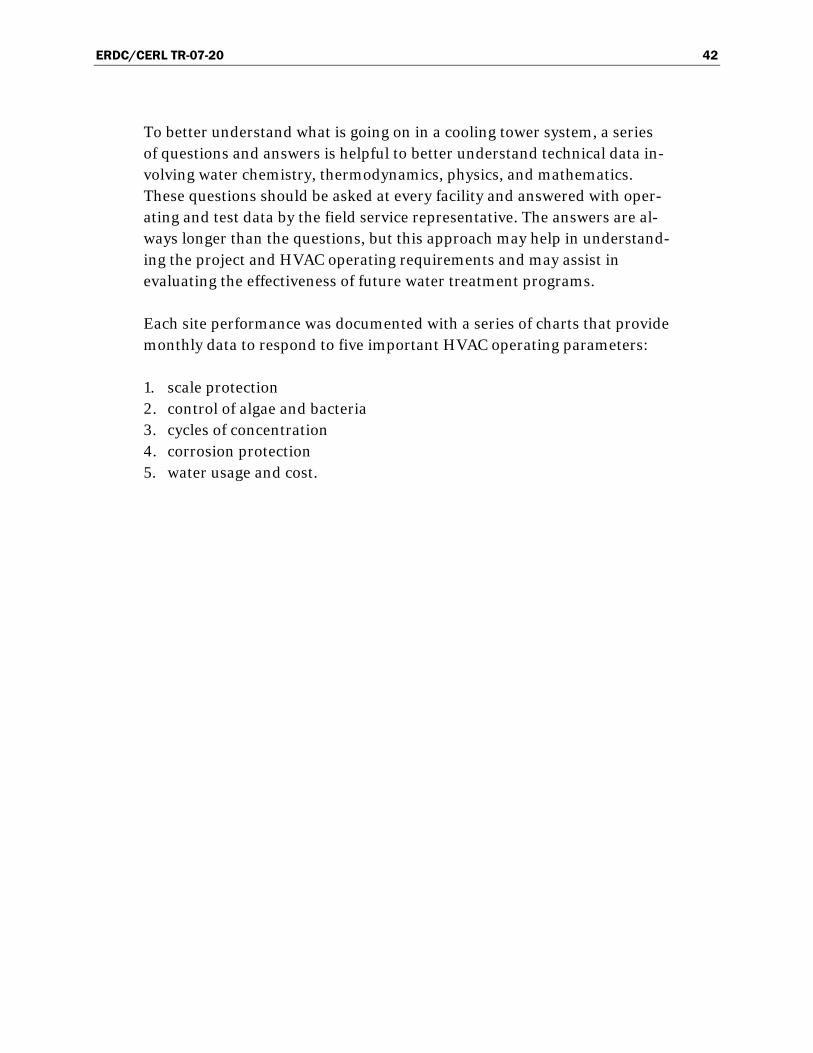
ERDC/CERL TR-07-20 42
To better understand what is going on in a cooling tower system, a series of questions and answers is helpful to better understand technical data in-volving water chemistry, thermodynamics, physics, and mathematics. These questions should be asked at every facility and answered with oper-ating and test data by the field service representative. The answers are al-ways longer than the questions, but this approach may help in understand-ing the project and HVAC operating requirements and may assist in evaluating the effectiveness of future water treatment programs.
Each site performance was documented with a series of charts that provide monthly data to respond to five important HVAC operating parameters:
1. scale protection 2. control of algae and bacteria 3. cycles of concentration 4. corrosion protection 5. water usage and cost.
ERDC/CERL TR-07-20 43
4 Metrics
Independent analysis was done by the Illinois State Water Survey, Illinois Department of Natural Resources. Standard water analysis included the following determinations performed by wet chemistry methods: P&M al-kalinity, hardness, chloride, nitrate, phosphate (organic, poly, and ortho as needed), tolyltriazole (if present), total dissolved solids, total suspended solids, pH, polymer, ammonia, and conductivity. Major and minor metals were analyzed by the ICP, which included calcium, magnesium, sulfate, iron, copper, zinc, aluminum, sodium, molybdenum, and silica, as well as others. ISWS also installed and periodically monitored corrosion coupons in each system. Garratt-Callahan monitored bacteria levels in cooling tow-ers.
ERDC/CERL TR-07-20 44
5 Economic Summary (Projected ROI)
Projected ROI
The projected ROI for this project was determined by assessing the project costs and projected costs of equipment operation and maintenance with the standard treatment and equipment, and with the green treatment chemicals and smart monitoring and control system designed for this pro-ject. An independent assessment of the performance of the technology and ROI analysis was completed by SurTech Corporation, and this report is included as Appendix E. The findings of the analysis validated the per-formance of the smart monitoring and control system in regulating the mild steel and copper corrosion inhibitor feed rates and the free chlorine biocide levels. Based on the results of this project, the ROI is projected to be 13.00. The original estimated ROI was exceeded.
Assumptions
The full economic analysis is presented in Appendix E, and the detailed data and assumptions are included. The analysis showed that implement-ing green chemical treatment and smart control and monitoring system would provide a net savings of over $7M in a 30-year period on an initial investment of $503K, the project cost fraction for Fort Rucker. The Sur-Tech analyst concluded that this ROI would be repeated at the other base locations. All other bases suffered similar problems and have benefited from this new technology.
Not included in this analysis are the savings from the expected reduced water usage, resulting from the accuracy of the blowdown control. In addi-tion, the technology can result in energy savings for running a cleaner boiler or cooling tower, operating with less load of biological growth or mineral scale. Also not included is the improved safety of the monitoring and control system, which reduces direct mixing and handling of the treatment chemicals.
ERDC/CERL TR-07-20 45
6 Recommendation
Based on the results of this project, it is recommended that military instal-lations ensure that boilers and cooling towers are fitted with good moni-toring and control systems for the application of chemical treatments for the prevention of corrosion, scale, and microbiological growth. This pro-ject implemented a state-of-the art system that self-adjusts the treatment based on corrosion rates. The full feature set of this system may exceed the requirements for most applications, but appropriate elements of the sys-tem can be incorporated into any treatment program.
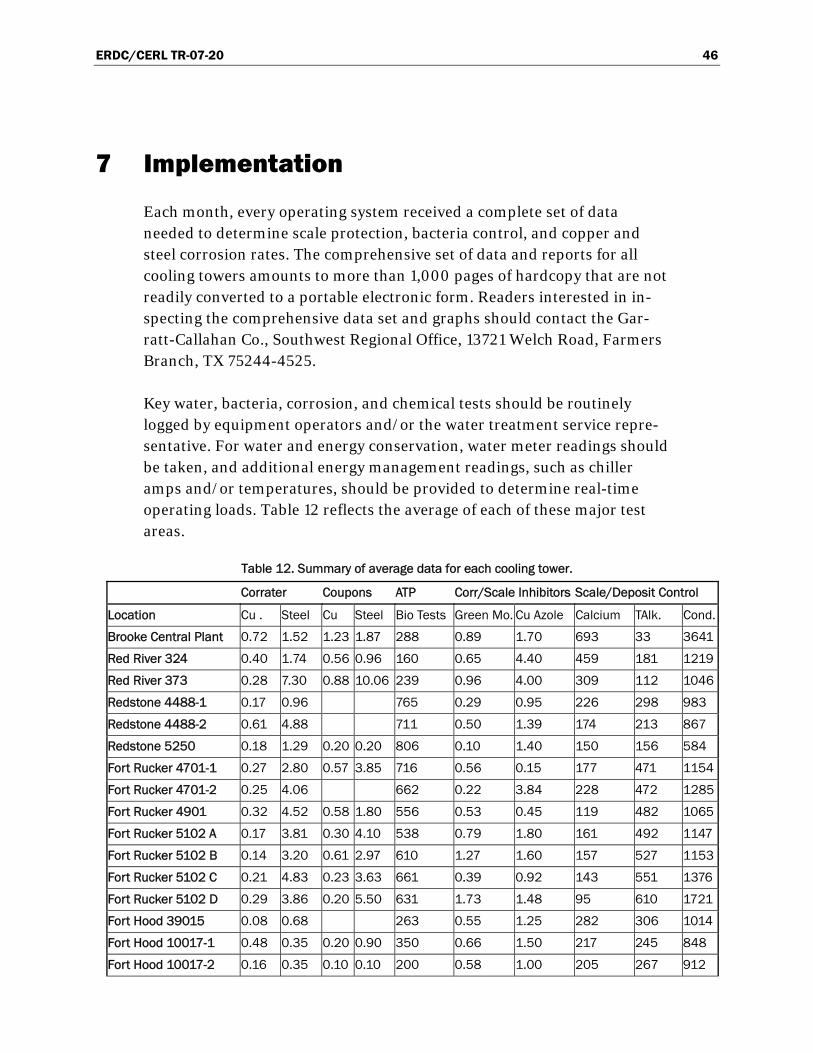
ERDC/CERL TR-07-20 46
7 Implementation
Each month, every operating system received a complete set of data needed to determine scale protection, bacteria control, and copper and steel corrosion rates. The comprehensive set of data and reports for all cooling towers amounts to more than 1,000 pages of hardcopy that are not readily converted to a portable electronic form. Readers interested in in-specting the comprehensive data set and graphs should contact the Gar-ratt-Callahan Co., Southwest Regional Office, 13721 Welch Road, Farmers Branch, TX 75244-4525.
Key water, bacteria, corrosion, and chemical tests should be routinely logged by equipment operators and/or the water treatment service repre-sentative. For water and energy conservation, water meter readings should be taken, and additional energy management readings, such as chiller amps and/or temperatures, should be provided to determine real-time operating loads. Table 12 reflects the average of each of these major test areas.
Table 12. Summary of average data for each cooling tower.
Corrater Coupons ATP Corr/Scale Inhibitors Scale/Deposit Control
Location Cu . Steel Cu Steel Bio Tests Green Mo. Cu Azole Calcium TAlk. Cond.
Brooke Central Plant 0.72 1.52 1.23 1.87 288 0.89 1.70 693 33 3641
Red River 324 0.40 1.74 0.56 0.96 160 0.65 4.40 459 181 1219
Red River 373 0.28 7.30 0.88 10.06 239 0.96 4.00 309 112 1046
Redstone 4488-1 0.17 0.96 765 0.29 0.95 226 298 983
Redstone 4488-2 0.61 4.88 711 0.50 1.39 174 213 867
Redstone 5250 0.18 1.29 0.20 0.20 806 0.10 1.40 150 156 584
Fort Rucker 4701-1 0.27 2.80 0.57 3.85 716 0.56 0.15 177 471 1154
Fort Rucker 4701-2 0.25 4.06 662 0.22 3.84 228 472 1285
Fort Rucker 4901 0.32 4.52 0.58 1.80 556 0.53 0.45 119 482 1065
Fort Rucker 5102 A 0.17 3.81 0.30 4.10 538 0.79 1.80 161 492 1147
Fort Rucker 5102 B 0.14 3.20 0.61 2.97 610 1.27 1.60 157 527 1153
Fort Rucker 5102 C 0.21 4.83 0.23 3.63 661 0.39 0.92 143 551 1376
Fort Rucker 5102 D 0.29 3.86 0.20 5.50 631 1.73 1.48 95 610 1721
Fort Hood 39015 0.08 0.68 263 0.55 1.25 282 306 1014
Fort Hood 10017-1 0.48 0.35 0.20 0.90 350 0.66 1.50 217 245 848
Fort Hood 10017-2 0.16 0.35 0.10 0.10 200 0.58 1.00 205 267 912
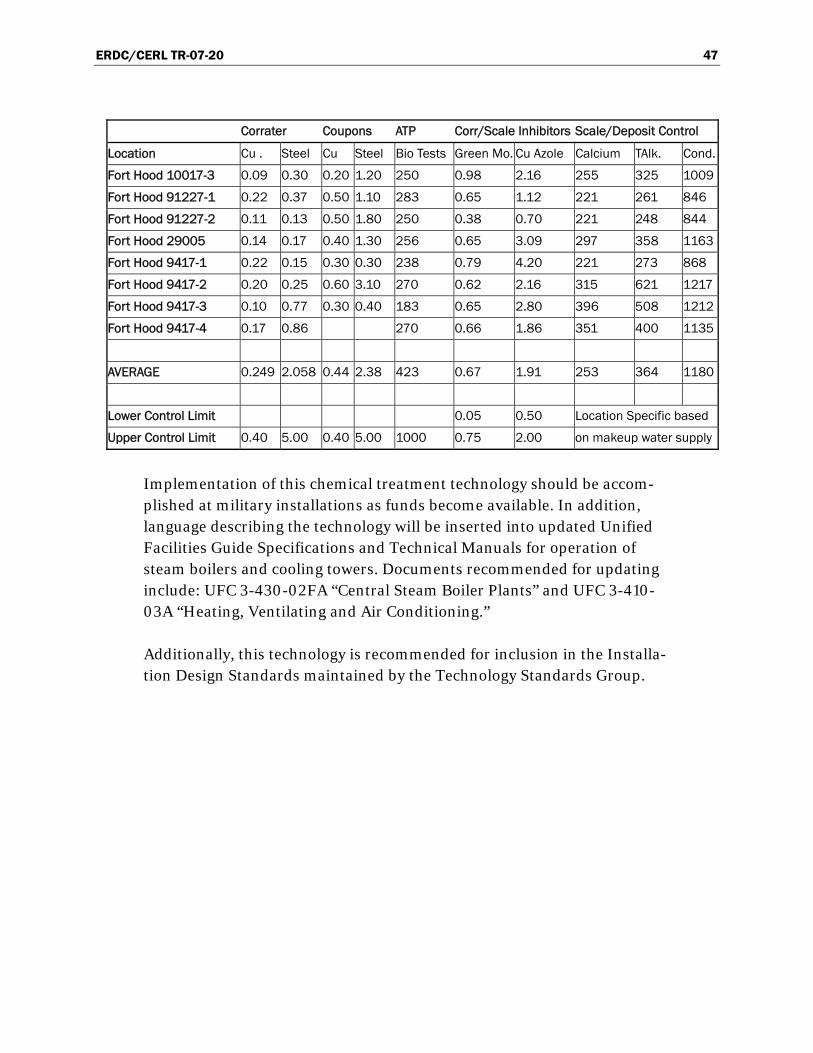
ERDC/CERL TR-07-20 47
Corrater Coupons ATP Corr/Scale Inhibitors Scale/Deposit Control
Location Cu . Steel Cu Steel Bio Tests Green Mo. Cu Azole Calcium TAlk. Cond.
Fort Hood 10017-3 0.09 0.30 0.20 1.20 250 0.98 2.16 255 325 1009
Fort Hood 91227-1 0.22 0.37 0.50 1.10 283 0.65 1.12 221 261 846
Fort Hood 91227-2 0.11 0.13 0.50 1.80 250 0.38 0.70 221 248 844
Fort Hood 29005 0.14 0.17 0.40 1.30 256 0.65 3.09 297 358 1163
Fort Hood 9417-1 0.22 0.15 0.30 0.30 238 0.79 4.20 221 273 868
Fort Hood 9417-2 0.20 0.25 0.60 3.10 270 0.62 2.16 315 621 1217
Fort Hood 9417-3 0.10 0.77 0.30 0.40 183 0.65 2.80 396 508 1212
Fort Hood 9417-4 0.17 0.86 270 0.66 1.86 351 400 1135
AVERAGE 0.249 2.058 0.44 2.38 423 0.67 1.91 253 364 1180
Lower Control Limit 0.05 0.50 Location Specific based
Upper Control Limit 0.40 5.00 0.40 5.00 1000 0.75 2.00 on makeup water supply
Implementation of this chemical treatment technology should be accom-plished at military installations as funds become available. In addition, language describing the technology will be inserted into updated Unified Facilities Guide Specifications and Technical Manuals for operation of steam boilers and cooling towers. Documents recommended for updating include: UFC 3-430-02FA “Central Steam Boiler Plants” and UFC 3-410-03A “Heating, Ventilating and Air Conditioning.”
Additionally, this technology is recommended for inclusion in the Installa-tion Design Standards maintained by the Technology Standards Group.
ERDC/CERL TR-07-20 48
8 Conclusions
Of the five installations at which the 22 facilities were located, only Fort Hood had any documented history of corrosion data or monitoring. The smart monitoring and control technology provided continuous corrosion monitoring of all systems and also adjusted corrosion inhibitors based on actual corrosion results. This kept the overall corrosion rate and the mi-crobial levels in the good to excellent control range. No major scaling issue was caused by the chemical or control equipment not operating as de-signed.
Feedback from each of the facilities involved with the project was positive, although there were daily challenges, such as on/off operating conditions, overflowing of the tower basins, and other facets involved with the com-plexity of HVAC facility operations that need a well-coordinated team ef-fort. The inconsistent periods of quality control were particularly evident during the spring and fall due to varying loads and on/off operating condi-tions.
This project successfully demonstrated the application of smart cooling tower controller technology, documented and proven with a significant quantity of chemical tests and corrosion data. Green chemistry cooling wa-ter treatment programs were revalidated with a wide range of water sup-plies, resulting in significantly lower corrosion rates at all project facilities and improved the continuous chlorination application at the Brooke Army Medical Center involving greywater makeup. This resulted in dramatically lowering the copper corrosion rate from 4–5 mpy to 0.4 mpy, representing a 90-92% reduction in the copper corrosion rate. A specific report evaluat-ing this corrosion was written by the contractor’s NACE-certified corrosion specialist and the project’s technical director.
Significant maintenance reduction requirements were reported at the Red River Army Depot at a high temperature Dynamometer brake testing sys-tem. At this facility, the ERDC-CERL boiler inspector was impressed with on-line cleaning of badly scaled boilers using G-C formula 1100.
At the facility where weekly service was already in place, the lowest corro-sion rates were recorded, strongly supporting the need for weekly service
ERDC/CERL TR-07-20 49
of water treatment programs, including documentation of steel and corro-sion rates, biological control (ATP or dip slides), and water treatment con-trol tests. Real-time information relating to water and energy usage, sys-tem loads, and overall cost of operation should also be considered for larger systems.
The DoD has developed an ongoing program of corrosion protection and control that affects all military assets, including facility HVAC operating infrastructure. The HVAC operating environment significantly impacts daily operating costs, long-term capital requirements when equipment must be replaced prematurely, air and water quality environmental issues, and manpower deployment. If management is to improve corrosion and related water treatment problems, an easy-to-use monitoring program needs to be in place.
The importance of a cooperative, well coordinated team cannot be over-emphasized, beginning with contracting to develop specifications and bids to apply and monitor water treatment programs, to operations personnel dedicated to a proactive maintenance program, and finally to management to monitor and manage results affecting the HVAC equipment.
As a shortage in water supply develops, there has been a trend developing to provide untreated (greywater) for HVAC systems. When this occurs, additional attention will be needed to address unique corrosion and depo-sition issues. This will require improved monitoring and application tech-nologies and additional chemical testing, as well as the use of service pro-grams to better track and report indirect operating costs, not just the cost of water treatment chemicals.
When all data are assimilated, the data and methodology of this project will be communicated to other government facilities, as well as the private sector, in their fight against corrosion. Because of the billions of dollars of annualized cost associated with HVAC corrosion in government facilities, applying chemicals with state-of-the-art control equipment and monitor-ing/reporting technologies will have a high return on investment (ROI). This high ROI primarily comes from extending HVAC equipment life and minimizing energy and water consumption. If this extended life is only for one year, with the vast number of cooling systems and the high cost per system, this could represent savings of millions of dollars at a site and bil-lions of dollars worldwide.
ERDC/CERL TR-07-20 50
To minimize operating costs and address health and safety issues and en-vironmental concerns, operating and management personnel need both a complete water treatment chemical program and a comprehensive moni-toring program to easily document what is going on in the HVAC system. An “HVAC Tips Sheet” was developed by Garratt-Callahan to assist man-agement with future water treatment applications (see Appendix C.)
The data developed in this project will continue to be useful long after the project is complete. At these five Army installations in particular, applica-tion of the corrosion data developed may be used as benchmark data for comparing future corrosion control in HVAC equipment. Future projects may want to consider refining this communication format to develop low-cost methods to monitor corrosion and continue to improve HVAC energy and water efficiencies. By working together with a well-designed and a well-monitored water treatment program, corrosion can be minimized and equipment life can be extended.

ERDC/CERL TR-07-20 A1
Appendix A: Using LSI and RSI Indices to Choose Cooling Water Products
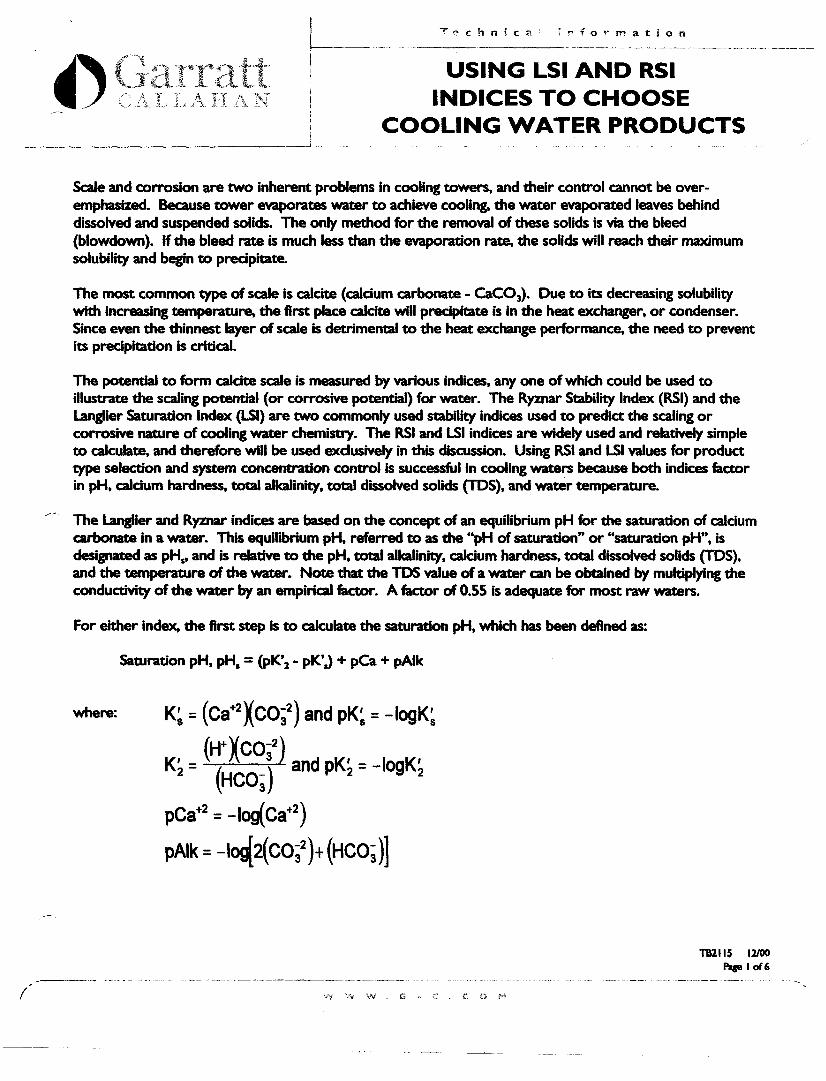
I ~--I j
I
I
----------------------------~!
USING LSI AND RSI INDICES TO CHOOSE
COOLING WATER PRODUCTS
/
Scale and corrosion are two inherent problems in cooling towers, and their control cannot be overemphasized. Because tower evaporates water to achieve cooling. the water evaporated leaves behind dissolved and suspended solids. The only method for the removal of these solids is via the bleed (blowdown). If the bleed rate is much less than the evaporation rate, the solids will reach their maximum solubility and begin to precipitate.
The most common type of scale is calcite (calcium carbonate - CaC01). Due to its decreasing solubility with increasing temperature, the first place calcite will precipitate is in the heat exchanger. or condenser. Since even the thinnest layer of scale is detrimental to the heat exchange performance. the need to prevent its precipitation is critical.
The potential to form calcite scale is measured by various indices. anyone of which could be used to illustrate the scaling potential (or corrosive potential) for water. The Ryznar Stability Index (RSI) and the Langlier Saturation Index (LSI) are two commonly used stabl1ity indices used to predict the scaling or corrosive nature of cooling water chemistry. The RSI and LSI indices are widely used and relatively simple to calculate. and therefore will be used exdusively in this discussion. Using RSI and LSI values for product type selection and system concentration control Is successful in cooling waters because both indices factor in pH. calcium hardness. total alkalinity. total dissolved solids (TDS). and water temperature.
The Langlier and Ryznar indices are based on the concept of an equilibrium pH for the saturation of calcium carbonate in a water. This equilibrium pH. referred to as the "pH of saturation" or "saturation pH". is designated as pHs. and is relative to the pH. total alkalinity. calcium hardness. total dissolved solids (TDS). and the temperature of the water. Note that the TDS value of a water can be obtained by multiplying the conductivity of the water by an empirical factor. A factor of 0.55 is adequate for most raw waters.
For either index, the first step is to calculate the saturation pH. which has been defined as:
where:
Saturation pH. pHs = (pK' 2 ~ pK'J + pca + pAik
K~ = (Ca+2XCO;2) and pK~ = -logK~ (WXCO-2
) K' = 3 and pK' = -logK'
2 (HCO;) 2 2
pCa+2 = -log(Ca+2)
pAlk = -IO~2(CO;2)+ (HCO;)]
mils IlIOO Pagelof6
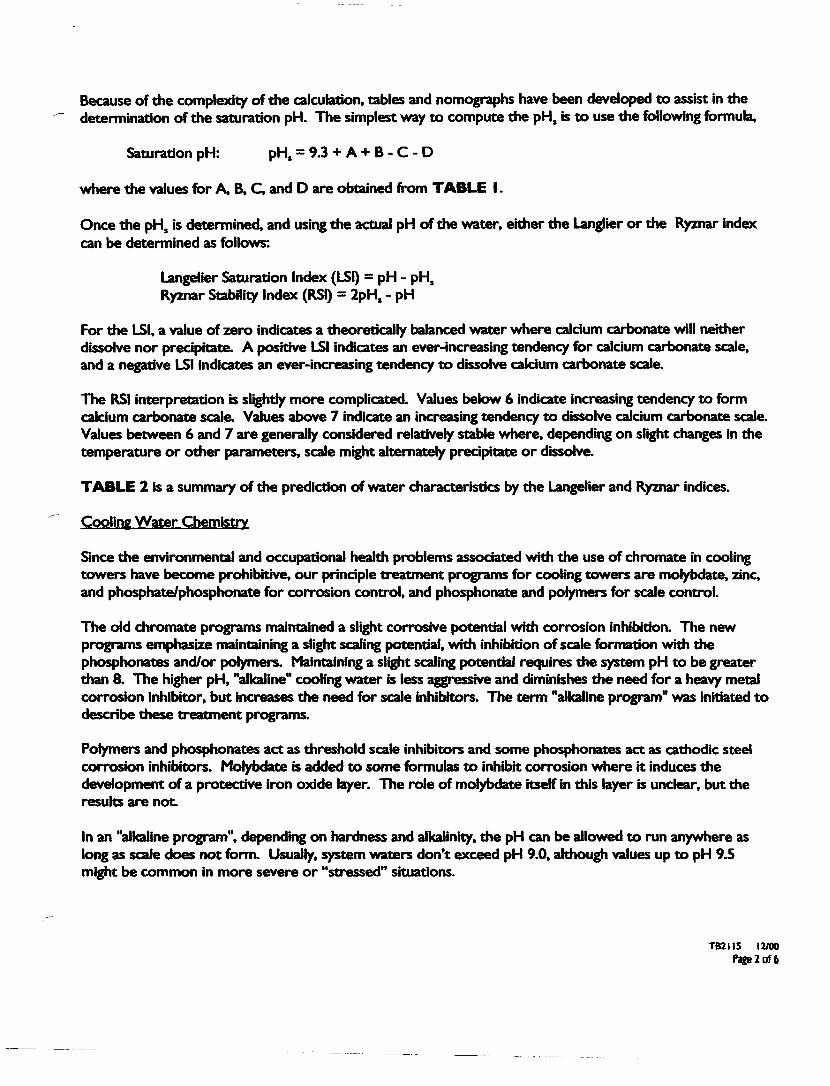
Because of the complexity of the calculation, tables and nomographs have been developed to assist in the determination of the saturation pH. The simplest way to compute the pHs is to use the following formula,
Saturation pH: pHs = 9.3 + A + B - C - 0
where the values for A, B, C, and 0 are obtained from TABLE I.
Once the pHs is determined, and using the actual pH of the water, either the Langlier or the Ryznar index can be determined as follows:
Langelier Saturation Index (LSI) = pH - pHs Ryznar Stability Index (RSI) = lpHs - pH
For the LSI, a value of zero indicates a theoretically balanced water where calcium carbonate will neither dissolve nor precipitate. A positive LSI indicates an ever-increasing tendency for calcium carbonate scale, and a negative LSI indicates an ever-increasing tendency to dissolve calcium carbonate scale.
The RSI interpretation is slightly more complicated. Values below 6 indicate increasing tendency to form calcium carbonate scale. Values above 7 indicate an increasing tendency to dissolve calcium carbonate scale. Values between 6 and 7 are generally considered relatively stable where, depending on slight changes in the temperature or other parameters, scale might alternately precipitate or dissolve.
TABLE 1 is a summary of the prediction of water characteristics by the Langelier and Ryznar indices.
Cooli", Wawr Chemistry
Since the environmental and occupational health problems associated with the use of chromate in cooling towers have become prohibitive, our principle treatment programs for cooling towers are molybdate, zinc, and phosphatelphosphonate for corrosion control, and phosphonate and polymers for scale control.
The old chromate programs maintained a slight corrosive potential with corrosion inhibition. The new programs emphasize maintaining a slight scaling potential, with inhibition of scale formation with the phosphonates and/or polymers. Maintaining a slight scaling potential requires the system pH to be greater than 8. The higher pH, "alkaline" cooling water is less aggressive and diminishes the need for a heavy metal corrosion inhibitor, but increases the need for scale inhibitors. The term "alkaline program" was initiated to describe these 1:1 eatment programs.
Polymers and phosphonates act as threshold scale inhibitors and some phosphonates act as cathodic steel corrosion inhibitors. Molybdate is added to some formulas to inhibit corrosion where it induces the development of a protective iron oxide layer. The role of molybdate itself in this layer is unclear, but the results are not.
In an "alkaline program", depending on hardness and alkalinity, the pH can be allowed to run anywhere as long as scale does not form. Usually, system waters don't exceed pH 9.0, although values up to pH 9.5 might be common in more severe or "stressed" situations.
TBll15 12100 Page2of6
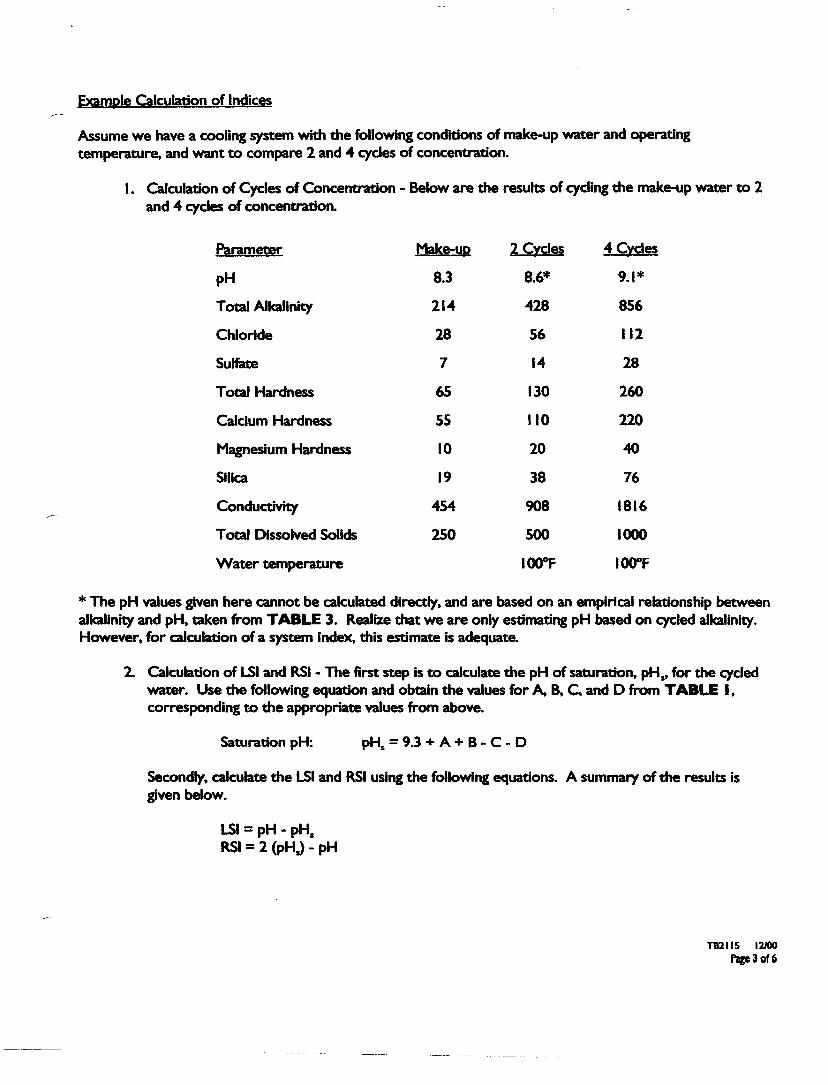
Example Calculation of Indices
Assume we have a cooling system with the following conditions of make-up water and operating temperature. and want to compare 2 and 4 cycles of concentration.
I. Calculation of Cycles of Concentration - Below are the results of cycling the make-up water to 2 and 4 cycles of concentration.
Parameter Make-up 2 CXcles 4 CXcles
pH 8.3 8.6* 9.1*
Total Alkalinity 214 428 8S6
Chloride 28 S6 112
Sulfate 7 14 28
Total Hardness 6S 130 260
Calcium Hardness SS 110 220
Magnesium Hardness 10 20 40
Silica 19 38 76
Conductivity 454 908 1816
Total Dissolved Solids 250 SOO 1000
Water temperature 1000F 1000F
* The pH values given here cannot be calculated directly. and are based on an empirical relationship between alkalinity and pH. taken from TABLE 3. Realize that we are only estimating pH based on cycled alkalinity. However. for calculation of a system index. this estimate is adequate.
2. Calculation of LSI and RSI - The first step is to calculate the pH of saturation. pHs. for the cycled water. Use the following equation and obtain the values for A, B. C. and D from TABLE •. corresponding to the appropriate values from above.
Saturation pH: pHs = 9.3 + A + B - C - D
Secondly. calculate the LSI and RSI using the following equations. A summary of the results is given below.
LSI = pH - pHs RSI = 2 (pHj - pH
TalliS 12100 f'il&dof6

ERDC/CERL TR-07-20 B1
Appendix B: Microbiologically Influenced Corrosion
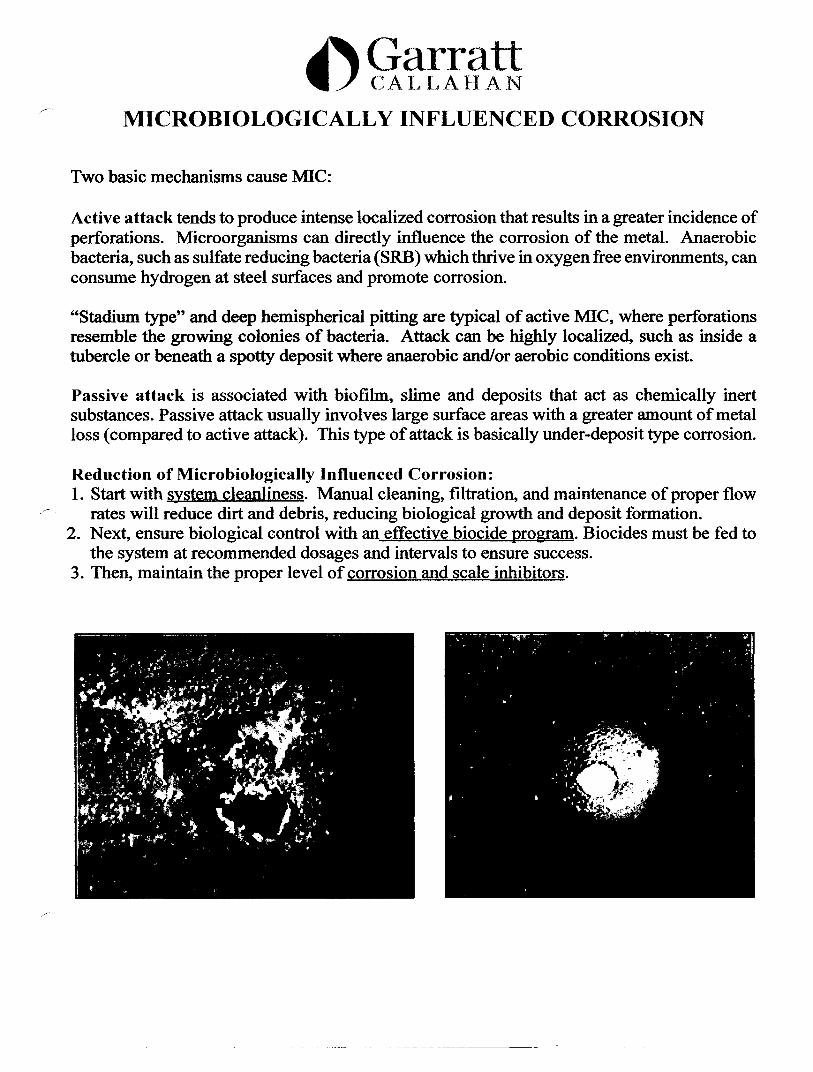
~g~[Fffn MICROBIOLOGICALL Y INFLUENCED CORROSION
Two basic mechanisms cause MIC:
Active attack tends to produce intense localized corrosion that results in a greater incidence of perforations. Microorganisms can directly influence the corrosion of the metal. Anaerobic bacteria, such as sulfate reducing bacteria (SRB) which thrive in oxygen free environments, can consume hydrogen at steel surfaces and promote corrosion.
"Stadium type" and deep hemispherical pitting are typical of active MIC, where perforations resemble the growing colonies of bacteria. Attack can be highly localized, such as inside a tubercle or beneath a spotty deposit where anaerobic and/or aerobic conditions exist.
Passive attack is associated with biofilm, slime and deposits that act as chemically inert substances. Passive attack usually involves large surface areas with a greater amount of metal loss (compared to active attack). This type of attack is basically under-deposit type corrosion.
Reduction of Microbiologically Influenced Corrosion: 1. Start with system cleanliness. Manual cleaning, filtration, and maintenance of proper flow
rates will reduce dirt and debris, reducing biological growth and deposit formation. 2. Next, ensure biological control with an effective biocide program. Biocides must be fed to
the system at recommended dosages and intervals to ensure success. 3. Then, maintain the proper level of corrosion and scale inhibitors.
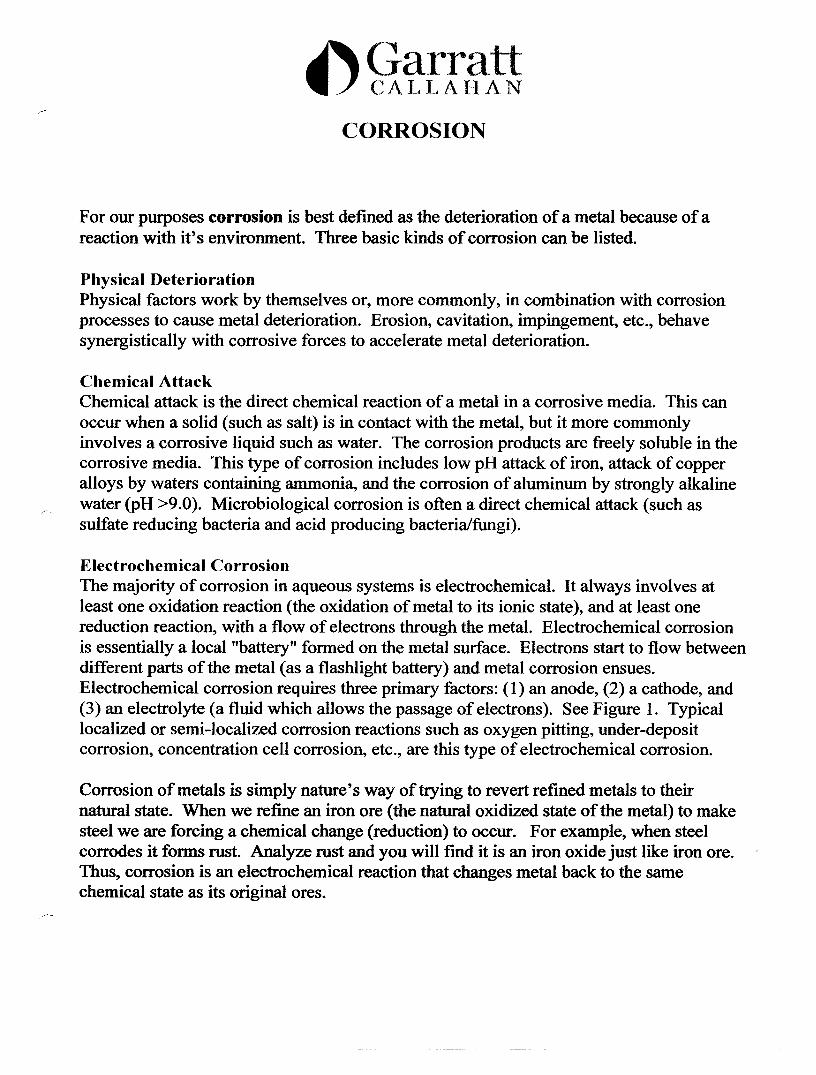
CORROSION
For our purposes corrosion is best defmed as the deterioration of a metal because of a reaction with it's environment. Three basic kinds of corrosion can be listed.
Physical Deterioration Physical factors work by themselves or, more commonly, in combination with corrosion processes to cause metal deterioration. Erosion, cavitation, impingement, etc., behave synergistically with corrosive forces to accelerate metal deterioration.
Chemical Attack Chemical attack is the direct chemical reaction of a metal in a corrosive media. This can occur when a solid (such as salt) is in contact with the metal, but it more commonly involves a corrosive liquid such as water. The corrosion products are freely soluble in the corrosive media. This type of corrosion includes low pH attack of iron, attack of copper alloys by waters containing ammonia, and the corrosion of aluminum by strongly alkaline water (PH >9.0). Microbiological corrosion is often a direct chemical attack (such as sulfate reducing bacteria and acid producing bacteria/fungi).
Electrochemical Corrosion The majority of corrosion in aqueous systems is electrochemical. It always involves at least one oxidation reaction (the oxidation of metal to its ionic state), and at least one reduction reaction, with a flow of electrons through the metal. Electrochemical corrosion is essentially a local "battery" formed on the metal surface. Electrons start to flow between different parts of the metal (as a flashlight battery) and metal corrosion ensues. Electrochemical corrosion requires three primary factors: (1) an anode, (2) a cathode, and (3) an electrolyte (a fluid which allows the passage of electrons). See Figure 1. Typical localized or semi-localized corrosion reactions such as oxygen pitting, under-deposit corrosion, concentration cell corrosion, etc., are this type of electrochemical corrosion.
Corrosion of metals is simply nature's way of trying to revert refined metals to their natural state. When we refine an iron ore (the natural oxidized state of the metal) to make steel we are forcing a chemical change (reduction) to occur. For example, when steel corrodes it forms rust. Analyze rust and you will fmd it is an iron oxide just like iron ore. Thus, corrosion is an electrochemical reaction that changes metal back to the same chemical state as its original ores.
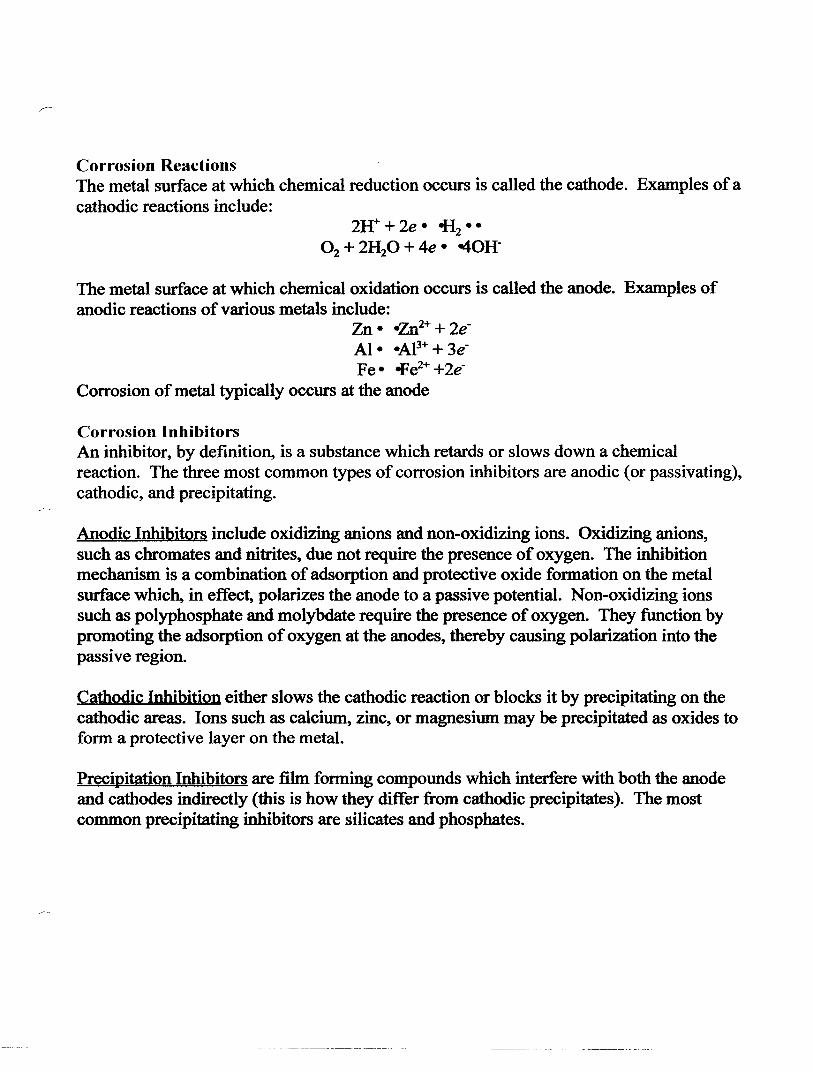
Corrosion Reactions The metal surface at which chemical reduction occurs is called the cathode. Examples of a cathodic reactions include:
2W+2e - £2--02 + 2H20 + 4e - -40H-
The metal surface at which chemical oxidation occurs is called the anode. Examples of anodic reactions of various metals include:
Zn - -Zn2+ + 2eAl - -AI3+ + 3eFe- tFe2+ +2e-
Corrosion of metal typically occurs at the anode
Corrosion Inhibitors An inhibitor, by defmition, is a substance which retards or slows down a chemical reaction. The three most common types of corrosion inhibitors are anodic (or passivating), cathodic, and precipitating.
Anodic Inhibitors include oxidizing anions and non-oxidizing ions. Oxidizing anions, such as chromates and nitrites, due not require the presence of oxygen. The inhibition mechanism is a combination of adsorption and protective oxide formation on the metal surface which, in effect, polarizes the anode to a passive potential. Non-oxidizing ions such as polyphosphate and molybdate require the presence of oxygen. They function by promoting the adsorption of oxygen at the anodes, thereby causing polarization into the . . pasSIve regIon.
Cathodic Inhibition either slows the cathodic reaction or blocks it by precipitating on the cathodic areas. Ions such as calcium, zinc, or magnesium may be precipitated as oxides to form a protective layer on the metal.
Precipitation Inhibitors are film forming compounds which interfere with both the anode and cathodes indirectly (this is how they differ from cathodic precipitates). The most common precipitating inhibitors are silicates and phosphates.
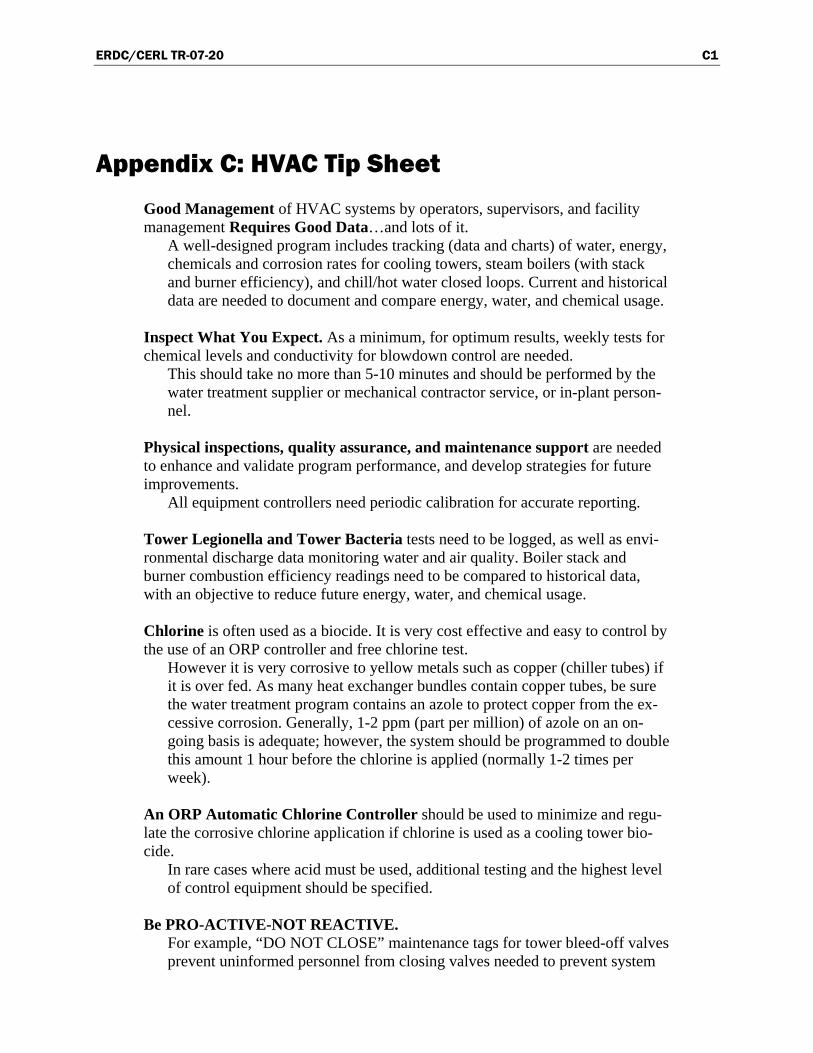
ERDC/CERL TR-07-20 C1
Appendix C: HVAC Tip Sheet
Good Management of HVAC systems by operators, supervisors, and facility management Requires Good Data…and lots of it.
A well-designed program includes tracking (data and charts) of water, energy, chemicals and corrosion rates for cooling towers, steam boilers (with stack and burner efficiency), and chill/hot water closed loops. Current and historical data are needed to document and compare energy, water, and chemical usage.
Inspect What You Expect. As a minimum, for optimum results, weekly tests for chemical levels and conductivity for blowdown control are needed.
This should take no more than 5-10 minutes and should be performed by the water treatment supplier or mechanical contractor service, or in-plant person-nel.
Physical inspections, quality assurance, and maintenance support are needed to enhance and validate program performance, and develop strategies for future improvements.
All equipment controllers need periodic calibration for accurate reporting. Tower Legionella and Tower Bacteria tests need to be logged, as well as envi-ronmental discharge data monitoring water and air quality. Boiler stack and burner combustion efficiency readings need to be compared to historical data, with an objective to reduce future energy, water, and chemical usage. Chlorine is often used as a biocide. It is very cost effective and easy to control by the use of an ORP controller and free chlorine test.
However it is very corrosive to yellow metals such as copper (chiller tubes) if it is over fed. As many heat exchanger bundles contain copper tubes, be sure the water treatment program contains an azole to protect copper from the ex-cessive corrosion. Generally, 1-2 ppm (part per million) of azole on an on-going basis is adequate; however, the system should be programmed to double this amount 1 hour before the chlorine is applied (normally 1-2 times per week).
An ORP Automatic Chlorine Controller should be used to minimize and regu-late the corrosive chlorine application if chlorine is used as a cooling tower bio-cide.
In rare cases where acid must be used, additional testing and the highest level of control equipment should be specified.
Be PRO-ACTIVE-NOT REACTIVE.
For example, “DO NOT CLOSE” maintenance tags for tower bleed-off valves prevent uninformed personnel from closing valves needed to prevent system
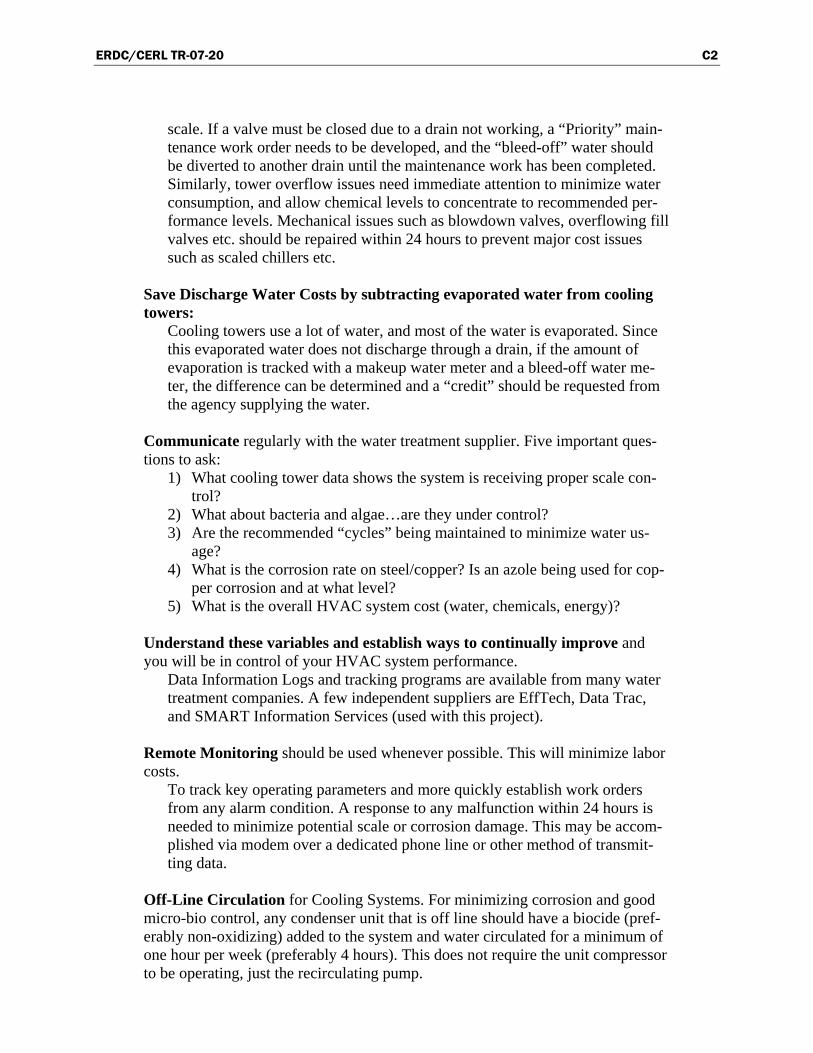
ERDC/CERL TR-07-20 C2
scale. If a valve must be closed due to a drain not working, a “Priority” main-tenance work order needs to be developed, and the “bleed-off” water should be diverted to another drain until the maintenance work has been completed. Similarly, tower overflow issues need immediate attention to minimize water consumption, and allow chemical levels to concentrate to recommended per-formance levels. Mechanical issues such as blowdown valves, overflowing fill valves etc. should be repaired within 24 hours to prevent major cost issues such as scaled chillers etc.
Save Discharge Water Costs by subtracting evaporated water from cooling towers:
Cooling towers use a lot of water, and most of the water is evaporated. Since this evaporated water does not discharge through a drain, if the amount of evaporation is tracked with a makeup water meter and a bleed-off water me-ter, the difference can be determined and a “credit” should be requested from the agency supplying the water.
Communicate regularly with the water treatment supplier. Five important ques-tions to ask:
1) What cooling tower data shows the system is receiving proper scale con-trol?
2) What about bacteria and algae…are they under control? 3) Are the recommended “cycles” being maintained to minimize water us-
age? 4) What is the corrosion rate on steel/copper? Is an azole being used for cop-
per corrosion and at what level? 5) What is the overall HVAC system cost (water, chemicals, energy)?
Understand these variables and establish ways to continually improve and you will be in control of your HVAC system performance.
Data Information Logs and tracking programs are available from many water treatment companies. A few independent suppliers are EffTech, Data Trac, and SMART Information Services (used with this project).
Remote Monitoring should be used whenever possible. This will minimize labor costs.
To track key operating parameters and more quickly establish work orders from any alarm condition. A response to any malfunction within 24 hours is needed to minimize potential scale or corrosion damage. This may be accom-plished via modem over a dedicated phone line or other method of transmit-ting data.
Off-Line Circulation for Cooling Systems. For minimizing corrosion and good micro-bio control, any condenser unit that is off line should have a biocide (pref-erably non-oxidizing) added to the system and water circulated for a minimum of one hour per week (preferably 4 hours). This does not require the unit compressor to be operating, just the recirculating pump.
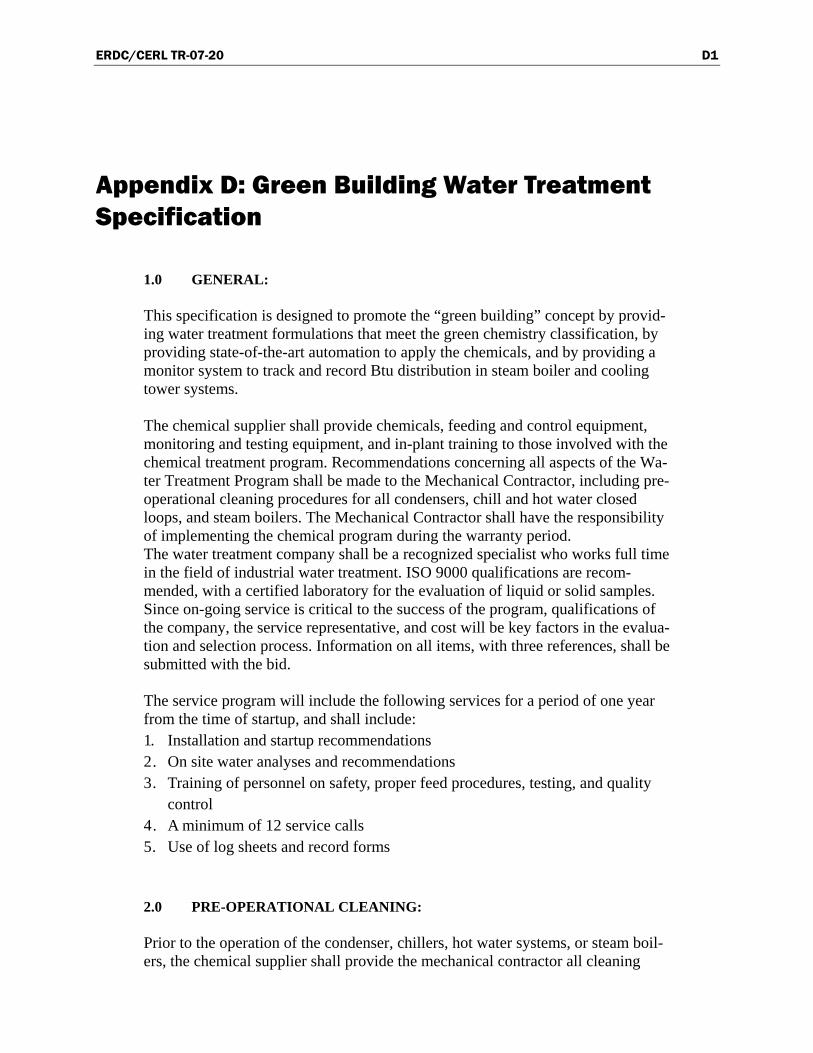
ERDC/CERL TR-07-20 D1
Appendix D: Green Building Water Treatment Specification
1.0 GENERAL: This specification is designed to promote the “green building” concept by provid-ing water treatment formulations that meet the green chemistry classification, by providing state-of-the-art automation to apply the chemicals, and by providing a monitor system to track and record Btu distribution in steam boiler and cooling tower systems. The chemical supplier shall provide chemicals, feeding and control equipment, monitoring and testing equipment, and in-plant training to those involved with the chemical treatment program. Recommendations concerning all aspects of the Wa-ter Treatment Program shall be made to the Mechanical Contractor, including pre-operational cleaning procedures for all condensers, chill and hot water closed loops, and steam boilers. The Mechanical Contractor shall have the responsibility of implementing the chemical program during the warranty period. The water treatment company shall be a recognized specialist who works full time in the field of industrial water treatment. ISO 9000 qualifications are recom-mended, with a certified laboratory for the evaluation of liquid or solid samples. Since on-going service is critical to the success of the program, qualifications of the company, the service representative, and cost will be key factors in the evalua-tion and selection process. Information on all items, with three references, shall be submitted with the bid. The service program will include the following services for a period of one year from the time of startup, and shall include: 1. Installation and startup recommendations 2. On site water analyses and recommendations 3. Training of personnel on safety, proper feed procedures, testing, and quality
control 4. A minimum of 12 service calls 5. Use of log sheets and record forms
2.0 PRE-OPERATIONAL CLEANING: Prior to the operation of the condenser, chillers, hot water systems, or steam boil-ers, the chemical supplier shall provide the mechanical contractor all cleaning
ERDC/CERL TR-07-20 D2
chemicals with written recommendations for the application of products and flushing of each system. If the initial flushing is not adequate after the systems are on line, based on iron and conductivity testing by the chemical supplier, addi-tional flushing may be required by the mechanical contractor. After the initial flushing, flushing should continue with a slow 1 gpm drain for 3-5 days, or until iron levels are less than 0.1 ppm and the total dissolved solids (tds) are within 10% of the supply water tds (usually 4-5 days). At that time, the system corrosion inhibitor should be added. The chemical supplier is responsible only for chemicals required for one cleaning process. If additional cleaning is needed due to system components not yet con-nected at the time of initial cleaning, materials for the second cleaning will be the responsibility and cost of the mechanical contractor. 3.0 WATER TREATMENT CHEMICALS: Furnish one year’s supply of the recommended formulas for scale and corrosion protection for all open cooling towers, chill water and hot water closed loops, and steam boilers.
A. The Cooling Tower chemical program shall utilize a “Green Chemical” wa-ter treatment program. This program shall use two Presidental Award mate-rials in the overall program. The first material is Polyaspartate (PASP) for-mulated into a single product with additional phosphonate materials and Benzyltriazole for copper corrosion protection. Sodium molybdate is al-lowed as a trace element for dosage control only, with a maximum residual of 1.0 ppm. A substitute trace element may be substituted only if molybdate is not permitted by local or state regulations. Corrosion shall be monitored with a corrosion coupon “rack” with the objective of 3-5 mils per year (or less) corrosion rate.
No acid materials for pH control shall be allowed and cycles of concentra-tion shall be maintained to carry three cycles of concentration, with a maxi-mum total hardness level of 500-600 ppm and a maximum silica level of 160 ppm. The combined total calcium hardness and total alkalinity level should not exceed 850 ppm.
For biological control, an automated non-oxidizing (no chlorine) dual bio-cide program will be provided, with the system programmed to apply the biocide two times per week during the hotter months (9) and one time per week during the remaining cooler months (3). One of the two non-oxidizing materials shall be the Presidential Green Chemistry award winner material Tetrrakis (hydroxymethyl phosphonium sulfate (THPS), which is an excel-lent bacteriacide. The second biocide material should be a non-oxidizing ma-terial to control algae. An oxidizing material shall be used two times per year, with the specific ob-jective of sanitizing the tower for potential Legionella bacteria.
ERDC/CERL TR-07-20 D3
B. All closed chill water and hot water loops shall be chemically cleaned with an alkaline, phosphate formulation containing dispersants, iron sequestrants, and surface-active materials, and then thoroughly flushed. After complete flushing as described in 2.0, each closed system is to be treated with a liquid nitrite/borate corrosion inhibitor based formulation, with 600-800 ppm nitrite in the chill loop and 800-1200 ppm nitrite in the hot water system. Once the recommended chemical residual is achieved and documented, any additional chemical required to re-treat the system due to water loss shall be the cost and responsibility of the Mechanical Contractor.
C. For steam boilers, a complete automated proportional feed system is re-
quired to apply three chemicals for pretreatment, internal treatment, and an-other environmentally friendly steamline ethoxolated soya material for steamline corrosion protection. All formulations shall be in liquid form, and applied directly to the feedwater tank through a stainless steel injection quill, with the exception of the ethoxolated soya steamline chemical which shall be injected through a stainless steel injection quill plumbed direct to the steam header (in the common steam header area if there are multiple boilers). Note: The plumbing from the chemical pump applying the sodium sulfite should be plumbed not only to the feedwater tank, but also to each boiler (with a shutoff valve) so that proper off-line and storage procedures may be utilized to protect the boiler(s) from oxygen corrosion at all times. All chemical plumbing should be in 3/8 inch 316 stainless steel. This re-quirement is only for the oxygen scavenger.
D. The internal treatment formulation shall include phosphate, polymer, and
phosphonate materials to provide scale and deposition protection and will be applied direct to the boiler feedwater. The ethoxolated soya steamline chemical shall be injected through a stainless steel injection nozzle direct to the steam header.
E. Feedwater temperature shall be regulated with a temperature-regulating
valve to maintain feedwater temperature no less than 180 degrees Fahren-heit.
F. As hard water dramatically increases chemical consumption, a twin unit
automatic regeneration based on water usage (not time) water softener shall be installed to insure soft water to the steam boilers at all times. The Sof-tener shall be professionally serviced two times per year, with a report on each service.
4.0 CHEMICAL FEEDING AND CONTROL EQUIPMENT: Chemical supplier shall provide the following equipment, with appropriate plumbing and wiring schematics: COOLING TOWER:
A. All control systems shall be automated to minimize labor cost, to minimize water consumption, and to maintain a high level of qual-
ERDC/CERL TR-07-20 D4
ity control of the applied chemicals. The Cooling Tower controller shall be a Pulsatrol model MCT 510-EAXXXX, or equal, with drum level sensors for 3 chemicals.
Controller shall be configured with a L-2 modem connection for phone line communications or direct connection for computer lap-top downloading.
B. The supply make-up line to the cooling tower shall be equipped
with a totalizing water meter with electric contact head, which should be installed in a convenient area approved for ease of read-ing (not higher than 6 feet). In addition, the bleed-off line shall have a totalizing water meter with electric contact head, again installed in an area easily accessed for the meter reader. Each month, the differ-ence between the total amount of make-up water and the total amount of bleed-off shall be determined to save on sewer discharge costs. All in-line meters shall be horizontally plumbed with a by-pass, for meter cleaning and/or removal if necessary, to allow for a continuous system operation.
C. The Cooling Tower bleed-off valve shall be an ASCO Zero Pres-
sure Ball Solenoid Valve, or equivalent, which requires zero pres-sure to operate. A ½ inch solenoid is required up to 400 tons, or 1200 gpm recirculation rate. A ¾ inch solenoid is required up to 800 tons, or a 2400 gpm recirculation rate. A 1 inch solenoid is re-quired if the system tonnage is 800-1200 tons, or a recirculation rate between 2400-3600 gpm. A Y strainer shall be plumbed immedi-ately in front of the solenoid valve, with a quick opening flush valve plumbed to drain. The bleedoff solenoid, as well as the bleed-off water meter, shall be plumbed in a by-pass arrangement, allowing the system a method to continue with a manual bleed should the so-lenoid valve require replacement.
D. Three Pulsafeeder chemical pumps, Model LBO3-SA-VTC1 or
equal, shall be provided for the three chemicals (inhibitor and 2 bio-cides). The pumps shall be mounted on an “L” bracket or shelf no higher than 50 inches and no less than 40 inches. The discharge of the 3 pumps shall be direct into the system recirculating line with 3 one inch steel shutoff valves.
One extra pump liquid end parts kit shall be provided.
E. A ¾ inch supply line manifold to the controller shall be provided.
The sample stream shall have a check valve immediately following the conductivity probe and a Y strainer is to be installed just ahead of the tower controller. Isolation valves and unions should be on both sides of the controller to facilitate cleaning and/or removal of the strainer or tower controller. A ½ inch flush/drain/sample valve shall be installed just inside the discharge isolation union.
ERDC/CERL TR-07-20 D5
F. One schedule 80 PVC corrosion coupon rack assembly with a four coupon holder shall be provided. A flow control valve shall be set at 5 gpm to insure proper flow over the corrosion coupons.
G. Pumps, Controller, and related plumbing shall be prefabricated in a
pre-plumbed and pre-wired panel to facilitate installation. HOT WATER AND CHILL WATER SYSTEMS:
H. Each separate chill water and hot water system shall have a Neptune FTF Filter Feeder. This five gallon feeder shall have an operation pressure rating of 200 psi and shall include a box of 6 replacement 5 micron filter bags.
I. Each separate chill water system shall have a schedule 80 PVC cor-
rosion rack assembly with a four coupon holder and a flow control valve set at 5 gpm. A 100 mesh Y-strainer shall be installed up-stream of the coupon rack to insure accurate corrosion rate results.
J. Each separate hot water system shall have a black iron corrosion
coupon rack assembly with a four coupon holder and a flow control valve set at 5 gpm. A 100 mesh Y-strainer shall be installed up-stream of the coupon rack to insure accurate corrosion rate results.
K. Each closed loop (chill water and hot water) shall have a Hendley
Nitro Series water meter, or approved equal, sized for the makeup line to the chill water and to the hot water systems. The meter shall have built in frost protection and a center sweep hand sealed register and shall be installed at a height no greater than 6 feet for ease of reading. The meter shall be installed in the main makeup line but shall be valved with a by-pass line so the meter may be removed without interrupting service. The resister shall have large numerals for easy reading and shall meet AWWA C708, ISO 4064, G131T19001-ISO9000 performance specifications. One approved source for this meter is Heron Mfg., Metairie, LA at 1-504-455-2300.
STEAM BOILERS:
L. Three Pulsafeeder model LB06EA-KTC1 Chemical pumps, or equal, complete with Reed Capsule Switches, shall be activated with the flow proportioning system. The pumps will be activated based on the amount of softened water made up to the boiler, and will feed the chemicals “neat” from the shipping container. The chemical pumps shall have a stainless steel discharge fitting and 3/8 stainless steel tubing shall be used. One extra pump liquid end parts kit shall be provided.
ERDC/CERL TR-07-20 D6
One pump shall apply the oxygen scavenger direct to the feedwater tank with an injection quill and this pump shall also be plumbed to each boiler for off-line storage with a shut off valve when not in use. The second pump shall be provided to apply the internal boiler treatment direct to the boiler feedwater with an injection quill (after the common line from the feedwater pumps), and the third pump shall use an injection nozzle to apply the ethoxolated soya filming material direct to the common steam header.
M. Each boiler larger than 100 horsepower shall be equipped with a
Pulsafeeder Model MBC 610 AXXX automatic blowdown control-ler, or equal, complete with a Model VP-300 Motorized Valve Package for a single boiler. With two boilers, the Pulsafeeder Model 620 AXXX model may be substituted, with an additional VP-300 Motorized Valve. For three boilers, the Pulsafeeder Model 630 AXXX should be used. The blowdown valve shall be installed in a by-pass with appropriate valves and unions for ease of removal, and to facilitate continued blowdown when in a by- pass mode.
N. For boilers less than 100 horsepower, the system shall be equipped
with a water meter counter, timer prefab system for all three chemi-cals. The water meter shall be the size of the makeup line to the fe-edwater tank and have an electric contact head. The control system shall be a Boiler Panel 5, complete with water meter, 3 chemical pumps, and blowdown valve, prefabricated by Heron Mfg., Met-airie, La. or approved equal. The control system power supply shall be electrically interlocked with the boiler fans so that the system will not receive power if the boilers are offline.
O. All Pumps, Controller, and related accessories shall be prefabricated
and pre-wired on a panel mount to facilitate installation, with all chemical pump discharge lines in 3/8 inch stainless steel.
SPILL CONTAINMENT & SAFETY:
A. All chemicals shall have a double containment chemical storage container, sized to hold from two to six months chemical supply. A Transfer pump with 10 feet of transfer hose shall be provided, with shutoff valves and quick disconnect fittings.
B. An eye wash station and shower shall be conveniently located to
the chemical feed station for emergency situations. 5.0 TESTING EQUIPMENT:
A. The chemical supplier shall provide testing equipment for each
scale/corrosion product recommended, with log sheets for recording both numeric and graphic test results. Testing frequency by the Me-
ERDC/CERL TR-07-20 D7
chanical Contractor and/or User shall be as needed to insure good softener operation (test several times per week), proper chemical re-siduals, and recommended cycles of concentration (tds).
B. For biocide control, biological test tabs shall be provided for the cooling tower and closed loops.
C. A multi-range Myron-L conductivity meter with pH capability shall be provided to test the supply water, tower water, boiler wa-ter, and condensate, and closed loops.
D. A True-Test Model 23-4C-6 Sr.Testmaster Senior, Complete with
glassware and reagents, in a wall mounted Cabinet shall be pro-vided, including a high temperature pyrex sample bottle for sam-pling boiler water.
E. Chemical supplier shall furnish safety equipment for handling
chemicals, including safety goggles, gloves, apron, and absorbent.
F. A Neptune GS-316 Grab Station Sample Cooler shall be provided to cool condensate and steam boiler water samples. Plumbing shall be with ¼ inch Stainless Steel. Boiler System water sample valves are to be installed for softened water, feedwater, boiler water, and condensate. Sample port for the cooling water will be installed in the pre-fabricated panel mount. Samples shall be plumbed, with isolation valves for each sample, to the Grab Station Sample Cooler near a convenient drain.
G. A spill containment basin or individual double containment vessels
are required for all chemical drums to contain accidental spills. 6.0 ENERGY MANAGEMENT: Incorporating energy efficiency, renewable energy, and sustainable “green design” fea-tures in all buildings has become a top priority. Progressive strategies, formalized through Executive Order 13123, known as Greening the Government through Efficient Energy Management mandates a reduction in energy usage. To monitor system performance and track heat distribution in HVAC facilities, automatic monitoring is required to detect changes in operating conditions, alert maintenance per-sonnel, and provide comprehensive reports on energy and water consumption. For steam boiler systems greater than 100 HP and cooling tower systems greater that 100 tons of cooling, an EDCS (Energy Data Collection System), or equal, is required. Speci-fications for the cooling and boiler monitoring systems are as follows:
ERDC/CERL TR-07-20 D8
BOILER SYSTEMS > 100 HORSEPOWER BOILER BTU MONITOR: Install a boiler temperature and flow monitoring system, or approved equal, to the EDCS (Energy Data Collection System) manufactured by Heron Inc., 4116 Page Drive, Met-airie, LA 70003-1328. Phone number 504-455-2300; fax 504-455-2319. System shall be capable of tracking and recording on an hourly, daily, weekly, monthly, quarterly, and annual basis (with data base capacity for three years data) the following measurements:
Makeup supply water temperature, and gallons of water consumed, Condensate return temperature, Feedwater temperature, and Hours of operation (burner on).
System shall have a color display with touch screen, and have the capability of entering the following real time operating data: Boiler steam operating pressure Fuel Cost (Gas/Oil/Coal) Percentage makeup Number of Steam Boilers Percentage blowdown Rated HP (each) Supply water cost Estimated % boiler efficiency Discharge water cost Boiler Stack temperature (full load) Sensor accuracy shall be +/- 0.8% span with a pressure sensor error of +/- 0.013%/oC and a temperature sensor error of +/- 0.1 oF. Sensor shall be “smart chip” technology with internal calibration and alarm when sensor replacement is required. Sensors shall be housed in rugged brass or stainless enclosure with standard ¼ inch NPT fittings. System shall provide the following average operating conditions, based on 3 second sam-ple intervals and stored on a short term and long term memory for hourly, daily, weekly, monthly, quarterly, and yearly data: Mass Temperature (Supply, condensate, Feedwater) Mass Flow (Supply, Condensate, Feedwater, Steam Produced, Boiler Blowdown) Heat Distribution (Supply, Condensate, Feedwater, Steam, Blowdown) Btu Requirement, Average Load, Fuel Consumption, Fuel and Water Cost System shall provide direct RS232 interface communications and have the capability of downloading to a PC, direct or through phone modem, and shall have Ethernet capability. WATER METER shall be a Hendley Nitro Series water meter, or approved equal, with built in frost protection and a center sweep hand sealed register that can be removed without shutting down service. The register shall have large numerals for easy reading and shall meet AWWA C708, ISO 4064, G131T19001-ISO9000 performance specifica-tions. Meter shall be sized to match the makeup supply line. =============================================================== COOLING SYSTEMS > 100 TONS: COOLING SYSTEM BTU MONITOR: Install a cooling system temperature and flow monitoring system, or approved equal, to the EDCS (Energy Data Collection System) manufactured by Heron Inc., 4116 Page Drive, Metairie, La. 70003-1328. Phone number 504-455-2300; fax 504-455-2319.
ERDC/CERL TR-07-20 D9
System shall be capable of tracking and recording on an hourly, daily, weekly, monthly, quarterly, and annual basis (with data base capacity for three years data) the following measurements: Flow (gpm) of condenser water and chill water, in and out temperatures of con-denser water and chill water, hours of chiller on time, metered gallons of cooling tower makeup and cooling tower bleedoff. System shall have a color display with touch screen, and have the capability of entering the following real time operating data: Saturated Liquid Refrigerant Temperature Energy Cost (KwH) Saturated Approach Temperature Number of Condensers/chillers Chiller Amperage Load Rated tons (each chiller) Supply water cost Total gpm tower circulation rate Discharge water cost Hours per day chiller loading Sensor accuracy shall be +/- 0.8% span with a pressure sensor error of +/- 0.013%/oC and a temperature sensor error of +/- 0.1 oF. Sensor shall be “smart chip” technology with internal calibration and alarm when sensor replacement is required. Sensors shall be housed in rugged brass or stainless enclosure with standard ¼ inch NPT fittings. System shall provide the following average operating conditions, based on 3 second sam-ple intervals and stored on a short term and long term memory for hourly, daily, weekly, monthly, quarterly, and yearly data: Mass Temperature (Condenser and Chill Water) Mass Flow (Condenser and Chill Water) Btu Distribution (Condenser and Chill Water) Btu Average Load Conditions, Hours On-Line, Water & Projected Energy Con-sumption/Cost System shall provide direct RS232 interface communications and have the capability of downloading to a PC, direct or through phone modem, and shall have Ethernet capability. WATER METERS (Makeup and Bleedoff) shall be a Hendley Nitro Series water meter, or approved equal, with built in frost protection and a center sweep hand sealed register that can be removed without shutting down service. The register shall have large numer-als for easy reading and shall meet AWWA C708, ISO 4064, G131T19001-ISO9000 per-formance specifications. Meters shall be sized to match the makeup supply line and bleedoff line.
ERDC/CERL TR-07-20 E1
Appendix E: Return on Investment (ROI) Calculation
RETURN ON INVESTMENT REPORT
NONHAZARDOUS CORROSION INHIBITORS/SMART CONTROL SYSTEMS FOR HEATING AND COOLING AT FIVE ARMY
INSTALLATIONS
OSD PROJECT AR-F-314-ROI
By
SURTECH CORPORATION INDIANAPOLIS, INDIANA
June 15, 2007
ERDC/CERL TR-07-20 E2
Executive summary
Background
The Army Installation Management Agency (IMA) and the Army Chief of Staff for Installation Management (ACSIM) consider the deterioration of heating and cooling systems to be the #1 priority corrosion problem due to the critical nature of heating and cooling services. Providing heating and cooling to DoD facilities is critical to mission execution. Personnel must be provided with a reasonable working environment, and mission critical electronic hardware must be kept at proper operating temperatures.
The Return on Investment (ROI) on this project was predicted initially at 9.31. This was based upon two sites – Fort Rucker and Fort Carson. Modi-fications to the project lead to the deletion of Fort Carson, but the addition of Redstone Arsenal, Brooke Army Medical Center, Fort Hood, and Red River Army Depot. These additions greatly enhanced the positive results by showing significant positive results regarding corrosion control in a wider variety of locations.
The project was funded at $2.6M. Base line data was difficult to obtain ex-cept at Fort Rucker. Since this was essentially a project looking at chemi-cal, equipment, water, and energy saving, the new locations did not have complete baseline data. Some sites had purchased chemicals and equip-ment directly from a water treatment company while others had obtained these items from a mechanical contractor as part of a larger service con-tract. Hence, the needed numbers were not available. The actual ROI at Fort Rucker was 14.33. Corrosion data at all sites points to even better re-sults than were seen at Fort Rucker.
A significant number of new chemical formulations have been introduced in the last several years, most notably in the areas of: 1) new formulations for corrosion inhibition, 2) microbiocides for inhibition of bacteria and al-gae, and 3) phosphonates and phosphonate alternatives and new polymers for scale inhibition. There as been an increased interest and emphasis on environmentally friendly chemicals. In this context, “environmentally friendly” formulations are those that have low toxicity, are biodegradable, are safe and low cost to dispose of when spent, and whose production has minimal negative environmental impact.
ERDC/CERL TR-07-20 E3
Smart monitoring and control systems have been developed continuously monitor the water treatment levels and dose new product into the system exactly when needed and in the amount required. This technology results in better control of corrosion, scale, and microbiological growth. Taken to-gether, the non-hazardous corrosion inhibitors and the smart control sys-tems result in a longer, energy efficient service life, lower life cycle cost op-erating costs, increased safety and reduced risk of environmental contamination.
An Office of the Secretary of Defense (OSD) Corrosion Control and Pre-vention (CPC) Program project “Non-hazardous Corrosion Inhibi-tors/SMART Control Systems for Heating & Cooling at Five Army Installa-tions”, will implement the non-hazardous water treatment and smart monitoring and control systems in heating and cooling systems at five Army installations, as given in Table 1. below.
A Contract has been awarded to Garratt-Callahan Company to accomplish this work. Initial Return on Investment (ROI) justification and calcula-tions were developed in the Project Management Plans submitted to OSD, as given in Attachment 1. At that stage of the development of the project, two installations were identified as sites for the project. This has since changed as described above. This report is on the Contractor’s work and evaluates whether or not any the cost/benefits were achieved.
Objectives
The contractor had the following objectives:
1. Minimize corrosion in all HVAC components 2. Maximize energy efficiency 3. Conserve water 4. Minimize environmental impact 5. Extend HVAC equipment life, thereby minimizing capital equipment
costs 6. Address health (Legionella) and safety issues related to chemical han-
dling, cleaning, and inspection of cooling towers and boilers 7. Minimize potential for multi-million dollar lawsuits
ERDC/CERL TR-07-20 E4
Regulatory items
The US Environmental Protection Agency has encouraged the develop-ment of safer chemicals both for operating personnel and waste stream discharge. Two of the chemicals employed in this project have been awarded the US Presidential Green Chemistry Challenge Award.
Results
Industrial cooling systems expect the cooling towers to have a life of 30 years. The tower fill should have a functional life of 15 years, while the chillers themselves are good for 25 years. The cost of replacing a 500 tons tower is about $100K. To replace a chiller is around $50 K. Because most of the cooling towers in this project were galvanized, corrosion of zinc is critical. Copper corrosion and, to a lesser extent steel corrosion, is the im-portant factor in chiller life. At all locations the levels of zinc, copper, and iron reported in the tower water was quite low and did not indicate a cor-rosion problem. Likewise, the corrosion coupons for steel and copper showed that the chemical and control equipment were functioning as in-tended. High copper and steel coupon corrosion occurred at times, but was due to flow or operational anomalies that were not related to the actual project itself. This was especially true for the condensate corrosion testing at Red River Army Depot where it was necessary to install a pump to in-sure proper circulation. Once this was accomplished corrosion rates de-creased from around 20 mpy to 1-2 mpy.
The SMART control equipment also performed well after the normal startup glitches were fixed. In our estimation, this equipment may func-tion for up to 20 years, but should probably be replaced every 10 years to take advantage of technology upgrades.
Technology description
Background and development
In recent years, numerous polymers and biocides have been developed to enhance or augment cooling water treatment programs. The polymers were designed to treat either corrosion or fouling problems in cooling wa-ter systems and heat exchanger equipment. However, few of these poly-mers can function as both a corrosion inhibitor and a scale inhibitor. In addition, many of these polymers and biocides still had some environment
ERDC/CERL TR-07-20 E5
drawbacks that rendered them harmful to aquatic life when discharge to receiving waters.
The objective of this project was to implement “green” water treatment chemicals that control biological growth, corrosion, and scale while reduc-ing or eliminating the generation of toxic substances during the manufac-ture, use, and disposal processes. A strong secondary goal is to develop treatment programs that are safer for operators and handlers of chemical treatments. To this end, acid for alkalinity control is not desired and auto-mation that minimizes user handling of products is sought. This project utilized HVAC performance-proven Green Chemical formulations that were demonstrated in earlier projects by CERL. However, in the support of previously established DoD directives, the project did encompass the de-velopment of a relatively new concept in “Smart” equipment automation for HVAC water treatment programs. The equipment used, however, now is commercial off the shelf (COTS).
A second chemical objective was to implement the use of a safer, green wa-ter treatment chemical for the prevention of steam condensate line corro-sion. Corrosion within the steam boiler should be minimal due to the addi-tion of water treatment formulations that remove corrosive oxygen and provide a non-corrosive highly buffered alkaline water. It is important that the oxygen scavenger be applied to the feedwater to protect the feedwater system and to minimize corrosion migration to the steam boilers.
Steam lines that distribute steam and return the heat in the form of con-densate often do not receive the desired corrosion protection. Carbonate and bicarbonate ions in the boiler makeup water will break down under the operating pressure and temperature of the boiler to form the gas car-bon dioxide. In turn, carbon dioxide leaves the boiler with the steam. At the point where the steam condenses in the system, the carbon dioxide leaves the steam phase and dissolves in the water phase to give carbonic acid. It is this carbonic acid that causes corrosive attack on the system metals as the condensate returns to the powerhouse. Even if the conden-sate is not recovered, it will still cause acidic corrosion at the point of con-densation. Most powerhouses utilize a single amine, or a blend of neutral-izing amines to minimize corrosion resulting from a low pH that occurs when the carbonic acid is formed in the condensate. However, neutralizing amines provide no protection from insidious oxygen corrosion, which is becoming much more prevalent as steam boilers are often taken off line to

ERDC/CERL TR-07-20 E6
save energy and reduce operating costs. For oxygen corrosion protection in steam lines, filming amines may be utilized for metal passivation, although distribution of filming amines in long steam lines, particularly those with vertical risers, is much more difficult than distribution of a neutralizing amine used for pH control. Where filming amines must be used, multiple injection sites may be required.
Historically, filming amines have been difficult to apply due to their high viscosity, low vaporization and limited distribution capability. This par-ticular green steam line formulation, an organic ethoxylated soya amine, minimizes handling issues, but still has difficulty distributing evenly when there are lengthy or complex steam lines. The material has not yet been FDA or USDA approved and currently is not recommended for steam hu-midification systems. As with all filming amines, there is a period of re-moving existing iron oxides as the film is being established on the metal surface, so start-up dosages need to be very low until the condensate iron residuals are low.
To monitor performance of this filming amine, a custom condensate pip-ing arrangement was required to house the Corrater probe and corrosion coupon, to insure the condensate line was full, and included a Dole flow control valve to maintain flow requirements for measuring corrosion. With this arrangement, low Corrater corrosion readings were promising al-though corrosion coupons were coated with the sloughed iron oxide, re-sulting in excessive corrosion rates due to under deposit corrosion on the coupon. A picture of the probes used is shown in Figure D1.
Figure D1. Corrater corrosion rate probes, copper (left) and steel).
Chemical theory
The green chemistry employed had been developed over the past few years in response to a need by a large midwestern university for a low pollution treatment program. The chemicals utilized were a low molecular weight thermally polymerized aspartate (TPA) for scale and corrosion inhibition and the biocide tetrakis (hydroxymethyl) phosphoniumsulfate (THPS).
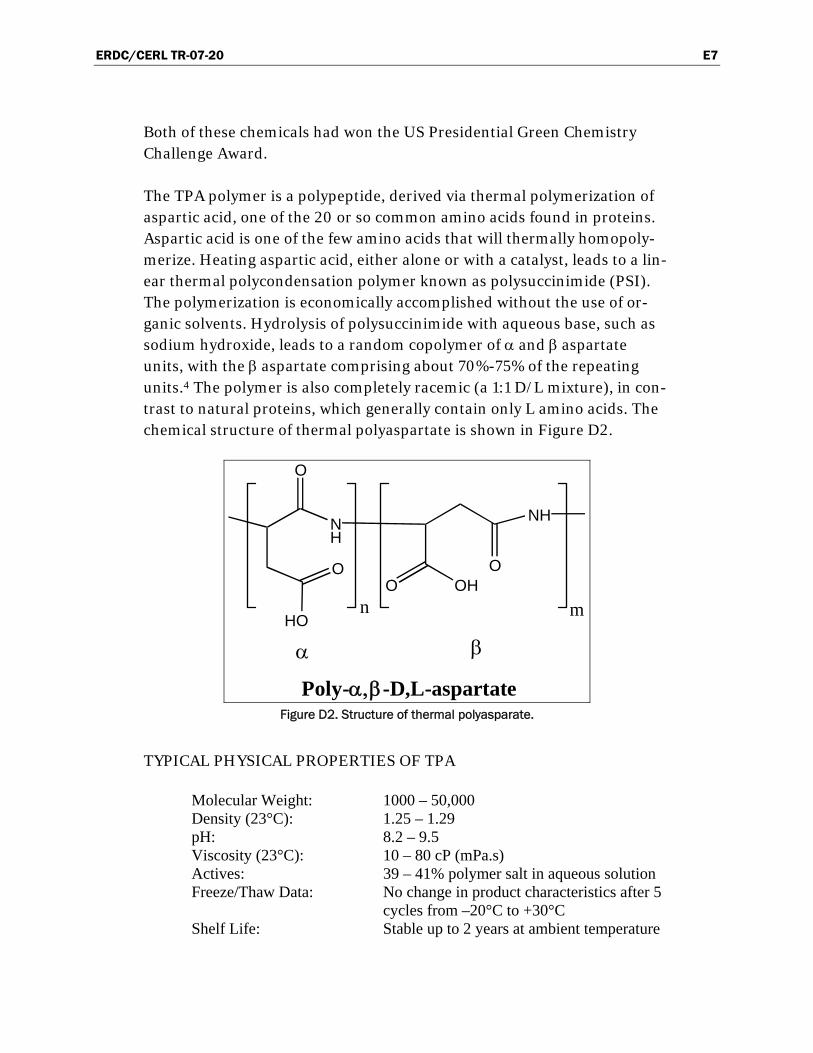
ERDC/CERL TR-07-20 E7
Both of these chemicals had won the US Presidential Green Chemistry Challenge Award.
The TPA polymer is a polypeptide, derived via thermal polymerization of aspartic acid, one of the 20 or so common amino acids found in proteins. Aspartic acid is one of the few amino acids that will thermally homopoly-merize. Heating aspartic acid, either alone or with a catalyst, leads to a lin-ear thermal polycondensation polymer known as polysuccinimide (PSI). The polymerization is economically accomplished without the use of or-ganic solvents. Hydrolysis of polysuccinimide with aqueous base, such as sodium hydroxide, leads to a random copolymer of α and β aspartate units, with the β aspartate comprising about 70%-75% of the repeating units.4 The polymer is also completely racemic (a 1:1 D/L mixture), in con-trast to natural proteins, which generally contain only L amino acids. The chemical structure of thermal polyaspartate is shown in Figure D2.
O
HO
OO
NHNH
OHO
n m
α β
Poly-α,β-D,L-aspartate Figure D2. Structure of thermal polyasparate.
TYPICAL PHYSICAL PROPERTIES OF TPA
Molecular Weight: 1000 – 50,000 Density (23°C): 1.25 – 1.29 pH: 8.2 – 9.5 Viscosity (23°C): 10 – 80 cP (mPa.s) Actives: 39 – 41% polymer salt in aqueous solution Freeze/Thaw Data: No change in product characteristics after 5
cycles from –20°C to +30°C Shelf Life: Stable up to 2 years at ambient temperature
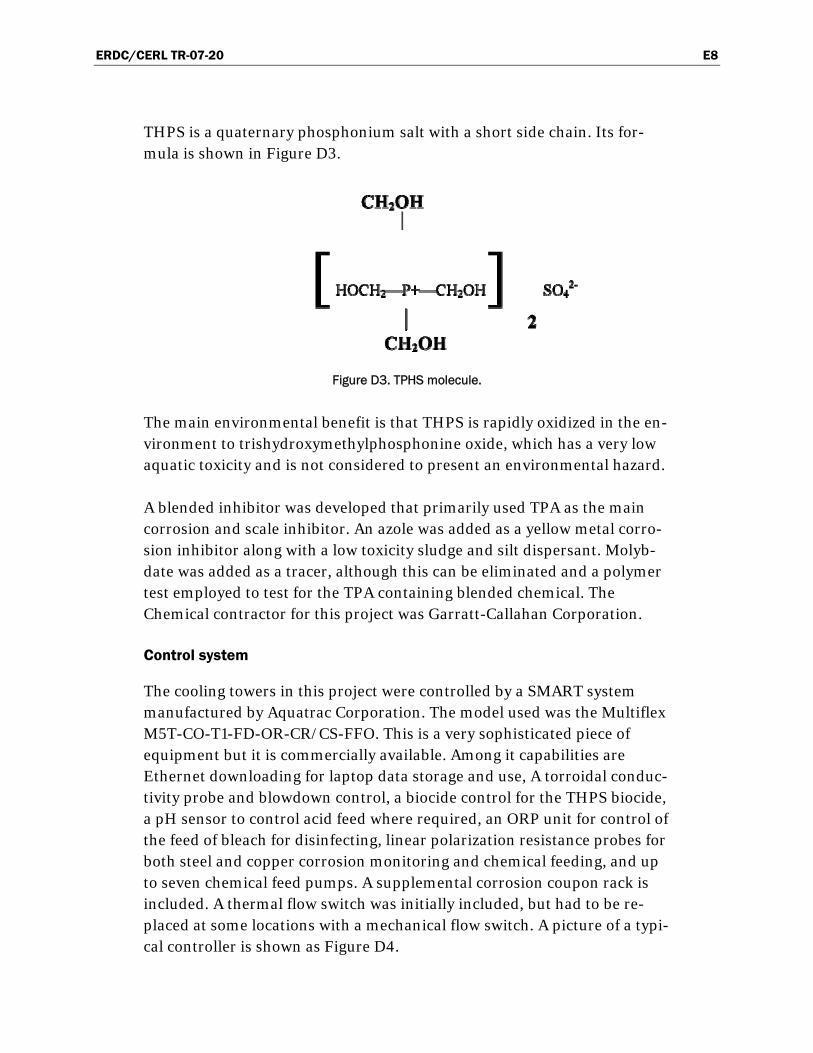
ERDC/CERL TR-07-20 E8
THPS is a quaternary phosphonium salt with a short side chain. Its for-mula is shown in Figure D3.
Figure D3. TPHS molecule.
The main environmental benefit is that THPS is rapidly oxidized in the en-vironment to trishydroxymethylphosphonine oxide, which has a very low aquatic toxicity and is not considered to present an environmental hazard.
A blended inhibitor was developed that primarily used TPA as the main corrosion and scale inhibitor. An azole was added as a yellow metal corro-sion inhibitor along with a low toxicity sludge and silt dispersant. Molyb-date was added as a tracer, although this can be eliminated and a polymer test employed to test for the TPA containing blended chemical. The Chemical contractor for this project was Garratt-Callahan Corporation.
Control system
The cooling towers in this project were controlled by a SMART system manufactured by Aquatrac Corporation. The model used was the Multiflex M5T-CO-T1-FD-OR-CR/CS-FFO. This is a very sophisticated piece of equipment but it is commercially available. Among it capabilities are Ethernet downloading for laptop data storage and use, A torroidal conduc-tivity probe and blowdown control, a biocide control for the THPS biocide, a pH sensor to control acid feed where required, an ORP unit for control of the feed of bleach for disinfecting, linear polarization resistance probes for both steel and copper corrosion monitoring and chemical feeding, and up to seven chemical feed pumps. A supplemental corrosion coupon rack is included. A thermal flow switch was initially included, but had to be re-placed at some locations with a mechanical flow switch. A picture of a typi-cal controller is shown as Figure D4.
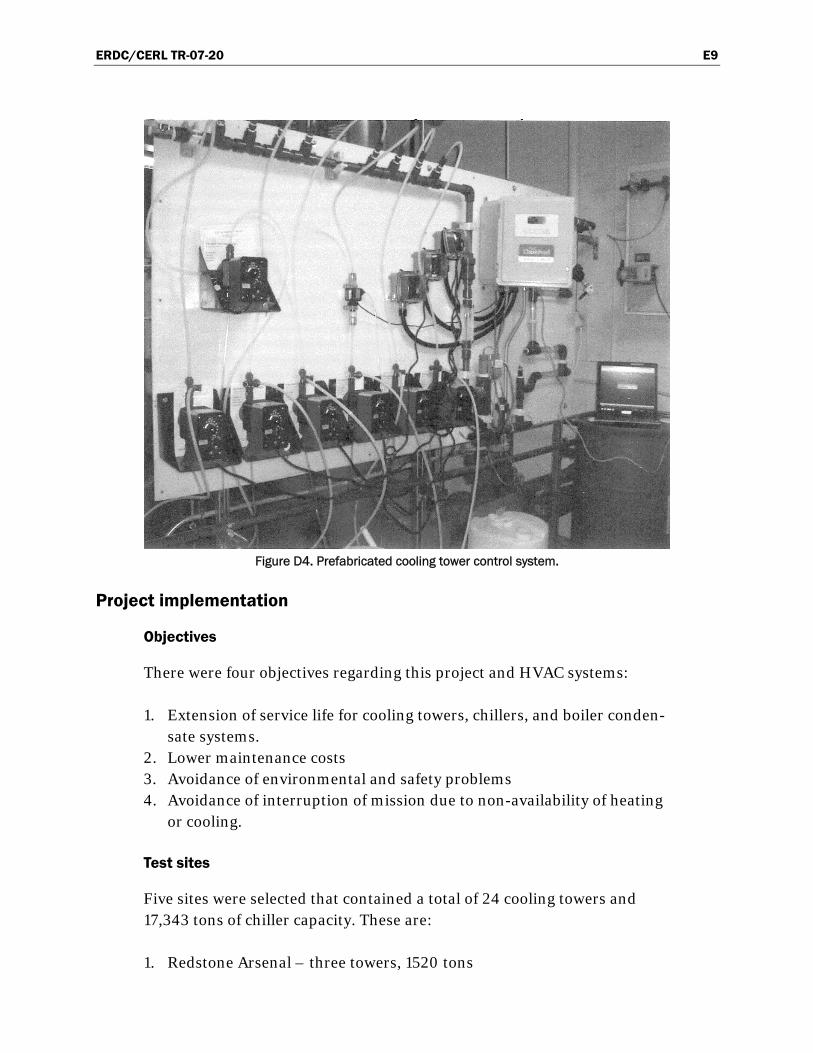
ERDC/CERL TR-07-20 E9
Figure D4. Prefabricated cooling tower control system.
Project implementation
Objectives
There were four objectives regarding this project and HVAC systems:
1. Extension of service life for cooling towers, chillers, and boiler conden-sate systems.
2. Lower maintenance costs 3. Avoidance of environmental and safety problems 4. Avoidance of interruption of mission due to non-availability of heating
or cooling.
Test sites
Five sites were selected that contained a total of 24 cooling towers and 17,343 tons of chiller capacity. These are:
1. Redstone Arsenal – three towers, 1520 tons
ERDC/CERL TR-07-20 E10
2. Brooke Army Medical Center – one tower, 6000 tons 3. Fort Rucker – seven towers, 1525 tons 4. Fort Hood – eleven towers, 5898 tons 5. Red River Army Depot – 2 towers, 2400 tons
Two sites were initially selected for the ethoxylated soya amine condensate project. Brooke Army Medical Center was not used since the ethoxylated soya amine could not be applied because it is not USFDA approved for steam autoclave systems. Only the Central Heating Plant at Red River Army Depot was utilized. It has 3-1000 horsepower boilers.
The majority of the cooling towers were for condenser chillers that pro-vided chilled water for air conditioning in offices, control rooms, and bar-racks. An exception was the two cooling towers at Red River Army Depot. One tower at that location cooled air compressors and the other cooled test stations for engines and transmissions. This latter tower did not cool through a condenser chiller but rather cooled a plate and frame heat ex-changer.
While the quality of the water varied by location, most used the regular base potable water supply for system makeup. The sole exception was at Brooke Army Medical Center were reclaimed municipal wastewater, called gray water was the makeup water source.
All cooling tower sites were equipped with the Aquatrac SMART control system. Each cooling tower had independently controlled feed of the polyaspartate corrosion and scale inhibitor, the azole copper corrosion in-hibitor, the bleach (sodium hypochlorite), and the THPS biocide. Brooke Army Medical Center also fed sulfuric acid for pH control.
The sole boiler water treatment site, Red River Army Depot, monitored the condensate corrosion with both stationary corrosion coupons and linear polarization resistance (LPR) probes. The boilers were fed a scale and sludge control agent along with an oxygen scavenger. The ethoxylated soya amine was fed to the steam condensate system.
A Garratt-Callahan service representative visited all systems covered un-der this project at least once every two weeks. Detailed water treatment chemical testing was conducted on each visit. The compilation of these tests can be found in the report submitted by Garratt-Callahan on the pro-
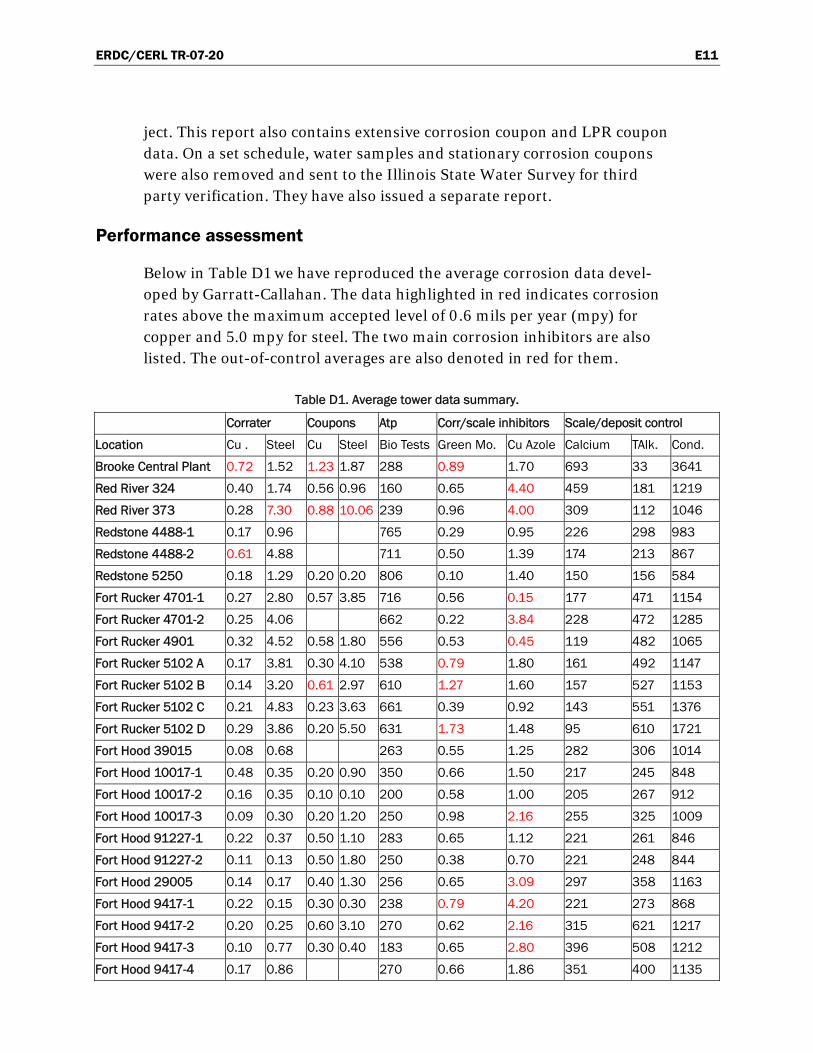
ERDC/CERL TR-07-20 E11
ject. This report also contains extensive corrosion coupon and LPR coupon data. On a set schedule, water samples and stationary corrosion coupons were also removed and sent to the Illinois State Water Survey for third party verification. They have also issued a separate report.
Performance assessment
Below in Table D1 we have reproduced the average corrosion data devel-oped by Garratt-Callahan. The data highlighted in red indicates corrosion rates above the maximum accepted level of 0.6 mils per year (mpy) for copper and 5.0 mpy for steel. The two main corrosion inhibitors are also listed. The out-of-control averages are also denoted in red for them.
Table D1. Average tower data summary.
Corrater Coupons Atp Corr/scale inhibitors Scale/deposit control
Location Cu . Steel Cu Steel Bio Tests Green Mo. Cu Azole Calcium TAlk. Cond.
Brooke Central Plant 0.72 1.52 1.23 1.87 288 0.89 1.70 693 33 3641
Red River 324 0.40 1.74 0.56 0.96 160 0.65 4.40 459 181 1219
Red River 373 0.28 7.30 0.88 10.06 239 0.96 4.00 309 112 1046
Redstone 4488-1 0.17 0.96 765 0.29 0.95 226 298 983
Redstone 4488-2 0.61 4.88 711 0.50 1.39 174 213 867
Redstone 5250 0.18 1.29 0.20 0.20 806 0.10 1.40 150 156 584
Fort Rucker 4701-1 0.27 2.80 0.57 3.85 716 0.56 0.15 177 471 1154
Fort Rucker 4701-2 0.25 4.06 662 0.22 3.84 228 472 1285
Fort Rucker 4901 0.32 4.52 0.58 1.80 556 0.53 0.45 119 482 1065
Fort Rucker 5102 A 0.17 3.81 0.30 4.10 538 0.79 1.80 161 492 1147
Fort Rucker 5102 B 0.14 3.20 0.61 2.97 610 1.27 1.60 157 527 1153
Fort Rucker 5102 C 0.21 4.83 0.23 3.63 661 0.39 0.92 143 551 1376
Fort Rucker 5102 D 0.29 3.86 0.20 5.50 631 1.73 1.48 95 610 1721
Fort Hood 39015 0.08 0.68 263 0.55 1.25 282 306 1014
Fort Hood 10017-1 0.48 0.35 0.20 0.90 350 0.66 1.50 217 245 848
Fort Hood 10017-2 0.16 0.35 0.10 0.10 200 0.58 1.00 205 267 912
Fort Hood 10017-3 0.09 0.30 0.20 1.20 250 0.98 2.16 255 325 1009
Fort Hood 91227-1 0.22 0.37 0.50 1.10 283 0.65 1.12 221 261 846
Fort Hood 91227-2 0.11 0.13 0.50 1.80 250 0.38 0.70 221 248 844
Fort Hood 29005 0.14 0.17 0.40 1.30 256 0.65 3.09 297 358 1163
Fort Hood 9417-1 0.22 0.15 0.30 0.30 238 0.79 4.20 221 273 868
Fort Hood 9417-2 0.20 0.25 0.60 3.10 270 0.62 2.16 315 621 1217
Fort Hood 9417-3 0.10 0.77 0.30 0.40 183 0.65 2.80 396 508 1212
Fort Hood 9417-4 0.17 0.86 270 0.66 1.86 351 400 1135
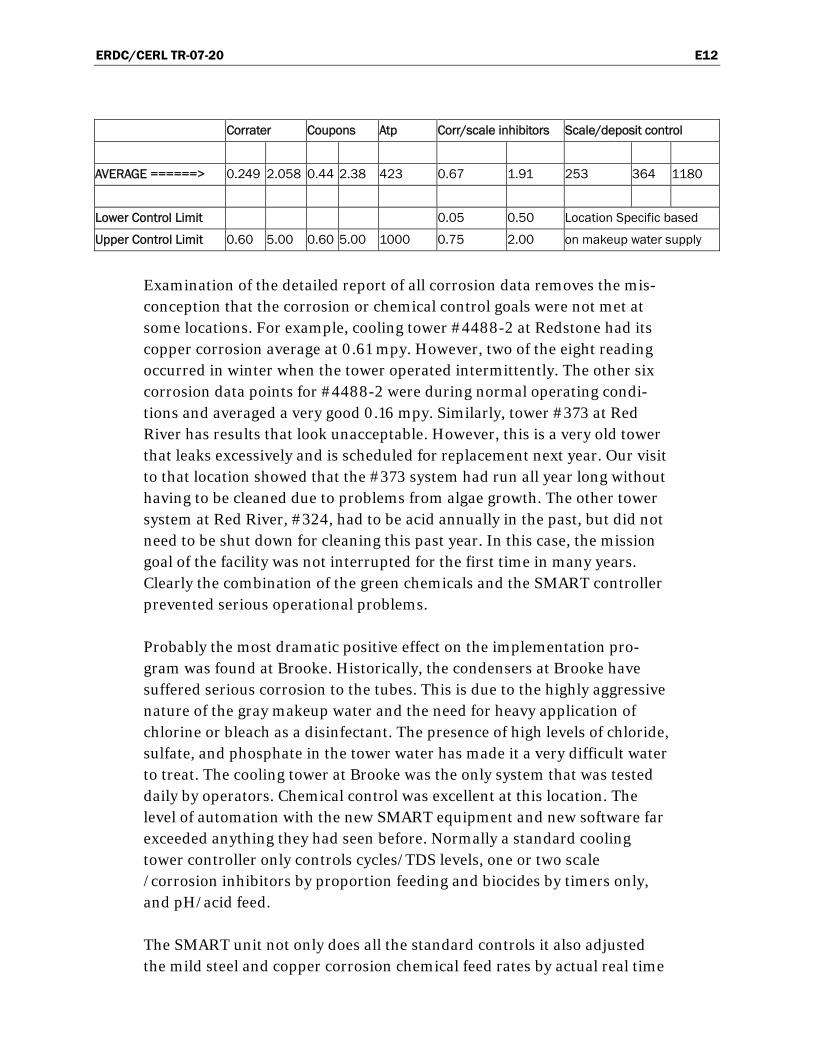
ERDC/CERL TR-07-20 E12
Corrater Coupons Atp Corr/scale inhibitors Scale/deposit control
AVERAGE ======> 0.249 2.058 0.44 2.38 423 0.67 1.91 253 364 1180
Lower Control Limit 0.05 0.50 Location Specific based
Upper Control Limit 0.60 5.00 0.60 5.00 1000 0.75 2.00 on makeup water supply
Examination of the detailed report of all corrosion data removes the mis-conception that the corrosion or chemical control goals were not met at some locations. For example, cooling tower #4488-2 at Redstone had its copper corrosion average at 0.61 mpy. However, two of the eight reading occurred in winter when the tower operated intermittently. The other six corrosion data points for #4488-2 were during normal operating condi-tions and averaged a very good 0.16 mpy. Similarly, tower #373 at Red River has results that look unacceptable. However, this is a very old tower that leaks excessively and is scheduled for replacement next year. Our visit to that location showed that the #373 system had run all year long without having to be cleaned due to problems from algae growth. The other tower system at Red River, #324, had to be acid annually in the past, but did not need to be shut down for cleaning this past year. In this case, the mission goal of the facility was not interrupted for the first time in many years. Clearly the combination of the green chemicals and the SMART controller prevented serious operational problems.
Probably the most dramatic positive effect on the implementation pro-gram was found at Brooke. Historically, the condensers at Brooke have suffered serious corrosion to the tubes. This is due to the highly aggressive nature of the gray makeup water and the need for heavy application of chlorine or bleach as a disinfectant. The presence of high levels of chloride, sulfate, and phosphate in the tower water has made it a very difficult water to treat. The cooling tower at Brooke was the only system that was tested daily by operators. Chemical control was excellent at this location. The level of automation with the new SMART equipment and new software far exceeded anything they had seen before. Normally a standard cooling tower controller only controls cycles/TDS levels, one or two scale /corrosion inhibitors by proportion feeding and biocides by timers only, and pH/acid feed.
The SMART unit not only does all the standard controls it also adjusted the mild steel and copper corrosion chemical feed rates by actual real time
ERDC/CERL TR-07-20 E13
corrosion readings. It also automatically adjusts the free chlorine based on millivolt readings. The combination of all controller functions and the re-sulting performance makes this the most complete water treatment system we have every seen, and it allows for the best overall control we have seen.
It is also important to point out that copper coupons were used throughout the corrosion monitoring process. Copper is a softer metal and will show higher corrosion rates than the alloyed admiralty or copper-nickel tubes that are found in most condensers.
When one looks at the diverse operating locations, cooling equipment, and varying quality waters of this project, it is apparent the combination of the green chemistry and SMART equipment met its objectives.
The operation of the boiler treatment program at Red River Army Depot also yielded impressive results. While the internal chemical treatment of the boilers was not part of the project, the chemicals applied by the con-tractor for that purposed saved the Army considerable money. Prior to the start of the project the boilers were inspected and the insides were found to have heavy scale deposits. The facility has three boilers and to chemi-cally clean them and dispose of the waste would cost around $30K each. The decision was made to run for the next year with the contractor’s chemicals. The following year’s inspection has shown improved conditions and evidence of cleanup. Clean boilers will lower the energy costs at least 10-20%. This was an added side benefit of this program.
The average corrosion rate for steel exposed to condensate was a respect-able 1.58 mpy. Based on Illinois State Water Survey data, the amount of iron being returned to the boilers was usually below 0.9 mg/l and usually much lower. There is an indication of raw water in-leakage into the con-densate on some days. For the most part, the return condensate quality was good. Return line treatment cost was significantly lower.
Cost reporting
This project was funded at $ 2.6 M. The chemical and equipment contrac-tor was funded at $ 881K. Funding of $ 500K was used in support of the Army’s boiler safety inspection program. The balance of $1,219K was used as support services at the five base locations and also for the third party testing and the ROI evaluation.
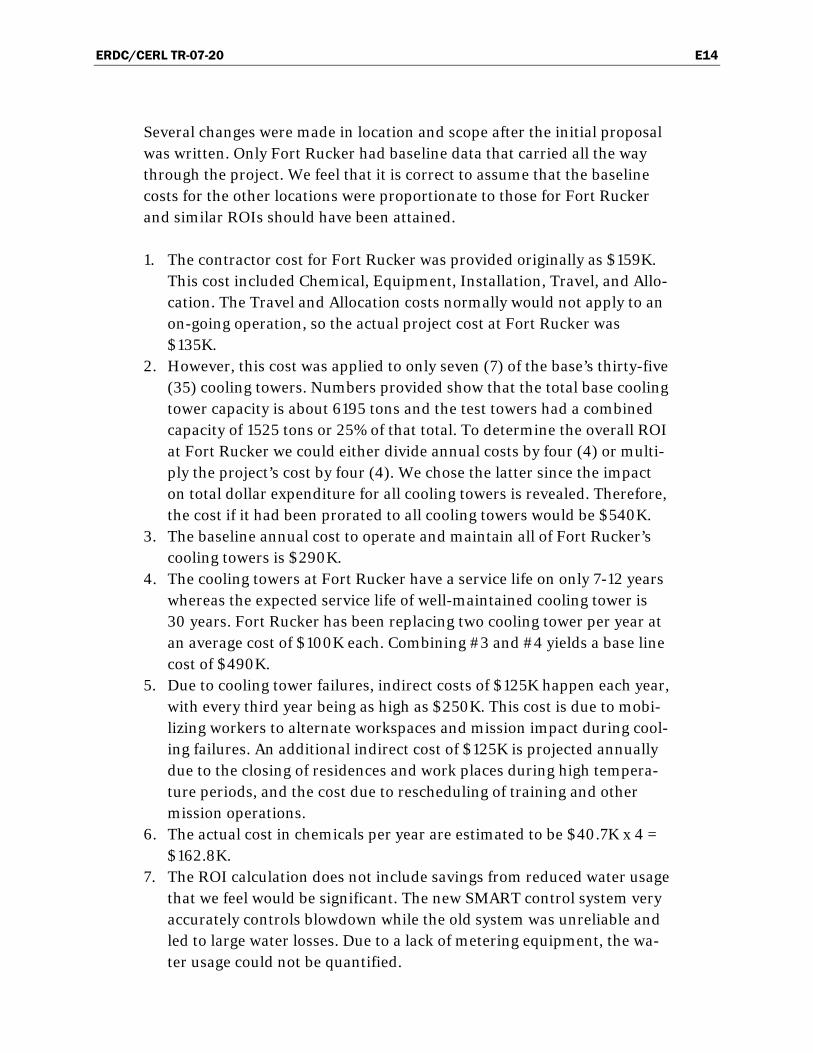
ERDC/CERL TR-07-20 E14
Several changes were made in location and scope after the initial proposal was written. Only Fort Rucker had baseline data that carried all the way through the project. We feel that it is correct to assume that the baseline costs for the other locations were proportionate to those for Fort Rucker and similar ROIs should have been attained.
1. The contractor cost for Fort Rucker was provided originally as $159K. This cost included Chemical, Equipment, Installation, Travel, and Allo-cation. The Travel and Allocation costs normally would not apply to an on-going operation, so the actual project cost at Fort Rucker was $135K.
2. However, this cost was applied to only seven (7) of the base’s thirty-five (35) cooling towers. Numbers provided show that the total base cooling tower capacity is about 6195 tons and the test towers had a combined capacity of 1525 tons or 25% of that total. To determine the overall ROI at Fort Rucker we could either divide annual costs by four (4) or multi-ply the project’s cost by four (4). We chose the latter since the impact on total dollar expenditure for all cooling towers is revealed. Therefore, the cost if it had been prorated to all cooling towers would be $540K.
3. The baseline annual cost to operate and maintain all of Fort Rucker’s cooling towers is $290K.
4. The cooling towers at Fort Rucker have a service life on only 7-12 years whereas the expected service life of well-maintained cooling tower is 30 years. Fort Rucker has been replacing two cooling tower per year at an average cost of $100K each. Combining #3 and #4 yields a base line cost of $490K.
5. Due to cooling tower failures, indirect costs of $125K happen each year, with every third year being as high as $250K. This cost is due to mobi-lizing workers to alternate workspaces and mission impact during cool-ing failures. An additional indirect cost of $125K is projected annually due to the closing of residences and work places during high tempera-ture periods, and the cost due to rescheduling of training and other mission operations.
6. The actual cost in chemicals per year are estimated to be $40.7K x 4 = $162.8K.
7. The ROI calculation does not include savings from reduced water usage that we feel would be significant. The new SMART control system very accurately controls blowdown while the old system was unreliable and led to large water losses. Due to a lack of metering equipment, the wa-ter usage could not be quantified.

ERDC/CERL TR-07-20 E15
8. While the SMART control equipment has a useful life of 20 years, we have projected replacing it every 10 years due to technological obsoles-cence. This will be an additional cost of $95 K in those years.
The implementation of this technology at Fort Rucker was very successful and we calculate a ROI of 13.00. We believe that this ROI will be repeated at the other base locations. All other bases suffered similar problems and have benefited from this new technology.
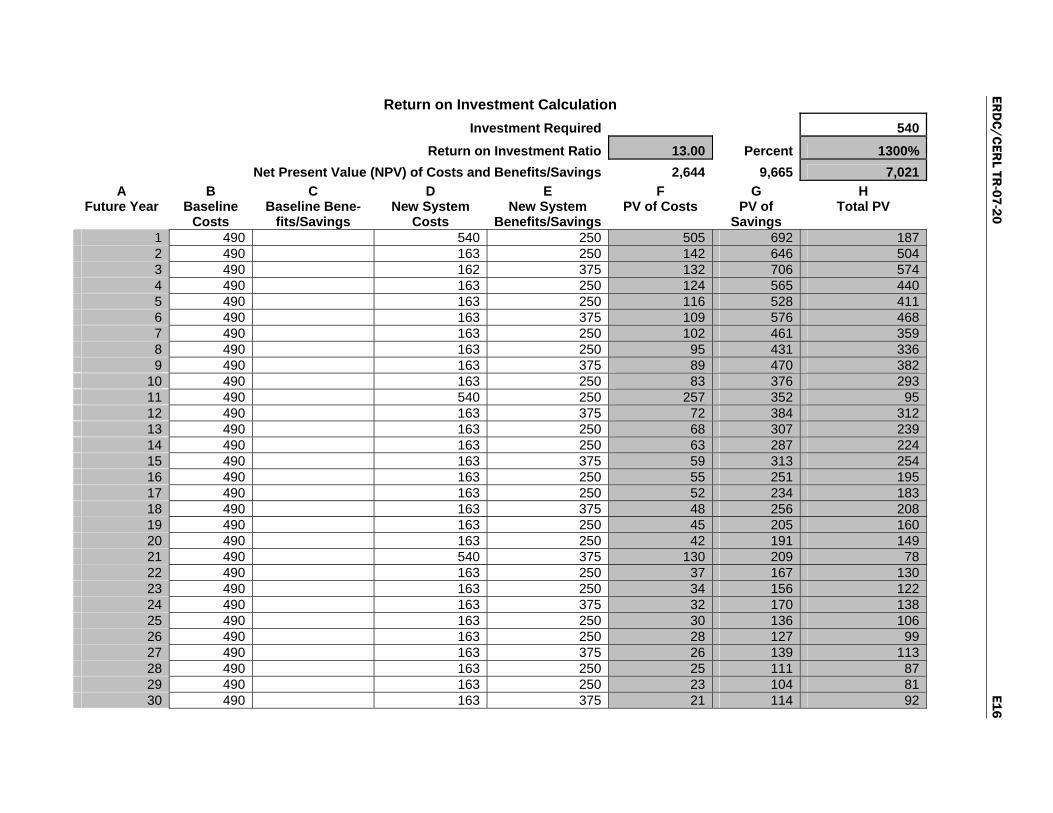
ERD
C/C
ERL TR
-07-20 E16
Return on Investment Calculation Investment Required 540 Return on Investment Ratio 13.00 Percent 1300% Net Present Value (NPV) of Costs and Benefits/Savings 2,644 9,665 7,021
A B C D E F G H Future Year Baseline
Costs Baseline Bene-
fits/Savings New System
Costs New System
Benefits/SavingsPV of Costs PV of
Savings Total PV
1 490 540 250 505 692 1872 490 163 250 142 646 5043 490 162 375 132 706 5744 490 163 250 124 565 4405 490 163 250 116 528 4116 490 163 375 109 576 4687 490 163 250 102 461 3598 490 163 250 95 431 3369 490 163 375 89 470 382
10 490 163 250 83 376 29311 490 540 250 257 352 9512 490 163 375 72 384 31213 490 163 250 68 307 23914 490 163 250 63 287 22415 490 163 375 59 313 25416 490 163 250 55 251 19517 490 163 250 52 234 18318 490 163 375 48 256 20819 490 163 250 45 205 16020 490 163 250 42 191 14921 490 540 375 130 209 7822 490 163 250 37 167 13023 490 163 250 34 156 12224 490 163 375 32 170 13825 490 163 250 30 136 10626 490 163 250 28 127 9927 490 163 375 26 139 11328 490 163 250 25 111 8729 490 163 250 23 104 8130 490 163 375 21 114 92
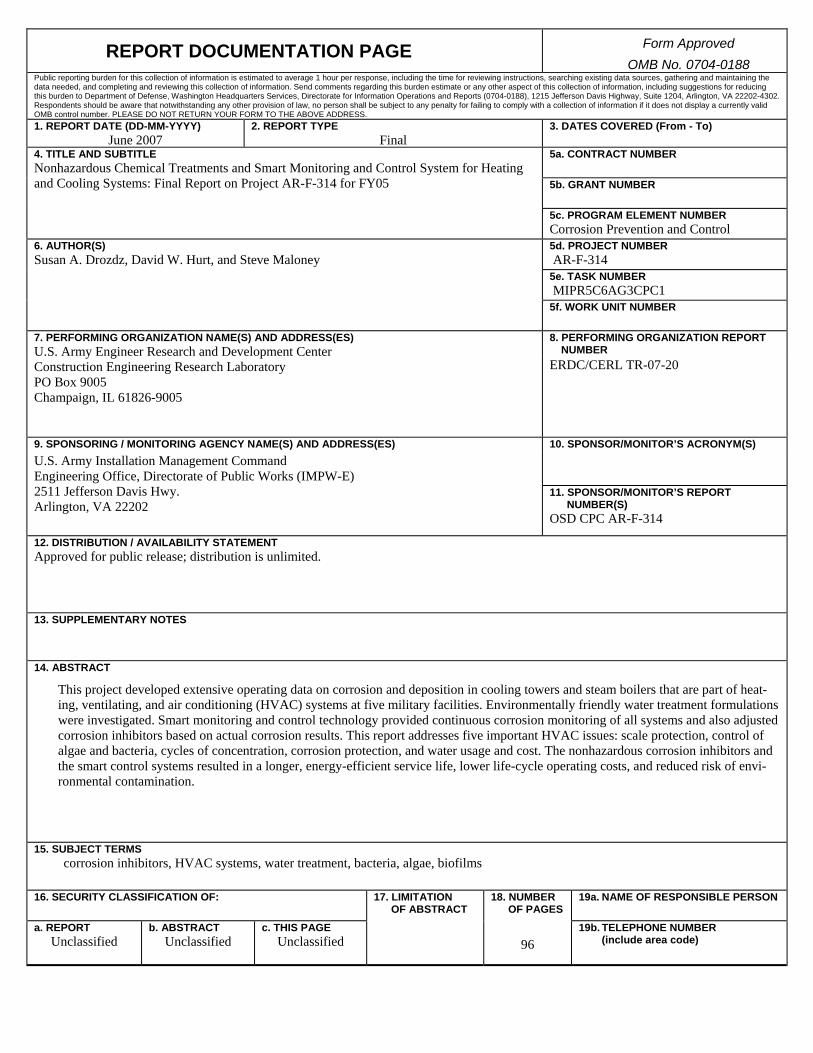
REPORT DOCUMENTATION PAGE Form Approved OMB No. 0704-0188
Public reporting burden for this collection of information is estimated to average 1 hour per response, including the time for reviewing instructions, searching existing data sources, gathering and maintaining the data needed, and completing and reviewing this collection of information. Send comments regarding this burden estimate or any other aspect of this collection of information, including suggestions for reducing this burden to Department of Defense, Washington Headquarters Services, Directorate for Information Operations and Reports (0704-0188), 1215 Jefferson Davis Highway, Suite 1204, Arlington, VA 22202-4302. Respondents should be aware that notwithstanding any other provision of law, no person shall be subject to any penalty for failing to comply with a collection of information if it does not display a currently valid OMB control number. PLEASE DO NOT RETURN YOUR FORM TO THE ABOVE ADDRESS. 1. REPORT DATE (DD-MM-YYYY)
June 2007 2. REPORT TYPE
Final3. DATES COVERED (From - To)
5a. CONTRACT NUMBER 5b. GRANT NUMBER
4. TITLE AND SUBTITLE Nonhazardous Chemical Treatments and Smart Monitoring and Control System for Heating and Cooling Systems: Final Report on Project AR-F-314 for FY05
5c. PROGRAM ELEMENT NUMBER Corrosion Prevention and Control 5d. PROJECT NUMBER AR-F-314 5e. TASK NUMBER MIPR5C6AG3CPC1
6. AUTHOR(S) Susan A. Drozdz, David W. Hurt, and Steve Maloney
5f. WORK UNIT NUMBER 8. PERFORMING ORGANIZATION REPORT
NUMBER 7. PERFORMING ORGANIZATION NAME(S) AND ADDRESS(ES) U.S. Army Engineer Research and Development Center Construction Engineering Research Laboratory PO Box 9005 Champaign, IL 61826-9005
ERDC/CERL TR-07-20
9. SPONSORING / MONITORING AGENCY NAME(S) AND ADDRESS(ES) 10. SPONSOR/MONITOR’S ACRONYM(S) U.S. Army Installation Management Command
Engineering Office, Directorate of Public Works (IMPW-E) 2511 Jefferson Davis Hwy. Arlington, VA 22202
11. SPONSOR/MONITOR’S REPORT NUMBER(S)
OSD CPC AR-F-314
12. DISTRIBUTION / AVAILABILITY STATEMENT Approved for public release; distribution is unlimited.
13. SUPPLEMENTARY NOTES
14. ABSTRACT
This project developed extensive operating data on corrosion and deposition in cooling towers and steam boilers that are part of heat-ing, ventilating, and air conditioning (HVAC) systems at five military facilities. Environmentally friendly water treatment formulations were investigated. Smart monitoring and control technology provided continuous corrosion monitoring of all systems and also adjusted corrosion inhibitors based on actual corrosion results. This report addresses five important HVAC issues: scale protection, control of algae and bacteria, cycles of concentration, corrosion protection, and water usage and cost. The nonhazardous corrosion inhibitors and the smart control systems resulted in a longer, energy-efficient service life, lower life-cycle operating costs, and reduced risk of envi-ronmental contamination.
15. SUBJECT TERMS corrosion inhibitors, HVAC systems, water treatment, bacteria, algae, biofilms 16. SECURITY CLASSIFICATION OF: 17. LIMITATION
OF ABSTRACT 18. NUMBER
OF PAGES 19a. NAME OF RESPONSIBLE PERSON
a. REPORT
Unclassified b. ABSTRACT
Unclassified c. THIS PAGE
Unclassified
96 19b. TELEPHONE NUMBER
(include area code)