Embed Size (px)
Citation preview

ERD
C TR
-09
-8
High Strain-Rate Testing of Mechanical Couplers
Stephen P. Rowell, Clifford E. Grey, Stanley C. Woodson, and Kevin P. Hager
September 2009
Geo
tech
nic
al a
nd
Str
uct
ure
s La
bor
ator
y
Approved for public release; distribution is unlimited.
ERDC TR-09-8 September 2009
High Strain-Rate Testing of Mechanical Couplers
Stephen P. Rowell and Stanley C. Woodson
Geotechnical and Structures Laboratory U.S. Army Engineer Research and Development Center 3909 Halls Ferry Road Vicksburg, MS 39180-6199
Clifford E. Grey
Information Technology Laboratory U.S. Army Engineer Research and Development Center 3909 Halls Ferry Road Vicksburg, MS 39180-6199
Kevin P. Hager
Naval Facilities Engineering Service Center 1100 23rd Avenue, Waterfront Structures Division Port Hueneme, CA 93043
FInal report
Approved for public release; distribution is unlimited.
Prepared for Naval Facilities Engineering Service Center Port Hueneme, CA 93043
ERDC TR-09-8 ii
Abstract: Criteria for designing structures to resist the effects of acciden-tal explosions are defined by Army Technical Manual (TM) 5-1300. These structures are built using steel-reinforced concrete. The current practice of splicing the flexural reinforcing steel is to lap the steel, which often creates a congestion of the steel in floors, walls, and adjoining corners. In 1971, a limited number of types of splices were tested at the U.S. Army Engineer Research and Development Center (ERDC) (formerly Waterways Experi-ment Station) to determine their performance under dynamic load condi-tions. Since then, several types of mechanical couplers have been tested and validated in developing the strength of reinforcing steel for cyclic loading and at strain rates expected during earthquakes. However, no mechanical couplers have been shown to meet the TM 5-1300 require-ments. Therefore, five types of these modern mechanical couplers were selected and tested at the high strain rates expected during structural response to blast loads. This report focuses on the performance of the mechanical couplers at high strain rates.
DISCLAIMER: The contents of this report are not to be used for advertising, publication, or promotional purposes. Citation of trade names does not constitute an official endorsement or approval of the use of such commercial products. All product names and trademarks cited are the property of their respective owners. The findings of this report are not to be construed as an official Department of the Army position unless so designated by other authorized documents. DESTROY THIS REPORT WHEN NO LONGER NEEDED. DO NOT RETURN IT TO THE ORIGINATOR.

ERDC TR-09-8 iii
Contents Figures and Tables..................................................................................................................................v
Preface...................................................................................................................................................vii
Unit Conversion Factors......................................................................................................................viii
1 Introduction..................................................................................................................................... 1 Background .............................................................................................................................. 1 Objective ................................................................................................................................... 3 Approach................................................................................................................................... 3
2 Test Description.............................................................................................................................. 5 Mechanical couplers................................................................................................................ 5
Coupler selection process ........................................................................................................... 5 Mechanical coupler systems....................................................................................................... 6
Concrete reinforcement bars................................................................................................... 7 Experiment setup ..................................................................................................................... 8
Test matrix .................................................................................................................................... 8 200,000-lb dynamic loader......................................................................................................... 9 Instrumentation..........................................................................................................................12
3 Test Results...................................................................................................................................14 As-rolled control specimens...................................................................................................14 Machined reinforcement bar .................................................................................................19 Upset head system.................................................................................................................21
Slow strain rate ..........................................................................................................................21 Intermediate strain rate.............................................................................................................23 Rapid strain rate ........................................................................................................................25
Grouted system ...................................................................................................................... 27 Slow strain rate ..........................................................................................................................27 Intermediate strain rate.............................................................................................................28 Rapid strain rate ........................................................................................................................30
Shear screw system ............................................................................................................... 31 Slow strain rate ..........................................................................................................................31 Intermediate strain rate.............................................................................................................33 Rapid strain rate ........................................................................................................................34
Taper threaded system ..........................................................................................................36 Slow strain rate ..........................................................................................................................36 Intermediate strain rate.............................................................................................................37 Rapid strain rate ........................................................................................................................39
ERDC TR-09-8 iv
Threaded rebar coupler system.............................................................................................40 Slow strain rate ..........................................................................................................................40 Intermediate strain rate.............................................................................................................42 Rapid strain rate ........................................................................................................................43
4 Data Analysis ................................................................................................................................46 As-rolled ASTM 615 Grade 60 control bars ..........................................................................46 Machined ASTM 615 Grade 60 bars.....................................................................................46 As-rolled ASTM 615 Grade 75 control bars .......................................................................... 47 Upset head system.................................................................................................................48 Grouted sleeve coupler system .............................................................................................50 Shear screw coupler system..................................................................................................50 Taper threaded coupler system............................................................................................. 51 Threaded bar coupler system................................................................................................52
5 Summary and Recommendations..............................................................................................53 Summary ................................................................................................................................53 Recommendations .................................................................................................................54
References............................................................................................................................................55
Appendix A: Drawings .........................................................................................................................56
Report Documentation Page

ERDC TR-09-8 v
Figures and Tables
Figures
Figure 1. Flexural and tension steel reinforcement at a wall-to-wall corner. ........................................ 2 Figure 2. Flexural, direct shear, and diagonal shear steel reinforcement. ........................................... 2 Figure 3. Mechanical couplers systems included in the test series...................................................... 7 Figure 4. Machined (left) and as-rolled (right) reinforcement bars. ...................................................... 8 Figure 5. Schematic of 200,000-lb hydraulic dynamic loader............................................................. 10 Figure 6. Three-dimensional view of 200,000-lb loader. ..................................................................... 11 Figure 7. Example of correction on applied load due to inertial effects during rapid-strain rate tests...............................................................................................................................11 Figure 8. Stress vs. strain for AR ASTM 615 Grade 60 steel slow-strain rate specimens.................15 Figure 9. Stress vs. strain for AR ASTM 615 Grade 60 steel intermediate-strain rate specimens.................................................................................................................................................15 Figure 10. Stress vs. strain for AR ASTM 615 Grade 60 steel rapid-strain rate specimens. ............ 16 Figure 11. Stress vs. strain for ART ASTM 615 Grade 75 steel slow-strain rate specimens. ........... 17 Figure 12. Stress vs. strain for ART ASTM 615 Grade 75 steel intermediate-strain rate specimens.................................................................................................................................................18 Figure 13. Stress vs. strain for ART ASTM 615 Grade 75 rapid-strain rate specimens. ...................18 Figure 14. Stress vs. strain for MB ASTM 615 Grade 60 steel slow-strain rate specimens. ............20 Figure 15. Stress vs. strain for MB ASTM 615 Grade 60 steel intermediate-strain rate specimens.................................................................................................................................................20 Figure 16. Stress vs. strain for MB ASTM 615 Grade 60 steel slow-strain rate specimens. ............ 21 Figure 17. Posttest photos of upset head specimens tested at slow strain rate. ..............................22 Figure 18. Stress vs. strain for upset head coupler system at the slow strain rate...........................23 Figure 19. Posttest photos of upset head specimens tested at intermediate strain rate................. 24 Figure 20. Stress vs. strain for upset head coupler system at the intermediate strain rate. ........... 24 Figure 21. Posttest photos of upset head specimens tested at rapid strain rate..............................25 Figure 22. Stress vs. strain for upset head coupler system at the rapid strain rate. ........................26 Figure 23. Posttest photos of grouted sleeve specimens tested at the slow strain rate................... 27 Figure 24. Stress vs. strain for grouted coupler system at the slow strain rate. ................................28 Figure 25. Posttest photos of grouted specimens tested at the intermediate strain rate. ...............29 Figure 26. Stress vs. strain for grouted coupler system at the intermediate strain rate...................29 Figure 27. Posttest photos of grouted specimens tested at the rapid strain rate..............................30 Figure 28. Stress vs. strain for grouted coupler system at the rapid strain rate................................ 31 Figure 29. Posttest photos of shear screw specimens tested at the slow strain rate.......................32 Figure 30. Stress vs. strain for shear screw coupler system at the slow strain rate. ........................32 Figure 31. Posttest photos of shear screw specimens at the intermediate strain rate.....................33 Figure 32. Stress vs. strain for shear screw coupler system at the intermediate strain rate. ..........34
ERDC TR-09-8 vi
Figure 33. Posttest photos of shear screw specimens tested at the rapid strain rate......................35 Figure 34. Stress vs. strain for shear screw coupler system at the rapid strain rate. .......................35 Figure 35. Posttest photos of taper threaded specimens tested at the slow strain rate..................36 Figure 36. Stress vs. strain for taper threaded coupler system at the slow strain rate. ................... 37 Figure 37. Posttest photos of taper threaded specimens tested at intermediate strain rate...........38 Figure 38. Stress vs. strain for taper threaded coupler system at intermediate strain rate.............38 Figure 39. Posttest photos of taper threaded specimens tested at rapid strain rate. ......................39 Figure 40. Stress vs. strain for taper thread coupler system at the rapid strain rate........................40 Figure 41. Posttest photos of threaded bar specimens tested at slow strain rate. ........................... 41 Figure 42. Stress vs. strain for threaded rebar coupler system at the slow strain rate. ................... 41 Figure 43. Posttest photos of threaded bar specimens tested at intermediate strain rate..............42 Figure 44. Stress vs. strain for threaded rebar coupler system at the intermediate rate.................43 Figure 45. Posttest photos of threaded bar specimens tested at rapid strain rate...........................44 Figure 46. Stress vs. strain for threaded rebar coupler system at the rapid strain rate. ..................44
Tables
Table 1. Mechanical coupler experiment matrix. .................................................................................... 8 Table 2. Reinforcement bar experiment matrix....................................................................................... 9 Table 3. Test results from AR ASTM 615 Grade 60 reinforcement bar control specimens. ............. 17 Table 4. Test results from ART ASTM 615 Grade 75 reinforcement bar control specimens. ...........19 Table 5. Test result from MB ASTM 615 Grade 60 steel reinforcement bar specimens...................22 Table 6. Test results of upset head coupler system at slow strain rates. ...........................................23 Table 7. Test results of upset head coupler system at intermediate strain rates...............................25 Table 8. Test results of upset head coupler system at rapid strain rates. ..........................................26 Table 9. Test results of grouted coupler system at slow strain rates. .................................................28 Table 10. Test results of grouted coupler system at intermediate strain rates. .................................30 Table 11. Test results of grouted coupler system at rapid strain rates. .............................................. 31 Table 12. Test results of shear screw coupler system at slow strain rates.........................................33 Table 13. Test results of shear screw coupler system at intermediate strain rates. .........................34 Table 14. Test results of shear screw coupler system at rapid strain rates........................................36 Table 15. Test results of taper threaded coupler system at slow strain rates.................................... 37 Table 16. Tests results of taper threaded coupler system at intermediate strain rates....................39 Table 17. Test results of taper thread coupler system at rapid strain rates. ......................................40 Table 18. Test results of threaded rebar coupler system at slow strain rates. ..................................42 Table 19. Test results of threaded rebar coupler system at intermediate strain rates. ....................43 Table 20. Test results of threaded rebar coupler system at rapid strain rates. .................................45 Table 21. Application of DIFs to ASTM 615 Grade 60 as-rolled control bars. ....................................46 Table 22. Application of DIF's to ASTM 615 Grade 60 machined bars............................................... 47 Table 23. Comparison of test results for ASTM 615 Grade 60 and Grade75 control bars. ............. 47 Table 24. Percent of response of mechanical coupler system compared to response of as-rolled control bars. ..........................................................................................................................49

ERDC TR-09-8 vii
Preface
The study reported herein was performed by staff members of the Struc-tural Mechanics Branch (SMB) and the Research Group of the Geosciences and Structures Division (GSD), Geotechnical and Structures Laboratory (GSL), U.S. Army Engineer Research and Development Center (ERDC), along with personnel of the Sensors, Measurements, and Instrumentation Branch (SMI), Computational Science and Engineering Division (CSE), ERDC Information and Technology Laboratory (ITL). The investigation was sponsored by the Naval Facilities Engineering Service Center, Water-front Structures Division (WSD). Kevin Hager was the WSD Project Engi-neer.
The Principal Investigator for this study was Stephen P. Rowell, GSD. Clifford E. Grey supervised all instrumentation and data collection. Dr. Stanley C. Woodson served as the technical subject matter expert. Frank D. Dallriva was Chief, SMB; Dr. Robert L. Hall was Chief, GSD; Dr. William P. Grogan was Deputy Director, GSL; and Dr. David W. Pittman was Director, GSL. Bruce C. Barker was Chief, SMI; Dr. Robert M. Wallace was Chief, CSE; Dr. Deborah F. Dent was Deputy Director, ITL; and Dr. Reed L. Mosher was Director, ITL.
COL Gary E. Johnston was Commander and Executive Director of ERDC. Dr. James R. Houston was Director.
ERDC TR-09-8 viii
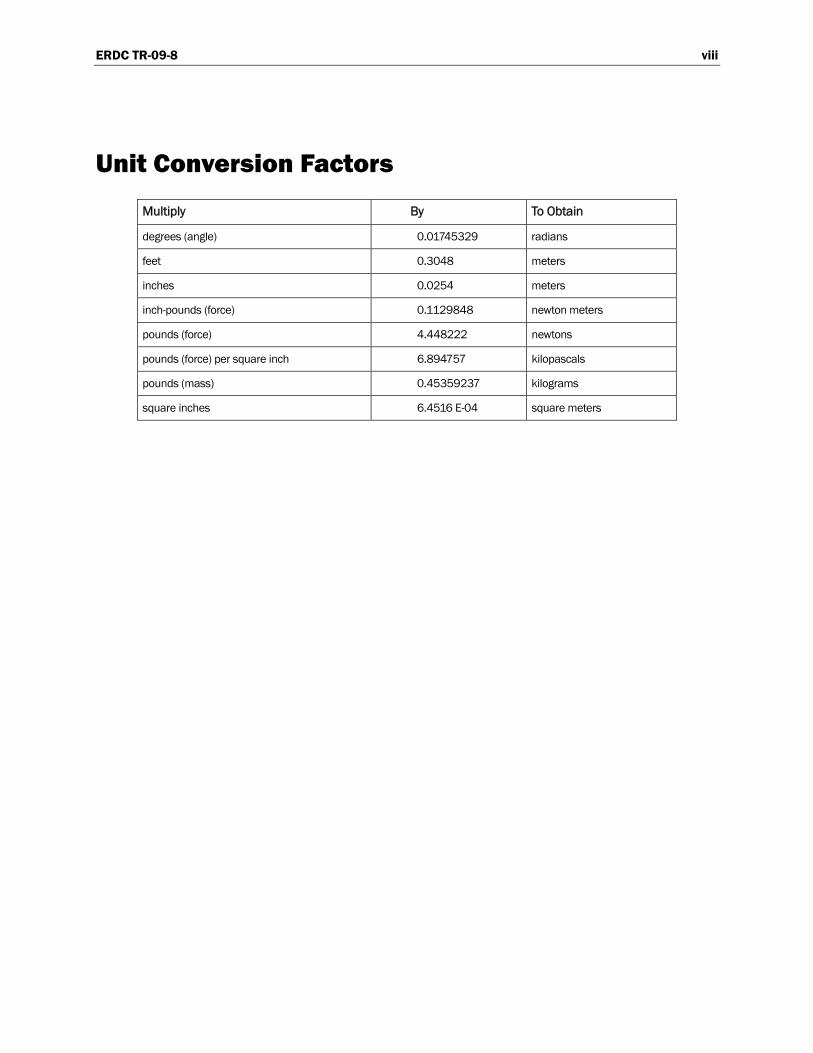
Unit Conversion Factors
Multiply By To Obtain
degrees (angle) 0.01745329 radians
feet 0.3048 meters
inches 0.0254 meters
inch-pounds (force) 0.1129848 newton meters
pounds (force) 4.448222 newtons
pounds (force) per square inch 6.894757 kilopascals
pounds (mass) 0.45359237 kilograms
square inches 6.4516 E-04 square meters
ERDC TR-09-8 1
1 Introduction
Background
Based on new security requirements, ordnance storage and maintenance facilities must be hardened and buried. Depending on the operational requirements, the cost of construction for modifying ordnance facilities may vary significantly. The total infrastructure cost for new construction and facility modification to support the Department of Defense will exceed $1 billion dollars. New facilities include magazines for long-term storage of ordnance and operational facilities for periodic inspection, maintenance, and life-extension of different weapons systems.
These facilities will be constructed using reinforced concrete to resist physical security threats and the effects of internal and external explo-sions. Department of the Army criteria for designing structures to resist the effects of accidental explosions or conventional weapons are defined by Technical Manual (TM) 5-1300 (Department of the Army et al. 1990) and TM 5-855-1 (Department of the Army et al. 1998), respectively. For accidental explosions, TM 5-1300 defines design methods applied to facili-ties used in the production, storage, and maintenance of ordnance and explosive materials. For conventional weapons effects, TM 5-855-1 defines design criteria for fixed, hardened structures.
Economic design of blast-resistant, reinforced concrete structures typically allows plastic deformations of the structural elements, which develops the ultimate strength and ductility of the steel reinforcement. Typical design details recommended in TM 5-1300 and TM 5-855-1 result in congestion of steel in slabs and beams and at corners. This congestion increases con-struction costs and difficulty in placing concrete between steel reinforce-ment bars. Figure 1 shows flexural and tension reinforcement at the corner between two walls. Standard hooks used to develop the strength of the flexural steel are also shown. Figure 2 shows flexural, diagonal shear, and direct shear reinforcement at the corner between a floor slab and a wall. Both figures illustrate the congestion of reinforcement at corners.

ERDC TR-09-8 2
Figure 1. Flexural and tension steel reinforcement at a wall-to-wall corner.
Figure 2. Flexural, direct shear, and diagonal shear steel reinforcement.
TM 5-1300 allows the use of mechanical couplers to splice flexural steel reinforcement. However, the mechanical coupler must develop the ulti-mate dynamic tensile strength and ductility of the steel reinforcement. High strain-rate tension tests of the splice must be conducted to validate the performance of the splice. TM 5-855-1 allows the use of mechanical

ERDC TR-09-8 3
couplers if the dynamic response of steel reinforcement to blast loads remains elastic.
In 1971, Cadweld, Thermite, and butt-welded splices were tested (Flathau 1971). Number 11 (1-3/8-in. diameter) reinforcing steel bars were tested at strain rates ranging from 0.05 to 3.0 sec-1. Based on these tests, Cadweld and Thermite splices may be used in blast-resistant structures.
For structures in high seismic regions, mechanical couplers were devel-oped to solve problems with steel congestion. Several manufacturers offer couplers that were tested and validated to develop the strength of reinforc-ing steel for cyclic loading and strain rates expected during earthquakes. However, no tests of these new mechanical couplers loaded at the high strain rates expected during blast loads have been documented. In addi-tion, no open test standard has been developed for industry to test candi-date splicing systems. Any open standard should provide a low-cost and rapid method for validating the behavior of mechanical splices at high strain rates.
Objective
The primary objective of the research reported herein was to measure the performance of mechanical couplers for splicing flexural reinforcing steel when stressed at high strain rates. Results of the testing may qualify com-mercially available mechanical couplers for use in blast-hardened struc-tures. The secondary objective was to develop and document a preliminary open-source test procedure for testing mechanical couplers subjected to high strain-rate load conditions. This procedure will allow commercial vendors to test their products according to a defined standard and will be documented in a separate, companion report.
Approach
The U.S. Army Engineer Research and Development Center (ERDC) con-ducted a series of high strain-rate tests on five types of mechanical cou-plers used for splicing flexural reinforcing steel. Each coupler system was tested at three strain rates. For each mechanical coupler and strain-rate combination, three specimens were tested to develop average properties defining the strength and ductility of the coupler system. A total of 45 tests were performed.

ERDC TR-09-8 4
A 200,000-lb dynamic loader (Huff 1969) was used to apply the required load at slow, intermediate, and rapid strain rates. The strain rates achieved were between 0.001 and 3.5 sec-1.

ERDC TR-09-8 5
2 Test Description
Three series of experiments were conducted in this study. The first and second series consisted of basic reinforcement bar material property tests in which the bars were tested in both the “machined” and “as-rolled” condition. The third series of experiments consisted of testing the mechanical couplers installed on the reinforcing bars. All test specimens were pulled in the vertical position.
The experimental parameters for the first two series of experiments were the condition of the reinforcement bar (as-rolled or machined) and the dynamic load condition (strain rate). The experimental parameters for the third series of experiments were the type of mechanical coupler and dynamic load condition (strain rate). These parameters are discussed in the following sections.
Mechanical couplers
Coupler selection process
American Concrete Institute (ACI) standard 439.3R-07 (ACI 2007) was used as a guide for selecting five types of mechanical couplers. Table 2.1 of that standard provides a list of the types of mechanical couplers available in the market today. The couplers listed in the table are suitable for ten-sion and compression applications for both type 1 and type 2 connections using ASTM A615 Grade 60 reinforcement bar under ACI standard 318-02 (ACI 2002). ACI 439.3R-07 states that the ACI 318 type 1 connections are used in elements where there is little concern for inelastic deformations and elevated tensile stresses from seismic events. ACI 318 type 2 connec-tions have demonstrated, through accepted industry testing, the ability to develop the specified tensile strength of the spliced bars for resistance to elevated tensile stresses. Only ACI 318 type 2 mechanical connectors were selected for this series of tests.
Using Table 2.1 (ACI 2007) to further narrow the selection, couplers that were shown to provide versatility in the categories of application and suit-ability were selected. Four types of couplers were initially selected:
Cold-swaged-steel coupling sleeve.
ERDC TR-09-8 6
Grout-filled coupling sleeve. Shear-screw and wedge coupling sleeve. Upset-bar and coupling sleeve with straight threads.
Other selection criteria were based on the ease of use and the selection of distinctly different couplers to provide a good cross section of applications and installation processes. The upset-bar type was selected over the cold-swaged type after review of its application in another government con-tainment facility, and the specific application warrants further investiga-tion. The sponsor selected and added a taper-threaded coupler system and a coupler system for thread-like deformed reinforcement bars to the experiment series. The final couplers selected for this series of experi-ments were the following:
Upset-bar and coupling sleeve with straight threads. Grout-filled coupling sleeve. Shear-screw coupling sleeve. Taper-threaded system. Thread-like deformed reinforcement bar coupler system.
Mechanical coupler systems
The criteria for selection of the couplers to be tested consisted of the cou-pler’s prior approval for seismic use and its ease of installation. The types selected for this study are generally categorized as “taper-thread,” “upset,” “grouted,” “shear screw,” and “rebar thread.” These systems provide a good representation of the types of couplers commonly available and in use today.
Illustrated in Figure 3 (from left to right) and described below are the five couplers:
Taper-threaded system: consists of tapered threads on each end of the rebar along with a male/female threaded coupler to form the connection between the two ends of the rebar.
Upset-head system: an “upset” system that uses a formed head on each end of the rebar along with a male/female threaded coupler.
Grouted-sleeve system: uses a sleeve in which the two ends of the rebar are “grouted” into the sleeve to make the connection.

ERDC TR-09-8 7
Figure 3. Mechanical couplers systems included in the test series.
Shear-screw system: consists of a wedge-shaped coupling sleeve and “shear screws” to form the connection between the two ends of the rebar.
Threaded-rebar system: consists of rebar with rolled-on deformations with a similar thread profile to that of a stub-acme thread. The coupler sleeve has matching internal threads and is locked in place with two similar threaded nuts at each end.
“Machine shop” and assembly drawings of these coupler systems are presented in Appendix A.
Concrete reinforcement bars
ASTM A615 Grade 60, Number 10, deformed reinforcement bars were tested at full size (as-rolled) to determine the ultimate dynamic load strength of the bar. The reinforcing bars were also machined to a standard “dog bone” shape and tested to determine the ultimate dynamic tensile strength of the bar for comparison with the static tensile strength from mill certifications and material test reports provided by the reinforcement bar manufacturer. Figure 4 shows the machined specimens in the left photo and the as-rolled reinforcement specimens in the photo to the right. Both are shown with their respective grip systems. All Grade 60 reinforce-ment bar tested was from the same lot and manufacturer. “Machine shop” drawings of the as-rolled and machined test specimens are presented in Appendix A.
Taper Thread Upset Head Grouted Sleeve Shear Screw Threaded BarTaper Thread Upset Head Grouted Sleeve Shear Screw Threaded Bar

ERDC TR-09-8 8
Figure 4. Machined (left) and as-rolled (right) reinforcement bars.
ASTM A615 Grade 75, Number 10, threaded deformed reinforcement bars were also tested at full size (as-rolled) to determine the ultimate dynamic load strength of the bar. All Grade 75 reinforcement bar tested was from the same lot and manufacturer. The ASTM A615 Grade 75 machined specimens were not tested in this series of experiments.
Experiment setup
Test matrix
Five types of mechanical couplers were tested in this test series and were identified as MC-1 through MC-5. Each coupler was subjected to three strain rates, and three couplers were tested for each type of coupler at each strain rate. The experiment matrix was designed based on prior experi-ments performed by William J. Flathau (Flathau 1971). The coupler test matrix is provided as Table 1.
Table 1. Mechanical coupler experiment matrix.
Coupler Identifier
Coupler Type
Number of Slow-Rate Tests
Number of Intermediate- Rate Tests
Number of Rapid-Rate Tests
MC-1 Upset 3 3 3
MC-2 Grouted 3 3 3
MC-3 Screwed 3 3 3
MC-4 Taper thread 3 3 3
MC-5 Threaded rebar 3 3 3
The ASTM A615 Grade 60 reinforcement bars were tested in two conditions, i.e., as-rolled and machined. The ASTM A615 Grade 75

ERDC TR-09-8 9
reinforcement bars were tested only in the as-rolled condition. Each condition of the reinforcement bar was subjected to three strain rates. The reinforcement bar test matrix is provided as Table 2.
Table 2. Reinforcement bar experiment matrix.
Reinforcement Bar
Reinforcement Bar Condition
Number of Slow-Rate Tests
Number of Intermediate- Rate Tests
Number of Rapid-Rate Tests
RB-1 (Grade 60)
As-rolled, deformed 3 3 3
RB-3 (Grade 60)
Machined, deformed 3 3 3
RB-4 (Grade 75)
As–rolled, threaded deformed
3 3 3
200,000-lb dynamic loader
The dynamic loader (Figures 5 and 6) is a device capable of applying a con-centrated load in short times over a maximum stroke of 6 in. This loader has the capability to test structural shapes with loading rates varying from slow static loads to those at which the maximum load is reached in very few milliseconds. The applied loads can be varied from 10,000 to 200,000 lb in either tension or compression. The design of the device is such that loads as high as 400,000 lb may be possible; however, the maximum load capacity of the device is dependent on the use to which it is subjected.
The maximum time required to develop a specific load is affected by many variables, including piston location, magnitude of load, response of resist-ing test specimen, and characteristics of the control valves, etc. Therefore, the rise-time characteristics of the loader are a function of the test condi-tion. A minimum rise time of 1.3 msec for a load in excess of 200,000 lb with approximately 1/4-in. movement of the piston has been obtained with the device.
For the tests documented herein, the loader was configured to allow slow, intermediate, and rapid strain rates as required by the sponsor. These
ERDC TR-09-8 10
Figure 5. Schematic of 200,000-lb hydraulic dynamic loader.
strain rates ranged from 0.001 sec-1 to 3.5 sec-1. The loader was calibrated by pulling several machined rebar specimens at each expected strain rate.
Rapidly applied loads may have an inertial force component that should be accounted for when determining the actual applied load on the specimen. This inertial force is due to the acceleration of the large masses associated with the loading system. The rapid strain-rate experiments required load corrections due to the inertial effects of the acceleration of the mass of the reinforcement bar, the mechanical coupler, and the gripping system of the loader.
Figure 7 shows the significant correction to the load at the rapid rate of strain. The correction is easily applied using a data plotting program to add the uncorrected curve (shown in black in Figure 7) to the inertia correction load (shown in red). This correction provides the final load curve (shown in green), which represents the actual applied load on the test specimen.
TENSION RAM DIRECTION
EXPANSION TANK
PRESSURE TANKSLOAD CELL DATA CABLE
LOWER GRIP
TEST SET UP
LOWER ADJUSTMENT
LOAD CELL
SOLENOID VALVE
UPPER ADJUSTEMENT
TEST SPECIMEN
LOADER TOWER
UPPER GRIP

ERDC TR-09-8 11
Figure 6. Three-dimensional view of 200,000-lb loader.
Figure 7. Example of correction on applied load due to inertial effects during rapid-strain rate tests.

ERDC TR-09-8 12
Instrumentation
Acceleration, coupler and rebar strain, applied load, and load duration were recorded during each test. An accelerometer was hard-mounted to both the upper and lower loader grips for the purpose of recording acceleration time-histories. Four strain gages were installed on the reinforcing bar to record longitudinal rebar strains on each side of the bar. Up to four strain gages, depending on the type of coupler being tested, were installed on each mechanical coupler to record longitudinal coupler strains. Two load cells, one upper and one lower, were used to record the reactive and applied loads, respectively.
Load cells
The load cells were made from 4130 quench and tempered steel with a minimum yield strength of 100,000 psi and a maximum capacity of greater than 200,000 lb. The load cells were capable of measuring both the applied and reaction forces during the test. The load cells were attached to the loader grips at each end of the test specimen, and then to the loader tower at the top end and to the loader ram at the bottom end. Four strain gages were attached 90 deg apart to measure the longitudinal and circumferential strains. These gages were connected electronically to form a Wheatstone bridge. This configuration allowed the net contribution to remain positive whether the load is in tension or compression. Each load cell was calibrated before the test series.
Strain gages
Reinforcing-bar strains were measured using Model CEA-06-062-350-UW 1/16-in. strain gages from Measurements Group. Four strain gages were mounted in the longitudinal direction between the bar deformations as close to 90 deg apart as possible. (See location SG1 in top view of Fig-ures A1–A6,) For the tensile strength property on the machined bar, three sets of gages (SG3, SG2, and SG4) were mounted, as shown in the bottom view of Figure A1.
Coupler strains were measured using similar 1/4-in. strain gages placed on the outside of the couplers 180 deg apart. The upset-head, taper-threaded, and threaded-bar couplers had two gages placed along the length of the coupler at the thinnest part of the coupler wall (location SG2 in Fig-ures A2, A5, and A6). The shear screw had two sets (locations SG2 and

ERDC TR-09-8 13
SG3 in Figure A4) and the grouted couplers had three sets (locations SG2, SG3, and SG4 in Figure A3) of two gages mounted in the longitudinal direction 180 deg apart on the outside of the coupler equally spaced from the ends of the coupler.
Accelerometers
Endevco Model 7270A accelerometers were used to determine the acceleration time-histories of the mass of the grips at the end of the bar for monitoring inertial effects. The accelerometers were hard-mounted to 1-in. steel blocks that were in turn mounted to the sides of the upper and lower grips.
High-speed photography
A high-speed, 10,000-fps digital camera was used to record the tests and capture the displacement histories at multiple locations, allowing the com-putation of strain on the test specimens past the capacity of the strain gages. A regular digital/video camera was used to record an overall view of selected experiments during the test series. Still photographs and video were also obtained during the construction, test preparation, test execu-tion, and posttest disassembly.

ERDC TR-09-8 14
3 Test Results
Comparison of the performance of the control specimen and performance of the selected mechanical couplers must be made to determine if the criteria given in Section 4-21.8 of TM 5-1300 (Department of Army 1990) was achieved. This criteria states that devices for mechanical splices of reinforcement may be used for end anchorage and splices in reinforcement if they are capable of developing the ultimate dynamic tensile strength of the reinforcement without reducing its ductility.
To determine the adequacy of these devices, a control specimen was first tested to determine the dynamic material properties of the reinforcement material at the desired strain rate under which the selected couplers would be subjected. The coupler systems were then tested at the same strain rate and in the same manner in which the control specimen was tested. The data collected from the results of each of the two test series were then compared.
Several failures occurred in the rebar at the location of the strain gages. It is possible that failure occurred at this location because a minute amount of material had been removed from the bar to provide a clean and smooth bonding surface for the strain gages. It is also possible that this affected the ultimate dynamic strengths of the specimens. However, the overall results are considered to be valid because both the control specimens and the coupler specimens were prepared for strain gages in the same location, manner, and procedure.
As-rolled control specimens
Two types of as-rolled (AR) reinforcement bars were tested. The first type of reinforcement bar was ASTM 615 Grade 60. This type was used in all tests except for the threaded rebar system (MC-5 and RB-4) series of tests. The second type was ASTM 615 Grade 75. Testing of the second type was required because the MC-5 coupler system required a special threaded rebar that was available only in Grade 75. Figures 8–10 show the test results of the ASTM 615 Grade 60 tests at the slow, intermediate, and rapid strain rates, respectively.
ERDC TR-09-8 15
Figure 8. Stress vs. strain for AR ASTM 615 Grade 60 steel slow-strain rate specimens.
Figure 9. Stress vs. strain for AR ASTM 615 Grade 60 steel intermediate-strain rate specimens.
ERDC TR-09-8 16
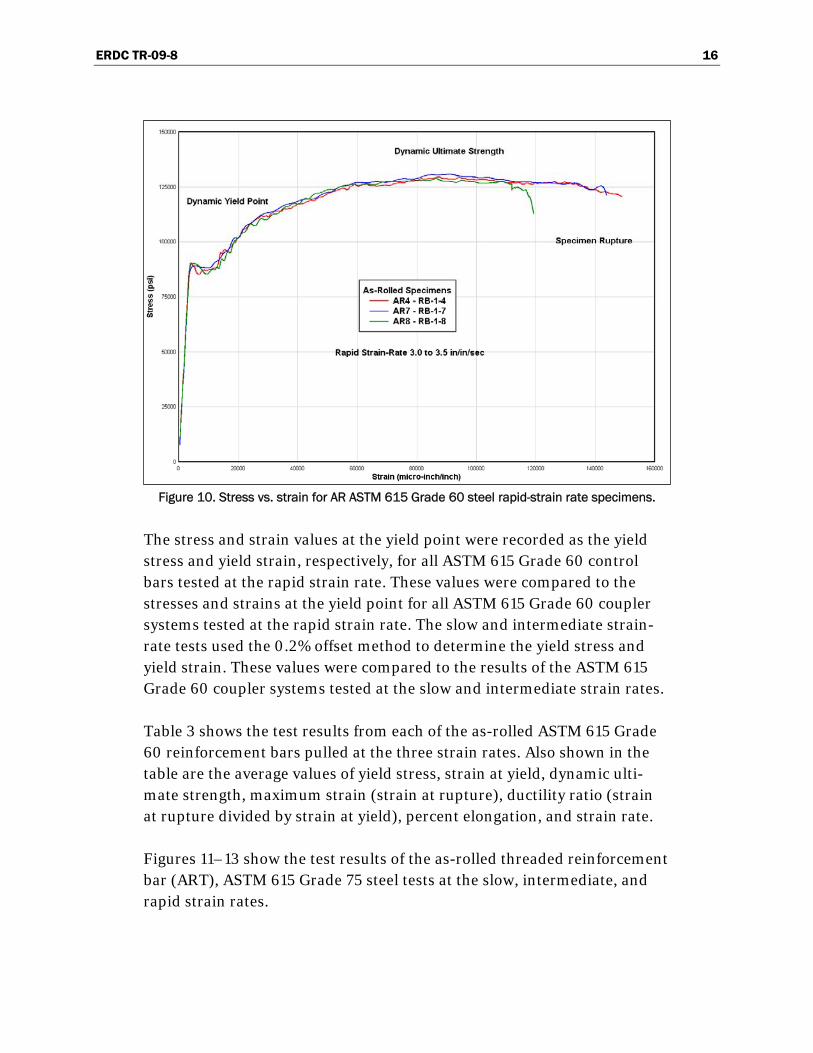
Figure 10. Stress vs. strain for AR ASTM 615 Grade 60 steel rapid-strain rate specimens.
The stress and strain values at the yield point were recorded as the yield stress and yield strain, respectively, for all ASTM 615 Grade 60 control bars tested at the rapid strain rate. These values were compared to the stresses and strains at the yield point for all ASTM 615 Grade 60 coupler systems tested at the rapid strain rate. The slow and intermediate strain-rate tests used the 0.2% offset method to determine the yield stress and yield strain. These values were compared to the results of the ASTM 615 Grade 60 coupler systems tested at the slow and intermediate strain rates.
Table 3 shows the test results from each of the as-rolled ASTM 615 Grade 60 reinforcement bars pulled at the three strain rates. Also shown in the table are the average values of yield stress, strain at yield, dynamic ulti-mate strength, maximum strain (strain at rupture), ductility ratio (strain at rupture divided by strain at yield), percent elongation, and strain rate.
Figures 11–13 show the test results of the as-rolled threaded reinforcement bar (ART), ASTM 615 Grade 75 steel tests at the slow, intermediate, and rapid strain rates.

ERDC TR-09-8 17
Table 3. Test results from AR ASTM 615 Grade 60 reinforcement bar control specimens.
Specimen Name
Specimen Number
Yield Stress (psi)
Yield Strain (μin./in.)
Dynamic Ultimate Strength (psi)
Maximum Strain (μin./in.)
Ductility Ratio
Elongation %
Strain Rate (in./in./sec)
AR6 RB-1-6 69,800 5,100 118,100 105,100 20.7 10.5 0.0035
AR11 RB-1-11 71,900 5,400 116,700 92,800 17.1 9.3 0.0039
AR12 RB-1-12 70,600 5,100 117,000 104,300 20.3 10.4 0.00037
AR-Slow Average 70,800 5,200 117,000 100,800 19.4 10.1 0.0037
AR5 RB-1-5 72,600 5,200 119,800 118,000 22.7 11.8 0.060
AR9 RB-1-9 ----- ----- ----- ----- ----- ----- -----
AR10 RB-1-10 77,000 5,400 119,200 92,000 17.0 9.2 0.068
AR-Inter Average 74,800 5,300 119,500 105,000 19.9 10.5 0.064
AR4 RB-1-4 90,400 4,100 129,500 149,000 36.3 14.9 3.3
AR7 RB-1-7 89,000 5,400 130,700 144,000 26.7 14.4 3.2
AR8 RB-1-8 90,000 4,700 128,700 120,000 25.5 12.0 3.1
AR-Rapid Average 89,800 4,700 129,600 138,000 29.5 13.8 3.2
Figure 11. Stress vs. strain for ART ASTM 615 Grade 75 steel slow-strain rate specimens.
ERDC TR-09-8 18
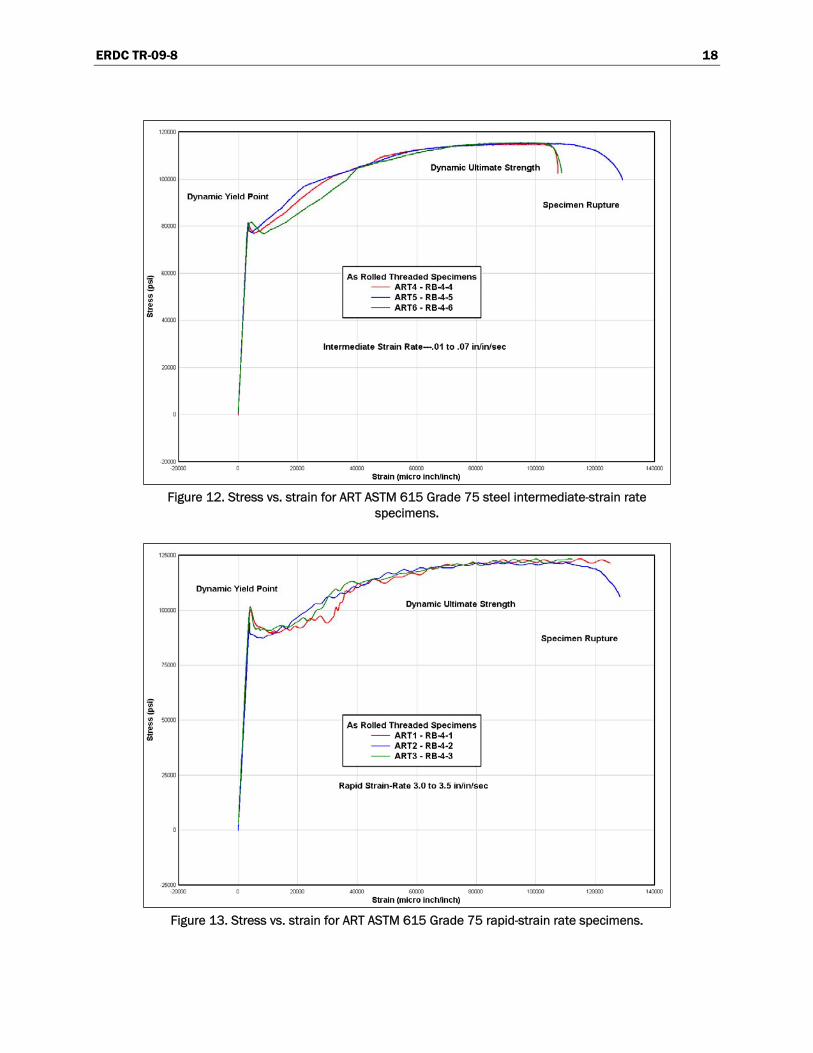
Figure 12. Stress vs. strain for ART ASTM 615 Grade 75 steel intermediate-strain rate specimens.
Figure 13. Stress vs. strain for ART ASTM 615 Grade 75 rapid-strain rate specimens.
ERDC TR-09-8 19
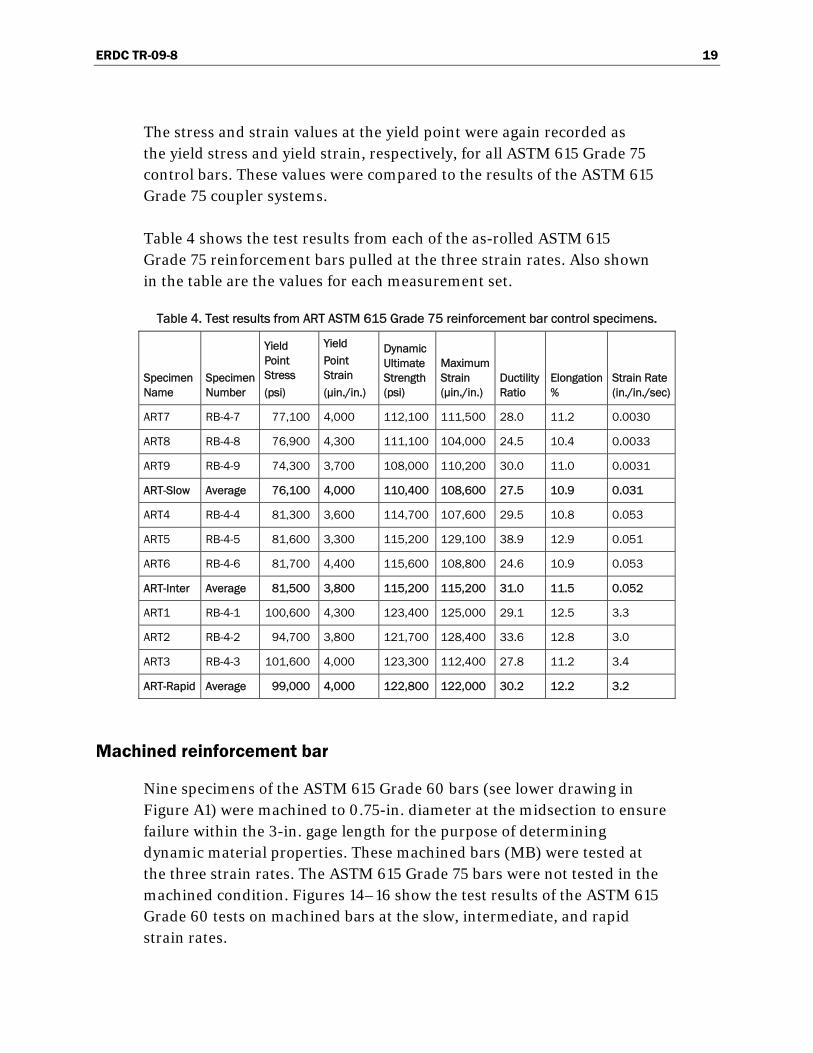
The stress and strain values at the yield point were again recorded as the yield stress and yield strain, respectively, for all ASTM 615 Grade 75 control bars. These values were compared to the results of the ASTM 615 Grade 75 coupler systems.
Table 4 shows the test results from each of the as-rolled ASTM 615 Grade 75 reinforcement bars pulled at the three strain rates. Also shown in the table are the values for each measurement set.
Table 4. Test results from ART ASTM 615 Grade 75 reinforcement bar control specimens.
Specimen Name
Specimen Number
Yield Point Stress (psi)
Yield Point Strain (μin./in.)
Dynamic Ultimate Strength (psi)
Maximum Strain (μin./in.)
Ductility Ratio
Elongation %
Strain Rate (in./in./sec)
ART7 RB-4-7 77,100 4,000 112,100 111,500 28.0 11.2 0.0030
ART8 RB-4-8 76,900 4,300 111,100 104,000 24.5 10.4 0.0033
ART9 RB-4-9 74,300 3,700 108,000 110,200 30.0 11.0 0.0031
ART-Slow Average 76,100 4,000 110,400 108,600 27.5 10.9 0.031
ART4 RB-4-4 81,300 3,600 114,700 107,600 29.5 10.8 0.053
ART5 RB-4-5 81,600 3,300 115,200 129,100 38.9 12.9 0.051
ART6 RB-4-6 81,700 4,400 115,600 108,800 24.6 10.9 0.053
ART-Inter Average 81,500 3,800 115,200 115,200 31.0 11.5 0.052
ART1 RB-4-1 100,600 4,300 123,400 125,000 29.1 12.5 3.3
ART2 RB-4-2 94,700 3,800 121,700 128,400 33.6 12.8 3.0
ART3 RB-4-3 101,600 4,000 123,300 112,400 27.8 11.2 3.4
ART-Rapid Average 99,000 4,000 122,800 122,000 30.2 12.2 3.2
Machined reinforcement bar
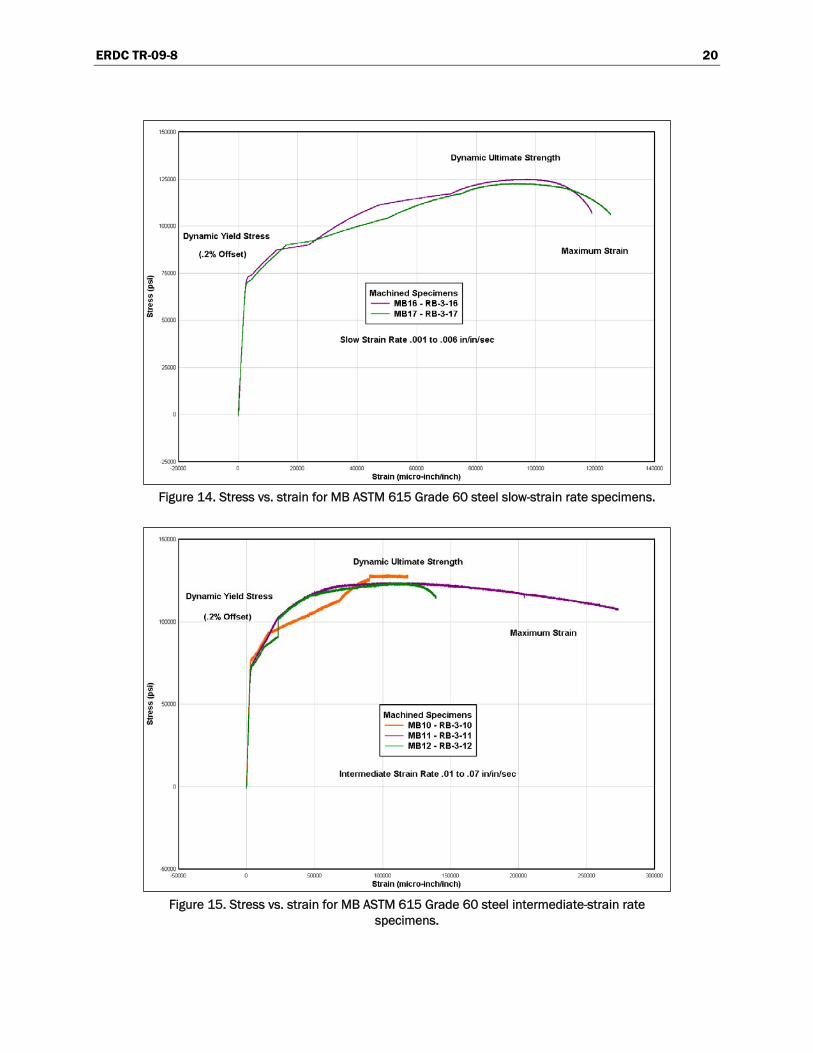
Nine specimens of the ASTM 615 Grade 60 bars (see lower drawing in Figure A1) were machined to 0.75-in. diameter at the midsection to ensure failure within the 3-in. gage length for the purpose of determining dynamic material properties. These machined bars (MB) were tested at the three strain rates. The ASTM 615 Grade 75 bars were not tested in the machined condition. Figures 14–16 show the test results of the ASTM 615 Grade 60 tests on machined bars at the slow, intermediate, and rapid strain rates.
ERDC TR-09-8 20
Figure 14. Stress vs. strain for MB ASTM 615 Grade 60 steel slow-strain rate specimens.
Figure 15. Stress vs. strain for MB ASTM 615 Grade 60 steel intermediate-strain rate specimens.
ERDC TR-09-8 21
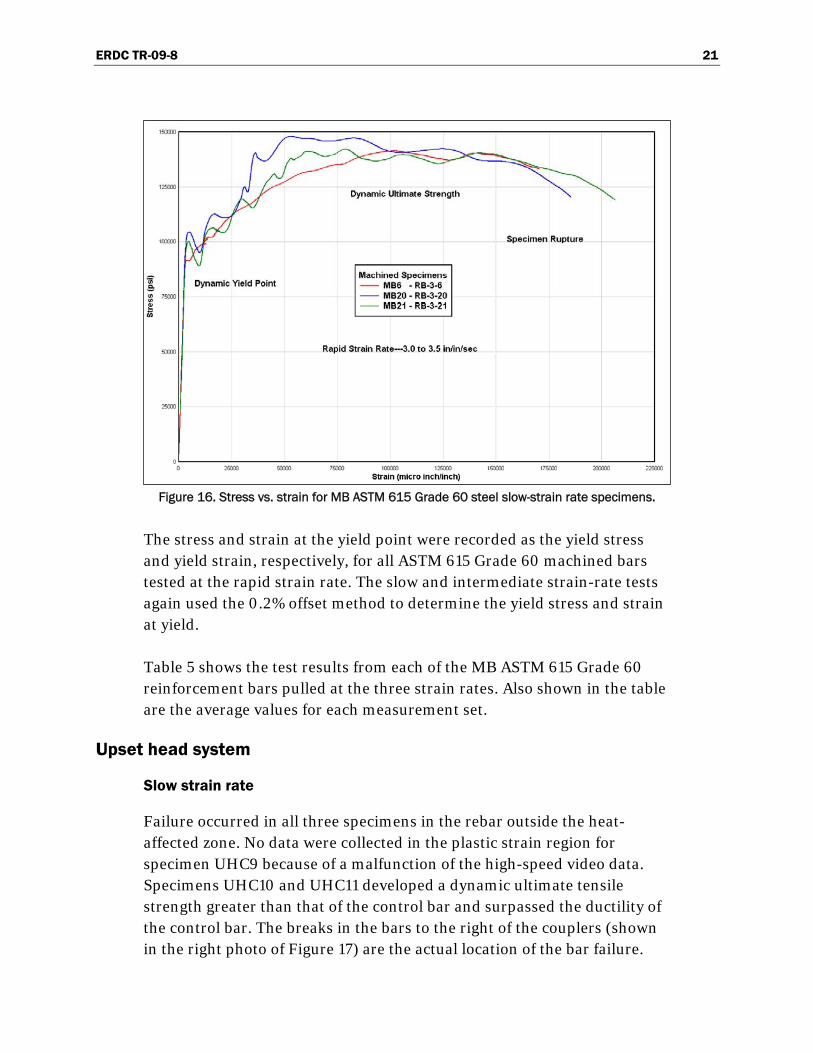
Figure 16. Stress vs. strain for MB ASTM 615 Grade 60 steel slow-strain rate specimens.
The stress and strain at the yield point were recorded as the yield stress and yield strain, respectively, for all ASTM 615 Grade 60 machined bars tested at the rapid strain rate. The slow and intermediate strain-rate tests again used the 0.2% offset method to determine the yield stress and strain at yield.
Table 5 shows the test results from each of the MB ASTM 615 Grade 60 reinforcement bars pulled at the three strain rates. Also shown in the table are the average values for each measurement set.
Upset head system
Slow strain rate
Failure occurred in all three specimens in the rebar outside the heat-affected zone. No data were collected in the plastic strain region for specimen UHC9 because of a malfunction of the high-speed video data. Specimens UHC10 and UHC11 developed a dynamic ultimate tensile strength greater than that of the control bar and surpassed the ductility of the control bar. The breaks in the bars to the right of the couplers (shown in the right photo of Figure 17) are the actual location of the bar failure.

ERDC TR-09-8 22
Table 5. Test result from MB ASTM 615 Grade 60 steel reinforcement bar specimens.
Specimen Name
Specimen Number
Yield Stress (psi)
Yield Strain (μin./in.)
Dynamic Ultimate Strength (psi)
Maximum Strain (μin./in.)
Ductility Ratio
Elongation %
Strain Rate (in./in./sec)
MB14 RB-3-14 ----- ----- ----- ----- ----- ----- -----
MB16 RB-3-16 74,300 4,600 125,000 118,900 25.8 11.8 0.002
MB17 RB-3-17 71,500 4,500 122,700 125,200 27.7 12.5 0.002
MB-Slow Average 72,900 4,550 123,900 122,000 26.8 12.2 0.002
MB10 RB-3-10 74,100 4,800 128,900 118,600 24.8 11.8 0.059
MB11 RB-3-11 75,300 4,800 124,100 273,400 56.6 27.3 0.072
MB12 RB-3-12 78,100 4,900 123,800 139,400 28.2 13.9 0.071
MB-Inter Average 75,800 4,800 125,600 177,100 36.5 17.7 0.067
MB6 RB-3-6 91,600 3,700 141,400 170,300 46.2 17.0 3.56
MB20 RB-3-20 104,400 4,800 147,900 185,400 38.8 18.5 3.60
MB21 RB-3-21 100,300 4,600 142,200 206,400 45.1 20.6 3.31
MB-Rapid Average 98,800 4,400 143,800 187,400 43.4 18.7 3.49
Figure 17. Posttest photos of upset head specimens tested at slow strain rate.
The breaks to the left of the couplers are where the bar was cut with a metal saw to allow for removal of the loader grip. The left photo in Figure 17 shows a typical tensile break.
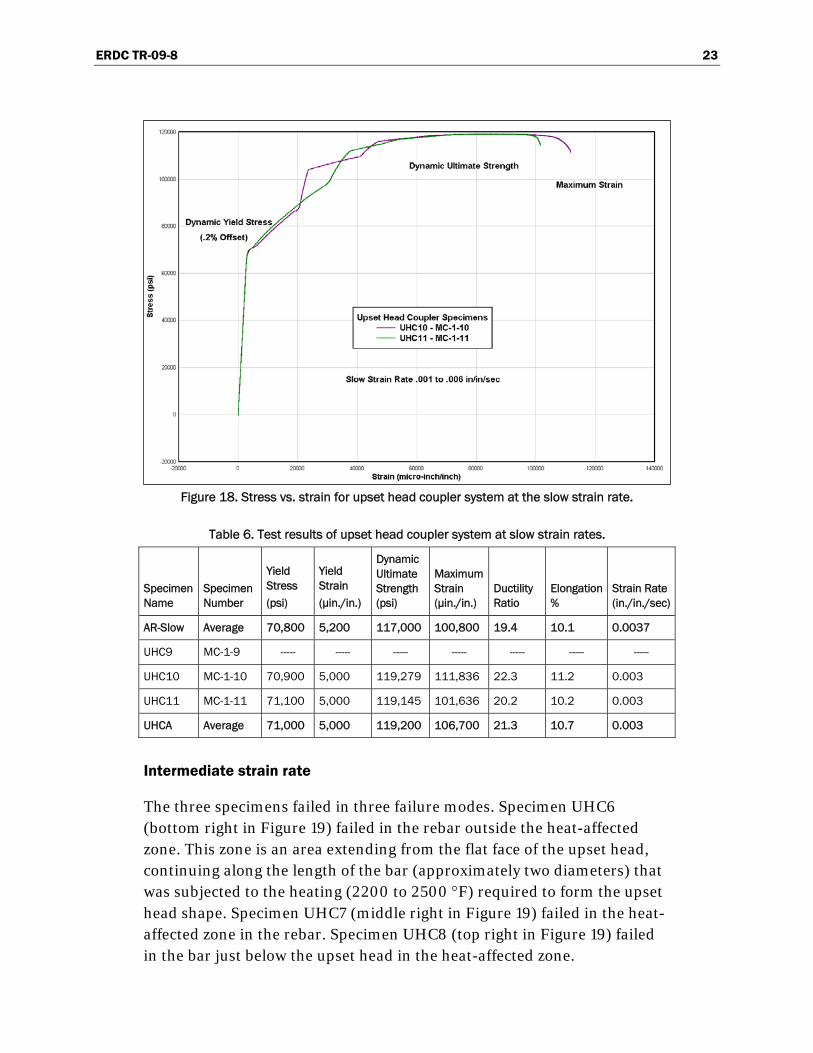
Figure 18 shows the stress-strain test results from the coupler specimens tested at the slow strain rate. Table 6 compares the test results of each of the upset head coupler specimens to the average test results of the ASTM 615 Grade 60 control bars pulled at the slow strain rate. Also shown in the table are the average values for each measurement set.
ERDC TR-09-8 23
Figure 18. Stress vs. strain for upset head coupler system at the slow strain rate.
Table 6. Test results of upset head coupler system at slow strain rates.
Specimen Name
Specimen Number
Yield Stress (psi)
Yield Strain (μin./in.)
Dynamic Ultimate Strength (psi)
Maximum Strain (μin./in.)
Ductility Ratio
Elongation %
Strain Rate (in./in./sec)
AR-Slow Average 70,800 5,200 117,000 100,800 19.4 10.1 0.0037
UHC9 MC-1-9 ----- ----- ----- ----- ----- ----- -----
UHC10 MC-1-10 70,900 5,000 119,279 111,836 22.3 11.2 0.003
UHC11 MC-1-11 71,100 5,000 119,145 101,636 20.2 10.2 0.003
UHCA Average 71,000 5,000 119,200 106,700 21.3 10.7 0.003
Intermediate strain rate
The three specimens failed in three failure modes. Specimen UHC6 (bottom right in Figure 19) failed in the rebar outside the heat-affected zone. This zone is an area extending from the flat face of the upset head, continuing along the length of the bar (approximately two diameters) that was subjected to the heating (2200 to 2500 F) required to form the upset head shape. Specimen UHC7 (middle right in Figure 19) failed in the heat-affected zone in the rebar. Specimen UHC8 (top right in Figure 19) failed in the bar just below the upset head in the heat-affected zone.

ERDC TR-09-8 24
Figure 19. Posttest photos of upset head specimens tested at intermediate strain rate.
Specimens UHC6 and UHC7 developed a dynamic ultimate tensile strength equal to or greater than that of the control bar but did not achieve the ductility of the control bar. Specimen UHC 9 failed close to the ulti-mate dynamic tensile strength of the control bar and also did not achieve the ductility of the control bar. The left photo in Figure 19 shows the fail-ure in the heat-affected zone just below the upset head. The breaks to the left of the couplers are where the bar was cut with a metal saw to allow for removal of the loader grip.
Figure 20 shows the stress-strain test results from the coupler specimens tested at the intermediate strain rate.
Figure 20. Stress vs. strain for upset head coupler system at the intermediate strain rate.
ERDC TR-09-8 25
Table 7 compares the test results of each of the upset head coupler speci-mens to the average test results of the ASTM 615 Grade 60 control bars pulled at the intermediate strain rate. Also shown in the table are the val-ues for each measurement set.
Table 7. Test results of upset head coupler system at intermediate strain rates.
Specimen Name
Specimen Number
Yield Stress (psi)
Yield Strain (μin/in)
Dynamic Ultimate Strength (psi)
Maximum Strain (μin/in)
Ductility Ratio
Elongation %
Strain Rate (in/in/sec)
AR-Inter Average 74,800 5,300 119,500 105,000 19.9 10.5 0.064
UHC6 MC-1-6 71,700 5,500 120,900 76,600 14.0 7.6 0.068
UHC7 MC-1-7 73,600 5,200 119,300 69,900 13.5 6.9 0.059
UHC8 MC-1-8 74,800 5,200 114,000 44,700 8.6 4.4 0.058
UHCA Average 73,400 5,300 118,100 63,700 12.0 6.3 0.062
Rapid strain rate
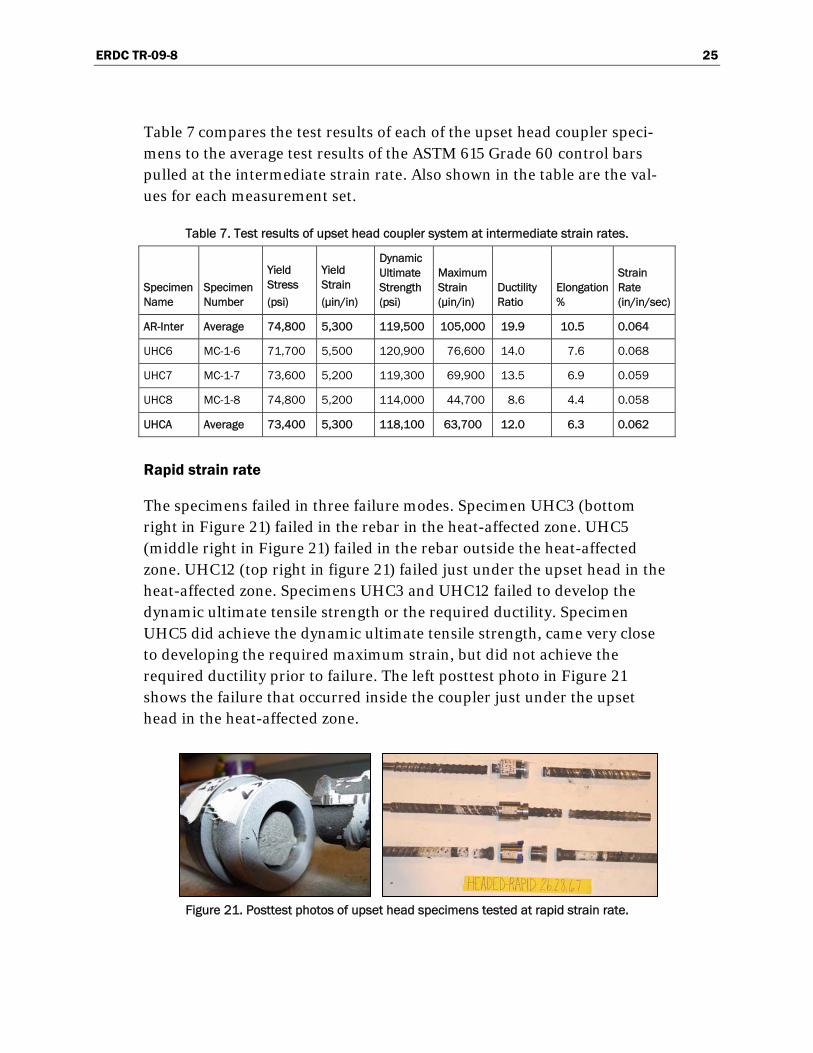
The specimens failed in three failure modes. Specimen UHC3 (bottom right in Figure 21) failed in the rebar in the heat-affected zone. UHC5 (middle right in Figure 21) failed in the rebar outside the heat-affected zone. UHC12 (top right in figure 21) failed just under the upset head in the heat-affected zone. Specimens UHC3 and UHC12 failed to develop the dynamic ultimate tensile strength or the required ductility. Specimen UHC5 did achieve the dynamic ultimate tensile strength, came very close to developing the required maximum strain, but did not achieve the required ductility prior to failure. The left posttest photo in Figure 21 shows the failure that occurred inside the coupler just under the upset head in the heat-affected zone.
Figure 21. Posttest photos of upset head specimens tested at rapid strain rate.
ERDC TR-09-8 26
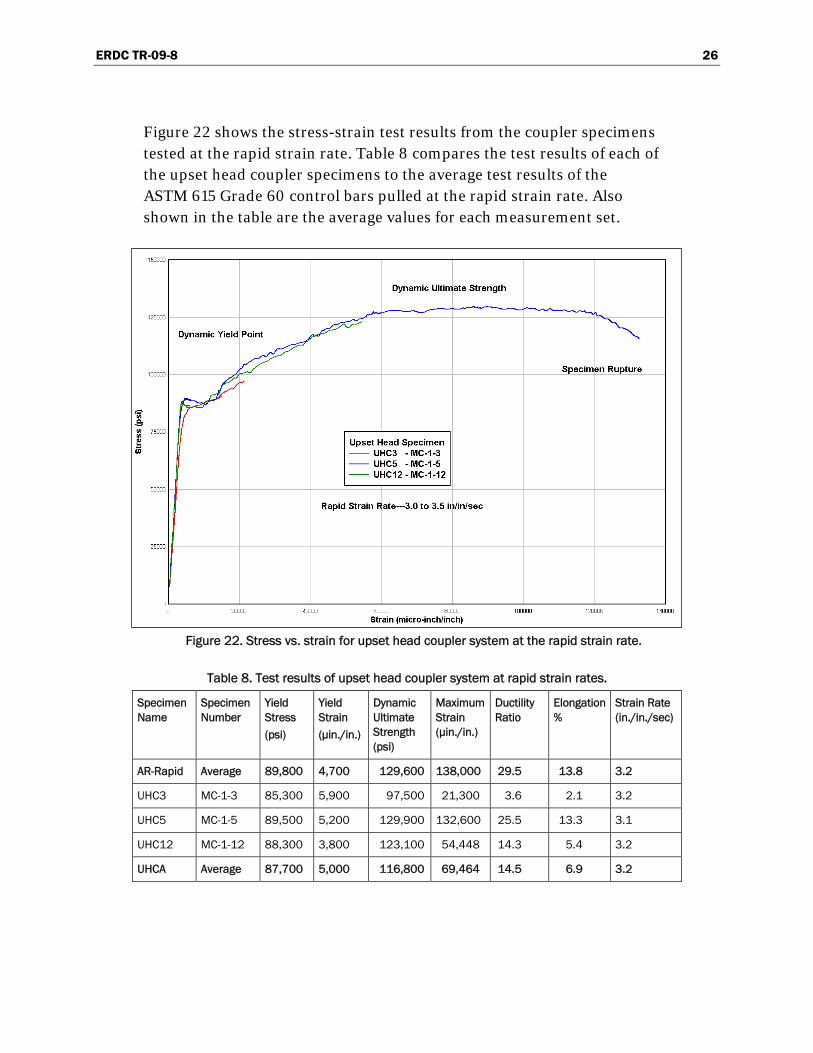
Figure 22 shows the stress-strain test results from the coupler specimens tested at the rapid strain rate. Table 8 compares the test results of each of the upset head coupler specimens to the average test results of the ASTM 615 Grade 60 control bars pulled at the rapid strain rate. Also shown in the table are the average values for each measurement set.
Figure 22. Stress vs. strain for upset head coupler system at the rapid strain rate.
Table 8. Test results of upset head coupler system at rapid strain rates.
Specimen Name
Specimen Number
Yield Stress (psi)
Yield Strain (μin./in.)
Dynamic Ultimate Strength (psi)
Maximum Strain (μin./in.)
Ductility Ratio
Elongation %
Strain Rate (in./in./sec)
AR-Rapid Average 89,800 4,700 129,600 138,000 29.5 13.8 3.2
UHC3 MC-1-3 85,300 5,900 97,500 21,300 3.6 2.1 3.2
UHC5 MC-1-5 89,500 5,200 129,900 132,600 25.5 13.3 3.1
UHC12 MC-1-12 88,300 3,800 123,100 54,448 14.3 5.4 3.2
UHCA Average 87,700 5,000 116,800 69,464 14.5 6.9 3.2

ERDC TR-09-8 27
Grouted system
Slow strain rate
The three specimens failed in two failure modes. Specimen GSC7 (bottom right in Figure 23) failed because the rebar pulled out of the grout in the grout sleeve. The grouted sleeve was sliced longitudinally to reveal evi-dence of the rebar pullout (left photo in Figure 23). Specimens GSC8 and GSC9 (middle and top right, respectively, in Figure 23) failed at the midpoint of the cast steel grout sleeve. All three specimens almost devel-oped the dynamic ultimate tensile strength of the control bar, but none achieved the ductility.
Figure 23. Posttest photos of grouted sleeve specimens tested at the slow strain rate.
Figure 23 shows the three specimens posttest and the grouted sleeve sliced longitudinally to reveal evidence of the rebar pullout.
Figure 24 shows the stress-strain test results from the coupler specimens tested at the slow strain rate.
Table 9 compares the test results of each of the grouted sleeve coupler specimens to the average test results of the ASTM 615 Grade 60 control bars pulled at the rapid strain rate. Also shown in the table are the average values for each measurement set.

ERDC TR-09-8 28
Figure 24. Stress vs. strain for grouted coupler system at the slow strain rate.
Table 9. Test results of grouted coupler system at slow strain rates.
Specimen Name
Specimen Number
Yield Stress (psi)
Yield Strain (μin./in.)
Dynamic Ultimate Strength (psi)
Maximum Strain (μin./in.)
Ductility Ratio
Elongation %
Strain Rate (in./in./sec)
AR-Slow Average 70,800 5,200 117,000 100,800 19.4 10.1 0.0037
GSC7 MC-2-7 71,000 5,300 115,800 65,800 12.5 6.6 0.004
GSC8 MC-2-8 70,400 5,000 114,000 67,400 11.6 5.7 0.003
GSC9 MC-2-9 69,200 5,200 113,900 60,000 11.6 6.0 0.004
GSCA Average 70,200 5,100 114,500 61,100 11.9 6.1 0.004
Intermediate strain rate
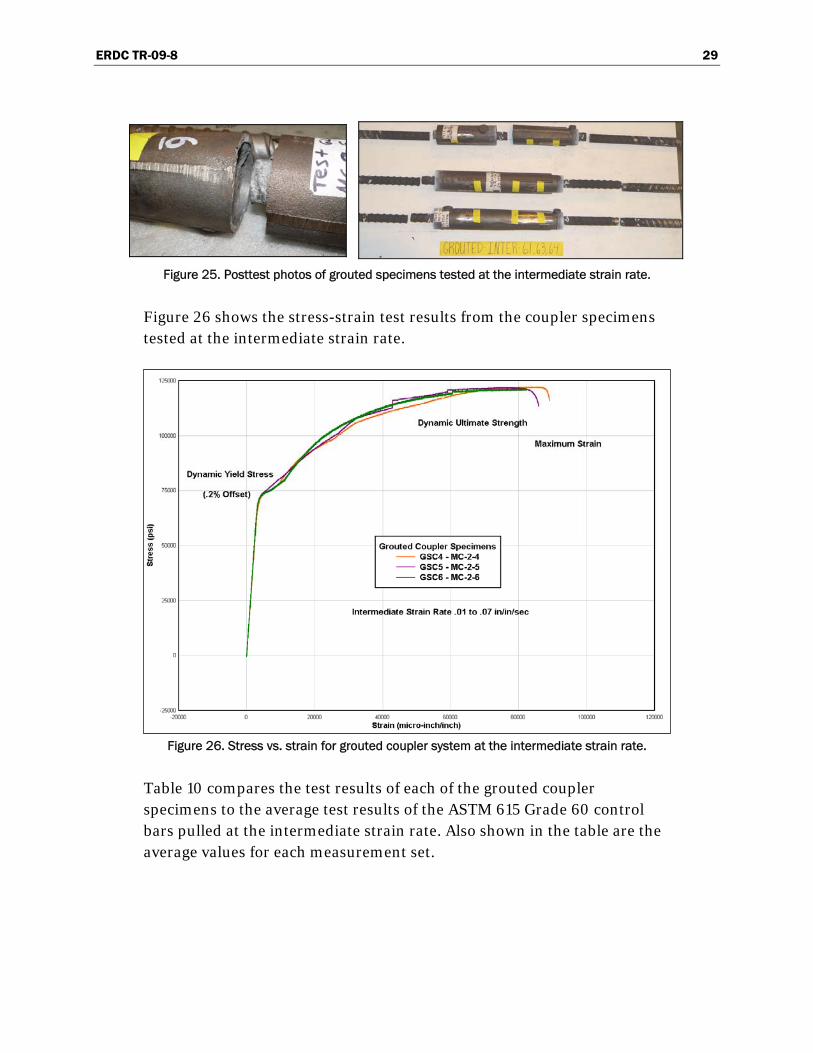
The three specimens failed in two failure modes. Specimens GSC4 and GSC5 (bottom and middle right, respectively, in Figure 25) failed in the rebar outside the grouted sleeve. Specimen GSC6 (top right in Figure 25 failed at the midpoint of the cast steel grout sleeve. All three specimens developed the dynamic ultimate tensile strength of the control bar. How-ever, none achieved the ductility of the control bar. The left photo in Figure 25 shows the grout sleeve coupler midpoint sleeve failure.
ERDC TR-09-8 29
Figure 25. Posttest photos of grouted specimens tested at the intermediate strain rate.
Figure 26 shows the stress-strain test results from the coupler specimens tested at the intermediate strain rate.
Figure 26. Stress vs. strain for grouted coupler system at the intermediate strain rate.
Table 10 compares the test results of each of the grouted coupler specimens to the average test results of the ASTM 615 Grade 60 control bars pulled at the intermediate strain rate. Also shown in the table are the average values for each measurement set.

ERDC TR-09-8 30
Table 10. Test results of grouted coupler system at intermediate strain rates.
Specimen Name
Specimen Number
Yield Stress (psi)
Yield Strain (μin./in.)
Dynamic Ultimate Strength (psi)
Maximum Strain (μin./in.)
Ductility Ratio
Elongation %
Strain Rate (in./in./sec)
AR-Inter Average 74,800 5,300 119,500 105,000 19.9 10.5 0.064
GSC4 MC-2-4 73,900 5,500 122,300 89,100 16.1 8.9 0.063
GSC5 MC-2-5 74,700 5,400 122,100 85,900 16.0 8.6 0.059
GSC6 MC-2-6 74,000 5,300 121,600 82,400 15.4 8.2 0.060
GSCA Average 74,200 5,400 122,000 85,800 15.8 8.6 0.061
Rapid strain rate
The specimens failed in three failure modes. Specimen GSC3 failed because of rebar pullout failure; specimen GSC2 failed because of sleeve failure; and specimen GSC1 failed because of rebar failure (bottom, mid-dle, and top right, respectively, in Figure 27). Specimens GSC2 and GSC3 did not achieve the dynamic ultimate tensile strength or the required ductility of the control bar prior to failure. Specimen GSC1 did achieve the dynamic ultimate tensile strength but did not achieve the required ductil-ity prior to failure. The left photo in Figure 27 shows the very violent midpoint sleeve failure.
Figure 27. Posttest photos of grouted specimens tested at the rapid strain rate.
Figure 28 shows the stress-strain test results from the grouted sleeve coupler system tested at the rapid strain rate.
Table 11 compares the test results of each of the grouted coupler sleeves specimens to the average results of the as-rolled ASTM 615 Grade 60 control bars tested at the rapid strain rate. Also shown in the table are the average values for each measurement set.

ERDC TR-09-8 31
Figure 28. Stress vs. strain for grouted coupler system at the rapid strain rate.
Table 11. Test results of grouted coupler system at rapid strain rates.
Specimen Name
Specimen Number
Yield Point (psi)
Yield Strain (μin./in.)
Dynamic Ultimate Strength (psi)
Maximum Strain (μin./in.)
Ductility Ratio
Elongation %
Strain Rate (in./in./sec)
AR-Rapid Average 89,800 4,700 129,600 138,000 29.5 13.8 3.2
GSC1 MC-2-1 85,700 6,400 130,300 144,500 22.5 14.5 3.5
GSC2 MC-2-2 82,600 4,600 124,700 58,400 12.7 5.8 3.0
GSC3 MC-2-3 82,300 4,200 119,200 49,000 11.6 4.9 3.2
GSCA Average 83,600 5,100 124,700 84,000 15.6 8.4 3.2
Shear screw system
Slow strain rate
All three specimens failed in the same failure mode, which was inside the steel coupler at the first shear screw. Specimens SSC7, SSC8, and SSC9 did not develop the required dynamic ultimate tensile strength nor the required ductility of the control bar. Figure 29 shows the three shear screw

ERDC TR-09-8 32
Figure 29. Posttest photos of shear screw specimens tested at the slow strain rate.
couplers posttest (right photo) and the indention in the rebar left by the first shear screw (left photo). Failure for all three specimens occurred at this location.
Figure 30 shows stress-strain test results from the shear screw coupler system tested at the slow strain rate.
Figure 30. Stress vs. strain for shear screw coupler system at the slow strain rate.
Table 12 compares the test results of each of the shear screw coupler sleeves to the average results of the as-rolled ASTM 615 Grade 60 control bars tested at the slow strain rate. Also shown in the table are the average values for each measurement set.
ERDC TR-09-8 33
Table 12. Test results of shear screw coupler system at slow strain rates.
Specimen Name
Specimen Number
Yield Stress (psi)
Yield Strain (μin./in.)
Dynamic Ultimate Strength (psi)
Maximum Strain (μin./in.)
Ductility Ratio
Elongation %
Strain Rate (in./in./sec)
AR-Slow Average 70,800 5,200 117,000 100,800 19.4 10.1 0.0037
SSC7 MC-3-7 68,800 5,400 80,600 16,700 3.1 1.7 0.004
SSC8 MC-3-8 69,700 5,000 95,800 27,000 5.4 2.7 0.003
SSC9 MC-3-9 69,300 5,200 81,500 17,600 3.4 1.8 0.004
SSCA Average 69,300 5,200 86,000 20,400 4.0 2.1 0.004
Intermediate strain rate
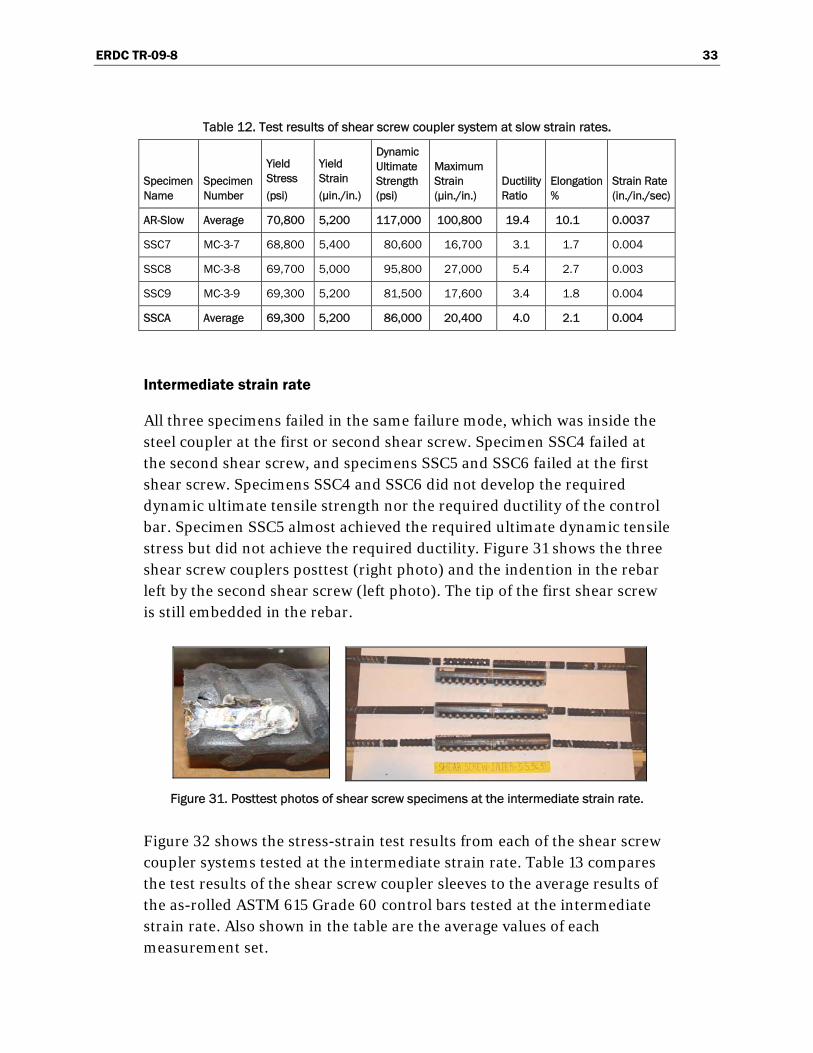
All three specimens failed in the same failure mode, which was inside the steel coupler at the first or second shear screw. Specimen SSC4 failed at the second shear screw, and specimens SSC5 and SSC6 failed at the first shear screw. Specimens SSC4 and SSC6 did not develop the required dynamic ultimate tensile strength nor the required ductility of the control bar. Specimen SSC5 almost achieved the required ultimate dynamic tensile stress but did not achieve the required ductility. Figure 31 shows the three shear screw couplers posttest (right photo) and the indention in the rebar left by the second shear screw (left photo). The tip of the first shear screw is still embedded in the rebar.
Figure 31. Posttest photos of shear screw specimens at the intermediate strain rate.
Figure 32 shows the stress-strain test results from each of the shear screw coupler systems tested at the intermediate strain rate. Table 13 compares the test results of the shear screw coupler sleeves to the average results of the as-rolled ASTM 615 Grade 60 control bars tested at the intermediate strain rate. Also shown in the table are the average values of each measurement set.

ERDC TR-09-8 34
Figure 32. Stress vs. strain for shear screw coupler system at the intermediate strain rate.
Table 13. Test results of shear screw coupler system at intermediate strain rates.
Specimen Name
Specimen Number
Yield Stress (psi)
Yield Strain (μin./in.)
Dynamic Ultimate Strength (psi)
Maximum Strain (μin./in.)
Ductility Ratio
Elongation %
Strain Rate (in./in./sec)
AR-Inter Average 74,800 5,300 119,500 105,000 19.9 10.5 0.064
SSC4 MC-3-4 72,900 5,600 97,100 26,000 4.7 2.6 0.065
SSC5 MC-3-5 73,300 5,600 116,800 62,800 11.3 6.3 0.062
SSC6 MC-3-6 72,500 5,500 86,200 15,700 2.8 1.6 0.065
SSCA Average 72,900 5,600 100,000 34,800 6.3 3.5 0.064
Rapid strain rate
The specimens failed in two failure modes. Specimen SSC1 (bottom right in Figure 33) failed by breaking the rebar at the first shear screw, as a result of stress concentration at the deformation in the rebar made by the shear. Specimens SSC2 and SSC3 failed by complete stripout of the rebar from the sleeve. All specimens failed prior to developing the required dynamic ultimate tensile strength and the required ductility.

ERDC TR-09-8 35
Figure 33. Posttest photos of shear screw specimens tested at the rapid strain rate.
The left photo in Figure 33 shows the indention in the rebar left by the shear screws at stripout. The tips of the shear screw formed a trough embedded in the rebar.
Figure 34 shows the stress-strain test results from the shear screw coupler system tested at the rapid strain rate.
Figure 34. Stress vs. strain for shear screw coupler system at the rapid strain rate.
Table 14 compares the test results of each of the shear screw coupler sleeves to the average results of the as-rolled ASTM 615 Grade 60 control bars tested at the rapid strain rate. Also shown in the table are the average values for each measurement set.

ERDC TR-09-8 36
Table 14. Test results of shear screw coupler system at rapid strain rates.
Specimen Name
Specimen Number
Yield Point (psi)
Yield Strain (μin./in.)
Dynamic Ultimate Strength (psi)
Maximum Strain (μin./in.)
Ductility Ratio
Elongation %
Strain Rate (in./in./sec)
AR-Rapid Average 89,800 4,700 129,600 138,000 29.5 13.8 3.2
SSC1 MC-3-1 80,500 4,800 93,600 25,700 5.3 2.6 3.5
SSC2 MC-3-2 81,100 5,900 98,300 26,300 4.5 2.6 3.2
SSC3 MC-3-3 78,200 6,200 104,500 27,300 4.4 2.7 3.8
SSCA Average 80,000 5,600 98,800 26,400 4.7 2.6 3.5
Taper threaded system
Slow strain rate
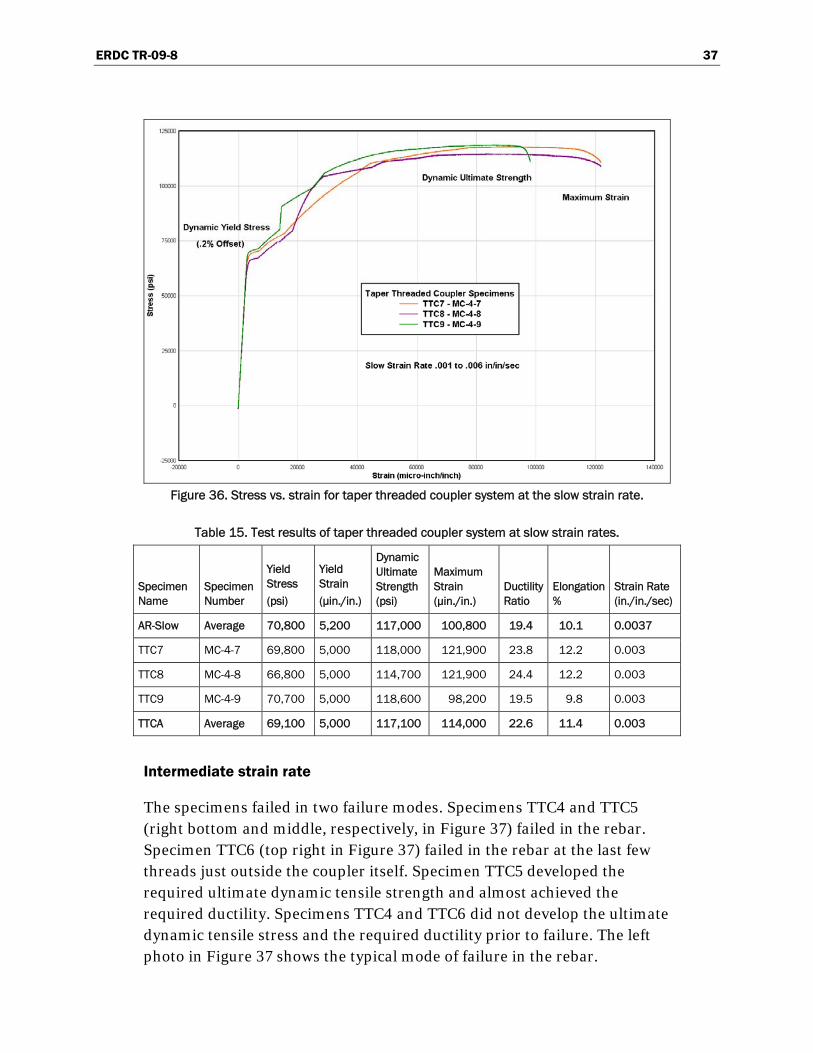
The specimens all failed in the same failure mode, which was failure of the rebar. Specimen TTC7 developed the required ultimate dynamic tensile strength and the required ductility based on the results of the control bar tests. Specimen TTC8 almost developed the ultimate dynamic tensile stress and did achieve the required ductility prior to failure. Specimen TTC9 developed the required dynamic ultimate tensile strength but not the required ductility. Figure 35 shows the three taper threaded couplers posttest (right photo) and the typical mode of failure in the rebar (left photo).
Figure 35. Posttest photos of taper threaded specimens tested at the slow strain rate.
Figure 36 shows the stress-strain test results from the taper threaded coupler system tested at the slow strain rate. Table 15 compares the test results of each of the taper threaded couplers to the average results of the as-rolled ASTM 615 Grade 60 control bars tested at the slow strain rate. Also shown in the table are the average values of each measurement set.
ERDC TR-09-8 37
Figure 36. Stress vs. strain for taper threaded coupler system at the slow strain rate.
Table 15. Test results of taper threaded coupler system at slow strain rates.
Specimen Name
Specimen Number
Yield Stress (psi)
Yield Strain (μin./in.)
Dynamic Ultimate Strength (psi)
Maximum Strain (μin./in.)
Ductility Ratio
Elongation %
Strain Rate (in./in./sec)
AR-Slow Average 70,800 5,200 117,000 100,800 19.4 10.1 0.0037
TTC7 MC-4-7 69,800 5,000 118,000 121,900 23.8 12.2 0.003
TTC8 MC-4-8 66,800 5,000 114,700 121,900 24.4 12.2 0.003
TTC9 MC-4-9 70,700 5,000 118,600 98,200 19.5 9.8 0.003
TTCA Average 69,100 5,000 117,100 114,000 22.6 11.4 0.003
Intermediate strain rate
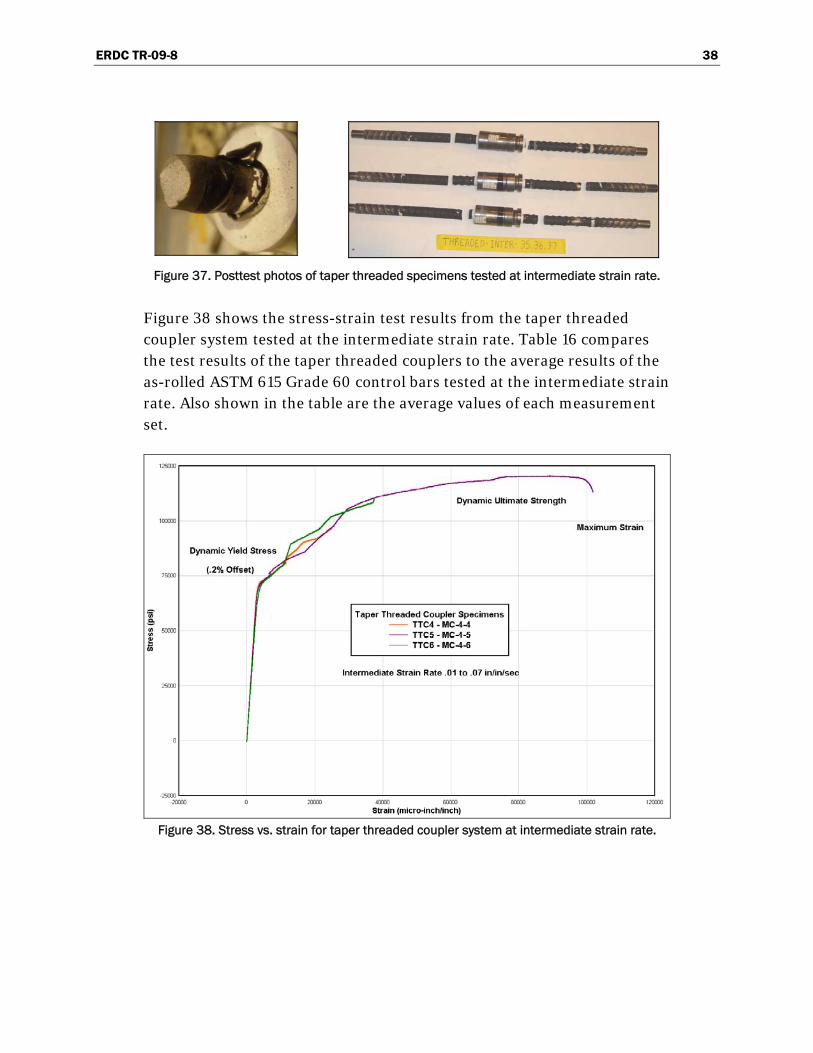
The specimens failed in two failure modes. Specimens TTC4 and TTC5 (right bottom and middle, respectively, in Figure 37) failed in the rebar. Specimen TTC6 (top right in Figure 37) failed in the rebar at the last few threads just outside the coupler itself. Specimen TTC5 developed the required ultimate dynamic tensile strength and almost achieved the required ductility. Specimens TTC4 and TTC6 did not develop the ultimate dynamic tensile stress and the required ductility prior to failure. The left photo in Figure 37 shows the typical mode of failure in the rebar.
ERDC TR-09-8 38
Figure 37. Posttest photos of taper threaded specimens tested at intermediate strain rate.
Figure 38 shows the stress-strain test results from the taper threaded coupler system tested at the intermediate strain rate. Table 16 compares the test results of the taper threaded couplers to the average results of the as-rolled ASTM 615 Grade 60 control bars tested at the intermediate strain rate. Also shown in the table are the average values of each measurement set.
Figure 38. Stress vs. strain for taper threaded coupler system at intermediate strain rate.

ERDC TR-09-8 39
Table 16. Tests results of taper threaded coupler system at intermediate strain rates.
Specimen Name
Specimen Number
Yield Stress (psi)
Yield Strain (μin./in.)
Dynamic Ultimate Strength (psi)
Maximum Strain (μin./in.
Ductility Ratio
Elongation %
Strain Rate (in./in./sec)
AR-Inter Average 74,800 5,300 119,500 105,000 19.9 10.5 0.064
TTC4 MC-4-4 73,000 5,100 96,900 25,000 4.9 2.5 0.057
TTC5 MC-4-5 73,300 5,100 120,700 101,800 19.8 10.1 0.058
TTC6 MC-4-6 73,100 5,400 110,200 37,500 6.9 3.8 0.065
TTCA Average 73,100 5,200 109,200 54,800 10.5 5.5 0.060
Rapid strain rate
All three specimens failed just outside the coupler in the last few threads in the rebar, because of stress concentration at those threads (right photo in Figure 39). All failed prior to developing the dynamic ultimate tensile strength and the required ductility. The left photo in Figure 39 shows the typical mode of failure in the rebar.
Figure 39. Posttest photos of taper threaded specimens tested at rapid strain rate.
Figure 40 shows the stress-strain test results from the taper threaded coupler system tested at the rapid strain rate. Table 17 compares the test results of the taper threaded couplers to the average results of the as-rolled ASTM 615 Grade 60 control bars tested at the rapid strain rate. Also shown in the table are the average values of each measurement set.

ERDC TR-09-8 40
Figure 40. Stress vs. strain for taper thread coupler system at the rapid strain rate.
Table 17. Test results of taper thread coupler system at rapid strain rates.
Specimen Name
Specimen Number
Yield Stress (psi)
Yield Strain (μin./in.)
Dynamic Ultimate Strength (psi)
Maximum Strain (μin./in.)
Ductility Ratio Elongation %
Strain Rate (in./in./sec)
AR-Rapid Average 89,800 4,700 129,600 138,000 29.5 13.8 3.2
TTC1 MC-4-1 86,400 5,900 87,800 13,300 2.3 1.3 3.0
TTC2 MC-4-2 86,900 5,700 106,000 24,300 4.3 2.4 3.0
TTC3 MC-4-3 86,300 4,400 102,400 19,700 4.5 2.0 3.7
TTCA Average 86,500 5,300 98,800 19,100 3.7 1.9 3.2
Threaded rebar coupler system
Slow strain rate
The specimens all failed in the same failure mode, which was in the rebar. During the test on specimen TBC7, the dynamic loader was not properly pressurized to provide sufficient stroke to fail the specimen in one run. Therefore, the test was divided into three separate runs until failure occurred. This created a nonstandard test result that cannot be compared

ERDC TR-09-8 41
to the results of the other specimens. Specimens TBC8 and TBC9 both developed the required ultimate dynamic tensile strength but did not achieve the required ductility. Figure 41 shows the three threaded bar couplers posttest (right photo) and a typical mode of failure in the rebar (left photo).
Figure 41. Posttest photos of threaded bar specimens tested at slow strain rate.
Figure 42 shows the stress-strain test results from the threaded bar coupler system tested at the slow strain rate.
Figure 42. Stress vs. strain for threaded rebar coupler system at the slow strain rate.

ERDC TR-09-8 42
Table 18 compares the test results of the threaded bar couplers to the average results of the as-rolled ASTM 615 Grade 75 control bars tested at the slow strain rate. Also shown in the table are the average values for each measurement set.
Table 18. Test results of threaded rebar coupler system at slow strain rates.
Specimen Name
Specimen Number
Yield Point (psi)
Yield Strain (μin./in.)
Dynamic Ultimate Strength (psi)
Maximum Strain (μin./in.)
Ductility Ratio
Elongation %
Strain Rate (in./in./sec)
ART-Slow Average 76,100 4,000 110,400 108,600 27.5 10.9 0.0031
TBC7 MC-5-7 ----- ----- ----- ----- ----- ----- -----
TBC8 MC-5-8 80,300 4,500 111,500 69,000 15.2 6.9 0.003
TBC9 MC-5-9 80,900 3,400 111,700 65,900 19.6 6.5 0.003
TBCA Average 80,600 3,900 111,600 67,400 17.4 6.7 0.003
Intermediate strain rate
All three specimens failed in the same failure mode, which was in the rebar (right photo in Figure 43). All specimens almost achieved the dynamic ultimate tensile strength of the control bar; none achieved the required ductility prior to failure. The left photo in Figure 43 shows a typical mode of failure in the rebar.
Figure 43. Posttest photos of threaded bar specimens tested at intermediate strain rate.
Figure 44 shows the stress-strain test results from the threaded bar coupler system tested at the intermediate strain rate. Table 19 compares the test results of the threaded bar couplers to the average results of the as-rolled ASTM 615 Grade 75 control bars tested at the intermediate strain rate. Also shown in the table are the average values for each measurement set.

ERDC TR-09-8 43
Figure 44. Stress vs. strain for threaded rebar coupler system at the intermediate rate.
Table 19. Test results of threaded rebar coupler system at intermediate strain rates.
Specimen Name
Specimen Number
Yield Point (psi)
Yield Strain (μin./in.)
Dynamic Ultimate Strength (psi)
Maximum Strain (μin./in.)
Ductility Ratio
Elongation %
Strain Rate (in./in./sec)
ART-Inter Average 81,500 3,800 115,200 115,200 31.0 11.5 0.052
TBC4 MC-5-4 80,900 4,100 113,700 109,900 26.9 11.0 0.048
TBC5 MC-5-5 80,700 3,700 113,300 109,100 29.4 10.9 0.050
TBC6 MC-5-6 81,200 4,900 113,900 92,900 19.0 9.3 0.050
TBCA Average 80,900 4,200 113,700 104,000 25.1 10.4 0.049
Rapid strain rate
All three specimens failed in the rebar (right photo in Figure 45). Speci-men TBC1 almost achieved the dynamic ultimate tensile strength of the control bar but did not achieve the required ductility prior to failure. Specimen TBC2 achieved the required dynamic ultimate tensile strength of the control bar; however, it did not achieve the required ductility prior to failure.
ERDC TR-09-8 44
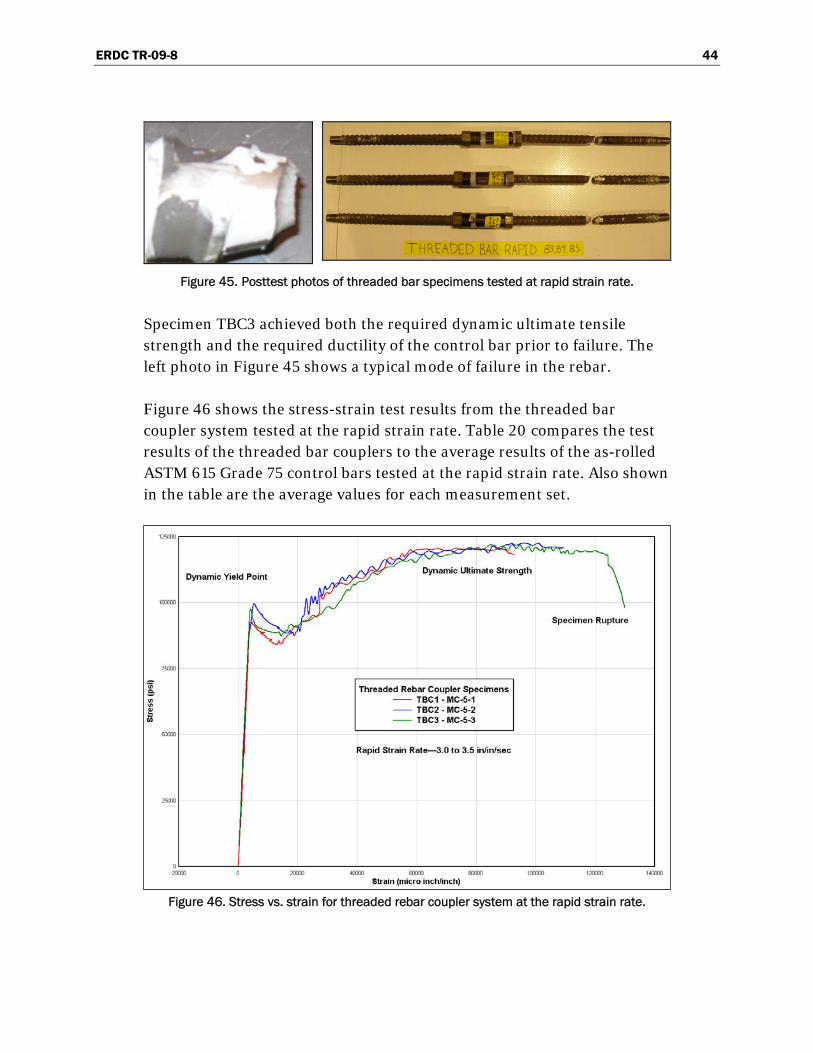
Figure 45. Posttest photos of threaded bar specimens tested at rapid strain rate.
Specimen TBC3 achieved both the required dynamic ultimate tensile strength and the required ductility of the control bar prior to failure. The left photo in Figure 45 shows a typical mode of failure in the rebar.
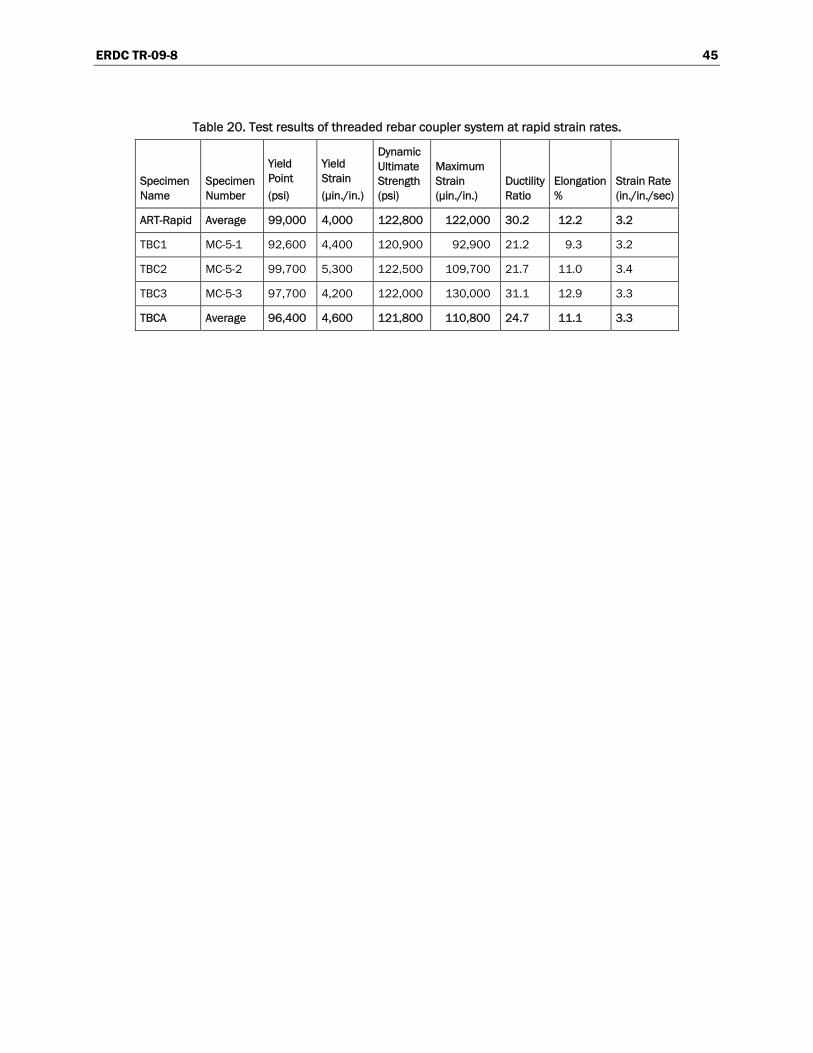
Figure 46 shows the stress-strain test results from the threaded bar coupler system tested at the rapid strain rate. Table 20 compares the test results of the threaded bar couplers to the average results of the as-rolled ASTM 615 Grade 75 control bars tested at the rapid strain rate. Also shown in the table are the average values for each measurement set.
Figure 46. Stress vs. strain for threaded rebar coupler system at the rapid strain rate.
ERDC TR-09-8 45
Table 20. Test results of threaded rebar coupler system at rapid strain rates.
Specimen Name
Specimen Number
Yield Point (psi)
Yield Strain (μin./in.)
Dynamic Ultimate Strength (psi)
Maximum Strain (μin./in.)
Ductility Ratio
Elongation %
Strain Rate (in./in./sec)
ART-Rapid Average 99,000 4,000 122,800 122,000 30.2 12.2 3.2
TBC1 MC-5-1 92,600 4,400 120,900 92,900 21.2 9.3 3.2
TBC2 MC-5-2 99,700 5,300 122,500 109,700 21.7 11.0 3.4
TBC3 MC-5-3 97,700 4,200 122,000 130,000 31.1 12.9 3.3
TBCA Average 96,400 4,600 121,800 110,800 24.7 11.1 3.3
ERDC TR-09-8 46
4 Data Analysis
As-rolled ASTM 615 Grade 60 control bars
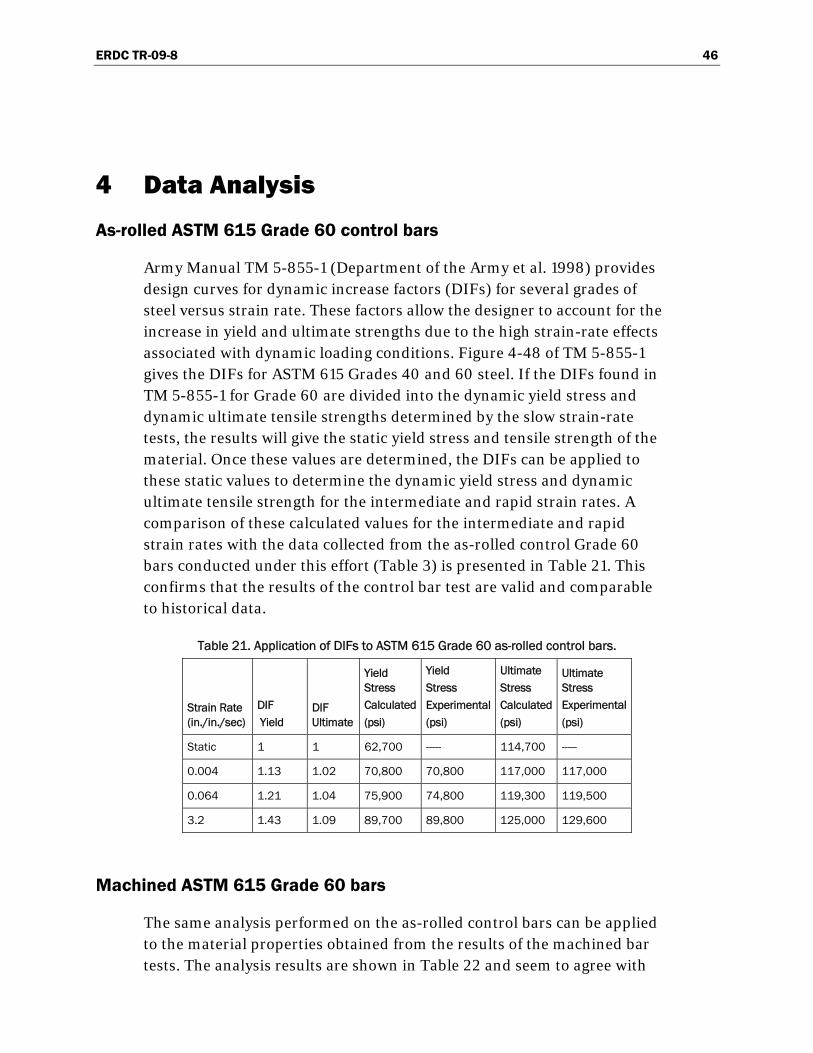
Army Manual TM 5-855-1 (Department of the Army et al. 1998) provides design curves for dynamic increase factors (DIFs) for several grades of steel versus strain rate. These factors allow the designer to account for the increase in yield and ultimate strengths due to the high strain-rate effects associated with dynamic loading conditions. Figure 4-48 of TM 5-855-1 gives the DIFs for ASTM 615 Grades 40 and 60 steel. If the DIFs found in TM 5-855-1 for Grade 60 are divided into the dynamic yield stress and dynamic ultimate tensile strengths determined by the slow strain-rate tests, the results will give the static yield stress and tensile strength of the material. Once these values are determined, the DIFs can be applied to these static values to determine the dynamic yield stress and dynamic ultimate tensile strength for the intermediate and rapid strain rates. A comparison of these calculated values for the intermediate and rapid strain rates with the data collected from the as-rolled control Grade 60 bars conducted under this effort (Table 3) is presented in Table 21. This confirms that the results of the control bar test are valid and comparable to historical data.
Table 21. Application of DIFs to ASTM 615 Grade 60 as-rolled control bars.
Strain Rate (in./in./sec)
DIF Yield
DIF Ultimate
Yield Stress Calculated (psi)
Yield Stress Experimental (psi)
Ultimate Stress Calculated (psi)
Ultimate Stress Experimental (psi)
Static 1 1 62,700 ----- 114,700 -----
0.004 1.13 1.02 70,800 70,800 117,000 117,000
0.064 1.21 1.04 75,900 74,800 119,300 119,500
3.2 1.43 1.09 89,700 89,800 125,000 129,600
Machined ASTM 615 Grade 60 bars
The same analysis performed on the as-rolled control bars can be applied to the material properties obtained from the results of the machined bar tests. The analysis results are shown in Table 22 and seem to agree with

ERDC TR-09-8 47
Table 22. Application of DIF's to ASTM 615 Grade 60 machined bars.
Strain Rate (in./in./sec)
DIF Yield
DIF Ultimate
Yield Stress Calculated (psi)
Yield Stress Experimental (psi)
Ultimate Stress Calculated (psi)
Ultimate Stress Experimental (psi)
Static 1 1 64,500 ----- 121,500 -----
0.002 1.13 1.02 72,900 72,900 123,900 123,900
0.067 1.21 1.04 78,000 75,800 126,400 125,600
3.49 1.43 1.09 92,200 98,800 132,400 143,800
the DIFs with the exception of an approximate 8% increase in the experimental high strain-rate results.
As-rolled ASTM 615 Grade 75 control bars
No DIFs were available for the ASTM 615 Grade 75 control bars. Therefore, a comparison of the test results for as-rolled Grade 60 and Grade 75 bars is provided in Table 23.
Table 23. Comparison of test results for ASTM 615 Grade 60 and Grade75 control bars.
Strain Rate (in./in./sec)
ASTM 615 Grade
Yield Point (psi)
Yield Strain (μin./in.)
Dynamic Ultimate Strength (psi)
Maximum Strain (μin./in.)
Ductility Ratio Elongation %
0.004 60 70,800 5,200 117,000 100,800 19.4 10.1
0.003 75 76,100 4,000 110,400 108,600 27.5 10.9
+7% -23% -6% +7% +29% +7%
0.064 60 74,800 5,300 119,500 105,000 19.9 10.5
0.052 75 81,500 3,800 115,200 115,000 31.0 11.5
+8% -28% -4% +9% +36% +9%
3.2 60 89,800 4,700 129,600 138,000 29.5 13.8
3.2 75 99,000 4,000 122,800 122,000 30.2 12.2
+9% -15% -5% -12% +2% -12%
The results in Table 23 indicate that the yield points for the Grade 75 bar at all strain rates are higher than those for the Grade 60 bar tested at comparable strain rates. However, the yield strains for the Grade 75 bars are less at all three strain rates than those for the Grade 60 bar. This indicates that the Grade 75 bar is stronger and less ductile at the yield point than the Grade 60 bar at all three strain rates. In terms of dynamic

ERDC TR-09-8 48
ultimate strength and maximum strain, the Grade 75 bar has lower strength and higher strains at the slow and intermediate rates. However, at the rapid rate, the Grade 75 bar has both lower dynamic ultimate strengths and lower maximum strains compared with the Grade 60 bar. These ultimate strengths and maximum strains are somewhat counter to those at yield. The data imply that, although stronger and less ductile at yield, the Grade 75 bars have less strength and are generally more ductile at the ultimate point compared with the responses of the Grade 60 bar. Finally, at all three strain rates, the Grade 75 bar has a higher ductility than the Grade 60 bar, but only slightly so at the rapid rate.
Upset head system
The upset head coupler (UHC) system performed very well under the slow strain-rate loading conditions. The system developed on average 102% of the dynamic ultimate tensile strength, 106% of the maximum strain, and 110% of the ductility achieved by the control bar. The mode of failure for all three specimens was in the rebar outside the heat-affected zone.
The average performance of the UHC system under the intermediate strain-rate loading condition produced 99% of the dynamic ultimate strength, 61% of the maximum strain, and 60% of the ductility achieved by the control bar. One specimen failed outside the heat-affected zone while the other two specimens failed in the heat-affected zone. One of the latter two specimens failed just under the upset head. Failures inside the heat-affected zone exhibited a brittle failure with little to no necking.
Under the rapid strain-rate loading condition, the UHC system developed an average of 90% of the dynamic ultimate strength, 50% of the maximum strain, and 49% of the ductility achieved by the control bar. One specimen failed outside the heat-affected zone while the other two specimens failed in the heat-affected zone, with one of the latter two specimens failing just under the upset head.
Table 24 contains individual specimen performances as well as the average UHC system performance.

ERDC TR-09-8 49
Table 24. Percent of response of mechanical coupler system compared to response of as-rolled control bars.
Slow Strain Rate Intermediate Strain Rate Rapid Strain Rate
Specimen Name
Dynamic Ultimate Strength
Maximum Strain
Ductility Ratio
Dynamic Ultimate Strength
Maximum Strain
Ductility Ratio
Dynamic Ultimate Strength
Maximum Strain
Ductility Ratio
UHC – Upset Head System
1 ----- ----- ----- 101 73 70 75 15 12
2 102 111 115 100 67 68 100 96 86
3 102 101 104 95 43 43 95 39 48
Average 102 106 110 99 61 60 90 50 49
GSC – Grouted Sleeve Coupler System
1 99 65 64 102 85 81 101 105 76
2 97 57 60 102 82 80 96 42 43
3 97 59 60 102 78 77 92 36 39
Average 98 61 61 102 82 79 96 61 53
SSC – Shear Screw Coupler System
1 69 17 16 81 25 24 72 19 18
2 82 27 28 98 60 57 76 19 15
3 70 17 18 72 15 14 81 20 15
Average 73 20 21 84 33 32 76 19 16
TTC – Tapered Thread Coupler System
1 101 121 123 81 24 25 68 10 8
2 98 121 126 101 96 99 82 18 15
3 101 97 101 92 36 35 79 14 15
Average 100 113 116 91 52 53 76 14 13
TBC – Threaded Rebar Coupler System
1 ----- ----- ----- 99 95 88 98 76 70
2 101 64 55 98 95 95 100 90 72
3 101 61 71 99 81 61 99 106 103
Average 101 62 63 99 90 81 99 91 82
The couplers themselves performed very well under all three strain rates. No couplers were observed to fail within the coupler connection itself. Failure for this system occurred either within the rebar heat-affected zone or in the rebar just outside the heat-affected zone. Couplers subjected to the slow- and intermediate-strain rates could be disassembled posttest. Couplers subjected to the high strain rate could not be disassembled posttest, which indicated deformation of the internal threads in the male-female threaded connection.
ERDC TR-09-8 50
Grouted sleeve coupler system
The grouted sleeve coupler (GSC) system on average under the slow-strain rate loading condition developed 99% of the dynamic ultimate tensile strength, 61% of the maximum strain, and 61% of the ductility achieved by the control bar (see Table 24). One GSC specimen failed as a result of pullout of the rebar from the grouted sleeve, and the other two failed in the sleeve at the midpoint of the sleeve. It is undetermined why the pullout failure occurred. The failure at the sleeve midpoint was due to voids and imperfections in the cast steel grout sleeve.
The performance of the GSC system under the intermediate-strain rate loading condition developed on average 102% of the dynamic ultimate strength, 82% of the maximum strain, and 79% of the ductility achieved by the control bar (see Table 24). Two specimens failed in the bar outside the cast steel grout sleeve, while the third failed at the midpoint of the cast steel grout sleeve, as the result of stress concentration at voids caused during the casting process.
The GSC system under the rapid-strain rate loading condition developed on average 96% of the dynamic ultimate strength, 61% of the maximum strain, and 53% of the ductility achieved by the control bar (see Table 24). One specimen failed because of rebar pullout; one specimen failed in the rebar outside the grout sleeve; and one specimen failed because of a violent failure of the cast steel grout sleeve.
Shear screw coupler system
The shear screw coupler (SSC) system under the slow-strain rate loading condition developed on average 73% of the dynamic ultimate tensile strength, 20% of the maximum strain, and 21% of the ductility achieved by the control bar (see Table 24). All three specimens failed in the rebar at the first shear screw location just inside the steel coupler sleeve.
The SSC system under the intermediate-strain rate loading condition developed on average 84% of the dynamic ultimate strength, 33% of the maximum strain, and 32% of the ductility achieved by the control bar (see Table 24). All three specimens failed in the rebar at the first or second shear screw location just inside the steel coupler sleeve.

ERDC TR-09-8 51
The SSC system average performance under the rapid-strain rate loading condition developed on average 76% of the dynamic ultimate strength, 19% of the maximum strain, and 16% of the ductility achieved by the control bar (see Table 24). Failure occurred in two modes. Two specimens failed by complete stripout of the rebar from the coupler sleeve, and one specimen failed in the rebar at the first shear screw location just inside the steel sleeve.
All steel sleeves performed very well. However, the stress concentration in the rebar caused by the tip of the shear screw embedded in the rebar caused premature failure prior to development of the required dynamic ultimate tensile strength and the required maximum strain.
Taper threaded coupler system
The taper threaded coupler (TTC) system performed very well under the slow-strain rate loading conditions. The system developed on average 100% of the dynamic ultimate tensile strength, 113% of the maximum strain, and 116% of the ductility achieved by the control bar (see Table 24). All three specimens failed under in the rebar after achieving the required dynamic ultimate strength and maximum strain.
Under the intermediate-strain rate loading condition, the TTC developed on average 91% of the dynamic ultimate strength, 52% of the maximum strain, and 53% of the ductility achieved by the control bar (see Table 24). Two specimens failed in the rebar outside the taper threads, and one specimen failed in the rebar in the last threads of the taper thread, as a result of the stress concentration caused by the taper threads in the rebar.
Under the rapid-strain rate loading, the TTC system developed on average 76% of the dynamic ultimate strength, 14% of the maximum strain, and 13% of the ductility achieved by the control bar (see Table 24). All three specimens failed in the rebar in the last threads of the taper thread as a result of the stress concentration caused by the taper threads in the rebar.
The couplers themselves performed very well under all three strain rates. No couplers were observed to fail within the coupler connection itself. Failure for this system occurred either within the rebar outside the threads or in the rebar in the last of the taper threads. Couplers subjected to all three strain rates could be disassembled posttest, indicating no

ERDC TR-09-8 52
detrimental deformation of the internal threads in the male-female threaded connection.
Threaded bar coupler system
The threaded bar coupler (TBC) system under the slow-strain rate loading condition developed on average 101% of the dynamic ultimate tensile strength, 62% of the maximum strain, and 63% of the ductility achieved by the control bar (see Table 24). All three specimens failed in the rebar outside the coupler.
The TBC system under the intermediate-strain rate loading condition developed on average 99% of the dynamic ultimate strength, 90% of the maximum strain, and 81% of the ductility achieved by the control bar (see Table 24). All three specimens failed in the rebar outside the coupler.
The TBC system under the rapid-strain rate loading condition developed on average 99% of the dynamic ultimate strength, 91% of the maximum strain, and 82% of the ductility achieved by the control bar (see Table 24). All three specimens failed in the rebar outside the coupler.
The couplers themselves performed very well under all three strain rates. No couplers were observed to fail within the coupler connection itself. Failure for this system occurred in the rebar outside of the coupler. Cou-plers subjected to all three strain rates could be disassembled posttest, indicating no detrimental deformation of the internal threads in the threaded bar connection. Minor deformation was observed posttest when the couplers were disassembled.

ERDC TR-09-8 53
5 Summary and Recommendations
Summary
All coupler sleeves with the exception of the grouted sleeve performed very well. The cast-steel grout sleeve was the only sleeve that failed. Most fail-ures that occurred appeared to be the result of the process required to pre-pare or make the mechanical connections. For example, the upset head failed in the heat-affected zone. The shear screw failed at the first or sec-ond shear screw embedment. The taper threaded coupler failed at the last taper threads just outside the coupler itself. The only coupler system that did not exhibit this type of failure was the threaded bar coupler.
Many of the couplers had successful or near-successful individual test results. However, when combined with the rest of the results of the other couplers within the series, the average results of the series were less than the requirements.
The taper thread coupler and the upset head coupler met the requirements at the slow strain rate and are candidates for use in hardened structures subjected to the slow strain rates such as reported herein.
The threaded rebar coupler and the grouted sleeve coupler performed the best compared with the other couplers at the intermediate rate. The TBC developed 99% of the dynamic ultimate tensile strength (DUTS), 90% of the maximum strain (MS), and 81% of the ductility ration (DR) of the con-trol bar. The GSC developed 102% of the DUTS, 82% of the MS, and 79% of the DR of the control bar.
The TBC performed the best compared with the other couplers at the high strain rate. It developed 99% of the DUTS, 91% of the MS, and 81% of the DR of the control bar.
The detailed test procedure described in this report provides a basis for an open test procedure for these types of mechanical couplers.
ERDC TR-09-8 54
Recommendations
The threaded bar coupler should be further investigated and additional tests conducted at all three strain rates to provide additional test results for review.
The standard lap splice specified in the TM 5-1300 should be tested experimentally in the same manner and at the same strain rates as per-formed on mechanical couplers in this effort, and the results compared with the performances of the control bars and the mechanical couplers documented herein.
The upset head, grout sleeve, and threaded rebar couplers should be tested in either subscale or full-scale reinforced concrete slabs at strain rates similar to those used in this study to determine their performances when combined with concrete cover. The subscale tests could be conducted in the ERDC blast load simulator. Full-scale tests could be conducted in the field. This group of couplers should also be modeled using a finite element code so that comparisons can be made between experimental results and analytical results obtained through the high performance computational models. These models could also be used to validate and extrapolate results so that optimum designs can be evaluated without costly field experiments.
Although system failures occurred at lower capacity than the control bars, the failure occurred in the rebar and not in the coupler. Therefore, consid-eration should be given to modification of the failure and acceptance criteria.

ERDC TR-09-8 55
References
American Concrete Institute (ACI). 2002. Building code requirements for structural concrete. ACI Report 318-02, Farmington Hills, MI.
_____. 2007. Types of mechanical splices for reinforcing bars. ACI Report 439.3R-07. Farmington Hills, MI.
Departments of the Army, Navy, and Air Force. 1990. Structures to resist the effects of accidental explosions. Department of the Army Technical Manual TM 5-1300; Department of the Navy Publication NAVFAC P-397; Department of the Air Force Manual AFR 88-22. Washington DC.
Departments of the Army, Navy, and Air Force and the Defense Special Weapons Agency. 1998. Design and analysis of hardened structures to conventional weapons effects. Department of the Army Technical Manual TM 5-855-1; Department of the Navy Publication NAVFAC P-1080; Department of the Air Force Manual AFPAM 32 1147(I). Washington DC.
Flathau, W. J. 1971. Dynamic tests of large reinforcing bar splices. Technical Report N--71-2. Vicksburg, MS: U.S. Army Engineer Waterways Experiment Station.
Huff, W. L. 1969. Test devices, Blast Load Generator Facility. Miscellaneous Paper N-69-1, Vicksburg, MS: U.S. Army Engineer Waterways Experiment Station.

ERDC TR-09-8 56
Appendix A: Drawings

ERD
C TR
-09-8 57
APP LIED 4 LDAD
r'~)
L1NE ~
AS ?O I Tu (UPPER)
R[ !N~C ~( [~[~~ _ H'~
" <LD"'ER)
HACHII£ SEE tt+" ,~~.,
D BAR
REr HIENC[
I£ToIL '"
:l r= L1~.
II TJJ' Bt' nt' ~.
Figur .. Al AD- r o lled .. , nIlchined r .. inforc ....... . ,
~~ IIl;CELE"oTI~ ,. ~) UPP ER LC 'O ;, ,f>y,
II dJ
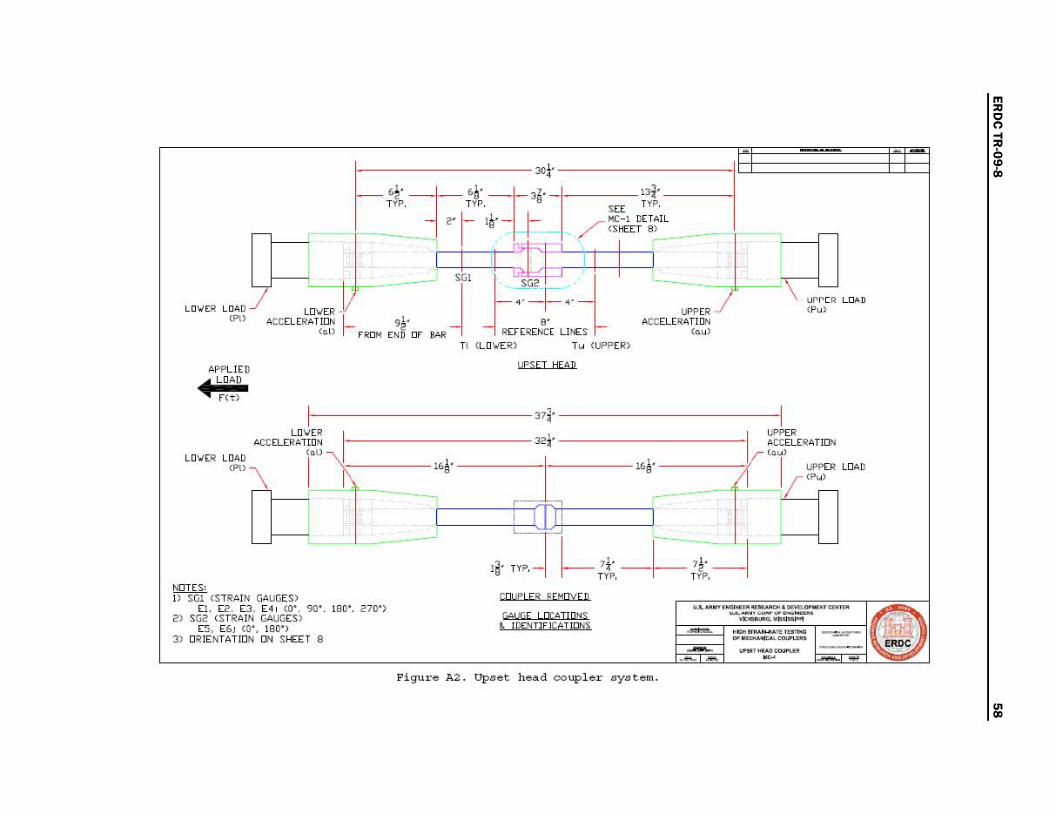
ERD
C TR
-09-8 58
lO " ER
T< <LO " ER) T ... (uPF EP)
I I'S[1 tO P
1----------37i-----------I
LO " [~
LO " ER 1 ------------------------- ---------------------------1 "" ACCEL[RATION - 32:\- ACC[L[RATION
LO AD ""1 1------------ ____________ +r ,.w
<" > \a=I~-:<' <-"" =="J" IISJ~" <~" I ! mi=
--~ " «"r~ :i; --I--j ; ='=1 ~ 1) SG! (STRAIN GAUGES) c[11l'1 Eg ' E~DY E n
[ 1. [ 2, [3 . [ 4 , (0', 90', l BO' , 2 70') 2 ) SGe (STRAIN GA~[S)
[ 5 , ( 6) (0', IHO') 3} DRI[NTATIOS ON Sf£[T B
F i gur .. A2. Up . .. t h .... d coup l .. r Dy~ t ""'.

ERD
C TR
-09-8 59
f--------------"""'"",,."'- '<----- I
1=:;:-,;· ::-i+=;';'::~. =i=::j\ :;:::=:~ =1- 'l -r-: " ~ (:--1- --1 T I E-1 Ti l r
- i 1 1-,;::] + H\-- 7~' -----1 2' ~ !~. ---t_+--- l~. * 7 ~ ' ,'H I+l---.. · ---+-----REHRE:~ ~ u /£s-----+ ---.. ·---Ji-I
LD I/ [ R TI <LD \l ER) Tu <lJI'PER) UPf' ER APf'LlE O AC~ [LER. TID."
• LD~D ( . 1)
F<~)
"CCEL[~~TmN GRrl lTED (. ~)
1------.. ------1 LO\IE~ LDAD 1------- 111l' -------1 UPPER LOAD
('"'I --I H _ 1""\ ( C - l I I~I ===t:1 ~i :J }
""'" 1--=:;;:--1- ~a' -I-." ~ I ,-1-" :::-~~-I 1) SGI <ST>l MN GAuc.E: S)
El. [ 2 . [ 3. E<J <0 ' , 90' , l B)', 270') COJP LEO R[ H[ly [ D 2> SG2 (STRAIN GAlJG.ES> ---- - - - - .... _,--... _ . _ ............. @) "'--_ .. - j;jl! [ 5. E6 , W. 180') GAUG E LOCATIO , S "",__ j 3> SG3 (STRA]N GIIIJG<:S> !. ][lrnTIFI[ ~T100S .-... _._.~~ .. _ " .... _~___ • ,_.
[ 7. Ea, <0' , 180') - _ n"" . , DR IE"T~Tm!l ON Sf£ET 8 _ . ____ ._- .." --'
Figure A l. Gro uted . l .. ev .. cou p l er . yU<I1<l,

ERD
C TR
-09-8 60
""PLIED ~ LOAD
F<~)
LO\IE~
j ' PIJ
II
1-
""'"
,~"
--I
'I' I "I'
II SGI <ST>l AlN (;Auc.E$) EI, E2, E3. E<J <0', 90' , IBO', 270')
" SG2 <STRAIN GAlJG.ES)---ES; <1' )
" SG3 <STRAIN GAlJG.ES) EO;; <I' )
" SG < <STRA IN GAlJG.ES) [7 , <I' )
" O~ IENT~Tm)l [)< Sf£ET B
~~li'
t -I II
I ,.' I[ ,.' CWE LER W 'OV ED
GAUG E ~~ATIC " S !. IUENTlF U TlOOS
F igur .. A4. S h .... r_ . c r ..... coup l .. r .Y.'''''''
ij~' I
~ ~ [ I
r I
"~. ,~"
~' ,
\ -I
I -,.. .' -I IOC' TYP,
-. ----- ----- - ...

ERD
C TR
-09-8 61
SEE-" MC • OCTAIL <S HEET 8)
43~'
I
4 "~' I - 'j :-i -j - " ;;=I ~~_ '" He.
I - -S~
;~-~~ I I I III I I I I
LO .,, [ R L ~~~ LO "' E~ - ---:. ~--I -1+' '---~ER ~)'" UlAn
AoCC ELERATIO~ r-- ~' G' -
AoCCELERATION <. 1) <ou)
H (LO ,", ER) r-- , 1" , _ ~ErEFI'L~~ E LIr£S Tu (lFPER)
APPL IE D • LO An
T!\f[ REO TH RE.U
n~)
LO\IER 3 ;~' UPP£~ A1:C ELER. TION AoCCELERATION
LO ." ER LO.D <0 " , 17~'
'il n' l ~ 17~' !/ 'OU)
~ ,~" \p1) ~
5J ~ ----.
~;l :-l-i! ; ,, ~ J 'I ~ -= m, l!'! ER !1E~O Y E D 1) %1 ' STRAIN GAVGE:S)
~' , ~~, D , ~" ( 0·, 9 0·, ' "0' , nO') .... _'_'·~M_._ ...... _ @) C,," 'GE ' [J;AIWNS ~--.. --
" SGZ (STROIN GAU~ ES ) ---E~, E6 , (0· , l B(l') • IU[ lfll ncA no Ns - .""-_ .. ...,." ~
" DRIENTATION ON SklEET 9 .. ---- ,-----""" ------ - ~
Figure AS. Taper threa ded cou p l e r DyUM>.

ERD
C TR
-09-8 62
APPLIED
~ LDAD
F<t )
(SH[[T S)
- "' --+-I - ""- --+\-- ::-11-1 --"" ---+I- " ~ J 1 I il l II I -=1 =t _I 'j ~ ' j _ ;\;-!t - £1:: - 'j ---HI ~· -t---",--t---"'---II " , 1-----~------",',-----------__4
IH 'lEAD FD BAR CWl'LER SISTE~
LO 'J ER LOAD LO II [ R UPPER lIP"£R LOA,," , - (Pl> ~ CCLERATION I\CC ELERATI)~ <Py)
/~/ ________ '7L.r~"""'-_____________________ ------------------------""'C""' ,,--------1\ ~l ~·
/ I ~-, ". ''' ------IIi" ~---'\ 1\ CI ~1========jl il========~I ~1
- ,j ~ " ~".~~".~ " = 1) SG! <STR ~IN GJ\\.IGE$) CWE LER ! EHOVED
El, E2. n , EOJ (Q', 90', l BO', 270') 2) SGl.' (STR~ ItI GIWGES>
E5, E6 , <0', l BO') 3) DR IEtlT~Tm!l ON Sf£ET 8
Figur .. A6. Thr .... ded bar ccup l .. r Dy~ t .. I'l .
- . -_ ........ --.- _ ... -

ERD
C TR
-09-8 63
IIIIIII I I l~' H P
--j r- TfiFlEAOCD
Figure A7. Machined bar ..
IIIIIII
nd grip deta i h.

ERD
C TR
-09-8 6
4
He 1 CwP\.ER LP><T .... .
• ," • U I IP! ER
, ...... "*'E"
I E± tE
! b
! -
H P,
• >K J mll' ! ER
1>EN> 1CroE'<' " " " """ " _ , ,.."'''- ON 1tC'T, >It'"
I
Figure A 8 . Coupler detai l. .

REPORT DOCUMENTATION PAGE Form Approved
OMB No. 0704-0188 Public reporting burden for this collection of information is estimated to average 1 hour per response, including the time for reviewing instructions, searching existing data sources, gathering and maintaining the data needed, and completing and reviewing this collection of information. Send comments regarding this burden estimate or any other aspect of this collection of information, including suggestions for reducing this burden to Department of Defense, Washington Headquarters Services, Directorate for Information Operations and Reports (0704-0188), 1215 Jefferson Davis Highway, Suite 1204, Arlington, VA 22202-4302. Respondents should be aware that notwithstanding any other provision of law, no person shall be subject to any penalty for failing to comply with a collection of information if it does not display a currently valid OMB control number. PLEASE DO NOT RETURN YOUR FORM TO THE ABOVE ADDRESS.
1. REPORT DATE (DD-MM-YYYY) September 2009
2. REPORT TYPE Final report
3. DATES COVERED (From - To)
5a. CONTRACT NUMBER
5b. GRANT NUMBER
4. TITLE AND SUBTITLE
High Strain-Rate Testing of Mechanical Couplers
5c. PROGRAM ELEMENT NUMBER
5d. PROJECT NUMBER
5e. TASK NUMBER
6. AUTHOR(S)
Stephen P. Rowell, Clifford E. Grey, Stanley C. Woodson, and Kevin P. Hager
5f. WORK UNIT NUMBER
7. PERFORMING ORGANIZATION NAME(S) AND ADDRESS(ES) 8. PERFORMING ORGANIZATION REPORT NUMBER
U.S. Army Engineer Research and Development Center Geotechnical and Structures Laboratory and Information Technology Laboratory 3909 Halls Ferry Road, Vicksburg, MS 39180-6199; Naval Facilities Engineering Service Center 1100 23rd Ave, Waterfront Structures Division Port Hueneme, CA 93043
ERDC TR-09-8
9. SPONSORING / MONITORING AGENCY NAME(S) AND ADDRESS(ES) 10. SPONSOR/MONITOR’S ACRONYM(S)
11. SPONSOR/MONITOR’S REPORT NUMBER(S)
Naval Facilities Engineering Service Center Port Hueneme, CA 93043
12. DISTRIBUTION / AVAILABILITY STATEMENT Approved for public release; distribution is unlimited.
13. SUPPLEMENTARY NOTES
14. ABSTRACT
Criteria for designing structures to resist the effects of accidental explosions are defined by Army Technical Manual (TM) 5-1300. These structures are built using steel-reinforced concrete. The current practice of splicing the flexural reinforcing steel is to lap the steel, which often creates a congestion of the steel in floors, walls, and adjoining corners. In 1971, a limited number of types of splices were tested at the U.S. Army Engineer Research and Development Center (ERDC) (formerly Waterways Experiment Station) to determine their performance under dynamic load conditions. Since then, several types of mechanical couplers have been tested and validated in developing the strength of reinforcing steel for cyclic loading and at strain rates expected during earthquakes. However, no mechanical couplers have been shown to meet the TM 5-1300 requirements. Therefore, five types of these modern mechanical couplers were selected and tested at the high strain rates expected during structural response to blast loads. This report focuses on the performance of the mechanical couplers at high strain rates.
15. SUBJECT TERMS
Concrete rebar couplers Dynamic material testing
High strain rate Mechanical couplers
Rebar splices Reinforcement bar couplers
16. SECURITY CLASSIFICATION OF: 17. LIMITATION OF ABSTRACT
18. NUMBER OF PAGES
19a. NAME OF RESPONSIBLE PERSON
a. REPORT
UNCLASSIFIED
b. ABSTRACT
UNCLASSIFIED
c. THIS PAGE
UNCLASSIFIED 73 19b. TELEPHONE NUMBER (include area code)
Standard Form 298 (Rev. 8-98) Prescribed by ANSI Std. 239.18