Embed Size (px)
Citation preview

1
ERDExamine.comResearch Digest
John Berardi ◆ 5 Year Anniversary Edition

2
From the EditorFirst, we want to thank you for taking the time to check out the Examine.com Research Digest (ERD). We feel a connection to those who love to get their hands dirty, wading through interesting and complex topics in nutrition and supplementation.
Examine.com was founded five years ago to help cut through the massive amount of misinformation on the web and everywhere else. To make sure we stay unbiased, we have a strict policy of accept-ing no advertising, sponsorship, product samples, or pretty much anything else that could even slightly skew our research. There’s a reason why over 50,000 people visit us every day.
As our reputation grew, health professionals started asking if they could get continuing education credits from reading our reviews. We responded with ERD, which covers new research in depth, using editors and reviewers from academic fields ranging from neu-roscience to immunology. Each month, ERD looks at eight recent papers that are both interesting and practical, and presents them in an easy-to-read and graphically pleasing manner. We are now approved for CECs from NSCA, NASM, The Academy, and more.
John has always been a big supporter of ERD, so we made this special anniversary issue for his readers, containing four ERD articles he thought you would find interesting.
For 72 hours only, we are offering ERD at a sale price of 20% off.
Click here to buy ERD (on sale only until March 17 midnight EST)
Click here to learn more about how Examine.com
evolved over the past five years.
Kamal Patel, Editor-in-Chief
For me, my team, and my colleagues, Examine.com has become our go-to resource for unbiased, meticulously researched, and scientifically credible information .
They review thousands of studies and give bottom-line nutrition and supplement recommendations better than anyone else. And their monthly research review — The Examine Research Digest — is fantastic, full of information and insight. I highly recommend it.
- John Berardi

3
Table of Contents07 A calorie is a calorie ... or is it?
Obesity research typically focus on what you eat, but less frequently touches on when you should eat it. Since animal models have shown strong results for meal timing, this study looked at potential weight-related benefits of eating earlier in humans.
14 Not-so-safe supplementsStudies have shown that supplement buyers generally trust the supplements they buy. That might not be the safest assumption, as dietary supplements that are presumed helpful or neutral may sometimes cause serious side effects, as quantified by this study.
21 I’m not too tired to stuff my faceSleep deprivation and overeating often go hand in hand. This study quantifies the phenomenon.
29 One meal, two meal, three meal, more?While there’s been a lot of research on meal frequency and dieting, no one has summarized all the data until now.

4
ContributorsResearchers
Margaret WertheimM.S., RD
Alex LeafM.S(c)
Courtney SilverthornPh.D.
Zach BohannanM.S.
Anders Nedergaard Ph.D.
Jeff Rothschild M.Sc., RD
Greg PalcziewskiPh.D. (c)
Gregory LopezPharm.D.
Pablo Sanchez SoriaPh.D.
Kamal PatelM.B.A., M.P.H., Ph.D(c)
Editors
Arya SharmaPh.D., M.D.
Natalie MuthM.D., M.P.H., RD
Stephan GuyenetPh.D.
Sarah BallantynePh.D.
Katherine RizzoneM.D.
Spencer NadolskyD.O.
Mark KernPh.D., RD
Gillian MandichPh.D(c)
Adel MoussaPh.D(c)
Reviewers

5
A calorie is a calorie ... or is it?Is the timing of caloric intake associated with variation in diet-induced thermogenesis
and in the metabolic pattern? A randomized
cross-over study

6
IntroductionIs a calorie always a calorie? Technically, yes. One food calorie is equivalent to the amount of energy needed to raise the temperature of one kilogram of water from 15° to 16°C. The emphasis on simply lowering calorie intake for weight loss has long been stressed, and the FDA recently even began requiring chain restaurants, movie theaters, and pizza parlors across the country to post calorie counts on their menus.
However, over the past 15 years, the hypothesis of all calories being equal has been challenged, particularly with regard to lower-carbohydrate and higher-protein diets. There’s some evidence that lower-carb and/or higher-protein diets increase calorie expenditure more than predicted, and therefore the amount of calo-ries retained in your fat tissue could also be less than predicted.
An increasing number of studies in animals have shown that the timing of food intake has an influence on weight gain, glucose control, lipid levels, and inflam-
mation, independent of total daily caloric intake. This is due to circadian rhythms, or our internal body clock, which helps our body predict when we should be sleep-ing, eating, exercising, and so on. While research in this area has been on the rise, this is not a new concept. Daily fluctuations in metabolism were first observed more than 60 years ago, and for nearly 30 years it’s been known that a decrease in carbohydrate oxidation occurs in the evening, compared to the morning. While human studies are currently less conclusive than the animal studies, more research is being undertaken to see how closely these effects translate.
Resting metabolic rate (RMR) refers to the amount of energy used while the body is at rest, or to put it anoth-er way, how many calories your body would use if you were laying down all day. A related measure is diet-in-duced thermogenesis, which refers to the increase in RMR after consumption of food, and accounts for about 10% of daily energy expenditure. This is depicted in Figure 1.
Figure 1: How your daily calories are spent

7
While 10% may seem trivial, the thermogenic response may actually be blunted in obese individuals and these small differences over a long period of time can add up. In fact, it’s the approximate difference in calorie intake (and energy expenditure) between a lean person and an overweight per-son. Additionally, time of day may have an effect on metabolic rate, as the diet-induced thermogenesis after consuming a snack in the morning has been measured to be higher than after the same snack in the evening.
Due to a variety of reasons, including differences in activity, habitual diets, fasting times, and meal sizes, as well as low number of subjects and lack of multiple measurements, the data in the literature on metabolic rate throughout the day is somewhat variable. To study daily variations in diet-induced thermogenesis, measuring RMR under the same conditions at different times of day is required. Accordingly, this new study compared the caloric and metabolic responses to a standardized meal consumed in the morning (8 a.m.) and evening (8 p.m.) in healthy participants after con-trolling for diet, fasting duration and pre-measurement activity level.
Diet-induced thermogenesis refers to the increase in metabolic rate after eating, and may be decreased at certain times of day, as well as in some specific populations.
Who and what was studied?Twenty healthy volunteers (10 men, 10 women, with an average age of 27.6 years) participated in this randomized cross-over study.
Participants were normal weight (BMI 19-26), performed a moderate level of exercise, and were excluded if they smoked more than 10 ciga-rettes per day. Potential participants were excluded if they had any acute or chronic diseases, were on any drugs or supplements, or worked night shifts. Considering the nature of this study protocol, it could not be a dou-ble-blinded study, though it was single-blinded since the researchers who performed the biochemical analyses were blinded to the group assignments.
The study methodology is summarized in Figure 2. Study participants were randomly assigned to receive a standardized meal at the study center at 8 a.m. and, one week later, the same meal at 8 p.m., or vice versa. The meal was quite large, consisting of 100 grams of white bread, 100 grams of ham, 50 grams of cheese, 125 grams of yoghurt, 200 milliliters of fruit juice, plus
Figure 2: How the experiment was
performed

8
25 grams of milk-protein supplement, for a total of 1168 calories (30% protein, 31% fat, 39% carb).
Eight hours prior to this meal, participants also received a standardized meal at home (the same meal but without the protein supplement), and were asked to spend the next six hours in bed. Giving participants a standardized meal eight hours prior to testing allows researchers to control for any lingering thermogenic effects from any previous meals, which may have an effect on the measurements. Neither drinking coffee or alcohol nor smoking were not permitted. Participants were asked to refrain from intense exercise during the week before the tests, and to consume their usual diet while keeping a three-day food diary.
Resting metabolic rate (RMR) was measured prior to eating, as well as 90 minutes after completing the main test meal at 8 a.m. / 8 p.m. (for one hour). Blood samples were drawn every 30 minutes. The main out-come of the study was to measure the changes in RMR
after the morning meal consumption, compared with changes in RMR after the evening meal. Diet-induced thermogenesis (DIT) was calculated as the difference between average after-meal RMR and the basal RMR. Additionally, changes in circulating levels of glucose, insulin, free fatty acids and triglycerides were measured.
Twenty healthy volunteers consumed a standardized meal at 8 a.m. or 8 p.m., and the metabolic response was measured. Eight hours prior to consuming the meal, participants consumed a slightly smaller stan-dardized meal, and were asked to spend the following six hours in bed.
What were the findings?Some of the main study findings are summarized in Figure 3. Fasting RMR was slightly lower in the evening, though this did not reach statistical significance (1519 vs. 1589 kcal, p=0.098).
Figure 3: Metabolic differences between morning and night

9
Values for RMR and DIT were higher after the morn-ing meal (1916 and 328 kcal, respectively) compared with the evening meal (1756 and 237 kcal, respectively). Carbohydrate oxidation made up the bulk of the differ-ences in RMR values, with both fasting and after-meal carb oxidation values being higher in the morning (0.13 g/min and 0.20 g/min, respectively) compared with evening (0.05 g/min and 0.12 g/min, respectively). Basal values of glucose, insulin, free fatty acids, and tri-glycerides were not different from morning to evening. After the evening meal, participants had delayed and larger increases in glucose and insulin concentrations, as well as higher AUC (area under the curve) levels of glucose, insulin, and free fatty acids, compared to the morning meal.
Metabolic rate was higher and glycemic and insu-linemic responses were lower after a morning meal, compared with the same meal consumed in the evening.
What does the study really tell us?This paper offers further evidence that the time of food intake affects both the thermogenic and the metabol-ic responses to meals, with morning meals leading to greater levels of diet-induced thermogenesis and low-ered insulin and glucose responses.
However, due to the atypical eating pattern that was imposed by the study, the findings may not be that relevant to our everyday lives. When setting up an experiment like this, researchers could choose to stan-dardize the meal timing prior to the test meal, or they could keep the meal intervals closer to a natural pat-tern of eating. This might mean 12 hours of overnight fasting but only three to five hours of daytime fasting between lunch and dinner. They chose the former, giv-ing the participants a standardized 1100 kcal meal eight
hours before the test meal and asking them to spend the following six hours in bed. This means people were either eating a very large meal at midnight and then going to sleep (which may happen but is not what most people would do), or eating a large lunch and then spending the afternoon in bed (much less typical).
This approach may be problematic for a number of reasons. One study showed that having a 400 kcal meal at 11 p.m. was enough to elevate blood sugar levels after breakfast the next morning, compared with consuming the last meal of the day at 6 p.m. Another study showed that substituting six hours of sitting with walking and standing was able to reduce insulin levels by 15%.
These results also may have been exaggerated by the large amount of protein consumed at the test meal (about 85 grams of protein), as protein causes the great-est increase in post-meal energy expenditure compared
[...] due to the atypical eating pattern that was imposed by the study, the findings may not be that relevant to our everyday lives.

10
to consuming similar amounts of fat or carbohydrate. Plus, a serving size of protein is more likely to be 30-50 grams (equivalent to a large chicken breast). Finally, it’s possible that only measuring the thermic effect of food for three hours after eating may be missing 40% of the total effect, as measuring up to six hours may be better.
Essentially, few people eat like this, and the authors spe-cifically designed the study in such a way as to increase the chances of seeing an effect. With all that in mind, this study offers a new piece to add to the puzzle, but it would be premature to draw direct recommendations to our daily lives based solely on this evidence.
While the results of this study are interesting, the research design makes it difficult to directly draw practical conclusions.
The big pictureThis study shows that the increase in metabolic rate after a meal is greater in the morning than in the evening. This is consistent with previous research that reported a 31% decrease in diet-induced thermogenesis after an evening meal, compared with the morning. Additionally, AUC values of glucose, insulin, and free fatty acids were higher after the evening meal, compared to the morning meal. This is also in line with previous research show-ing a twofold larger AUC for glucose after eating in the evening compared with morning, regardless of whether participants were fasted for six or 12 hours. That same study found the AUC for insulin was 25-50% greater in the evening, compared to morning meals. Taken togeth-er, it becomes clear that our bodies exhibit a circadian rhythm of glucose tolerance.
There are two key factors that determine the magni-tude of diet-induced thermogenesis, which accounts for approximately 10% of our daily energy expendi-ture. One part is related to the energy required for the
digestion, absorption, and metabolism of nutrients. The other appears to be regulated by the sympathetic nervous system and may exhibit circadian rhythmicity, meaning it changes throughout the day.
It is known that epinephrine (AKA adrenaline) increas-es metabolic rate and glucose oxidation, and varies through the day. Additionally, a decrease in insulin sen-sitivity that occurs in the evening can also play a role in lowering thermogenesis in the evening. Thus, it appears that both circadian fluctuations in epinephrine levels and insulin sensitivity may both contribute to the low-ered amounts of diet-induced thermogenesis observed in the evening.
Practically speaking, a number of other studies have found consumption of greater amounts of energy intake in the evening to be associated with increased risks for metabolic syndrome, obesity, and cardiovascular dis-eases. Specifically, people who ate their main meal later in the day lost less weight than people eating earlier in the day. Another study in women who were overweight found a similar result: a high-calorie breakfast with reduced intake at dinner led to greater weight loss than the opposite pattern, when each group was consuming the same number of calories. This study reinforces what has been becoming increasingly clear: while a calorie is a calorie, it may not act the same way in your body at different times of the day.
Frequently asked questionsIf I feel that I’m more of a “night person,” would this change things? Probably not. A person’s chronotype reflects their indi-vidual circadian phase, and reflects the time of day the individual’s physical functions, hormone levels, body temperature, cognitive faculties, and eating and sleep-ing patterns are active. In a study of 420 individuals that were overweight and following a 20-week weight loss program, participants who followed an earlier eating pattern lost more weight and had better insulin sensi-

11
tivity than those eating later, while chronotype had no effect on the outcomes.
Should I eat a big breakfast and small dinner? This study suggests that if you are worried about weight gain, it may be better to eat a larger amount of food earlier in the day rather than later.
However, in daily life things are different from a con-trolled study environment. For example, exercise will greatly improve your blood sugar control after a meal, as well as increase metabolic rate, and many people go to the gym after work but before dinner. In that case, eating a bigger dinner would likely be much more benign, and possibly favorable. On the other hand, if you are sedentary all day (or work out in the morning) it may indeed be better to have the majority of your calories earlier in the day.
What should I know?Healthy participants were given the same meal at 8 a.m. or 8 p.m., and the metabolic responses to the meal were measured.
The evening meal led to a lowered metabolic rate and an increased glucose and insulin response, compared with the morning meal. This study adds to the growing evidence that energy expenditure and metabolism are regulated by circadian rhythms, and timing of meals may need to be considered rather than simply following a daily calorie goal. ◆
If you’re reading this late at night while snacking, shame shame on you. Go to bed, and wait until tomor-row to check out the ERD Facebook forum discussion on this topic.
This study suggests that if you are worried about weight gain, it may be better to eat a larger amount of food earlier in the day rather than later.

12
Not-so-safe supplements
Emergency Department Visits for Adverse Events Related to
Dietary Supplements

13
IntroductionDietary supplements are sometimes erroneously per-ceived as inherently healthy. And because of the way many supplements are advertised, it’s easy to overlook that improper administration can lead to adverse outcomes.
The classification of a supplement is defined in the United States Dietary Supplement Health and Education Act of 1994 (DSHEA) as a vitamin, miner-al, herb or botanical, amino acid, and any concentrate, metabolite, constituent, or extract of these substances. In the U.S., the Food and Drug Administration (FDA) is the governing body that oversees the regulation of dietary supplements. If a supplement has been report-ed to be causing serious adverse events or reactions, the FDA has the authority to pull it from the market. However, no safety testing or FDA approval is required before a company can market their supplement. The lack of oversight authority given to the FDA has even drawn the attention of late night talk shows hosts like John Oliver, who humorously covered the issue in this YouTube video.
Many adults are using one or more supplements to address illnesses or symptoms, and to maintain or improve health. Half of all U.S. adults have report-ed using at least one supplement in the past 30 days. Twelve percent of college students have reported taking five or more supplements a week. Now, more than ever, there are seemingly endless options to choose from. The number of supplement products currently avail-able on the market is thought to be in excess of 55,000. Compare that to the mere 4,000 available in 1994, when DSHEA was passed.
Furthermore, confidence in the safety and efficacy of these supplements is very high despite the lack of rigor-ous oversight by the FDA. A survey conducted by the trade association, Council for Responsible Nutrition, found that “85% of American adults … are confident in the safety, quality and effectiveness of dietary supple-
ments.” An independent survey has echoed these results, finding that 67.2% of respondents felt extremely or somewhat confident in supplement efficacy and 70.8% felt extremely or somewhat confident about their safety.
While the majority of Americans trust in their sup-plements, more than one-third have not told their physician about using them. There are numerous docu-mented drug-supplement interactions ranging from the mild to the severe. The herb St. John’s Wort is thought to be able to reduce symptoms in people with mild to moderate depression. But this ‘natural’ supplement also has 200 documented major drug interactions, including some with common depression medication. However, no good data currently exists to document how com-mon adverse events related to dietary supplements may be. The authors of the present study have used surveil-lance data to try and fill this knowledge gap.
Due to DSHEA, supplements remain largely unreg-ulated by the FDA. But dietary supplements are becoming ever more popular, as about half of U.S. adults report using one or more in the past 30 days. Trust in the safety and efficacy of these supplements also remains high. The authors of this study aimed to investigate how many annual adverse events are caused by improper supplement usage.
Who and what was studied?The researchers looked at 10 years of data (2004-2013) to estimate the adverse events associated with dietary sup-plements in the United States from 63 different hospitals. The selection of these hospitals was meant to be nation-ally representative and included locations that had 24-hour emergency departments. Trained patient record abstractors reviewed the reports from each hospital to identify cases where supplements had been implicated as the likely source of the adverse event. These abstrac-tors have been trained to analyze and compile medical information contained in patient records.

14
Cases were scanned for emergency room visits where the treating clinician had explicitly ascribed dietary supplements as the root cause of the medical issue. This included herbal or complementary nutritional products such as botanicals, microbial additives, and amino acids, in addition to micronutrients like vitamins and minerals. Products that may typically be classified as food were excluded, like energy drinks and herbal tea beverages. Topical herbal items and homeopathic products were included in the analysis even though they do not fall under the regulatory definition of dietary supplements.
Adverse events were classified as anything causing adverse or allergic reactions, excess doses, unsu-pervised ingestion by children, or other events like choking. Due to the non-standard death registration practices among different hospitals, cases involving a mortality were not included, as were any cases involv-
ing intentional self-harm, drug abuse, therapeutic failures, nonadherence, and withdrawal.
Researchers examined patient records from 2004 to 2013 from 63 different hospitals. Cases where the treating clinician had identified a supplement as the cause of the medical emergency were extracted from the dataset. However, deaths associated with or caused by supplements were not included, as hospi-tals differ in their practice of registering mortalities.
What were the findings?Some of the major findings are summarized in Figure 1. Over 3,600 cases were identified within the prede-termined 10-year period. The researchers extrapolated from these data that the U.S. experienced an average
Figure 1: Supplement safety by the numbers

15
of 23,000 supplement-related emergency department visits per year, with estimates ranging from 18,600 to 27,400. Of these 23,000 emergency room visits, it was calculated that about 2,150 (9.4%) of these result in hospitalization. About 88% of these ER visits were attributed to a single supplement, as opposed to inter-actions or mixtures of multiple supplements. The average age of patients treated for supplement-related adverse events was 32 years, and the majority of these cases were female.
Figure 2 shows age and supplement category related results. About a quarter of ER visits involved people between the ages of 20 to 34, but people older than 65 years old were more likely to have a visit that resulted in hospitalization. Of patients above 65 admitted to the ER, 16% had to be hospitalized. Surprisingly, one-fifth of supplement-related ER visits were due to accidental ingestion by children. When the data covering unsuper-vised ingestion of dietary supplements by children was not included, the researchers found that the majority
of ER visits (65.9%) were due to herbal or complemen-tary nutritional products. The top five products in this category included the following: weight loss (25.5%), energy (10.0%), sexual enhancement (3.4%), cardiovas-cular health (3.1%), and sleep, sedation, or anxiolysis (i.e. anti-anxiety) (2.9%). Multivitamins or unspecified vitamin products were the biggest contributors to ER visits under the micronutrient product category.
ER visits also varied according to gender and age. Weight loss and micronutrient supplements dispro-portionately landed females in the ER, while sexual enhancement and bodybuilding products largely affect-ed males. Among patients younger than four years old and adults over 65, micronutrients were the number one cause of emergency department visits. This is in contrast to the other age groups, where herbal and complementary nutritional products were the biggest contributor. In people ages five to 34, weight loss prod-ucts or energy products were implicated in more than 50% of ER visits. Weight loss products mostly affected
Figure 2: Summary of which types of supplements lead to ER visits by age
Source: Geller AI et al. N Engl J Med. 2015 Oct.

16
patients from 20 to 34 years of age, while the micro-nutrients iron, calcium, and potassium mostly affected those older than 65.
About 23,000 people go to the ER for supplement-re-lated visits every year. The biggest contributors to this are herbal or complementary nutritional prod-ucts like weight loss and energy supplements, which largely affect people between the ages of five to 34. Females are more likely than males to end up in the ER due to adverse supplement reactions. Those over the age of 65 are most at risk for an ER visit due to micronutrient supplements such as iron, calcium, and potassium.
What does the study really tell us?While 23,000 annual supplement-related emergency vis-its may sound high, this is less than 5% of pharmaceutical product-related ER visits. However, these ER admittance rates do not line up with the marketing that has promot-
ed dietary supplements as fundamentally healthy. That is, the general public overwhelmingly perceives these prod-ucts to be safe and effective, but the present data does not support this notion (ERD readers excluded. We think you are all ahead of the curve on this one).
However, it should also be noted that overall incidences of supplement-related ER visits have remained con-stant over time. No significant changes were detected between 2004 and 2013 when accounting for popu-lation increases. The only increase that occurred was ER visits associated with micronutrient supplements, which jumped 42.5%, from 3,212 to 4,578 cases in this same time frame.
Unlike their highly regulated pharmaceutical coun-terparts, there are no legal requirements for dietary supplements to identify any potential adverse effects or major drug interactions on their packaging. The lack of adequate warning labels may be a contributing factor to why histories of dietary supplement usage are rarely obtained by clinicians. This can be due to a combina-tion of clinicians not asking proper patient screening questions and to a lack of disclosure by the patient.
Proprietary Blends
The FDA has established labeling standards dictating what must appear on a supplement’s packaging. Manufacturers must list out each ingredient, and are required to display the amount or percentage of daily value of those ingredients.
A proprietary blend falls under a slightly different set of regulations. Blends are a unique mix-ture of ingredients that are typically developed by the manufacturer. The FDA requires that all ingredients of a proprietary blend be listed on the label in descending order according to pre-dominance of weight. While the amount of the blend as a whole must be listed, the amount of each ingredient included in the blend does not.
Blends are used to help prevent the competition from knowing what the specific formulation is. But it can also hide the fact that very little of an active ingredient may be in the bottle. So while a proven performance enhancing ingredient like creatine may be listed in a proprietary blend, it could be well below what is considered to be an effective dose.
17
Given that there is a tendency to underreport sup-plement usage, the researchers have noted that their calculations of emergency department visits attributed to supplement-related adverse events are probably an underestimation. A further limitation was the relative-ly small sample of hospitals used. But this method of data collection is likely to yield more accurate results over voluntary reporting despite the fact that volun-tary reporting would have likely allowed for a larger sample population.
While 23,000 annual supplement-related emer-gency visits may not be a large contributor to ER visits in the larger scheme of things, it does provide a counter-narrative to the marketing that often portrays supplements as always health promot-ing. Supplements are not required to come with labels warning of adverse events or potential drug interactions, which can be a contributing factor to supplement-related ER visits.
The big pictureThe supplement industry is the wild west of nutrition. By and large, DSHEA has hampered the ability of the FDA to adequately regulate supplements. If you have ever taken a supplement that makes a health claim, you may have encountered this statement on the label: “These statements have not been evaluated by the Food and Drug Administration. This product is not intended to diagnose, treat, cure, or prevent any disease.” While all ingredients must be declared on the label, there is lit-tle oversight to ensure that these ingredients are present in the supplement, at the doses that are advertised on the packaging. Under DSHEA, there is no requirement for companies to provide any data to the FDA showing that their supplement is safe and effective, unless they are introducing a new or novel ingredient. It falls on the FDA to show that a supplement is unsafe before any action can be taken.
In light of this lack of regulatory oversight, if you are currently taking or thinking about adding a supplement to your diet, be sure to notify your doctor. Supplements can interact with prescription medication or could exacerbate certain medical conditions. Warfarin (Coumadin) is a good example. It is a blood-thinning medication that can be prescribed to people at risk of forming blood clots. To ensure that the medication works properly, these patients are usually placed on a low vitamin K diet, as vitamin K plays an essential role in forming blood clots. If these patients do not disclose that they are taking a multivitamin with vitamin K, multivitamins being one of the most commonly used supplements, they could be putting themselves at risk for developing unwanted clots.
Currently, the supplement industry is partially policed by itself. Companies that market and sell supplement products do not have to show the FDA data of safety or efficacy in the same fashion that pharmaceutical companies do. The FDA can step in when a supplement has been shown to cause harm and pull it from the market. It is important to dis-cuss all supplements you may be taking with your doctor to avoid unpleasant or dangerous interactions. Be sure to tell them even if they do not ask during your screening.
Frequently asked questionsIs there any way to ensure that I’m purchasing a quality supplement?? There are companies out there that do supply third-par-ty certifications to supplement manufacturers. These companies will verify that the supplements listed on the ingredient list are present in the concentrations claimed. There are four major companies that provide these certifications, which are shown in Figure 3: NSF International, Informed Choice, Consumer Lab, and U.S. Pharmacopeia. With the exception of Consumer

18
Lab, all of these third-party certifiers print their seal on the products they have screened.
The testing process often involves looking at the puri-ty, strength, and bioavailability of the product. Good manufacturing practices, which help to provide systems that track proper design, monitoring, and control of the manufacturing process and facilities, are also frequently taken into account. Many employ continuous random testing in order for a given supplement to remain cer-tified. It is very important to note that these companies do not test for efficacy. That is to say, these certifications do not ensure that any health claims made about the supplement are truthful.
What should I know?While 23,000 dietary-supplement related ER visits may not seem like a lot when compared to something like the 610,000 deaths caused by heart disease every year in the U.S., it is something that can be easily prevented with education and awareness. Although supplement
related deaths were not included in the ER visit pro-jection, which could lead to an underestimation, it is also possible that emergency department physicians may have incorrectly ascribed certain signs and symp-toms to supplements, which could consequently lead to overestimation. Essentially, the 23,000 annual ER visits should be viewed as a very rough estimation.
If you are currently taking or planning to introduce a supplement to your diet, be sure that you are con-suming the recommended dose for that product and consult your doctor before hand. Supplements are not automatically beneficial for health, no matter what the marketing says. Treat dietary supplements the way you would treat medication, with caution and respect for their ability to both help and harm your health. ◆
An incredibly effective supplement may also be incred-ibly harmful given the right (well … wrong) context. Talk about the under-discussed issue of supplement safety at the ERD Facebook forum.
Figure 3: Third-party supplement certifications

19
I’m not too tired to stuff my face
Altered salience network connectivity predicts
macronutrient intake after sleep deprivation

20
IntroductionThe less we sleep, the more we’ll weigh - that’s what the observational evidence seems to indicate, and some randomized controlled studies have backed this up. But what causes these weight changes at the biological level? Recent research into the sleep-deprived brain has start-ed to answer this question.
One clue comes from brain scans of sleep-deprived sub-jects, which have shown increased activity in response to food in areas of the brain involved with reward, such as the putamen, insula, and nucleus accumbens. Another brain area, the anterior cingulate cortex (ACC), showed increased activity in subjects who were totally deprived of sleep when shown pictures of food, and the activity correlated to how desirable they found the food to be. It seems these brain regions respond more strongly to food when sleep-deprived.
It also turns out that similar regions of the brain also respond to food abnormally in obese people. For instance, one study found increased activation in the ACC, putamen, and insula as well as other brain regions in response to pictures of high-calorie foods in obese people, compared to normal-weight individuals. And the sum of recent evidence suggests that there are differences in the brain activity of obese and normal-weight people.
Many of the brain regions that activate more strongly in response to food stimuli in sleep-deprived and obese people have something in common: they are part of what’s known as the “salience network.” The role of the salience network is to take stock of how the body is doing as a whole, and guide behavior to make things better if something is amiss. It’s the system that draws attention to something that might be useful in your environment, generates some of the impulse to act, and doles out a reward when what was desired is obtained. Could sleep deprivation activate the salience network and make food, or at least certain kinds of food, more palatable? That’s what this study intended to explore.
There’s a wealth of evidence to suggest that sleep deprivation is associated with obesity. Parts of the brain, like the anterior cingulate cortex (ACC), putamen, and insula over-activate in response to food stimuli in both obese and sleep-deprived people. These parts of the brain are known as the “salience network,” which notices things in the environment and drives action to obtain them as needed. This study explored how the salience network was associ-ated with food intake after sleep deprivation.
Many of the brain regions that activate more strongly in response to food stimuli in sleep-deprived and obese people have something in common: they are part of what’s known as the “salience network.”

21
Who and what was studied?Forty-six healthy adults between the ages of 21-50 were recruited for this study. All participants were either of normal BMI or overweight. None were obese. They were also all nonsmokers, and were screened to make sure that they had normal, healthy sleep patterns.
The study protocol is summarized in Figure 1. To start off the study, all of the participants had a baseline functional MRI (fMRI) of their brains done after being allowed nine hours of bedtime for sleep. The day after, their caloric and macronutrient intake was measured. Everybody was allowed to eat whatever and however much they wanted from a provided menu. Since all the food was provided to the participants, the macronutri-ent and caloric intake could be accurately assessed.
The participants were then randomized to either a total sleep deprivation (TSD) condition or a control condition. The participants in the TSD group weren’t allowed to sleep at all for one night, whereas the control group was allowed to sleep for up to eight hours. The TSD group was allowed to do pretty much whatever they wanted to while awake, except exercise (which no one was allowed to do during the course of the study). The two groups then underwent a second fMRI. The following day, mac-ronutrient and caloric intake was measured again.
The main parameter that the fMRIs were measuring was
something called “resting state functional connectivity.” “Resting state” means that the fMRIs were done while the participants were not doing anything besides laying there and having their brains scanned. Sometimes, fMRIs are done while the participants are performing tasks. This was not the case here, hence “resting state.” “Functional connectivity” is the study of how activity in different parts of the brain are correlated. If one part of the brain tends to be active at the same time as another part of the brain, they are both functionally connected. In short, the fMRIs were used to see how different parts of the brain communicated with each other while at rest. Differences in functional connectivity between the sleep-deprived subjects and the controls were examined to see if there was any relationship to macronutrient intake.
Healthy participants with BMIs in the normal or overweight range were randomized to sleep for eight hours in a night or undergo total sleep deprivation (TSD) for a night. Both groups were allowed to eat whatever they liked whenever they liked, and their macronutrient and caloric intake was measured. Brain scans using functional magnetic resonance imaging (fMRI) were performed at baseline and afterwards to measure whether the communication between different parts of the brain (the “functional connectivity”) was affected by sleep deprivation and if they correlated to macronutrient intake.
Figure 1: Study protocol

22
What were the findings?The participants randomized to TSD did not differ from the controls in any measurements at baseline, including their macronutrient and caloric intake. This is good, since any differences between them after the intervention are more likely to be attributable to sleep deprivation than statistical accident.
The TSD group consumed as many calories on the day after being deprived of a night’s sleep as they did at baseline (when they were allowed a full night’s sleep) on average, which was about 2250 calories. However, the TSD group did consume a higher percentage of those calories as fat and ate significantly fewer carbohydrates
compared to their baseline day, when they were allowed to sleep. Overall, about 4% more of the total daily calo-ries came from fat after sleep deprivation as compared to baseline.The amount of protein intake was not differ-ent in the TSD group between baseline and the day after sleep deprivation. There were no differences in mac-ronutrient or caloric intake percentages in the control group between the two days.
However, the TSD group also ate about 900 calories worth of food while awake. The control group didn’t eat anything. After all, it’s hard to eat when you’re asleep (although it does happen sometimes). This means that the total caloric intake for the TSD group was higher, and is completely attributable to nighttime eating while staying awake.
fMRIs in a nutshell
Figure 2: What fMRI measures in a nutshell
Active parts of the brain need oxygen and sugar car-ried by the blood in order to function. When a part of the brain becomes more active, the body meets the increased demands of the active neurons by provid-ing more oxygen- and glucose-rich blood to that part of the brain.
Functional magnetic resonance imaging uses this change in blood flow in order to see what parts of the
brain are active. It turns out that oxygen-saturated hemoglobin behaves differently than oxygen-de-pleted hemoglobin when placed in a magnetic field. When oxygen-rich blood rushes in to feed active parts of the brain, we can see this by applying some strong magnetic fields (as seen in Figure 2, along with some fancy computational techniques) and infer which parts of the brain are functioning.

23
Certain brain changes were seen to correlate to the changes in percent fat and carbohydrate intake in the sleep-deprived participantts. Specifically, functional connectivity between the ACC and putamen (shown in Figure 3) was positively correlated to increased fat intake and decreased carbohydrate intake, and unrelat-ed to protein intake. A similar correlation was observed with functional connectivity between the ACC and anterior insula. No other correlations between func-tional connectivity and macronutrient intake were seen, and no changes in FC were seen in the control group.
More calories were eaten after sleep deprivation in the TSD group than at baseline, when participants were able to get a full night’s sleep, due entirely to eating while they stayed awake at night. They ate a similar amount of calories during the day after sleep deprivation as they did after a full night’s sleep. However, they ate a higher percentage of calories as fat and a lower percentage as carbs compared to the day after they were able to sleep. Functional connec-tivity between the ACC and the putamen and insula (parts of the “salience network”) correlated with increased fat and decreased carbohydrate intake.
What does the study really tell us?This study speaks to two things: how total sleep depri-vation affects caloric and macronutrient intake (at least in the short term), and how sleep deprivation may affect the brain, which leads to these changes in macro-nutrient intake.
In this study, sleep deprivation led to increased over-all caloric intake of close to 1000 calories on average. Perhaps somewhat surprisingly, though, this increase in calories was entirely attributable to nighttime eating. At baseline, when the TSD group was allowed a full night’s sleep, they ate as many calories during the day as they
did when they were sleep deprived. However, they took in a higher percentage of those daytime calories as fat, and fewer as carbs, when sleep-deprived.
Why did the TSD group eat during the night? Boredom is a possibility, but not a very strong one, as the sleep-de-prived subjects were allowed to do whatever they wanted (read, watch TV, play games, etc.) except exercise. So it’s hard to say what mind state led them to eat at night. This study didn’t address the psychological reasons behind their eating. However, it did take a look at neurological reasons.
What do the fMRIs tell us about this? In terms of night eating, not a whole lot. Measurements weren’t taken to see brain changes that led to night eating. However, there were correlations between changes in functional connectivity and macronutrient intake the day after sleep deprivation. Specifically, functional connectivity
Figure 3: Functional connectivity in the sleep-deprived brain

24
between the ACC and the putamen and the ACC and the insula correlated with increased fat intake. However, unless you’re a neuroscientist, that probably doesn’t make things much clearer. So, let’s break it down.
Recall from the introduction that the ACC, insula, and putamen are all part of what’s known as “the salience network,” whose job is to identify things that the body needs. Specifically, the ACC is known to be activated when the body is challenged physically, and helps guide behavior to overcome the obstacle. Sleep deprivation is one such bodily challenge, and has been shown to increase ACC activity in response to food in previous studies. The insula is known to play a role in labeling objects and aspects of the environment as helpful and calling them to attention. Increased functional connec-tivity between the ACC and insula seems to indicate that the ACC senses a stress (sleep deprivation) and asks the insula to bring attention to potential solutions. Meanwhile, the putamen is known to also play a role in the detection of salient stimuli like the insula, but in addition may play a special part in anticipating the stimulus. In a separate study, sleep deprivation has been shown to enhance the reward reaction of the putamen and insular cortex to positive experiences. Sleep depri-vation causing an increase in functional connectivity between the ACC and putamen implies that the ACC is asking the putamen to be on the lookout for and antic-ipate positive stimuli, which would then be rewarded more than usual if obtained.
In short, the ACC senses stress (sleep deprivation) and recruits the putamen and insula to look out for and anticipate rewarding stimuli. One thing that the ACC and insula find rewarding is dietary fat. We know this because the ACC and insula are known to activate after oral fat intake.
This is necessary background to understand what hap-pens in the brain when it is sleep deprived, and why it leads to increased fat intake. The ACC, under stress
from lack of sleep, asks the insula and putamen to keep a sleepy eye out for anything that may help the body in this time of need. The insula motivates behaviors to achieve these goals, and the putamen creates anticipa-tion and rewards obtaining the stimuli more than usual. Fat is a stress reliever for the tired brain, which may explain why sleep-deprived people ate more fat.
Note that these results and the story revealed by this study may not extend to everybody. The participants in this study were all healthy, somewhat young (no older than 50), and were either of normal weight or overweight. The findings of this study may not extend to children, the elderly, sick people, or obese people. Also, keep in mind that this study was done during total sleep deprivation, and the results may not completely carry over to partial sleep deprivation over long stretches of time.
Fat is a stress reliever for the tired brain, which may explain why sleep-deprived people ate more fat.

25
Normal weight or overweight and otherwise healthy individuals ate close to 1000 calories at night while awake. While they didn’t eat any more calories than usual the day after being sleep-deprived, a higher percentage of their calories came from fat at the expense of carbs. Brain imaging suggests that the reason they ate more fat the following day was due to their fatigued brains being stressed, and searching for reward via eating more fat.
The big pictureSeveral clinical trials have demonstrated that a sleep deficit seems to cause increased caloric intake, going beyond the observational evidence mentioned in the Introduction, which can only establish correlations. One trial found over a 500 calorie per day increase in intake after depriving participants of sleep, with no change in energy expenditure. Another study yielded similar results in terms of sleep deprivation having no effect on energy expenditure. Researchers observed an increase in caloric intake closer to what was seen in the study under review, around 1000 calories per day. It also showed similar effects, in that meal intake amounts were similar, and that most of the calories came from snacks. Interestingly, the snacks that were eaten tend-ed to be higher in carbohydrates and lower in fat than before sleep deprivation, the opposite of what was seen here and in the studies discussed below. A third trial showed that increased caloric intake due to sleep defi-
cits leads to weight gain, indicating that insufficient sleep may indeed contribute to putting on the pounds.
The phenomenon of sleep deprivation leading to increased fat intake is also pretty well-studied. One trial found an increased intake of energy and fat, specifically saturated fat, associated with sleep deprivation. Another study found that, in addition to increased fat intake, excess calories were consumed during the late-night hours while sleep-deprived. And while the current study didn’t report the macronutrient content of late-night eating, another study filled that gap and found that higher fat foods were consumed at night as well.
Overall, it’s pretty well-established that sleep depri-vation causes excess caloric intake. In most cases, fat is consumed in higher quantities by sleep-deprived people. This study adds a look into the brains of sleep-deprived people to the literature, which hints at the mechanism behind why the brain may crave more fat. The salience network is a brain region to watch for in future research about obesity and fat intake.
Several clinical trials have established that sleep deprivation leads to a higher energy intake, often during night hours, and sometimes an increased per-centage of those calories coming from fat. This trial confirmed many of these results and took the further step of providing a brain-based mechanism for why increased fat intake may occur.
Several clinical trials have demonstrated that a sleep deficit seems to cause increased caloric intake [...]

26
Frequently asked questionsCool study, but what are the practical implications? If the salience network is involved in weight gain and obesity, then, in theory, interventions that affect the salience network may limit weight gain. The research is still in its early stages on what exactly can affect the salience network, but one study has shown that mind-fulness meditation alters the salience network, as well as integrates it with other networks. The practical implications of this, especially in terms of weight gain, aren’t understood well. However, the evidence so far seems to indicate that mindfulness interventions may be useful for curbing overeating. Interestingly, exercise does not seem to affect the salience network, but may affect another network called the default mode network (which is roughly what your brain does when it’s idling), which may reduce food intake as well. There is proba-bly a lot more going on the in the brain related to food intake beyond the salience network. Neuroscience is complicated!
Any advantages to not eating at night beyond fewer calories? Maybe. A recent study (abstract #0317 here) that was just presented at the SLEEP 2015 conference found that sleep-deprived people who were not allowed to eat at night were more vigilant the following day, performing better on a battery of psychological tests compared to sleep-deprived people who ate at night. In addition to fewer calories, not eating at night when you’re sleep deprived may also make you a little more alert the fol-lowing day.
How little sleep will lead to weight gain? This study didn’t directly explore this question, but in the introduction, the authors mention that less than six hours of sleep a night puts people at substantial risk for weight gain and obesity. However, the exact num-ber varies a little from study to study. For instance, one observational study states that the risk is increased for people who get less than five hours of sleep per night
as opposed to those who get more than seven, with no difference in risk between people who slept for more than eight hours versus sleeping seven hours.
You mostly talked about the TSD group above. Anything interesting happen with the control group? Not really, but that’s a good thing. All the action hap-pened in the sleep-deprived group, and all the major measures were performed within groups, not between groups. What the control group tells us is that noth-ing weird went on just because the participants were locked up in a lab for a few days, which is important information in itself. It’s perfectly possible that being under scrutiny by people in white lab coats and being fed from a fixed menu may have caused brain or dietary changes. But nothing like that was observed in the con-trol group, which increases researcher confidence that all the changes we saw in the TSD group were really due to being deprived of sleep, and not being locked up in a strange environment for a few days.
What should I know?This study found that total sleep deprivation leads to more calories eaten overall, but those calories were all consumed at night. Sleep deprivation did not affect the amount of calories consumed the following day. However, it did lead to a higher percentage of those cal-ories coming from fat, at the expense of carbohydrates. Changes in the brain’s “salience network” (regions which control what to pay attention to in the environ-ment and what would be rewarding at a given time) accounted for the increased fat intake. ◆
Tired of bad conversations? Increase your intake of salient discussion over at the ERD Facebook forum!
27
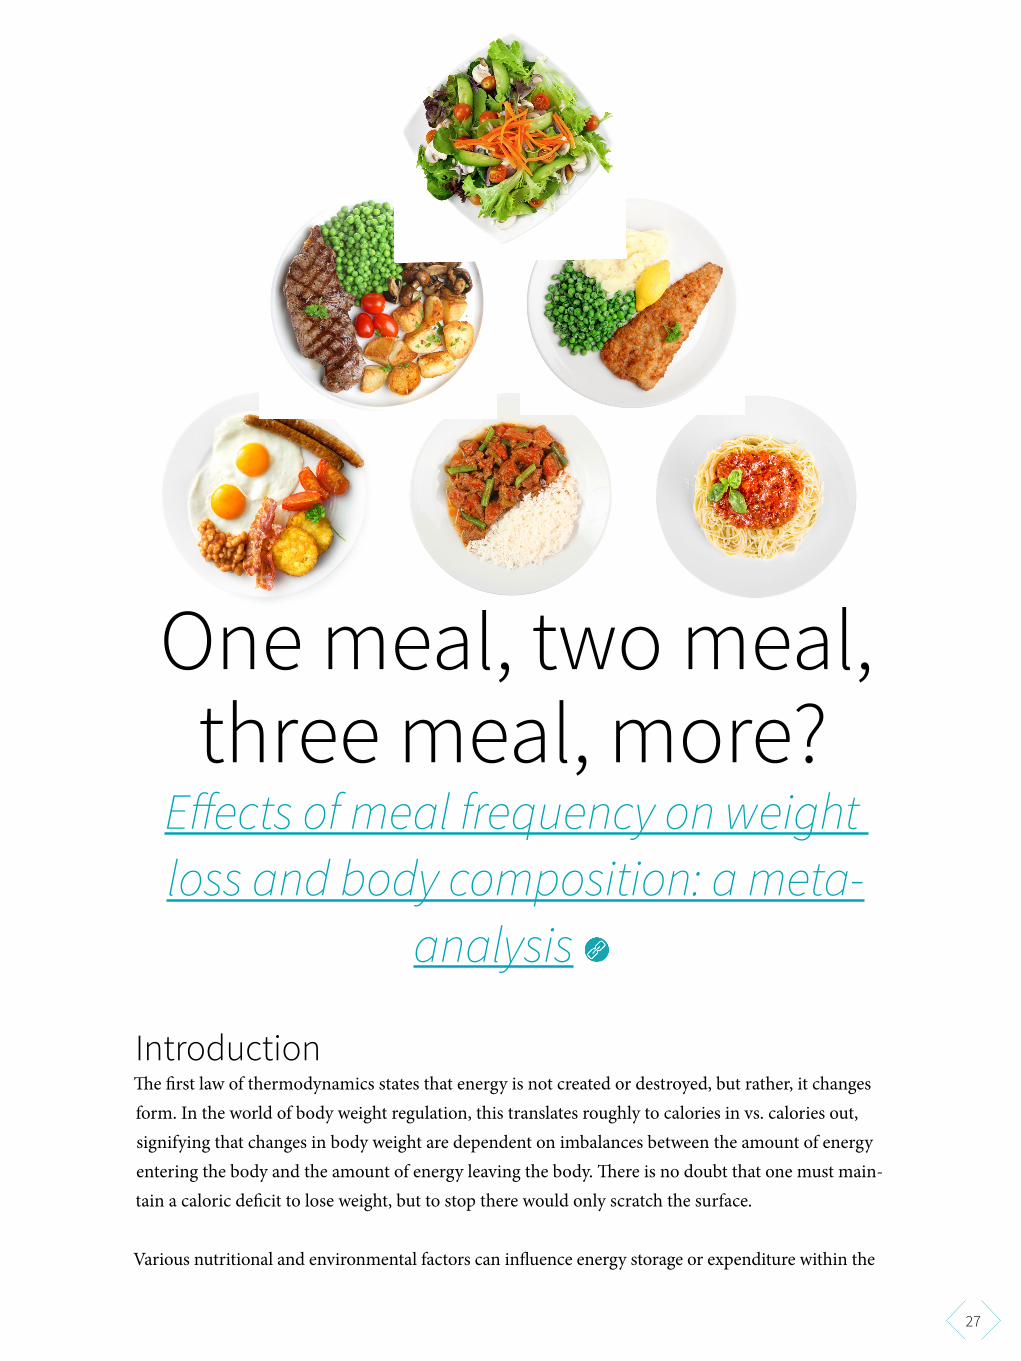
One meal, two meal, three meal, more?
Effects of meal frequency on weight loss and body composition: a meta-
analysis IntroductionThe first law of thermodynamics states that energy is not created or destroyed, but rather, it changes form. In the world of body weight regulation, this translates roughly to calories in vs. calories out, signifying that changes in body weight are dependent on imbalances between the amount of energy entering the body and the amount of energy leaving the body. There is no doubt that one must main-tain a caloric deficit to lose weight, but to stop there would only scratch the surface.
Various nutritional and environmental factors can influence energy storage or expenditure within the

28
context of the first law of thermodynamics. For instance, resistance training can help partition a portion of excess calories toward muscle growth rather than fat storage. Consumption of protein is not only necessary for muscle growth, it is also more thermogenic than carbohydrates or fats. Moreover, intense exercise attenuates the detrimental metabolic effects of overfeeding, and also leads to greater fat loss when compared to no exercise.
Another suggested method of optimizing body composi-tion outcomes is meal frequency. The idea that eating small, frequent meals enhances fat loss and aids in weight man-agement dates back to the classic skinfold thickness data of 379 Czechoslovakian men published in The Lancet in 1964. Since then, observational data has supported the relation-ship between eating frequency and obesity risk. Proposed mechanisms for the benefits include appetite regulation, improved glucose tolerance, and the thermic effect of the meals. Additionally, increased meal frequency has been shown to play a crucial role in the anabolic responses to resistance training.
Despite an apparent theoretical basis, studies assessing the relationship between meal frequency and body composition have conflicting results, perhaps from differences in the study populations and procedures. Thus, the current study was a meta-analysis aimed at pooling the outcomes of these studies to clarify on the relationship between meal frequen-cy and changes in fat mass and lean body mass.
There have been many studies done to determine the effect of meal frequency of weight managment. The study under review is a meta-analysis, meaning researchers pooled data from previous studies to determine correla-tion and other relationships.
Who and what was studied?No one was studied, per se. Instead, the data from existing studies was gathered and included in several meta-analyses. This allows for greater statistical power to detect outcomes
of interest, as well as the ability to identify patterns, discrep-ancies, and relationships between the included studies. In order to be included in the current meta-analysis, the stud-ies were required to meet five inclusion criteria:
1. Had to be a randomized controlled trial (RCT) pub-lished in English
2. Had to compare unequal feeding frequencies of less than three meals per day with more than three meals per day
[...] studies assessing the relationship between meal frequency and body composition have conflicting results, perhaps from differences in the study populations and procedures.

29
3. Had a study duration of at least two weeks4. Reported a pre- and post-measure of body composition5. Used human subjects over 18 years of age
As we can see from the five criteria, there was a lot of wig-gle-room for study procedures. What measures of body composition were used? Were the unequal feedings calo-rie-controlled? Was protein equal? Were the subjects young, old, overweight, or normal weight? Nonetheless, a search of the literature for all studies from the beginning of time to November 2013 ultimately yielded 15 studies to include in the analysis.
A meta-analysis for each measure of body composition was created in which the number of meals per day was the only experimental variable. Since meal frequency outcomes can be affected by numerous other factors such as initial body mass of the participants, caloric intake, and actual number of meals, a reduced meta-analysis was created that controlled for these factors. These reduced analyses were then used to generate outcomes when meal frequency was categorical (1-2, 3-4, 5+ meals) or binary (high vs. low).
Thus, each outcome had essentially three meta-analyses, the simple continuous (e.g., for each additional meal/day), the reduced binary, and the reduced categorical.
The reduced models generated by the researchers were then subject to permutation testing. Each study included in the analysis was removed one at a time and the outcomes were re-calculated. This method allows the researchers to identify highly influential studies that may have skewed the results.
This study analyzed the findings from 15 studies. Studies had to meet five criteria to be eligible for inclusion, which included a human subjects requirement and a study dura-tion of at least two weeks.
What were the findings?Understanding the basics of the studies included in the meta-analysis is important to contextualize the outcome. Figure 1 summarizes some important study characteris-tics. Most of the studies used participants who were under
Figure 1: Study characteristics

30
49 years old, overweight or obese, and sedentary, with no exercise added to the trial. Also, seven of the studies were less than four weeks in duration, with only four studies lasting longer than 12 weeks. The inherent limitations of the included studies translate directly to the meta-analysis and will thus greatly limit the generalizability of the results to, for example, the elderly or lean athletes.
Meal frequency was not significantly associated with changes in body weight. However, body weight is a crude outcome when it comes to dieting because it fails to account for changes in body composition.
Most people imply fat loss when they discuss weight loss. In this regard, the simple meta-analysis (with results shown in Figure 2) did find a statistically significant reduction of 0.25 kilograms of fat mass with each additional meal. But remov-al of a single study (Iwao, et al) from the analysis made this finding not significant (p=0.04 → p=0.44). Additionally, in the reduced models, higher meal frequencies resulted in
an average of 0.89 kilograms more fat loss than lower meal frequencies, with more than five meals resulting in 1.24 kilograms more fat loss than one to two meals. But these results also became not significant after the permutation test. Under no circumstances were the differences between one to two and three to four meals or three to four and more than five meals statistically significant.
The reason people imply fat loss when they say ‘diet is because they want to preserve any and all lean body mass (LBM) they have. Unfortunately, the outcomes for preserva-tion of LBM follow the same path as the outcomes for body fat. There was a trend for more meals to preserve more LBM (+0.22 kilograms with each additional meal) that became nowhere near significant when the same study that impact-ed the fat mass outcomes was removed (p=0.07 → p=0.96). The only reduced model to show a significant difference was more than five meals vs. one to two meals per day, and this was not supported by the permutation test results.
Figure 2: Meal Frequency effect on fat mass, by study

31
Although outcomes for body weight, fat mass, and LBM were not significant in any regard, there still exists a possibility that their interaction in the form of body fat percentage could be. Indeed, for each additional meal there was a significant reduction of 0.23%. But just as with the other outcomes, removal of a single study made this out-come not significant. Even with the study remaining in the data set, the significance disappeared when other covariates were controlled for in the reduced models, and the permu-tation test also failed to support a significant finding.
Body fat percentage, fat mass, and lean body mass at first appeared to change significantly based on meal frequen-cy, with each additional daily meal associated with a 0.23% reduction in body fat. By removing a single study from the analysis, however, the statistical significance disappeared.
What does the study really tell us?On the surface, the results appear to favor eating more fre-quently, as the meta-analyses found significant reductions
in fat mass with greater preservation of LBM as the number of meals consumed increased. However, these outcomes were highly influenced by a single study, the removal of which rendered the results not significant. Moreover, the magnitude of the outcomes was so small that any possible benefits may have limited practical relevance.
It is worth digging into the influential study to determine why it would have such a profound impact. This study found that boxers consuming six meals per day lost less LBM and showed lower measures of muscle catabolism than boxers consuming the same diet in two meals per day. While we should applaud the fact that the diets were otherwise matched between the groups, its intrinsic design limitations reduce its relevance.
Aside from the short study duration (two weeks) and small sample size (12 men, no women), energy and protein intake was incredibly low at 1200 kcal and 60 grams (one gram per kilogram) per day, respectively. To emphasize how minor these values are, previous research has shown that even 2.3 grams per kilogram of protein with over 2,000 kcal per day cannot fully offset the loss of LBM in a dieting athlete. In such catabolic circumstances, it is not entirely surprising that eating more frequently would lead to greater LBM retention.
Once the above study was removed from the analysis, meal frequency was found to had no influence on body compo-sition. However, these results are limited to the populations used to generate them. That is, overweight and obese sed-entary individuals. The boxer study was the only study included in the meta-analysis that looked at athletes.
With this in mind, it is important to look at yet another study that was highly influential in the significant outcome favoring body fat percentage reductions with increasing meal frequency. In this study, 28 middle-aged, sedentary, obese adults (85% women) underwent a four-week weight maintenance phase followed by a four-week dieting phase in one of three groups consuming 25% less kcal than need-ed to maintain weight, which was roughly a 500 kcal daily
The boxer study was the only study included in the meta-analysis that looked at athletes.

32
deficit. The three groups were two high-protein groups (35% PRO, 45% CHO, and 20% FAT) consumed either as six meals or three meals per day, and a low-protein group consuming three meals per day (15% PRO, 60% CHO, and 25% FAT).
What made this study unique is that it used a high-protein diet, whereas nearly all the other studies used low to moder-ate amounts. In the high-protein groups, it was shown that consuming six meals resulted in greater reductions in body fat percentage, primarily through an increase in lean body mass, when compared to the other groups. Importantly, the six meals were spread 2.5 to three hours apart and con-tained at least 20 grams of protein each, which may explain why LBM increased.
Nonetheless, the significant positive effect for meal frequen-cy on body fat percentage in this meta-analysis was also completely explained by variances in total energy intake, as the reduced models that controlled for this showed no significant outcome. Additionally, all but two of the stud-ies included in the analyses did equalize calories between treatment groups. This strongly suggests that under calo-rie-controlled conditions, meal frequency does not alter body composition outcomes.
Though initially the analysis under review suggested that more meals per day is associated with more fat loss, once caloric variation in the analysed studies was accounted for, the relationship disappeared.
The big pictureIt’s hard to overemphasize the importance of the specific study populations and interventions when trying to figure out where each piece of the puzzle fits. The meta-analysis at hand focused solely on body composition outcomes during caloric restriction in primarily sedentary, overweight, and obese populations. The big picture really depends on the individual. So let’s review some of the evidence on meal frequency in different populations and outcomes.
Normal weight populations Only three studies in the current analysis were performed on lean individuals, with only the boxer study using athletes. In one of the studies, fat mass was found to increase marginal-ly (~0.44% body fat) when going from four to three meals, despite a small reduction in caloric intake. In the other study, reducing from three to one meal a day reduced body fat. The results of these studies offer conflicting ideas, since reducing intake from four to three meals leads to slight fat gain, but dropping further still to one meal a day results in greater fat loss. It is difficult to draw conclusions given the scarcity of research in lean and healthy, let alone athletic, populations. Important caveats to these studies are that they included low protein intake (~16% of kcal) and lacked exercise. Moreover, these studies were designed to maintain weight, and there is reason to believe that outcomes would be different during times of caloric excess, such as during a “bulk.”
Muscle gain
In one of the studies, fat mass was found to increase marginally when going from four to three meals, despite a small reduction in caloric intake.

33
Some research, primarily using amino acid infusions, sug-gests that skeletal muscle can become insensitive to further stimulus for protein synthesis (MPS) in what is called the
“muscle full” hypothesis. Originally, researchers demonstrat-ed that raising blood amino acid concentrations to about 70% above basal levels led to an increase in MPS after about 30 minutes, which was maintained until two hours when MPS rapidly declined back to baseline despite the mainte-nance of high blood amino acid concentrations. Two years later, the researchers built upon this work and showed that it is the concentration of amino acids outside (extracellular), but not inside (intracellular), the muscle fibers that stimulate MPS. It was also suggested that it is the changes in extra-cellular amino acid concentrations rather than the absolute availability of amino acids that was driving these changes.
In other words, it is a change from low to high blood amino acid concentrations that stimulate MPS. Since levels return to baseline after about two to three hours, consuming another protein-rich meal at this time in a rinse-and-repeat manner would theoretically maximize MPS. In support of this, it has been shown that consuming four doses of 20 grams of whey protein every three hours is superior to consuming eight 10 gram doses every 1.5 hours or two 40 gram doses every six hours for stimulating MPS throughout the day. Although it should be kept in mind that increased MPS does not necessarily translate into increased muscle mass. Nonetheless, this could also explain why the boxer study had more LBM retention with six meals per day and why the high-protein overweight study actually had muscle growth with six meals per day.
Blood sugar and cholesterol Another area of interest with regard to meal frequency and timing is in blood glucose regulation. An early study compar-ing a standard three meal diet to an identical 17-snack diet found that the nibbling pattern of eating reduced fasting total and LDL cholesterol, as well as fasting insulin concentrations despite no differences in blood glucose or triglycerides. In the previously mentioned one-meal per day study, there were no differences of diet on blood glucose, but total, LDL, and HDL cholesterol were 11.7%, 16.8%, and 8.4% higher, respec-tively, in participants consuming one meal per day than in people consuming three meals per day. Additionally, a sepa-rate analysis of this study population showed that one meal per day resulted in higher fasting glucose levels and impaired morning glucose tolerance. However, both 17 snacks and one meal per day are at the extremes of meal frequency and quite unrealistic for most people.
To that end, a study in healthy, young, physically active men and women compared the glucose and insulin response to three vs. six meals consumed over the course of 12 hours, with blood measurements being made every 15 minutes. This frequent sampling greatly aids in giving us a full pic-ture of what happens over the course of a standard eating window, and the sample population makes the results more
[...] having higher protein intake that is consumed evenly across the day in three hour intervals appears to be beneficial for fat loss and LBM retention.

34
relevant to healthy people and athletes alike. The conditions were identical in caloric content, with the only difference between the distribution of the calories over the 12 hours, and the composition of the meals were 65% carbohydrate and 15% protein. It was found that glucose levels remained elevated throughout the day with six meals compared to three meals, although no difference was found in the insulin values. When these conditions were compared to a six-meal high-protein diet of equal calories (45% protein; 35% carbohydrate), both blood glucose and insulin levels were at their low-est in the high-protein condition.
This final study demon-strates the difficulties in drawing conclusions, as a simple swap from carbohydrate to protein changes the playing field in terms of metabolic response. However, there is a consistent pattern to the research that supports the muscle full hypoth-esis in normal weight, overweight, obese, sedentary, and physically active popu-lations. In other words, having higher protein intake that is consumed evenly across the day in three hour intervals appears to be beneficial for fat loss and LBM retention. As for carbohydrates and fats, more research is needed to know how meal frequency interacts with these macronutrients to impact health and body composition outcomes.
Adherence and appetite While most studies have been conducted in calorie-con-
trolled environments, a diet is only as good as your adherence to it. How meal frequency impacts sensations of hunger can make or break a diet, especially for people not accustomed to tracking food intake. Some evidence sug-gests that snacking, at least in the current nutrient-dense and widely available food environment, may contribute to
positive energy balance and weight gain.
At the same time, people eating one meal per day report significantly greater hunger than those eating three meals per day, and people consuming three meals also show greater satiety than those con-suming two meals per day. However, there does not appear to be a significant difference between three and six meals per day in appetite ratings. It seems reasonable to conclude that satiety increases with meal frequency until about three meals per day, where no further increase is seen. This is partially supported by other research showing
that higher protein intake promotes greater satiety, but that consuming six meals per day actually reduces sensations of fullness compared to three daily meals.
So what is the big picture when addressing meal frequency? It is hard to say given that at least half the puzzle pieces are missing, and the other half are scattered. In overweight and obese people, meal frequency doesn’t appear to influence body composition when dieting, but research in lean and athletic populations is lacking. Higher protein diets spread-
Some evidence suggests that snacking, at least in the current nutrient-dense and widely available food environment, may contribute to positive energy balance and weight gain.

35
ing consumption out across the day appears to favor LBM growth and retention, but research on other macronutri-ents is lacking. Eating less frequently may have detrimental effects on glucose and lipid metabolism, but long-term studies are needed to confirm this. So for now, the big pic-ture suggests a meal frequency that you enjoy.
Frequently Asked QuestionsSome people say more frequent meals spurs greater thermic effect of food, some say that’s bollocks. What’s the truth? It takes calories to metabolize and use the food that we eat. This energy expenditure is called diet-induced thermogen-esis (DIT). Although there are clear differences between macronutrients with regard to DIT, with protein being the greatest, followed by carbohydrates then fats, the truth is that meal frequency differences tend towards being bollocks.
It is true that consuming a single giant meal will produce a greater thermogenic response than consuming a smaller meal, but if the DIT of all the small meals were added over the course of the day, there would be no difference from
the single giant meal. This has been demonstrated with one vs. two meals, two vs. three meals, and two vs. seven meals. One study in humans (and an earlier study with dogs) showed a thermogenic benefit from higher meal frequency, but as seen in Figure 3 the bulk of evidence shows no differ-ence with different meal frequencies.
Something to keep in mind, however, is that DIT and the overall thermogenic response is only one piece of the puz-zle. While it may not be different with meal frequency, carbohydrate and fat oxidation rates are. For instance, three meals have been shown to increase 24-hour fat oxidation in healthy women when compared to two meals. Higher meal frequencies appear to favor relatively constant carbohydrate and fat oxidation throughout the day, whereas lower meal frequencies show greater reliance on carbohydrates after a meal and greater reliance on fat during the fasting periods. Of course, this is also subject to the type of meal consumed (i.e. macronutrient amounts).
How frequently do humans eat in a more natural setting, like in indigenous tribes?
Figure 3: Mixed evidence for thermogenic effect of increased meal frequency

36
Despite the often claimed ancestral meal pattern of inter-mittent fasting, there is relatively little research actually exploring meal frequency; most literature focuses on nutrient consumption. The theory of feast-and-famine is characterized by alternating periods of high and low degrees of prosperity, and is commonly observed in more carnivorous predators such as those living in the African savannah. Since humans are omnivorous, many in the paleo community have applied this concept to us as well, claiming that humans did not have frequent access to food and fre-quently went 16 hours or longer without eating.
However, this line of thinking is purely theoretical, and a recent study strongly challenges this idea. In this study, researchers gathered information from a database con-taining over 186 preindustrial global societies coded with thousands of different variables, including famine, diseases, marital patterns, incidences of conflict, location, rainfall, temperature, plant productivity, and many others. They compared hunter-gatherer societies to agriculturalists and found significantly less frequent famine in hunter-gatherer societies than in agricultural societies, even after adjust-ment for habitat quality.
In addition to the above, it was also found that warm-cli-mate hunter-gatherers had a significantly lower frequency of famine than cold-climate hunter-gatherers, but that planning for famine was significantly more common in cold-climate hunter-gatherers. This is in agreement with other research demonstrating modern hunter-gather-ers to frequently engage in various forms of food storage, including drying and smoking of meats to prevent spoilage. Moreover, a recent analysis of Amazonian hunter-gatherers found that they consumed no less than 55 various fruits on the spot during foraging and hunting, which is no different than snacking.
We cannot say for certain how frequently our ancestors ate, and the intermittent fasting explanation is appealing. However, more recent evidence based on modern forager societies sug-gests that in a natural setting, humans do consume set meals
and snacks. They store food for consumption later on, such as in the morning after waking, and snack on foods (if available) that are found during times of physical exertion.
I’ve heard about eating around four meals a day, with BCAAs in between to maximize muscle gain. Is that a worthwhile strategy? The primary BCAA is leucine, which has been found to independently and significantly stimulate muscle pro-tein synthesis in young and healthy adults with as little as 3.42 grams. This has been exemplified by a recent study comparing MPS among various protein and amino acid combinations both alone and in combination with resis-tance training in healthy young men. The researchers found that 25 grams of whey protein isolate (three grams total leucine) was no different from 6.25 grams of whey protein supplemented with leucine (5 grams total leucine) in the subsequent 4.5 hour total protein synthetic rate.
However, protein synthesis requires all amino acids, so stimulating it with leucine or BCAAs alone is like telling someone to build a wall without bricks. Thus, taken in combination with the “muscle-full” hypothesis discussed earlier, using BCAAs in-between meals does appear to be an efficient way to keep maximize muscle gain if schedule or preference does not allow for an actual meal. Just ensure that the time between meals and the BCAAs isn’t too long or too short, somewhere around 2.5 to three hours.
Should meal frequency be different if you lift first thing in the morning, versus after work in the evening? Not necessarily, and much will depend on personal prefer-ence. If you lift in the morning, you may choose to consume a small meal before and after the session or train fasted and eat afterwards. Either way, everyone will have their own
“feeding” window that they enjoy. Typically it is eight to12 hours, and one recommendation would be to consume a meal with protein every three to five hours within that time-frame so as to stimulate muscle protein synthesis as often as feasible.

37
Does meal frequency matter as much when you’re doing intermittent fasting (either a set window per day or even alternate-day fasting)? In many of the studies exploring meal frequency, intermit-tent fasting is somewhat built in to the study protocols. For instance, the study that compared one meal daily at dinner time had at least a 20 hour fast between meals by necessity, while the standard three-meal group had at least a 12 hour overnight fast between dinner and breakfast. However, oth-er studies have controlled for this.
One of the previously mentioned studies in overweight and obese individuals compared a traditional 3-meal diet to a high-protein diet consumed as either three or six meals within a 12 hour feeding window. The results favored the six-meal high-protein group for reductions in body fat percentage and increases in LBM, which had participants eating at least 20 grams of protein every 2.5 to three hours (the 3-meal conditions ate every five to six hours). Similarly, six carbohydrate-rich (65% CHO; 15% PRO) meals con-sumed over 12 hours results in significantly greater blood glucose levels and lower insulin levels over the eating win-dow timeframe when compared to the same diet consumed as three meals. Yet, consuming six protein-rich meals (35% CHO; 45% PRO) led to even lower glucose and insulin concentrations.
So meal frequency may matter depending on the goals of the individual, as well as the length of the fast and the com-position of the diet. If the person is overweight and looking to shed some pounds to become healthier, then meal fre-quency appears to be less important than diet composition in the grand scheme of things. Research regarding leaner and/or athletic populations is lacking, but from a theoret-ical standpoint, consuming protein-rich meals every three hours would be ideal to maximize muscle protein stimulus. Depending on the length of the intermittent fast, this could range from three meals within an eight hour feeding win-dow, to five meals within a 12 hour feeding window.
What should I know?Research is lacking, mostly! There are far too many variables that influence how our bodies and minds interact with meal frequency, meal size, meal composition, etc. The current meta-analysis provides strong evidence that in sedentary overweight adults, the meal frequency they enjoy should be the one they follow. That said, there may be advantages to consuming a higher protein diet spread throughout the day. As for other populations, it is too soon to make definite recommendations. ◆
With all these different study samples and diets, can we real-ly conclude much about meal frequency in general? Talk it over at the ERD Facebook forum.
[...] using BCAAs in-between meals does appear to be an efficient way to keep maximize muscle gain if schedule or preference does not allow for an actual meal.

38
In closing...Thanks again for reading ERD. We enjoy helping people stay up to date on research, whether you’re dietitians, trainers, physicians, or simply people interested in improv-ing your health.
Click here to learn more about how Examine.com evolved over the past five years.
Kamal Patel, Editor-in-Chief
For me, my team, and my colleagues, Examine.com has become our go-to resource for unbiased, meticulously researched, and scientifically credible information .
They review thousands of studies and give bottom-line nutrition and supplement recommendations better than anyone else. And their monthly research review — The Examine Research Digest — is fantastic, full of information and insight. I highly recommend it.
- John Berardi

39
CreditsCopy Editor: Dmitri BarvinokInfographics: Antonius Khengdro, Hieu Nguyen, Jessie Alley & Calla Lee
©iStock.com/pacopole©iStock.com/STILLFX©iStock.com/3alexd©iStock.com/aluxum ©iStock.com/ffolas ©iStock.com/MikeyGen73 ©iStock.com/Jaaske©iStock.com/Floortje ©iStock.com/JoeGough