Embed Size (px)
Citation preview
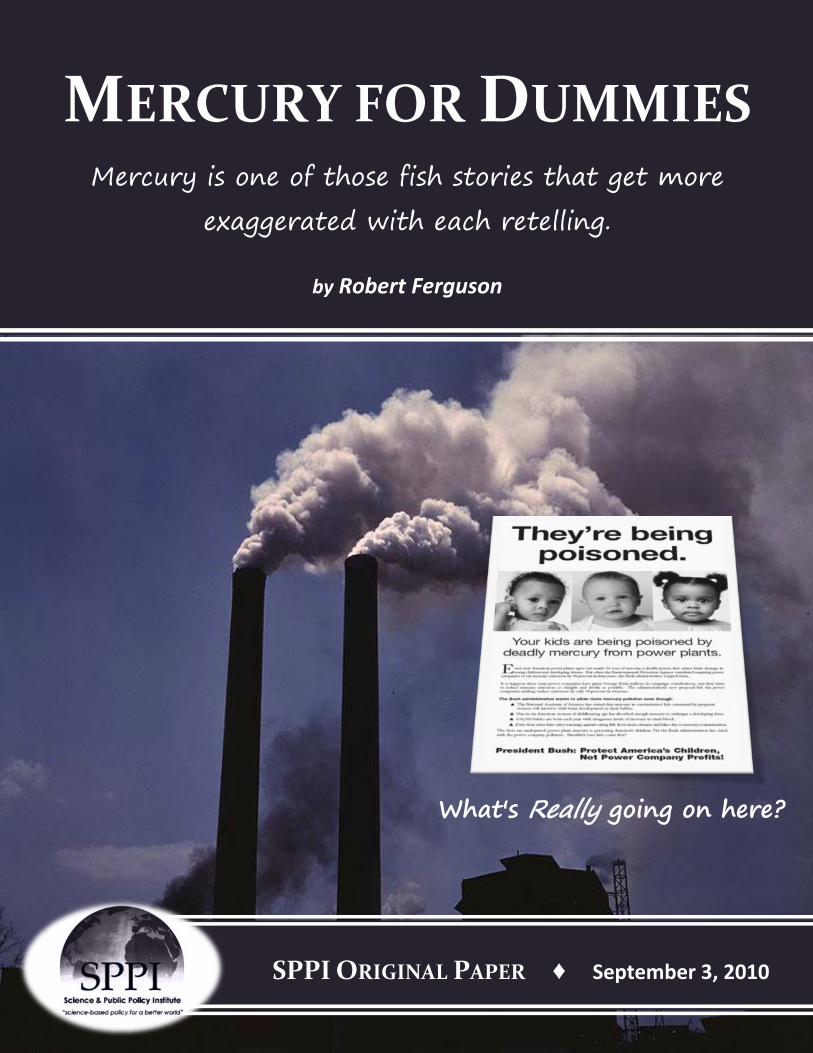
What's Really going on here?
SPPI ORIGINAL PAPER ♦ September 3, 2010
MERCURY FOR DUMMIES
Mercury is one of those fish stories that get more
exaggerated with each retelling.
by Robert Ferguson
2
MERCURY FOR DUMMIES
by Robert Ferguson | July 31, 2010
Mercury is one of those fish stories that get more exaggerated with each retelling.
The scientific literature fails to support the hypothesis that the trace amount of naturally occurring mercury in the fish we eat in any way endangers or threatens health, especially that of expectant mothers and their babies. Exactly the opposite is true: those alarming people away from fish pose the real danger to public health. This is so because mercury has likely been naturally occurring in fish for as long as fish have been on the planet, and mercury exposure levels in humans have not increased in centuries, as evidenced by tests on 100+ years old fish samples and on human remains dating as far back as 400AD. The alarmism is driven by EPA’s ignoring of any contrary science and by its arbitrary extremism on setting a safe exposure level with unjustified large safety cushions. EPA’s RfD is far more restrictive by multiple times than that established by most other scientific agencies here and around the world. Playing off EPA’s bad science, the mainstream media and professional environmental organizations shamelessly exploit for personal gain modern cultural anxieties about exposure to harmful substances and age-old, normal concerns of pregnant women. This only serves to incite health-damaging anxiety and life-threatening poor choices. The bad science employed to bureaucratic and ideological ends, wastes valuable research dollars by running them through a sieve designed to retain the dross and let the gold wash away. Thus, we are all poorer and less safe and healthy as a result. EPA MERCURY CLAIM SIMPLIFIED In a highly simplified form, what is being hypothesized by some at EPA and hysterically asserted by the environmental industry and an uncritical media is that there exists both correlation and causation between a gaseous form of elemental mercury (Hg) emitted from U.S. coal-fired plants and permanent hypothetical brain damage in fetuses and young children. This purportedly results from maternal consumption of fish with toxic and dangerous levels of methylmercury (MeHg). Or as Friends of the Earthy puts it in superstitious, medieval terms, “power plants are poisoning our children.” There are two proposed remedies to this emotion-driven claim. The first step is EPA will make the fish “safe” again to eat by reducing the fish tissue MeHg concentration levels through draconian regulation of the tiny U.S. power plant Hg air-borne emissions (.08% of 6,000 annual
tones; non-U.S. man-made 42%; natural from oceans and surface volcanoes 39%; natural from biomass burning 16%; total natural 55%). This “remedy” flows from a series of false or strained assumptions. Primary are that (a) amounts of mercury and mercury emissions flux in nature are accounted for, (b) these amounts are in general steady-state (unchanging over time) and harmless, and (c) anomalies from (a), real or imagined, are all anthropogenic driven, and always harmful. In other words, a fanciful and ominous paradigm of the physical world is constructed and sold as reality. This is not unlike declaring that the creatures, physical laws and cultures of Tolkien’s Middle Earth are actually those of planet earth, and then forming public policy accordingly. Step two is that until EPA can get the fish tissue mercury levels down to “safe” levels, people should follow State “fish advisories” to restrict or eliminate fish from their diets. (Practically, because neither EPA nor States can ever permanently change levels in fish, these advisories stand as enduring monuments to the triumph of ignorance, superstition and ideology over human welfare.) In other words, reduce intake of the “poison.” The practical message, especially for pregnant women and mothers of young children, is don’t eat or prepare any fish meals at all. Such a tragic state of affairs is exactly what a dozen Senators and several Federal agencies warned EPA about nearly a decade ago. Complicit in this tragedy have been assorted professional environmental organizations, the media, politicians and academics -- all employing deception and fear for personal gains of fund-raising, market share, political influence and research grants. When anyone attempts to attract to themselves attention, advantage and funding by making alarmist pronouncements far outside the current scientific understanding, they harm the credibility of science and its role in public policy, to say nothing of endangering the public. Like any organization, EPA and professional NGOs are run by people with strengths, limitations and personal agendas. They can do good or they can cause serious harm. Public outcomes are more important than motivations, and the outcome of mercury alarmism and politics is nothing but harmful. EPA’s mercury hypothesis can be tested by examining at least four questions:
1. Is EPA behaving in a rational and responsible manner?
2. If human activity did not increase fish mercury tissue concentrations, how can EPA regulate a decrease?
3. Where are all the victims from fish consumption?
4. Is EPA the one really endangering public health?
4
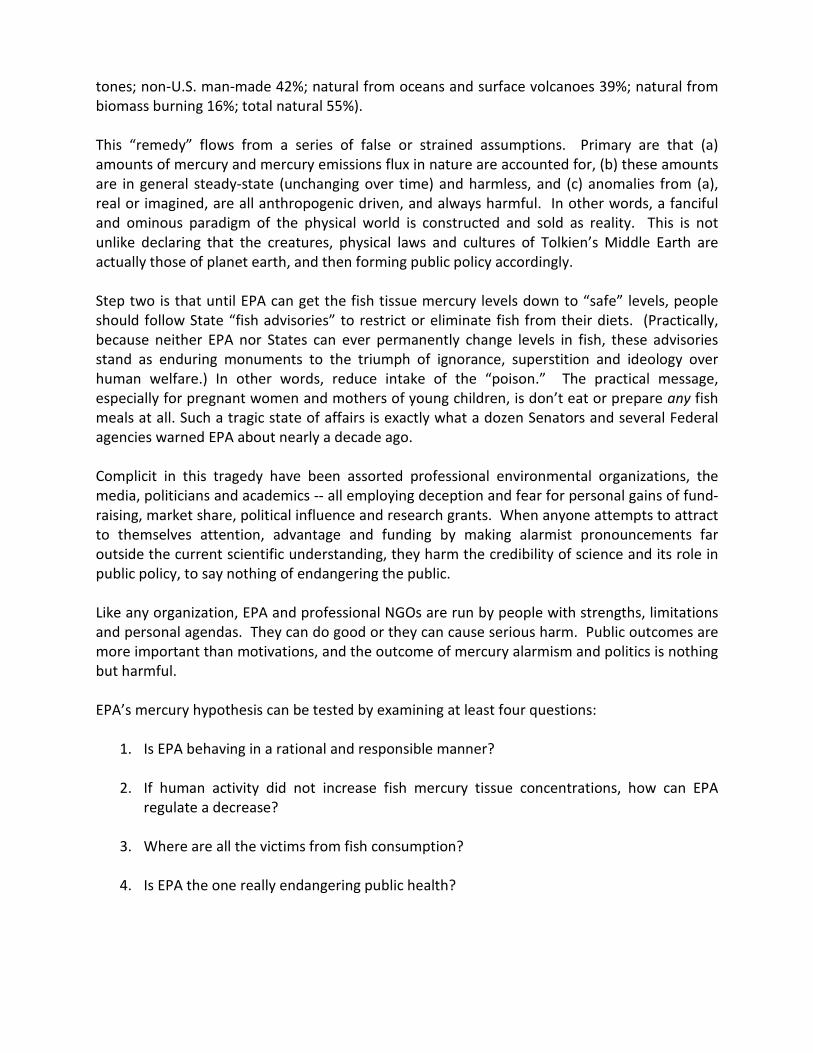
1. Is EPA behaving in a rational and responsible manner?
EXHIBIT A: WRONG TARGET The Chief Physician of the Faroe hospital system and co-author of the study publicly and emphatically stated: “...fish consumption does not harm Faroese children. In the contrary the fish consumption most likely is beneficial to their health.” (Pal Weihe, Open Letter to the Boston Herald, Feb-2-04). The only concern was over eating Pilot whale meat and fat. (Coke with orange juice and vodka) The authors and the Danish govt. refuse to release the raw data for other researchers to examine. This is highly unscientific. How can EPA or the National Research Council seriously cling to the Faroe study for its RfD for fish consumption when the lead author states the study has nothing to do with MeHg in fish, but only in whale meat? How can Dr. Grandjean claim associations between IQ levels in Faroese children and fish consumption when Dr. Weihe reports that those children (a) are not exposed to harmful levels of MeHg by eating fish, (b) are exposed to no health threat from fish, and (c) actually benefit from maternal fish consumption? A post NRC (2000) analysis by Dourson et al. (2001, Neurotoxicology, vol. 22,677-689) recommended that “The Faroe Islands data are from exposures to a mixture of chemicals. The Seychelles Island data are from exposures to primarily one chemical, methyl Hg. ... We would ... encourage EPA to use the Seychelles Island data as the basis of its methyl Hg RfD.” This is why it is scientifically appropriate to challenge the biased conclusions of NRC (2000) and hence EPA’s basis for its MeHg RfD.
5
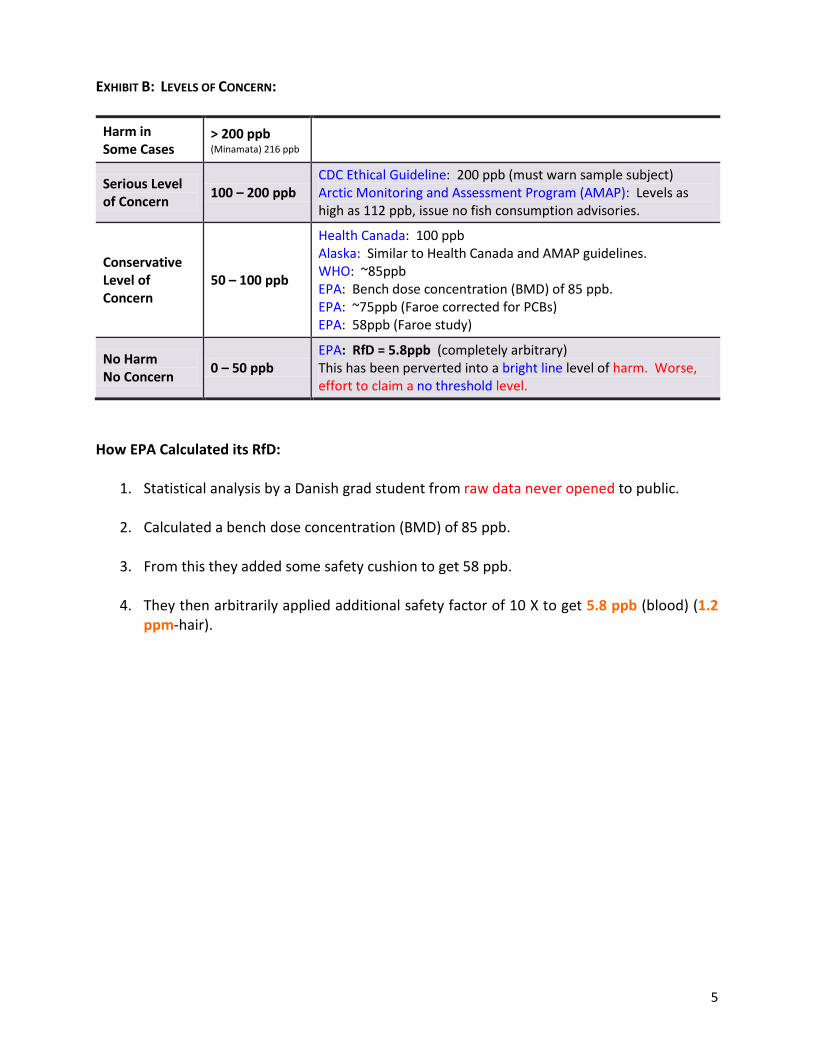
EXHIBIT B: LEVELS OF CONCERN:
Harm in Some Cases
> 200 ppb (Minamata) 216 ppb
Serious Level of Concern
100 – 200 ppb CDC Ethical Guideline: 200 ppb (must warn sample subject) Arctic Monitoring and Assessment Program (AMAP): Levels as high as 112 ppb, issue no fish consumption advisories.
Conservative Level of Concern
50 – 100 ppb
Health Canada: 100 ppb Alaska: Similar to Health Canada and AMAP guidelines. WHO: ~85ppb EPA: Bench dose concentration (BMD) of 85 ppb. EPA: ~75ppb (Faroe corrected for PCBs) EPA: 58ppb (Faroe study)
No Harm No Concern
0 – 50 ppb EPA: RfD = 5.8ppb (completely arbitrary)
This has been perverted into a bright line level of harm. Worse, effort to claim a no threshold level.
How EPA Calculated its RfD:
1. Statistical analysis by a Danish grad student from raw data never opened to public.
2. Calculated a bench dose concentration (BMD) of 85 ppb.
3. From this they added some safety cushion to get 58 ppb.
4. They then arbitrarily applied additional safety factor of 10 X to get 5.8 ppb (blood) (1.2 ppm-hair).
6
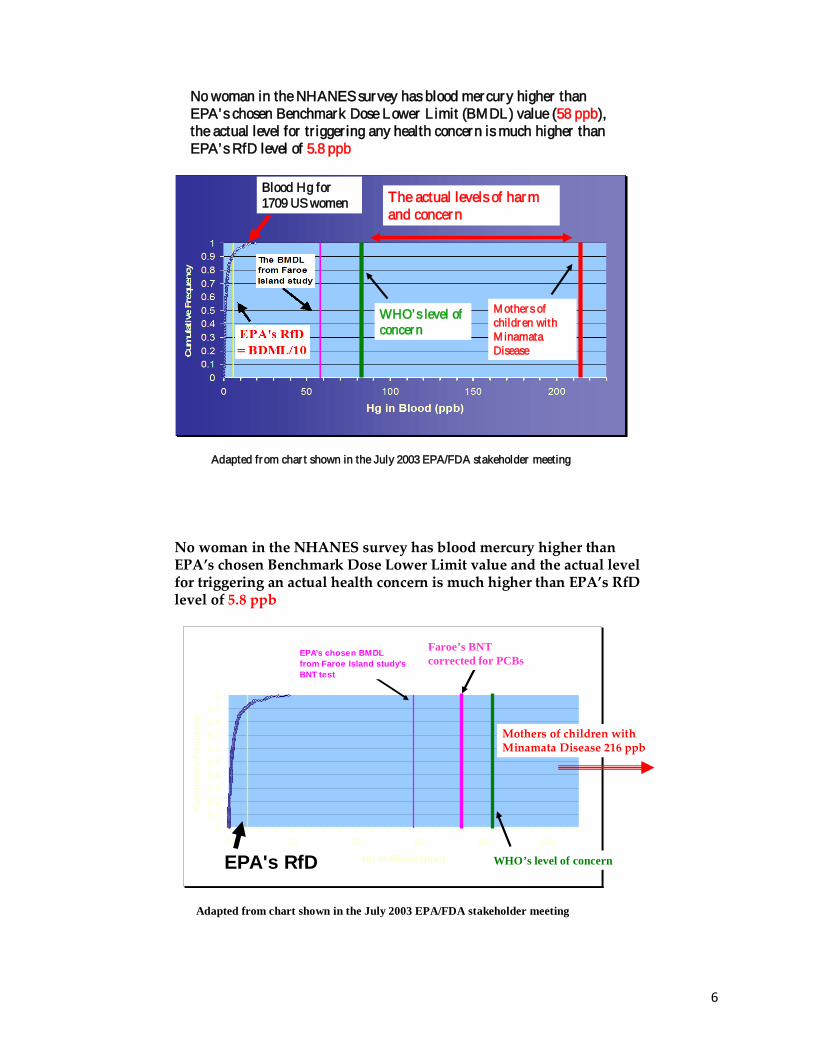
No woman in the NHANES survey has blood mercury higher than EPA’s chosen Benchmark Dose Lower L imit (BMDL) value (58 ppb), the actual level for tr iggering any health concern is much higher than EPA’s RfD level of 5.8 ppb
Adapted from char t shown in the July 2003 EPA/FDA stakeholder meeting
WHO’s level of concern
Mothers of children with M inamata Disease
Blood Hg for 1709 US women The actual levels of harm
and concern
No woman in the NHANES survey has blood mercury higher than EPA’s chosen Benchmark Dose Lower Limit value and the actual level for triggering an actual health concern is much higher than EPA’s RfD level of 5.8 ppb
00.10.20.30.40.50.60.70.80.9
1
0 20 40 60 80 100
Hg in Blood (ppb)
Cum
ulat
ive
Freq
uenc
y
EPA's RfD
EPA's chosen BMDLfrom Faroe Island study's BNT test
Adapted from chart shown in the July 2003 EPA/FDA stakeholder meeting
Faroe’s BNT corrected for PCBs
WHO’s level of concern
Mothers of children with Minamata Disease 216 ppb
7
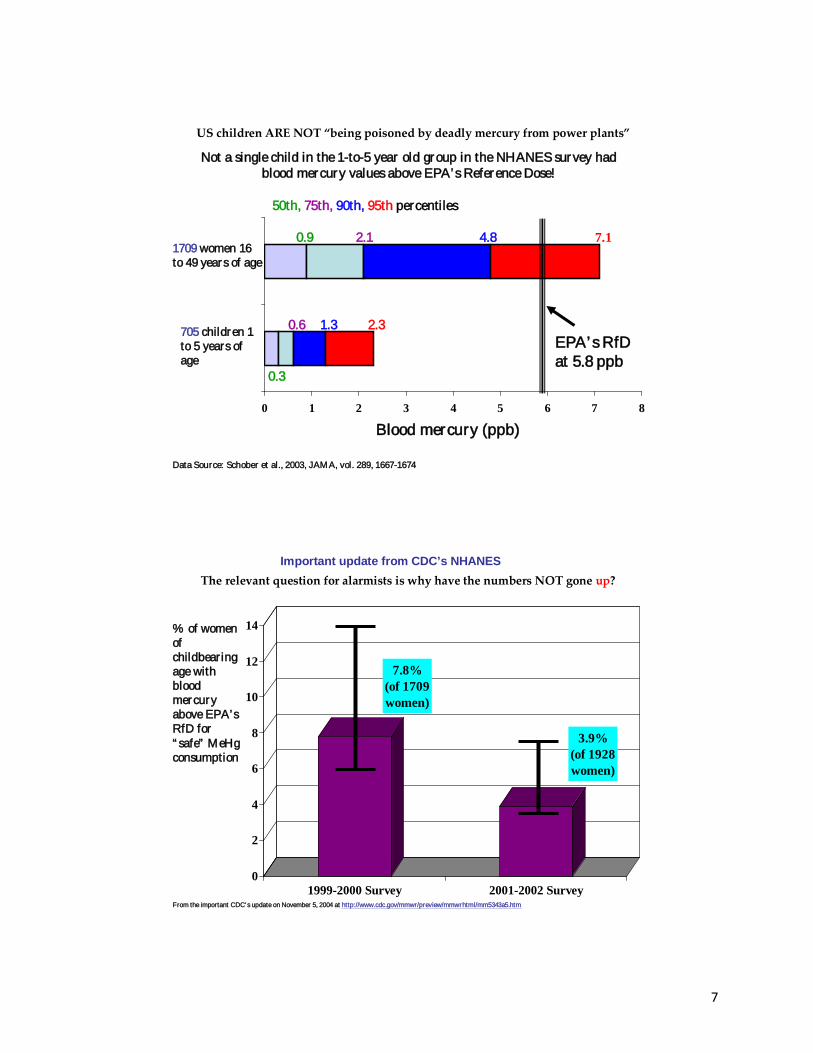
Not a single child in the 1-to-5 year old group in the NHANES survey hadblood mercury values above EPA’s Reference Dose!
0 1 2 3 4 5 6 7 8
50th, 75th, 90th, 95th percentiles
Blood mercury (ppb)
1709 women 16 to 49 years of age
705 children 1 to 5 years of age
Data Source: Schober et al., 2003, JAMA, vol. 289, 1667-1674
0.9 2.1 4.8 7.1
2.31.30.6
0.3
EPA’s RfD at 5.8 ppb
US children ARE NOT “being poisoned by deadly mercury from power plants”
7.8% (of 1709 women)
3.9% (of 1928 women)
0
2
4
6
8
10
12
14
1999-2000 Survey 2001-2002 Survey
% of women of childbearing age with blood mercury above EPA’s RfD for “ safe” MeHg consumption
From the important CDC’s update on November 5, 2004 at http://www.cdc.gov/mmwr/preview/mmwrhtml/mm5343a5.htm
Important update from CDC’s NHANESThe relevant question for alarmists is why have the numbers NOT gone up?
8
EXHIBIT C: ARCTIC MONITORING AND ASSESSMENT PROGRAM Officials from the international Arctic Monitoring and Assessment Program have pointed out their mistrust of EPA RfD because it only considers the hypothetical potential risks and does not take into account the well-known actual benefits of fish consumption. For example native women of Nunavik have average blood levels of 16.6ppb (2ppb-112ppb) and suggest no restrictions at all because they know that a seafood diet is rich in selenium and vitamin E, which strong antioxidants are known to protect against mercury toxicity. EXHIBIT D: ALASKA Alaska uses exposure guidelines from Health Canada and WHO, and will not issue any fish advisories for restricted consumption. It encourages pregnant women to eat all the seafood they can because of multiple health benefits to the woman and her fetus, including enhanced brain development and cognitive abilities. EXHIBIT E: SELENIUM AND OTHER ANTIOXIDANTS IN FISH It has long been well known in the scientific literature that fish naturally contain strong antioxidants such as Selenium and vitamin E that modify the MeHg into a biologically inactive compound. In other words it demethylates the mercury, preventing it from entering the brain. Small amounts of Se have been shown to protect against large amounts of mercury. All fish accumulate Se along with the mercury, but in a higher ratio. Salmon ranges from a Se advantage of from 3:1 – 25:1. Tuna is also very high in Se content. “There are, however, major differences between the diet of Faroese and the diet of Inuits, and care must be exerted before one concludes that Inuit children are at risk. … [I]n view of the high selenium intake [in the diets of the Inuit population from consumption of mattak - beluga whale skin - which is about 2.4 times higher than that measured in the Farose], which may counteract methylmercury-induced toxicity, local public health authorities did not recommend reducing seafood consumption. ” (Dewailly et al., 2001) EXHIBIT F: WARNING FROM SENATE
United States Senate, Washington, D.C. March 14, 1996 The Honorable Carol Browner Administrator, Environmental Protection Agency 12th Floor, Room 1200, Mail Code #1101 401 M Street, S.W., Washington, D.C. 20460 Dear Ms. Browner: In recent months we have expressed concern to both you and the Secretary of Health and Human Services about the scientific methodology relating to seafood safety sections of early drafts of a U.S.
9
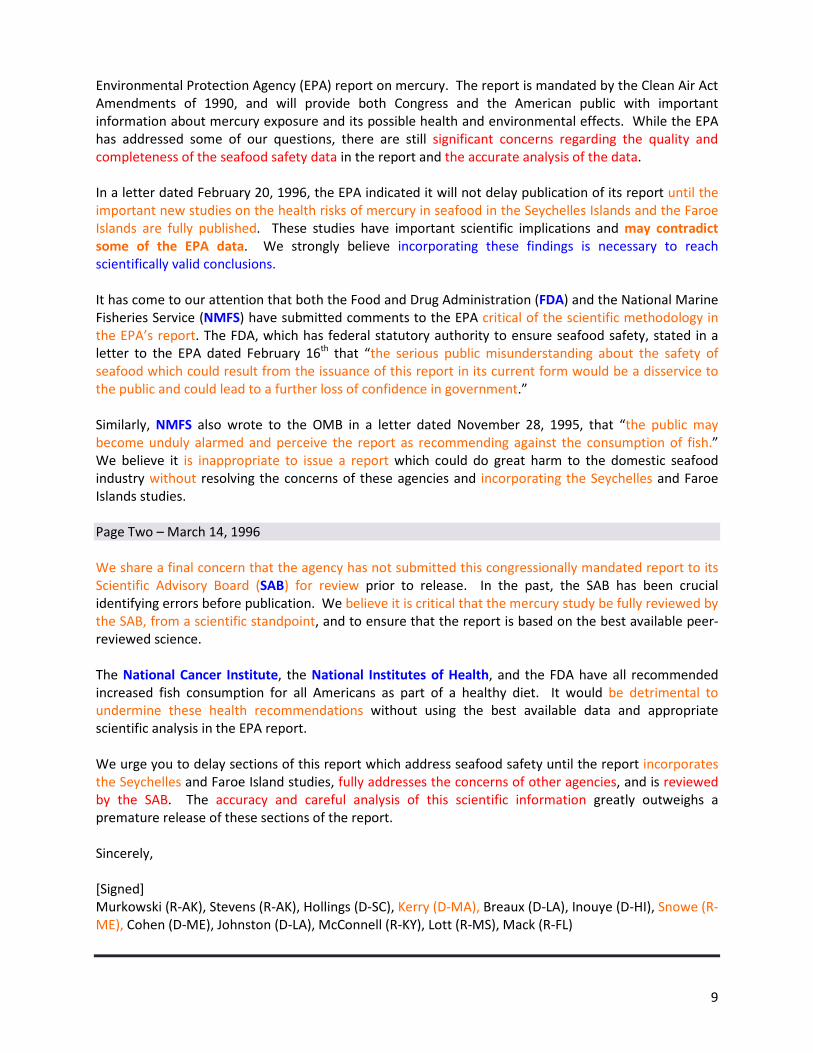
Environmental Protection Agency (EPA) report on mercury. The report is mandated by the Clean Air Act Amendments of 1990, and will provide both Congress and the American public with important information about mercury exposure and its possible health and environmental effects. While the EPA has addressed some of our questions, there are still significant concerns regarding the quality and completeness of the seafood safety data in the report and the accurate analysis of the data. In a letter dated February 20, 1996, the EPA indicated it will not delay publication of its report until the important new studies on the health risks of mercury in seafood in the Seychelles Islands and the Faroe Islands are fully published. These studies have important scientific implications and may contradict some of the EPA data. We strongly believe incorporating these findings is necessary to reach scientifically valid conclusions. It has come to our attention that both the Food and Drug Administration (FDA) and the National Marine Fisheries Service (NMFS) have submitted comments to the EPA critical of the scientific methodology in the EPA’s report. The FDA, which has federal statutory authority to ensure seafood safety, stated in a letter to the EPA dated February 16th that “the serious public misunderstanding about the safety of seafood which could result from the issuance of this report in its current form would be a disservice to the public and could lead to a further loss of confidence in government.” Similarly, NMFS also wrote to the OMB in a letter dated November 28, 1995, that “the public may become unduly alarmed and perceive the report as recommending against the consumption of fish.” We believe it is inappropriate to issue a report which could do great harm to the domestic seafood industry without resolving the concerns of these agencies and incorporating the Seychelles and Faroe Islands studies. Page Two – March 14, 1996 We share a final concern that the agency has not submitted this congressionally mandated report to its Scientific Advisory Board (SAB) for review prior to release. In the past, the SAB has been crucial identifying errors before publication. We believe it is critical that the mercury study be fully reviewed by the SAB, from a scientific standpoint, and to ensure that the report is based on the best available peer-reviewed science. The National Cancer Institute, the National Institutes of Health, and the FDA have all recommended increased fish consumption for all Americans as part of a healthy diet. It would be detrimental to undermine these health recommendations without using the best available data and appropriate scientific analysis in the EPA report. We urge you to delay sections of this report which address seafood safety until the report incorporates the Seychelles and Faroe Island studies, fully addresses the concerns of other agencies, and is reviewed by the SAB. The accuracy and careful analysis of this scientific information greatly outweighs a premature release of these sections of the report. Sincerely, [Signed] Murkowski (R-AK), Stevens (R-AK), Hollings (D-SC), Kerry (D-MA), Breaux (D-LA), Inouye (D-HI), Snowe (R-ME), Cohen (D-ME), Johnston (D-LA), McConnell (R-KY), Lott (R-MS), Mack (R-FL)
10
2. If human activity did not increase fish mercury tissue
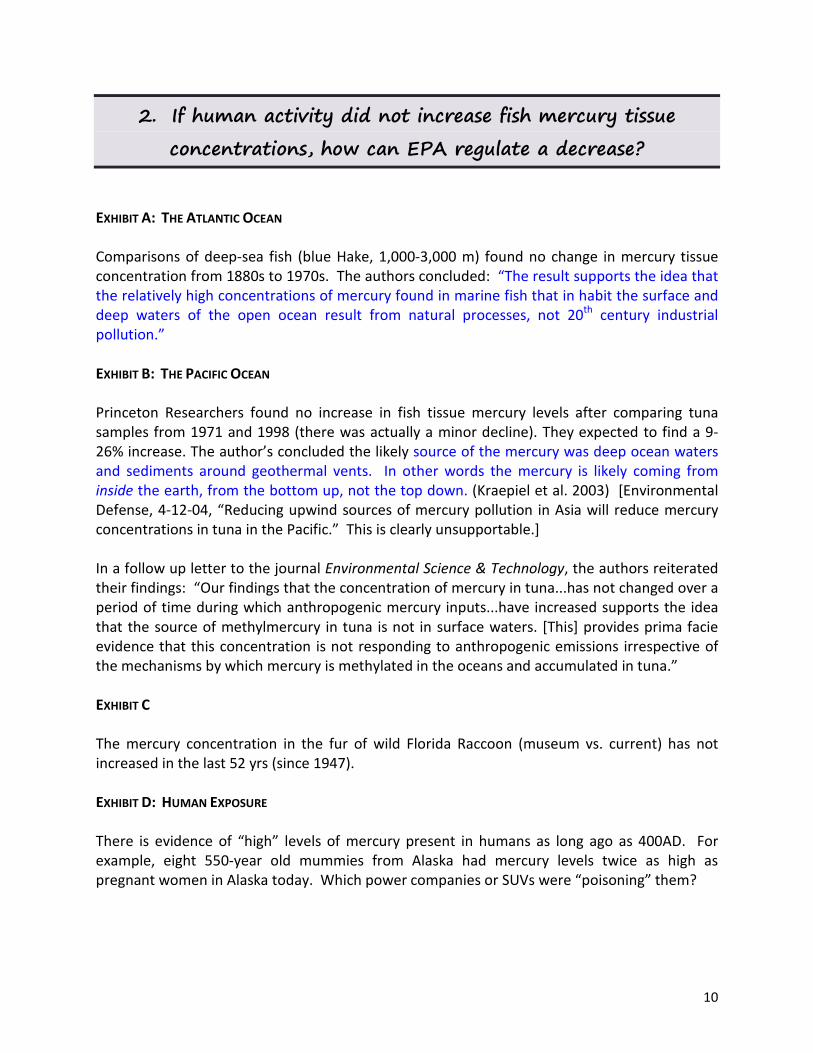
concentrations, how can EPA regulate a decrease? EXHIBIT A: THE ATLANTIC OCEAN Comparisons of deep-sea fish (blue Hake, 1,000-3,000 m) found no change in mercury tissue concentration from 1880s to 1970s. The authors concluded: “The result supports the idea that the relatively high concentrations of mercury found in marine fish that in habit the surface and deep waters of the open ocean result from natural processes, not 20th century industrial pollution.” EXHIBIT B: THE PACIFIC OCEAN Princeton Researchers found no increase in fish tissue mercury levels after comparing tuna samples from 1971 and 1998 (there was actually a minor decline). They expected to find a 9-26% increase. The author’s concluded the likely source of the mercury was deep ocean waters and sediments around geothermal vents. In other words the mercury is likely coming from inside the earth, from the bottom up, not the top down. (Kraepiel et al. 2003) [Environmental Defense, 4-12-04, “Reducing upwind sources of mercury pollution in Asia will reduce mercury concentrations in tuna in the Pacific.” This is clearly unsupportable.] In a follow up letter to the journal Environmental Science & Technology, the authors reiterated their findings: “Our findings that the concentration of mercury in tuna...has not changed over a period of time during which anthropogenic mercury inputs...have increased supports the idea that the source of methylmercury in tuna is not in surface waters. [This] provides prima facie evidence that this concentration is not responding to anthropogenic emissions irrespective of the mechanisms by which mercury is methylated in the oceans and accumulated in tuna.” EXHIBIT C The mercury concentration in the fur of wild Florida Raccoon (museum vs. current) has not increased in the last 52 yrs (since 1947). EXHIBIT D: HUMAN EXPOSURE There is evidence of “high” levels of mercury present in humans as long ago as 400AD. For example, eight 550-year old mummies from Alaska had mercury levels twice as high as pregnant women in Alaska today. Which power companies or SUVs were “poisoning” them?
11
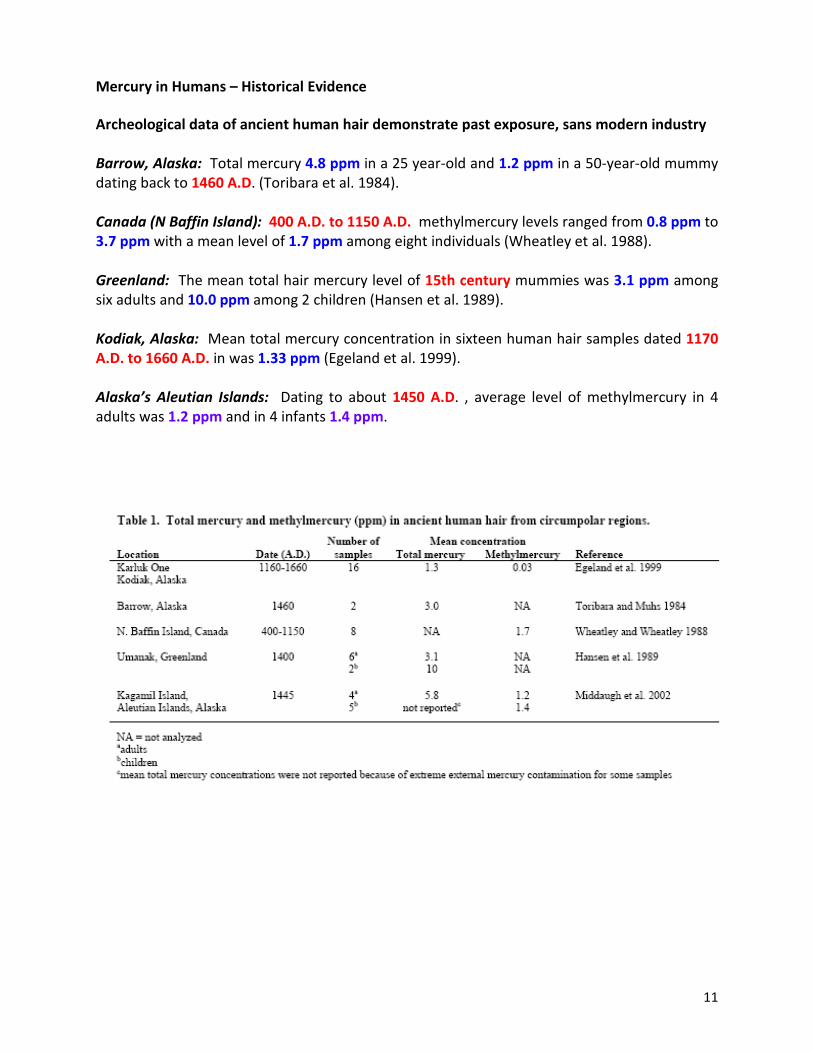
Mercury in Humans – Historical Evidence Archeological data of ancient human hair demonstrate past exposure, sans modern industry Barrow, Alaska: Total mercury 4.8 ppm in a 25 year-old and 1.2 ppm in a 50-year-old mummy dating back to 1460 A.D. (Toribara et al. 1984). Canada (N Baffin Island): 400 A.D. to 1150 A.D. methylmercury levels ranged from 0.8 ppm to 3.7 ppm with a mean level of 1.7 ppm among eight individuals (Wheatley et al. 1988). Greenland: The mean total hair mercury level of 15th century mummies was 3.1 ppm among six adults and 10.0 ppm among 2 children (Hansen et al. 1989). Kodiak, Alaska: Mean total mercury concentration in sixteen human hair samples dated 1170 A.D. to 1660 A.D. in was 1.33 ppm (Egeland et al. 1999). Alaska’s Aleutian Islands: Dating to about 1450 A.D. , average level of methylmercury in 4 adults was 1.2 ppm and in 4 infants 1.4 ppm.
12
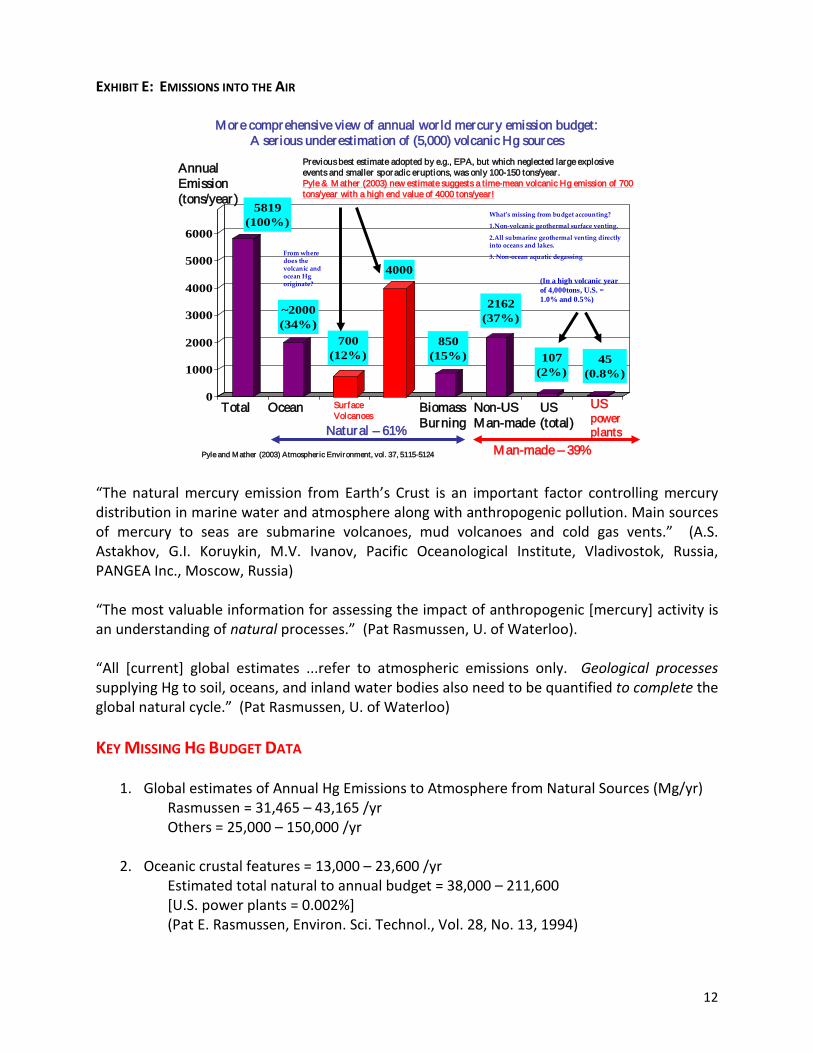
EXHIBIT E: EMISSIONS INTO THE AIR
More comprehensive view of annual wor ld mercury emission budget:A ser ious underestimation of (5,000) volcanic Hg sources
5819(100%)
~2000(34%)
700(12%)
4000
850(15%)
2162(37%)
107(2%)
45(0.8%)
0
1000
2000
3000
4000
5000
6000
Annual Emission (tons/year )
Total Ocean Surface Volcanoes
Biomass Burning
Non-US Man-made
US (total)
US power plants
Pyle and Mather (2003) Atmospher ic Environment, vol. 37, 5115-5124
Natural – 61%Man-made – 39%
Previous best estimate adopted by e.g., EPA, but which neglected large explosive events and smaller sporadic eruptions, was only 100-150 tons/year.Pyle & M ather (2003) new estimate suggests a time-mean volcanic Hg emission of 700 tons/year with a high end value of 4000 tons/year!
What’s missing from budget accounting?
1.Non-volcanic geothermal surface venting.
2.All submarine geothermal venting directly into oceans and lakes.
3. Non-ocean aquatic degassing
(In a high volcanic year of 4,000tons, U.S. = 1.0% and 0.5%)
From where does the volcanic and ocean Hg originate?
“The natural mercury emission from Earth’s Crust is an important factor controlling mercury distribution in marine water and atmosphere along with anthropogenic pollution. Main sources of mercury to seas are submarine volcanoes, mud volcanoes and cold gas vents.” (A.S. Astakhov, G.I. Koruykin, M.V. Ivanov, Pacific Oceanological Institute, Vladivostok, Russia, PANGEA Inc., Moscow, Russia) “The most valuable information for assessing the impact of anthropogenic [mercury] activity is an understanding of natural processes.” (Pat Rasmussen, U. of Waterloo). “All [current] global estimates ...refer to atmospheric emissions only. Geological processes supplying Hg to soil, oceans, and inland water bodies also need to be quantified to complete the global natural cycle.” (Pat Rasmussen, U. of Waterloo) KEY MISSING HG BUDGET DATA
1. Global estimates of Annual Hg Emissions to Atmosphere from Natural Sources (Mg/yr) Rasmussen = 31,465 – 43,165 /yr Others = 25,000 – 150,000 /yr
2. Oceanic crustal features = 13,000 – 23,600 /yr Estimated total natural to annual budget = 38,000 – 211,600 [U.S. power plants = 0.002%]
(Pat E. Rasmussen, Environ. Sci. Technol., Vol. 28, No. 13, 1994)
13
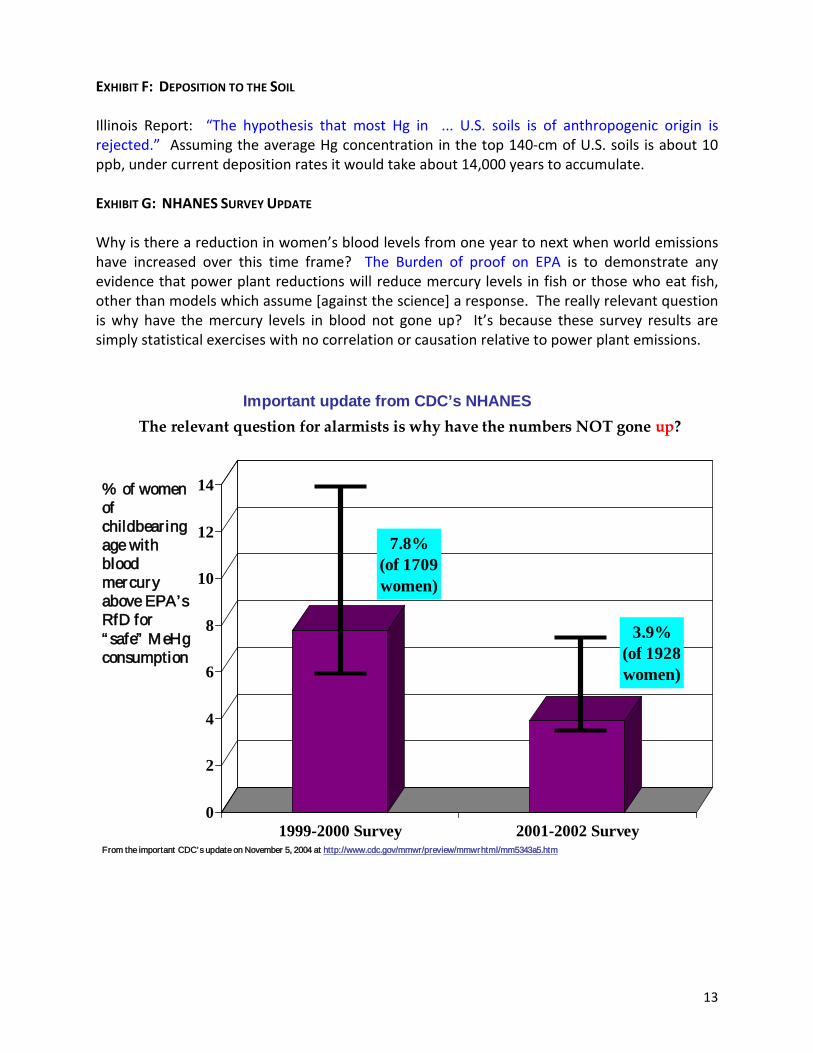
EXHIBIT F: DEPOSITION TO THE SOIL Illinois Report: “The hypothesis that most Hg in ... U.S. soils is of anthropogenic origin is rejected.” Assuming the average Hg concentration in the top 140-cm of U.S. soils is about 10 ppb, under current deposition rates it would take about 14,000 years to accumulate. EXHIBIT G: NHANES SURVEY UPDATE Why is there a reduction in women’s blood levels from one year to next when world emissions have increased over this time frame? The Burden of proof on EPA is to demonstrate any evidence that power plant reductions will reduce mercury levels in fish or those who eat fish, other than models which assume [against the science] a response. The really relevant question is why have the mercury levels in blood not gone up? It’s because these survey results are simply statistical exercises with no correlation or causation relative to power plant emissions.
7.8% (of 1709 women)
3.9% (of 1928 women)
0
2
4
6
8
10
12
14
1999-2000 Survey 2001-2002 Survey
% of women of childbearing age with blood mercury above EPA’s RfD for “ safe” MeHg consumption
From the important CDC’s update on November 5, 2004 at http://www.cdc.gov/mmwr/preview/mmwrhtml/mm5343a5.htm
Important update from CDC’s NHANESThe relevant question for alarmists is why have the numbers NOT gone up?
14
3. Where are all the victims from fish consumption? The mercury scare is essentially a claim of massive crime with missing victims. EXHIBIT A: SEYCHELLES ISLAND STUDY Seychelles Island Study in the Indian Ocean. MeHg levels twice those of Faroe. 12-14 fish meals/week – US: one or less. No harm only benefits: better eyesight, less hyperactivity.
“We do not believe that there is presently good scientific evidence that moderate fish consumption is harmful to the fetus. However, fish is an important source of protein in many countries and large numbers of mothers around the world rely on fish for proper nutrition. Good maternal nutrition is essential to the baby’s health. Additionally, there is increasing evidence that the nutrients in fish are important for brain development and perhaps for cardiac and brain function in older individuals.”
EXHIBIT B: BRISTOL ENGLAND Bristol England study found no harm, only benefits:
- High fish intake by pregnant women and young children was associated with higher child mental development scores.
- Better eyesight. - “[O]ur data did not suggest adverse developmental affects associated with mercury.”
EXHIBIT C: NORWEGIAN STUDY Norwegian Study (Helland et al.) Found that the nutrients found in fish oil ingested during pregnancy and lactation “improves the intelligence of children at 4 years of age.” EXHIBIT D: AMAZON RAINFOREST NATIVES STUDY Amazon Rainforest natives study (Dorea, et al.) Although natives eat lots of fish from Hg-rich areas, there is “no evidence that shows that freshwater...fish cause neuropathies (brain problems).” Hair levels at mean average of 21ppm, as high as 303 ppm with sign of toxicity effects. Possible explanation: Both Se and amino acids from fish help reduce toxicity by inhibiting entry/transport of MeHg into brain cells. (Tom Clarkson) EXHIBIT E: JAPANESE AND HONG KONG LEVELS Where are all the learning disabled kids? Japanese 87% above EPA “safe” level. International standardized tests in math and science (4th through 12th grades) score high fish consuming cultures at the top.
15
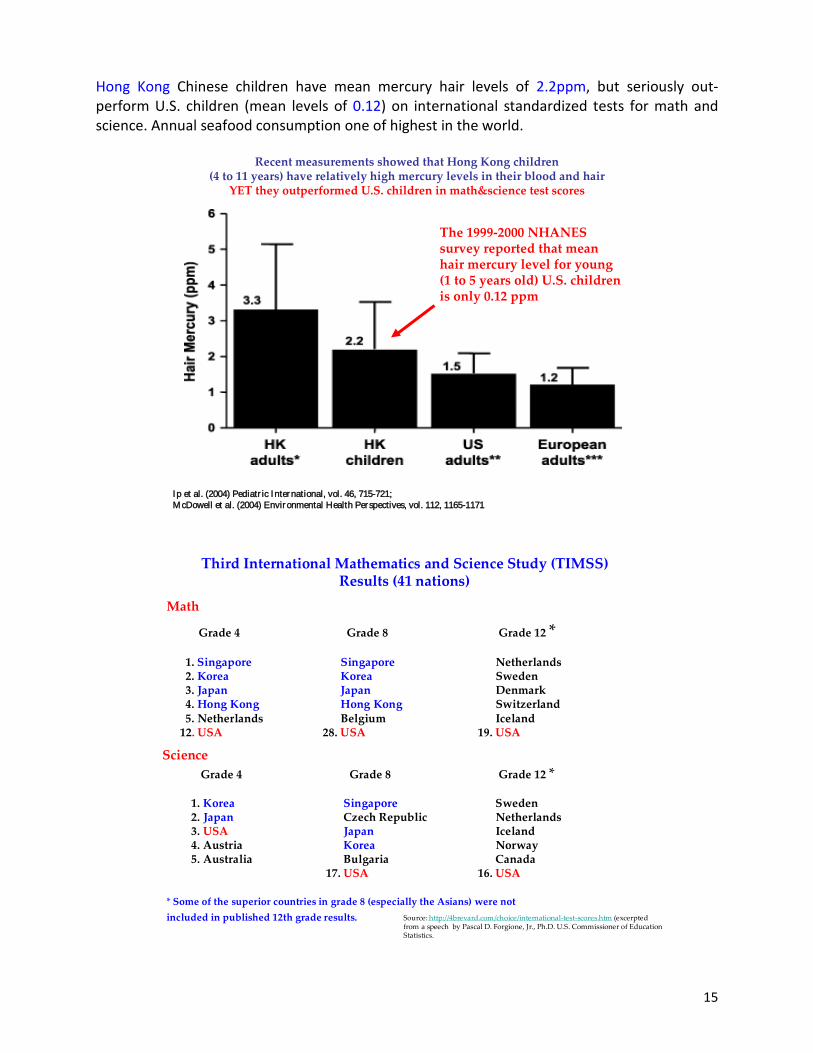
Hong Kong Chinese children have mean mercury hair levels of 2.2ppm, but seriously out-perform U.S. children (mean levels of 0.12) on international standardized tests for math and science. Annual seafood consumption one of highest in the world.
Recent measurements showed that Hong Kong children (4 to 11 years) have relatively high mercury levels in their blood and hair
YET they outperformed U.S. children in math&science test scores
Ip et al. (2004) Pediatr ic International, vol. 46, 715-721; McDowell et al. (2004) Environmental Health Perspectives, vol. 112, 1165-1171
The 1999-2000 NHANES survey reported that mean hair mercury level for young (1 to 5 years old) U.S. children is only 0.12 ppm
Third International Mathematics and Science Study (TIMSS)
Results (41 nations)
Grade 4 Grade 8 Grade 12 *
1. Singapore Singapore Netherlands2. Korea Korea Sweden3. Japan Japan Denmark4. Hong Kong Hong Kong Switzerland5. Netherlands Belgium Iceland
12. USA 28. USA 19. USA
Grade 4 Grade 8 Grade 12 *
1. Korea Singapore Sweden2. Japan Czech Republic Netherlands3. USA Japan Iceland4. Austria Korea Norway5. Australia Bulgaria Canada
17. USA 16. USA
Math
Science
* Some of the superior countries in grade 8 (especially the Asians) were not included in published 12th grade results. Source: http://4brevard.com/choice/international-test-scores.htm (excerpted
from a speech by Pascal D. Forgione, Jr., Ph.D. U.S. Commissioner of Education Statistics.
16
EXHIBIT F: INUIT CHILDREN FROM GREENLAND The search for “subtle neurobehavioral deficits” in children from prenatal exposure to MeHg failed detection in Inuit children from Greenland. “In a traditional Inuit community in Qaanaq, Greenland, mercury concentrations in cord blood and maternal hair have been examined in connection with all births. We examined 43 children at age 7-12 years with a battery of neurobehavioral tests. The average mercury concentration in hair was 5 ppm [0.6-1 ppm in Faroese children at 7 to 14 years old] and 15.5 ppm [4.2 ppm in Faroese mothers] in children and mothers, respectively. Because of the small size of the group examined, the statistical power of this study is limited. However, it is noteworthy that the children who participated in the examinations did not appear to be clinically adversely affected by the exposure. The neuropsychological tests failed in revealing clear mercury-related deficits. (Weihe et al. (2002) International Journal of Circumpolar Health, vol. 61, 41-49.)
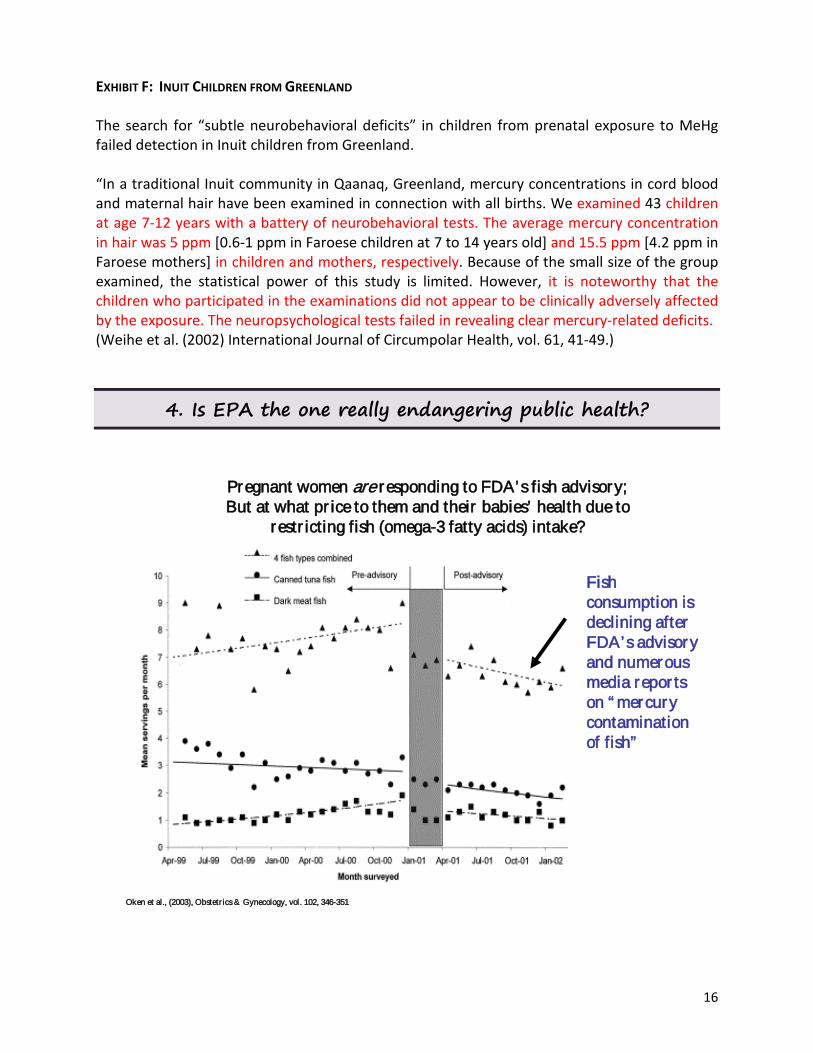
4. Is EPA the one really endangering public health?
Pregnant women are responding to FDA’s fish advisory; But at what pr ice to them and their babies’ health due to
restr icting fish (omega-3 fatty acids) intake?
Oken et al., (2003), Obstetr ics & Gynecology, vol. 102, 346-351
Fish consumption is declining after FDA’s advisory and numerous media repor ts on “ mercury contamination of fish”
17
EXHIBIT A: REAL COST AND DANGER Alarmism poses the risk of frightening people away from eating fish altogether, or in sufficient quantities to gain the nutritional benefits, which are legion. Already, Americans consume far less seafood than recommended amounts. The real cost and danger of restricting fish intake (or omega-3 polyunsaturated fatty acid) is outlined below. Fish consumption may help reduce risks to:
- Cardiovascular disease, coronary heart disease (CHD), and sudden deaths - Breast cancer - Prostate cancer - Endometrial (inner lining of uterus) cancer - Kidney disorders - Alzheimer disease - Rheumatoid arthritis - Type 2 diabetes in women, and CHD in type 2 diabetic women - Pre-term delivery and low birth weights, and poor mental development of infants and
children - Postpartum depression and suicidal ideation - Stroke in men and women - High blood pressure - Poor adult cognitive performance - Hostility in young adults (18-30 years) - Bipolar disorders.
Most seriously affected groups:
- Women (particularly pregnant women) - Fetuses - Young children - Black males - Elderly - Native subsistence populations.
EXHIBIT B: MENTAL HEALTH Over the last several decades there appears to have been created in the public mind an inverse relationship between the safety we actually enjoy and the level of fear and anxiety we feel. The stress this generates jeopardizes health, particularly of children (David Ropeik, Director of Risk Communications at Harvard):
1. Psychologically – Contributes to depression and sleep problems. 2. Physiologically – Weakens immune system, precipitates weight gain, and increases
blood pressure. Possibly contributes to low birth weights, and increase risks of heart disease and other chronic diseases of aging.
3. Nutritionally – Influences the personal choices people make.
18
EXHIBIT C: PREGNANT WOMEN Claims of concern for fetal and child health by EPA and mercury activists appear disingenuous because they largely failed to emphasize to the public the benefits of fish consumption. This activism could unnecessarily terrorize expectant mothers into not eating a food that promotes better fetal development and child health. Premature birth is a striking example. So serious is this outcome that the March of Dimes organization has adopted it as a primary cause. More than 470,000 babies are born prematurely every year in the U.S. These infants aren’t just small; they’re developmentally “unfinished.” The March of Dimes provides these facts on prematurely born babies:
- Has increased by 29 percent since 1981 - Accounts for 12 percent of all live births - Can happen to any pregnant woman - Is the leading killer of babies in their first month of life - Is a major cause of long-term health problems, including cerebral palsy, mental
retardation, blindness, chronic lung problems, respiratory distress syndrome and bleeding in the brain
- Is the number one obstetrical problem in the country - Robs families of the full potential of their children, society of their future leaders and
our nation of strong and healthy citizens - Places tremendous financial burdens on everyone. Hospital charges for infants with a
principle diagnosis of prematurely average $75,000, and add up to billions of dollars each year.
Recognizing the role of fish nutrition plays in helping prevent the tragedy of premature births, the March of Dimes is funding a Danish and Chinese research team to further clarify the issue. One of the researchers, Dr. Sjurdur Olsen of Denmark reported that Danish women who consumed fish or seafood at least once a week during the first 16 weeks of pregnancy have three times less risk of low-birth weight or premature births. But a closer look at the literature will reveal ample evidence already available that women who avoid fish in their diets during pregnancy are at increased risk for delivering their babies early, which increases risk for their babies being born small, sick and dying. Lower levels of postpartum depression and suicidal ideation for women with high fish intake (Hibbelin, 2002). EXHIBIT D: NATIVE POPULATIONS If EPA has serious concerns for native populations, it should focus on the fact that instead of advancing health and safety for these peoples, mercury warnings are already causing harm. John Middaugh, State Epidemiologist of Alaska, recently warned FDA: “Advisories based upon risk assessment without consideration of well-established public health benefits of fish consumption have great potential to harm public health if reductions in fish consumption occur.”
19
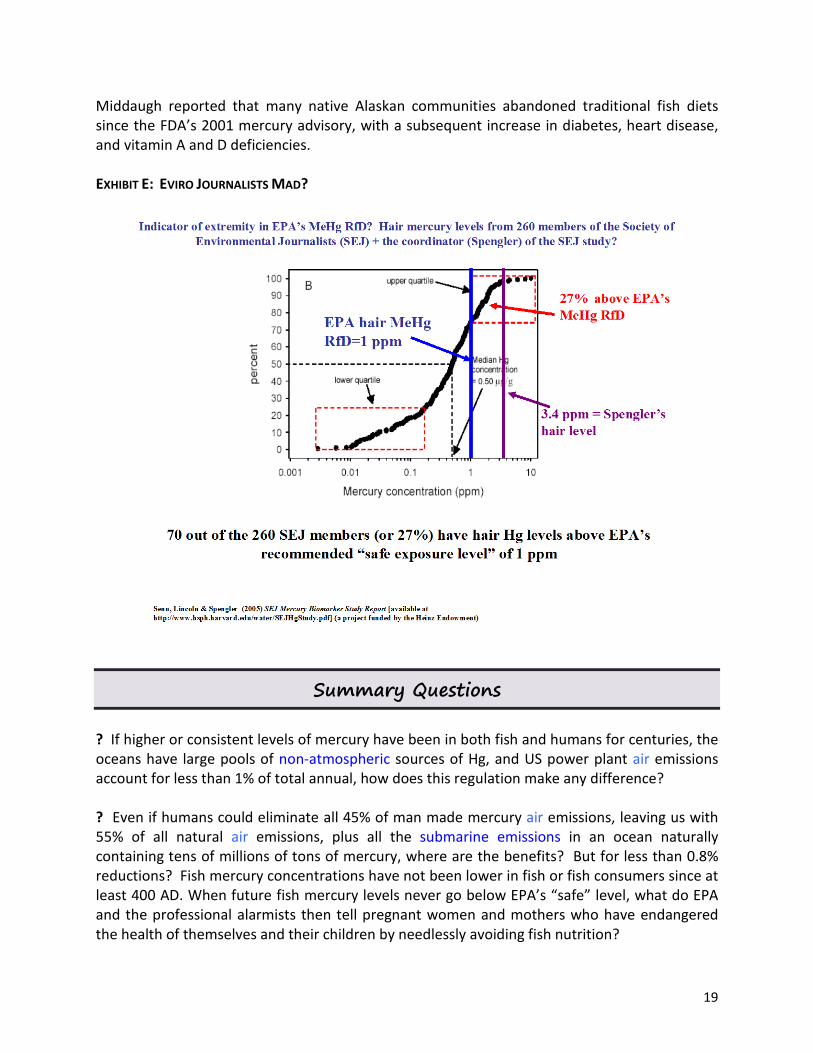
Middaugh reported that many native Alaskan communities abandoned traditional fish diets since the FDA’s 2001 mercury advisory, with a subsequent increase in diabetes, heart disease, and vitamin A and D deficiencies. EXHIBIT E: EVIRO JOURNALISTS MAD?
Summary Questions ? If higher or consistent levels of mercury have been in both fish and humans for centuries, the oceans have large pools of non-atmospheric sources of Hg, and US power plant air emissions account for less than 1% of total annual, how does this regulation make any difference? ? Even if humans could eliminate all 45% of man made mercury air emissions, leaving us with 55% of all natural air emissions, plus all the submarine emissions in an ocean naturally containing tens of millions of tons of mercury, where are the benefits? But for less than 0.8% reductions? Fish mercury concentrations have not been lower in fish or fish consumers since at least 400 AD. When future fish mercury levels never go below EPA’s “safe” level, what do EPA and the professional alarmists then tell pregnant women and mothers who have endangered the health of themselves and their children by needlessly avoiding fish nutrition?
20
? Given the source of EPA’s claim for fetal harm through maternal fish consumption comes from the Faroe study (which has non-transparent raw data), how does EPA justify it when the Chief Physician of the Faroe hospital system and co-author of the study publicly and emphatically states: “...fish consumption does not harm Faroese children. In the contrary the fish consumption most likely is beneficial to their health.” (Pal Weihe, Open Letter to the Boston Herald, Feb-2-04). ? The recent Washington Post story does not mention that the Harvard study was commissioned through EPA grants to an independent nonprofit organization of Northeastern-state governments that works on regional environmental issues. [Read: An organization dedicated to raising the cost of coal-fired power in the Midwest]. The EPA provided about $270,000 in funding for the project. Who is providing adult supervision to EPA staff? ? One of the highest sources of US mercury emissions is forest fires. In a really bad year, they can out emit all US power plants combined, especially as power plant emissions continue to drop. World-wide, vegetative burning accounts for about 16% of annual emissions. Environmental groups with philosophies of “no cut” and “let it burn” and the Forest Service are defacto large and unregulated emitters of air borne mercury ? Given that raw mercury is most efficiently converted into the problematic MeHg in swamps, marshes and other wetlands, then are Environmentalists who want more wetlands providing more “poison” for our children and wildlife? ? Given that Yellowstone National Park may emit more mercury than all eight of Wyoming’s Power Plants combined, should EPA declare it a superfund site and shut it down? It cannot possibly ever clean it up. Should EPA dome over all volcanoes and geothermal spots in the West?
21
APPENDIX
MERCURY SCIENCE FACT SHEET by Science and Public Policy Institute | July 31, 2010
What is Mercury? Mercury (Hg) is an element that has existed (and will continue to exist) naturally since the earth was formed 4.5 billion years ago. The oceans alone contain millions of tons of mercury.1
There are two major forms of mercury emitted during fossil fuel combustion: 1. Oxidized, which is water soluble and can be washed out of the air into rivers, lakes, and streams. 2. Elemental, which is not water soluble and moves around in a global mercury cycle.
A small fraction (about one one-thousandth) of the oxidized mercury that ends up in waterways may be changed into an organic form called methylmercury (MeHg) which is the kind of mercury with which EPA is concerned. This type of mercury can be eaten by tiny organisms that are then eaten by small fish, resulting in possible bioaccumulation in larger fish eaten by humans. Methylmercury is not emitted directly from fossil-fuel-fired power plants. It is produced and accumulated within the biosphere by a myriad of mercury transformation processes that do not depend upon the amount of inorganic mercury emitted from man-made sources.2
The natural cyclical production and destruction is controlled by environmental factors and ecosystem processes that are largely beyond human control or intervention.
Where does Hg come from? – A Mostly Natural, World-wide Phenomena The largest source of annual air-borne Hg is from natural sources such as volcanoes, forest fires, and oceans.3 Emissions from Yellowstone National Park, for example, likely exceed that of all Wyoming coal-fired power plants combined.4 Under current estimates of total annual air-borne sources of Hg into the world cycle, US power plant emissions account for as little as 0.5%.5
A new estimate by scientists from the National Center for Atmospheric Research recently shown that mercury emissions from fires, mainly biomass burning from forests, from the lower 48 U.S. states and Alaska amount to about 44 tons per year.6 This is of similar magnitude in comparison to the total mercury emissions from U.S. power plants. For another perspective, the 2008 UNEP mercury report gives 26 tons per year as the contribution from the cremation of human remains.7
The natural mercury emission from Earth’s crust is an important factor controlling mercury distribution in marine waters and the atmosphere, along with anthropogenic emissions. Main sources of mercury to seas are submarine volcanoes, mud volcanoes and cold gas vents. All current global estimates refer to atmospheric emissions only. Geological processes supplying Hg to soil, oceans, and inland water bodies also need to be quantified and considered in the global mercury budget and its natural cycling. When estimates of all natural sources are considered, including geothermal events under oceans and lakes, US power plants may account for as little as 0.002% of the entire annual world mercury emissions budget.8
22
Are Mercury levels changing?
From 1990 – 2000, total US anthropogenic Hg emissions decreased by 69 tons (to current level of about 107 tons), while Asia increased by over 500 tons (to current level of about 1204 tons) and Africa increased by about 230 tons (to about 407 tons). Table 5 of Pacyna et al. (2006)9 reported the top seven mercury emitters in 2000 to be China, South Africa, India, Japan, Australia, U.S.A. and Russia with 604.7, 256.7, 149.9, 143.5, 123.5, 109.2 and 72.6 tons respectively. Again, a fact confirming the relatively small amount of mercury emissions from the U.S. sources, with US emission in 2000 ranked only 6th below even South Africa, India, Japan and Australia. With the most recent mercury emission budget available up to 2005, SPPI notes from the November 10, 2009 press release by the EPA10 that from “1990 through 2005, [U.S.] emissions of mercury into the air decreased by 58 percent.” Further good news is that the latest projection of mercury emission in 2020 by Pacyna et al. (2010)11
also suggest very small contribution, if not negligible role, from US industrial emissions.
In the Atlantic Ocean, comparisons of deep-sea fish (i.e., blue hake at depths of 1,000-3,000 m) found no change in tissue mercury concentration from 1880s to 1970s. The authors concluded: “The result supports the idea that the relatively high concentrations of mercury found in marine fish that inhabit the surface and deep waters of the open ocean result from natural processes, not 20th century industrial pollution.”12
In the Pacific Ocean, Princeton researchers found no increase in fish tissue mercury levels after comparing tuna samples from 1971 and 1998 (there was actually a minor decline). They expected to find a 9-26% increase. Those authors concluded the likely source of the mercury was deep ocean waters and sediments around geothermal vents: “Our findings that the concentration of mercury in tuna...has not changed over a period of time, during which anthropogenic mercury inputs...have increased, supports the idea that the source of methylmercury in tuna is not in surface waters. [This] provides prima facie evidence that this concentration is not responding to anthropogenic emissions irrespective of the mechanisms by which mercury is methylated in the oceans and accumulated in tuna.”13
As for human exposure to mercury (Hg and MeHg) through fish consumption, there is evidence of micro-traces of mercury (equal to and greater than modern levels) present in humans as long ago as 400AD. For example, eight 550-year old mummies from Alaska had mercury levels twice as high as pregnant women in Alaska today.14
What is the safe level (reference dose) of MeHg consumption according to EPA? A reference dose (RfD) is the amount of a substance that can be consumed each day for a lifetime (70 years) without harm. The EPA mercury RfD is based on inappropriate studies of people who consume whale meat and blubber (a unique diet no one in the US has) containing multiple chemicals (PCBs, cadmium, pesticides, persistent organic pollutants, DDT, etc.) of which mercury is only one. The owners of the raw data refused to release it for scientific review. EPA downplayed studies that found no harm.
- EPA’s RfD is the most restrictive in the world – 10 times lower than the lowest level of concern.
- EPA is scaring people, especially pregnant women, from eating fish and benefiting from vital nutrition.15
23
What health benefits are lost from NOT eating fish due to concerns about mercury? The best study in the world, the Seychelles Island Study (Myers et al.) in the Indian Ocean, found benefits to children from mothers eating large quantities of fish (12-14 meals per week). These benefits included better eyesight and less hyperactivity in children.16
The Bristol England study found that high fish intake by pregnant women and young children was associated with higher child mental development scores, better eyesight and “no adverse developmental effects associated with mercury.”17
A Norwegian Study (Helland et al.) found that the nutrients in fish oil ingested during pregnancy and lactation “improves the intelligence of children at 4 years of age.”18
High fish or omega-3 fatty acids consumption may reduce risk for these conditions:
- Cardiovascular disease, coronary heart disease (CHD), and sudden deaths - Breast cancer - Prostate cancer - Endometrial (inner lining of uterus) cancer - Alzheimer disease - Type 2 diabetes in women, and CHD in type 2 diabetic women - Pre-term delivery and low birth weights, physiological and mental development of infants, and
Postpartum depression19
and suicidal ideation.
ENDNOTES 1 E.g., Carmago (1993) Nature, vol. 365, 302. 2 Making Sense of State Fish Advisories, March 2005. (http://ff.org/centers/csspp/pdf/20050228_hgfishadvisories.pdf) 3 Pacyna et al. (2003) Atmos Environ, vol. 37, S109-S117; Friedli et al., (2003) Atmos Environ, vol. 37, 253-267. 4 http://newsdesk.inel.gov/press_releases/2003/10-21mercury_testing.htm. 5 See Pyle and Mather (2003) Atmos Environ, vol. 37, 5115-5124 [also see:
http://ff.org/centers/csspp/docs/20050103EPANODAComments.doc]. 6 Wiedinmyer and Friedli (2007) Environmental Science & Technology, vol. 41, 8092-8098. 7 p. 18 of the 2008’s UNEP Mercury Report. UNEP’s “The Global Atmospheric Mercury Assessment: Sources, Emissions and
Transport” (2008; updated and corrected May 2009). Available from: http://www.chem.unep.ch/Mercury/Atmospheric _Emissions/UNEP%20SUMMARY%20REPORT%20%20CORRECTED%20May09%20%20final%20for%20WEB%202008.pdf.
8 Rasmussen (1994) Environ Sci & Tech., vol. 28, 2233-2241. 9 Pacyna et al. (2006) Atmospheric Environment, vol. 40, 4048-4063. 10 EPA’s press release on this new report on November 10, 2009; available at: http://yosemite.epa.gov/OPA/ADMPRESS.NSF/
d0cf6618525a9efb85257359003fb69d/62b53c67bc92ef878525766a004b3456!OpenDocument. 11 Pacyna et al. 2010, Atmospheric Environment, vol. 44, 2487-2499. 12 Barber et al. (1984) Enviro Sci & Tech, vol.18, 552-555. 13 Kraepiel et al. (2004) Environ Sci & Tech, vol. 38, 4048 and see also Kraepiel et al., (2003), Environ Sci & Tech, vol. 37, 5551-
5558. 14 See Middaugh on pp 53-68 of July 24, 2002’s FDA’s Food Advisory Committee on MeHg.
(http://www.fda.gov/OHRMS/DOCKETS/ac/02/transcripts/3872t2.htm) and also Arnold and Middaugh (2004) in Use of Traditional Foods in a Healthy Diet in Alaska: Risks in Perspective (available at: http://www.epi.hss.state.ak.us/ bulletins/catlist.jsp?cattype=Mercury).
15 Oken et al. (2003), Obstetrics & Gynecology, vol. 102, 346-351. 16 Myers et al. (2003), Lancet, vol. 361, 1686-1692. 17 Daniels et al. (2004), Epidemiology, vol. 15, 394-402. 18 Helland et al. (2003), Pediatrics, vol. 111, e39-e44. 19 Hibbeln (2002) Journal of Affective Disorders, vol. 69, 16-29.
24
Cover photo from dragscience.net.