Embed Size (px)
Citation preview

ERCOT PUBLIC1
LTSA Scenario Workshop
ERCOT PUBLIC2
Outline
Overview
Drivers
Scenarios
2014 LTSA results
ERCOT PUBLIC3
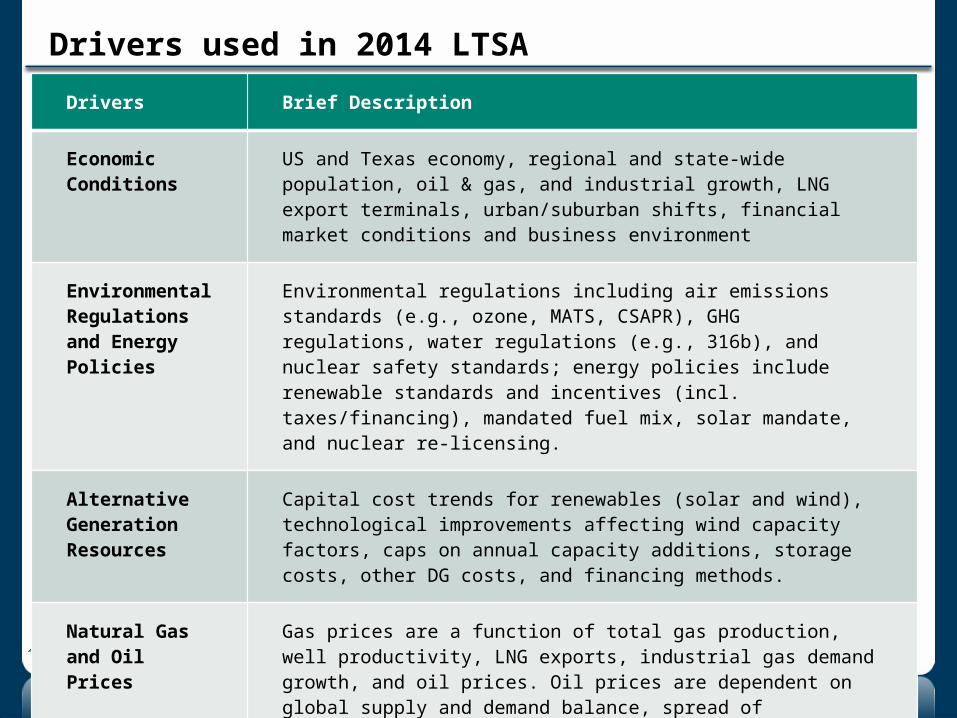
Drivers used in 2014 LTSA
Drivers Brief Description
Economic Conditions
US and Texas economy, regional and state-wide population, oil & gas, and industrial growth, LNG export terminals, urban/suburban shifts, financial market conditions and business environment
Environmental Regulations and Energy Policies
Environmental regulations including air emissions standards (e.g., ozone, MATS, CSAPR), GHG regulations, water regulations (e.g., 316b), and nuclear safety standards; energy policies include renewable standards and incentives (incl. taxes/financing), mandated fuel mix, solar mandate, and nuclear re-licensing.
Alternative Generation Resources
Capital cost trends for renewables (solar and wind), technological improvements affecting wind capacity factors, caps on annual capacity additions, storage costs, other DG costs, and financing methods.
Natural Gas and Oil Prices
Gas prices are a function of total gas production, well productivity, LNG exports, industrial gas demand growth, and oil prices. Oil prices are dependent on global supply and demand balance, spread of horizontal drilling technologies. Oil and gas prices will affect drilling locations within Texas.
ERCOT PUBLIC4
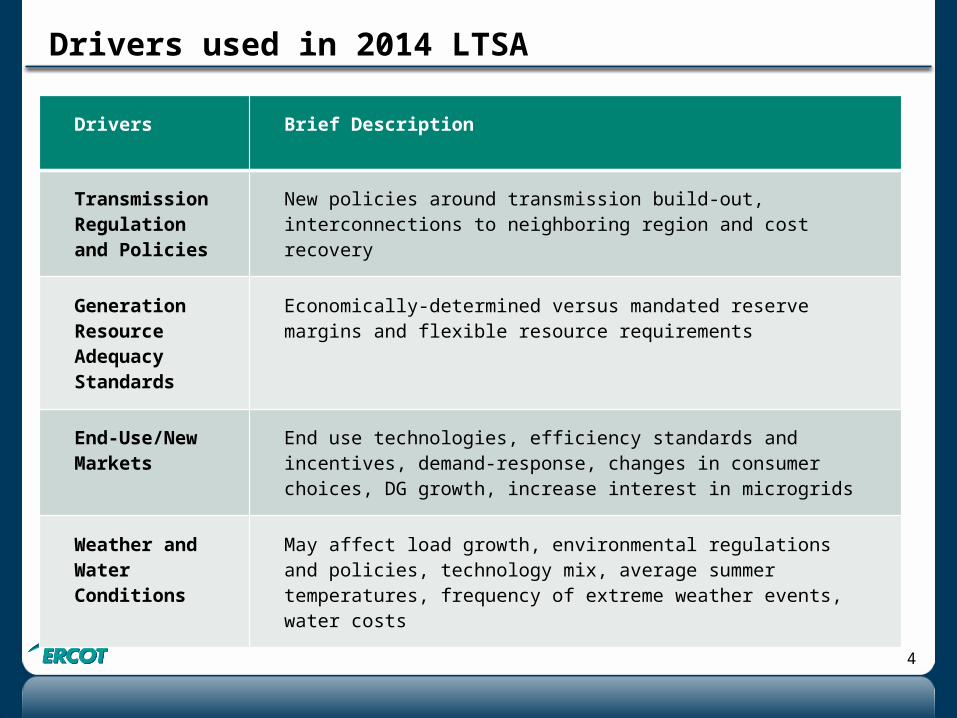
Drivers used in 2014 LTSA
Drivers Brief Description
Transmission Regulation and Policies
New policies around transmission build-out, interconnections to neighboring region and cost recovery
Generation Resource Adequacy Standards
Economically-determined versus mandated reserve margins and flexible resource requirements
End-Use/New Markets
End use technologies, efficiency standards and incentives, demand-response, changes in consumer choices, DG growth, increase interest in microgrids
Weather and Water Conditions
May affect load growth, environmental regulations and policies, technology mix, average summer temperatures, frequency of extreme weather events, water costs
ERCOT PUBLIC5
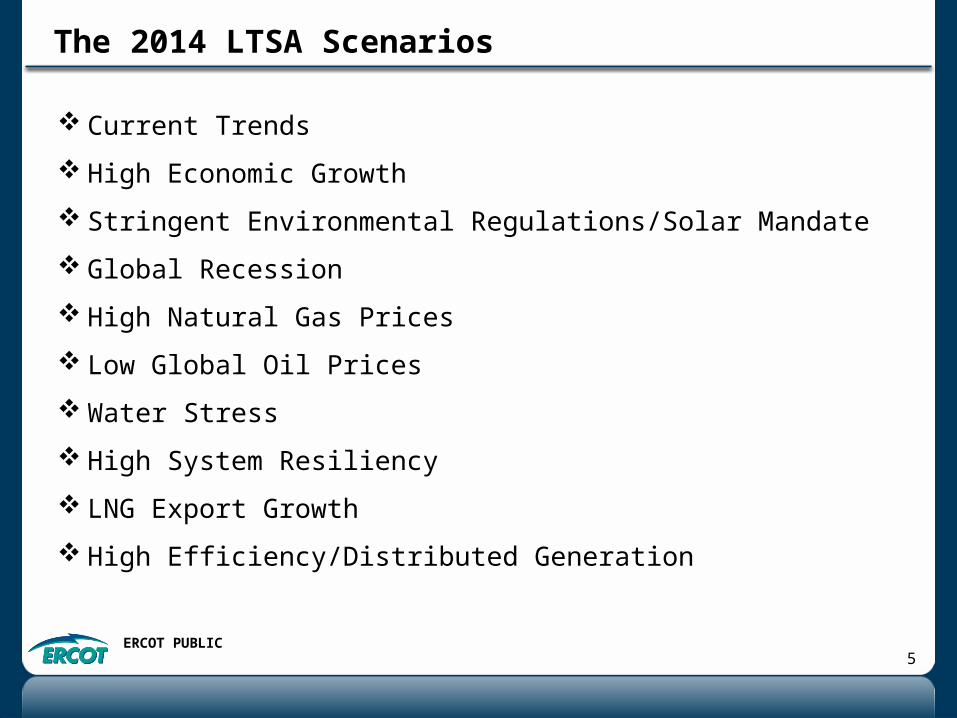
The 2014 LTSA Scenarios
Current Trends
High Economic Growth
Stringent Environmental Regulations/Solar Mandate
Global Recession
High Natural Gas Prices
Low Global Oil Prices
Water Stress
High System Resiliency
LNG Export Growth
High Efficiency/Distributed Generation
ERCOT PUBLIC6
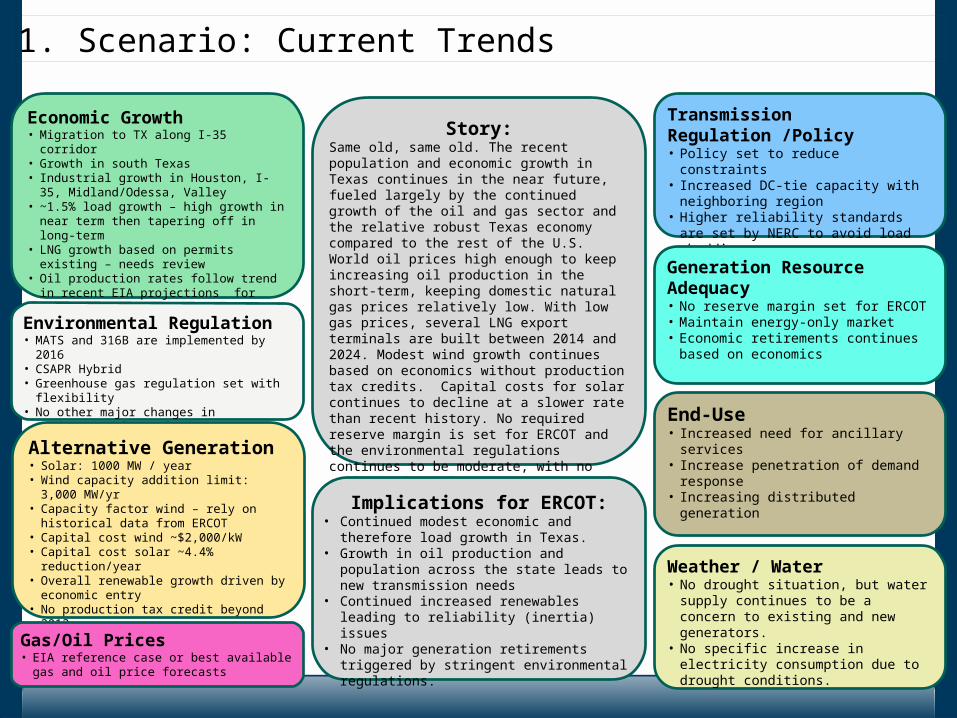
Economic Growth• Migration to TX along I-35 corridor• Growth in south Texas• Industrial growth in Houston, I-35,
Midland/Odessa, Valley• ~1.5% load growth – high growth in near term
then tapering off in long-term • LNG growth based on permits existing –
needs review• Oil production rates follow trend in recent EIA
projections for Texas
Weather / Water• No drought situation, but water supply
continues to be a concern to existing and new generators.
• No specific increase in electricity consumption due to drought conditions.
Transmission Regulation /Policy• Policy set to reduce constraints• Increased DC-tie capacity with neighboring
region • Higher reliability standards are set by
NERC to avoid load shedding
End-Use• Increased need for ancillary services• Increase penetration of demand response• Increasing distributed generation
Generation Resource Adequacy• No reserve margin set for ERCOT• Maintain energy-only market• Economic retirements continues based on
economicsEnvironmental Regulation• MATS and 316B are implemented by 2016• CSAPR Hybrid • Greenhouse gas regulation set with flexibility• No other major changes in environmental
regulations
Story:Same old, same old. The recent population and economic growth in Texas continues in the near future, fueled largely by the continued growth of the oil and gas sector and the relative robust Texas economy compared to the rest of the U.S. World oil prices high enough to keep increasing oil production in the short-term, keeping domestic natural gas prices relatively low. With low gas prices, several LNG export terminals are built between 2014 and 2024. Modest wind growth continues based on economics without production tax credits. Capital costs for solar continues to decline at a slower rate than recent history. No required reserve margin is set for ERCOT and the environmental regulations continues to be moderate, with no explicit federal carbon tax or required national cap and trade, but greenhouse gas emissions become regulated beyond 2016.
Implications for ERCOT:• Continued modest economic and therefore load
growth in Texas.• Growth in oil production and population across the
state leads to new transmission needs• Continued increased renewables leading to
reliability (inertia) issues• No major generation retirements triggered by
stringent environmental regulations.
1. Scenario: Current Trends
Alternative Generation• Solar: 1000 MW / year • Wind capacity addition limit: 3,000 MW/yr• Capacity factor wind – rely on historical data
from ERCOT• Capital cost wind ~$2,000/kW• Capital cost solar ~4.4% reduction/year• Overall renewable growth driven by economic
entry• No production tax credit beyond 2013• No change to existing investment tax credit
policy
Gas/Oil Prices• EIA reference case or best available gas and oil
price forecasts
ERCOT PUBLIC7
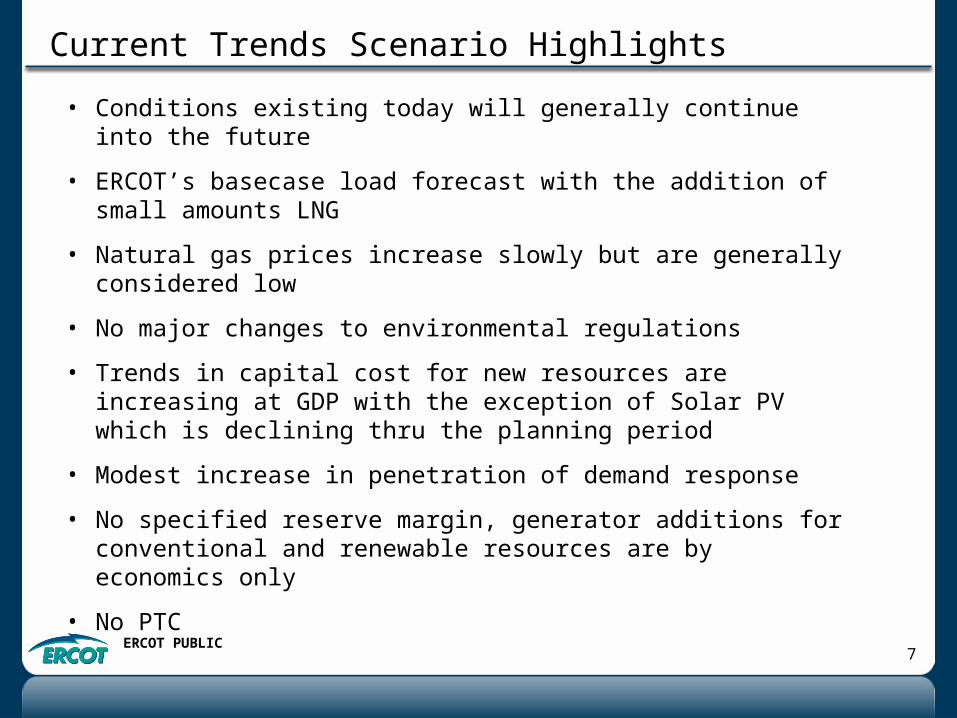
Current Trends Scenario Highlights
• Conditions existing today will generally continue into the future
• ERCOT’s basecase load forecast with the addition of small amounts LNG
• Natural gas prices increase slowly but are generally considered low
• No major changes to environmental regulations
• Trends in capital cost for new resources are increasing at GDP with the exception of Solar PV which is declining thru the planning period
• Modest increase in penetration of demand response
• No specified reserve margin, generator additions for conventional and renewable resources are by economics only
• No PTC
ERCOT PUBLIC8
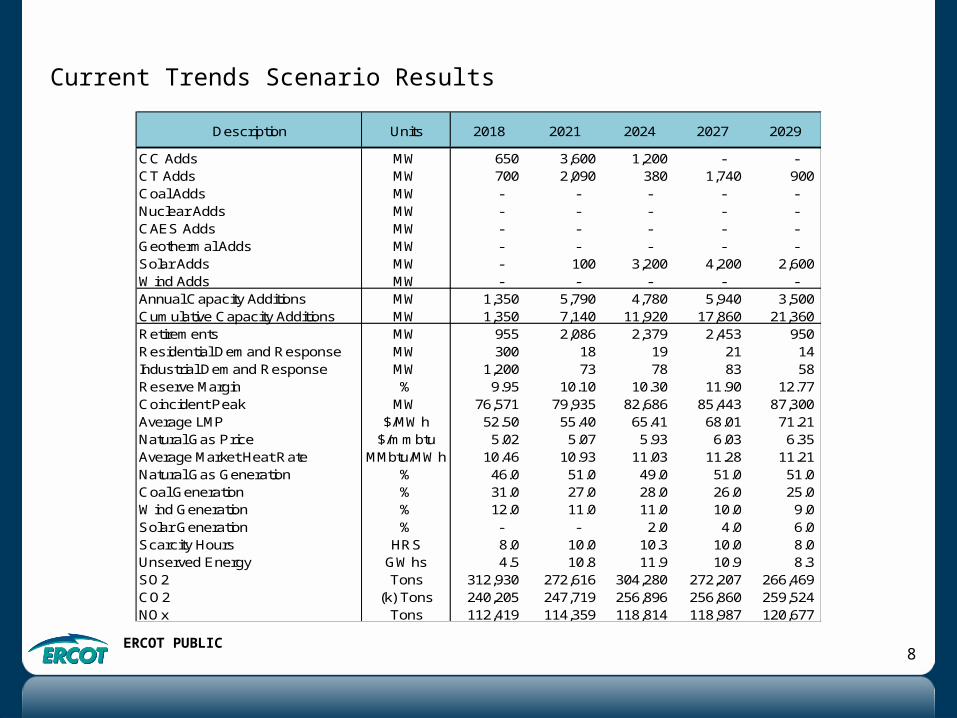
CC Adds MW 650 3,600 1,200 - - CT Adds MW 700 2,090 380 1,740 900 Coal Adds MW - - - - - Nuclear Adds MW - - - - - CAES Adds MW - - - - - Geothermal Adds MW - - - - - Solar Adds MW - 100 3,200 4,200 2,600 Wind Adds MW - - - - - Annual Capacity Additions MW 1,350 5,790 4,780 5,940 3,500 Cumulative Capacity Additions MW 1,350 7,140 11,920 17,860 21,360 Retirements MW 955 2,086 2,379 2,453 950 Residential Demand Response MW 300 18 19 21 14 Industrial Demand Response MW 1,200 73 78 83 58 Reserve Margin % 9.95 10.10 10.30 11.90 12.77 Coincident Peak MW 76,571 79,935 82,686 85,443 87,300 Average LMP $/MWh 52.50 55.40 65.41 68.01 71.21 Natural Gas Price $/mmbtu 5.02 5.07 5.93 6.03 6.35 Average Market Heat Rate MMbtu/MWh 10.46 10.93 11.03 11.28 11.21 Natural Gas Generation % 46.0 51.0 49.0 51.0 51.0 Coal Generation % 31.0 27.0 28.0 26.0 25.0 Wind Generation % 12.0 11.0 11.0 10.0 9.0 Solar Generation % - - 2.0 4.0 6.0 Scarcity Hours HRS 8.0 10.0 10.3 10.0 8.0 Unserved Energy GWhs 4.5 10.8 11.9 10.9 8.3 SO2 Tons 312,930 272,616 304,280 272,207 266,469 CO2 (k) Tons 240,205 247,719 256,896 256,860 259,524 NOx Tons 112,419 114,359 118,814 118,987 120,677
2027 2029Description Units 2018 2021 2024
Current Trends Scenario Results
ERCOT PUBLIC9
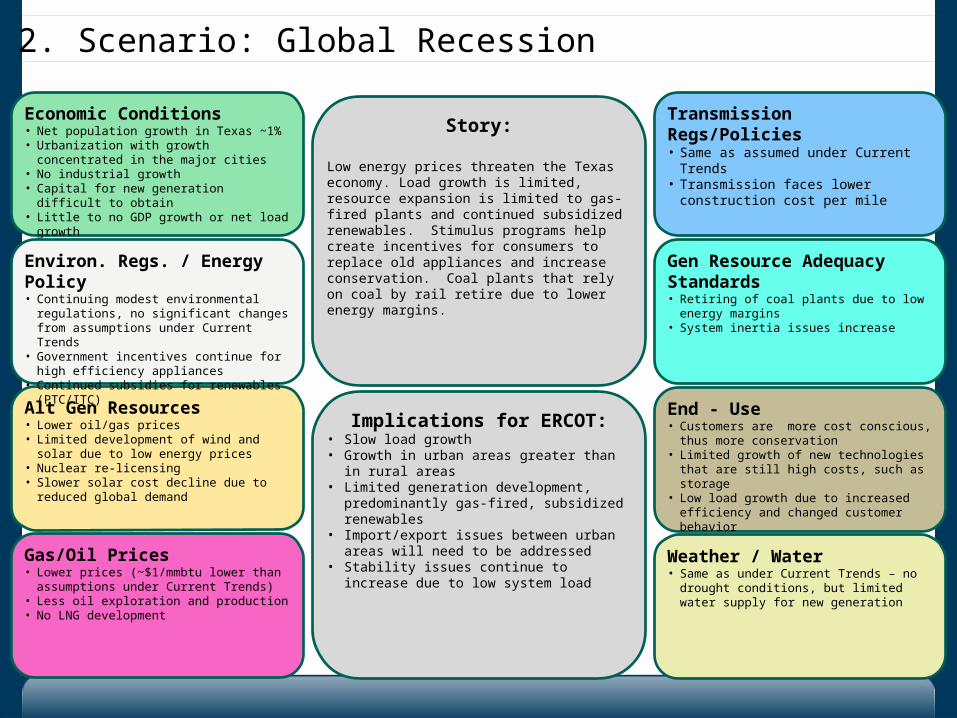
Economic Conditions• Net population growth in Texas ~1%• Urbanization with growth concentrated in the
major cities• No industrial growth• Capital for new generation difficult to obtain• Little to no GDP growth or net load growth
Weather / Water• Same as under Current Trends – no drought
conditions, but limited water supply for new generation
Gas/Oil Prices• Lower prices (~$1/mmbtu lower than
assumptions under Current Trends)• Less oil exploration and production• No LNG development
Transmission Regs/Policies• Same as assumed under Current Trends• Transmission faces lower construction cost
per mile
End - Use• Customers are more cost conscious, thus
more conservation • Limited growth of new technologies that are
still high costs, such as storage• Low load growth due to increased efficiency
and changed customer behavior
Alt Gen Resources• Lower oil/gas prices• Limited development of wind and solar due to
low energy prices• Nuclear re-licensing • Slower solar cost decline due to reduced global
demand
Gen Resource Adequacy Standards• Retiring of coal plants due to low energy
margins • System inertia issues increase
Environ. Regs. / Energy Policy• Continuing modest environmental regulations,
no significant changes from assumptions under Current Trends
• Government incentives continue for high efficiency appliances
• Continued subsidies for renewables (PTC/ITC)
Story:
Low energy prices threaten the Texas economy. Load growth is limited, resource expansion is limited to gas-fired plants and continued subsidized renewables. Stimulus programs help create incentives for consumers to replace old appliances and increase conservation. Coal plants that rely on coal by rail retire due to lower energy margins.
Implications for ERCOT:• Slow load growth• Growth in urban areas greater than in rural areas• Limited generation development, predominantly
gas-fired, subsidized renewables• Import/export issues between urban areas will
need to be addressed• Stability issues continue to increase due to low
system load
2. Scenario: Global Recession
ERCOT PUBLIC10
Global Recession Highlights• Natural gas price is low
• Scenario includes PTC and ITC
• No Reserve Margin
• Solar capital costs decline slower
• Lowest reserve margin of all scenarios – 9% in 2029
ERCOT PUBLIC11
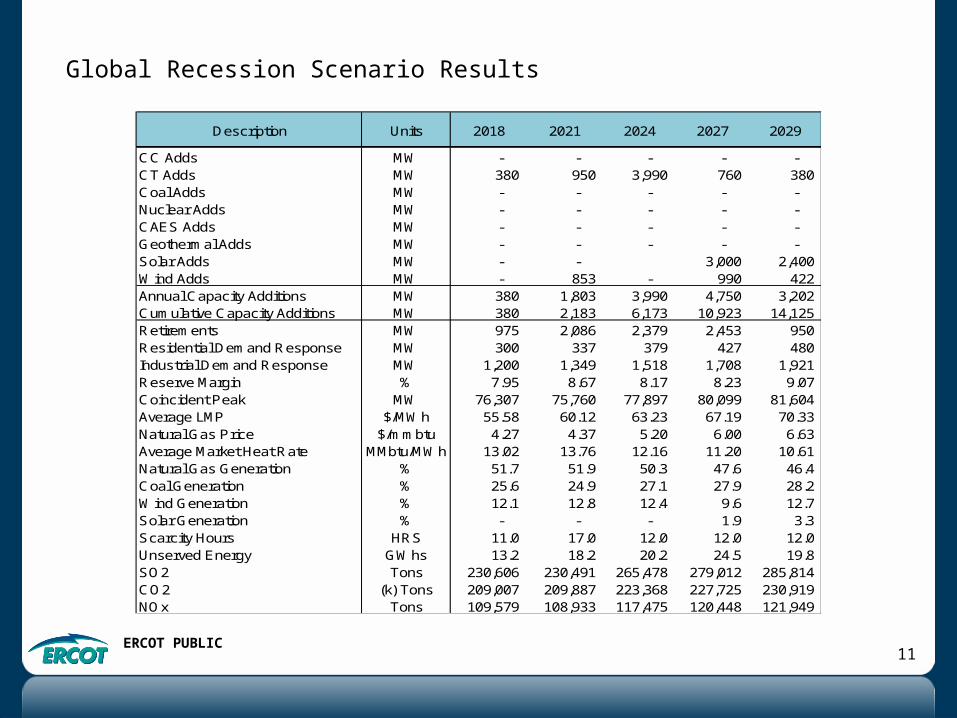
CC Adds MW - - - - - CT Adds MW 380 950 3,990 760 380 Coal Adds MW - - - - - Nuclear Adds MW - - - - - CAES Adds MW - - - - - Geothermal Adds MW - - - - - Solar Adds MW - - 3,000 2,400 Wind Adds MW - 853 - 990 422 Annual Capacity Additions MW 380 1,803 3,990 4,750 3,202 Cumulative Capacity Additions MW 380 2,183 6,173 10,923 14,125 Retirements MW 975 2,086 2,379 2,453 950 Residential Demand Response MW 300 337 379 427 480 Industrial Demand Response MW 1,200 1,349 1,518 1,708 1,921 Reserve Margin % 7.95 8.67 8.17 8.23 9.07 Coincident Peak MW 76,307 75,760 77,897 80,099 81,604 Average LMP $/MWh 55.58 60.12 63.23 67.19 70.33 Natural Gas Price $/mmbtu 4.27 4.37 5.20 6.00 6.63 Average Market Heat Rate MMbtu/MWh 13.02 13.76 12.16 11.20 10.61 Natural Gas Generation % 51.7 51.9 50.3 47.6 46.4 Coal Generation % 25.6 24.9 27.1 27.9 28.2 Wind Generation % 12.1 12.8 12.4 9.6 12.7 Solar Generation % - - - 1.9 3.3 Scarcity Hours HRS 11.0 17.0 12.0 12.0 12.0 Unserved Energy GWhs 13.2 18.2 20.2 24.5 19.8 SO2 Tons 230,606 230,491 265,478 279,012 285,814 CO2 (k) Tons 209,007 209,887 223,368 227,725 230,919 NOx Tons 109,579 108,933 117,475 120,448 121,949
2027 2029Description Units 2018 2021 2024
Global Recession Scenario Results
ERCOT PUBLIC12
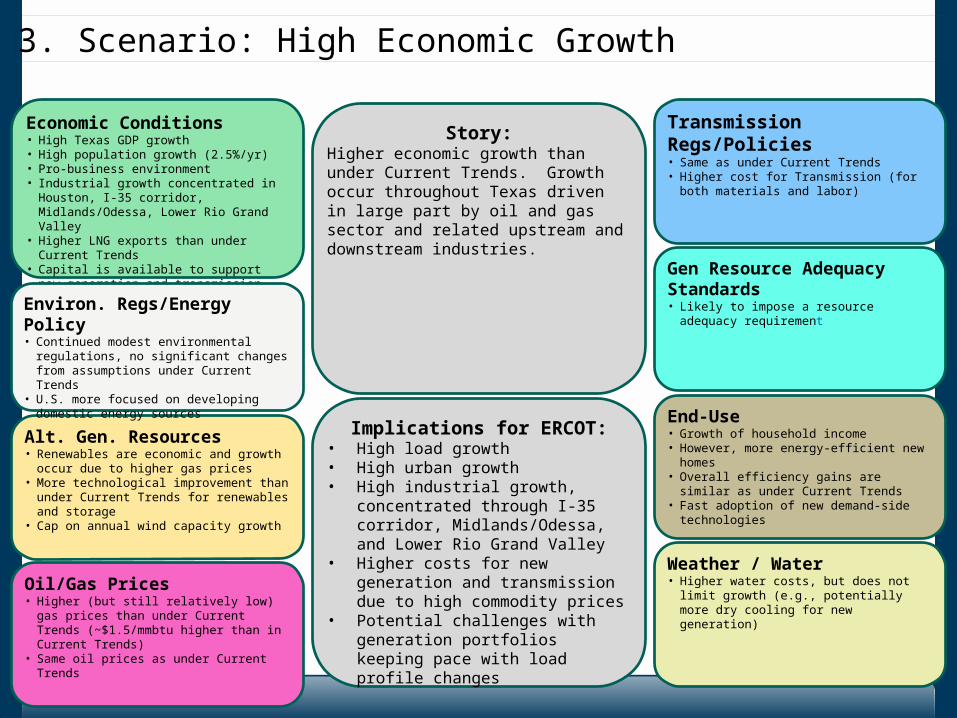
Transmission Regs/Policies• Same as under Current Trends• Higher cost for Transmission (for both
materials and labor)
Economic Conditions• High Texas GDP growth • High population growth (2.5%/yr)• Pro-business environment• Industrial growth concentrated in Houston, I-35
corridor, Midlands/Odessa, Lower Rio Grand Valley
• Higher LNG exports than under Current Trends
• Capital is available to support new generation and transmission
Weather / Water• Higher water costs, but does not limit growth
(e.g., potentially more dry cooling for new generation)
Oil/Gas Prices• Higher (but still relatively low) gas prices than
under Current Trends (~$1.5/mmbtu higher than in Current Trends)
• Same oil prices as under Current Trends
End-Use • Growth of household income• However, more energy-efficient new homes • Overall efficiency gains are similar as under
Current Trends• Fast adoption of new demand-side
technologies
Alt. Gen. Resources• Renewables are economic and growth occur
due to higher gas prices• More technological improvement than under
Current Trends for renewables and storage• Cap on annual wind capacity growth
Gen Resource Adequacy Standards• Likely to impose a resource adequacy
requirement
Environ. Regs/Energy Policy• Continued modest environmental regulations,
no significant changes from assumptions under Current Trends
• U.S. more focused on developing domestic energy sources
Story:Higher economic growth than under Current Trends. Growth occur throughout Texas driven in large part by oil and gas sector and related upstream and downstream industries.
Implications for ERCOT:• High load growth• High urban growth • High industrial growth, concentrated
through I-35 corridor, Midlands/Odessa, and Lower Rio Grand Valley
• Higher costs for new generation and transmission due to high commodity prices
• Potential challenges with generation portfolios keeping pace with load profile changes
3. Scenario: High Economic Growth
ERCOT PUBLIC13
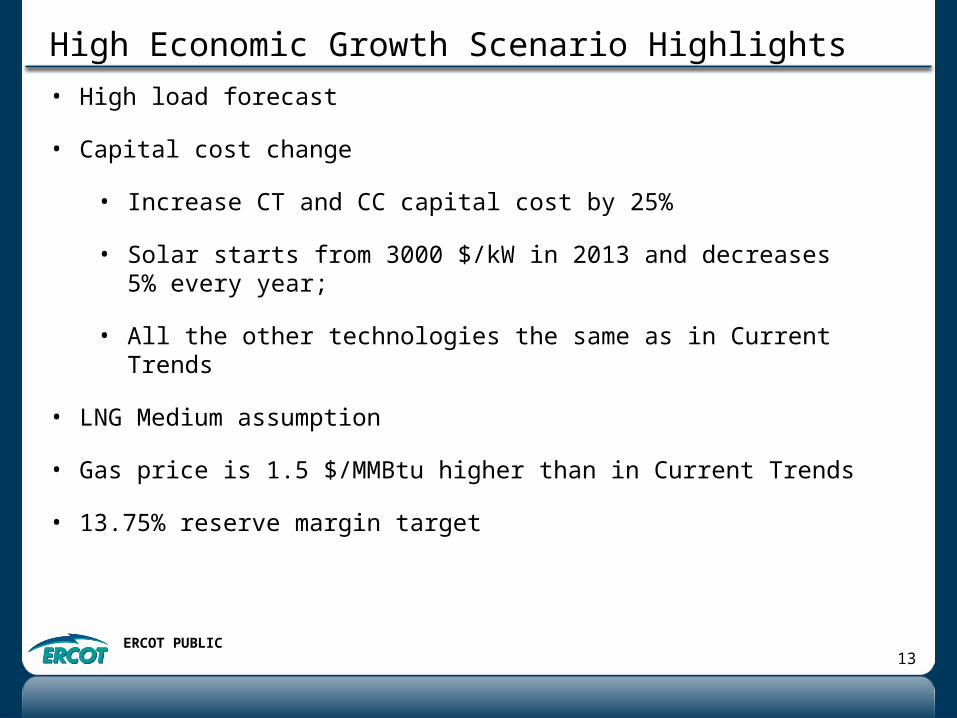
High Economic Growth Scenario Highlights• High load forecast
• Capital cost change
• Increase CT and CC capital cost by 25%
• Solar starts from 3000 $/kW in 2013 and decreases 5% every year;
• All the other technologies the same as in Current Trends
• LNG Medium assumption
• Gas price is 1.5 $/MMBtu higher than in Current Trends
• 13.75% reserve margin target
ERCOT PUBLIC14
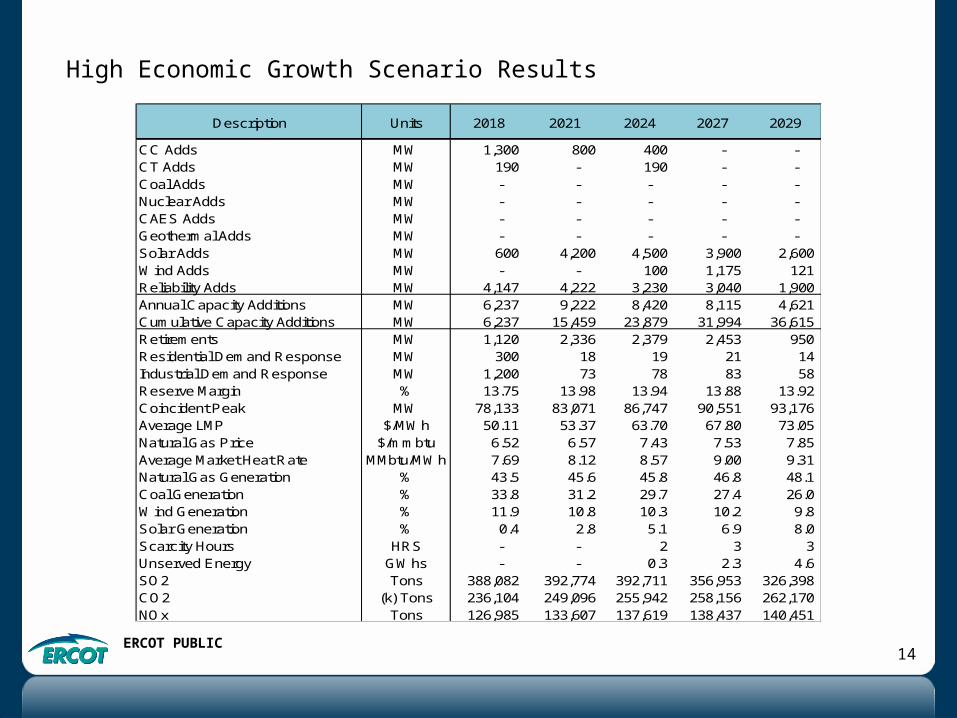
CC Adds MW 1,300 800 400 - - CT Adds MW 190 - 190 - - Coal Adds MW - - - - - Nuclear Adds MW - - - - - CAES Adds MW - - - - - Geothermal Adds MW - - - - - Solar Adds MW 600 4,200 4,500 3,900 2,600 Wind Adds MW - - 100 1,175 121 Reliability Adds MW 4,147 4,222 3,230 3,040 1,900 Annual Capacity Additions MW 6,237 9,222 8,420 8,115 4,621 Cumulative Capacity Additions MW 6,237 15,459 23,879 31,994 36,615 Retirements MW 1,120 2,336 2,379 2,453 950 Residential Demand Response MW 300 18 19 21 14 Industrial Demand Response MW 1,200 73 78 83 58 Reserve Margin % 13.75 13.98 13.94 13.88 13.92 Coincident Peak MW 78,133 83,071 86,747 90,551 93,176 Average LMP $/MWh 50.11 53.37 63.70 67.80 73.05 Natural Gas Price $/mmbtu 6.52 6.57 7.43 7.53 7.85 Average Market Heat Rate MMbtu/MWh 7.69 8.12 8.57 9.00 9.31 Natural Gas Generation % 43.5 45.6 45.8 46.8 48.1 Coal Generation % 33.8 31.2 29.7 27.4 26.0 Wind Generation % 11.9 10.8 10.3 10.2 9.8 Solar Generation % 0.4 2.8 5.1 6.9 8.0 Scarcity Hours HRS - - 2 3 3 Unserved Energy GWhs - - 0.3 2.3 4.6 SO2 Tons 388,082 392,774 392,711 356,953 326,398 CO2 (k) Tons 236,104 249,096 255,942 258,156 262,170 NOx Tons 126,985 133,607 137,619 138,437 140,451
2027 2029Description Units 2018 2021 2024
High Economic Growth Scenario Results
ERCOT PUBLIC15
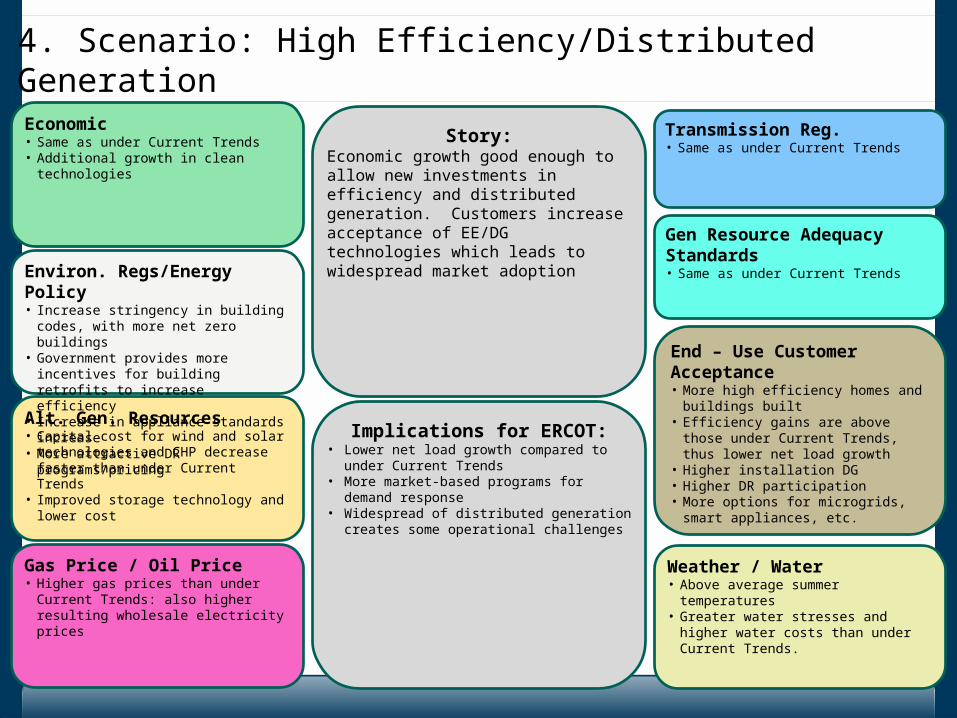
Economic• Same as under Current Trends• Additional growth in clean technologies
Weather / Water• Above average summer temperatures• Greater water stresses and higher water
costs than under Current Trends.
Gas Price / Oil Price• Higher gas prices than under Current
Trends: also higher resulting wholesale electricity prices
Transmission Reg.• Same as under Current Trends
End – Use Customer Acceptance• More high efficiency homes and buildings
built• Efficiency gains are above those under
Current Trends, thus lower net load growth
• Higher installation DG• Higher DR participation• More options for microgrids, smart
appliances, etc.
Alt. Gen. Resources• Capital cost for wind and solar
technologies and CHP decrease faster than under Current Trends
• Improved storage technology and lower cost
Gen Resource Adequacy Standards • Same as under Current TrendsEnviron. Regs/Energy Policy
• Increase stringency in building codes, with more net zero buildings
• Government provides more incentives for building retrofits to increase efficiency
• Increase in appliance standards increase• More attractive DR programs/pricing
Story:Economic growth good enough to allow new investments in efficiency and distributed generation. Customers increase acceptance of EE/DG technologies which leads to widespread market adoption
Implications for ERCOT:• Lower net load growth compared to under
Current Trends• More market-based programs for demand
response• Widespread of distributed generation creates
some operational challenges
4. Scenario: High Efficiency/Distributed Generation
ERCOT PUBLIC16
High EE and DG Highlights• High natural gas price
• High amounts of EE, DR and DG
ERCOT PUBLIC17
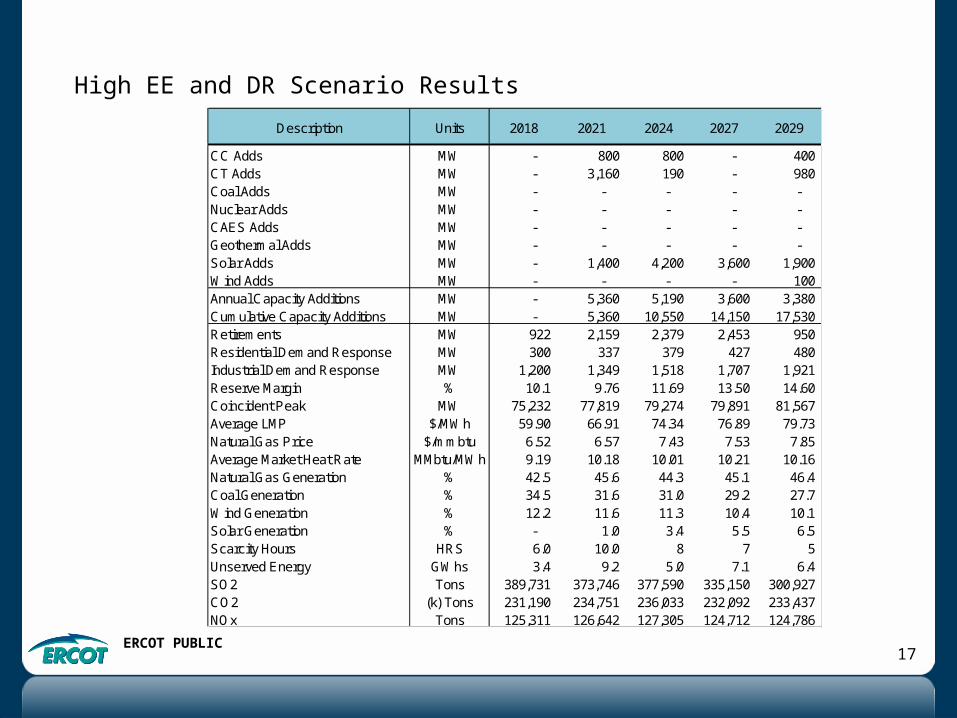
High EE and DR Scenario Results
CC Adds MW - 800 800 - 400 CT Adds MW - 3,160 190 - 980 Coal Adds MW - - - - - Nuclear Adds MW - - - - - CAES Adds MW - - - - - Geothermal Adds MW - - - - - Solar Adds MW - 1,400 4,200 3,600 1,900 Wind Adds MW - - - - 100 Annual Capacity Additions MW - 5,360 5,190 3,600 3,380 Cumulative Capacity Additions MW - 5,360 10,550 14,150 17,530 Retirements MW 922 2,159 2,379 2,453 950 Residential Demand Response MW 300 337 379 427 480 Industrial Demand Response MW 1,200 1,349 1,518 1,707 1,921 Reserve Margin % 10.1 9.76 11.69 13.50 14.60 Coincident Peak MW 75,232 77,819 79,274 79,891 81,567 Average LMP $/MWh 59.90 66.91 74.34 76.89 79.73 Natural Gas Price $/mmbtu 6.52 6.57 7.43 7.53 7.85 Average Market Heat Rate MMbtu/MWh 9.19 10.18 10.01 10.21 10.16 Natural Gas Generation % 42.5 45.6 44.3 45.1 46.4 Coal Generation % 34.5 31.6 31.0 29.2 27.7 Wind Generation % 12.2 11.6 11.3 10.4 10.1 Solar Generation % - 1.0 3.4 5.5 6.5 Scarcity Hours HRS 6.0 10.0 8 7 5 Unserved Energy GWhs 3.4 9.2 5.0 7.1 6.4 SO2 Tons 389,731 373,746 377,590 335,150 300,927 CO2 (k) Tons 231,190 234,751 236,033 232,092 233,437 NOx Tons 125,311 126,642 127,305 124,712 124,786
2027 2029Description Units 2018 2021 2024
ERCOT PUBLIC18
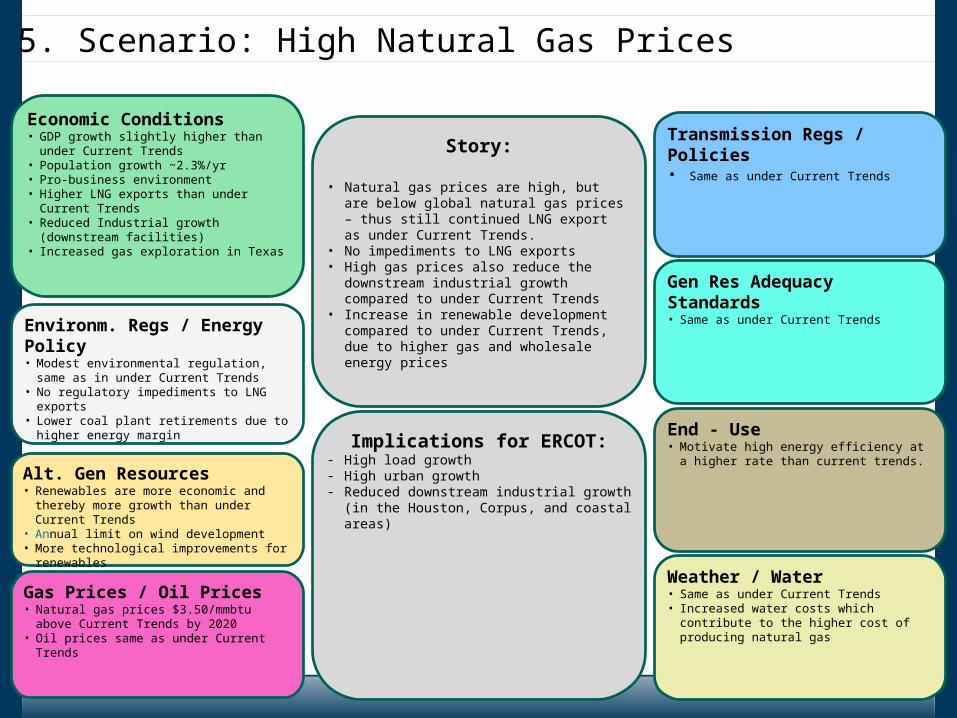
Economic Conditions• GDP growth slightly higher than under Current
Trends• Population growth ~2.3%/yr• Pro-business environment• Higher LNG exports than under Current
Trends• Reduced Industrial growth (downstream
facilities)• Increased gas exploration in Texas
Weather / Water• Same as under Current Trends• Increased water costs which contribute to the
higher cost of producing natural gas
Gas Prices / Oil Prices• Natural gas prices $3.50/mmbtu above Current
Trends by 2020• Oil prices same as under Current Trends
Transmission Regs / Policies• Same as under Current Trends
End - Use• Motivate high energy efficiency at a higher rate
than current trends.Alt. Gen Resources• Renewables are more economic and thereby
more growth than under Current Trends• Annual limit on wind development• More technological improvements for
renewables
Gen Res Adequacy Standards • Same as under Current Trends
Environm. Regs / Energy Policy• Modest environmental regulation, same as in
under Current Trends• No regulatory impediments to LNG exports• Lower coal plant retirements due to higher
energy margin
Story:
• Natural gas prices are high, but are below global natural gas prices – thus still continued LNG export as under Current Trends.
• No impediments to LNG exports• High gas prices also reduce the downstream
industrial growth compared to under Current Trends
• Increase in renewable development compared to under Current Trends, due to higher gas and wholesale energy prices
Implications for ERCOT:- High load growth- High urban growth- Reduced downstream industrial growth (in the
Houston, Corpus, and coastal areas)
5. Scenario: High Natural Gas Prices
ERCOT PUBLIC19
High Natural Gas Prices Highlights• Lower solar and storage costs than under Current Trends
• Gas price is 3.5 $/MMBtu higher than under Current Trends
• High EE and DG as under Stringent Environmental scenario, DR growth additional 3% every year than under Current Trends
ERCOT PUBLIC20
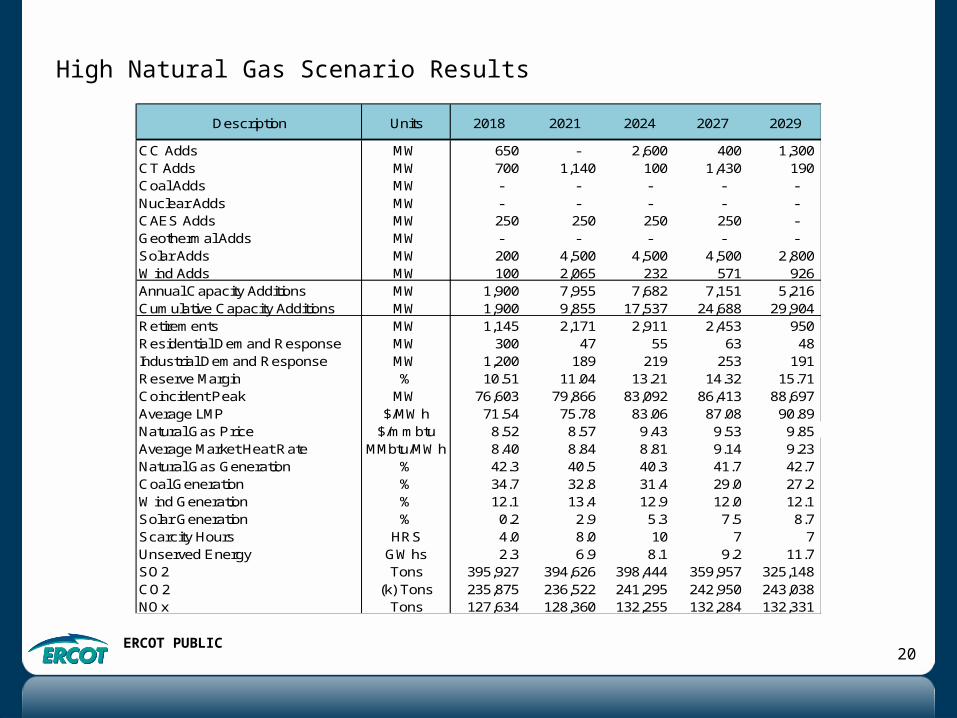
CC Adds MW 650 - 2,600 400 1,300 CT Adds MW 700 1,140 100 1,430 190 Coal Adds MW - - - - - Nuclear Adds MW - - - - - CAES Adds MW 250 250 250 250 - Geothermal Adds MW - - - - - Solar Adds MW 200 4,500 4,500 4,500 2,800 Wind Adds MW 100 2,065 232 571 926 Annual Capacity Additions MW 1,900 7,955 7,682 7,151 5,216 Cumulative Capacity Additions MW 1,900 9,855 17,537 24,688 29,904 Retirements MW 1,145 2,171 2,911 2,453 950 Residential Demand Response MW 300 47 55 63 48 Industrial Demand Response MW 1,200 189 219 253 191 Reserve Margin % 10.51 11.04 13.21 14.32 15.71 Coincident Peak MW 76,603 79,866 83,092 86,413 88,697 Average LMP $/MWh 71.54 75.78 83.06 87.08 90.89 Natural Gas Price $/mmbtu 8.52 8.57 9.43 9.53 9.85 Average Market Heat Rate MMbtu/MWh 8.40 8.84 8.81 9.14 9.23 Natural Gas Generation % 42.3 40.5 40.3 41.7 42.7 Coal Generation % 34.7 32.8 31.4 29.0 27.2 Wind Generation % 12.1 13.4 12.9 12.0 12.1 Solar Generation % 0.2 2.9 5.3 7.5 8.7 Scarcity Hours HRS 4.0 8.0 10 7 7 Unserved Energy GWhs 2.3 6.9 8.1 9.2 11.7 SO2 Tons 395,927 394,626 398,444 359,957 325,148 CO2 (k) Tons 235,875 236,522 241,295 242,950 243,038 NOx Tons 127,634 128,360 132,255 132,284 132,331
2027 2029Description Units 2018 2021 2024
High Natural Gas Scenario Results
ERCOT PUBLIC21
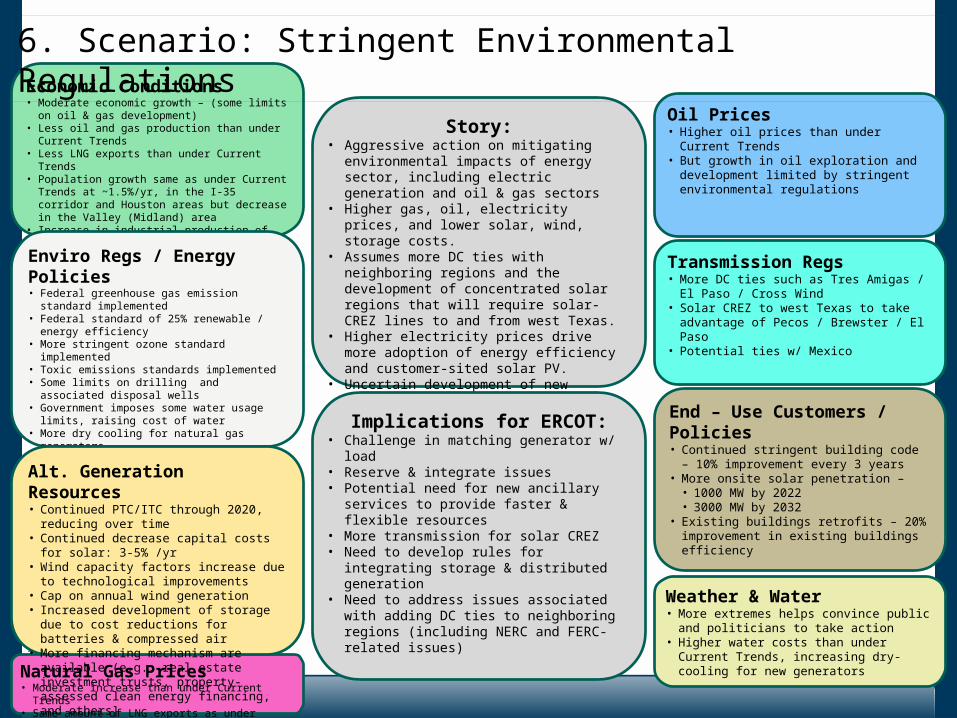
Economic Conditions• Moderate economic growth – (some limits on oil &
gas development)• Less oil and gas production than under Current
Trends• Less LNG exports than under Current Trends• Population growth same as under Current Trends at
~1.5%/yr, in the I-35 corridor and Houston areas but decrease in the Valley (Midland) area
• Increase in industrial production of alternative energy and efficiency-related technologies
Weather & Water• More extremes helps convince public and
politicians to take action• Higher water costs than under Current Trends,
increasing dry-cooling for new generatorsNatural Gas Prices• Moderate increase than under Current Trends • Same amount of LNG exports as under Current Trends
Oil Prices• Higher oil prices than under Current Trends• But growth in oil exploration and development
limited by stringent environmental regulations
End – Use Customers / Policies• Continued stringent building code – 10%
improvement every 3 years• More onsite solar penetration –
• 1000 MW by 2022• 3000 MW by 2032
• Existing buildings retrofits – 20% improvement in existing buildings efficiency
Transmission Regs• More DC ties such as Tres Amigas / El Paso /
Cross Wind• Solar CREZ to west Texas to take advantage
of Pecos / Brewster / El Paso• Potential ties w/ Mexico
Enviro Regs / Energy Policies• Federal greenhouse gas emission standard
implemented• Federal standard of 25% renewable / energy
efficiency• More stringent ozone standard implemented• Toxic emissions standards implemented• Some limits on drilling and associated disposal
wells• Government imposes some water usage limits,
raising cost of water• More dry cooling for natural gas generators• Moderate carbon tax / price materializes• Increase nuclear safety concerns than under
Current Trends
Story:• Aggressive action on mitigating environmental
impacts of energy sector, including electric generation and oil & gas sectors
• Higher gas, oil, electricity prices, and lower solar, wind, storage costs.
• Assumes more DC ties with neighboring regions and the development of concentrated solar regions that will require solar-CREZ lines to and from west Texas.
• Higher electricity prices drive more adoption of energy efficiency and customer-sited solar PV.
• Uncertain development of new nuclear & geothermal
Implications for ERCOT:• Challenge in matching generator w/ load• Reserve & integrate issues• Potential need for new ancillary services to
provide faster & flexible resources• More transmission for solar CREZ• Need to develop rules for integrating storage &
distributed generation• Need to address issues associated with adding
DC ties to neighboring regions (including NERC and FERC-related issues)
6. Scenario: Stringent Environmental Regulations
Alt. Generation Resources • Continued PTC/ITC through 2020, reducing
over time• Continued decrease capital costs for solar: 3-
5% /yr• Wind capacity factors increase due to
technological improvements• Cap on annual wind generation• Increased development of storage due to
cost reductions for batteries & compressed air• More financing mechanism are available (e.g.:
real estate investment trusts, property-assessed clean energy financing, and others]
ERCOT PUBLIC22
Stringent Environmental Scenario Highlights
• ERCOT’s Current Trends load forecast was adjusted for increased EE and 2,400 MW of Solar DG by 2029
• Current Trends NG forecast was increased by $1.50/mmBtu in each year
• Costs for SO2, NOx, and CO2 were added
– CO2 costs ranged from $25/ton in 2018 to $61/ton in 2029
– At these CO2 costs ERCOT exceeds current GHG emission levels goals for both 2020 and 2030
• PTC and ITC were added to Wind and Solar expansion
• Demand response was increased an additional 3% per year over Current Trends amounts
• DC Ties were increased by 3,000 MW to represent new connections to external ERCOT markets
• This scenario will be analyzed with Kermit
ERCOT PUBLIC23
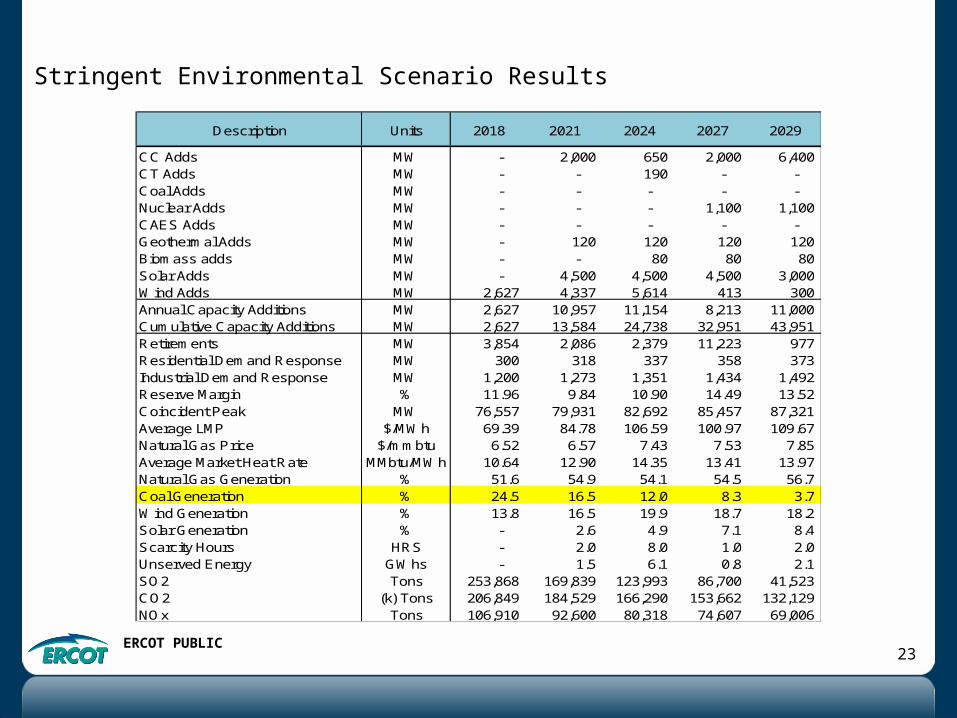
CC Adds MW - 2,000 650 2,000 6,400 CT Adds MW - - 190 - - Coal Adds MW - - - - - Nuclear Adds MW - - - 1,100 1,100 CAES Adds MW - - - - - Geothermal Adds MW - 120 120 120 120 Biomass adds MW - - 80 80 80 Solar Adds MW - 4,500 4,500 4,500 3,000 Wind Adds MW 2,627 4,337 5,614 413 300 Annual Capacity Additions MW 2,627 10,957 11,154 8,213 11,000 Cumulative Capacity Additions MW 2,627 13,584 24,738 32,951 43,951 Retirements MW 3,854 2,086 2,379 11,223 977 Residential Demand Response MW 300 318 337 358 373 Industrial Demand Response MW 1,200 1,273 1,351 1,434 1,492 Reserve Margin % 11.96 9.84 10.90 14.49 13.52 Coincident Peak MW 76,557 79,931 82,692 85,457 87,321 Average LMP $/MWh 69.39 84.78 106.59 100.97 109.67 Natural Gas Price $/mmbtu 6.52 6.57 7.43 7.53 7.85 Average Market Heat Rate MMbtu/MWh 10.64 12.90 14.35 13.41 13.97 Natural Gas Generation % 51.6 54.9 54.1 54.5 56.7 Coal Generation % 24.5 16.5 12.0 8.3 3.7 Wind Generation % 13.8 16.5 19.9 18.7 18.2 Solar Generation % - 2.6 4.9 7.1 8.4 Scarcity Hours HRS - 2.0 8.0 1.0 2.0 Unserved Energy GWhs - 1.5 6.1 0.8 2.1 SO2 Tons 253,868 169,839 123,993 86,700 41,523 CO2 (k) Tons 206,849 184,529 166,290 153,662 132,129 NOx Tons 106,910 92,600 80,318 74,607 69,006
2027 2029Description Units 2018 2021 2024
Stringent Environmental Scenario Results
ERCOT PUBLIC24
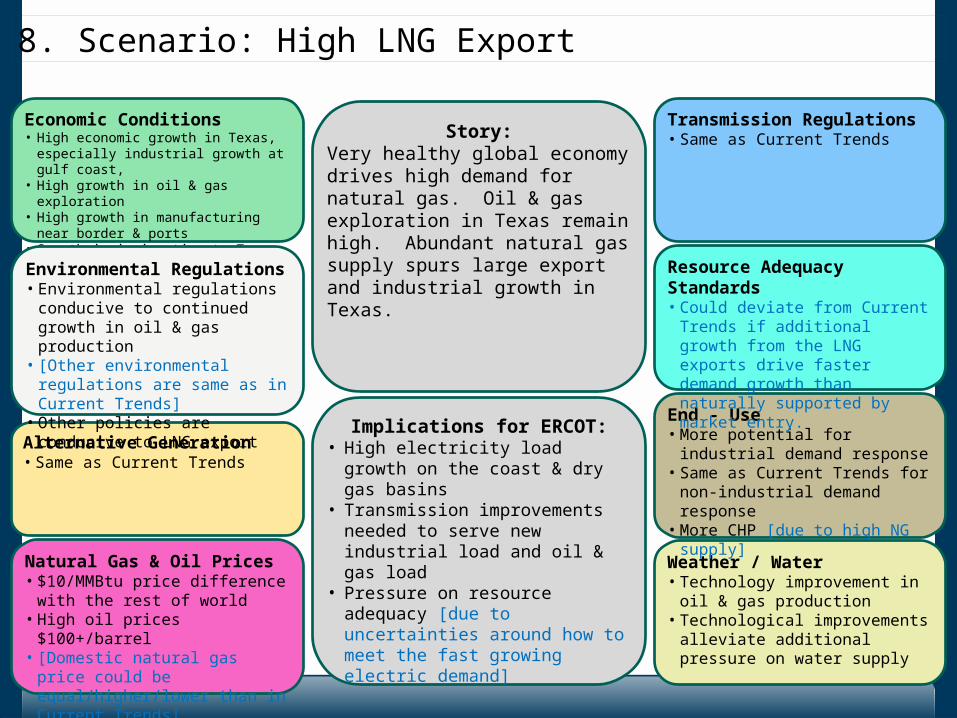
Economic Conditions• High economic growth in Texas, especially
industrial growth at gulf coast, • High growth in oil & gas exploration• High growth in manufacturing near border
& ports• Growth in immigration to Texas
Weather / Water• Technology improvement in oil &
gas production• Technological improvements
alleviate additional pressure on water supply
Natural Gas & Oil Prices• $10/MMBtu price difference with the
rest of world• High oil prices $100+/barrel• [Domestic natural gas price could
be equal/higher/lower than in Current Trends]
Transmission Regulations• Same as Current Trends
End - Use• More potential for industrial
demand response• Same as Current Trends for non-
industrial demand response• More CHP [due to high NG supply]
Alternative Generation• Same as Current Trends
Resource Adequacy Standards• Could deviate from Current Trends
if additional growth from the LNG exports drive faster demand growth than naturally supported by market entry.
Environmental Regulations• Environmental regulations
conducive to continued growth in oil & gas production
• [Other environmental regulations are same as in Current Trends]
• Other policies are conducive to LNG export
Story:Very healthy global economy drives high demand for natural gas. Oil & gas exploration in Texas remain high. Abundant natural gas supply spurs large export and industrial growth in Texas.
Implications for ERCOT:• High electricity load growth on the
coast & dry gas basins• Transmission improvements needed
to serve new industrial load and oil & gas load
• Pressure on resource adequacy [due to uncertainties around how to meet the fast growing electric demand]
8. Scenario: High LNG Export
ERCOT PUBLIC25
High LNG Export Highlights• Load forecast between High Economic Growth and Current Trends
scenarios
• Added 4.1 bcf/d LNG from 2018 and additional 5.7 bcf/d from 2019, the total is around 3840 MW flat load
ERCOT PUBLIC26
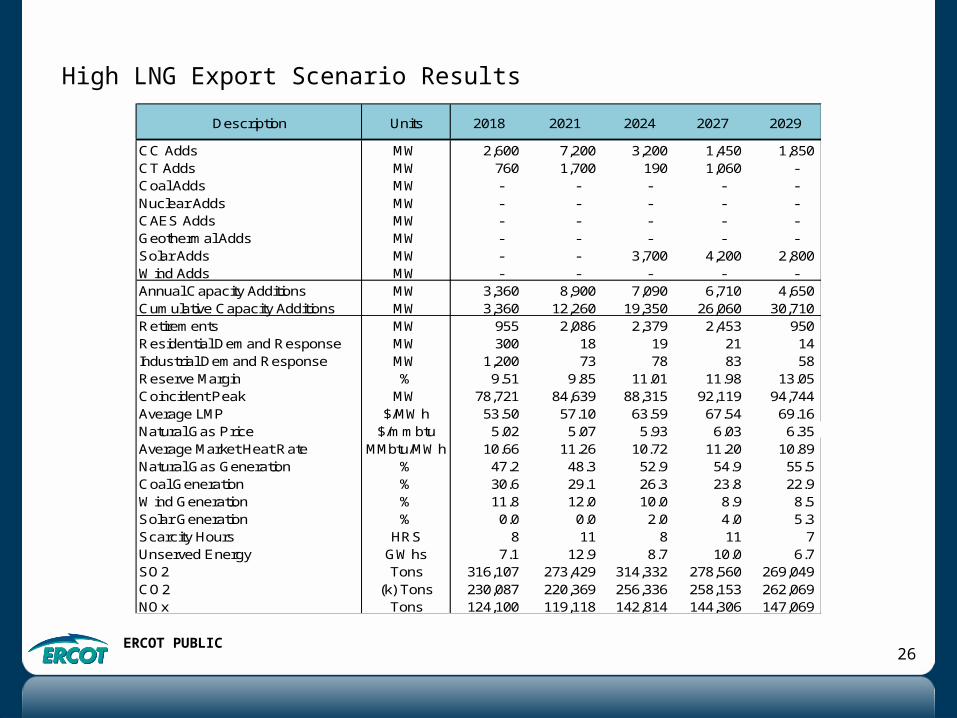
CC Adds MW 2,600 7,200 3,200 1,450 1,850 CT Adds MW 760 1,700 190 1,060 - Coal Adds MW - - - - - Nuclear Adds MW - - - - - CAES Adds MW - - - - - Geothermal Adds MW - - - - - Solar Adds MW - - 3,700 4,200 2,800 Wind Adds MW - - - - - Annual Capacity Additions MW 3,360 8,900 7,090 6,710 4,650 Cumulative Capacity Additions MW 3,360 12,260 19,350 26,060 30,710 Retirements MW 955 2,086 2,379 2,453 950 Residential Demand Response MW 300 18 19 21 14 Industrial Demand Response MW 1,200 73 78 83 58 Reserve Margin % 9.51 9.85 11.01 11.98 13.05 Coincident Peak MW 78,721 84,639 88,315 92,119 94,744 Average LMP $/MWh 53.50 57.10 63.59 67.54 69.16 Natural Gas Price $/mmbtu 5.02 5.07 5.93 6.03 6.35 Average Market Heat Rate MMbtu/MWh 10.66 11.26 10.72 11.20 10.89 Natural Gas Generation % 47.2 48.3 52.9 54.9 55.5 Coal Generation % 30.6 29.1 26.3 23.8 22.9 Wind Generation % 11.8 12.0 10.0 8.9 8.5 Solar Generation % 0.0 0.0 2.0 4.0 5.3 Scarcity Hours HRS 8 11 8 11 7 Unserved Energy GWhs 7.1 12.9 8.7 10.0 6.7 SO2 Tons 316,107 273,429 314,332 278,560 269,049 CO2 (k) Tons 230,087 220,369 256,336 258,153 262,069 NOx Tons 124,100 119,118 142,814 144,306 147,069
2027 2029Description Units 2018 2021 2024
High LNG Export Scenario Results
ERCOT PUBLIC27
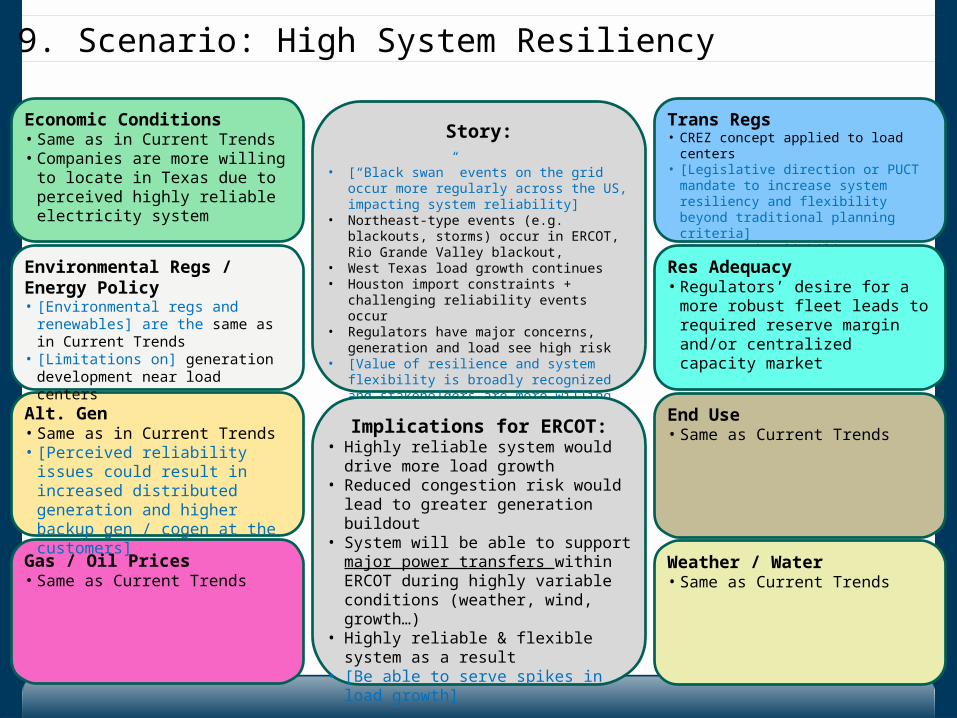
Economic Conditions• Same as in Current Trends• Companies are more willing to
locate in Texas due to perceived highly reliable electricity system
Weather / Water• Same as Current Trends
Gas / Oil Prices• Same as Current Trends
Trans Regs• CREZ concept applied to load centers• [Legislative direction or PUCT mandate to
increase system resiliency and flexibility beyond traditional planning criteria]
• [Increased reliability standards applied to transmission planning]
End Use• Same as Current Trends
Alt. Gen• Same as in Current Trends• [Perceived reliability issues could
result in increased distributed generation and higher backup gen / cogen at the customers]
Res Adequacy• Regulators’ desire for a more
robust fleet leads to required reserve margin and/or centralized capacity market
Environmental Regs / Energy Policy• [Environmental regs and renewables]
are the same as in Current Trends • [Limitations on] generation
development near load centers
Story:
• [“Black swan” events on the grid occur more regularly across the US, impacting system reliability]
• Northeast-type events (e.g. blackouts, storms) occur in ERCOT, Rio Grande Valley blackout,
• West Texas load growth continues• Houston import constraints + challenging
reliability events occur • Regulators have major concerns, generation
and load see high risk • [Value of resilience and system flexibility is
broadly recognized and stakeholders are more willing to invest in infrastructure to ensure greater resiliency]
Implications for ERCOT:• Highly reliable system would drive more
load growth• Reduced congestion risk would lead to
greater generation buildout• System will be able to support major
power transfers within ERCOT during highly variable conditions (weather, wind, growth…)
• Highly reliable & flexible system as a result
• [Be able to serve spikes in load growth]
9. Scenario: High System Resiliency
ERCOT PUBLIC28
High System Resiliency Highlights• DC Ties were increased by 3,000 MW to represent new connections to
external ERCOT markets as under Stringent Environmental Scenario
• Included a 13.75% reserve margin target
• DR growth is 5% every year as under String Environmental Scenario
ERCOT PUBLIC29
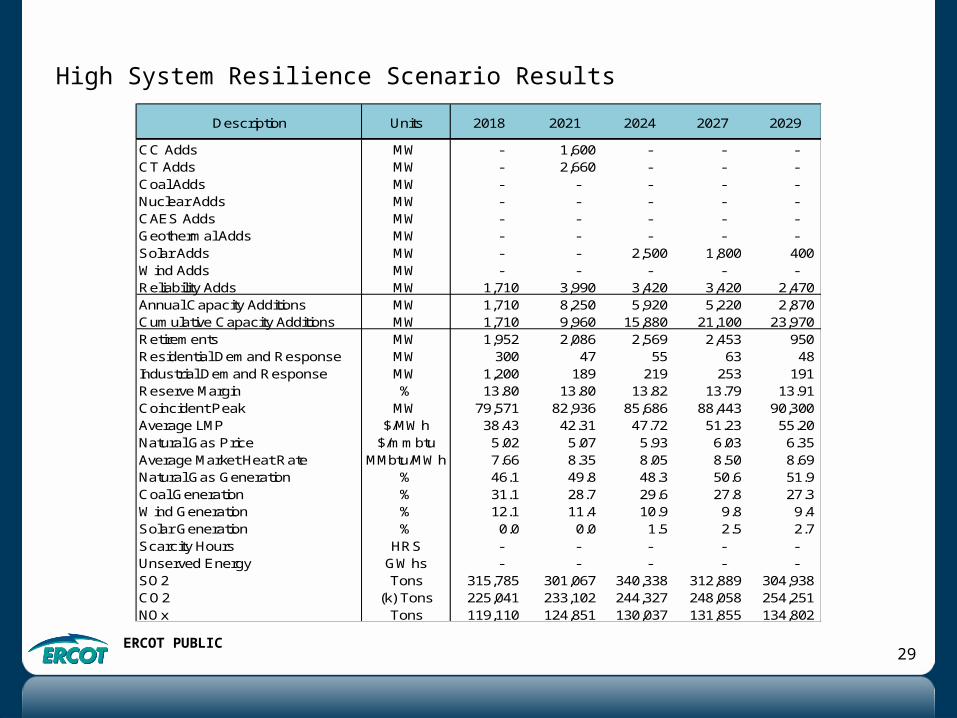
CC Adds MW - 1,600 - - - CT Adds MW - 2,660 - - - Coal Adds MW - - - - - Nuclear Adds MW - - - - - CAES Adds MW - - - - - Geothermal Adds MW - - - - - Solar Adds MW - - 2,500 1,800 400 Wind Adds MW - - - - - Reliability Adds MW 1,710 3,990 3,420 3,420 2,470 Annual Capacity Additions MW 1,710 8,250 5,920 5,220 2,870 Cumulative Capacity Additions MW 1,710 9,960 15,880 21,100 23,970 Retirements MW 1,952 2,086 2,569 2,453 950 Residential Demand Response MW 300 47 55 63 48 Industrial Demand Response MW 1,200 189 219 253 191 Reserve Margin % 13.80 13.80 13.82 13.79 13.91 Coincident Peak MW 79,571 82,936 85,686 88,443 90,300 Average LMP $/MWh 38.43 42.31 47.72 51.23 55.20 Natural Gas Price $/mmbtu 5.02 5.07 5.93 6.03 6.35 Average Market Heat Rate MMbtu/MWh 7.66 8.35 8.05 8.50 8.69 Natural Gas Generation % 46.1 49.8 48.3 50.6 51.9 Coal Generation % 31.1 28.7 29.6 27.8 27.3 Wind Generation % 12.1 11.4 10.9 9.8 9.4 Solar Generation % 0.0 0.0 1.5 2.5 2.7 Scarcity Hours HRS - - - - - Unserved Energy GWhs - - - - - SO2 Tons 315,785 301,067 340,338 312,889 304,938 CO2 (k) Tons 225,041 233,102 244,327 248,058 254,251 NOx Tons 119,110 124,851 130,037 131,855 134,802
2027 2029Description Units 2018 2021 2024
High System Resilience Scenario Results
ERCOT PUBLIC30
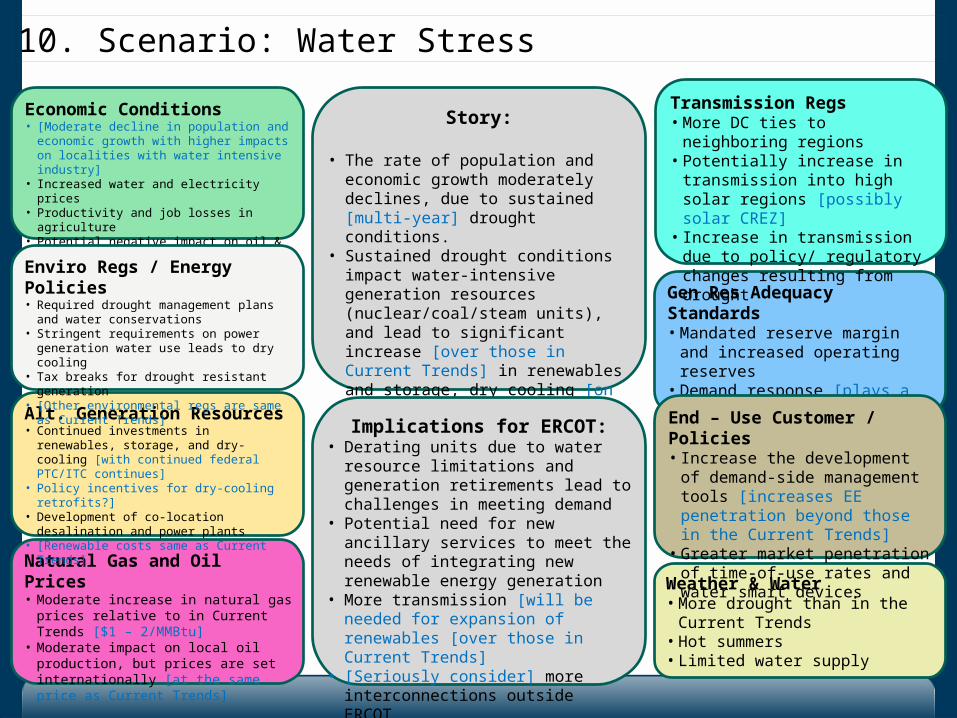
Economic Conditions• [Moderate decline in population and economic
growth with higher impacts on localities with water intensive industry]
• Increased water and electricity prices• Productivity and job losses in agriculture• Potential negative impact on oil & gas
extraction• Impact on local economy
Weather & Water• More drought than in the Current
Trends• Hot summers• Limited water supply
Natural Gas and Oil Prices• Moderate increase in natural gas prices
relative to in Current Trends [$1 – 2/MMBtu]• Moderate impact on local oil production, but
prices are set internationally [at the same price as Current Trends]
Gen Res Adequacy Standards• Mandated reserve margin and
increased operating reserves• Demand response [plays a larger
role than in Current Trends]
End – Use Customer / Policies• Increase the development of
demand-side management tools [increases EE penetration beyond those in the Current Trends]
• Greater market penetration of time-of-use rates and water smart devices
Alt. Generation Resources• Continued investments in renewables, storage,
and dry-cooling [with continued federal PTC/ITC continues]
• Policy incentives for dry-cooling retrofits?]• Development of co-location desalination and
power plants• [Renewable costs same as Current Trends]
Transmission Regs • More DC ties to neighboring
regions• Potentially increase in
transmission into high solar regions [possibly solar CREZ]
• Increase in transmission due to policy/ regulatory changes resulting from drought
Enviro Regs / Energy Policies• Required drought management plans and
water conservations• Stringent requirements on power generation
water use leads to dry cooling• Tax breaks for drought resistant generation• [Other environmental regs are same as Current
Trends]
Story:
• The rate of population and economic growth moderately declines, due to sustained [multi-year] drought conditions.
• Sustained drought conditions impact water-intensive generation resources (nuclear/coal/steam units), and lead to significant increase [over those in Current Trends] in renewables and storage, dry cooling [on thermal generation], and transmission expansion.
Implications for ERCOT:• Derating units due to water resource
limitations and generation retirements lead to challenges in meeting demand
• Potential need for new ancillary services to meet the needs of integrating new renewable energy generation
• More transmission [will be needed for expansion of renewables [over those in Current Trends]
• [Seriously consider] more interconnections outside ERCOT.
10. Scenario: Water Stress
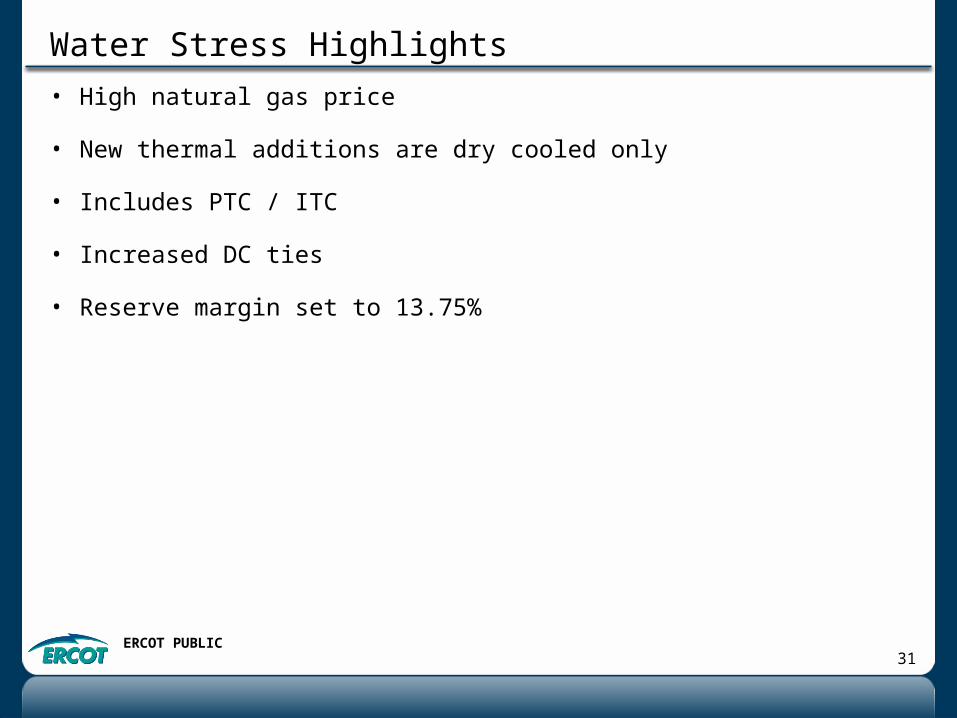
ERCOT PUBLIC31
Water Stress Highlights• High natural gas price
• New thermal additions are dry cooled only
• Includes PTC / ITC
• Increased DC ties
• Reserve margin set to 13.75%
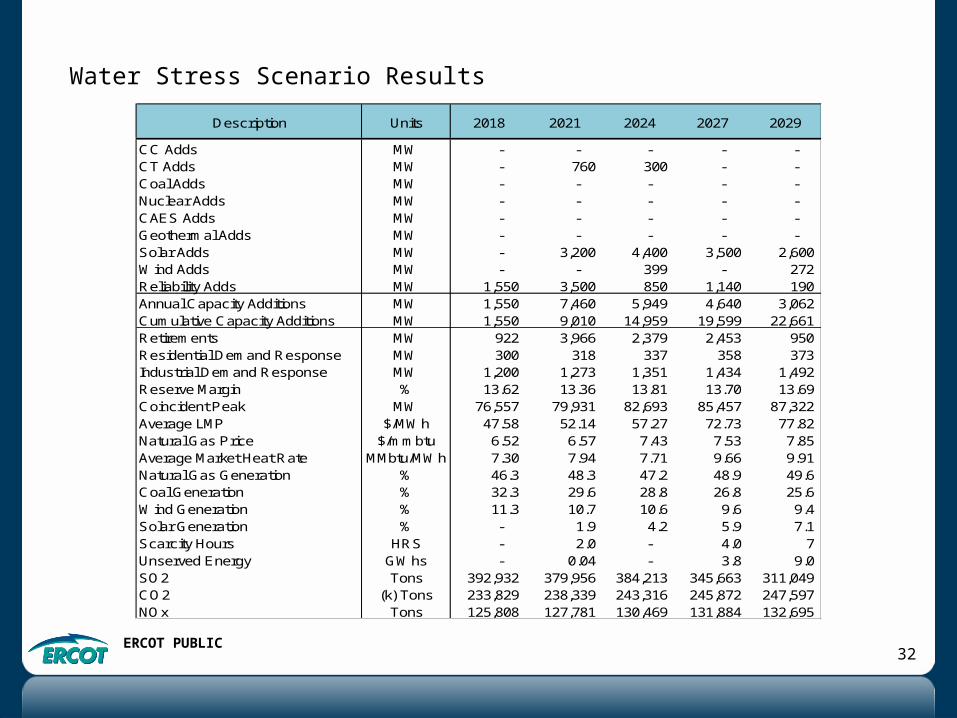
ERCOT PUBLIC32
Water Stress Scenario Results
CC Adds MW - - - - - CT Adds MW - 760 300 - - Coal Adds MW - - - - - Nuclear Adds MW - - - - - CAES Adds MW - - - - - Geothermal Adds MW - - - - - Solar Adds MW - 3,200 4,400 3,500 2,600 Wind Adds MW - - 399 - 272 Reliability Adds MW 1,550 3,500 850 1,140 190 Annual Capacity Additions MW 1,550 7,460 5,949 4,640 3,062 Cumulative Capacity Additions MW 1,550 9,010 14,959 19,599 22,661 Retirements MW 922 3,966 2,379 2,453 950 Residential Demand Response MW 300 318 337 358 373 Industrial Demand Response MW 1,200 1,273 1,351 1,434 1,492 Reserve Margin % 13.62 13.36 13.81 13.70 13.69 Coincident Peak MW 76,557 79,931 82,693 85,457 87,322 Average LMP $/MWh 47.58 52.14 57.27 72.73 77.82 Natural Gas Price $/mmbtu 6.52 6.57 7.43 7.53 7.85 Average Market Heat Rate MMbtu/MWh 7.30 7.94 7.71 9.66 9.91 Natural Gas Generation % 46.3 48.3 47.2 48.9 49.6 Coal Generation % 32.3 29.6 28.8 26.8 25.6 Wind Generation % 11.3 10.7 10.6 9.6 9.4 Solar Generation % - 1.9 4.2 5.9 7.1 Scarcity Hours HRS - 2.0 - 4.0 7 Unserved Energy GWhs - 0.04 - 3.8 9.0 SO2 Tons 392,932 379,956 384,213 345,663 311,049 CO2 (k) Tons 233,829 238,339 243,316 245,872 247,597 NOx Tons 125,808 127,781 130,469 131,884 132,695
2027 2029Description Units 2018 2021 2024
ERCOT PUBLIC33
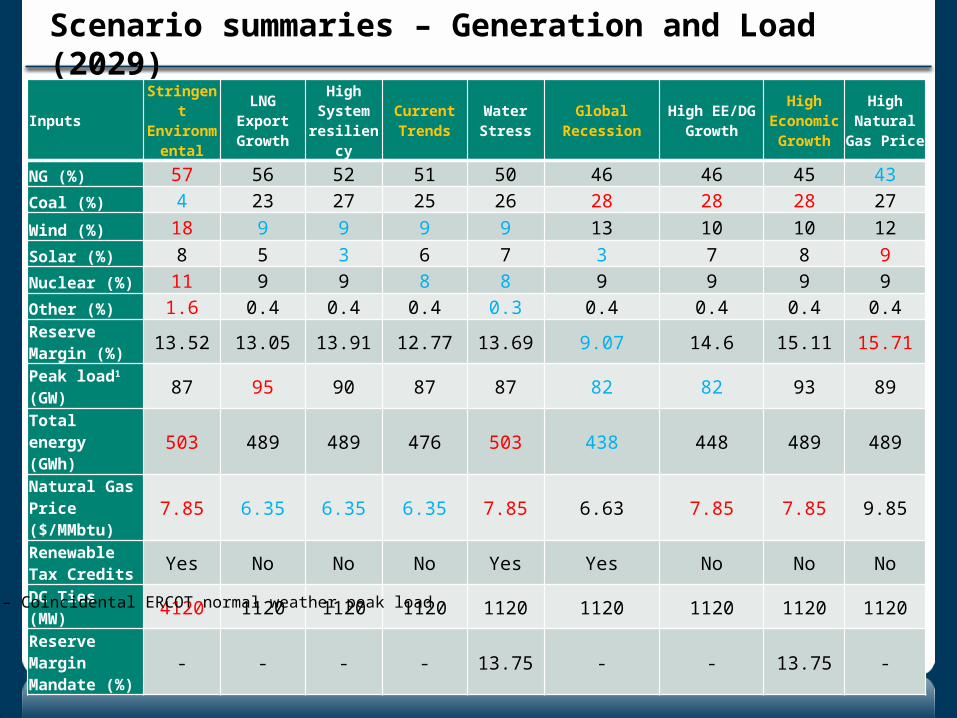
Scenario summaries – Generation and Load (2029)
InputsStringent Environm
ental
LNG Export Growth
High System
resiliency
Current Trends
Water Stress
Global Recession
High EE/DG Growth
High Economic
Growth
High Natural
Gas Price
NG (%) 57 56 52 51 50 46 46 45 43Coal (%) 4 23 27 25 26 28 28 28 27
Wind (%) 18 9 9 9 9 13 10 10 12Solar (%) 8 5 3 6 7 3 7 8 9Nuclear (%) 11 9 9 8 8 9 9 9 9Other (%) 1.6 0.4 0.4 0.4 0.3 0.4 0.4 0.4 0.4Reserve Margin (%) 13.52 13.05 13.91 12.77 13.69 9.07 14.6 15.11 15.71
Peak load1 (GW) 87 95 90 87 87 82 82 93 89
Total energy (GWh) 503 489 489 476 503 438 448 489 489
Natural Gas Price ($/MMbtu)
7.85 6.35 6.35 6.35 7.85 6.63 7.85 7.85 9.85
Renewable Tax Credits Yes No No No Yes Yes No No No
DC Ties (MW) 4120 1120 1120 1120 1120 1120 1120 1120 1120Reserve Margin Mandate (%)
- - - - 13.75 - - 13.75 -
1 – Coincidental ERCOT normal weather peak load
ERCOT PUBLIC34
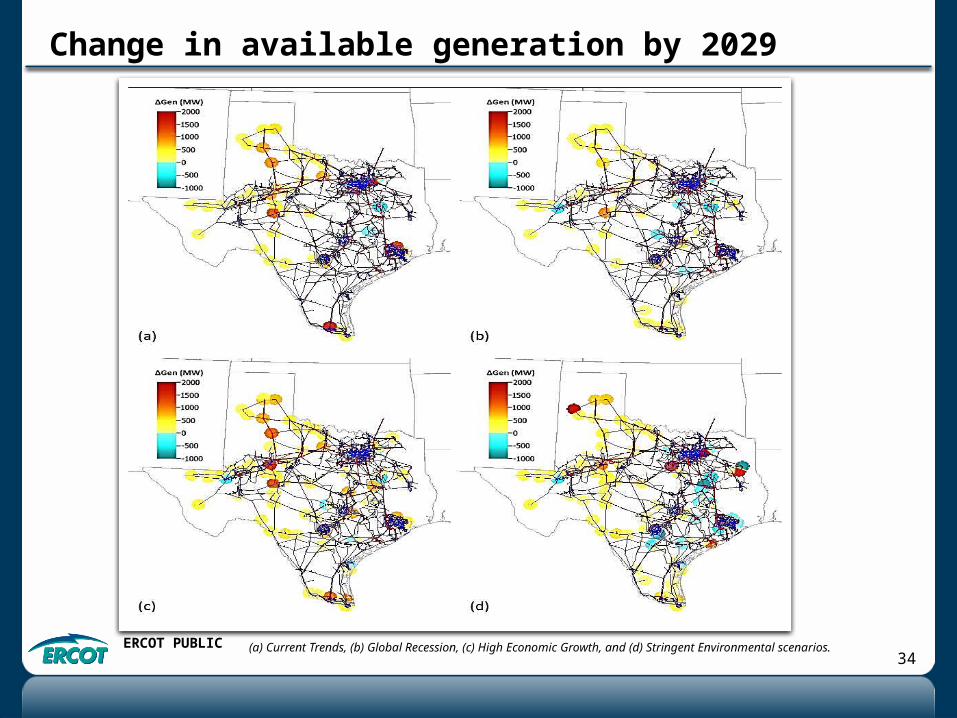
(a) Current Trends, (b) Global Recession, (c) High Economic Growth, and (d) Stringent Environmental scenarios.
Change in available generation by 2029
ERCOT PUBLIC35
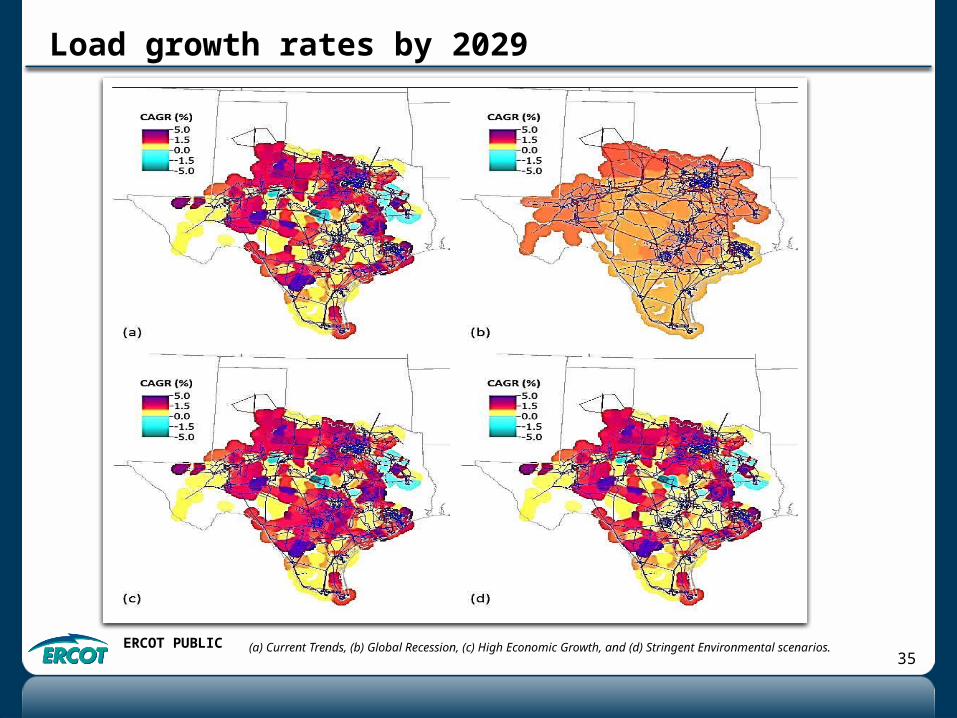
(a) Current Trends, (b) Global Recession, (c) High Economic Growth, and (d) Stringent Environmental scenarios.
Load growth rates by 2029
ERCOT PUBLIC36
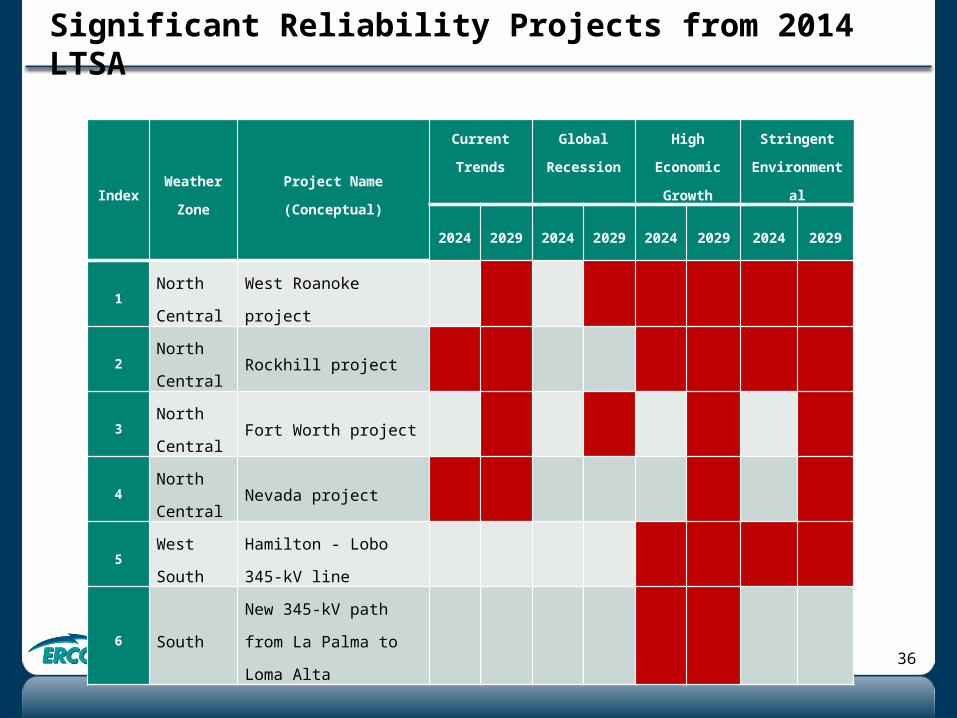
Significant Reliability Projects from 2014 LTSA
IndexWeather
ZoneProject Name (Conceptual)
Current
Trends
Global
Recession
High
Economic
Growth
Stringent
Environmental
2024 2029 2024 2029 2024 2029 2024 2029
1North
CentralWest Roanoke project
2North
CentralRockhill project
3North
CentralFort Worth project
4North
CentralNevada project
5West
South
Hamilton - Lobo 345-kV
line
6 SouthNew 345-kV path from
La Palma to Loma Alta
ERCOT PUBLIC37
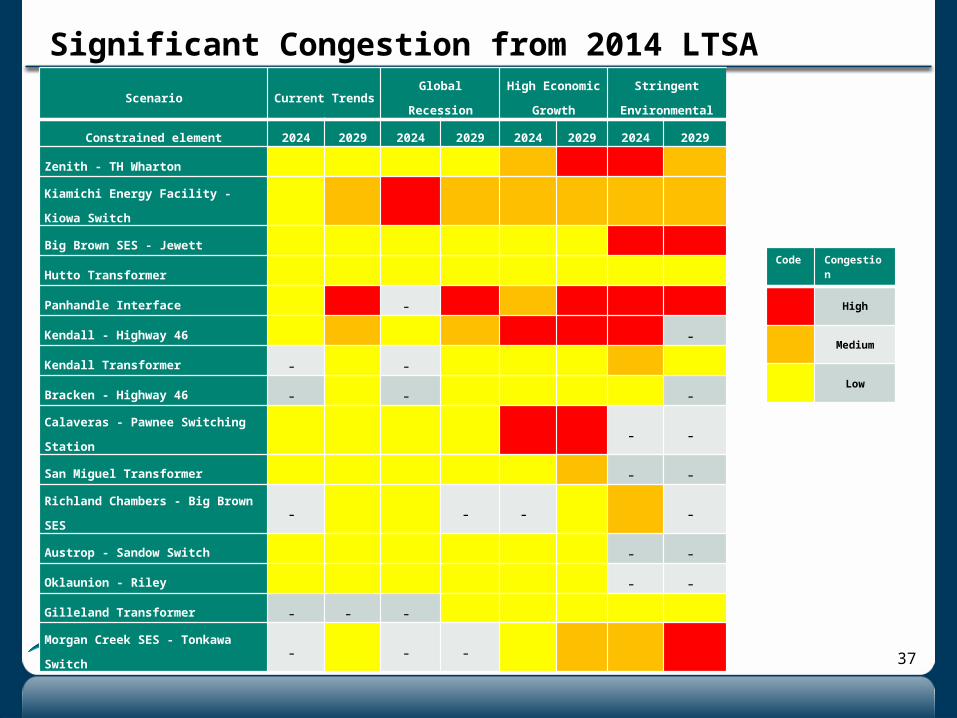
Significant Congestion from 2014 LTSA
Scenario Current Trends Global RecessionHigh Economic
Growth
Stringent
Environmental
Constrained element 2024 2029 2024 2029 2024 2029 2024 2029
Zenith - TH Wharton
Kiamichi Energy Facility - Kiowa
Switch
Big Brown SES - Jewett
Hutto Transformer
Panhandle Interface -
Kendall - Highway 46 -
Kendall Transformer - -
Bracken - Highway 46 - - -
Calaveras - Pawnee Switching Station - -
San Miguel Transformer - -
Richland Chambers - Big Brown SES - - - -
Austrop - Sandow Switch - -
Oklaunion - Riley - -
Gilleland Transformer - - -
Morgan Creek SES - Tonkawa Switch - - -
Code Congestion
High
Medium
Low