Embed Size (px)
Citation preview

ERA OF ECONOMIC REFORMS, POPULATION AGEING AND SUPPORT SYSTEM IN INDIA
Laishram Ladusingh
International Institute for Population Sciences,Mumbai
M.R. Narayana
Institute for Social and Economic Change,Bangalore
Eight Global National Transfer Accounts MeetingDecember 5‐9, 2011
Belo Horizonte, Minas Gerais, Brazil
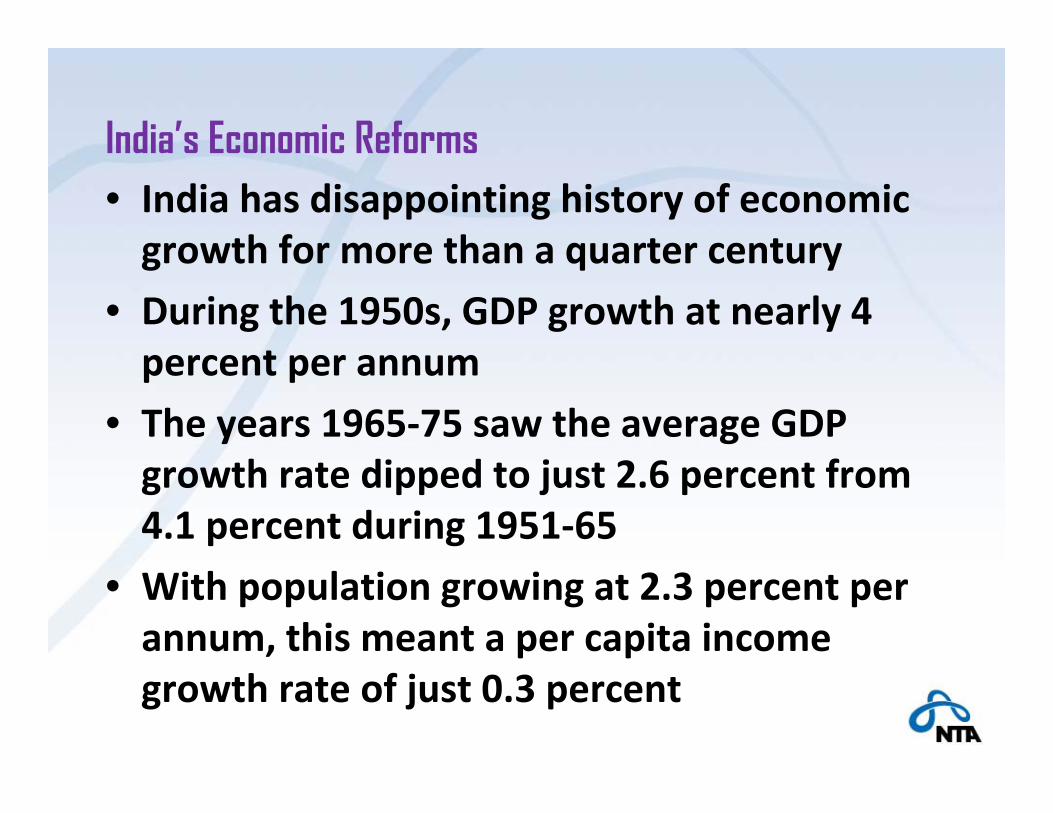
India’s Economic Reforms• India has disappointing history of economic growth for more than a quarter century
• During the 1950s, GDP growth at nearly 4 percent per annum
• The years 1965‐75 saw the average GDP growth rate dipped to just 2.6 percent from 4.1 percent during 1951‐65
• With population growing at 2.3 percent per annum, this meant a per capita income growth rate of just 0.3 percent

India’s Economic Reforms
• In the 1990s the Indian Economy was plagued by severe crisis of balance of payment, deceleration in agricultural growth output and uneven performance in manufacturing
• To ride over the economic crisis of the 1990s, the government undertook major economic reforms in 1991
• Opening to the private sector’s role as a leading engine of growth
India’s Economic Reforms
• Placing greater reliance on market forces and opening the economy to international trade, foreign investment and foreign technology
• As the reforms were implemented during the crisis period, the economy had to resort to IMF financing and a structural adjustment loan from the World Bank
• It was the systematic reforms that helped accelerate the GDP Growth rate to 7.1 percent during 1993‐97 and then sustain it at the 6 percent level over a longer time
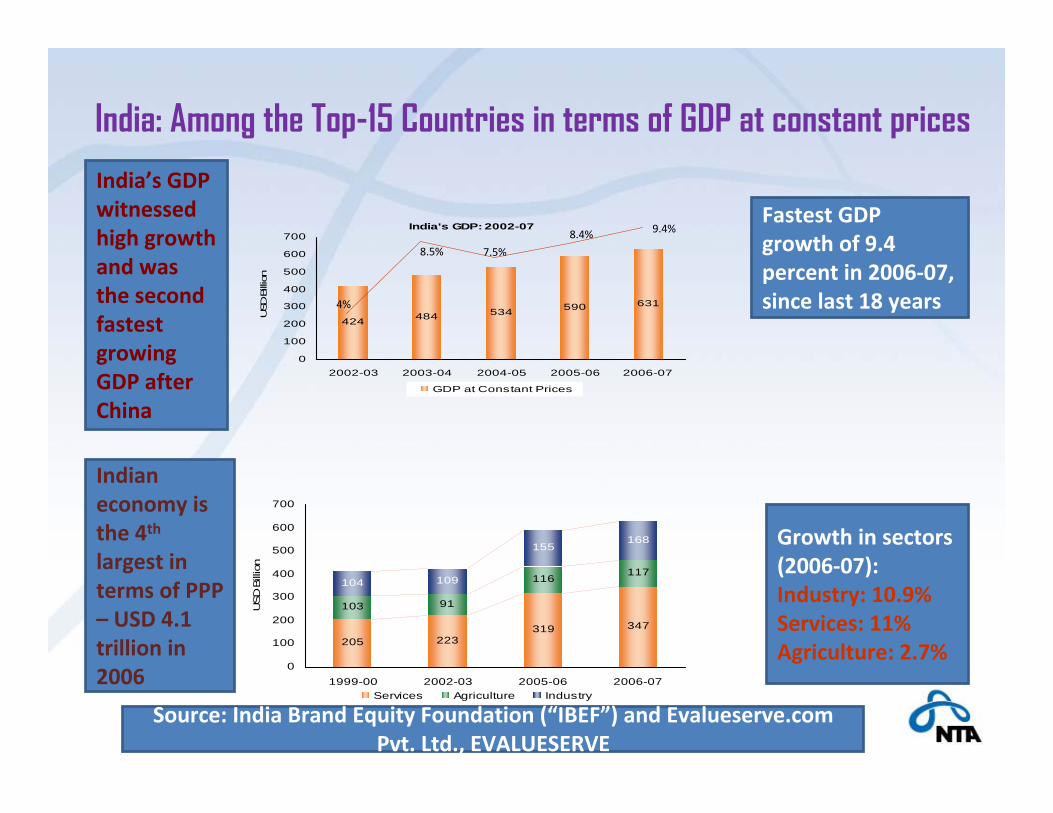
India: Among the Top-15 Countries in terms of GDP at constant prices
India's GDP: 2002-07
424 484 534 590 631
0
100
200
300
400
500
600
700
2002-03 2003-04 2004-05 2005-06 2006-07
USD
Billio
n
GDP at Constant Prices
4%
8.5% 7.5%
8.4% 9.4%
205 223319 347
103 91
116117
104 109
155168
0
100
200
300
400
500
600
700
1999-00 2002-03 2005-06 2006-07
USD
Bill
ion
Services Agriculture Industry
Fastest GDP growth of 9.4 percent in 2006‐07, since last 18 years
Growth in sectors (2006‐07):Industry: 10.9%Services: 11%Agriculture: 2.7%
India’s GDP witnessed high growth and was the second fastest growing GDP after China
Indian economy is the 4th
largest in terms of PPP – USD 4.1 trillion in 2006
Source: India Brand Equity Foundation (“IBEF”) and Evalueserve.com Pvt. Ltd., EVALUESERVE
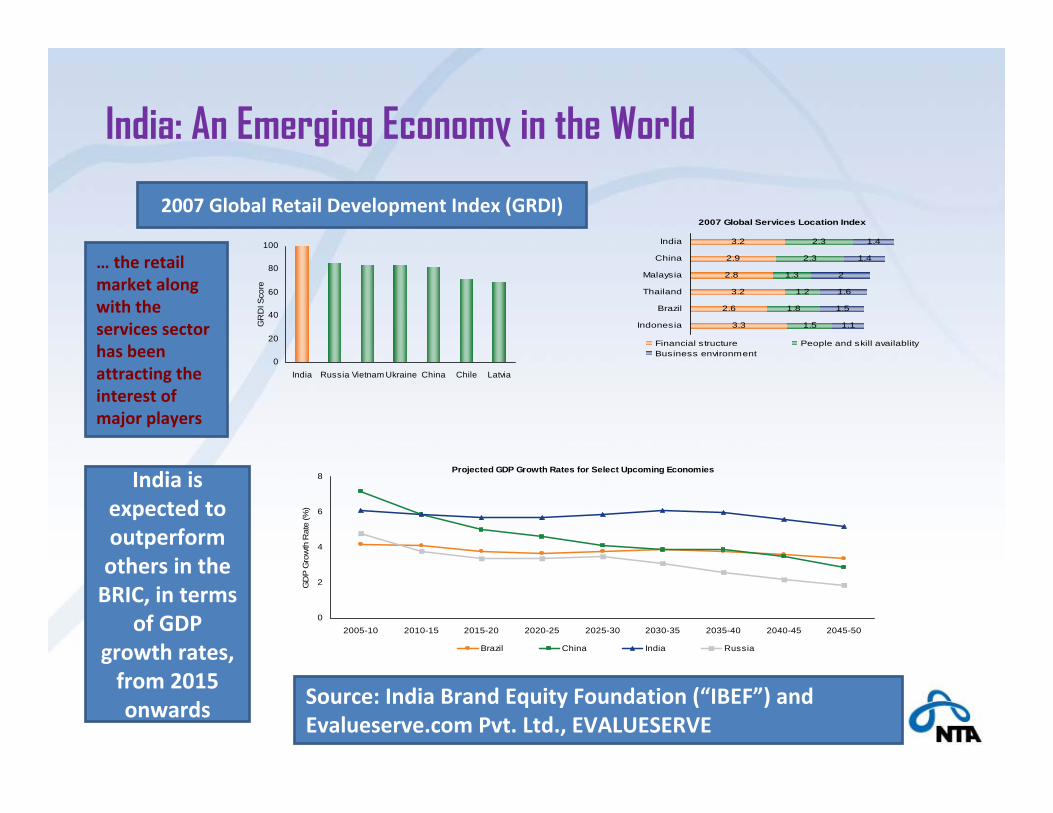
India: An Emerging Economy in the World
Projected GDP Growth Rates for Select Upcoming Economies
0
2
4
6
8
2005-10 2010-15 2015-20 2020-25 2025-30 2030-35 2035-40 2040-45 2045-50
GD
P G
row
th R
ate
(%)
Brazil China India Russia
0
20
40
60
80
100
India Russia Vietnam Ukraine China Chile Latvia
GR
DI S
core
2007 Global Services Location Index
3.3
2.6
3.2
2.8
2.9
3.2
1.5
1.8
1.2
1.3
2.3
2.3
1.1
1.5
1.6
2
1.4
1.4
Indonesia
Brazil
Thailand
Malaysia
China
India
Financial structure People and skill availablityBusiness environment
2007 Global Retail Development Index (GRDI)
India is expected to outperform others in the BRIC, in terms
of GDP growth rates, from 2015 onwards
… the retail market along with the services sector has been attracting the interest of major players
Source: India Brand Equity Foundation (“IBEF”) and Evalueserve.com Pvt. Ltd., EVALUESERVE
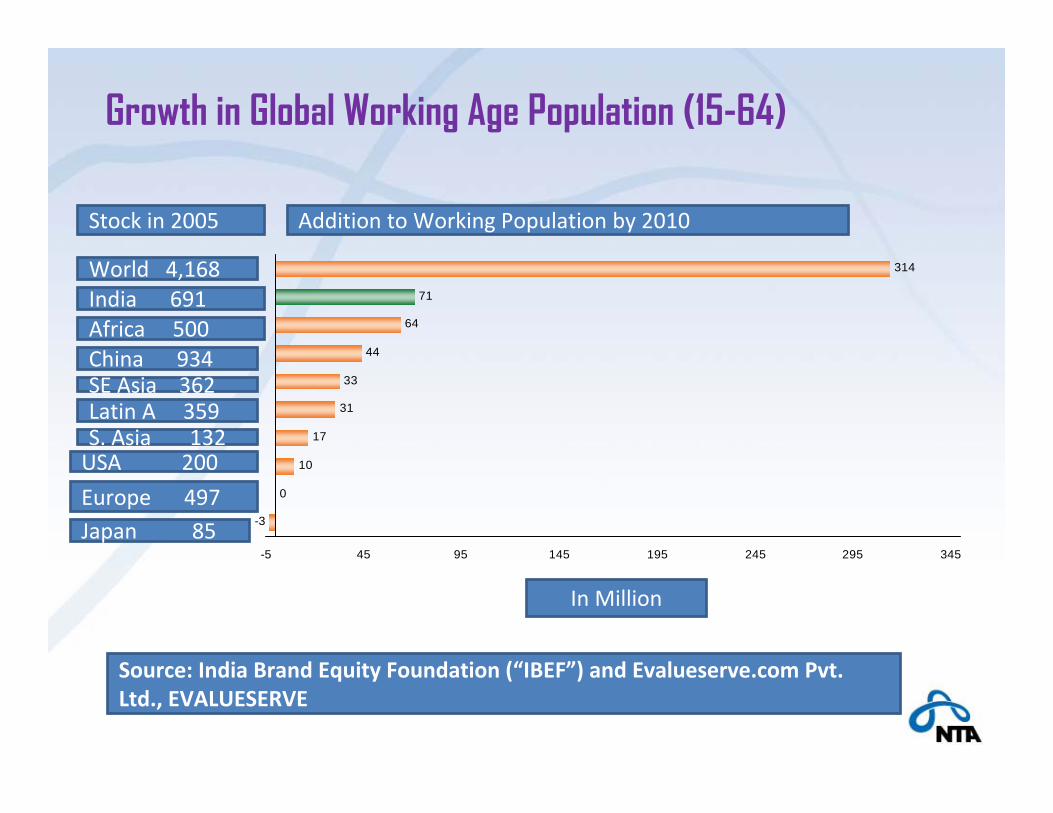
Growth in Global Working Age Population (15-64)
-3
0
10
17
31
33
44
64
71
314
-5 45 95 145 195 245 295 345
World 4,168India 691Africa 500China 934
Stock in 2005 Addition to Working Population by 2010
In Million
SE Asia 362Latin A 359S. Asia 132USA 200
Europe 497Japan 85
Source: India Brand Equity Foundation (“IBEF”) and Evalueserve.com Pvt. Ltd., EVALUESERVE
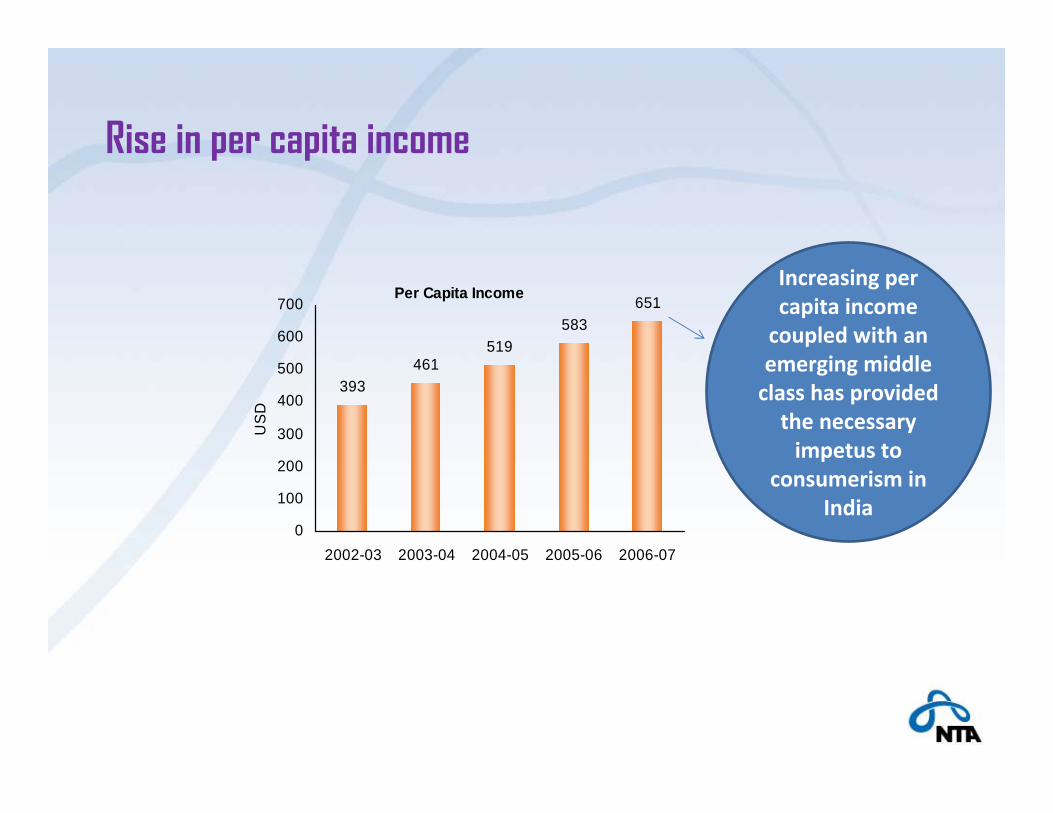
Rise in per capita income
Per Capita Income
393461
519583
651
0
100
200
300
400
500
600
700
2002-03 2003-04 2004-05 2005-06 2006-07
US
DIncreasing per capita income coupled with an emerging middle class has provided the necessary impetus to
consumerism in India
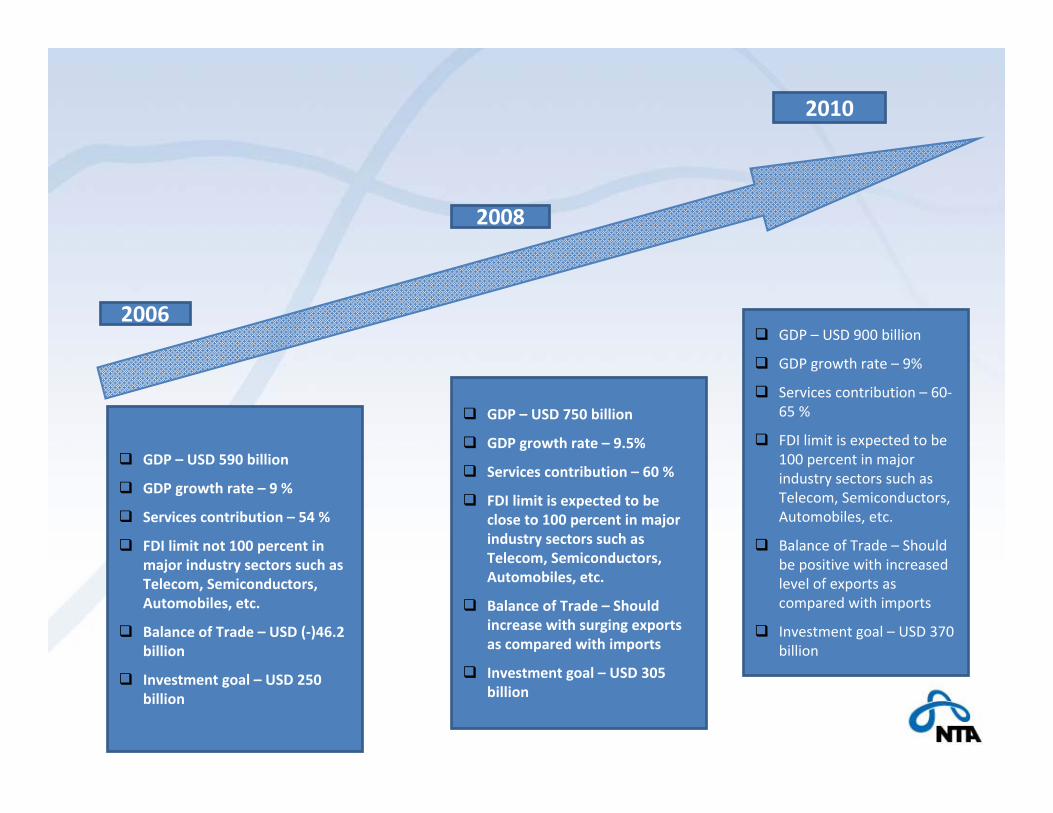
GDP – USD 590 billion
GDP growth rate – 9 %
Services contribution – 54 %
FDI limit not 100 percent in major industry sectors such as Telecom, Semiconductors, Automobiles, etc.
Balance of Trade – USD (‐)46.2 billion
Investment goal – USD 250 billion
GDP – USD 750 billion
GDP growth rate – 9.5%
Services contribution – 60 %
FDI limit is expected to be close to 100 percent in major industry sectors such as Telecom, Semiconductors, Automobiles, etc.
Balance of Trade – Should increase with surging exports as compared with imports
Investment goal – USD 305 billion
GDP – USD 900 billion
GDP growth rate – 9%
Services contribution – 60‐65 %
FDI limit is expected to be 100 percent in major industry sectors such as Telecom, Semiconductors, Automobiles, etc.
Balance of Trade – Should be positive with increased level of exports as compared with imports
Investment goal – USD 370 billion
2006
2008
2010
India at the crossroad
• One road leads India to economic prosperity and glory
• The other road leads it to inequality • The real benefits of the economic reforms have rarely percolated to the lowest strata of society
• The widening gap is a matter of concerned as it can jeopardize political system and sustainability of economic reforms
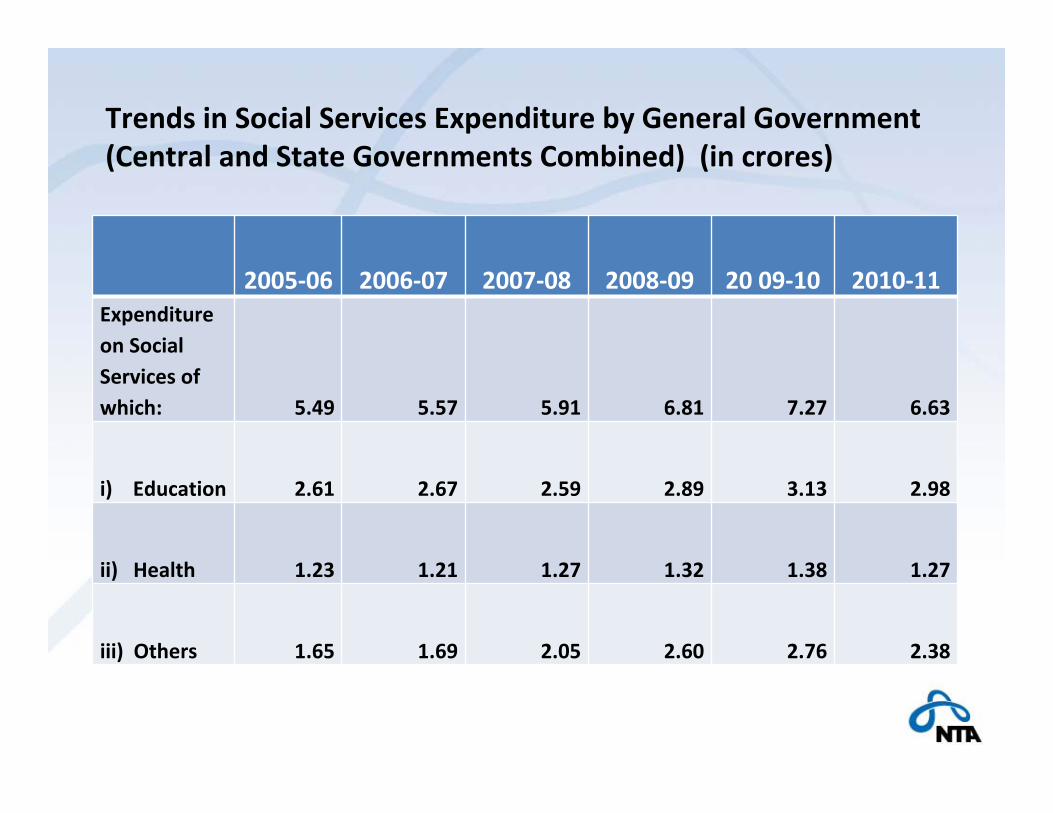
Trends in Social Services Expenditure by General Government (Central and State Governments Combined) (in crores)
2005‐06 2006‐07 2007‐08 2008‐09 20 09‐10 2010‐11Expenditure on Social Services of which: 5.49 5.57 5.91 6.81 7.27 6.63
i) Education 2.61 2.67 2.59 2.89 3.13 2.98
ii) Health 1.23 1.21 1.27 1.32 1.38 1.27
iii) Others 1.65 1.69 2.05 2.60 2.76 2.38
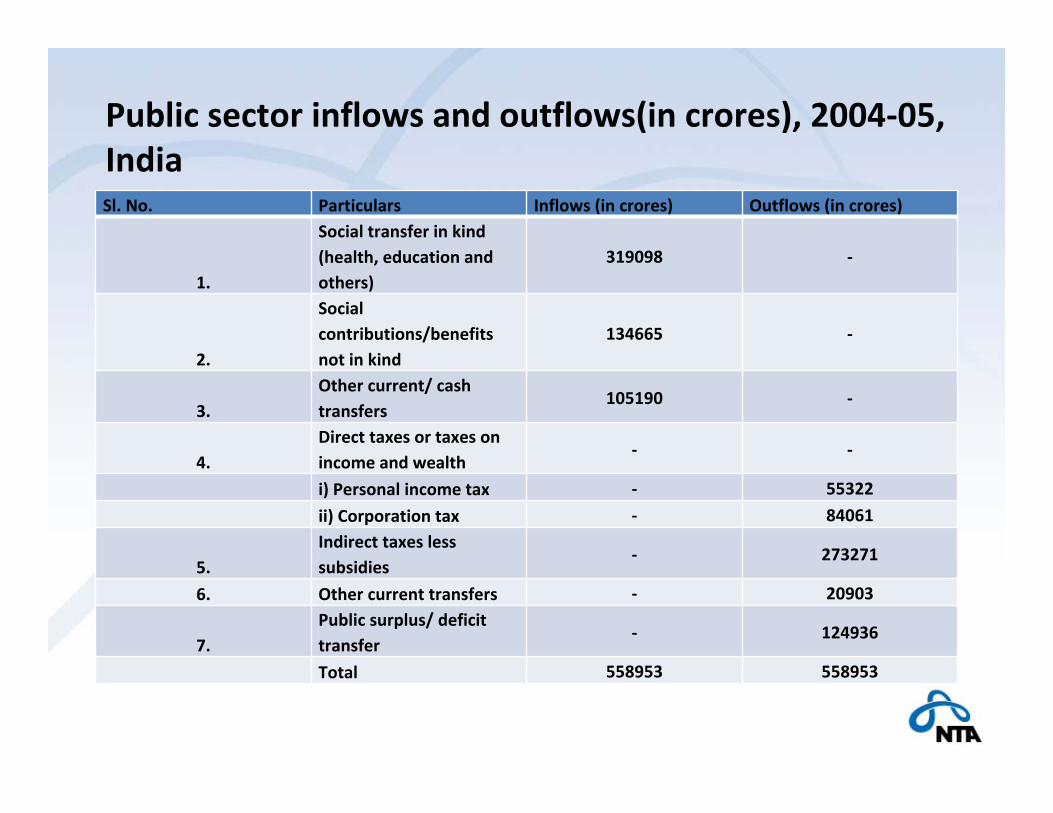
Public sector inflows and outflows(in crores), 2004‐05, IndiaSl. No. Particulars Inflows (in crores) Outflows (in crores)
1.
Social transfer in kind (health, education and others)
319098 ‐
2.
Social contributions/benefits not in kind
134665 ‐
3.Other current/ cash transfers
105190 ‐
4.Direct taxes or taxes on income and wealth
‐ ‐
i) Personal income tax ‐ 55322
ii) Corporation tax ‐ 84061
5.Indirect taxes less subsidies
‐ 273271
6. Other current transfers ‐ 20903
7.Public surplus/ deficit transfer
‐ 124936
Total 558953 558953
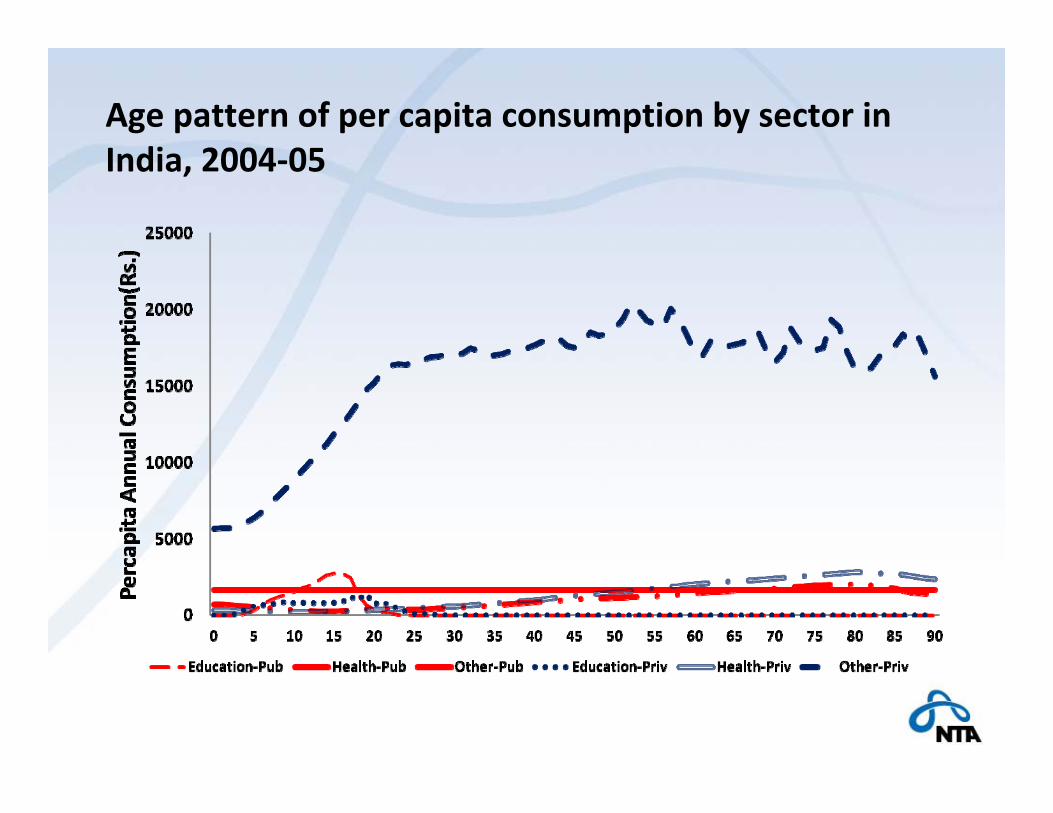
Age pattern of per capita consumption by sector in India, 2004‐05
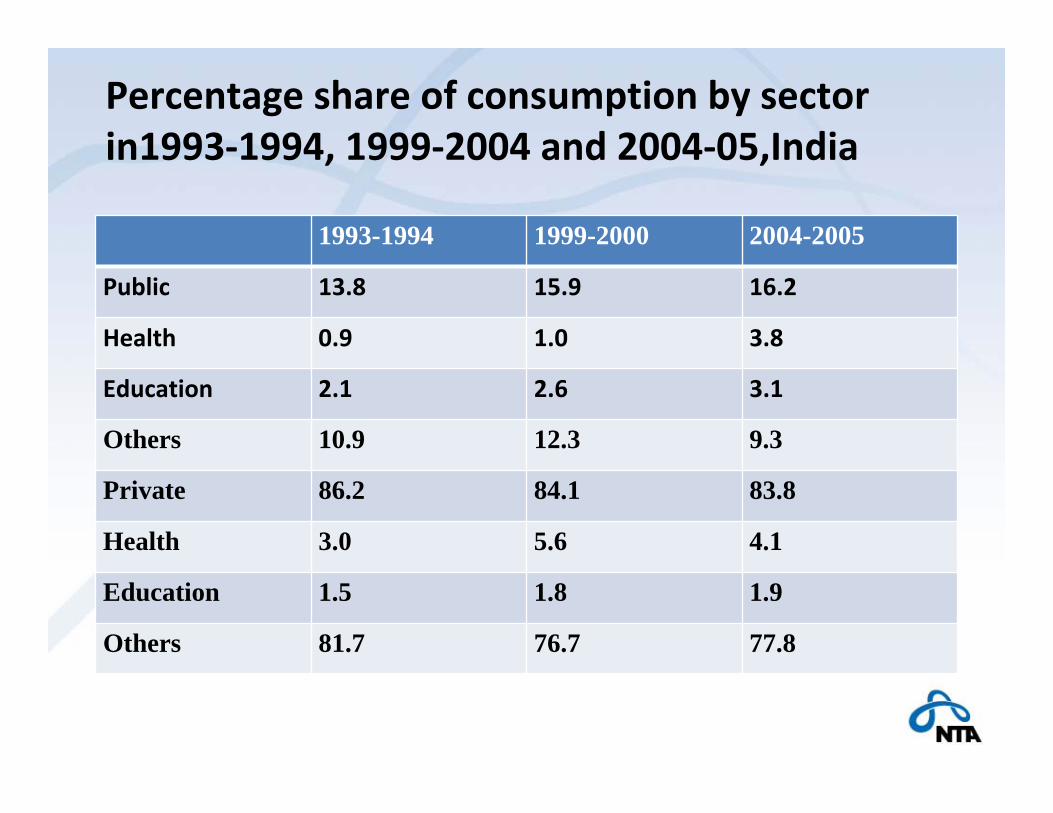
Percentage share of consumption by sector in1993‐1994, 1999‐2004 and 2004‐05,India
1993-1994 1999-2000 2004-2005
Public 13.8 15.9 16.2
Health 0.9 1.0 3.8
Education 2.1 2.6 3.1
Others 10.9 12.3 9.3
Private 86.2 84.1 83.8
Health 3.0 5.6 4.1
Education 1.5 1.8 1.9
Others 81.7 76.7 77.8

Normalized age patterns of lifecycle deficit in 1993‐94, 1999‐2000 & 2004‐05
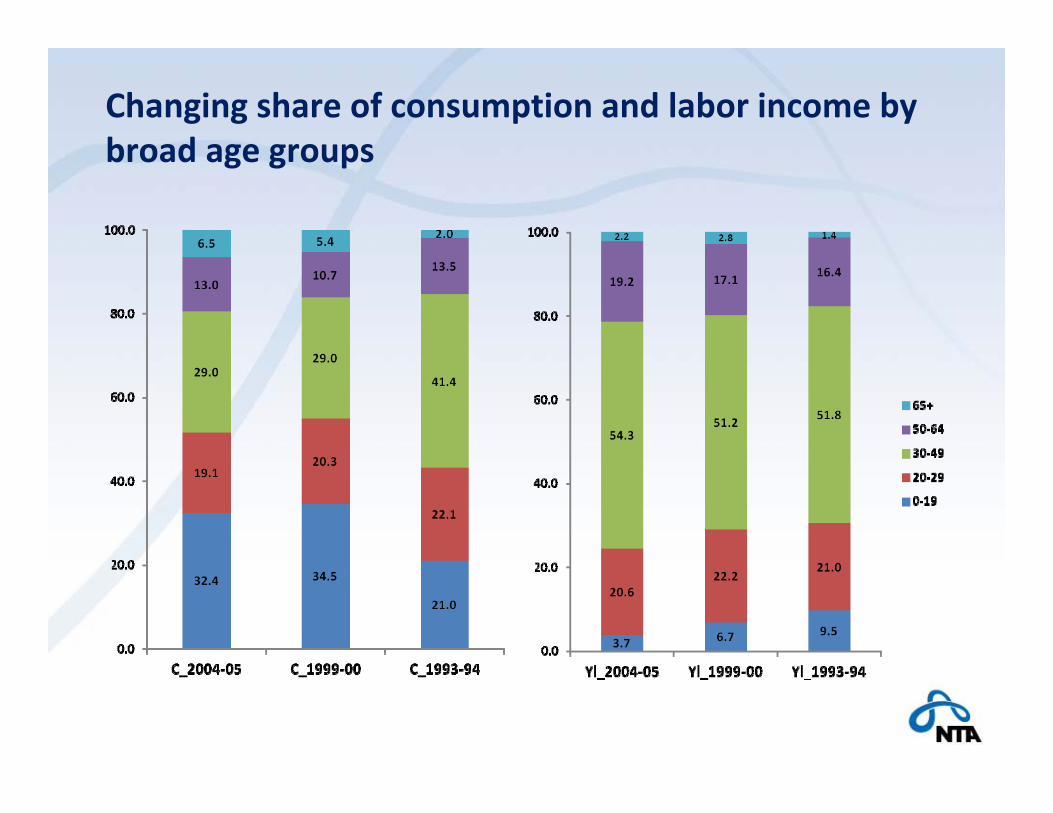
Changing share of consumption and labor income by broad age groups

Changing share of old age and young dependent consumptions
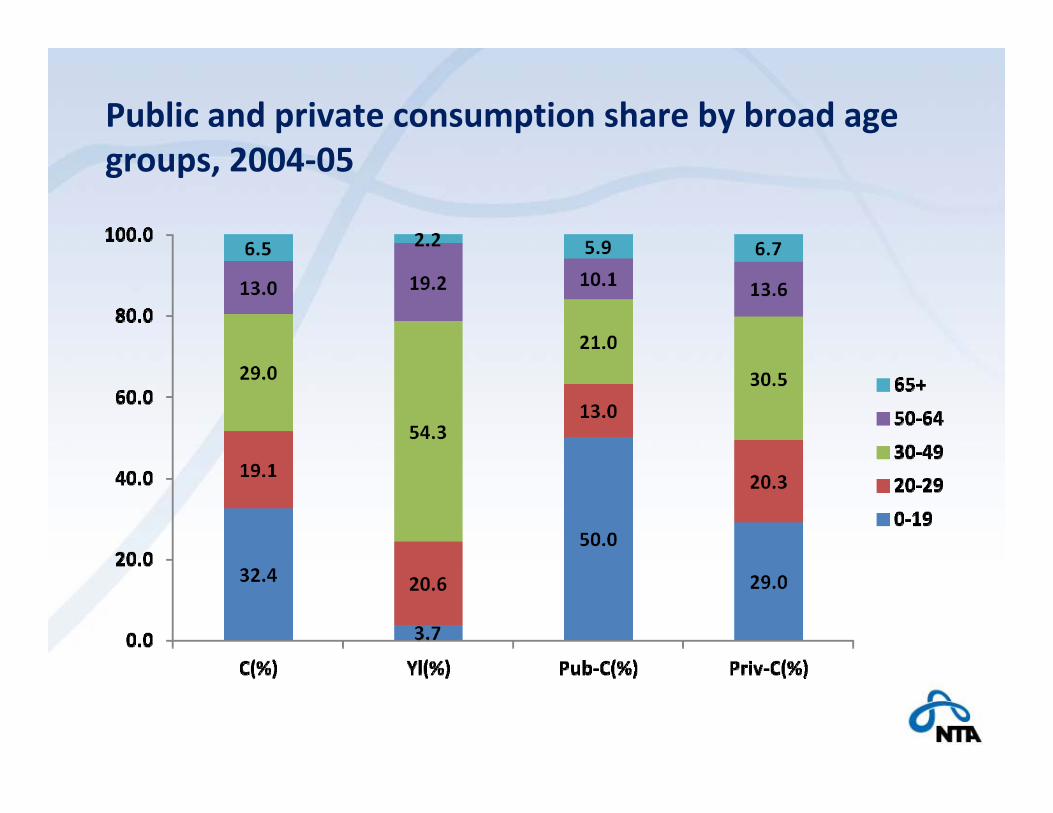
Public and private consumption share by broad age groups, 2004‐05
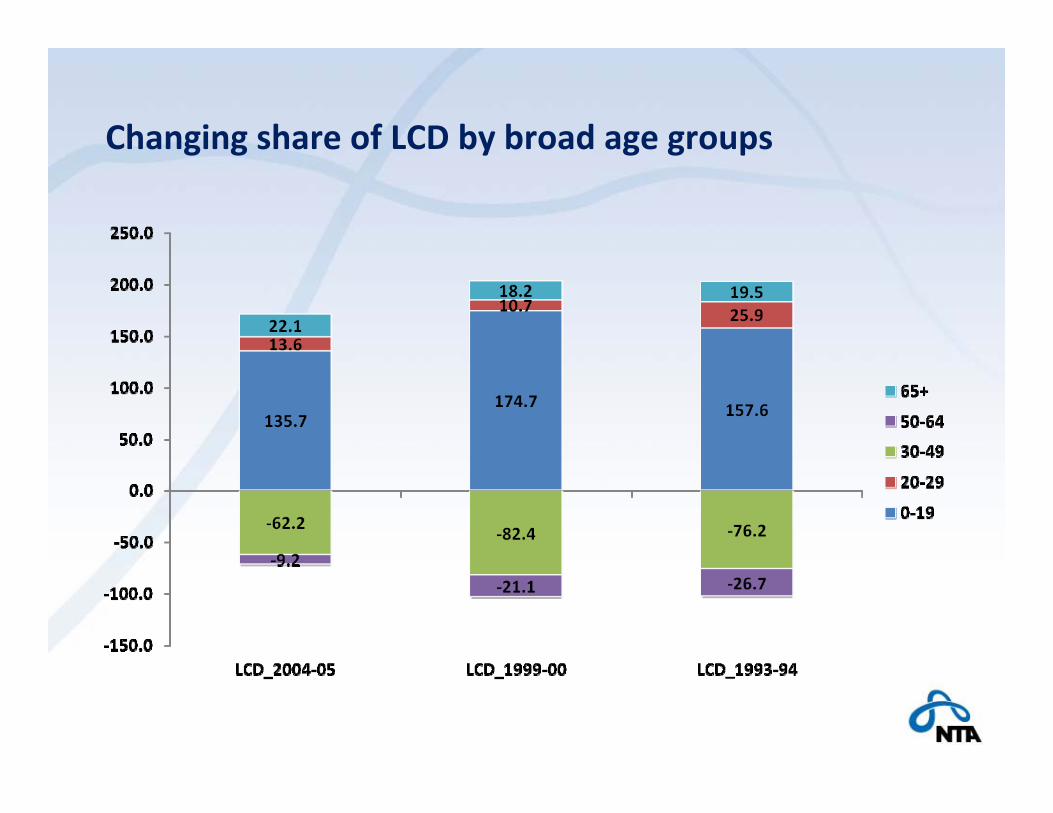
Changing share of LCD by broad age groups
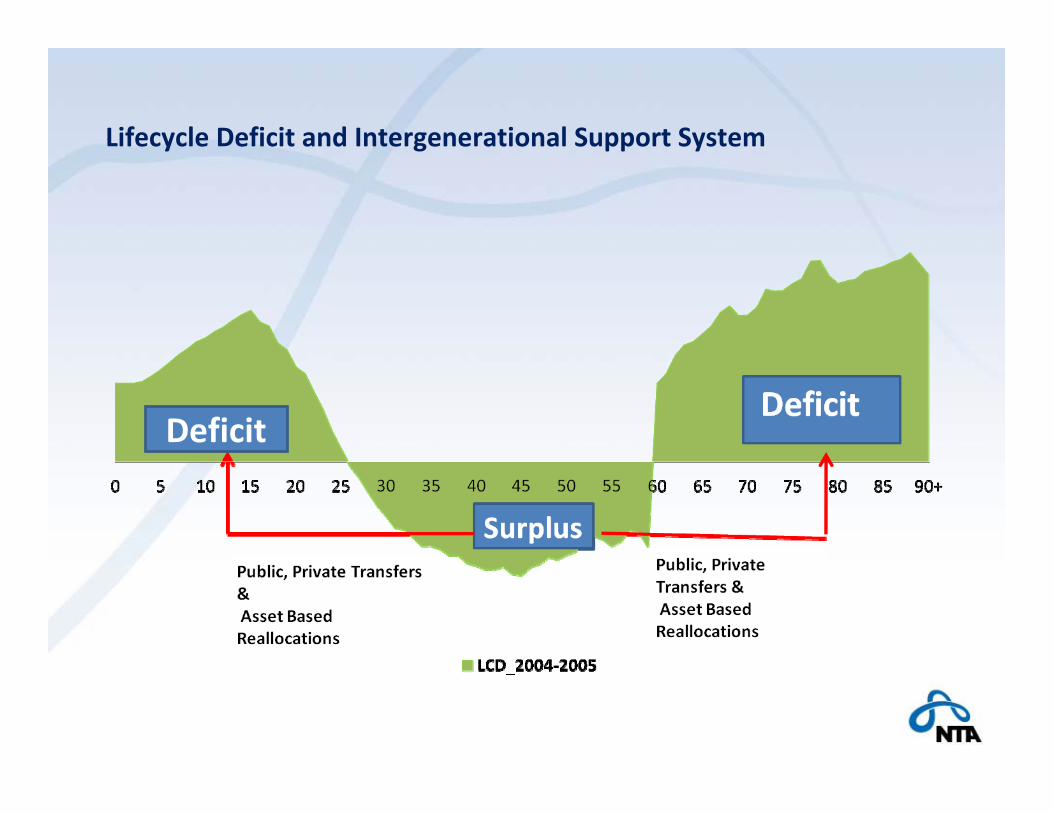
Lifecycle Deficit and Intergenerational Support System
Deficit
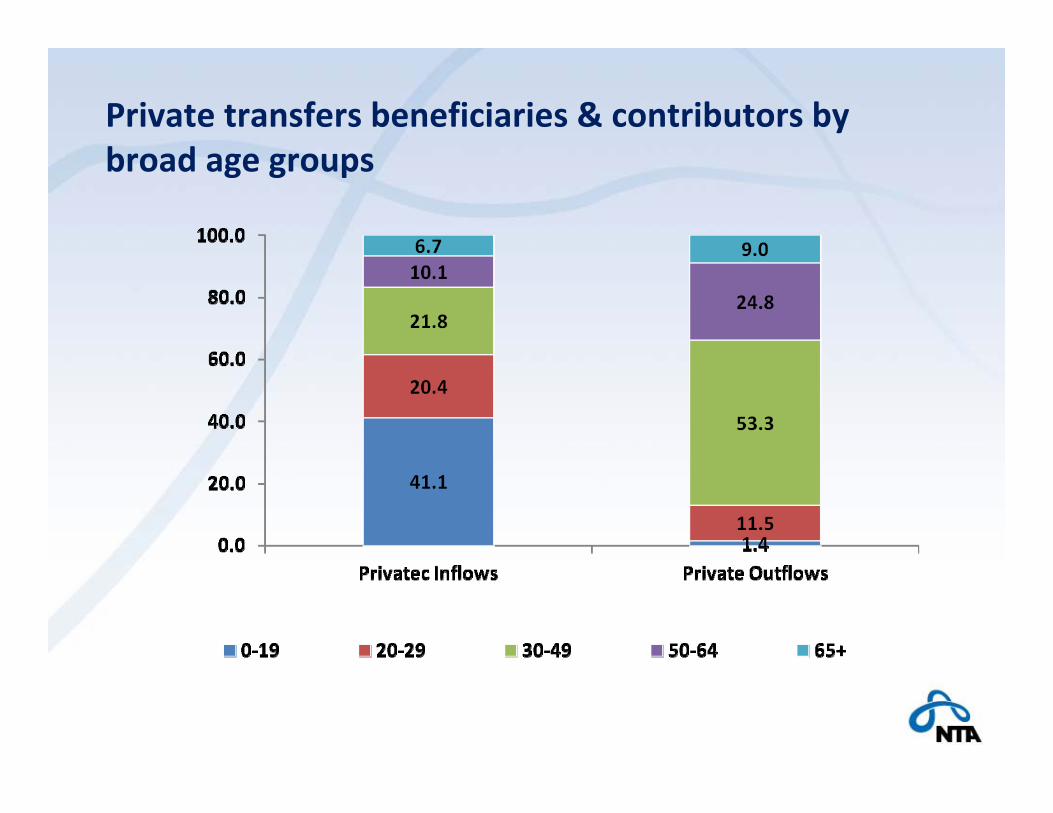
Private transfers beneficiaries & contributors by broad age groups

Private transfers beneficiaries & contributors by broad age groups

Components of public, private transfers and asset based reallocations supporting lifecycle deficit by broad age groups
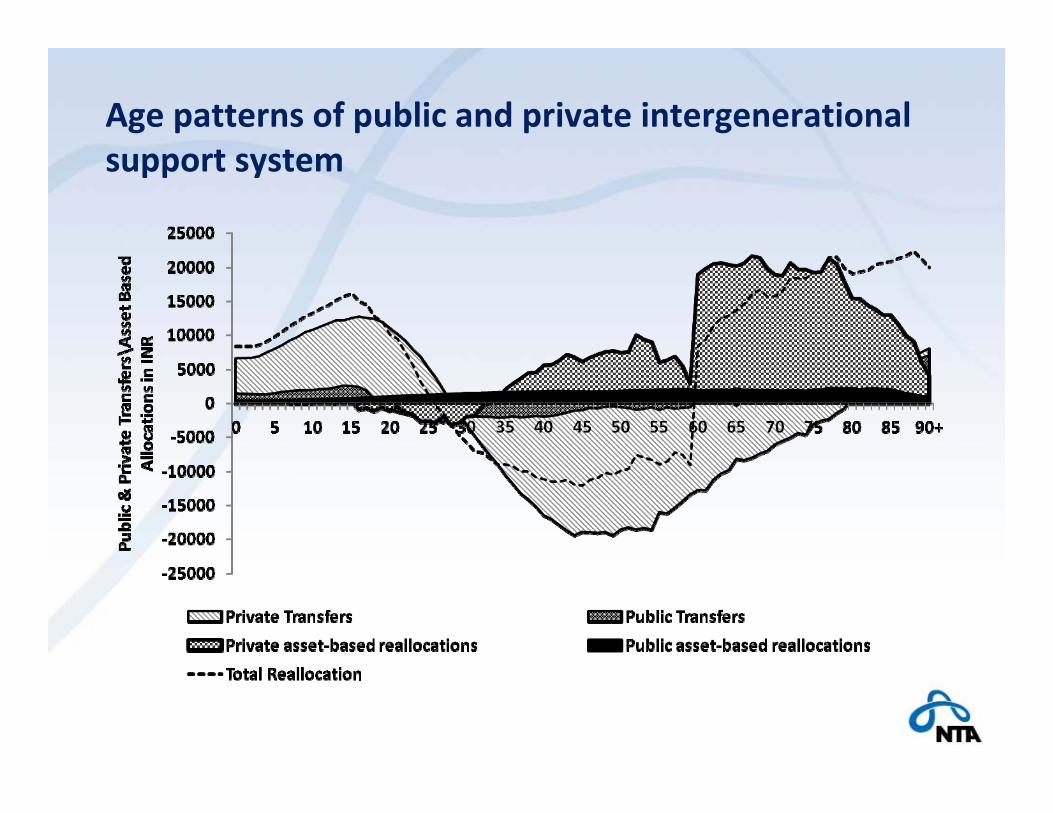
Age patterns of public and private intergenerational support system
Summary
• Public in kind transfers constitutes 16 % of total consumption in the accounting year 2004‐05 and 50% of this goes to under 20 population and 6% to population 65+ years
• The corresponding share of private consumption of these two age groups are 6.7% and 29% respectively
• Elderly 65+ are not benefited from intra‐household transfers as they themselves contributes especially for education of grandchildren more than what benefit from familial transfers

Summary
• Elderly 65+ contrary to the common belief that are supported by family members, are self supported by own asset based‐reallocation
• Public funding support too less for the LCD of elderly
ACKNOWLEDGEMENT
We appreciate and thank Professor Andrew Mason for the support to attend NTA meeting
Our thanks to Dr.Sang‐Hyop for helping us to complete computation
Financial grant from International Development Research Centre, Canada for this research is highly appreciated in particular acknowledge the initiative and support of Dr. Edgard Rodriguez
We thank Professor Ando of NUPRI,Tokyo
We acknowledge and thank Professor Cassio and his team for all the facilitation to be in this beautiful place
Our thanks are also due to Ms.June at EWC,Honolulu