Embed Size (px)
Citation preview
(ER-201030)
Validation of a Novel Bioassay for Low-level Perchlorate Determination
May 2013 This document has been cleared for public release; Distribution Statement A
Report Documentation Page Form ApprovedOMB No. 0704-0188
Public reporting burden for the collection of information is estimated to average 1 hour per response, including the time for reviewing instructions, searching existing data sources, gathering andmaintaining the data needed, and completing and reviewing the collection of information. Send comments regarding this burden estimate or any other aspect of this collection of information,including suggestions for reducing this burden, to Washington Headquarters Services, Directorate for Information Operations and Reports, 1215 Jefferson Davis Highway, Suite 1204, ArlingtonVA 22202-4302. Respondents should be aware that notwithstanding any other provision of law, no person shall be subject to a penalty for failing to comply with a collection of information if itdoes not display a currently valid OMB control number.
1. REPORT DATE MAY 2013 2. REPORT TYPE
3. DATES COVERED 00-00-2013 to 00-00-2013
4. TITLE AND SUBTITLE Validation of a Novel Bioassay for Low-level Perchlorate Determination
5a. CONTRACT NUMBER
5b. GRANT NUMBER
5c. PROGRAM ELEMENT NUMBER
6. AUTHOR(S) 5d. PROJECT NUMBER
5e. TASK NUMBER
5f. WORK UNIT NUMBER
7. PERFORMING ORGANIZATION NAME(S) AND ADDRESS(ES) Environmental Security Technology Certification Program(ESTCP),4800 Mark Center Drive, Suite 17D08,Alexandria,VA,22350-3605
8. PERFORMING ORGANIZATIONREPORT NUMBER
9. SPONSORING/MONITORING AGENCY NAME(S) AND ADDRESS(ES) 10. SPONSOR/MONITOR’S ACRONYM(S)
11. SPONSOR/MONITOR’S REPORT NUMBER(S)
12. DISTRIBUTION/AVAILABILITY STATEMENT Approved for public release; distribution unlimited
13. SUPPLEMENTARY NOTES
14. ABSTRACT
15. SUBJECT TERMS
16. SECURITY CLASSIFICATION OF: 17. LIMITATION OF ABSTRACT Same as
Report (SAR)
18. NUMBEROF PAGES
51
19a. NAME OFRESPONSIBLE PERSON
a. REPORT unclassified
b. ABSTRACT unclassified
c. THIS PAGE unclassified
Standard Form 298 (Rev. 8-98) Prescribed by ANSI Std Z39-18
i
COST & PERFORMANCE REPORT Project: ER-201030
TABLE OF CONTENTS
Page
EXECUTIVE SUMMARY ...................................................................................................... ES-1
1.0 INTRODUCTION .............................................................................................................. 1 1.1 BACKGROUND .................................................................................................... 1 1.2 OBJECTIVE OF THE DEMONSTRATION ......................................................... 2 1.3 REGULATORY DRIVERS ................................................................................... 2
2.0 TECHNOLOGY ................................................................................................................. 5 2.1 TECHNOLOGY DESCRIPTION .......................................................................... 5 2.2 ADVANTAGES AND LIMITATIONS OF THE TECHNOLOGY.................... 10
3.0 PERFORMANCE OBJECTIVES .................................................................................... 11
4.0 SITE DESCRIPTION ....................................................................................................... 15 4.1 SITE SELECTION ............................................................................................... 15 4.2 SITE LOCATION AND HISTORY ..................................................................... 15 4.3 SITE GEOLOGY/HYDROGEOLOGY ............................................................... 16 4.4 CONTAMINANT DISTRIBUTION .................................................................... 16
5.0 TEST DESIGN ................................................................................................................. 17 5.1 CONCEPTUAL EXPERIMENTAL DESIGN ..................................................... 17 5.2 BASELINE CHARACTERIZATION .................................................................. 17 5.3 TREATABILITY OR LABORATORY STUDY RESULTS .............................. 17 5.4 FIELD TESTING.................................................................................................. 17 5.5 SAMPLING AND ANALYTICAL METHODS ................................................. 17 5.6 SAMPLE TESTING RESULTS ........................................................................... 19 5.7 TESTING FOR FACTORS THAT MAY IMPACT BIOASSAY
PERFORMANCE ................................................................................................. 23
6.0 PERFORMANCE ASSESSMENT .................................................................................. 29 6.1 QUANTITATIVE PERFORMANCE OBJECTIVE 1: COMPARE
BENCHTOP BIOASSAY RESULTS TO REFERENCE ANALYTICAL METHOD RESULTS ........................................................................................... 29
6.2 QUANTITATIVE PERFORMANCE OBJECTIVE 2: COMPARE BENCHTOP BIOASSAY FIELD KIT RESULTS TO SITE’S REFERENCE METHOD RESULTS ................................................................... 29
6.3 QUALITATIVE PERFORMANCE OBJECTIVE: FIELD KIT EASE OF USE ASSESSMENT ............................................................................................ 29
7.0 COST ASSESSMENT ...................................................................................................... 31
8.0 IMPLEMENTATION ISSUES ........................................................................................ 33
9.0 REFERENCES ................................................................................................................. 35 APPENDIX A POINTS OF CONTACT......................................................................... A-1
ii
LIST OF FIGURES
Page Figure 1. Schematic diagram of groundwater testing by benchtop bioassay and
reference analytical methods................................................................................... 6 Figure 2. Non-enzymatic reduction of O2 by NADH and PMS. ............................................ 6 Figure 3. Perchlorate reductase coupled to NADH oxidation. ............................................... 7 Figure 4. Perchlorate reductase activity in reactions with different starting
concentrations of perchlorate. ................................................................................. 7 Figure 5. Determination of perchlorate in a groundwater sample by the standard
additions method. .................................................................................................... 8 Figure 6. Representative SAM regression lines from benchtop bioassay testing of the
six groundwater sources analyzed in the project. ................................................. 21 Figure 7. Perchlorate anaerobic PR bioassay results for batch 4. ........................................ 25 Figure 8. MDS plot based on ICPMS data for groundwater and SPE eluates with
superimposed circles representing the concentration of uranium (µg/L). ............ 28
iii
LIST OF TABLES
Page Table 1. Performance objectives, data requirements, success criteria, and results. ............ 11 Table 2. Site selection criteria. ............................................................................................ 15 Table 3. Sites of groundwater sources. ............................................................................... 15 Table 4. Total number of groundwater samples collected for benchtop bioassay,
perchlorate reference methods, and characterization testing. ............................... 18 Table 5. Analytical methods for sample analysis. .............................................................. 18 Table 6. Conductivity, pH, and historical perchlorate of groundwater sources.................. 19 Table 7. Perchlorate concentration estimated by different methods and accuracy
evaluated using PD comparisons. ......................................................................... 20 Table 8. ANOVA for reference method performed by a commercial laboratory, IC at
UCB, and the benchtop bioassay, and grouping using the Tukey Method. .......... 23 Table 9. Perchlorate concentration estimated by plate reader (PR) bioassay and
accuracy evaluated using the PD compared to the reference analytical method................................................................................................................... 25
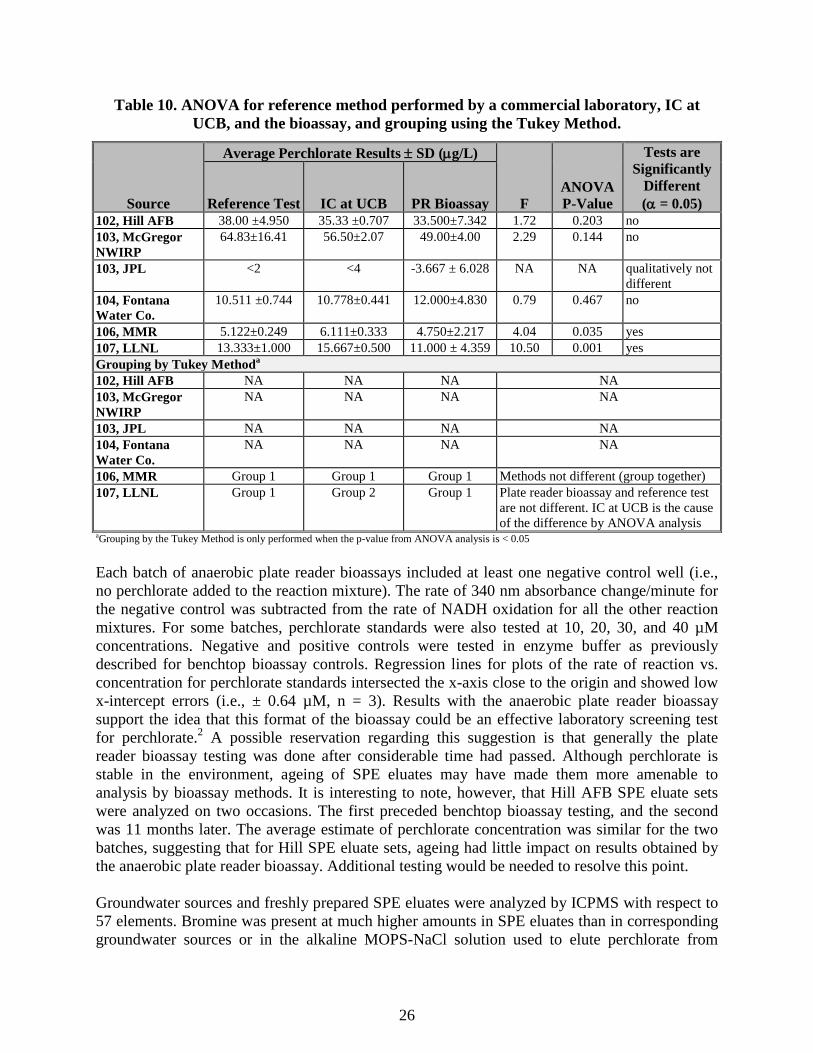
Table 10. ANOVA for reference method performed by a commercial laboratory, IC at UCB, and the PR bioassay, and grouping using the Tukey Method..................... 26
iv
ACRONYMS AND ABBREVIATIONS AFB Air Force Base ANOVA analysis of variance Chlorate ClO3
- Cld chlorite dismutase DPRB dissimilatory perchlorate-reducing bacteria DTAB decyltrimethyl ammonium bromide IC ion chromatography ICPMS inductively coupled plasma mass spectrometry JPL Jet Propulsion Laboratory LC liquid chromatography LC/MS liquid chromatography/mass spectrometry LLNL Lawrence Livermore National Laboratory µg/kg/d micrograms per kilogram per day µg/L micrograms per liter µM micromoles MDS multidimensional scaling MMR Massachusetts Military Reservation MOPS morpholinepropane sulfonic acid MRL method reporting level NAD+ oxidized nicotinamide adenine dinucleotide NADH reduced nicotinamide adenine dinucleotide NAS National Academy of Sciences nm nanometer NWIRP Naval Weapons Industrial Reserve Plant Pcr, PCR perchlorate reductase PD percent difference PI principal investigator PMS phenazine methosulfate PMSH reduced phenazine methosulfate ppb parts per billion PR plate reader QA quality assurance QC quality control
ACRONYMS AND ABBREVIATIONS (continued)
v
SAM standard additions method SD standard deviation SDVB styrene divinylbenzene SERDP Strategic Environmental Research and Development Program SPE solid phase extraction UCB University of California, Berkeley USEPA U.S. Environmental Protection Agency UV ultraviolet
Technical material contained in this report has been approved for public release. Mention of trade names or commercial products in this report is for informational purposes only;
no endorsement or recommendation is implied.
vi
ACKNOWLEDGEMENTS The following sites provided invaluable help by providing samples for the conduct of this work: Hill Air Force Base, Naval Weapons Industrial Reserve Plant McGregor, Jet Propulsion Laboratory, Fontana Water Company, Massachusetts Military Reservation, and Lawrence Livermore National Laboratory. Their participation is greatly appreciated.

This page left blank intentionally.
ES-1
EXECUTIVE SUMMARY
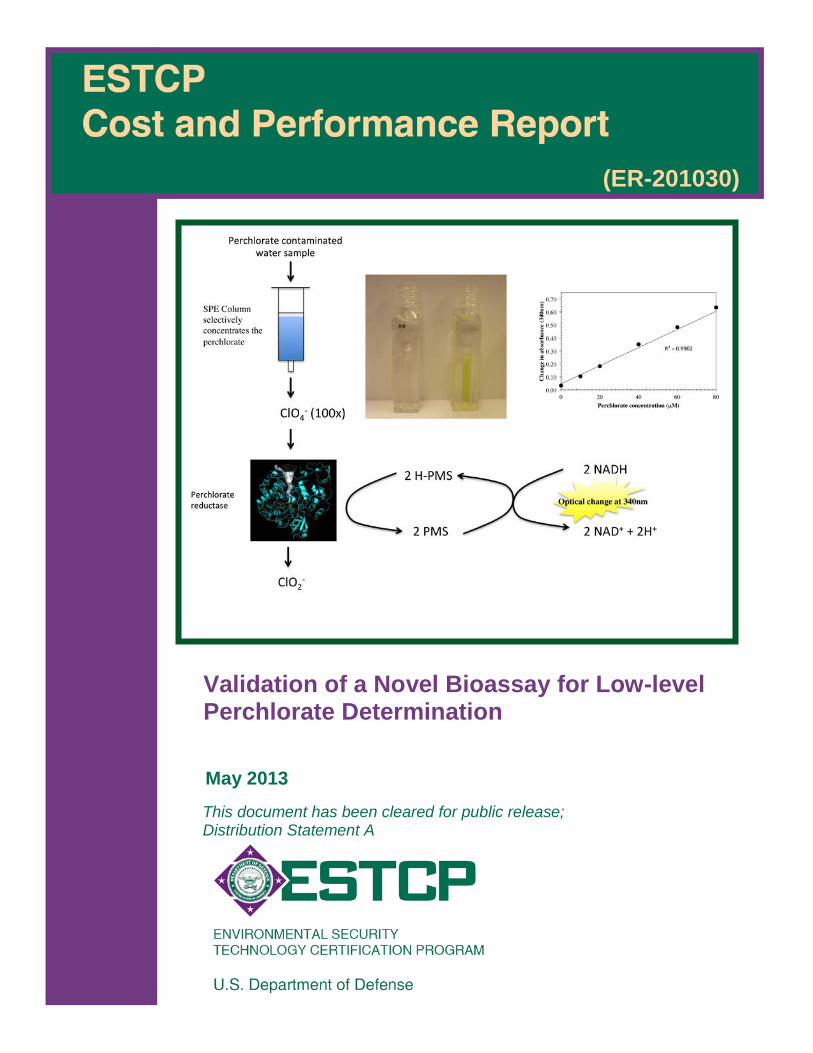
The bioassay for low-level perchlorate (Perchlorate)determination (range approximately 6 to 40 micrograms per liter [µg/L]), which was the focus of the project, is a benchtop enzyme assay combined with a perchlorate concentration and purification step using solid phase extraction (SPE) cartridges (Heinnickel et al., 2011). It is based on perchlorate reductase activity and couples reduced nicotinamide adenine dinucleotide (NADH) oxidation to perchlorate reduction, with phenazine methosulfate (PMS) as an electron shuttle. Hence the amount of perchlorate in an aqueous sample can be determined enzymatically by monitoring the amount of NADH oxidized spectrophotometrically (i.e., by measuring the decrease in absorbance at 340 nanometer [nm]). The instrumentation for the bioassay is a ultraviolet (UV) spectrophotometer. The equipment and materials are relatively inexpensive and the bioassay potentially may be performed by less highly trained personnel than required by ion chromatography (IC) or liquid chromatography/mass spectrometry (LC/MS) analytical methods. Thus it was thought likely that the benchtop bioassay might supplement more expensive and time consuming analytical procedures as a screening test for perchlorate in groundwater to facilitate tasks such as mapping plumes and monitoring perchlorate levels during remediation. The three performance objectives of the project were: (1) Compare benchtop bioassay results from testing in the principal investigator’s (PI) laboratory to results from a reference analytical method performed by a commercial laboratory; (2) Compare results with a benchtop bioassay kit format tested by site field personnel to the site’s routine perchlorate detection method; and (3) Evaluate the ease of use of the benchtop bioassay kit format. Six groundwater sources were obtained for the project. Success criteria were met for one of groundwater sources, but were not met for four other groundwater sources. Quantitative success criteria could not be applied to the sixth source since the amount of perchlorate by the reference method was less than the method reporting level (MRL). Results for this source were considered to have qualitatively met success criteria. The benchtop bioassay was deemed not suitable in its current format as a screening test for perchlorate in groundwater. In depth analysis indicated that oxygen contamination of the benchtop assay, even in the face of several oxygen barriers and an active chemical reductant, was the culprit for the unpredictability and poor performance of the bioassay comparison under objective 1. Retesting of the water samples with the bioassay in an anaerobic chamber with a nitrogen/hydrogen atmosphere confirmed this finding and provided a different outcome. In this instance the bioassay accuracy met all performance criteria for groundwater eluates amenable to quantitative testing. However, this requirement defeats the original purpose of the bioassay as a robust field applicable tool. Since performance of the bioassay was not high enough to warrant proceeding with development of a kit format for the benchtop bioassay, no testing was done relative to performance objectives 2 and 3. OBJECTIVES OF THE DEMONSTRATION Perchlorate is principally a synthetic compound with a broad assortment of industrial applications ranging from pyrotechnics to lubricating oils, and is used as an energetic booster or oxidant in solid rocket fuels. Its presence in the environment poses a potential health threat and primarily results from legal historical discharge of unregulated manufacturing waste streams,
ES-2
disposal pond leaching, and the periodic servicing of military inventories. Perchlorate does not sorb to any significant extent to soils or sediments and, in the absence of any biological interactions, its mobility and fate are largely influenced by the hydrology of the environment. Perchlorate is known to affect mammalian thyroid hormone production and its primary toxicity results from its structural similarity to iodate, which plays an important regulatory role in hormone production by the thyroid gland. Perchlorate readily enters into the food web and can persist during processing into final consumer products such as cigarettes and chewing tobacco. The successful implementation of any remediative strategy is dependent on the accurate identification of the boundaries of the perchlorate plume. Analytical methods currently available include IC with conductivity detection, and liquid chromatography or IC coupled with electrospray ionization (ESI) mass spectrometry, which forms the basis of the U.S. Environmental Protection Agency (USEPA) Methods 6850 or 6860, respectively. These techniques are laborious, expensive, time consuming, and require highly trained personnel, making them unsuitable for the rapid delineation of contaminated environments. An alternative screening test like the Perchlorate bioassay could be useful in the remediation of perchlorate contaminated groundwater. The goal of the project was to determine whether results with the benchtop bioassay were in agreement with those of a reference analytical method using diverse groundwater sources. If results with the benchtop bioassay performed in the PI’s laboratory were comparable to reference analytical methods, it was planned to develop and test a kit format of the bioassay that could be used in the field. The three performance objectives of the project were: 1. Compare benchtop bioassay results from testing in the PI’s laboratory to results from a reference analytical method performed by a commercial laboratory. Success criteria were that bioassay accuracy match the reference method (i.e. bioassay results have a percent difference of 30 % or less compared to the reference method), and that the bioassay result be not significantly different (α = 0.05) from the reference method by analysis of variance (ANOVA) statistical analysis. 2. Compare results with a benchtop bioassay kit format tested by site field personnel to the site’s routine Perchlorate detection method. 3. Evaluate the ease of use of the benchtop bioassay kit format. Success criteria for the first objective were not met for four of the six groundwater sources tested. Thus, the benchtop bioassay, at least in its current format, is not suitable as a screening test for Perchlorate in groundwater. Hence, no kit format for the bioassay was developed or tested with regard to the other two objectives. TECHNOLOGY DESCRIPTION The enzymatic bioassay for perchlorate was developed under Strategic Environmental Research and Development Program (SERDP) Project ER-1530. The bioassay makes use of SPE cartridges to concentrate and purify groundwater based on the procedure developed by Thorne, 2004. Since different groundwater samples vary in the efficiency of perchlorate recovery at the SPE step, subsamples are spiked with perchlorate according to the standard additions method for quantitating an analyte. After applying perchlorate-spiked groundwater to SPE cartridges, the cartridges are rinsed, and then perchlorate is eluted with an alkaline solution (pH >12) of morpholinepropane sulfonic acid (MOPS) and NaCl. The eluates are neutralized to about pH 7.2 and treated non-enzymatically to remove oxygen prior to enzyme analysis. Addition of enzyme initiates the enzyme reaction. An extract of the perchlorate reducing bacterium Dechloromonas
ES-3
agitata strain CKB, which contains the enzyme PCR, provides the enzyme source for the assay. Bioassay results with groundwater collected from three different locations at one site were in good agreement with results obtained by a reference IC method. This testing was performed in a 96 well microplate using a UV spectrophotometric microplate reader inside of an anaerobic chamber with an atmosphere of nitrogen and hydrogen. In addition, a benchtop version of the bioassay was developed, using quartz cuvettes, and a UV spectrophotometer to be performed in ambient laboratory conditions. The benchtop bioassay format performed as well as the microplate reader format with perchlorate standards. DEMONSTRATION RESULTS Although it proved difficult to find partners who could collect the groundwater needed for the study, six groundwater sources were obtained for the project. Success criteria were met for one groundwater source, but were not met for four other groundwater sources. Quantitative success criteria could not be applied to the sixth source since the amount of Perchlorate by the reference method could not be quantitated (i.e., was <MRL). Results for this source were considered to have qualitatively met success criteria. Thus the benchtop bioassay, at least in its current format, is not suitable as a screening test for perchlorate in groundwater. IMPLEMENTATION ISSUES Implementation issues are not relevant since the current version of the benchtop bioassay is not suitable for use as a screening test for perchlorate in the field.

This page left blank intentionally.
1
1.0 INTRODUCTION
1.1 BACKGROUND
Perchlorate (ClO4-) is principally a synthetic compound with a broad assortment of industrial
applications ranging from pyrotechnics to lubricating oils12. Ammonium perchlorate represents 90% of all Perchlorate salts manufactured and is used as an energetic booster or oxidant in solid rocket fuels. Its presence in the environment poses a potential health threat and primarily results from legal historical discharge of unregulated manufacturing waste streams, disposal pond leaching, and the periodic servicing of military inventories. Although a powerful oxidant, under most environmental conditions, Perchlorate is highly stable and non-reactive due to the high energy of activation associated with its reduction. Because of the large molecular volume and single anionic charge, Perchlorate also has a low affinity for cations and as a result, Perchlorate salts are generally highly soluble and completely dissociate in aqueous solution. Perchlorate does not sorb to any significant extent to soils or sediments and, in the absence of any biological interactions, its mobility and fate are largely influenced by the hydrology of the environment.16 Perchlorate is known to affect mammalian thyroid hormone production and its primary toxicity results from its structural similarity to iodate, which plays an important regulatory role in hormone production by the thyroid gland.3, 18 Perchlorate readily enters into the food web and can be taken up by forage and edible vegetation9 as well as plants grown hydroponically.7 In certain plant species, including tobacco and lettuce, Perchlorate accumulates and can persist during processing into final consumer products such as cigarettes and chewing tobacco.8 Of great concern is a study done in the U.S. on breast and dairy milk showing the presence of Perchlorate in almost all samples analyzed.11 It has been known for more than fifty years that microorganisms can reduce oxyanions of chlorine such as chlorate (ClO3
-) and perchlorate [collectively denoted (per)chlorate] under reducing conditions. The high reduction potential makes them ideal electron acceptors for microbial metabolism and specialized microbes can grow by the anaerobic reductive dissimilation of (per)chlorate to innocuous chloride. Many dissimilatory perchlorate-reducing bacteria (DPRB) have been isolated from a broad diversity of environments including both pristine and contaminated soils and sediments.1,4,6 Remediation strategies for Perchlorate contamination include making use of DPRB both in-situ and ex-situ, in addition to other technologies.5 The successful implementation of any remediative strategy is dependent on the accurate identification of the boundaries of the Perchlorate plume. Analytical methods currently available include ion chromatography (IC) with conductivity detection, which forms the basis of Environmental Protection Agency (EPA) Method 314.0, and liquid chromatography (LC) or IC coupled with electrospray ionization (ESI) mass spectrometry, which forms the basis of EPA Method 6850 or 6860, respectively. These techniques are laborious, expensive, time consuming, and require highly trained personnel, making them unsuitable for the rapid delineation of contaminated environments. An alternative biochemical technique was developed under SERDP Project ER-1530 “An Enzymatic Bioassay for Perchlorate” by Coates, Heinnickel, and Achenbach, 201019, which is based on perchlorate reductase (PCR) activity coupled to reduced nicotinamide adenine dinucleotide (NADH) oxidation, with phenazine methosulfate (PMS) as an
2
electron shuttle. The instrumentation for the bioassay is ultraviolet (UV) spectrophotometer used to measure the absorbance of NADH at 340 nanometers (nm). Bioassay results with groundwater samples from three wells at one collection site were in good agreement with results obtained by a reference IC method. The levels of perchlorate in these samples were approximately 10, 22, and 71 parts per billion (ppb). This testing was performed in a 96 well microplate using a microplate reader inside of an anaerobic chamber with an atmosphere of nitrogen and hydrogen. In addition, a benchtop version of the bioassay was developed using quartz cuvettes to be performed in ambient laboratory conditions. The benchtop bioassay format performed as well as the microplate reader format with perchlorate standards. Thus the benchtop bioassay method appeared to have the potential to supplement more expensive and time consuming analytical methods as a screening test to facilitate tasks such as mapping plumes and monitoring perchlorate levels during remediation.
1.2 OBJECTIVE OF THE DEMONSTRATION
The overall project goals of this project were: 1) Evaluate the sensitivity and reliability of the benchtop perchlorate bioassay as a screening test for perchlorate in the 6 to 40 ppb range, compared to IC or liquid chromatography/mass spectrometry (LC/MS) analytical techniques as the reference method, using groundwater samples from diverse environments. If bioassay results were consistent with those of the reference method, thereby showing promise as an alternative screening test for perchlorate, proceed to the second goal. 2) Assess the feasibility of using the bioassay in a kit format to monitor perchlorate levels at field sites by developing reagents, an standard operating procedure, and 3) Provide technical support to field personnel unfamiliar with the assay who would test samples by the bioassay in parallel with the site’s usual analytical procedures. Bioassay results would be compared to results from the site’s routine perchlorate testing method, and the ease of use would be evaluated by questionnaire and discussions with field testing personnel. Six sites provided groundwater to meet the first goal. The benchtop bioassay met the criterion for accuracy relative to the reference analytical method for only one groundwater source, and accuracy was qualitatively acceptable with a second source. With a third source, bioassay results did not meet the accuracy criterion, although they were close to the cut-off for acceptance. In addition, bioassay results for this source were significantly different from the reference analytical method by an analysis of variance (ANOVA). Finally, the benchtop bioassay accuracy was unacceptable for an additional three groundwater sources. Thus the benchtop bioassay, at least in its current format, is not suitable as a screening test for perchlorate in groundwater. Since performance of the bioassay was not high enough to warrant proceeding with field testing of the bioassay in a kit format, the focus of activities shifted to attempting to identify factors that interfere with the benchtop bioassay in order to determine whether operations and performance could be improved.
1.3 REGULATORY DRIVERS
Before 1997, perchlorate was unregulated in the U.S., however, its discovery in national drinking water resources, prompted the establishment of a federal provisional action level of 18 ppb (or micrograms per liter [µg/L]) resulting in a decade of high profile debate over the determination
3
of a final federal action level. In 1998 perchlorate was added to the U.S. EPA Contaminant Candidate List for drinking water supplies,17 and a final decision regarding the regulatory limit was to be set pending the outcome of ongoing toxicological studies. States such as Massachusetts, New Jersey, and California, adopted their own regulatory levels of 2, 5, and 6 ppb, respectively, in an attempt to limit the health impact of this contaminant while awaiting the outcome of a federal decision.13 In January 2002, as a result of publication of the first draft of the EPA review on toxicological and risk assessment data, a revised and lowered health protective standard of 1 µg/L was suggested. Since the findings of this draft assessment were highly controversial to three other federal agencies, the U.S. National Academy of Sciences (NAS) was asked to make an assessment. In January of 2005 the NAS suggested a maximum permissible dose of 0.7 micrograms per kilogram per day (µg/kg/d). This suggestion correlates to a standard of about 23 µg/L for a normal adult person. However, the level would be lower for infants and children based on weight. This is especially poignant due to the recent study done on breast and dairy milk in the U.S.11 The highest level detected in breast milk was 92 µg/L, a level 20 times higher than the NAS estimated maximum permissible dose for a baby. Reports of this magnitude are pressuring officials to set a final regulatory limit in the near future, and focus interest on technologies that support perchlorate remediation at contaminated sites. The current EPA Interim Drinking Water Health Advisory for perchlorate exposure is 15 µg/L.24

This page left blank intentionally.
5
2.0 TECHNOLOGY
The perchlorate bioassay uses an extract of the perchlorate reducing bacterium Dechloromonas agitata strain CKB, which contains the enzyme PCR. The bioassay is based on coupling perchlorate reduction to NADH oxidation using PMS as an electron shuttle to transfer electrons from NADH to the PCR enzyme.2 Hence the amount of perchlorate in an aqueous sample can be determined enzymatically by the decrease in absorbance at 340 nm. The method also requires prior perchlorate concentration and purification using solid phase extraction (SPE) cartridges by a modification of the procedure described by Thorne.15 Since different samples vary in the efficiency of perchlorate recovery at the SPE step, subsamples are spiked with perchlorate according to the standard additions method (SAM) for quantitating an analyte.14 Cartridges are rinsed and then perchlorate is eluted with an alkaline solution (pH >12) of morpholinepropane sulfonic acid (MOPS) and NaCl. The eluates are neutralized to about pH 7.2, added to cuvettes, and anaerobic conditions needed for enzyme activity are generated using the non-enzymatic reduction of PMS by NADH in order to reduce dissolved oxygen to water.
2.1 TECHNOLOGY DESCRIPTION
The benchtop bioassay method for low-level perchlorate determination is a UV spectrophotometric enzyme assay with a prior perchlorate concentration and purification step using SPE cartridges.2 The equipment and materials are relatively inexpensive and the bioassay potentially may be performed by less highly trained personnel than required by IC or LC/MS analytical methods. The SPE step uses cartridges and a cartridge conditioning procedure previously described by Thorne (2004) both to concentrate perchlorate15 and lower the levels of other anions that would interfere with subsequent perchlorate detection, such as nitrate and chlorate (ClO3
-). In addition, a SAM14 is used to compensate for the variable recovery of perchlorate from SPE cartridges. Hence, a 1 L sample of groundwater for bioassay analysis is divided into five 200 mL subsamples. One subsample is not spiked with any perchlorate and the remaining four are spiked with increasing increments of 10 ppb (or µg/L) of perchlorate. Each subsample is applied to a separate conditioned SPE cartridge. To condition cartridges prior to use they are sequentially rinsed with acetone, deionized water, and decyltrimethyl ammonium bromide (DTAB). After a 200 mL subsample is passed through a cartridge, the cartridge is rinsed with 7.5 mL of a solution of 2.5 millimoles DTAB in 15% acetone in water in order to remove chlorate (ClO3
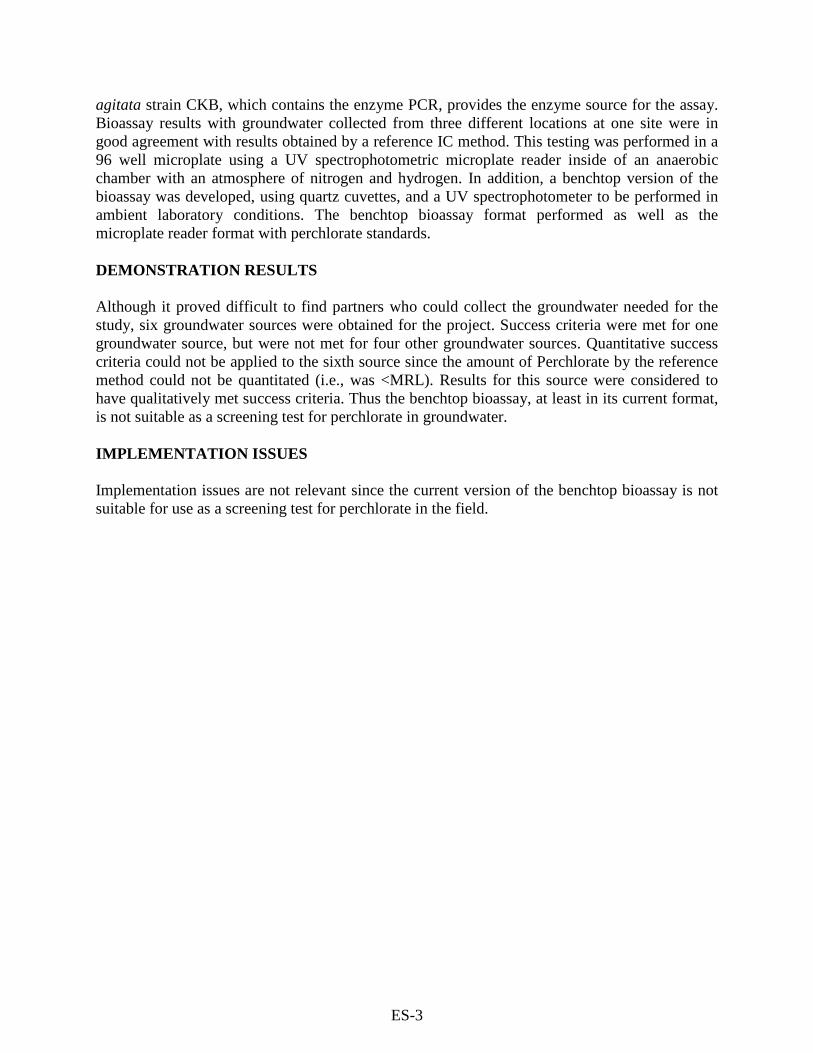
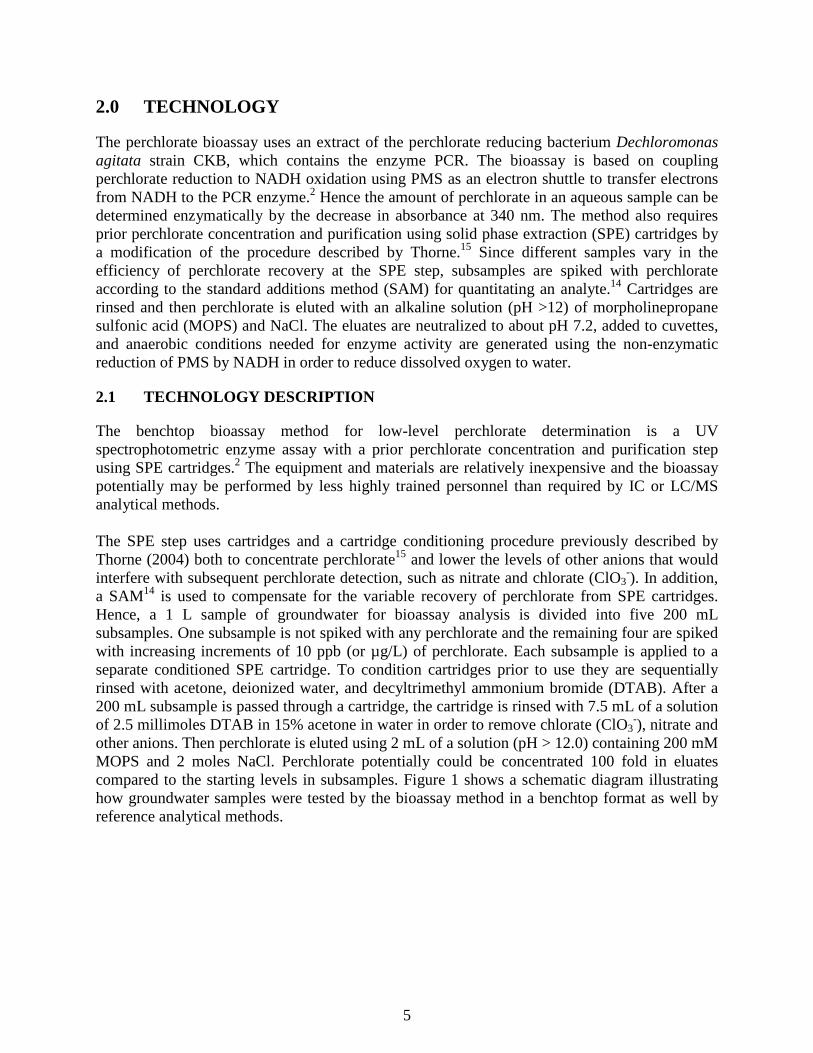
-), nitrate and other anions. Then perchlorate is eluted using 2 mL of a solution (pH > 12.0) containing 200 mM MOPS and 2 moles NaCl. Perchlorate potentially could be concentrated 100 fold in eluates compared to the starting levels in subsamples. Figure 1 shows a schematic diagram illustrating how groundwater samples were tested by the bioassay method in a benchtop format as well by reference analytical methods.
6
Figure 1. Schematic diagram of groundwater testing by benchtop bioassay and reference analytical methods.
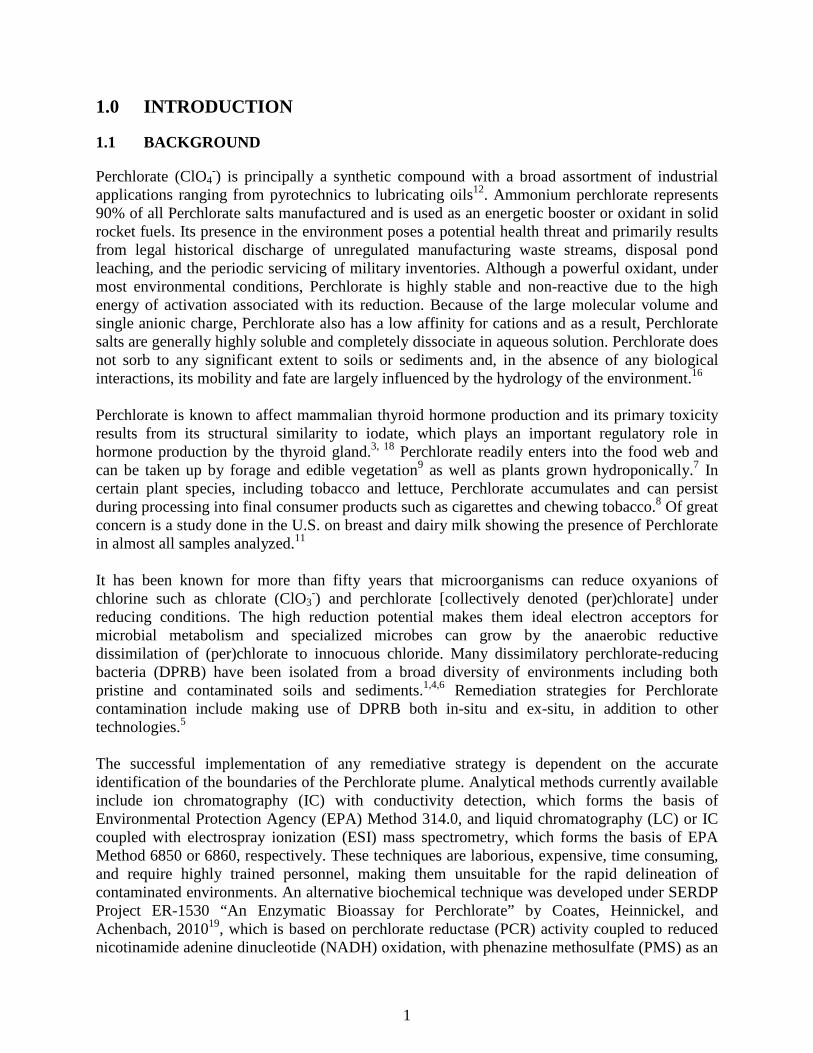
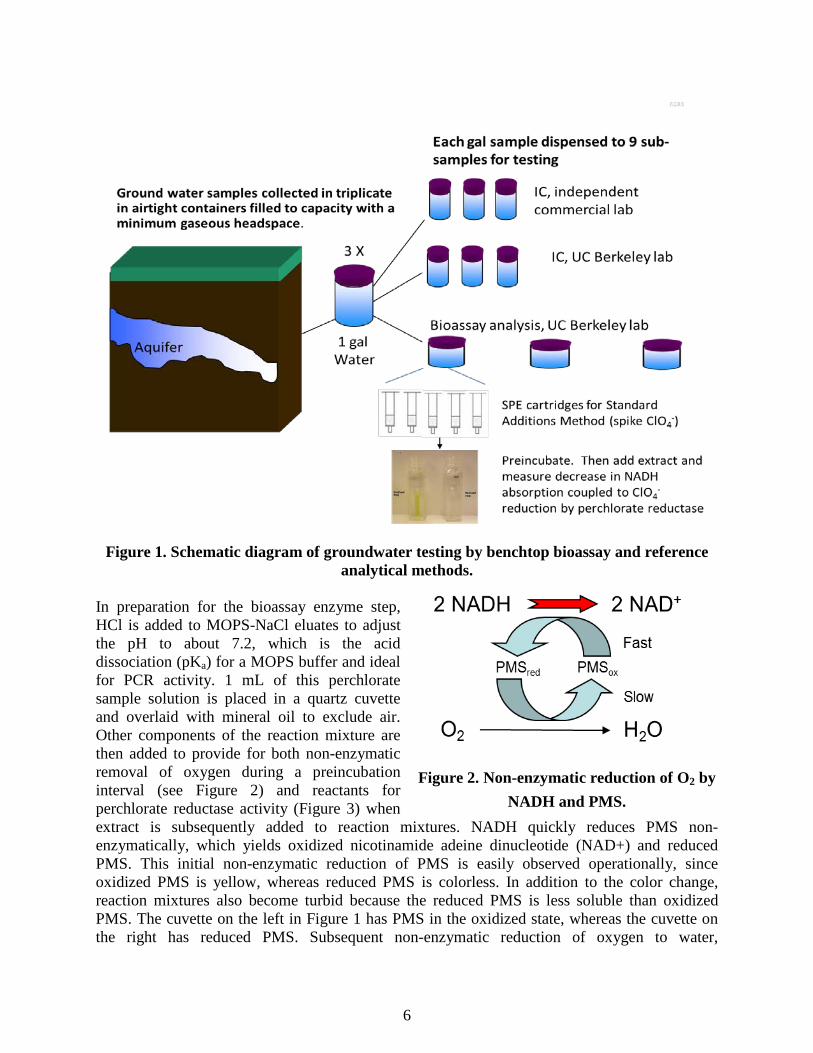
In preparation for the bioassay enzyme step, HCl is added to MOPS-NaCl eluates to adjust the pH to about 7.2, which is the acid dissociation (pKa) for a MOPS buffer and ideal for PCR activity. 1 mL of this perchlorate sample solution is placed in a quartz cuvette and overlaid with mineral oil to exclude air. Other components of the reaction mixture are then added to provide for both non-enzymatic removal of oxygen during a preincubation interval (see Figure 2) and reactants for perchlorate reductase activity (Figure 3) when extract is subsequently added to reaction mixtures. NADH quickly reduces PMS non-enzymatically, which yields oxidized nicotinamide adeine dinucleotide (NAD+) and reduced PMS. This initial non-enzymatic reduction of PMS is easily observed operationally, since oxidized PMS is yellow, whereas reduced PMS is colorless. In addition to the color change, reaction mixtures also become turbid because the reduced PMS is less soluble than oxidized PMS. The cuvette on the left in Figure 1 has PMS in the oxidized state, whereas the cuvette on the right has reduced PMS. Subsequent non-enzymatic reduction of oxygen to water,
Figure 2. Non-enzymatic reduction of O2 by NADH and PMS.
7
accompanied by reoxidation of PMS, apparently is a much slower reaction. This proved to be a significant impediment for the benchtop bioassay method, since perchlorate reductase requires and anaerobic environment and reaction mixtures must be rendered anoxic before enzyme is added.
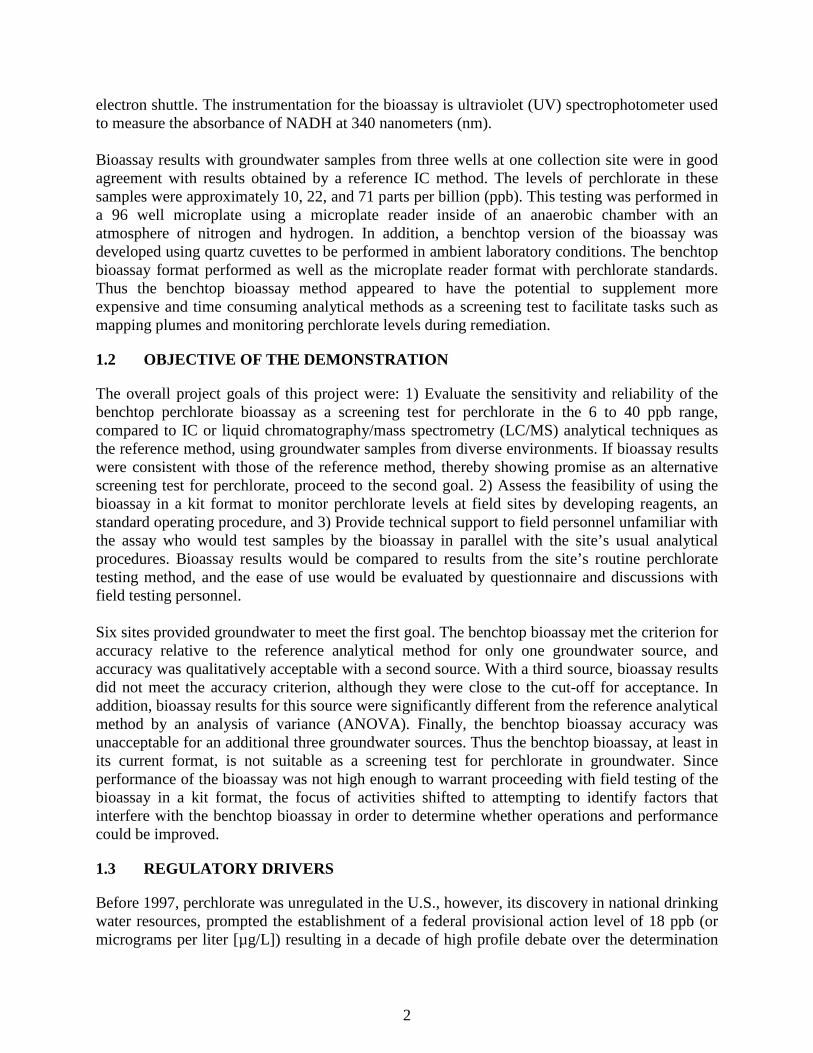
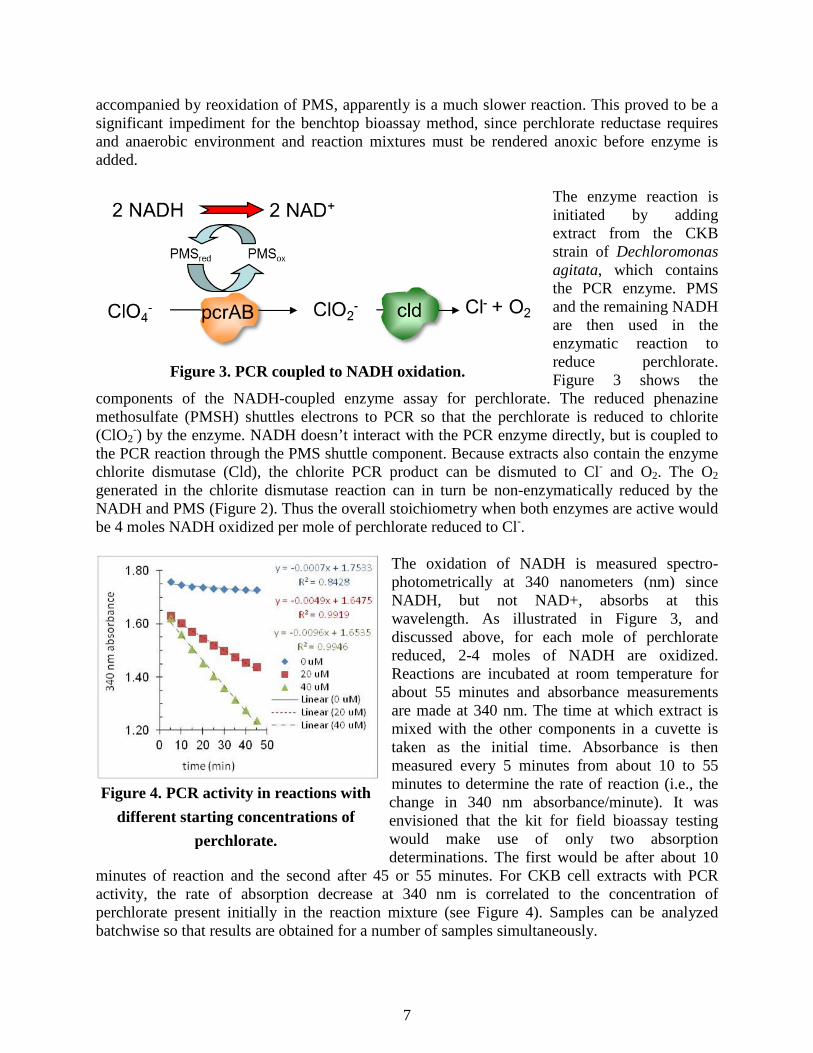
The enzyme reaction is initiated by adding extract from the CKB strain of Dechloromonas agitata, which contains the PCR enzyme. PMS and the remaining NADH are then used in the enzymatic reaction to reduce perchlorate. Figure 3 shows the
components of the NADH-coupled enzyme assay for perchlorate. The reduced phenazine methosulfate (PMSH) shuttles electrons to PCR so that the perchlorate is reduced to chlorite (ClO2
-) by the enzyme. NADH doesn’t interact with the PCR enzyme directly, but is coupled to the PCR reaction through the PMS shuttle component. Because extracts also contain the enzyme chlorite dismutase (Cld), the chlorite PCR product can be dismuted to Cl- and O2. The O2 generated in the chlorite dismutase reaction can in turn be non-enzymatically reduced by the NADH and PMS (Figure 2). Thus the overall stoichiometry when both enzymes are active would be 4 moles NADH oxidized per mole of perchlorate reduced to Cl-.
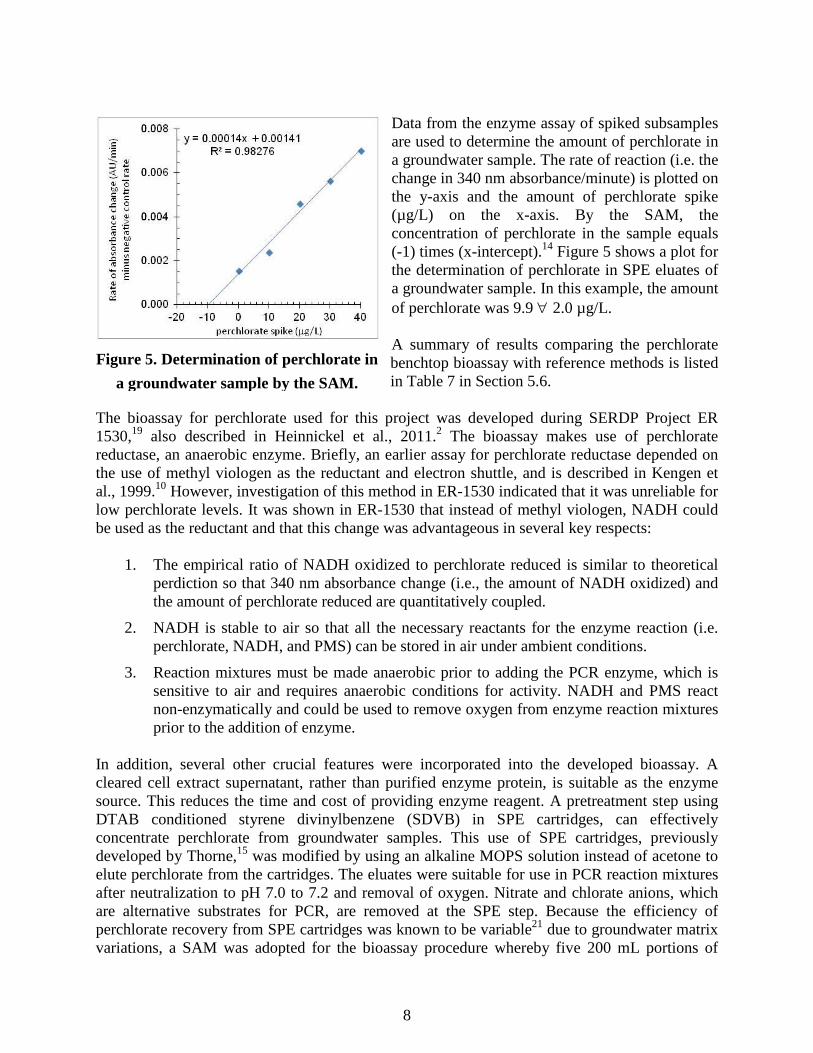
The oxidation of NADH is measured spectro-photometrically at 340 nanometers (nm) since NADH, but not NAD+, absorbs at this wavelength. As illustrated in Figure 3, and discussed above, for each mole of perchlorate reduced, 2-4 moles of NADH are oxidized. Reactions are incubated at room temperature for about 55 minutes and absorbance measurements are made at 340 nm. The time at which extract is mixed with the other components in a cuvette is taken as the initial time. Absorbance is then measured every 5 minutes from about 10 to 55 minutes to determine the rate of reaction (i.e., the change in 340 nm absorbance/minute). It was envisioned that the kit for field bioassay testing would make use of only two absorption determinations. The first would be after about 10
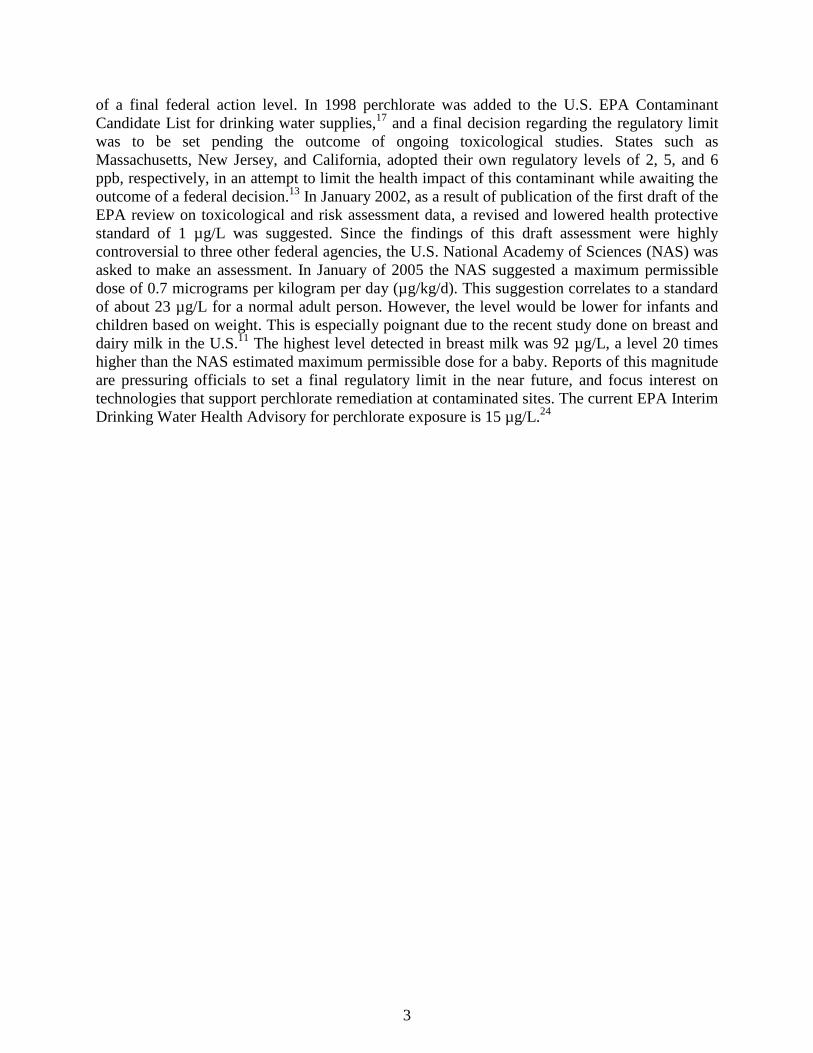
minutes of reaction and the second after 45 or 55 minutes. For CKB cell extracts with PCR activity, the rate of absorption decrease at 340 nm is correlated to the concentration of perchlorate present initially in the reaction mixture (see Figure 4). Samples can be analyzed batchwise so that results are obtained for a number of samples simultaneously.
Figure 3. PCR coupled to NADH oxidation.
Figure 4. PCR activity in reactions with different starting concentrations of
perchlorate.
8
Data from the enzyme assay of spiked subsamples are used to determine the amount of perchlorate in a groundwater sample. The rate of reaction (i.e. the change in 340 nm absorbance/minute) is plotted on the y-axis and the amount of perchlorate spike (µg/L) on the x-axis. By the SAM, the concentration of perchlorate in the sample equals (-1) times (x-intercept).14 Figure 5 shows a plot for the determination of perchlorate in SPE eluates of a groundwater sample. In this example, the amount of perchlorate was 9.9 ∀ 2.0 µg/L. A summary of results comparing the perchlorate benchtop bioassay with reference methods is listed in Table 7 in Section 5.6.
The bioassay for perchlorate used for this project was developed during SERDP Project ER 1530,19 also described in Heinnickel et al., 2011.2 The bioassay makes use of perchlorate reductase, an anaerobic enzyme. Briefly, an earlier assay for perchlorate reductase depended on the use of methyl viologen as the reductant and electron shuttle, and is described in Kengen et al., 1999.10 However, investigation of this method in ER-1530 indicated that it was unreliable for low perchlorate levels. It was shown in ER-1530 that instead of methyl viologen, NADH could be used as the reductant and that this change was advantageous in several key respects:
1. The empirical ratio of NADH oxidized to perchlorate reduced is similar to theoretical perdiction so that 340 nm absorbance change (i.e., the amount of NADH oxidized) and the amount of perchlorate reduced are quantitatively coupled.
2. NADH is stable to air so that all the necessary reactants for the enzyme reaction (i.e. perchlorate, NADH, and PMS) can be stored in air under ambient conditions.
3. Reaction mixtures must be made anaerobic prior to adding the PCR enzyme, which is sensitive to air and requires anaerobic conditions for activity. NADH and PMS react non-enzymatically and could be used to remove oxygen from enzyme reaction mixtures prior to the addition of enzyme.
In addition, several other crucial features were incorporated into the developed bioassay. A cleared cell extract supernatant, rather than purified enzyme protein, is suitable as the enzyme source. This reduces the time and cost of providing enzyme reagent. A pretreatment step using DTAB conditioned styrene divinylbenzene (SDVB) in SPE cartridges, can effectively concentrate perchlorate from groundwater samples. This use of SPE cartridges, previously developed by Thorne,15 was modified by using an alkaline MOPS solution instead of acetone to elute perchlorate from the cartridges. The eluates were suitable for use in PCR reaction mixtures after neutralization to pH 7.0 to 7.2 and removal of oxygen. Nitrate and chlorate anions, which are alternative substrates for PCR, are removed at the SPE step. Because the efficiency of perchlorate recovery from SPE cartridges was known to be variable21 due to groundwater matrix variations, a SAM was adopted for the bioassay procedure whereby five 200 mL portions of
Figure 5. Determination of perchlorate in a groundwater sample by the SAM.
9
groundwater were spiked with different amounts of perchlorate (i.e., 0, 10, 20, 30, or 40 µg/L) prior to application to SPE cartridges. Inclusion of 2 M NaCl in the alkaline MOPS eluting solution also was useful in several respects: lowering the background of other NADH oxidizing enzyme reactions, decreasing the solubility of oxygen in eluates, and decreasing diffusion of oxygen into the reaction mixture from the walls of the cuvette. Environmental samples were collected from different locations at the Aerojet Sacramento, CA, site and donated for bioassay analysis. Results with the bioassay (anaerobic plate reader) method were not significantly different from results obtained by a reference IC method.2 Lastly, a benchtop version of the bioassay was developed in which 1 mL of an enzyme buffer (i.e. MOPS-NaCl solution at about pH 7.2) containing perchlorate could be placed in a quartz cuvette, overlaid with mineral oil to separate the reaction from air, and amended with NADH and PMS to non-enzymatically consume sufficient oxygen during a preincubation period to obtain conditions suitable for PCR activity. Reactions were subsequently initiated with the addition of cell extract, and the change in 340 nm absorbance showed a good correlation between the amount of NADH oxidized and the amount of perchlorate reduced2. The focus of the current project was on the benchtop bioassay format, first to test environmentally diverse groundwater sources with the bioassay and second, if the performance of the benchtop bioassay was satisfactory, to develop and field test a kit version to be used as a possible perchlorate screening test. Additional development work was done to improve operations. The benchtop bioassay requires that reactants be added to the aqueous phase under the mineral oil overlay and mixed to obtain a homogeneous solution. Different approaches to mixing were tested. Both repipetting with disposable plastic transfer pipettes and stirring, with disposable inoculating loops or a reusable stirring tool, were satisfactory when tested in reactions with perchlorate standards in enzyme buffer. However, when SPE eluates containing perchlorate were used, stirring seemed to correlate better with less variable non-enzymatic NADH oxidation. Obtaining sufficiently reduced conditions in reaction mixtures by the non-enzymatic reaction between NADH and PMS proved difficult, particularly when SPE eluates were used. The non-enzymatic oxidation of NADH in the presence of PMS was much greater for the benchtop format than observed when reactions were performed in the anaerobic chamber using the plate reader format. NADH oxidation seen during the preincubation period was variable among replicate SPE eluate sets and often of much greater magnitude than occurs during perchlorate reduction by PCR. Some consideration was given to the approach of adding reductants, in addition to the NADH and PMS system, to more efficiently reduce SPE eluates prior to bioassay analysis. However, using reductants such as ascorbic acid, dithiothreitol, or dithionite was not attractive, since these reduce PMS2, and it was thought they would interfere with the stoichiometry of NADH and perchlorate in the bioassay. With regard to the reductant cysteine (an amino acid with a sulfhydral group), PMS is known to chemically react with sulfhydral groups. Mixing oxidized PMS with cysteine resulted in the rapid formation of a red degradation product, showing that cysteine wouldn’t be suitable as an additional reductant for the benchtop bioassay. Thus the only approach adopted for benchtop bioassay testing was to extend the preincubation period during which residual oxygen is removed non-enzymatically and amend reaction mixtures with additional NADH prior to addition of extract to start the enzymatic reaction. Apparently,
10
this procedure was not sufficiently effective or reproducible as a means of making reaction mixtures suitably reduced prior to PCR addition. Development work was also done to improve SPE operations. In the current version of the bioassay, groundwater is applied to SPE cartridges using positive pressure. A condensed nitrogen gas source provides the necessary pressure. Testing was done to determine whether gravity flow would be an effective way of applying samples for perchlorate extraction if large resin beads of SDVB, conditioned with DTAB, were used. Three grams of SDVB (20 % cross-linked) white beads of 20 – 60 mesh were packed into the barrels of 10 mL syringes, conditioned with DTAB, and 200 mL of deionized water containing perchlorate (100 µg/L) was applied by gravity flow. IC analysis of perchlorate in the effluents showed that 96.1 ∀ 1.6 % of the perchlorate (average of three replicates ∀ standard deviation [SD]) was extracted. Application of groundwater by gravity flow would be much more convenient and save operator contact time in conducting bioassay testing. As illustrated in Figure 4, and studied previously (Coates and Achenbach, unpublished), the rate of 340 nm absorption is correlated to the concentration of perchlorate present initially in the reaction mixture when a CKB extract is used for the bioassay. To evaluate whether this is a general feature of perchlorate reductase enzymes from DPRB in the genus Dechloromonas, extracts of D. aromatica strain RCB were also tested in the bioassay. With the RCB extract, bioassay rates were distinctly less variable at different perchlorate concentrations than is seen with a CKB extract. This effect on the rate of reaction was observed in both plate reader and benchtop bioassay formats. Had the development of a kit for the benchtop bioassay gone forward, it might have been advantageous to test RCB extracts for their suitability for that application, since the rate of absorbance change is faster at low perchlorate concentrations when an RCB extract is used. The stoichiometry of the NADH-coupled PCR bioassay was previously studied.19 In the present study, the stoichiometry was about 4 moles of NADH oxidized per mole of perchlorate reduced using a CKB extract in both the benchtop and plate reader formats.
2.2 ADVANTAGES AND LIMITATIONS OF THE TECHNOLOGY
The major advantages of the perchlorate bioassay technology are that the materials and equipment are relatively inexpensive, operators potentially do not need to be highly trained, and results from the assay can be obtained with a short turnaround time. A limitation to the bioassay methodology is its complexity. There are three component steps to the overall procedure: use of SPE cartridges to concentrate and purify perchlorate in spiked subsamples, spectrophotometric determination of perchlorate, and data analysis to calculate the perchlorate concentration in the sample by the SAM using linear regression. A great difficulty in the current version of the benchtop bioassay is not having an efficient method of obtaining anaerobic conditions in reaction mixtures prior to the addition of PCR. PCR is not active aerobically. Furthermore, lack of anaerobicity favors non-enzymatic NADH oxidation in the presence of PMS and other components in reaction mixtures, thus compromising the specificity of the benchtop bioassay.
11
3.0 PERFORMANCE OBJECTIVES
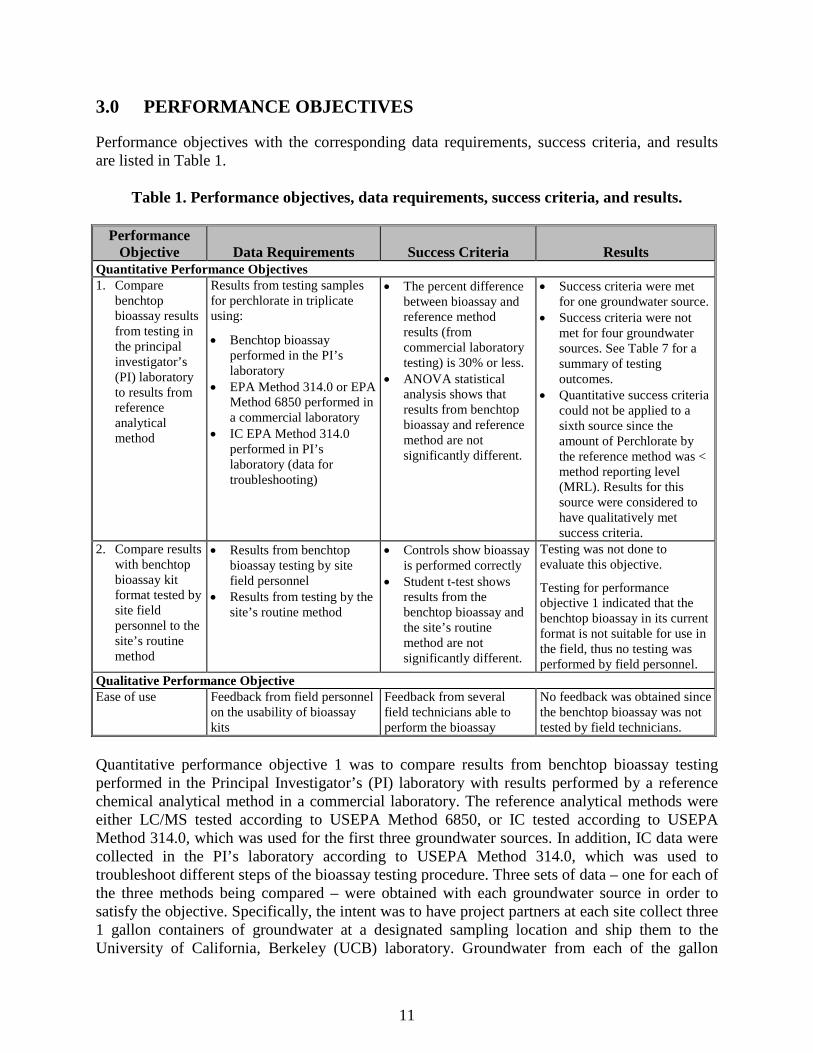
Performance objectives with the corresponding data requirements, success criteria, and results are listed in Table 1.
Table 1. Performance objectives, data requirements, success criteria, and results.
Performance Objective Data Requirements Success Criteria Results
Quantitative Performance Objectives 1. Compare
benchtop bioassay results from testing in the principal investigator’s (PI) laboratory to results from reference analytical method
Results from testing samples for perchlorate in triplicate using:
• Benchtop bioassay performed in the PI’s laboratory
• EPA Method 314.0 or EPA Method 6850 performed in a commercial laboratory
• IC EPA Method 314.0 performed in PI’s laboratory (data for troubleshooting)
• The percent difference between bioassay and reference method results (from commercial laboratory testing) is 30% or less.
• ANOVA statistical analysis shows that results from benchtop bioassay and reference method are not significantly different.
• Success criteria were met for one groundwater source.
• Success criteria were not met for four groundwater sources. See Table 7 for a summary of testing outcomes.
• Quantitative success criteria could not be applied to a sixth source since the amount of Perchlorate by the reference method was < method reporting level (MRL). Results for this source were considered to have qualitatively met success criteria.
2. Compare results with benchtop bioassay kit format tested by site field personnel to the site’s routine method
• Results from benchtop bioassay testing by site field personnel
• Results from testing by the site’s routine method
• Controls show bioassay is performed correctly
• Student t-test shows results from the benchtop bioassay and the site’s routine method are not significantly different.
Testing was not done to evaluate this objective.
Testing for performance objective 1 indicated that the benchtop bioassay in its current format is not suitable for use in the field, thus no testing was performed by field personnel.
Qualitative Performance Objective Ease of use Feedback from field personnel
on the usability of bioassay kits
Feedback from several field technicians able to perform the bioassay
No feedback was obtained since the benchtop bioassay was not tested by field technicians.
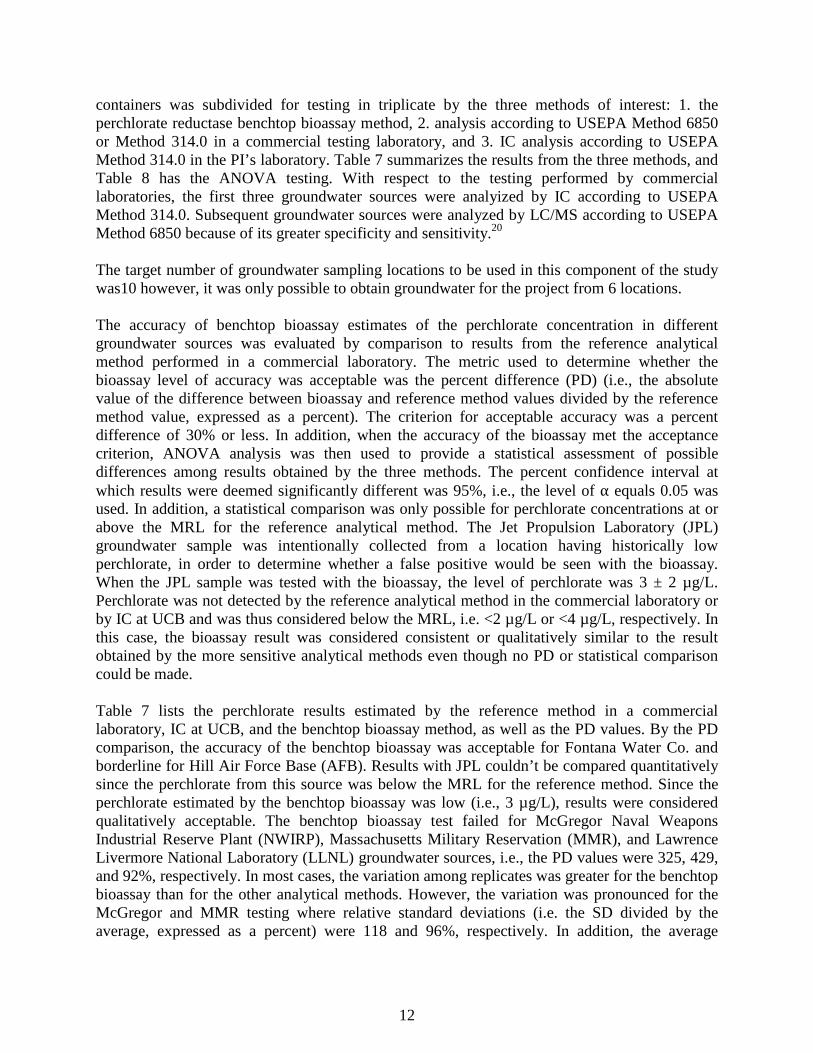
Quantitative performance objective 1 was to compare results from benchtop bioassay testing performed in the Principal Investigator’s (PI) laboratory with results performed by a reference chemical analytical method in a commercial laboratory. The reference analytical methods were either LC/MS tested according to USEPA Method 6850, or IC tested according to USEPA Method 314.0, which was used for the first three groundwater sources. In addition, IC data were collected in the PI’s laboratory according to USEPA Method 314.0, which was used to troubleshoot different steps of the bioassay testing procedure. Three sets of data – one for each of the three methods being compared – were obtained with each groundwater source in order to satisfy the objective. Specifically, the intent was to have project partners at each site collect three 1 gallon containers of groundwater at a designated sampling location and ship them to the University of California, Berkeley (UCB) laboratory. Groundwater from each of the gallon
12
containers was subdivided for testing in triplicate by the three methods of interest: 1. the perchlorate reductase benchtop bioassay method, 2. analysis according to USEPA Method 6850 or Method 314.0 in a commercial testing laboratory, and 3. IC analysis according to USEPA Method 314.0 in the PI’s laboratory. Table 7 summarizes the results from the three methods, and Table 8 has the ANOVA testing. With respect to the testing performed by commercial laboratories, the first three groundwater sources were analyized by IC according to USEPA Method 314.0. Subsequent groundwater sources were analyzed by LC/MS according to USEPA Method 6850 because of its greater specificity and sensitivity.20 The target number of groundwater sampling locations to be used in this component of the study was10 however, it was only possible to obtain groundwater for the project from 6 locations. The accuracy of benchtop bioassay estimates of the perchlorate concentration in different groundwater sources was evaluated by comparison to results from the reference analytical method performed in a commercial laboratory. The metric used to determine whether the bioassay level of accuracy was acceptable was the percent difference (PD) (i.e., the absolute value of the difference between bioassay and reference method values divided by the reference method value, expressed as a percent). The criterion for acceptable accuracy was a percent difference of 30% or less. In addition, when the accuracy of the bioassay met the acceptance criterion, ANOVA analysis was then used to provide a statistical assessment of possible differences among results obtained by the three methods. The percent confidence interval at which results were deemed significantly different was 95%, i.e., the level of α equals 0.05 was used. In addition, a statistical comparison was only possible for perchlorate concentrations at or above the MRL for the reference analytical method. The Jet Propulsion Laboratory (JPL) groundwater sample was intentionally collected from a location having historically low perchlorate, in order to determine whether a false positive would be seen with the bioassay. When the JPL sample was tested with the bioassay, the level of perchlorate was 3 ± 2 µg/L. Perchlorate was not detected by the reference analytical method in the commercial laboratory or by IC at UCB and was thus considered below the MRL, i.e. <2 µg/L or <4 µg/L, respectively. In this case, the bioassay result was considered consistent or qualitatively similar to the result obtained by the more sensitive analytical methods even though no PD or statistical comparison could be made. Table 7 lists the perchlorate results estimated by the reference method in a commercial laboratory, IC at UCB, and the benchtop bioassay method, as well as the PD values. By the PD comparison, the accuracy of the benchtop bioassay was acceptable for Fontana Water Co. and borderline for Hill Air Force Base (AFB). Results with JPL couldn’t be compared quantitatively since the perchlorate from this source was below the MRL for the reference method. Since the perchlorate estimated by the benchtop bioassay was low (i.e., 3 µg/L), results were considered qualitatively acceptable. The benchtop bioassay test failed for McGregor Naval Weapons Industrial Reserve Plant (NWIRP), Massachusetts Military Reservation (MMR), and Lawrence Livermore National Laboratory (LLNL) groundwater sources, i.e., the PD values were 325, 429, and 92%, respectively. In most cases, the variation among replicates was greater for the benchtop bioassay than for the other analytical methods. However, the variation was pronounced for the McGregor and MMR testing where relative standard deviations (i.e. the SD divided by the average, expressed as a percent) were 118 and 96%, respectively. In addition, the average
13
perchlorate estimated with the bioassay was 4 to 5 fold greater than for the reference method. However, for LLNL testing, the average perchlorate estimated with the bioassay was 13 fold lower than for the reference method, and there was good agreement among replicate SPE eluate sets, suggesting there may have been inhibition of the bioassay with this source. ANOVA was performed using using the Hill AFB and Fontana Water Co. data (see Table 8). This analysis showed that the three methods were not significantly different for Fontana Water Co. groundwater. However, the benchtop bioassay was significantly different from the analytical methods for the Hill AFB source. Results with the benchtop bioassay did not justify the development of a field kit, hence no testing was done relative to the second quantitative performance objective. Likewise, since no field kit was developed, no assessment was done relative to the qualitative performance objective.

This page left blank intentionally.
15
4.0 SITE DESCRIPTION
4.1 SITE SELECTION
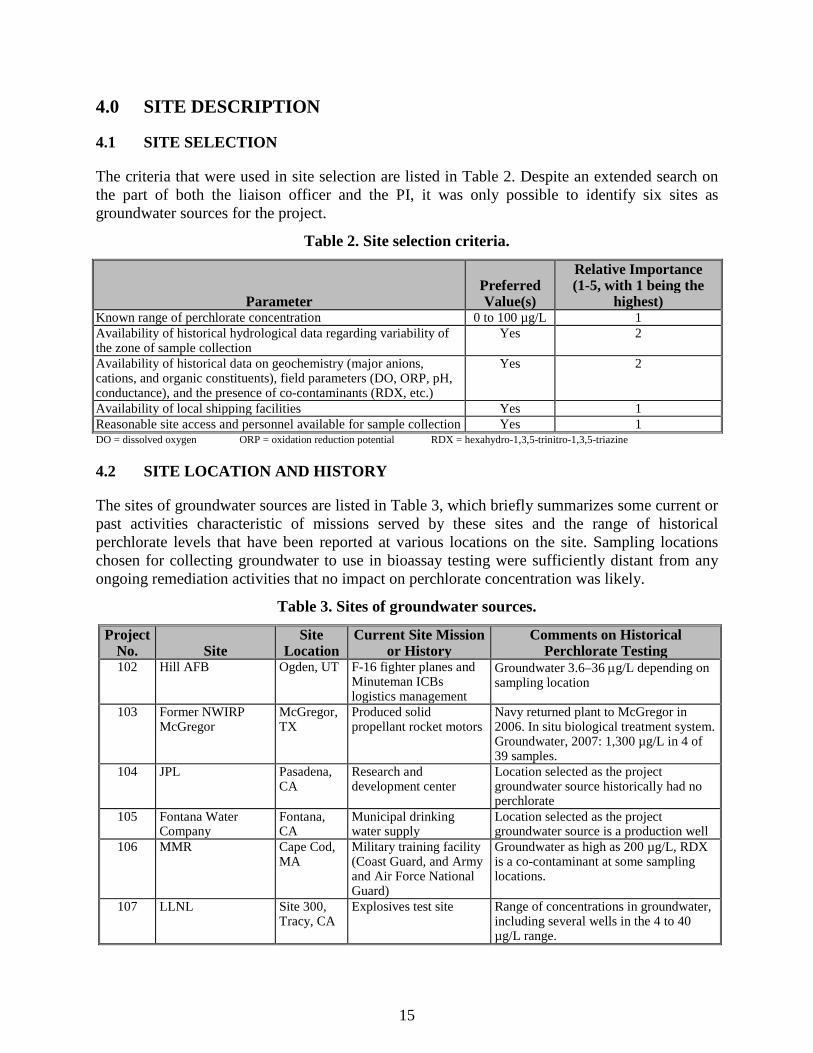
The criteria that were used in site selection are listed in Table 2. Despite an extended search on the part of both the liaison officer and the PI, it was only possible to identify six sites as groundwater sources for the project.
Table 2. Site selection criteria.
Parameter Preferred Value(s)
Relative Importance (1-5, with 1 being the
highest) Known range of perchlorate concentration 0 to 100 µg/L 1 Availability of historical hydrological data regarding variability of the zone of sample collection
Yes 2
Availability of historical data on geochemistry (major anions, cations, and organic constituents), field parameters (DO, ORP, pH, conductance), and the presence of co-contaminants (RDX, etc.)
Yes 2
Availability of local shipping facilities Yes 1 Reasonable site access and personnel available for sample collection Yes 1 DO = dissolved oxygen ORP = oxidation reduction potential RDX = hexahydro-1,3,5-trinitro-1,3,5-triazine
4.2 SITE LOCATION AND HISTORY
The sites of groundwater sources are listed in Table 3, which briefly summarizes some current or past activities characteristic of missions served by these sites and the range of historical perchlorate levels that have been reported at various locations on the site. Sampling locations chosen for collecting groundwater to use in bioassay testing were sufficiently distant from any ongoing remediation activities that no impact on perchlorate concentration was likely.
Table 3. Sites of groundwater sources.
Project No. Site
Site Location
Current Site Mission or History
Comments on Historical Perchlorate Testing
102 Hill AFB Ogden, UT F-16 fighter planes and Minuteman ICBs logistics management
Groundwater 3.6–36 µg/L depending on sampling location
103 Former NWIRP McGregor
McGregor, TX
Produced solid propellant rocket motors
Navy returned plant to McGregor in 2006. In situ biological treatment system. Groundwater, 2007: 1,300 µg/L in 4 of 39 samples.
104 JPL Pasadena, CA
Research and development center
Location selected as the project groundwater source historically had no perchlorate
105 Fontana Water Company
Fontana, CA
Municipal drinking water supply
Location selected as the project groundwater source is a production well
106 MMR Cape Cod, MA
Military training facility (Coast Guard, and Army and Air Force National Guard)
Groundwater as high as 200 µg/L, RDX is a co-contaminant at some sampling locations.
107 LLNL Site 300, Tracy, CA
Explosives test site Range of concentrations in groundwater, including several wells in the 4 to 40 µg/L range.
16
4.3 SITE GEOLOGY/HYDROGEOLOGY
Historical information on the geology, hydrogeology, and matrix of sampling locations was considered in order to include diverse groundwater samples in the testing.
4.4 CONTAMINANT DISTRIBUTION
Historical data on the variability in perchlorate concentration were reviewed to ensure sampling locations had low variability in perchlorate concentration. When possible, locations likely to provide groundwater samples that contained co-contaminants in addition to perchlorate were included in the testing. The ideal perchlorate concentration range was 0 – 40 µg/L. Three locations (JPL, Fontana Water Co., and MMR) had historical perchlorate concentrations less than 10 µg/L.
17
5.0 TEST DESIGN
No new sampling installations were used for this study. Instead, the aim was to coordinate the collection of samples to coincide with the routine groundwater sampling schedule of the different locations included in the study. Groundwater from the different sites was tested to evaluate the performance of the bioassay on various kinds of samples.
5.1 CONCEPTUAL EXPERIMENTAL DESIGN
Objective one was to perform bioassay testing on environmentally diverse groundwater samples, defined as groundwater from a diverse assortment of geographic regions expected to differ with respect to geochemical parameters such as pH, salinity, iron content, temperature, and conductivity. However, the groundwater sources included in the study were collected primarily based on availability. Three labeled gallon containers were collected at each sampling location (see Figure 1). These were cooled and shipped overnight along with a chain-of-custody form to the UCB laboratory where the integrity of the samples was examined and temperature, pH, and conductivity were measured. Each gallon of groundwater was filtered to remove particulate material and subdivided to obtain nine subsamples. The subsamples to be tested by a commercial laboratory were shipped along with chain-of-custody documentation to the testing facility. Subsamples were subsequently tested for perchlorate in triplicate by each method (i.e. benchtop bioassay, a reference analytical method performed by a commercial laboratory, and IC according to EPA method 314.0 at the UCB laboratory). A residual sample from each gallon container was stored at 2-8 ΕC in case additional analytical testing was desirable to identify factors in a sample that might influence bioassay performance.
5.2 BASELINE CHARACTERIZATION
Historical data on the perchlorate concentration at sampling locations over several years was used to help select the locations for groundwater sampling. No additional baseline characterization activities were undertaken.
5.3 TREATABILITY OR LABORATORY STUDY RESULTS
No treatability or laboratory scale studies were part of the project.
5.4 FIELD TESTING
Testing of the perchlorate benchtop bioassay was not carried out since the assay in its current format is not suitable as a screening test for use in the field.
5.5 SAMPLING AND ANALYTICAL METHODS
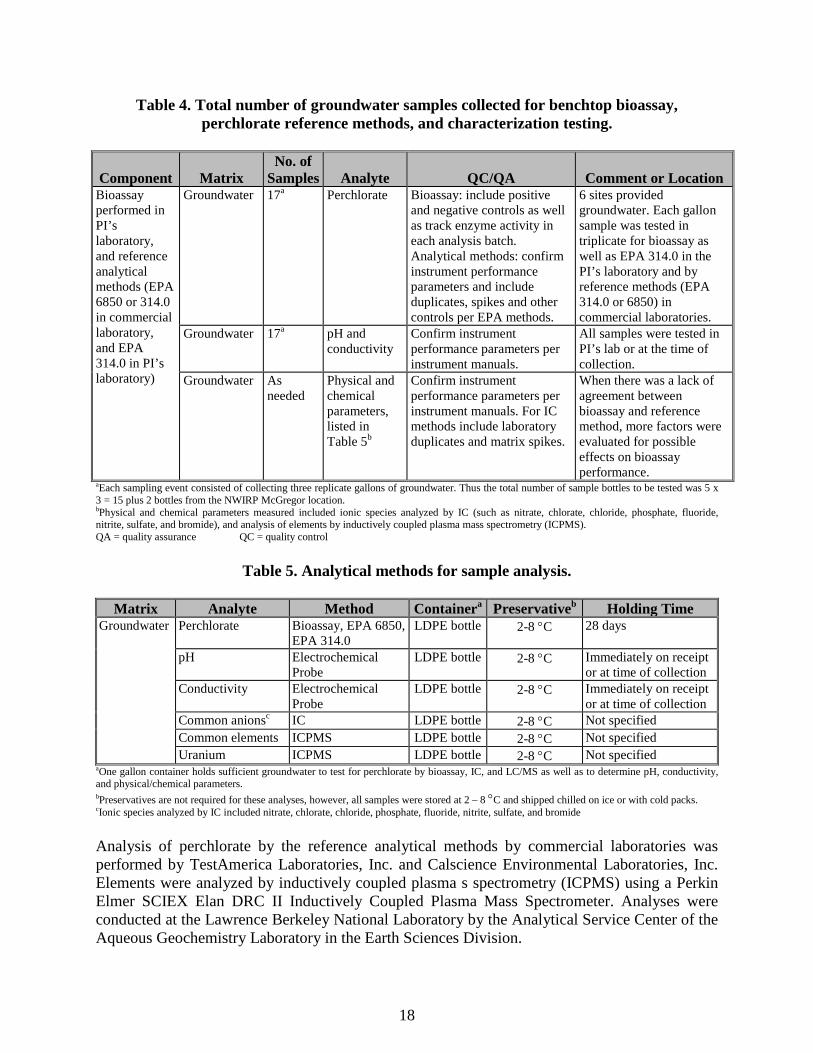
The number of groundwater samples collected for the project and the types of tests performed are summarized in Table 4. The analytical methods are listed in Table 5.
18
Table 4. Total number of groundwater samples collected for benchtop bioassay, perchlorate reference methods, and characterization testing.
Component Matrix No. of
Samples Analyte QC/QA Comment or Location Bioassay performed in PI’s laboratory, and reference analytical methods (EPA 6850 or 314.0 in commercial laboratory, and EPA 314.0 in PI’s laboratory)
Groundwater 17a Perchlorate Bioassay: include positive and negative controls as well as track enzyme activity in each analysis batch. Analytical methods: confirm instrument performance parameters and include duplicates, spikes and other controls per EPA methods.
6 sites provided groundwater. Each gallon sample was tested in triplicate for bioassay as well as EPA 314.0 in the PI’s laboratory and by reference methods (EPA 314.0 or 6850) in commercial laboratories.
Groundwater 17a pH and conductivity
Confirm instrument performance parameters per instrument manuals.
All samples were tested in PI’s lab or at the time of collection.
Groundwater As needed
Physical and chemical parameters, listed in Table 5b
Confirm instrument performance parameters per instrument manuals. For IC methods include laboratory duplicates and matrix spikes.
When there was a lack of agreement between bioassay and reference method, more factors were evaluated for possible effects on bioassay performance.
aEach sampling event consisted of collecting three replicate gallons of groundwater. Thus the total number of sample bottles to be tested was 5 x 3 = 15 plus 2 bottles from the NWIRP McGregor location. bPhysical and chemical parameters measured included ionic species analyzed by IC (such as nitrate, chlorate, chloride, phosphate, fluoride, nitrite, sulfate, and bromide), and analysis of elements by inductively coupled plasma mass spectrometry (ICPMS). QA = quality assurance QC = quality control
Table 5. Analytical methods for sample analysis.
Matrix Analyte Method Containera Preservativeb Holding Time Groundwater Perchlorate Bioassay, EPA 6850,
EPA 314.0 LDPE bottle 2-8 °C 28 days
pH Electrochemical Probe
LDPE bottle 2-8 °C Immediately on receipt or at time of collection
Conductivity Electrochemical Probe
LDPE bottle 2-8 °C Immediately on receipt or at time of collection
Common anionsc IC LDPE bottle 2-8 °C Not specified Common elements ICPMS LDPE bottle 2-8 °C Not specified Uranium ICPMS LDPE bottle 2-8 °C Not specified
aOne gallon container holds sufficient groundwater to test for perchlorate by bioassay, IC, and LC/MS as well as to determine pH, conductivity, and physical/chemical parameters. bPreservatives are not required for these analyses, however, all samples were stored at 2 – 8 °C and shipped chilled on ice or with cold packs. cIonic species analyzed by IC included nitrate, chlorate, chloride, phosphate, fluoride, nitrite, sulfate, and bromide Analysis of perchlorate by the reference analytical methods by commercial laboratories was performed by TestAmerica Laboratories, Inc. and Calscience Environmental Laboratories, Inc. Elements were analyzed by inductively coupled plasma s spectrometry (ICPMS) using a Perkin Elmer SCIEX Elan DRC II Inductively Coupled Plasma Mass Spectrometer. Analyses were conducted at the Lawrence Berkeley National Laboratory by the Analytical Service Center of the Aqueous Geochemistry Laboratory in the Earth Sciences Division.
19
The bioassay determination of perchlorate was by a SAM, and (-1) times the x-intercept of the SAM regression line provides the concentration of perchlorate in the sample14. Linear regression statistical analysis22 was performed using Microsoft Excel (Microsoft Corporation, Redmond, Washington). ANOVA statistical testing was performed using Minitab 16.2.3 software (Minitab, Inc., State College, Pennsylvania). Multi-dimensional Scaling (MDS) statistical analysis was performed using Primer 6 software (Primer-E Ltd., Plymouth Marine Laboratory, UK).
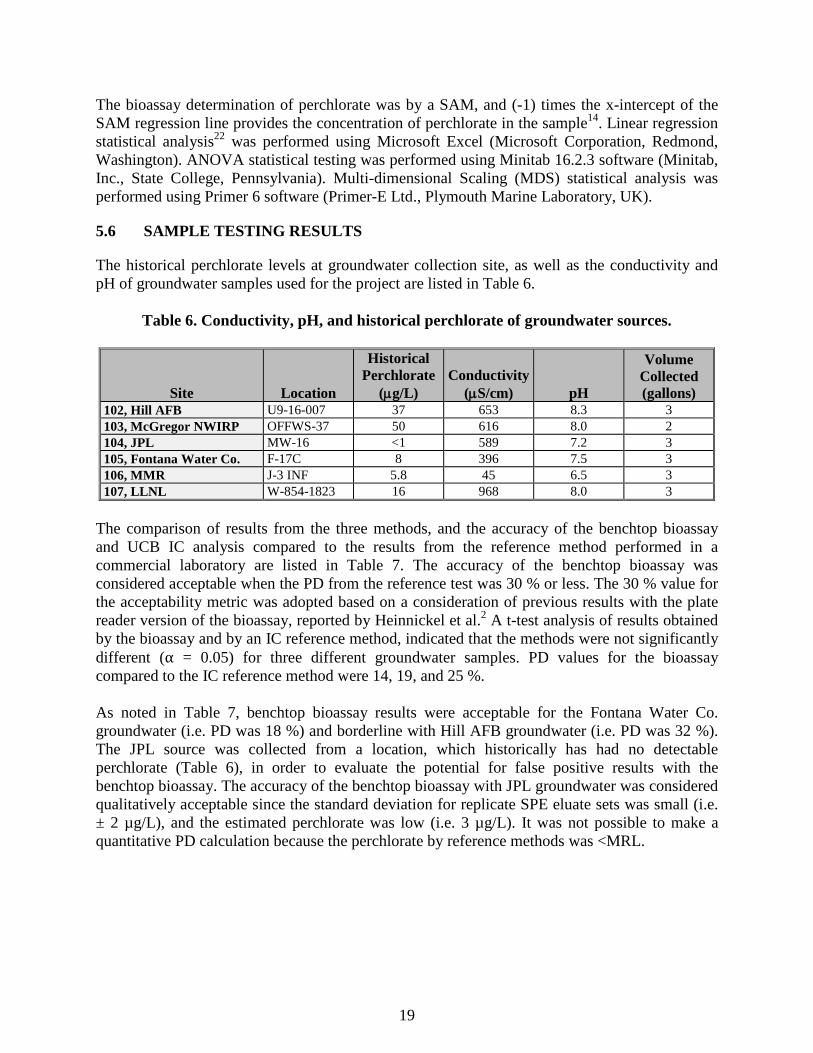
5.6 SAMPLE TESTING RESULTS
The historical perchlorate levels at groundwater collection site, as well as the conductivity and pH of groundwater samples used for the project are listed in Table 6.
Table 6. Conductivity, pH, and historical perchlorate of groundwater sources.
Site Location
Historical Perchlorate
(µg/L) Conductivity
(µS/cm) pH
Volume Collected (gallons)
102, Hill AFB U9-16-007 37 653 8.3 3 103, McGregor NWIRP OFFWS-37 50 616 8.0 2 104, JPL MW-16 <1 589 7.2 3 105, Fontana Water Co. F-17C 8 396 7.5 3 106, MMR J-3 INF 5.8 45 6.5 3 107, LLNL W-854-1823 16 968 8.0 3
The comparison of results from the three methods, and the accuracy of the benchtop bioassay and UCB IC analysis compared to the results from the reference method performed in a commercial laboratory are listed in Table 7. The accuracy of the benchtop bioassay was considered acceptable when the PD from the reference test was 30 % or less. The 30 % value for the acceptability metric was adopted based on a consideration of previous results with the plate reader version of the bioassay, reported by Heinnickel et al.2 A t-test analysis of results obtained by the bioassay and by an IC reference method, indicated that the methods were not significantly different (α = 0.05) for three different groundwater samples. PD values for the bioassay compared to the IC reference method were 14, 19, and 25 %. As noted in Table 7, benchtop bioassay results were acceptable for the Fontana Water Co. groundwater (i.e. PD was 18 %) and borderline with Hill AFB groundwater (i.e. PD was 32 %). The JPL source was collected from a location, which historically has had no detectable perchlorate (Table 6), in order to evaluate the potential for false positive results with the benchtop bioassay. The accuracy of the benchtop bioassay with JPL groundwater was considered qualitatively acceptable since the standard deviation for replicate SPE eluate sets was small (i.e. ± 2 µg/L), and the estimated perchlorate was low (i.e. 3 µg/L). It was not possible to make a quantitative PD calculation because the perchlorate by reference methods was <MRL.
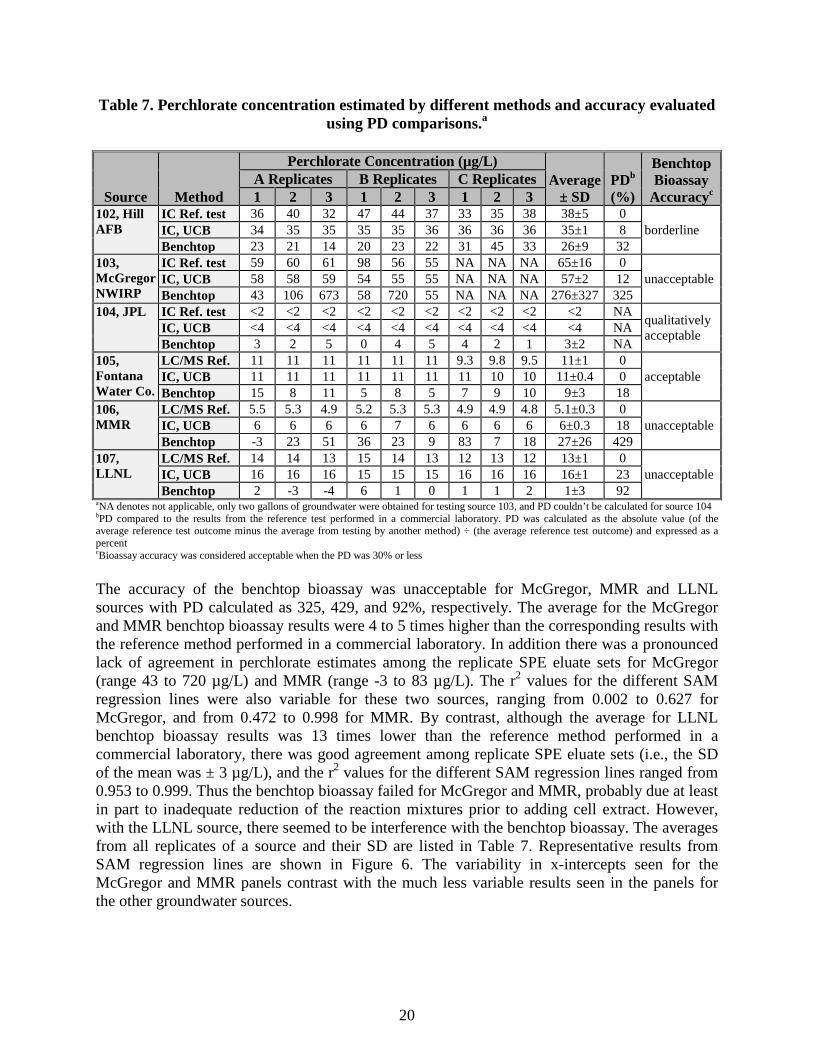
20
Table 7. Perchlorate concentration estimated by different methods and accuracy evaluated using PD comparisons.a
Source Method
Perchlorate Concentration (µg/L) Average
± SD PDb (%)
Benchtop Bioassay
Accuracyc A Replicates B Replicates C Replicates 1 2 3 1 2 3 1 2 3
102, Hill AFB
IC Ref. test 36 40 32 47 44 37 33 35 38 38±5 0 borderline IC, UCB 34 35 35 35 35 36 36 36 36 35±1 8
Benchtop 23 21 14 20 23 22 31 45 33 26±9 32 103, McGregor NWIRP
IC Ref. test 59 60 61 98 56 55 NA NA NA 65±16 0 unacceptable IC, UCB 58 58 59 54 55 55 NA NA NA 57±2 12
Benchtop 43 106 673 58 720 55 NA NA NA 276±327 325 104, JPL IC Ref. test <2 <2 <2 <2 <2 <2 <2 <2 <2 <2 NA qualitatively
acceptable IC, UCB <4 <4 <4 <4 <4 <4 <4 <4 <4 <4 NA Benchtop 3 2 5 0 4 5 4 2 1 3±2 NA
105, Fontana Water Co.
LC/MS Ref. 11 11 11 11 11 11 9.3 9.8 9.5 11±1 0 acceptable IC, UCB 11 11 11 11 11 11 11 10 10 11±0.4 0
Benchtop 15 8 11 5 8 5 7 9 10 9±3 18 106, MMR
LC/MS Ref. 5.5 5.3 4.9 5.2 5.3 5.3 4.9 4.9 4.8 5.1±0.3 0 unacceptable IC, UCB 6 6 6 6 7 6 6 6 6 6±0.3 18
Benchtop -3 23 51 36 23 9 83 7 18 27±26 429 107, LLNL
LC/MS Ref. 14 14 13 15 14 13 12 13 12 13±1 0 unacceptable IC, UCB 16 16 16 15 15 15 16 16 16 16±1 23
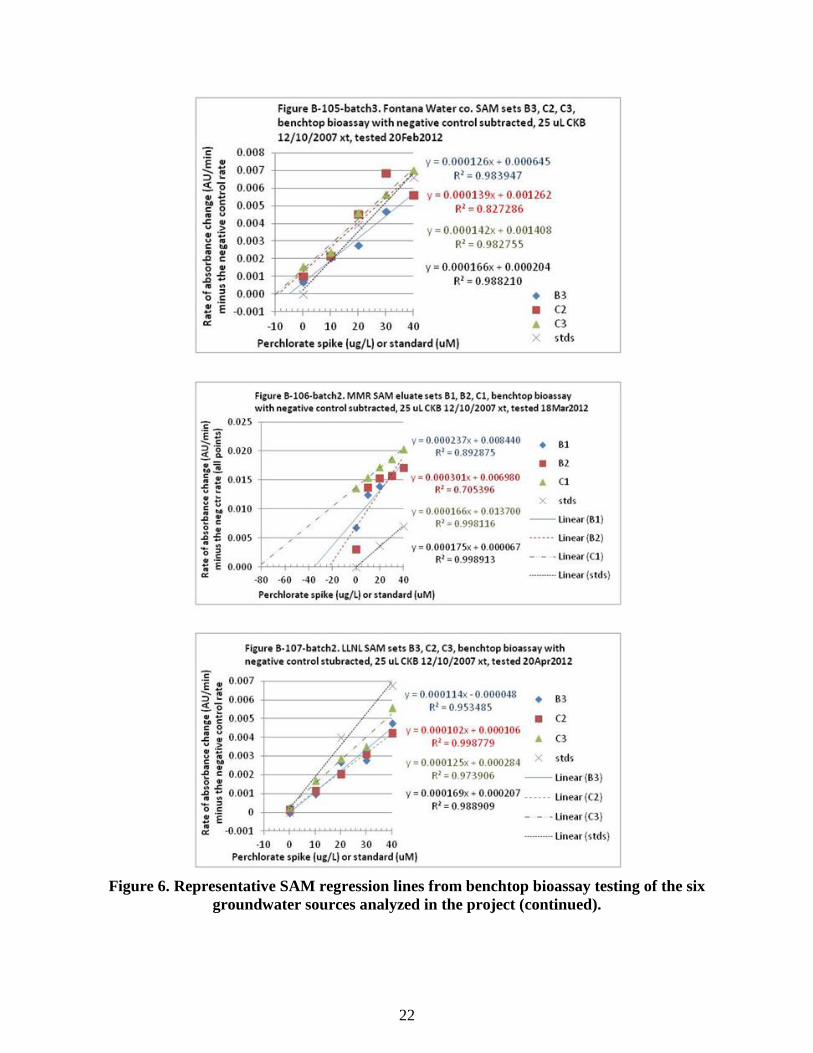
Benchtop 2 -3 -4 6 1 0 1 1 2 1±3 92 aNA denotes not applicable, only two gallons of groundwater were obtained for testing source 103, and PD couldn’t be calculated for source 104 bPD compared to the results from the reference test performed in a commercial laboratory. PD was calculated as the absolute value (of the average reference test outcome minus the average from testing by another method) ÷ (the average reference test outcome) and expressed as a percent cBioassay accuracy was considered acceptable when the PD was 30% or less The accuracy of the benchtop bioassay was unacceptable for McGregor, MMR and LLNL sources with PD calculated as 325, 429, and 92%, respectively. The average for the McGregor and MMR benchtop bioassay results were 4 to 5 times higher than the corresponding results with the reference method performed in a commercial laboratory. In addition there was a pronounced lack of agreement in perchlorate estimates among the replicate SPE eluate sets for McGregor (range 43 to 720 µg/L) and MMR (range -3 to 83 µg/L). The r2 values for the different SAM regression lines were also variable for these two sources, ranging from 0.002 to 0.627 for McGregor, and from 0.472 to 0.998 for MMR. By contrast, although the average for LLNL benchtop bioassay results was 13 times lower than the reference method performed in a commercial laboratory, there was good agreement among replicate SPE eluate sets (i.e., the SD of the mean was ± 3 µg/L), and the r2 values for the different SAM regression lines ranged from 0.953 to 0.999. Thus the benchtop bioassay failed for McGregor and MMR, probably due at least in part to inadequate reduction of the reaction mixtures prior to adding cell extract. However, with the LLNL source, there seemed to be interference with the benchtop bioassay. The averages from all replicates of a source and their SD are listed in Table 7. Representative results from SAM regression lines are shown in Figure 6. The variability in x-intercepts seen for the McGregor and MMR panels contrast with the much less variable results seen in the panels for the other groundwater sources.
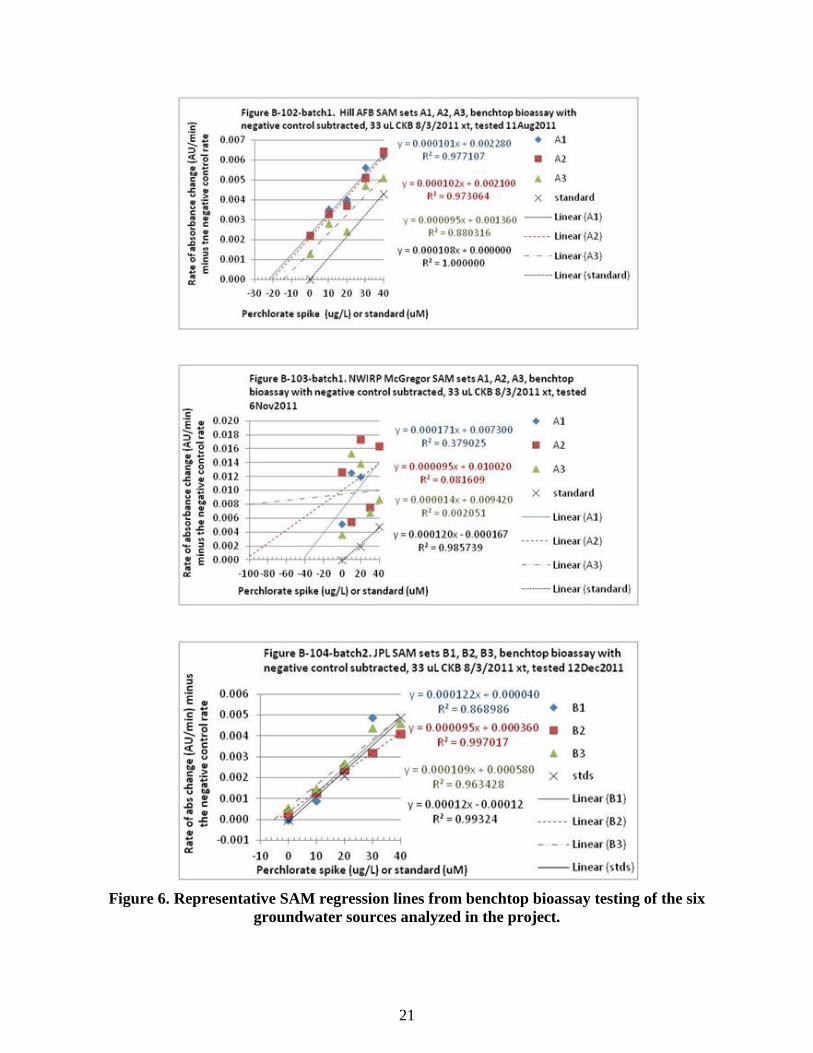
21
Figure 6. Representative SAM regression lines from benchtop bioassay testing of the six
groundwater sources analyzed in the project.
22
Figure 6. Representative SAM regression lines from benchtop bioassay testing of the six
groundwater sources analyzed in the project (continued).
23
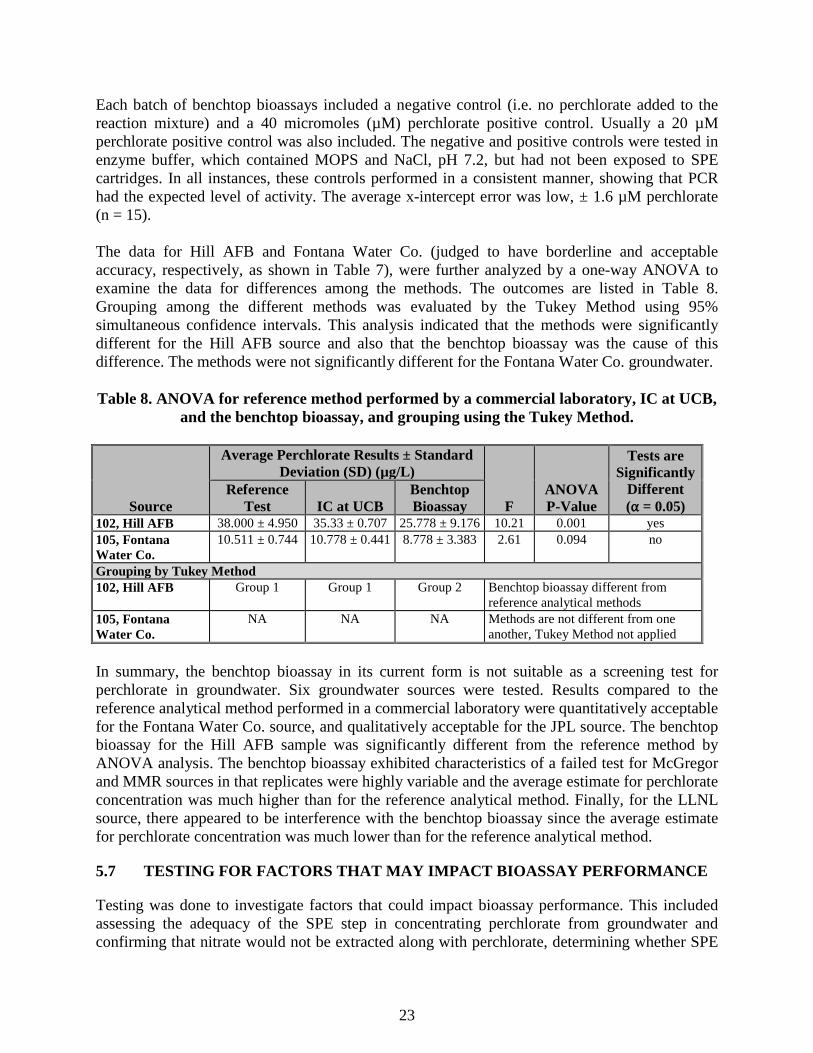
Each batch of benchtop bioassays included a negative control (i.e. no perchlorate added to the reaction mixture) and a 40 micromoles (µM) perchlorate positive control. Usually a 20 µM perchlorate positive control was also included. The negative and positive controls were tested in enzyme buffer, which contained MOPS and NaCl, pH 7.2, but had not been exposed to SPE cartridges. In all instances, these controls performed in a consistent manner, showing that PCR had the expected level of activity. The average x-intercept error was low, ± 1.6 µM perchlorate (n = 15). The data for Hill AFB and Fontana Water Co. (judged to have borderline and acceptable accuracy, respectively, as shown in Table 7), were further analyzed by a one-way ANOVA to examine the data for differences among the methods. The outcomes are listed in Table 8. Grouping among the different methods was evaluated by the Tukey Method using 95% simultaneous confidence intervals. This analysis indicated that the methods were significantly different for the Hill AFB source and also that the benchtop bioassay was the cause of this difference. The methods were not significantly different for the Fontana Water Co. groundwater. Table 8. ANOVA for reference method performed by a commercial laboratory, IC at UCB,
and the benchtop bioassay, and grouping using the Tukey Method.
Source
Average Perchlorate Results ± Standard Deviation (SD) (µg/L)
F ANOVA P-Value
Tests are Significantly
Different (α = 0.05)
Reference Test IC at UCB
Benchtop Bioassay
102, Hill AFB 38.000 ± 4.950 35.33 ± 0.707 25.778 ± 9.176 10.21 0.001 yes 105, Fontana Water Co.
10.511 ± 0.744 10.778 ± 0.441 8.778 ± 3.383 2.61 0.094 no
Grouping by Tukey Method 102, Hill AFB Group 1 Group 1 Group 2 Benchtop bioassay different from
reference analytical methods 105, Fontana Water Co.
NA NA NA Methods are not different from one another, Tukey Method not applied
In summary, the benchtop bioassay in its current form is not suitable as a screening test for perchlorate in groundwater. Six groundwater sources were tested. Results compared to the reference analytical method performed in a commercial laboratory were quantitatively acceptable for the Fontana Water Co. source, and qualitatively acceptable for the JPL source. The benchtop bioassay for the Hill AFB sample was significantly different from the reference method by ANOVA analysis. The benchtop bioassay exhibited characteristics of a failed test for McGregor and MMR sources in that replicates were highly variable and the average estimate for perchlorate concentration was much higher than for the reference analytical method. Finally, for the LLNL source, there appeared to be interference with the benchtop bioassay since the average estimate for perchlorate concentration was much lower than for the reference analytical method.
5.7 TESTING FOR FACTORS THAT MAY IMPACT BIOASSAY PERFORMANCE
Testing was done to investigate factors that could impact bioassay performance. This included assessing the adequacy of the SPE step in concentrating perchlorate from groundwater and confirming that nitrate would not be extracted along with perchlorate, determining whether SPE
24
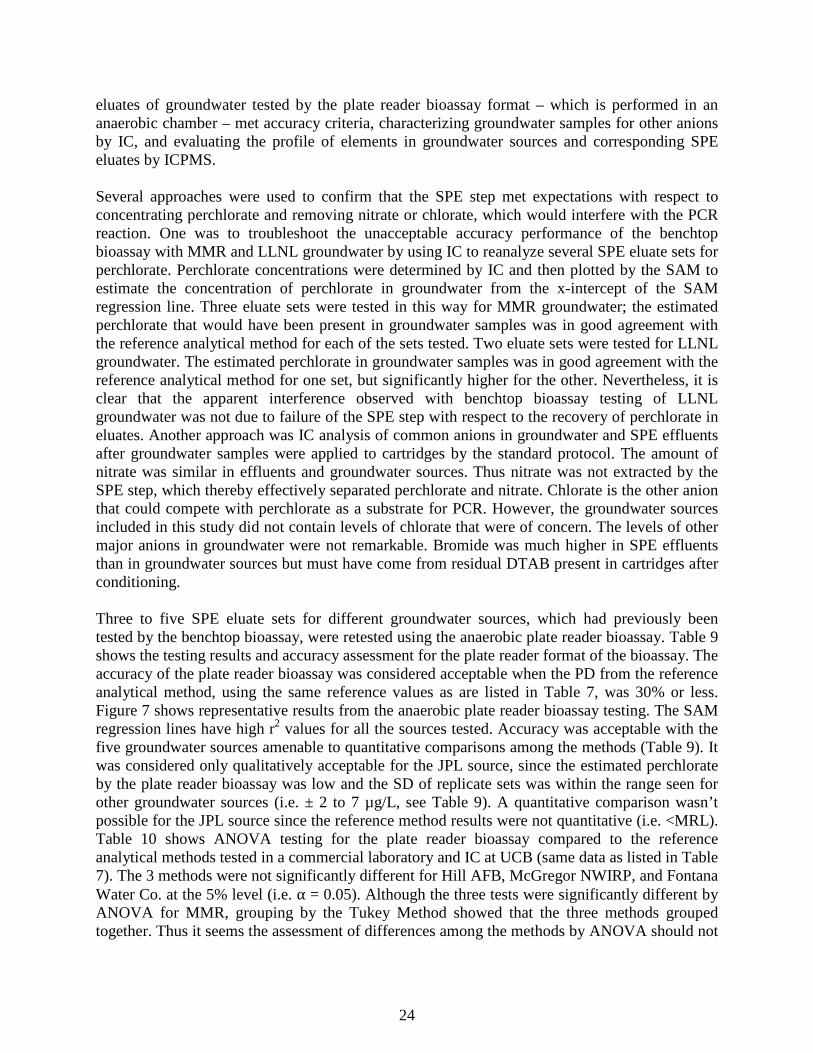
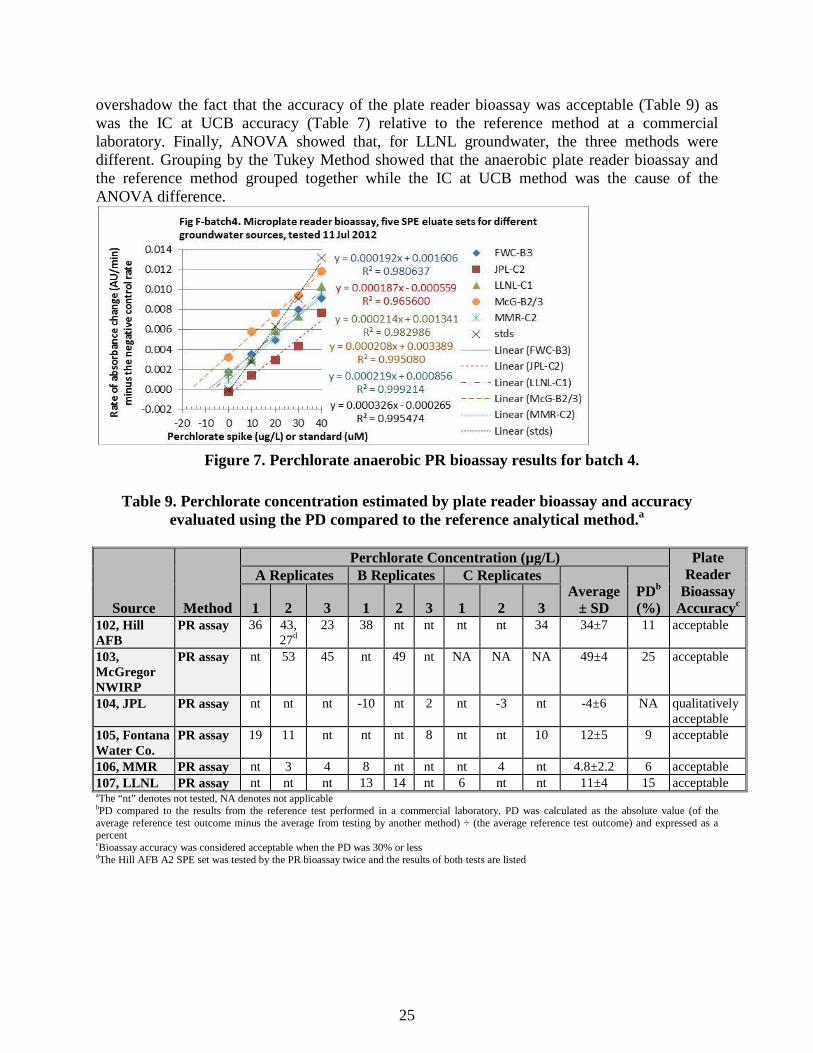
eluates of groundwater tested by the plate reader bioassay format – which is performed in an anaerobic chamber – met accuracy criteria, characterizing groundwater samples for other anions by IC, and evaluating the profile of elements in groundwater sources and corresponding SPE eluates by ICPMS. Several approaches were used to confirm that the SPE step met expectations with respect to concentrating perchlorate and removing nitrate or chlorate, which would interfere with the PCR reaction. One was to troubleshoot the unacceptable accuracy performance of the benchtop bioassay with MMR and LLNL groundwater by using IC to reanalyze several SPE eluate sets for perchlorate. Perchlorate concentrations were determined by IC and then plotted by the SAM to estimate the concentration of perchlorate in groundwater from the x-intercept of the SAM regression line. Three eluate sets were tested in this way for MMR groundwater; the estimated perchlorate that would have been present in groundwater samples was in good agreement with the reference analytical method for each of the sets tested. Two eluate sets were tested for LLNL groundwater. The estimated perchlorate in groundwater samples was in good agreement with the reference analytical method for one set, but significantly higher for the other. Nevertheless, it is clear that the apparent interference observed with benchtop bioassay testing of LLNL groundwater was not due to failure of the SPE step with respect to the recovery of perchlorate in eluates. Another approach was IC analysis of common anions in groundwater and SPE effluents after groundwater samples were applied to cartridges by the standard protocol. The amount of nitrate was similar in effluents and groundwater sources. Thus nitrate was not extracted by the SPE step, which thereby effectively separated perchlorate and nitrate. Chlorate is the other anion that could compete with perchlorate as a substrate for PCR. However, the groundwater sources included in this study did not contain levels of chlorate that were of concern. The levels of other major anions in groundwater were not remarkable. Bromide was much higher in SPE effluents than in groundwater sources but must have come from residual DTAB present in cartridges after conditioning. Three to five SPE eluate sets for different groundwater sources, which had previously been tested by the benchtop bioassay, were retested using the anaerobic plate reader bioassay. Table 9 shows the testing results and accuracy assessment for the plate reader format of the bioassay. The accuracy of the plate reader bioassay was considered acceptable when the PD from the reference analytical method, using the same reference values as are listed in Table 7, was 30% or less. Figure 7 shows representative results from the anaerobic plate reader bioassay testing. The SAM regression lines have high r2 values for all the sources tested. Accuracy was acceptable with the five groundwater sources amenable to quantitative comparisons among the methods (Table 9). It was considered only qualitatively acceptable for the JPL source, since the estimated perchlorate by the plate reader bioassay was low and the SD of replicate sets was within the range seen for other groundwater sources (i.e. ± 2 to 7 µg/L, see Table 9). A quantitative comparison wasn’t possible for the JPL source since the reference method results were not quantitative (i.e. <MRL). Table 10 shows ANOVA testing for the plate reader bioassay compared to the reference analytical methods tested in a commercial laboratory and IC at UCB (same data as listed in Table 7). The 3 methods were not significantly different for Hill AFB, McGregor NWIRP, and Fontana Water Co. at the 5% level (i.e. α = 0.05). Although the three tests were significantly different by ANOVA for MMR, grouping by the Tukey Method showed that the three methods grouped together. Thus it seems the assessment of differences among the methods by ANOVA should not
25
overshadow the fact that the accuracy of the plate reader bioassay was acceptable (Table 9) as was the IC at UCB accuracy (Table 7) relative to the reference method at a commercial laboratory. Finally, ANOVA showed that, for LLNL groundwater, the three methods were different. Grouping by the Tukey Method showed that the anaerobic plate reader bioassay and the reference method grouped together while the IC at UCB method was the cause of the ANOVA difference.
Figure 7. Perchlorate anaerobic PR bioassay results for batch 4.
Table 9. Perchlorate concentration estimated by plate reader bioassay and accuracy
evaluated using the PD compared to the reference analytical method.a
Source Method
Perchlorate Concentration (µg/L) Plate Reader
Bioassay Accuracyc
A Replicates B Replicates C Replicates Average
± SD PDb (%) 1 2 3 1 2 3 1 2 3
102, Hill AFB
PR assay 36 43, 27d
23 38 nt nt nt nt 34 34±7 11 acceptable
103, McGregor NWIRP
PR assay nt 53 45 nt 49 nt NA NA NA 49±4 25 acceptable
104, JPL PR assay nt nt nt -10 nt 2 nt -3 nt -4±6 NA qualitatively acceptable
105, Fontana Water Co.
PR assay 19 11 nt nt nt 8 nt nt 10 12±5 9 acceptable
106, MMR PR assay nt 3 4 8 nt nt nt 4 nt 4.8±2.2 6 acceptable 107, LLNL PR assay nt nt nt 13 14 nt 6 nt nt 11±4 15 acceptable aThe “nt” denotes not tested, NA denotes not applicable bPD compared to the results from the reference test performed in a commercial laboratory. PD was calculated as the absolute value (of the average reference test outcome minus the average from testing by another method) ÷ (the average reference test outcome) and expressed as a percent cBioassay accuracy was considered acceptable when the PD was 30% or less dThe Hill AFB A2 SPE set was tested by the PR bioassay twice and the results of both tests are listed
26
Table 10. ANOVA for reference method performed by a commercial laboratory, IC at UCB, and the bioassay, and grouping using the Tukey Method.
Source
Average Perchlorate Results ± SD (µg/L)
F ANOVA P-Value
Tests are Significantly
Different (α = 0.05) Reference Test IC at UCB PR Bioassay
102, Hill AFB 38.00 ±4.950 35.33 ±0.707 33.500±7.342 1.72 0.203 no 103, McGregor NWIRP
64.83±16.41 56.50±2.07 49.00±4.00 2.29 0.144 no
103, JPL <2 <4 -3.667 ± 6.028 NA NA qualitatively not different
104, Fontana Water Co.
10.511 ±0.744 10.778±0.441 12.000±4.830 0.79 0.467 no
106, MMR 5.122±0.249 6.111±0.333 4.750±2.217 4.04 0.035 yes 107, LLNL 13.333±1.000 15.667±0.500 11.000 ± 4.359 10.50 0.001 yes Grouping by Tukey Methoda 102, Hill AFB NA NA NA NA 103, McGregor NWIRP
NA NA NA NA
103, JPL NA NA NA NA 104, Fontana Water Co.
NA NA NA NA
106, MMR Group 1 Group 1 Group 1 Methods not different (group together) 107, LLNL Group 1 Group 2 Group 1 Plate reader bioassay and reference test
are not different. IC at UCB is the cause of the difference by ANOVA analysis
aGrouping by the Tukey Method is only performed when the p-value from ANOVA analysis is < 0.05 Each batch of anaerobic plate reader bioassays included at least one negative control well (i.e., no perchlorate added to the reaction mixture). The rate of 340 nm absorbance change/minute for the negative control was subtracted from the rate of NADH oxidation for all the other reaction mixtures. For some batches, perchlorate standards were also tested at 10, 20, 30, and 40 µM concentrations. Negative and positive controls were tested in enzyme buffer as previously described for benchtop bioassay controls. Regression lines for plots of the rate of reaction vs. concentration for perchlorate standards intersected the x-axis close to the origin and showed low x-intercept errors (i.e., ± 0.64 µM, n = 3). Results with the anaerobic plate reader bioassay support the idea that this format of the bioassay could be an effective laboratory screening test for perchlorate.2 A possible reservation regarding this suggestion is that generally the plate reader bioassay testing was done after considerable time had passed. Although perchlorate is stable in the environment, ageing of SPE eluates may have made them more amenable to analysis by bioassay methods. It is interesting to note, however, that Hill AFB SPE eluate sets were analyzed on two occasions. The first preceded benchtop bioassay testing, and the second was 11 months later. The average estimate of perchlorate concentration was similar for the two batches, suggesting that for Hill SPE eluate sets, ageing had little impact on results obtained by the anaerobic plate reader bioassay. Additional testing would be needed to resolve this point. Groundwater sources and freshly prepared SPE eluates were analyzed by ICPMS with respect to 57 elements. Bromine was present at much higher amounts in SPE eluates than in corresponding groundwater sources or in the alkaline MOPS-NaCl solution used to elute perchlorate from
27
cartridges. The likely source of this bromine was residual bromide from the DTAB used to condition and rinse SPE cartridges. Eight other elements had a high variation in concentration among different SPE eluates, and were therefore considered possible candidates for impacting bioassay performance. Of particular interest were elements that had different levels when Fontana Water Co. and LLNL SPE eluates were compared, since benchtop bioassay accuracy results were acceptable for Fontana Water Co. but showed interference for LLNL (Table 7). Three elements were higher in groundwater compared to their levels in SPE eluates (magnesium, calcium, and iron), whereas five were concentrated in SPE eluates relative to their levels in groundwater (chromium, cobalt, copper, molybdenum, and uranium). Among these five, only uranium had a striking difference in the concentration observed for Fontana Water Co. (i.e., 1 µM) and LLNL (i.e., 7.5 µM). ICPMS analysis to quantitate uranium was also done on some of the SPE eluate sets from LLNL, Fontana Water Co., and Hill AFB that had previously been tested by the benchtop bioassay. This analysis confirmed that the amount of uranium present in eluates analyzed by bioassay testing was similar to that seen in freshly prepared SPE eluates. The average µM amount of uranium present in these eluates was 8.7, 1.2, and 3.1, respectively, for LLNL, Fontana Water Co., and Hill AFB SPE eluates. Evidently, uranium was effectively extracted from groundwater by SPE cartridges and eluted by alkaline MOPS-NaCl. Finding that uranium is concentrated in SPE eluates is not an unexpected observation for the SPE processing step since removal of uranium from groundwater by ion exchange processes is a well described phenomenon.23 The eight elements with the highest variability in SPE eluates were further evaluated by non-metric MDS. Results for uranium are shown in Figure 8. The MDS analysis showed that overall patterns for all the elements were distinct for groundwater and SPE eluates: groundwater sources grouped on the left-hand side of the plot, and are identified with the prefix “G,” whereas SPE eluates grouped on the right-hand side of the plot, and are identified with the suffix “-DI.” Superimposed on the MDS plot in Figure 8 are circles representing uranium concentrations (µg/L) according to the scale in the legend at the left of the figure. Eluates prepared from LLNL groundwater had the highest uranium concentration followed by Hill AFB and JPL eluates. The ICPMS data seemed consistent with the possibility that the presence of fairly high levels of uranium in LLNL SPE eluates might have impacted PCR activity in the benchtop bioassay testing. Uranium was tested for possible interference with PCR activity by adding it directly to benchtop bioassay reaction mixtures. However, no interference was observed when various amounts of uranium (0, 1, 2, 3, 5, 8, or 10 µM) were present in reaction mixtures in addition to the enzyme substrate, perchlorate (40 µM).
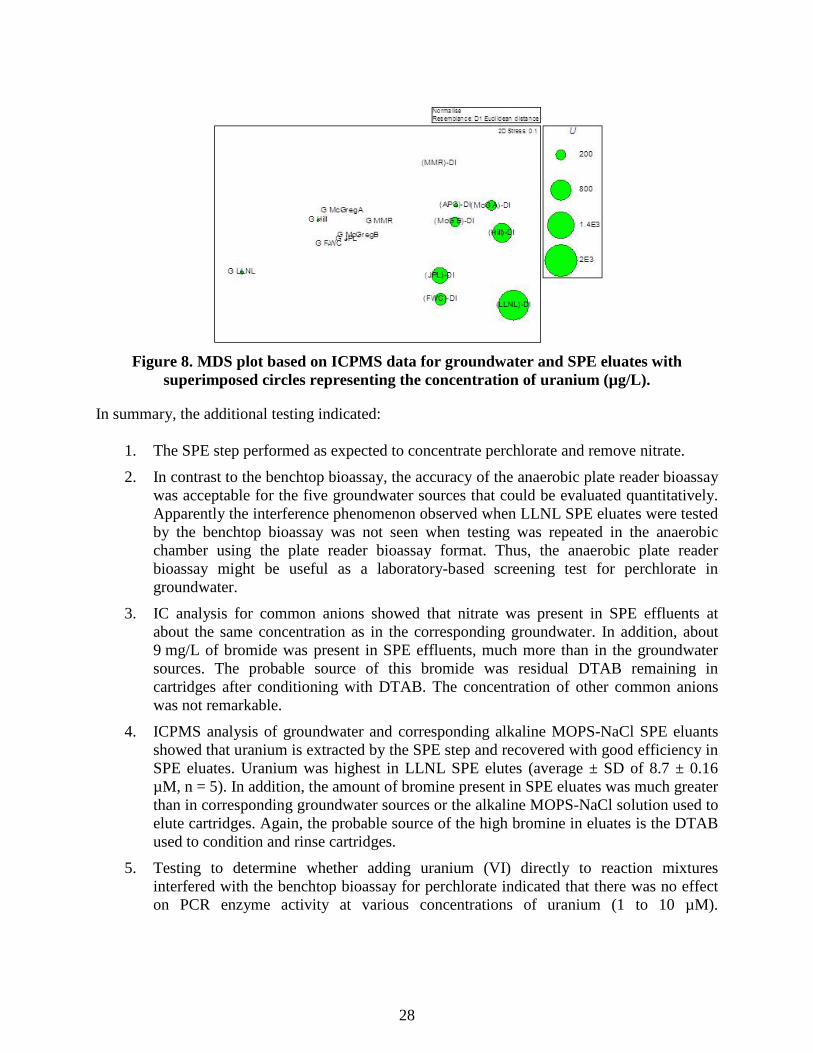
28
Figure 8. MDS plot based on ICPMS data for groundwater and SPE eluates with
superimposed circles representing the concentration of uranium (µg/L).
In summary, the additional testing indicated:
1. The SPE step performed as expected to concentrate perchlorate and remove nitrate.
2. In contrast to the benchtop bioassay, the accuracy of the anaerobic plate reader bioassay was acceptable for the five groundwater sources that could be evaluated quantitatively. Apparently the interference phenomenon observed when LLNL SPE eluates were tested by the benchtop bioassay was not seen when testing was repeated in the anaerobic chamber using the plate reader bioassay format. Thus, the anaerobic plate reader bioassay might be useful as a laboratory-based screening test for perchlorate in groundwater.
3. IC analysis for common anions showed that nitrate was present in SPE effluents at about the same concentration as in the corresponding groundwater. In addition, about 9 mg/L of bromide was present in SPE effluents, much more than in the groundwater sources. The probable source of this bromide was residual DTAB remaining in cartridges after conditioning with DTAB. The concentration of other common anions was not remarkable.
4. ICPMS analysis of groundwater and corresponding alkaline MOPS-NaCl SPE eluants showed that uranium is extracted by the SPE step and recovered with good efficiency in SPE eluates. Uranium was highest in LLNL SPE elutes (average ± SD of 8.7 ± 0.16 µM, n = 5). In addition, the amount of bromine present in SPE eluates was much greater than in corresponding groundwater sources or the alkaline MOPS-NaCl solution used to elute cartridges. Again, the probable source of the high bromine in eluates is the DTAB used to condition and rinse cartridges.
5. Testing to determine whether adding uranium (VI) directly to reaction mixtures interfered with the benchtop bioassay for perchlorate indicated that there was no effect on PCR enzyme activity at various concentrations of uranium (1 to 10 µM).
29
6.0 PERFORMANCE ASSESSMENT
The benchtop bioassay, at least in its current format, is not suitable as a screening test for perchlorate in groundwater.
6.1 QUANTITATIVE PERFORMANCE OBJECTIVE 1: COMPARE BENCHTOP BIOASSAY RESULTS TO REFERENCE ANALYTICAL METHOD RESULTS
The metric used to evaluate the accuracy of the bioassay method was the PD between benchtop bioassay results and the reference method performed in a commercial laboratory. By the PD comparison, the accuracy of the benchtop bioassay was acceptable for Fontana Water Co. and borderline for Hill AFB (Table 7). Results with JPL couldn’t be compared quantitatively since the perchlorate from this source was lower than the MRL for the reference method. The benchtop bioassay test failed for McGregor NWIRP, MMR, and LLNL groundwater sources, i.e. the PD values were 325, 429, and 92%, respectively. In most cases, the variation among replicates was greater for the benchtop bioassay than for the other analytical methods. The lack of agreement was pronounced for the McGregor and MMR testing where relative SD (i.e., the SD ÷ average, expressed as a percent) were 118 and 96 %, respectively. However, for LLNL testing there was good agreement among replicate SPE eluate sets, suggesting there may have been interference with the bioassay for this source. ANOVA was performed using the Hill AFB and Fontana Water Co. data (see Table 8). This analysis showed that the three methods were not significantly different for Fontana Water Co. groundwater. However, the benchtop bioassay was significantly different from the analytical methods for the Hill AFB source.
6.2 QUANTITATIVE PERFORMANCE OBJECTIVE 2: COMPARE BENCHTOP BIOASSAY FIELD KIT RESULTS TO SITE’S REFERENCE METHOD RESULTS
Results with the benchtop bioassay did not justify the development of a field kit, hence no testing was done relative to this objective.
6.3 QUALITATIVE PERFORMANCE OBJECTIVE: FIELD KIT EASE OF USE ASSESSMENT
No field kit was developed, hence no assessment was done relative to evaluate this objective.

This page left blank intentionally.

31
7.0 COST ASSESSMENT
A costs assessment for implementing a field screening test for perchlorate based on the benchtop bioassay format is not applicable since the current version of the assay is not suitable for this use.

This page left blank intentionally.
33
8.0 IMPLEMENTATION ISSUES
Implementation issues are not relevant since the current version of the benchtop bioassay is not suitable for use as a screening test for perchlorate in the field. The accuracy of the benchtop bioassay with different groundwater sources was evaluated by comparison to results from the reference analytical method performed in a commercial laboratory. The metric used to determine whether the bioassay level of accuracy was acceptable was the PD. The criterion for acceptable accuracy was a PD of 30% or less. The reference analytical methods used were either LC/MS tested according to EPA Method 6850, or IC tested according to EPA Method 314.0. In general, the benchtop assay performed poorly. While the accuracy was qualitatively acceptable for the JPL source and quantitatively acceptable for the Fontana Water Co. source, it was only borderline for the Hill AFB source and was not acceptable (i.e > 30% PD) for the three other sources: NWIRP McGregor, MMR, and LLNL. There was a pronounced lack of agreement among replicates tested in the benchtop bioassay for NWIRP McGregor and MMR sources. Retesting of the water samples with the bioassay in an anaerobic chamber with a nitrogen/hydrogen atmosphere provided a different outcome. In this instance the accuracy was acceptable for all five groundwater eluates amenable to quantitative testing: Hill AFB, NWIRP McGregor, Fontana Water Co., MMR, and LLNL. Furthermore, ANOVA and Tukey Method statistical analyses indicated that the anaerobic bioassay and the reference method in a commercial laboratory were not significantly different. This finding pointed to oxygen interference in the benchtop assay as the culprit of inaccuracy. In support of this, creating sufficiently reduced conditions in reaction mixtures by the non-enzymatic reaction between NADH and PMS proved unreliable. The non-enzymatic oxidation of NADH in the presence of PMS was unpredictable and far greater for the benchtop format than observed when reactions were performed in the anaerobic chamber. NADH oxidation seen during the preincubation period was even variable and unpredictable among replicate SPE eluate sets and often of much greater magnitude than occurs during perchlorate reduction by perchlorate reductase. While consideration was given to adding reductants in addition to the NADH and PMS system, to more chemically remove oxygen from the SPE eluates prior to bioassay analysis, this approach was dismissed because of possible interference. As a point in case, mixing of the reductant cysteine (an amino acid with a sulfhydral group) with oxidized PMS resulted in the rapid formation of a red degradation product, showing that cysteine wouldn’t be suitable as an additional reductant for the benchtop bioassay. Other reductants such as ascorbic acid, dithiothreitol, or dithionite were not attractive, since these reduce PMS2 directly, and would interfere with the stoichiometry of NADH and perchlorate in the bioassay. Thus the only approach that could be adopted for benchtop bioassay was to extend the preincubation period during which residual oxygen is removed non-enzymatically and amend reaction mixtures with additional NADH prior to addition of extract to start the enzymatic reaction. However, this approach was not sufficiently effective or reproducible as a means of making reaction mixtures suitably reduced prior to PCR addition creating unpredictability in the bioassay for perchlorate determination. Although the bioassay proved reliable, accurate, and reproducible when performed under anoxic conditions in a glove bag, this requirement defeats the original purpose of the bioassay as a robust field applicable tool and as such the bioassay in its current format is not deemed suitable for field deployment.

This page left blank intentionally.
35
9.0 REFERENCES
1. Bender, K.S., M.R. Rice, W.H. Fugate, J.D. Coates, and L.A. Achenbach, 2004. Metabolic primers for the detection of (per)chlorate-reducing bacteria in the environment and phylogenetic analysis of cld gene sequences. Appl Environ Microbiol 70:5651-5658.
2. Heinnickel, M., S.C. Smith, J. Koo, S.M. O’Connor, and J.D. Coates, 2011. Design and
optimization of a colorimetric bioassay for perchlorate in the ppb range. Environ Sci Tech 45:2958-2964.
3. Clark, J.J., 2000. In: Perchlorate in the Environment, Urbansky ET (ed.) Kluwer
Academic/Plenum, New York. 4. Coates, J.D., and L.A. Achenbach, 2004. Microbial perchlorate reduction: rocket-fuelled
metabolism. Nature Rev. Microbiol. 2:569-580. 5. Coates, J.D., and A. Jackson, 2008. Principles of perchlorate treatment. In: In Situ
Bioremediation of Perchlorate in Groundwater. CH Ward and HF Stroo. Norwell, MA, Springer.
6. Coates, J.D., U. Michaelidou, S.M. O’Connor, R.A. Bruce, and L.A. Achenbach, 2000.
The diverse microbiology of (per)chlorate reduction. In: Urbansky ED. Perchlorate in the Environment. Kluwer Academic/Plenum, New York, 257-270.
7. Collette, T.W., T.L. Williams, E.T. Urbansky, M.L. Magnuson, G.N. Herbert, and S.H.
Strauss, 2003. Analysis of hydroponic fertilizer matrixes for perchlorate: comparison of analytical techniques. Analyst 128:88-97.
8. Ericksen, G.E., 1983. The Chilean nitrate deposits. American Scientist 71:366-374. 9. Jackson, W.A. et al., 2005. Perchlorate accumulation in forage and edible vegetation. J.
Agric. Food Chem. 53:369-373. 10. Kengen, S.W., G.B. Rikken, W.R. Hagen, C.G. van Ginkel, and A.J. Stams, 1999.
Purification and characterization of (per)chlorate reductase from the chlorate-respiring strain GR-1. J Bacteriol. 181:6706-6711.
11. Kirk, A.B., E.E. Smith, K. Tian, T.A. Anderson, and P.K. Dasgupta, 2003. Perchlorate in
milk. Environmental Science & Technology37:4979-4981. 12. Motzer, W.E., 1998. Perchlorate: problems, detection, and solutions. Environmental
Forensics 2:301-311. 13. Renner, R., 2009. EPA perchlorate decision flawed, say advisers. Environmental Science
& Technology 43:553-334.
36
14. Skoog, D.A., F.J. Holler, and T.A. Nieman, 1998. Principles of Instrumental Analysis. Brooks/Cole Thomson Learning, United States of America.
15. Thorne, P.G., 2004. Field screening method for perchlorate in water and soil.
ERDC/CRREL TR-04-8. 16. Urbansky, E.T., and S.K. Brown, 2003. Perchlorate retention and mobility in soils. J.
Environmental Monitoring 5:455-462. 17. U.S. Environmental Protection Agency (EPA), 1998. Drinking water candidate
contaminant list. Washington DC, US Environmental Protection Agency. 18. Wolff, J., 1998. Perchlorate and the thyroid gland. Pharmacological Reviews 50:89-105. 19. Coates, J.D., M. Heinnickel, and L.A. Achenbach, 2010. An enzymatic bioassay for
perchlorate. SERDP-ER-1530-FR. Accession number ADA539494. 20. Environmental Data Quality Workgroup, 2007. DoD Perchlorate Handbook. Washington
D.C., U.S. Department of Defense. 21. Magnuson, M.L., E.T. Urbansky, and C.A. Kelty, 2000. Determination of perchlorate at
trace levels in drinking water by ion-pair extraction with electrospray ionization mass spectrometry. Anal Chem 72:25-29.
22. Ott, R.L., and M. Longnecker, 2001, An Introduction to Statistical Methods and Data
Analysis, 5th edn. Duxbury, Thomson Learning, United States of America, 23. Patterson, J., R. Parette, F.S. Cannon, C. Lutes, and T. Henderson, 2011. Competition of
anions with perchlorate for exchange sites on cationic surfactant-tailored GAC. Environ. Eng. Sci. 28:249-256.
24. EPA, 2009. Revised Assessment Guidance for Perchlorate.
http://www.epa.gov/fedfac/documents/perchlorate_memo_01-08-09.pdf Accessed 14 May 2013.
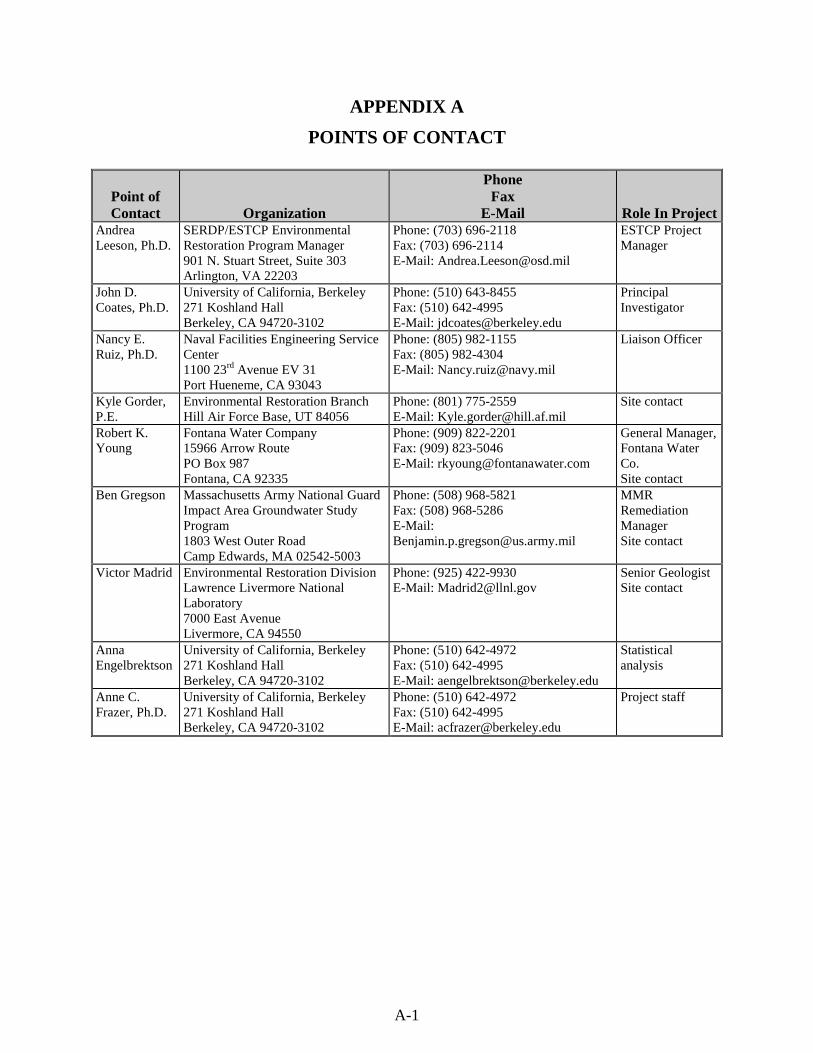
A-1
APPENDIX A
POINTS OF CONTACT
Point of Contact Organization
Phone Fax
E-Mail Role In Project Andrea Leeson, Ph.D.
SERDP/ESTCP Environmental Restoration Program Manager 901 N. Stuart Street, Suite 303 Arlington, VA 22203
Phone: (703) 696-2118 Fax: (703) 696-2114 E-Mail: [email protected]
ESTCP Project Manager
John D. Coates, Ph.D.
University of California, Berkeley 271 Koshland Hall Berkeley, CA 94720-3102
Phone: (510) 643-8455 Fax: (510) 642-4995 E-Mail: [email protected]
Principal Investigator
Nancy E. Ruiz, Ph.D.
Naval Facilities Engineering Service Center 1100 23rd Avenue EV 31 Port Hueneme, CA 93043
Phone: (805) 982-1155 Fax: (805) 982-4304 E-Mail: [email protected]
Liaison Officer
Kyle Gorder, P.E.
Environmental Restoration Branch Hill Air Force Base, UT 84056
Phone: (801) 775-2559 E-Mail: [email protected]
Site contact
Robert K. Young
Fontana Water Company 15966 Arrow Route PO Box 987 Fontana, CA 92335
Phone: (909) 822-2201 Fax: (909) 823-5046 E-Mail: [email protected]
General Manager, Fontana Water Co. Site contact
Ben Gregson Massachusetts Army National Guard Impact Area Groundwater Study Program 1803 West Outer Road Camp Edwards, MA 02542-5003
Phone: (508) 968-5821 Fax: (508) 968-5286 E-Mail: [email protected]
MMR Remediation Manager Site contact
Victor Madrid Environmental Restoration Division Lawrence Livermore National Laboratory 7000 East Avenue Livermore, CA 94550
Phone: (925) 422-9930 E-Mail: [email protected]
Senior Geologist Site contact
Anna Engelbrektson
University of California, Berkeley 271 Koshland Hall Berkeley, CA 94720-3102
Phone: (510) 642-4972 Fax: (510) 642-4995 E-Mail: [email protected]
Statistical analysis
Anne C. Frazer, Ph.D.
University of California, Berkeley 271 Koshland Hall Berkeley, CA 94720-3102
Phone: (510) 642-4972 Fax: (510) 642-4995 E-Mail: [email protected]
Project staff

This page left blank intentionally.