Embed Size (px)
Citation preview

Equity Trading in the 21st Century: An Update
06.21.2013
James J. Angel Associate Professor
McDonough School of Business
Georgetown University
Lawrence E. Harris Fred V. Keenan Chair in Finance
Professor of Finance and
Business Economics
Marshall School of Business
University of Southern California
Chester S. Spatt Pamela R. and Kenneth B. Dunn
Professor of Finance
Tepper School of Business
Carnegie Mellon University

Abstract
This report updates our previous study, “Equity Trading in the 21st Century,” which presented results about
U.S. equity market quality.1 Despite many complaints in the national media, various measures of market
quality indicate that U.S. markets continue to be very healthy. Trade transaction cost estimates have stayed
low and market depth and execution speeds remain high. New findings that measure the total transaction
cost of executing very large block orders indicate that improvements in market quality also have benefited
large institutional traders. While still high, both the number of quotes per trade and per minute have declined
substantially from their peaks in 2008. Intraday volatility is below the levels of the pre-electronic 1990s.
Although market quality is quite good, it could be enhanced. We discuss some current concerns about
maker/taker pricing, dark pools, high frequency trading, tick sizes, designated dealers, transaction taxes,
IPOs, and market stability.
1 This research project was supported by funding from Knight Capital Group, which also provided under our direction some of the data presented in this study. This article presents our analyses and opinions only and does not necessarily represent the opinions of the sponsor of this project. The authors retained full editorial control over the content and conclusions of this report. The conclusions and opinions expressed in this document are those of the authors and do not necessarily represent those of Knight Capital Group or its employees.

Equity Trading in the 21st Century: An Update
06.21.2013
3
1. Introduction
In 2010, we circulated “Equity Trading in the 21st Century,” a paper that documented how market quality had
changed with the growth of electronic trading. Our empirical results showed that traditional measures of market
quality such as execution speed, bid-ask spreads, and transactions costs all had improved dramatically over time.
The paper also included discussions about several important issues in equity market structure. In particular, we
expressed concerns about “maker/taker” pricing, direct access, and front-running of orders in correlated issues.
We also concluded that risk control procedures were inadequate to contain the damage that could be caused
by misfiring algorithms.
Several interesting events have occurred since we disseminated our original study. Less than three months later,
the “Flash Crash” occurred on May 6, 2010, in which the Dow Jones Industrial Average fell more than five percent
in a few minutes and then rebounded. On March 23, 2012, BATS withdrew its IPO after technical issues derailed
its trading. On May 18, 2012, technical issues also marred the Facebook IPO. And on August 1, 2012, a technology
issue at Knight Capital Group resulted in losses of over $400 million in less than 30 minutes. Partly as a result of
these events, many investors, practitioners, and regulators remain concerned about the complexity of today’s
market structures, and in particular about the impact of high frequency trading on markets.
This report updates our empirical results with more recent data, and comments on recent concerns about equity
market structure. Our new results appear in the next section. Our current remarks about equity market structure
appear in Section 3. They focus on maker/taker pricing, dark pools, high frequency trading, tick sizes, designated
dealers, transaction taxes, IPOs, and market stability.
A glossary of terms used appears at the end of this report.
1.1 Summary of Major Results
In general, most measures of market quality have remained fairly stable and at high levels over the last three
years. Quotation activity has fallen sharply from its recent peaks, but remains surprisingly high to those who are
unaware of how electronic traders operate. Overall, our results show that electronic trading has substantially
improved markets and that investors have continued to enjoy those improvements over the last three years since
we first documented these results.

Equity Trading in the 21st Century: An Update
06.21.2013
4
2. An Empirical Profile of Recent Changes in Market Quality
This section updates the empirical results from our earlier study.
2.1 Trading volumes have fallen from their peaks.
Average Daily U.S. Equity Trading Volumes
Source: Barclays Capital Equity Research
Reported U.S. equity trading volume tripled in the first decade of the century, but fell over the last three years
from its peak. Several factors produced the growth. In the early part of the decade, the direct costs of trading
fell substantially so that strategies that would have been non-economical at higher trading costs are now feasible.
The increase in derivative products also increased trading volume as arbitrage activity keeps derivatives prices
linked to prices in the underlying cash markets. The growth in the importance of exchange-traded funds (ETFs)
also contributed to the increase in trading volume. Finally, the growth of high frequency trading probably
increased volume as electronic dealers often trade with one another.
Volume decreased following the 2007-2008 financial crisis, in large part due to the reduced investor confidence
that often accompanies substantial market downturns. Also, many firms that implemented high frequency
trading strategies did not succeed. Their departures from the industry since 2008 have reduced aggregate
trading volume.

Equity Trading in the 21st Century: An Update
06.21.2013
5
2.2 Bid-Ask spreads remain small.
Quoted Bid-Ask Spreads
Source: NYSE TAQ data
This chart displays the quoted bid-ask spreads for securities traded in the U.S. National Market System from
2003 through 2012. The median quoted bid-ask spread was calculated for each stock and percentiles of the
cross-sectional distribution of these median quoted spreads are displayed here. The quoted spreads for the
largest stocks remain at one cent. For smaller stocks, spreads jumped during the financial crisis, but since
have returned to historic lows.

Equity Trading in the 21st Century: An Update
06.21.2013
6
2.3 Net spreads have increased relative to quoted spreads.
Ratio of Net to Quoted Bid-Ask Spreads
Source: NYSE TAQ data
Access fees increase the costs of trading marketable orders and thus increase the actual spreads paid by market
order traders and their brokers. In particular, a 0.3 cent per share access fee increases the net price that buyers
pay by that amount and likewise decreases the net price received by sellers. Accordingly, the net spread is 0.6
cents wider than the quoted spread. The above figure plots the ratio of net to quoted spreads from 2003 to 2012
based on the data presented in the previous figure on the assumption that access fees are 0.3 cents per share.
Since the bulk of U.S. equity market volume occurs in the most active stocks which have the smallest spreads,
the access fee is a significant fraction of the cost of trading. Access fees thus have a major impact on the order
submission and routing decisions made by market participants.

Equity Trading in the 21st Century: An Update
06.21.2013
7
2.4 Effective spreads also remain small.
Effective Bid-Ask Spreads from Rule 605 Reports
Source: Public Rule 605 Reports from Thomson, Market orders 100-9,999 shares
This chart displays average effective bid-ask spreads obtained from Rule 605 reports for eligible market orders.
The effective bid-ask spread estimates spreads that investors actually pay. It is twice the difference between
the actual trade price and the midpoint of the quoted National Best Bid or Offer (“NBBO”) at the time of order
receipt. The general downward trend in spreads was interrupted by an upward spike during the recent financial
crisis. Care should be used in interpreting differences across exchanges because the stocks that the two exchanges
list differ in capitalizations, price levels, volumes, and volatilities—variables that all affect bid-ask spreads.

Equity Trading in the 21st Century: An Update
06.21.2013
8
2.5 Market depth remains high for the typical stock.
Displayed Market Depth (Bid+Ask) Median Stock
Source: NYSE TAQ Data
This chart displays the quoted depth in dollars across all exchanges for the median stock traded in the
U.S. National Market System. We took the number of shares displayed at both the bid and offer prices for all
exchanges multiplied by the share price to get dollar depth. The displayed depth for the median stock rose after
the financial crisis and then leveled off. However, displayed depth is still much higher than in the early part of the
first decade of the century. Note that the entire time period displayed is post decimalization.

Equity Trading in the 21st Century: An Update
06.21.2013
9
2.6 Market depth has increased for the smallest stocks as well.
Displayed Market Depth (Bid+Ask) Smallest 5th Percentile
Source: NYSE TAQ data
Although much concern about the impact of market structure on the smallest stocks has been expressed,
displayed market depth for smaller stocks is still roughly twice what it was a decade ago. This chart plots
the dollar depth at the 5th percentile of the distribution of displayed market depths across all stocks in the
U.S. National Market System.

Equity Trading in the 21st Century: An Update
06.21.2013
10
2.7 Market depth remains high for large stocks.
Displayed Market Depth (Bid+Ask) Largest Stocks (95th Percentile)
Source: NYSE TAQ database
The dollar depth displayed to market participants for large stocks is also roughly twice what it was a decade ago.
This chart plots the dollar depth at the 95th percentile of the distribution of displayed market depths across all
stocks in the U.S. National Market System.

Equity Trading in the 21st Century: An Update
06.21.2013
11
2.8 Market volatility still fluctuates.
VIX (Volatility Index)
Source: Yahoo! Finance
Market volatility continues to fluctuate, although it is down substantially from its highs during the financial crisis.
The VIX index, which measures volatility implied from S&P 500 option prices, was unusually low in 2006 but rose
to record levels in the fall of 2008. It has since returned to more normal levels with a few upward spikes. We
believe that most volatility is driven by macro-economic concerns.

Equity Trading in the 21st Century: An Update
06.21.2013
12
2.9 Intraday volatility has fallen from its peaks and is below 1990s levels.
Intraday Volatility (Excess of Daily High Over Daily Low)
Source: CRSP Database
Intraday volatility of individual stocks remains low. Individual stock volatility is due to market-wide macroeco-
nomic factors and also to firm-specific factors that may be due to variation in fundamental valuation factors or
to trading frictions.
This chart displays the intraday volatility of individual stocks as measured by the high/low range. We express the
daily high price as a percent of the daily low price for each U.S. common stock in the CRSP database and plot the
median, 95th percentile, and 99th percentile of the cross-sectional distribution of this intraday volatility measure.
The median represents the intraday volatility of the typical stock. The median intraday volatility increased during
the financial crisis but has since fallen to levels that are indistinguishable from earlier periods.
One potential criticism is that the modern market structure works well on most days but may create pockets of
instability when stocks are stressed. To examine this, we also examine the 95th and 99th percentiles of intraday
volatility—the volatilities of the stocks that were most volatile during each measurement period. These measures
peaked during both the dot-com bubble and the financial crisis, but have since fallen to levels lower than the
pre-electronic 1990s.

Equity Trading in the 21st Century: An Update
06.21.2013
13
2.10 Adjusted for overall market volatility, intraday volatility shows no clear pattern.
Ratio of Intraday Volatility to VIX
Source: CRSP
Volatility is driven by both macroeconomic as well as other effects. This chart plots the percentiles of the intraday
volatility (daily high price as a fraction of the daily low price) distribution divided by the level of the VIX index.
This ratio controls for market-wide volatility induced by macro-economic uncertainty. No clear pattern emerges.

Equity Trading in the 21st Century: An Update
06.21.2013
14
2.11 Retail commissions remain low.
Average Commission Revenue per Revenue Trade
Source: Barclays Capital Equity Research
This chart displays the average retail commissions charged per trade by three major retail brokers from 2002
through 2012. Retail commissions fell dramatically in the early part of the century as electronic trading took hold,
but have since stabilized. This result indicates that the cost savings resulting from the switch to electronic trading
appear to have been mostly achieved.

Equity Trading in the 21st Century: An Update
06.21.2013
15
2.12 Average trade size remains small.
NYSE-listed Consolidated Average Shares per Trade
Source: NYSE-Euronext, nyx.com
After falling significantly in the early part of the prior decade, the decrease in the average trade size has leveled
off. We interpret this result as a sign that the switch to algorithmic trading, in which buy-side algorithms chop
larger orders into smaller child orders, has mostly run its course.

Equity Trading in the 21st Century: An Update
06.21.2013
16
2.13 Execution times are still fast.
Market Order Execution Speed in Seconds
Source: Rule 605 data from Thomson for all eligible market orders (100-9,999 shares)
The execution speed for small market orders fell dramatically in the first part of the decade due to the
automation of the market and has remained virtually constant. However, execution time for NYSE-listed stocks
spiked up in May 2010 (the month of the Flash Crash) and for NASDAQ-listed stocks in May 2012 (the month
of the Facebook IPO).
The displayed market order execution speeds are averages from the Rule 605 data reported by various market
centers. NASDAQ now reports a round-trip execution time at its data center of 46-95 microseconds depending
on the method used to access the system.2
2 A microsecond is a millionth of a second. The NASDAQ execution time is from http://www.nasdaqtrader.com/Trader.aspx?id=Latencystats, accessed March 7, 2013.

Equity Trading in the 21st Century: An Update
06.21.2013
17
2.14 The increase in quote frequency has moderated.
Quotes per Minute per Security
Source: NYSE TAQ Data
This chart displays the average number of quote updates per minute for each stock in the NYSE TAQ dataset.
The frequency of quote updates increased dramatically in recent years, with a spike occurring during the period
of intense volatility and volume associated with the recent financial crisis. The increasing frequency of quote
updates is consistent with the growth of high frequency trading and the increased use of algorithmic trading
strategies that break large orders into many smaller ones. The reduction in quoting activity is consistent with the
exit from the market of some high frequency traders, an overall decline in volume as well as pricing policies on
some exchanges to charge for excessive quoting.

Equity Trading in the 21st Century: An Update
06.21.2013
18
2.15 Overall quote traffic in the market has moderated.
Total Market Average Quotes per Minute
Source: NYSE TAQ data
Quote traffic, the number of quotes per minute exploded in the last decade. In January 1993, approximately
952 quotes per minute were disseminated for all stocks on all exchanges in the U.S. By January 2001 this
number had increased to 14,319. By January of 2005, the number had increased to 134,108 total quotes per
minute, and by January 2008 to over 1 million quotes per minute. The number peaked in August, 2011 at over
3 million quotes per minute. The number of total quotes per minute has since moderated to between 1 and
1.5 million quotes per minute.

Equity Trading in the 21st Century: An Update
06.21.2013
19
2.16 The Quote-to-Trade Ratio has moderated from recent peaks.
Quote-to-Trade Ratio
Source: NYSE TAQ Data
The implementation of many trading strategies requires frequent order cancellations. For example, an electronic
market maker who wants to update a quote will need to both cancel a previous limit order and post a new limit
order. As trading volume increases and average trade size decreases, many more quote updates occurred, as was
seen during much of the first decade of the century.
The quote-to-trade ratio, measured as the total number of quotations in the NYSE TAQ data divided by the total
number of trades each month, reached a peak of 36.5 in November, 2011 before dropping off to more moderate
levels in 2012. The decrease likely was due to a reduction in volatility and to a reduction in the number of high
frequency traders making markets.

Equity Trading in the 21st Century: An Update
06.21.2013
20
2.17 Market shares at traditional markets fell; Dealer and “dark pool” shares have risen.
NYSE-listed Market Shares
Source: Barclays Capital Equity Research
The market share of the NYSE in NYSE-listed stocks fell dramatically in the last decade subsequent to the adop-
tion of Regulation NMS in 2005. The market share of other exchanges has increased, as well as the market share
of off-exchange trading, which is listed here as “other,” and which primarily includes trades reported through the
NASDAQ and NYSE Trade Reporting Facilities. This off-exchange trading includes both internalization by dealers
and trading on dark pools. Dark pool market share is displayed in more detail below.

Equity Trading in the 21st Century: An Update
06.21.2013
21
2.18 NASDAQ’s share of NASDAQ-listed volume has fallen while off-exchange volume has increased.
NASDAQ-listed Market Shares
Source: Barclays Capital Equity Research
NASDAQ market share fell in recent years as other competitors gained ground. The old NASDAQ did not actually
match trades, but relied on a dealer network for order execution. NASDAQ later added its own matching engine,
Super Montage, and acquired ECNs such as INET and Island. Off-exchange trading, which includes trades inter-
nalized by broker-dealers as well as trades arranged in dark pools, also increased in NASDAQ-listed stocks.

Equity Trading in the 21st Century: An Update
06.21.2013
22
2.19 Dark pool market share has risen and leveled off.
Dark Pool Market Shares
Source: Rosenblatt Securities
The share of trading reported in dark pools has risen over time. These data measure the market share of broker-
run “dark pools” that match customer order flow but do not display their quotes to the outside world. Note that
the approximate 14% dark pool market share in 2012 is much smaller than the approximate 40% market share of
total off-exchange trading displayed in previous graphs. The difference stems from the internalization of order
flow by brokerage firms that take the other side of their customers’ orders. The increase in market share in recent
years may reflect a decline in high frequency trading on the “lit” exchanges, which would cause the dark pool
market share to be larger even if the dark pool volume were unchanged.
Equity Trading in the 21st Century: An Update
06.21.2013
23
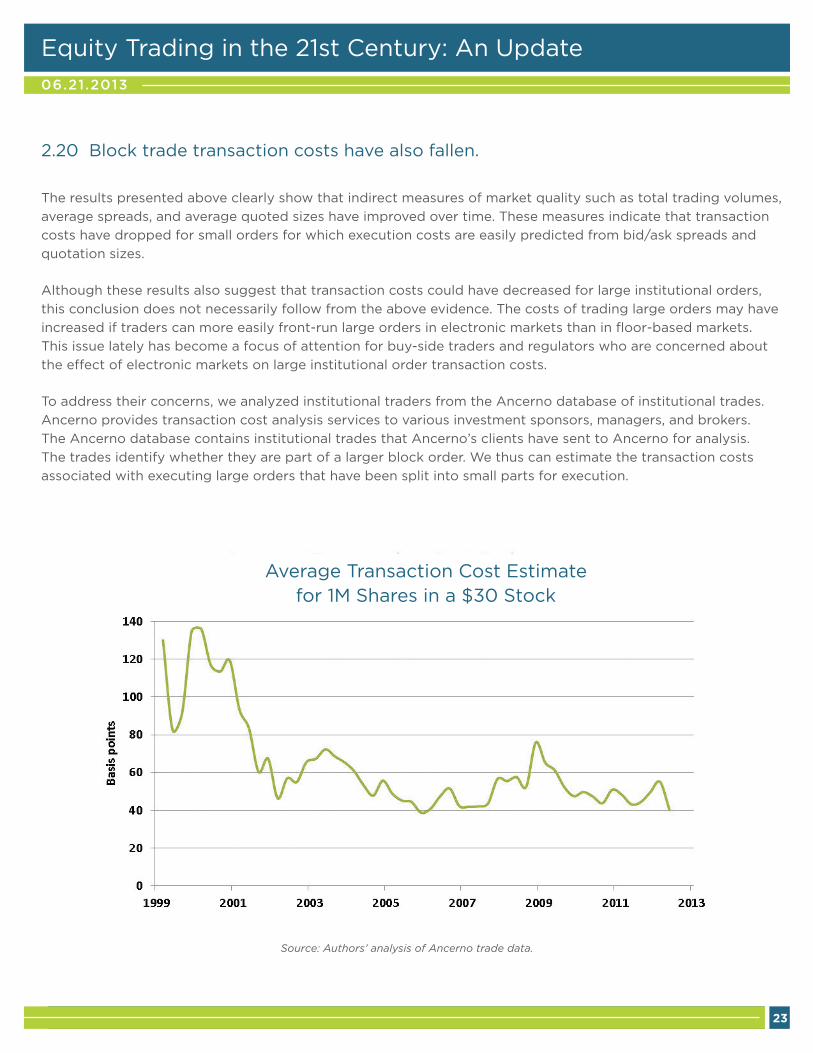
2.20 Block trade transaction costs have also fallen.
Average Transaction Cost Estimate for 1M Shares in a $30 Stock
Source: Authors’ analysis of Ancerno trade data.
The results presented above clearly show that indirect measures of market quality such as total trading volumes,
average spreads, and average quoted sizes have improved over time. These measures indicate that transaction
costs have dropped for small orders for which execution costs are easily predicted from bid/ask spreads and
quotation sizes.
Although these results also suggest that transaction costs could have decreased for large institutional orders,
this conclusion does not necessarily follow from the above evidence. The costs of trading large orders may have
increased if traders can more easily front-run large orders in electronic markets than in floor-based markets.
This issue lately has become a focus of attention for buy-side traders and regulators who are concerned about
the effect of electronic markets on large institutional order transaction costs.
To address their concerns, we analyzed institutional traders from the Ancerno database of institutional trades.
Ancerno provides transaction cost analysis services to various investment sponsors, managers, and brokers.
The Ancerno database contains institutional trades that Ancerno’s clients have sent to Ancerno for analysis.
The trades identify whether they are part of a larger block order. We thus can estimate the transaction costs
associated with executing large orders that have been split into small parts for execution.

Equity Trading in the 21st Century: An Update
06.21.2013
24
The above chart plots our estimates of the average costs (in basis points) of executing a 1,000,000 share order
in a 30-dollar stock for each quarter in the Ancerno database between 1999 Q1 and 2012 Q2. We obtained these
cost estimates using the implementation shortfall method (percentage difference between average fill price and
the price that prevailed in the market when the executing broker first received the order).3 These estimates do
not include brokerage commissions or exchange and SEC fees. The results are based on an analysis of all trades
in the Ancerno database, but the largest trades are given the greatest weight. In each quarter, between 9,000
and 23,000 orders appear in the database with an aggregate dollar value of more than $10M. These large trades
typically were filled over two to four trading days and often over longer periods.
These results show that the average costs of executing large institutional orders have fallen substantially over
time as electronic trading has grown. Although large institutional traders may still suffer from front-running, these
results suggest that on net, the effects of electronic trading on large order executions have been quite positive.
We believe that the reduction in large order transaction costs are mainly due to the development of electronic
algorithms for executing large orders, to the development of dark pool order matching systems that protect large
traders from front-running while they search for liquidity, and to a general increase in market liquidity due to the
growth of electronic trading which has greatly reduced the physical and administrative costs of trading.
In passing, we also note that institutional brokerage commissions have also dropped substantially over this
period. They once ranged between 3 and 5 cents per share, depending on whether they included soft-dollar
benefits. They now range between 1 and 3 cents per share.
3 We analyzed orders in the Ancerno database for which the average fill price was greater than $1 and less than $1,000. For each such buy order, we estimate the transaction cost of filling the order as the percentage difference (expressed in basis points) between the average fill price for the order and the price that prevailed in the market when the executing broker first received the order. We likewise estimate the transaction cost of filling a sell order as the negative of this percentage difference.
When the market is rising, the implementation shortfall method overestimates transaction costs for buy orders and underestimates transaction costs for sell orders. The method likewise overestimates transaction costs for sell orders and underestimates transaction costs for buy orders when the market is falling. Fortunately, the bias is symmetric for the two order types. We therefore can obtain an unbiased transaction cost estimate by averaging separate estimates of average transaction costs for buy and sell orders.
For all buy orders in a given quarter, we regress the implementation shortfall transaction cost estimate on the log price, log order size (in shares), and squares and cross products of these two variables to characterize how transaction costs depend on security price levels and order sizes. We likewise estimate a regression for all sell orders in the given quarter.
To ensure that our results primarily reflect the costs of filling large orders, we estimate these regressions by weighting each order by its aggregate dollar value. The weighted-average dollar value of the orders in the Ancerno database is about $30 million. The typical large order was filled over three trading days.
The regression results (not shown) indicate that transaction costs decrease with increasing prices and increase with increasing order sizes. The latter result is obvious and expected. The former result is due to the fact that large firms (which generally trade in very liquid markets) tend to have high prices. We estimate the average transaction cost of a 1,000,000 share purchase in a 30-dollar stock from the predicted value of the purchase cost regression for these values. We likewise estimate the average transaction cost of filling a corresponding sell order. This figure (2.19) plots the average of these two estimates.

Equity Trading in the 21st Century: An Update
06.21.2013
25
2.21 U.S. institutional transactions costs remain among the lowest in the world.
Institutional Trading Costs (bps)
Source: Investment Technology Group, Inc., ITG’s Global Cost Review4
ITG, Inc. regularly reviews institutional trading costs around the world. A comparison of the data from 2010 with
the most recent data show that institutional trading costs have generally experienced modest decreases since
2010 and that U.S. large capitalization trading costs remain among the lowest in the world. Note that these
transaction results do not account for differences in the sizes of companies in different markets. Accordingly,
the results are most useful for examining changes in transaction costs within a country and not for comparing
transaction costs across countries.
4 Obtained from http://www.itg.com/wp-content/uploads/2009/12/ITGGlobalCostReview_2010Q2_Final.pdf

Equity Trading in the 21st Century: An Update
06.21.2013
26
2.22 The number of U.S. exchange listed firms continues to fall.
Number of U.S. Exchange-listed Public Companies
Source: CRSP database
This chart displays the number of domestic U.S. companies listed on the NYSE, AMEX, and NASDAQ markets
since 1997. The chart does not include ADRs, ETFs, preferred stocks, units, warrants, or closed-end funds. The
number has dropped steadily from 7,337 in January 1997 to 3,626 at the end of 2012.
Many potential factors may explain this decline. These factors include mergers and acquisitions, additional
regulatory requirements imposed by Sarbanes-Oxley, changes in market structure, the rise of private equity,
and overall market conditions. While some of these factors are benign, a decline in the availability of public
equity capital to public investors may have important implications for investors.
Equity Trading in the 21st Century: An Update
06.21.2013
27
3. Comments on Market Structure
The above results indicate that the improvements in market quality that we documented in 2010 have not
gone away. Instead, markets remain much more liquid than they were before the growth of electronic trading.
Nonetheless, we and many others are concerned about several features of our current markets. This section
discusses these concerns.
3.1 Maker/Taker Pricing
In our original study, we identified several problems associated with maker/taker pricing. Maker/taker pricing
refers to an exchange pricing model in which active market orders that “take” liquidity pay an “access fee” and
the resting limit orders that “make” liquidity receive a rebate when they are executed. Brokers commonly sell their
marketable orders to wholesale dealers (or equivalently internalize marketable orders with their dealing affiliates)
to capture what they can of the bid-ask spread and to avoid access fees. They also commonly send their limit
orders to exchanges for executions to produce liquidity rebate revenues. These order routing decisions allow
brokers to profit from their customers’ order flow, subject of course, to their obligation to provide best execution.
Many brokers first send marketable limit orders to so-called dark pools to see if they can get an order filled
without paying exchange access fees or filled at an improved price for the customer. The practice accounts for
much of the marketable order flow going first into dark markets, and it ensures that limit orders sent to exchang-
es often execute only when they are the last orders standing or when traders who cannot access dark markets
trade with them. In principle, the revenues that brokers obtain from their order flows may be competed away as
they lower their commissions and offer greater service to their customers in an attempt to attract their orders.
Indeed, evidence exists that suggests that competition among brokers to obtain customer order flow has driven a
significant portion of these payments back to retail customers. For example, when payments for order flow were
higher due to wider spreads, some retail brokerages did not charge commissions on marketable orders. However,
we also recognize that these markets for order flow are not perfectly competitive in practice so that
the return of these revenues to customers may be incomplete or unevenly distributed.
We also remain concerned about transparency problems associated with maker/taker pricing. Maker/taker
pricing has artificially narrowed quoted bid/ask spreads as traders compete to receive liquidity rebates and as
they have avoided placing marketable orders to avoid access fees. Since trades only occur when makers meet
takers, bid/ask spreads appear smaller under maker/taker pricing than they really are.
Smaller average spreads are required to encourage traders to take liquidity by placing a marketable order while
paying the access fee and to discourage too many traders from making to obtain liquidity rebates. Under maker/
taker pricing, net spreads are equal to quoted spreads plus the twice the access fee. We believe that maker/
taker pricing has not changed net spreads, but has decreased quoted spreads, hence the transparency problem.
For example, in a 0.3 cent access-fee world where the displayed bid price is $10.00, the true bid price is $9.997

Equity Trading in the 21st Century: An Update
06.21.2013
28
because the marketable sell order will receive not the $10.00 displayed bid price, but the displayed bid price
less the 0.3 cent access fee. Likewise, where the displayed offer price is $10.01, the true offer price is $10.013 as a
marketable buy order has to pay the $10.01 offer plus the 0.3 cent access fee. Thus, the true bid-ask spread is 1.6
cents rather than the quoted one cent, or 60% larger than is apparent.
Perhaps the problem with maker/taker pricing is best understood by recognizing that maker/taking pricing
effectively reprices customer limit orders. Suppose that a customer sends a buy order, limit $10.00 to a broker.
By sending the order to a maker/taker exchange, the broker and the exchange together effectively reprice the
order at $9.997 because if the buy order executes while standing at the exchange, the seller will only receive a
net price of $9.997. However, the broker will still charge the client $10.00 per share for the trade. The exchange
takes 0.1 cent of the 0.3 cent difference as its exchange fee and the broker takes 0.2 cent as the liquidity rebate.
If the customer does not receive the rebate, the broker effectively profits from repricing the customer’s order.
Since we wrote our original study, several exchange operators have established subsidiary exchanges with the
opposite pricing structure in which market orders receive rebates, and the resting limit orders pay a fee when
they are executed. This inverse pricing scheme is sometimes called “taker/maker” pricing. When two exchanges
both have quotes at the same price on the same side of the market, brokers and traders have an incentive to
route market orders to these taker/maker exchanges to receive the rebate. Thus, a limit order at the quote on
such an exchange is likely to be filled before a similar limit order on a traditional maker/taker exchange. This
mechanism thus effectively reduces the effect of the minimum tick size by allowing a limit order trader to step
ahead of the existing quote by only the access fee instead of the full tick.
In effect, the maker who posts a limit order to sell at the inverse exchange is quoting a lower asking price. These
makers invariably are dealers or other proprietary traders because brokers will not route customer limit orders
to inverse exchanges because they would have to pay the exchange maker fees when the orders execute. The
inverse taker/maker fee structure thus is a mechanism that allows dealers and proprietary traders to subvert
the subpenny pricing restrictions in Regulation NMS. This prong of Regulation NMS was designed to reduce the
quote-matching (sometimes known as pennying) that was occurring when traders could quote prices that only
slightly improved the market and thereby step in front of other orders.
The SEC should prohibit the maker/taker and taker/maker pricing models. Prohibition would directly eliminate
the conflict-of-interest, front-running, and transparency problems associated with these pricing schemes. It
would not interfere with the price competition among exchanges for order flow, which should remain free and
unregulated. Instead, it would merely set a common standard for collecting exchange fees.
Alternatively, the SEC could require that brokers pass through to their clients all access fees and liquidity rebates.
This policy would indirectly eliminate marker/taker pricing as most clients probably would not be willing to pay
high exchange access fees. More fundamentally, it would eliminate the conflict-of-interest distortion in the routing
decision. However, this policy would not address the subpenny pricing problem since brokers would still have an
incentive to route marketable orders to the inverse exchanges when dealers and proprietary traders are willing to

Equity Trading in the 21st Century: An Update
06.21.2013
29
trade ahead of orders at another exchange. Also, since exchange rebates are often based on the total volume
a participant brings to the exchange, a rule to pass through all fees and rebates could be hard to implement
because brokerage firms may not know the exact amounts of their rebates until the end of the month or later.
3.2 Limited Display Venues (“Dark Pools”)
So-called dark pools have come under substantial scrutiny recently as market shares have fallen at exchange
markets. As a result, many commentators are concerned that the NBBO spread has widened and become less
informative. Numerous calls for change have been made from practitioners and, of course, from the exchanges
that have lost order flow.
The phrase “dark pool” is not completely accurate as all trades that result from such trading platforms are required
to be reported immediately after a trade. Also, so-called “lit” exchange markets are not totally transparent since
most support hidden order types. We prefer the phrase “limited display venues” as more accurate and less
pejorative than the phrase “dark pools.”
Two elements distinguish limited display venues from the “lit” exchanges. First, the limited display venues do not
display their best bids and offers, which are not incorporated into the NBBO. Second, such venues are regulated
as broker-dealers and not as exchanges, and thus have a much lower regulatory burden than the exchanges. For
example, every change in an exchange’s rules have to be filed and approved by the SEC, while dark pools can
change their rules without prior approval.5 We believe that this disparity should be addressed by lowering the
regulatory burden on exchanges, rather than by increasing the burden on competing trading platforms. The cur-
rent regulatory regime for exchanges was designed to tame the then near-monopoly of the NYSE. As seen in the
data, the NYSE no longer has the near-monopoly it once had, and thus a different regulatory approach is prudent.
Internalization and preferencing of order flow is responsible for the routing of much order flow into the limited
display venues. Fixing the maker/taker problem would reduce the diversion of many of these orders. Many
brokers route orders first to dark pools because they charge lower fees than the exchanges and may be able to
provide better fill prices for their customers.
While we are concerned about the potential degradation of the NBBO, we note that bid-ask spreads continue
to be at historically low levels and displayed depth at very high levels. We also recognize that many traders who
prefer limited-display venues do so because they believe that they obtain better executions in these venues.
Many of these traders are institutional traders who prefer to trade only with other similar institutional or retail
traders and specifically not with hedge funds that they widely believe to be better informed. These institutional
traders would rather not trade than trade on the wrong side of the market with a well-informed trader. Any
moves to reduce trader access to limited display venues may very well have the unintended consequence of
increasing transaction costs for large institutional traders, many of whom predominately manage money for
retail mutual funds and pension beneficiaries.
5 Dark pools are required to give the SEC 20 days advance notice of material changes to their systems.

Equity Trading in the 21st Century: An Update
06.21.2013
30
3.3 Order Anticipation Problems
In the last few years, large institutional traders have become increasingly concerned that their large orders are
being front-run by traders who use sophisticated computerized pattern recognition tools to identify when the
institutional traders are using algorithms to split up their orders. Although our evidence presented above shows
that the costs of filling very large institutional orders has decreased over time, front-running still may be increasing
these costs. Although many institutional traders use hidden orders, limited display venues, and various
randomization schemes to hide their trades, sophisticated traders may still recognize their market presence
from careful analyses of trade reports.
If the SEC wishes to address this problem, it could act to reduce the timeliness of trade size information dissemi-
nated to the public. It could do so by requiring that the exchanges and the consolidated tape only reports trade
prices as they occur, but not also trade sizes. Instead, aggregate trading volume could be reported at regular
intervals ranging from five minutes for the most actively traded stocks to three hours for the least actively traded
stocks. The delayed reporting of trade volumes would substantially frustrate traders who try to predict future
orders from observed trade sizes. However, delayed reporting also would complicate the inferences that traders
make about future market direction, and thus would lead to somewhat wider spreads. A trade-off thus exists
between the public interest in controlling front-running costs versus the public interest in narrow spreads. Large
traders would favor less immediate reporting of trade sizes while small traders would favor immediate reporting
of all sizes.
3.4 The Arms Race in High Frequency Trading
High frequency traders presently are engaged in an arm’s race in which each trader is trying to be faster than
their competitors. Speed is essential to the profitability of their dealing and arbitrage strategies. They want to be
the first to quote at a price or to take a trading opportunity, and they want to cancel their standing orders quickly
when they no longer want to trade at a given price. Accordingly, high frequency traders are spending substantial
sums to trade faster than one another.
These expenditures on speedy technologies increasingly are becoming significant barriers to entry for new high
frequency traders. And those high frequency traders who cannot keep up are dropping out. As a result, high
frequency trading is becoming more concentrated among fewer entities. We expect this trend to continue, and
we are concerned about its long-run implications for transaction costs.
Public investors benefit when high frequency traders offer liquidity when dealing, and move liquidity among
markets by arbitraging markets. But the value of these benefits to public traders is not measured in milliseconds
much less microseconds. The willingness of high frequency traders to provide these benefits likewise does not
depend on the speed with which they trade as long as no electronic trader has a substantial speed advantage
over another. Thus, the markets would not be any worse off if high frequency traders were slowed down in a
manner that largely removes their incentives to overinvest in expensive technologies. However, care must be
taken to make sure that any such speed limits do not impose other and perhaps worse distortions on the market.

Equity Trading in the 21st Century: An Update
06.21.2013
31
It should also be noted that using order submission time as the secondary priority rule, or tie breaker, when two
or more orders are willing to trade at the same price is the primary cause of this arms race for speed. It is by no
means clear that time priority is the optimal way to break such ties. While simple to implement in electronic
systems, time priority has rarely been used in a pure form. Indeed, most markets have numerous exceptions to
time priority.
To this end, one of us (Harris) has proposed that all instructions sent to markets be delayed by a random period
of time ranging from 0 to 10 milliseconds before they are processed, and we all agree that this proposal merits
further consideration. Such a change could greatly reduce the incentives to engage in the speed arms race.
We also note that some commentators have called for an increasing role for time priority, and calling for different
market centers to yield time priority to other market centers that displayed earlier at the same price. Increasing
the role of time priority, through “trade-at” or similar rules, will merely increase the arms race for speed as traders
try to be first at a new price.
3.5 Minimum Resting Times
In response to concerns about high frequency trading, some commentators have suggested that quotes stand for
a minimum period. We do not support such policies. These minimum resting time proposals would not reduce the
incentives to engage in the high speed arms race to quote or take quickly. Increasing the time to cancel orders
would force liquidity providers to offer liquidity when they otherwise would not want to do so, often when they
are in the process of updating their quotes. Traders would still spend enormous resources so that they could
receive and react to information before other traders, and race to pick off liquidity providers who are trapped by
a minimum resting time when they would otherwise be updating their quotes. This would cause spreads to widen
and depths to fall.
3.6 Transaction Taxes
European regulators and some U.S. voices have recently renewed proposals to impose transaction taxes on
trading. Such taxes would increase transaction costs and thereby reduce volumes. Spreads would widen as the
high frequency traders who are most responsible for the narrow spreads that we presently enjoy would be most
impacted. Liquidity would decrease and with it the ability of informed traders to establish the profitable positions
necessary to cover their costs of acquiring and analyzing information about fundamentals values. Prices thus
would become less informative. We believe that transaction taxes on trading would be very unhealthy for the
markets, for the investors who use them, and for the economy as a whole. The United States had such a tax and
wisely dropped it in 1965.
Equity Trading in the 21st Century: An Update
06.21.2013
32
3.7 Market Stability
In our previous paper, which we circulated before the Flash Crash, we expressed concern that the safeguards at
brokerage firms and trading platforms were inadequate to deal with the risk of misfiring computer algorithms.
We wrote “In the minutes it takes humans at the exchanges to react to the situation, billions of dollars of damage
may be done.”
Subsequent to the Flash Crash, several changes were made in market structure. The exchanges quickly initiated
procedures in 2010 to halt trading in an individual stock when it moves up or down more than 10% in five
minutes. The more complex “Limit-up, Limit-down” (“LULD”) protections are now being rolled out. LULD is
designed to prevent stocks from trading outside of a dynamic price band but would not immediately halt a stock.
The stock could naturally reopen if trading activity pushed the stock away from the band. If a stock is at the limit
of the band for a period of time, then a trading halt would occur. A new price band would be established by the
re-opening auction.
The new procedure is a step in the right direction, but we believe that more work needs to be done. We are
concerned that its technical complexity will cause unintended and potentially serious side effects during the
next market convulsion. For example, radio and television reporters may create and disseminate measures that
indicate what fraction of the market has been halted. A substantial rise in this measure could panic investors into
trading foolishly.
We are also concerned about the interaction of the limit-up, limit-down procedures with other stability
measures such as market-wide halts and various stability measures on derivative exchanges. The implications
of these complex systems may not become apparent until after the next big tsunami of message traffic hits
the market network.
The logic behind trading halts, whether single stock or market-wide, is straightforward: the job of the market is
to discover price. If a dislocation would result in poor price discovery, halting the market would be better than
producing bad prices. And preventing erroneous trades is better than attempting to bust them later.
Trading should be halted only when the market is in danger of producing bad prices. For example, such halts can
occur when frictions in the dissemination of information are present, so trading halts occur routinely when news
is pending. Consideration should be given to having trading halts when data feeds are delayed. We learned in the
Flash Crash that such delays can exacerbate problems in the market.
Similarly, sudden and extreme fluctuations in price also may signal an error or a breakdown in a system. On the
other hand, it could indicate the incorporation of news into the price of a stock.
One problem with mechanical circuit breakers is that they can go into effect when they are not needed or, worse
yet, could cause further harm. If the Flash Crash had occurred just a few minutes earlier and been a little bit
deeper, it would have triggered a one-hour trading halt. Instead of an event that was over in minutes, the trading

Equity Trading in the 21st Century: An Update
06.21.2013
33
halt could have led to panic among investors once media organizations had reported that the market was halted.
The reopening could have been very ugly. Thus, it was lucky that the one hour trading halt was not activated
during the Flash Crash.
Even worse, under some conditions, market-wide circuit breakers could halt trading for the rest of the day. Such
halts raise the risk that the closing prices for the day will be based on prices created by a glitch that triggered
the trading halt. Such prices could result in erroneous pricing for mutual fund transactions on that day, as well as
catastrophic margin calls. We note that the Stock Market Crash of October 19, 1987 was preceded by a trading
halt of 2½ days (the regular weekend halt) that occurred immediately after extreme volatility on October 16. On
that Friday, the DJIA recorded the largest point decline (106 points, or 5%) in its history. That record, of course,
stood only until the next trading day.
We recommend that the market-wide circuit breakers be modified to allow the markets to always reopen in an
orderly manner so that orderly closing prices can be discovered. As each market convulsion is slightly different
and it is impossible to predict all possible scenarios in advance, it is appropriate to permit human judgment in
such times. The trading halt rules should be modified to encourage the exchanges to use their judgment, in
consultation with the SEC, to decide whether and how to re-open after a market convulsion.
We also note that our markets currently open every morning with a “soft” open in which pre-open trading by
some investors helps the market discover the right price for the opening auction. We believe that such a system
would work well for reopening after trading halts and IPOs. We discuss this issue in more detail below.
3.8 Market Maker Obligations
Much liquidity is now provided by electronic market participants without affirmative market maker obligations.
Some commentators have suggested that small stocks might best trade in markets with designated market
makers who would be required to provide liquidity. These commentators believe that without the support of a
dedicated market-maker, small stocks can languish and investors may shun them.
However, the problem with assigning special responsibilities to a dedicated market-maker is that they are expen-
sive to fulfill when the designated market-maker otherwise would not want to trade. Accordingly, the assignment of
special responsibilities to a market-maker invariably is associated with special privileges that allow the designated
market-maker to build a war chest necessary to support the stock during extraordinary conditions.
This system suffers from two very serious problems. First, no regulatory mechanism can ensure that the value of
the liquidity provided is equal to the value of the special privileges exercised. Second, and more importantly,
during normal times, traders will avoid markets with designated market-makers to avoid losses associated with
the exercise of their special privileges. The designated market-maker thus will not be able to build their war
chests. However, when called upon to meet their special responsibilities, all traders will want to trade with them.
Systems with special privileges for designated market-makers can only work well in markets in which all trading
is consolidated by regulation to the sponsoring market.

Equity Trading in the 21st Century: An Update
06.21.2013
34
Such consolidated market structures are inconsistent with current U.S. regulatory policies, but a change in policy
might be considered to allow them for new public companies. Who then would determine market structure for
these consolidated markets? Either the SEC would have to designate the market structure or the issuer would
have to choose it. In either case, we are not confident that the resulting decisions would necessarily be the best
ones for the majority of public investors.
3.9 Tick Sizes
Recently some commentators have argued that small tick sizes have hurt market quality, especially for smaller
stocks. These voices believe that if tick sizes were larger, the resulting higher bid/ask spreads would make dealers
more willing to continuously provide liquidity, especially in markets for smaller stocks.
We agree that large tick sizes will lead to wider spreads, and most certainly for those stocks which are presently
trading on only one penny. This increase would hurt impatient traders who take liquidity, including small traders
who routinely trade at quoted prices.
We also agree that large tick sizes will result in greater market depth as traders queue to make markets at favor-
able prices. This increase would benefit larger traders who are willing to pay for size and it would provide better
prices for patient traders whose resting limit orders execute. A larger tick thus would favor some traders over
others. We are agnostic about whether a larger tick size in general is in the public interest. However, a wider tick
size by itself would not lead dealers to offer liquidity when they would otherwise not desire to do so.
In a consolidated market, increasing the tick size would reduce quote-matching (pennying) strategies and thus
protect traders who supply liquidity. Such protection would increase the supply of liquidity and would increase
incentives to display liquidity. But such protection is less powerful in fragmented markets where quote-matchers
can front-run orders in one market by trading in another market.
3.10 Trade-at Rules
The Joint SEC-CFTC Advisory Committee On Emerging Regulatory Issues has proposed that the SEC consider
adopting a “trade-at” rule that would require that orders be routed to a market with the best displayed price
or be executed at a materially improved price—probably ½ cent better for most securities. Such a rule would
increase incentives to display prices. Proponents believe that it would lead to better prices for internalized and
preferenced orders.
The trade-at proposal effectively imposes a weak form of time precedence across all market centers. Off –
exchange dealers and traders in dark pools who are not currently quoting the best prices would no longer be
able to simply match the best price offered elsewhere. To trade, they would have to provide significantly better
prices or start displaying quotes at the NBBO. Otherwise they would have to route incoming order to markets
displaying better prices.

Equity Trading in the 21st Century: An Update
06.21.2013
35
We are concerned about several unintended consequences of this proposal:
1. A trade-at rule will substantially impair the ability of market participants to discriminate in favor of less-
informed traders such as most retail investors and some institutions. Less-informed traders presently
indirectly benefit from payments for order flow that brokers receive from dealers to whom they preference
their clients’ orders or from profits that broker-dealers make when internalizing their clients’ orders. They also
benefit when their orders are routed to alternative trading systems that secure improved prices for them.
Although preferencing and internalization is subject to important agency problems, the retail market for order
flow is quite competitive so that much of the benefits of discriminating in favor of less-informed traders
should in principle flow back to retail traders in the form of lower commissions or greater service. Forced
routing of orders limits the ability of market participants to serve less-informed traders whose orders are
relatively easy to fill and who thus should receive better prices on average. A trade-at rule will benefit
well-informed traders by ensuring that the markets in which they trade are more liquid. But their increased
profits will come at the expense of less-informed traders.
2. Internalizing and preferencing dealers could simply post market quotes at the NBBO to continue doing their
business, but in doing so, they will expose themselves to informed order flow. Their losses ultimately will be
borne by their less-informed clients.
3. Creative solutions to subvert a trade-at rule will emerge because the economics of internalization and
preferencing are quite compelling. The adoption of a trade-at rule will likely lead to the creation of convoluted
systems that facilitate internalization and preferencing while remaining in compliance with the new rule.
For example, upon receiving a marketable buy order, a broker-dealer could “stop” the execution of the order –
guarantee that the order will be filled at the best offer – and then place an order to sell for its own account at
the national best offer at a smaller exchange with an empty book. Once posted, the broker-dealer then would
route the client order to that exchange for execution. Internalization was frequently done this way at the
regional exchanges many years ago. To avoid the creation of such systems, a trade-at rule will have to specify
that routing would only be required to quotes that have stood for a minimum period. This specification would
increase the complexity of the rule and the potential for further unintended consequences as traders attempt
to game the new rule. For example, dealers may momentarily improve the NBBO to reset the timer. To
prevent this behavior, the rule would have to be further complicated.
4. If the maker-taker and taker-maker problems are not solved, a trade-at rule will cause marketable orders
to be routed to the market offering the lowest access fee (for maker-taker markets) or the highest rebate
(for taker-maker markets). The proposal thus will exacerbate the problems of subpenny pricing (primarily
front-running by fast traders).
5. A trade-at rule also will force brokers or their clients to pay access fees that they can currently avoid through
internalization and preferencing. Trade-at routing decisions thus should be based on net prices rather than
quoted prices. But if access fees and liquidity rebates are included in the computation of the net price,
subpenny pricing problems will grow.

Equity Trading in the 21st Century: An Update
06.21.2013
36
6. If regulatory changes eliminate the subpenny pricing problems associated with maker-taker pricing by prohib-
iting the practice, we wonder how two or more exchanges offering the same price will compete to encourage
brokers to route orders to them. Ideally that competition will express itself in lower transaction fees or better
service, but we recognize the potential for other types of order flow inducements such as data subsidies.
7. We also note that any attempts to increase the importance of time precedence in the U.S. National Market
System increase the benefits of being a fast trader and the incentives for exchanges to compete on execution
speeds. A trade-at rule thus would exacerbate the speed arms-race problem that we discuss above.
8. Finally, we are concerned that a trade-at rule will tend to establish dominant exchanges that may someday
exercise excessive market power. When faced with identical pricing at two markets, brokers tend to route to
the more active market since the order will most likely fill in its entirety at that market. Traders in less active
markets thus would not be rewarded for offering liquidity during normal times, but their liquidity-supplying
orders would be quickly taken when the market moves against them. A trade-at rule thus would ultimately
reduce competition among market centers. This problem could be solved by imposing universal time
precedence across all exchanges, but such consolidated limit order book proposals would represent a
substantial shift in regulatory policy that is far beyond any current discussion.
The adoption of a trade-at rule would promote one set of values at the cost of another set of values. Adoption
would favor greater transparency and greater overall operational efficiency through increased consolidation of
the markets. But adoption also would decrease competition among markets that presently serve the different
interests of diverse traders. Neither side can uniquely claim to be pro-competitive. A trade-at rule would favor the
competition of traders for best price whereas the present system would continue to favor the competition among
market centers to provide exchange services that appeal to diverse traders, and in particular, less-informed traders.
If the SEC adopts a trade-at rule, it also should recognize its role as a promoter of competition. Under a trade-at
rule, markets may consolidate to the point where one exchange will acquire substantial market power. If so, the
SEC should ensure that power is not used to disadvantage investors. However, to do so, the SEC may have to
engage in fee regulation, which it has studiously avoided in the past.
3.11 Bandwidth Issues
Although message traffic has moderated somewhat from recent peaks, high message traffic imposes serious
costs on market participants. Traders who submit excessive numbers of orders with little expectation of
executing those orders impose costs on all other market participants who must process the data. This externality
should concern policy makers.

Equity Trading in the 21st Century: An Update
06.21.2013
37
Under most current pricing models, market participants are not charged for entering and canceling orders.
Market participants who enter and then cancel orders thus do not pay directly for these trading services.6 If a
poorly written algorithm gets caught in an infinite loop that places and cancels orders, the perpetrators usually
are not penalized for the costs that they impose upon others.
Charging economically reasonable fees for quotes would solve this problem. At a minimum, since the costs of
creating the new Consolidated Audit Trail system will be driven by the total message traffic, they should be
apportioned in part by the amount of message traffic generated.
3.12 Opening Procedures for IPOs
The Facebook IPO illustrated the weaknesses of the auctions used to open extremely large IPOs. NASDAQ
operates a single price computerized auction. On the NYSE floor, the designated market maker (DMM) dissemi-
nates various indicated opening prices and gauges demand. The DMM keeps changing prices until a price is
found that balances supply with demand.
Both methods suffer from the lack of price discovery before the official opening. A better way exists that is
well tested. Every morning our exchanges open in a gradual manner. NYSE Arca and NASDAQ turn on their
computers at 4 a.m. Eastern Time, and are followed by the other exchanges later in the morning. Very early
morning trading is very light, but volume gradually builds up before the official 9:30 a.m. open. During this pre-
market trading, sophisticated and adventurous investors trade in a manner that discovers the price, while retail
and more patient orders queue up for the opening auction. This produces “battle-hardened” prices that inform
the price discovery in the opening auction. Retail and other investors thus benefit from this pre-market trading
by receiving a fair and stable price.
IPOs should open in the same manner as all other exchange-listed stocks open daily. This change in procedures
will not only create more stability in the opening auctions and near aftermarket, but it also poses less technological
risk: Using the same regularly proven trading systems to open IPOs would substantially reduce the chance that
things go wrong as occurred in the Facebook and BATS IPOs.
Stocks should open after trading halts using the same gradual approach: Let the sophisticated and adventurous
traders battle it out to find the new price while retail and other traders queue up for an orderly restarting auction
that is informed by the trading activity that takes place before the auction.
If opening and reopening auctions are to be preserved, certain improvements should be made to the auction
mechanism. In particular, markets should disseminate more information about the projected auction price in the
period leading up to the auction, and they should prohibit order cancellations shortly before they calculate the
auction price.
6 NASDAQ is the only exchange operator that presently charges a fee for excess cancellations, and only if the “Weighted order to trade ratio” exceeds 100 to 1. http://www.nasdaqtrader.com/trader.aspx?id=pricelisttrading2

Equity Trading in the 21st Century: An Update
06.21.2013
38
4. Summary and Conclusions
An update of the empirical results in our 2010 study “Equity Trading in the 21st Century” shows that market
quality has remained high by all measures in the United States, despite concerns that have been expressed
by some practitioners and regulators. Improvements in market quality have benefited small traders and new
evidence presented in this revision indicates that it also has benefited the institutional trader executing very
large orders over many days.
While we find these results to be encouraging, we also note that certain changes in market structure could produce
even better markets. We are particularly concerned about maker/taker pricing and its cousin, taker/maker
pricing. Both create transparency and exacerbate conflict-of-interest problems. The later represents a subversion
of the subpenny rule of Regulation NMS with the attendant implications for front-running trading. We also are
concerned about front-running of large institutional traders by traders employing computerized pattern recog-
nition systems. Large institutional traders could be protected from these strategies by a simple change in trade
reporting procedures. Finally, we note that high frequency traders are engaged in a dissipative arm’s race that is
not benefiting public investors. A slight random delay in order processing could reduce the importance, and thus
the costs, of winning this race.
We are also concerned about various proposals to change market structure that we believe would damage
substantially market quality. Foremost among these are proposals to impose transaction costs on trading and
minimum resting times on quotes. Both proposals would hurt liquidity without producing the desired improvements
in market quality.
With so much current controversy about equity market structure, taking a fresh look at the structure of our
markets from a broad perspective is important. Our empirical results show that the markets are functioning
reasonably well despite the many calls for change. At the same time, various economic distortions and principal-
agency problems suggest that market structures could be enhanced to better serve investors. Such changes
should be guided by sound economic and legal principles when their application is well understood. When they
are not, pilot studies and policy phase-ins can produce additional economic evidence that could improve policy
decisions. However, regulators should not create pilot studies simply to defer good policies that are politically
difficult to implement.

Equity Trading in the 21st Century: An Update
06.21.2013
39
Glossary
Access fee. A fee paid to an exchange or ECN by the trader (or trader’s broker) who uses a marketable order to initiate a transaction with a standing order. SEC Regulation NMS limits access fees to 0.3 cents per share.
Ancerno data. Ancerno provides transaction cost analyses to its institutional clients who provide it with trade data for analysis. It makes some of these data available to academics. See www.ancerno.com.
Ask. The price at which a trader is offering to sell a security. This price is sometimes called the offer price.
Basis point. 1/100th of one percent.
Best execution. Brokers have a duty to get the best execution possible for their client orders. Best execution depends on price, speed of execution, the ability of counterparties to provide customer service, such as satisfactory error resolution, among many other criteria.
Bid. The price at which a trader is willing to buy a security.
Bid-ask spread. The difference between the bid and ask prices. This difference estimates the round-trip transaction cost to small investors who uses market orders to buy and sell and whose orders are not filled at better prices. It is a traditional measure of market quality.
BPS. Abbreviation for basis points. 100 basis points equal one percent.
Block trade. A trade involving a very large number of shares that cannot easily be arranged at an exchange. For statistical purposes, trades of more than 10,000 shares are traditionally have been classified as block trades.
CRSP. Center for Research in Securities Prices. CRSP maintains databases of U.S. stock prices commonly used for academic research. See www.crsp.com.
Dark pool. A trading platform that matches buy and sell orders but does not display quotations regarding its current trading interest. Like exchanges, dark pools report trade price and quantity immediately after executing a trade.
Depth. The number of shares available to buy at the ask price or that a trader can sell at the bid price.
ECN. Electronic Communication Network. An ECN is a trading platform that electronically matches buy and sell orders much like a stock exchange. However, the SEC regulates ECNs as broker-dealers rather than as exchanges, which results in a lower regulatory burden.
Effective Bid-Ask Spread. A measure of transaction cost actually incurred equal to twice the difference between the trade price and the midpoint of the quoted National Best Bid or Offer (“NBBO”) at the time of order receipt. The effective bid-ask spread is smaller than the quoted bid-ask spread when an order executes at an improved price relative to the NBBO price.
ETF. Exchange Traded Fund. An ETF is a security that represents a basket of other financial instruments that trades on an exchange with a single ticker symbol. For example, SPY, the S&P 500 Depository Receipt, represents all 500 S&P stocks.
Flash Crash. The May 6, 2010 event in which stock prices fell about 7% in about 10 minutes and then recovered equally quickly.
Front running. A practice in which a trader discovers (or suspects) the existence of a large order and then trades on the

Equity Trading in the 21st Century: An Update
06.21.2013
40
same side as that order before it is executed, with the hope of profiting from the change in price caused by the execution of the large order or from the option to reverse the front-running trade by trading with the large order.
Internalization. The practice in which a broker fills a customer order by trading with the customer instead of by routing it to an exchange or other trading platform where another trader will fill the order.
INET. An ECN once operated by Instinet. NASDAQ acquired INET in 2005.
IPO. Initial Public Offering. A stock is sold to the general public for the first time in an IPO.
Lit Market. An exchange or off-exchange trading platform such as an ECN that publicly displays its best bid and offers.
Liquidity. The ability to quickly buy or sell a security without moving the price much.
Liquidity rebate. A payment made by an exchange or ECN to the trader (or trader’s broker) whose standing limit order allows another trader to initiate a transaction. The trader receiving the liquidity rebate is called the maker.
Maker. The trader whose standing limit order allows another trader to initiate a trade. The maker’s order is said to make a market.
Maker-taker pricing. A pricing mechanisms used by exchanges and ECNs to charge for their services. The initiator of a trade (the market order trader) pays an access fee that is typically about 0.3 cents per share and the maker of a trade (the trader who posted the standing limit order taken by the maker) receives a liquidity rebate that is typically 0.25 cents per share. The difference is the net amount collected by the exchange for its transaction services.
NBBO. National Best Bid and Offer. The NBBO consists of the best (highest) bid price and the best (lowest) offer price publicly displayed on all U.S. exchanges for a particular security at a particular point in time.
NMS. National Market System. The set of market centers consisting of exchanges, dealers, and alternative trading systems that trade securities designated by the SEC as National Market System securities. Trading in the NMS is regulated by Regulation NMS, among many other regulations.
Preferencing. The practice of routing orders to a particular market center that promises to match the NBBO, even when it is not quoting at the NBBO.
Quoted bid-ask spread. The bid-ask spread calculated from the difference between actual bid and ask quotations, usually based on the NBBO.
Regulation NMS. A SEC rule that requires participants in the National Market System (market centers consisting of exchanges, dealers, and alternative trading systems) to honor the publicly displayed prices posted at other centers by either matching those prices or routing orders to the other centers, as long as they are electronically accessible. Regulation NMS also prohibits market centers from disseminating subpenny quotes and from charging more than 0.3 cents per share in access fees.
Rule 605. SEC Rule 605 requires market centers to publish execution quality statistics such as effective bid-ask spread and speed of execution for various orders.
SEC. The United States Securities and Exchange Commission, the regulatory agency charged with overseeing securities markets in the U.S.
Subpenny pricing. The pricing of securities on subpenny (fractions of a penny) increments. Regulation NMS prohibits the use of subpenny increments for publicly disseminated quotations but not for trade prices.

Equity Trading in the 21st Century: An Update
06.21.2013
41
Taker. The trader whose marketable order initiates a transaction with a standing limit order on the other side. The trader is said to take the liquidity offered by the standing limit order.
Taker-maker pricing. A pricing mechanisms used by exchanges and ECNs to charge for their services that is similar to maker-taker pricing except that the maker pays a fee and the taker receives a rebate.
TAQ. Trades and Quotes. The NYSE distributes the TAQ database containing trade records of the price and quantity of each stock trade in the U.S., along with all exchange bid and ask quotations .
Time Precedence. A method of breaking ties when two or more traders are willing to trade at the same price. Time precedence gives precedence to the first trader to enter an order at a given price. Alternative methods for breaking such ties include giving preference to displayed versus hidden orders, larger versus smaller orders, customer versus exchange member orders, or randomly selected orders.
Time Preference. Same as time precedence.
Time Priority. Same as time precedence.
Trade At. A proposed rule that would not permit off-exchange traders such as dealers and dark pools to execute a trade at the same price as the NBBO price posed by an exchange. Instead, they only would be able to trade at prices better than the NBBO prices.
VIX. Volatility Index. An index of U.S. market volatility related to the implied volatilities associated with S&P 500 option prices.