Embed Size (px)
Citation preview
April 2018
‘A su i table benchmark for Equi t y Sav ings Funds’{ {
WHITE PAPERSERIES #12
Equity Savings
1
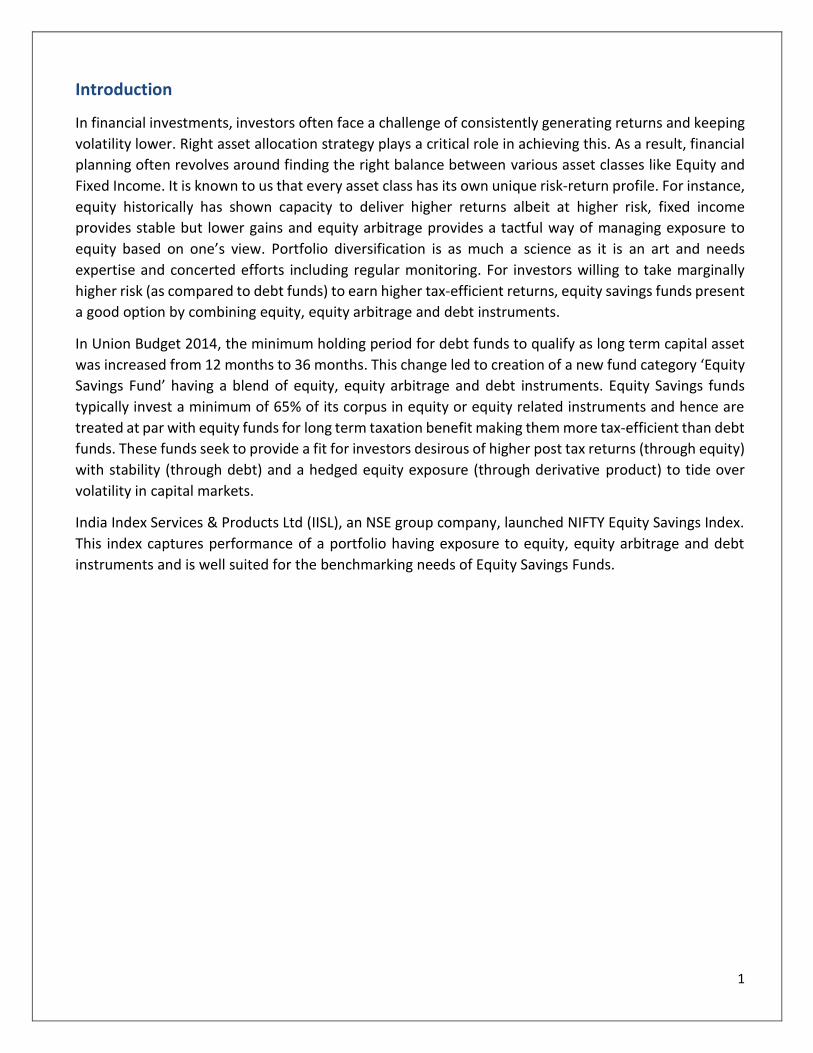
Introduction
In financial investments, investors often face a challenge of consistently generating returns and keeping
volatility lower. Right asset allocation strategy plays a critical role in achieving this. As a result, financial
planning often revolves around finding the right balance between various asset classes like Equity and
Fixed Income. It is known to us that every asset class has its own unique risk-return profile. For instance,
equity historically has shown capacity to deliver higher returns albeit at higher risk, fixed income
provides stable but lower gains and equity arbitrage provides a tactful way of managing exposure to
equity based on one’s view. Portfolio diversification is as much a science as it is an art and needs
expertise and concerted efforts including regular monitoring. For investors willing to take marginally
higher risk (as compared to debt funds) to earn higher tax-efficient returns, equity savings funds present
a good option by combining equity, equity arbitrage and debt instruments.
In Union Budget 2014, the minimum holding period for debt funds to qualify as long term capital asset
was increased from 12 months to 36 months. This change led to creation of a new fund category ‘Equity
Savings Fund’ having a blend of equity, equity arbitrage and debt instruments. Equity Savings funds
typically invest a minimum of 65% of its corpus in equity or equity related instruments and hence are
treated at par with equity funds for long term taxation benefit making them more tax-efficient than debt
funds. These funds seek to provide a fit for investors desirous of higher post tax returns (through equity)
with stability (through debt) and a hedged equity exposure (through derivative product) to tide over
volatility in capital markets.
India Index Services & Products Ltd (IISL), an NSE group company, launched NIFTY Equity Savings Index.
This index captures performance of a portfolio having exposure to equity, equity arbitrage and debt
instruments and is well suited for the benchmarking needs of Equity Savings Funds.
2
About NIFTY Equity Savings Index
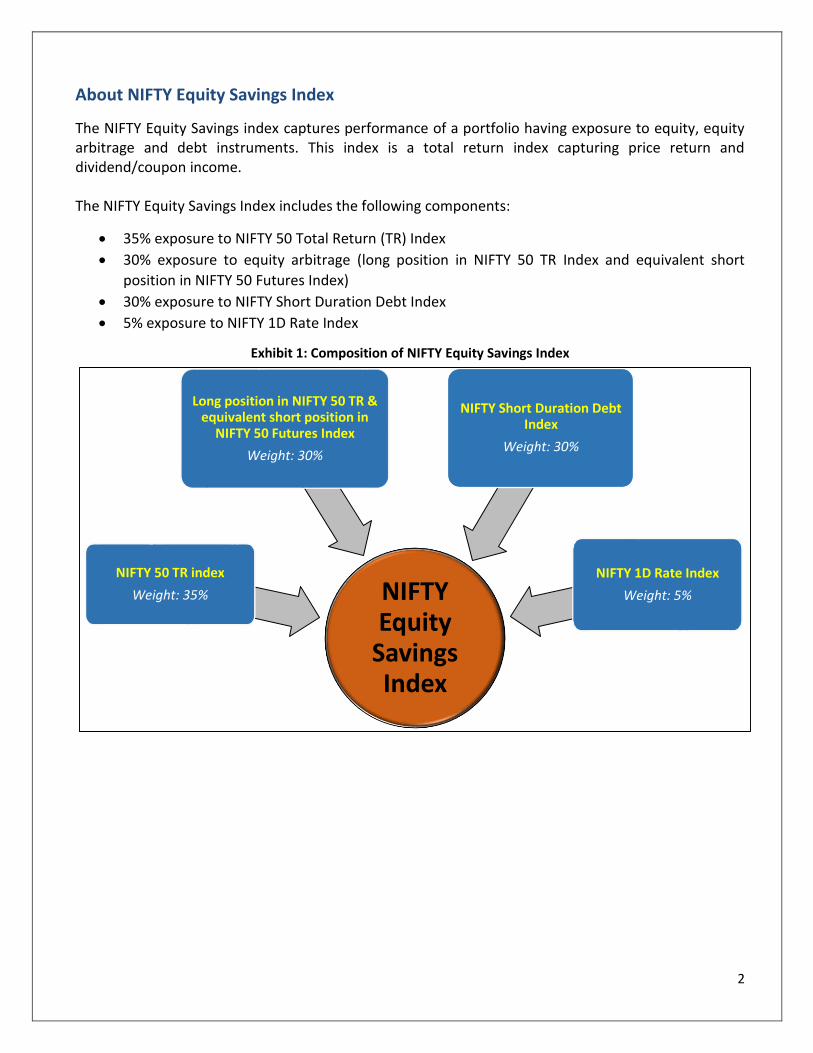
The NIFTY Equity Savings index captures performance of a portfolio having exposure to equity, equity arbitrage and debt instruments. This index is a total return index capturing price return and dividend/coupon income. The NIFTY Equity Savings Index includes the following components:
35% exposure to NIFTY 50 Total Return (TR) Index
30% exposure to equity arbitrage (long position in NIFTY 50 TR Index and equivalent short
position in NIFTY 50 Futures Index)
30% exposure to NIFTY Short Duration Debt Index
5% exposure to NIFTY 1D Rate Index
Exhibit 1: Composition of NIFTY Equity Savings Index
NIFTY Equity
Savings Index
NIFTY 50 TR index
Weight: 35%
Long position in NIFTY 50 TR & equivalent short position in
NIFTY 50 Futures Index
Weight: 30%
NIFTY Short Duration Debt Index
Weight: 30%
NIFTY 1D Rate Index
Weight: 5%
3
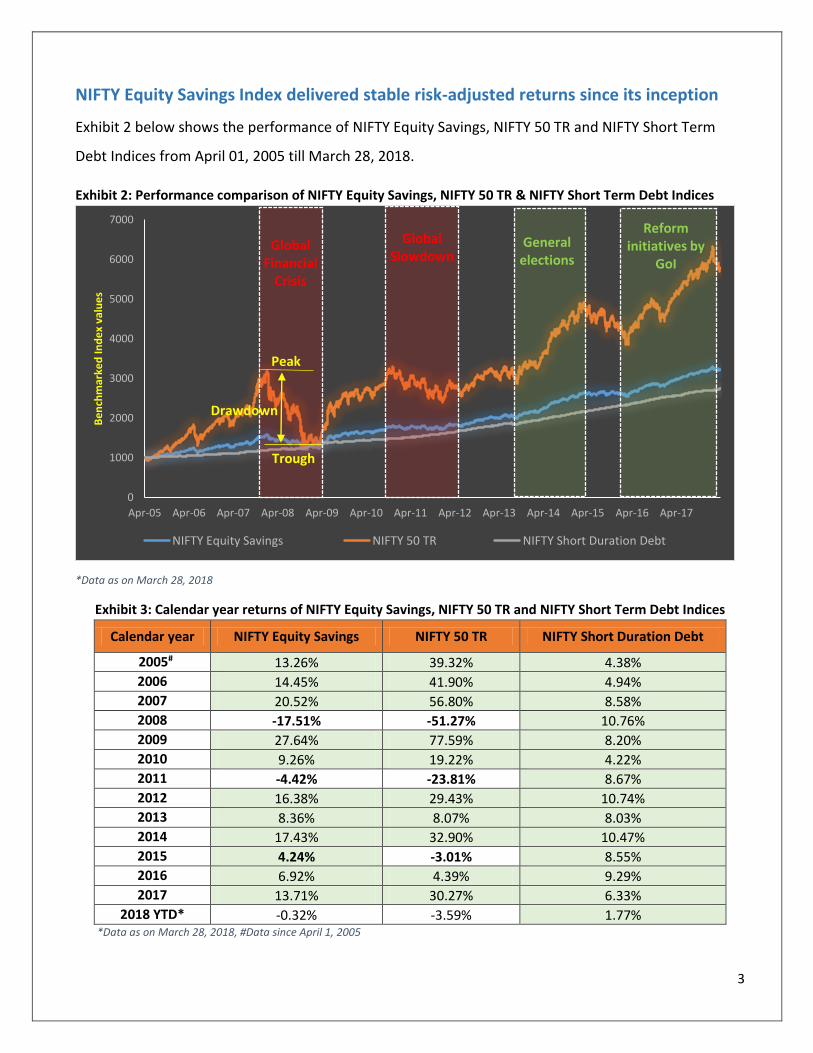
NIFTY Equity Savings Index delivered stable risk-adjusted returns since its inception
Exhibit 2 below shows the performance of NIFTY Equity Savings, NIFTY 50 TR and NIFTY Short Term
Debt Indices from April 01, 2005 till March 28, 2018.
Exhibit 2: Performance comparison of NIFTY Equity Savings, NIFTY 50 TR & NIFTY Short Term Debt Indices
*Data as on March 28, 2018
Exhibit 3: Calendar year returns of NIFTY Equity Savings, NIFTY 50 TR and NIFTY Short Term Debt Indices
Calendar year NIFTY Equity Savings NIFTY 50 TR NIFTY Short Duration Debt
2005# 13.26% 39.32% 4.38%
2006 14.45% 41.90% 4.94%
2007 20.52% 56.80% 8.58%
2008 -17.51% -51.27% 10.76%
2009 27.64% 77.59% 8.20%
2010 9.26% 19.22% 4.22%
2011 -4.42% -23.81% 8.67%
2012 16.38% 29.43% 10.74%
2013 8.36% 8.07% 8.03%
2014 17.43% 32.90% 10.47%
2015 4.24% -3.01% 8.55%
2016 6.92% 4.39% 9.29%
2017 13.71% 30.27% 6.33%
2018 YTD* -0.32% -3.59% 1.77%
*Data as on March 28, 2018, #Data since April 1, 2005
0
1000
2000
3000
4000
5000
6000
7000
Apr-05 Apr-06 Apr-07 Apr-08 Apr-09 Apr-10 Apr-11 Apr-12 Apr-13 Apr-14 Apr-15 Apr-16 Apr-17
Be
nch
mar
ked
Ind
ex
valu
es
NIFTY Equity Savings NIFTY 50 TR NIFTY Short Duration Debt
Generalelections
Global Financial
Crisis
GlobalSlowdown
Reforminitiatives by
GoI
Peak
Trough
Drawdown
4
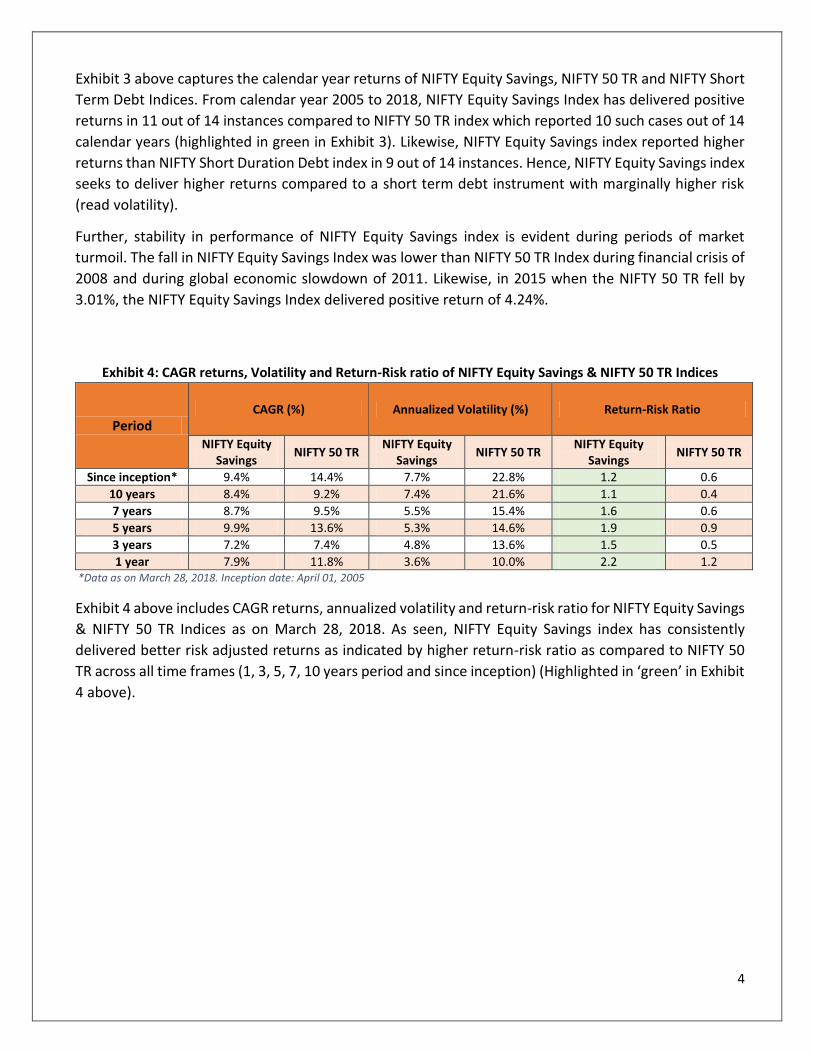
Exhibit 3 above captures the calendar year returns of NIFTY Equity Savings, NIFTY 50 TR and NIFTY Short
Term Debt Indices. From calendar year 2005 to 2018, NIFTY Equity Savings Index has delivered positive
returns in 11 out of 14 instances compared to NIFTY 50 TR index which reported 10 such cases out of 14
calendar years (highlighted in green in Exhibit 3). Likewise, NIFTY Equity Savings index reported higher
returns than NIFTY Short Duration Debt index in 9 out of 14 instances. Hence, NIFTY Equity Savings index
seeks to deliver higher returns compared to a short term debt instrument with marginally higher risk
(read volatility).
Further, stability in performance of NIFTY Equity Savings index is evident during periods of market
turmoil. The fall in NIFTY Equity Savings Index was lower than NIFTY 50 TR Index during financial crisis of
2008 and during global economic slowdown of 2011. Likewise, in 2015 when the NIFTY 50 TR fell by
3.01%, the NIFTY Equity Savings Index delivered positive return of 4.24%.
Exhibit 4: CAGR returns, Volatility and Return-Risk ratio of NIFTY Equity Savings & NIFTY 50 TR Indices
Period CAGR (%) Annualized Volatility (%) Return-Risk Ratio
NIFTY Equity Savings
NIFTY 50 TR NIFTY Equity
Savings NIFTY 50 TR
NIFTY Equity Savings
NIFTY 50 TR
Since inception* 9.4% 14.4% 7.7% 22.8% 1.2 0.6
10 years 8.4% 9.2% 7.4% 21.6% 1.1 0.4
7 years 8.7% 9.5% 5.5% 15.4% 1.6 0.6
5 years 9.9% 13.6% 5.3% 14.6% 1.9 0.9
3 years 7.2% 7.4% 4.8% 13.6% 1.5 0.5
1 year 7.9% 11.8% 3.6% 10.0% 2.2 1.2 *Data as on March 28, 2018. Inception date: April 01, 2005
Exhibit 4 above includes CAGR returns, annualized volatility and return-risk ratio for NIFTY Equity Savings
& NIFTY 50 TR Indices as on March 28, 2018. As seen, NIFTY Equity Savings index has consistently
delivered better risk adjusted returns as indicated by higher return-risk ratio as compared to NIFTY 50
TR across all time frames (1, 3, 5, 7, 10 years period and since inception) (Highlighted in ‘green’ in Exhibit
4 above).
5
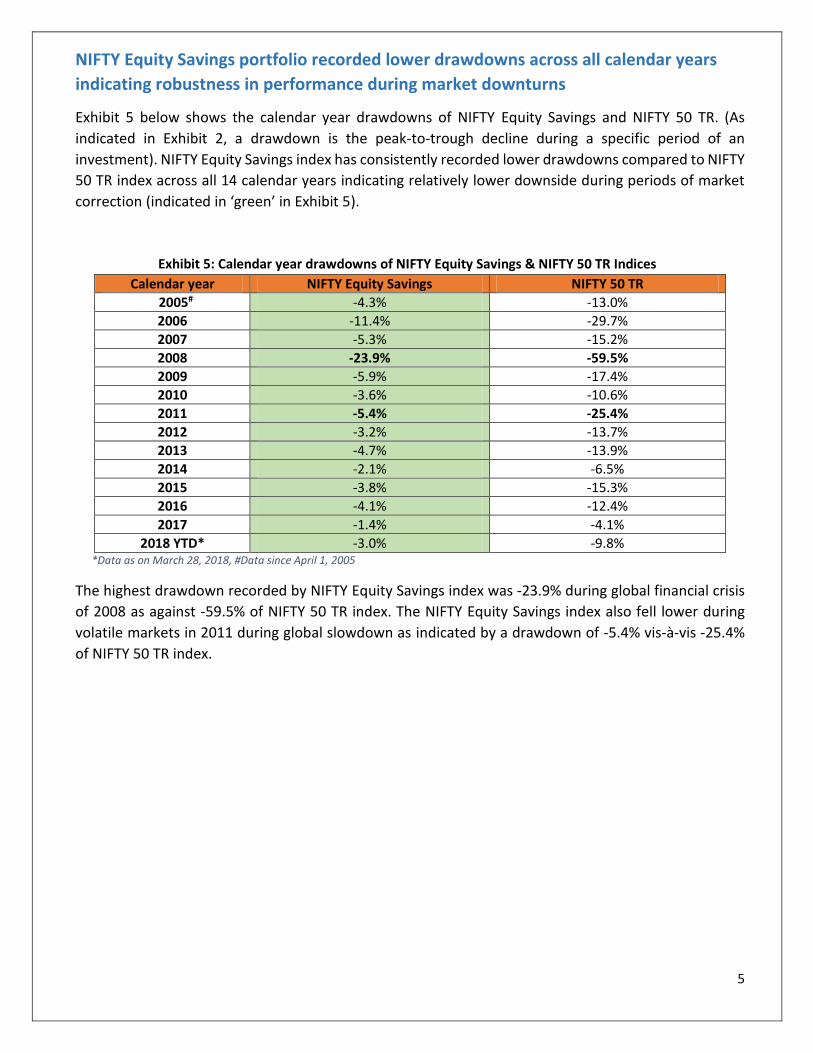
NIFTY Equity Savings portfolio recorded lower drawdowns across all calendar years
indicating robustness in performance during market downturns
Exhibit 5 below shows the calendar year drawdowns of NIFTY Equity Savings and NIFTY 50 TR. (As
indicated in Exhibit 2, a drawdown is the peak-to-trough decline during a specific period of an
investment). NIFTY Equity Savings index has consistently recorded lower drawdowns compared to NIFTY
50 TR index across all 14 calendar years indicating relatively lower downside during periods of market
correction (indicated in ‘green’ in Exhibit 5).
Exhibit 5: Calendar year drawdowns of NIFTY Equity Savings & NIFTY 50 TR Indices
Calendar year NIFTY Equity Savings NIFTY 50 TR
2005# -4.3% -13.0%
2006 -11.4% -29.7%
2007 -5.3% -15.2%
2008 -23.9% -59.5%
2009 -5.9% -17.4%
2010 -3.6% -10.6%
2011 -5.4% -25.4%
2012 -3.2% -13.7%
2013 -4.7% -13.9%
2014 -2.1% -6.5%
2015 -3.8% -15.3%
2016 -4.1% -12.4%
2017 -1.4% -4.1%
2018 YTD* -3.0% -9.8% *Data as on March 28, 2018, #Data since April 1, 2005
The highest drawdown recorded by NIFTY Equity Savings index was -23.9% during global financial crisis
of 2008 as against -59.5% of NIFTY 50 TR index. The NIFTY Equity Savings index also fell lower during
volatile markets in 2011 during global slowdown as indicated by a drawdown of -5.4% vis-à-vis -25.4%
of NIFTY 50 TR index.
6
Signing Off…
The NIFTY Equity Savings index captures performance of a portfolio having exposure to equity, equity
arbitrage and debt instruments. The NIFTY Equity Savings index has consistently delivered stable risk-
adjusted returns since its inception. The index also has lower drawdowns compared to NIFTY 50 TR index
underlining the robustness in performance especially during periods of market downturns. NIFTY Equity
Savings portfolio, thus, strikes the right balance between equity, debt and equity arbitrage strategy
delivering better risk adjusted returns and is ideal for investors seeking stability in returns over long term
investment horizons. Similar to the investment philosophy of equity savings funds, this index captures
performance of a portfolio having exposure to equity, equity arbitrage and debt instruments and hence
is an appropriate benchmark index for these funds.
For information on Index methodology and factsheet, please visit us at www.niftyindices.com
7
About India Index Services & Products Ltd. (IISL):
India Index Services & Products Ltd. (IISL), a subsidiary of NSE, provides a variety of indices and index
related services for the capital markets. IISL focuses upon the index as a core product. IISL owns and
manages a portfolio of indices under the NIFTY brand of NSE, including the flagship index, the NIFTY 50.
IISL equity Indices comprises of broad-based benchmark indices, sectoral indices, strategy indices,
thematic indices and customised indices. IISL also maintains fixed income indices based on Government
of India securities, corporate bonds and money market instruments. Many investment products based
on IISL indices have been developed within India and abroad. These include index based derivatives
traded on NSE, Singapore Exchange Ltd. (SGX), Chicago Mercantile Exchange Inc. (CME), Osaka Exchange
Inc. (OSE), Taiwan Futures Exchange (TAIFEX) and a number of index funds and exchange traded funds.
The flagship 'NIFTY 50' index is widely tracked and traded as the benchmark for Indian Capital Markets.
Disclaimer: All information contained herewith is provided for reference purpose only. IISL ensures accuracy and reliability of the above information to the best of its endeavors. However, IISL makes no warranty or representation as to the accuracy, completeness or reliability of any of the information contained herein and disclaim any and all liability whatsoever to any person for any damage or loss of any nature arising from or as a result of reliance on any of the information provided herein. The information contained in this document is not intended to provide any professional advice.
Contact:
Email: [email protected]
Tel: +91 22 26598386
Address: Exchange Plaza, Bandra Kurla Complex,
Bandra (East), Mumbai– 400 051(India)
Contact Details
Analytical contact
Aman Singhania, CFA, FRM
Head – Products (IISL)
+91-22-26598214
Business Development contact
Rohit Kumar, FRM
Chief Manager – Business Development
+91-22- 26598386