Embed Size (px)
Citation preview
EQUITY RESEARCH
Retail
16 March 2015
DISCLAIMER: Foster Stockbroking Pty Ltd does and seeks to do business with companies covered in its research reports. As a result, investors should be aware that the firm may have a conflict of interest that could affect the objectivity of this report. Refer full disclosures at the end of this report.
Rating SPEC BUY
Previous n/a
Price Target 1.10$
Previous n/a
Share Price (A$) 0.55$
52 week low - high (A$) $0.78-0.42
Valuation (A$/share) 1.05
Methodology DCF
Risk High
Capital Structure
Shares on Issue (m) 139
Shares on Issue diluted (m) 182
Free Float (%) 100%
12mth Av Daily Volume ('000) 1130
Diluted Market Cap ($m) 100
EV ($m) 88
Key Metrics 2015e 2016e 2017e 2018e
Revenue ($m) 1.6 16.2 34.4 48.2
EBITDA ($m) -4.8 -0.5 6.8 12.1
NPAT rep ($m) -4.9 -0.5 4.4 7.7
NPAT adj($m) -4.9 -0.5 4.4 7.7
EPS adj (¢) 0.0 0.0 0.0 0.1
Revenue Growth (%) n/a 886% 113% 40%
EBITDA growth (%) n/a n/a -1510% 79%
EBITDA margin (%) n.a -3% 20% 25%
EPS growth (%) n/a n/a n/a 0%
Op Cashflow ($m) -9.0 -1.7 7.6 10.3
Capex ($m) -0.9 -0.7 -1.0 -0.5
FCF ($m) -9.9 -2.3 6.6 9.8
Net Cash ($m) 8.9 8.9 6.6 13.2
Share Price Graph
Analyst
Haris Khaliqi +61 2 9993 8168
Foster Stockbroking was the Lead manager to the
placement of 20m shares at $0.50 per share to raise A$10m
in February and received fees for this service
Yowie Group Ltd (YOW.ASX)
Time to sweeten your portfolio.
Event:
We initiate on YOW with a SPEC BUY recommendation with a price target of $1.10/sh.
Investment Highlights:
Launching a proven brand. Yowie Group ('YOW') is an early stage growth company that is now well advanced on the re-launch of the Yowie chocolate brand into the US market that will be followed by Australia and New Zealand. In its first full 12 months of sales in Australia in 1997, Cadbury sold 65m ($100m) units and took 30% of Kinder Surprise’s market share.
No direct competitor in the US. Despite over 2 billion unit sales worldwide, Kinder Surprise is unable to be sold in US because the chocolate encapsulated toy is considered a choking hazard.
Competitive advantage lies in exclusive use of patent capsule. YOW has partnered up with the Whetstone Candy Company who holds an exclusive use of a patent to commercialise an inclusion/capsule chocolate manufacturing process inside the US market.
Rolling out to largest US retailer, Walmart. Yowie product is scheduled to be rolled out across 1,505 Walmart stores nationally in March post a successful trial which was conducted in Q4CY14 across 50 stores in Texas. This is a significant endorsement laying the foundations to build sales volumes and brand awareness in the US market.
In country sales team quickly building distribution. In addition to Walmart Yowie has quickly established distribution network across 35 US mainland States and in ~4,500 outlets. Notably rolling out in Safeway across 1,300 and concluding a trial with Walgreens. Sales and distribution are being led by in-country management in conjunction with confectionary broker networks to provide national reach across various trade channels.
Capital light and scalable production facility. Manufacturing occurs in St Augustine, Florida US under a contract manufacturing agreement. The facility operates at a production rate of 7m units p.a has a current capacity of 20m units pa (facility has scope to increase to 100m units p.a). Additional 20m units p.a of capacity can be added at a cost $600K with a 4 month lead time.
Funded for growth, forecast profitability within 12 months. Company is well funded with $12m cash and no debt. We forecast YOW can achieve profitability at a sales run rate of ~12m unit’s p.a which forecast to occur in Q3 FY16. We forecast sales volumes increasing from 11m units p.a in FY16 to 49m units by FY19 delivering $A20.9m NPAT. We note our assumptions are for US market only.
Significant upside achievable. While our assumptions ere on the conservative side. Conceivably if the brand is a success the demand for US alone could exceed 100 units p.a. On annualised sales of 100m units we believe Yowie generates $40m NPAT, applying a 17 times earnings multiple would imply a valuation of up to $4.10/sh. Further upside can be achieved through new markets and product lines.
Recommendation:
We initiate on YOW with a SPEC BUY and a price target of $1.10/sh.
0
2,000
4,000
6,000
8,000
10,000
12,000
0.000.100.200.300.400.500.600.700.800.901.00
Mar
12
May
12
Ju
n 1
2
Ju
l 12
Au
g 1
2
Oct
12
No
v 1
2
De
c 1
2
Jan
13
Feb
13
Mar
13
Ap
r 1
3
Volume('000)
Share Price ($)
16 March 2015 Level 25, 52 Martin Place, Sydney, NSW 2000 | +61 2 9993 8100 | www.fostock.com.au 2
Yowie Group LTD (YOW.ASX)
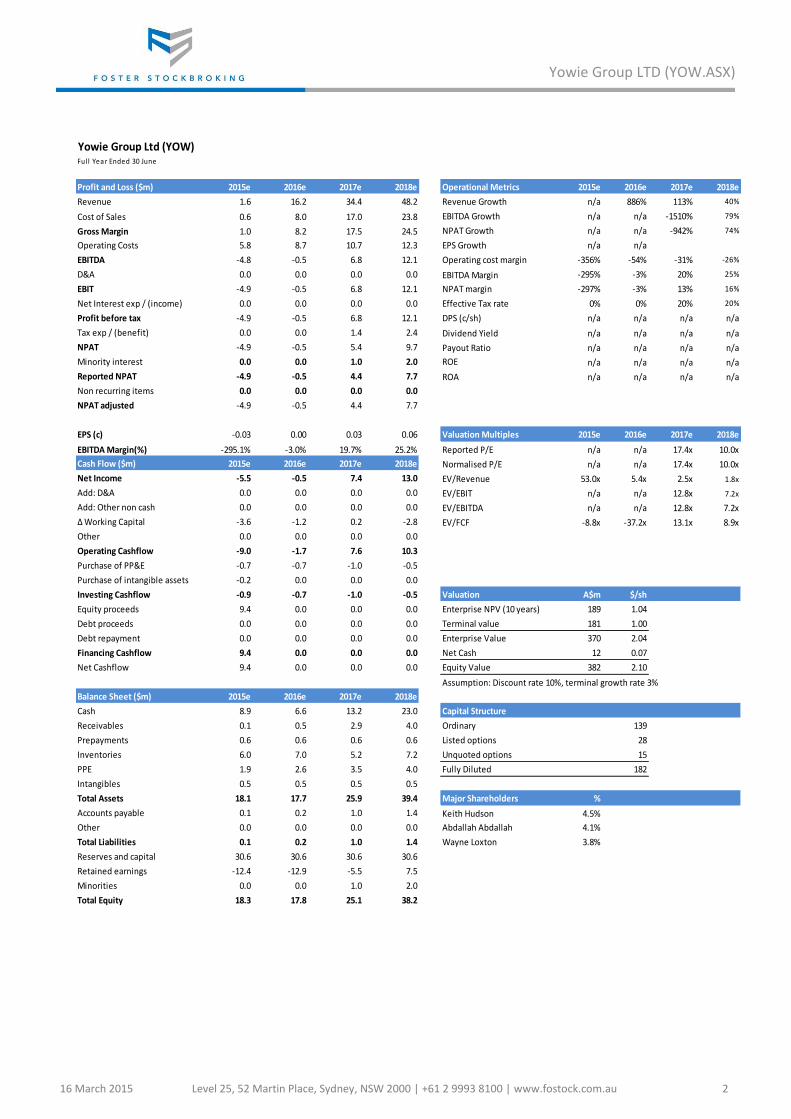
Yowie Group Ltd (YOW)Ful l Year Ended 30 June
Profit and Loss ($m) 2015e 2016e 2017e 2018e Operational Metrics 2015e 2016e 2017e 2018e
Revenue 1.6 16.2 34.4 48.2 Revenue Growth n/a 886% 113% 40%
Cost of Sales 0.6 8.0 17.0 23.8 EBITDA Growth n/a n/a -1510% 79%
Gross Margin 1.0 8.2 17.5 24.5 NPAT Growth n/a n/a -942% 74%
Operating Costs 5.8 8.7 10.7 12.3 EPS Growth n/a n/a
EBITDA -4.8 -0.5 6.8 12.1 Operating cost margin -356% -54% -31% -26%
D&A 0.0 0.0 0.0 0.0 EBITDA Margin -295% -3% 20% 25%
EBIT -4.9 -0.5 6.8 12.1 NPAT margin -297% -3% 13% 16%
Net Interest exp / (income) 0.0 0.0 0.0 0.0 Effective Tax rate 0% 0% 20% 20%
Profit before tax -4.9 -0.5 6.8 12.1 DPS (c/sh) n/a n/a n/a n/a
Tax exp / (benefit) 0.0 0.0 1.4 2.4 Dividend Yield n/a n/a n/a n/a
NPAT -4.9 -0.5 5.4 9.7 Payout Ratio n/a n/a n/a n/a
Minority interest 0.0 0.0 1.0 2.0 ROE n/a n/a n/a n/a
Reported NPAT -4.9 -0.5 4.4 7.7 ROA n/a n/a n/a n/a
Non recurring items 0.0 0.0 0.0 0.0
NPAT adjusted -4.9 -0.5 4.4 7.7
EPS (c) -0.03 0.00 0.03 0.06 Valuation Multiples 2015e 2016e 2017e 2018e
EBITDA Margin(%) -295.1% -3.0% 19.7% 25.2% Reported P/E n/a n/a 17.4x 10.0x
Cash Flow ($m) 2015e 2016e 2017e 2018e Normalised P/E n/a n/a 17.4x 10.0x
Net Income -5.5 -0.5 7.4 13.0 EV/Revenue 53.0x 5.4x 2.5x 1.8x
Add: D&A 0.0 0.0 0.0 0.0 EV/EBIT n/a n/a 12.8x 7.2x
Add: Other non cash 0.0 0.0 0.0 0.0 EV/EBITDA n/a n/a 12.8x 7.2x
Δ Working Capital -3.6 -1.2 0.2 -2.8 EV/FCF -8.8x -37.2x 13.1x 8.9x
Other 0.0 0.0 0.0 0.0
Operating Cashflow -9.0 -1.7 7.6 10.3
Purchase of PP&E -0.7 -0.7 -1.0 -0.5
Purchase of intangible assets -0.2 0.0 0.0 0.0
Investing Cashflow -0.9 -0.7 -1.0 -0.5 Valuation A$m $/sh
Equity proceeds 9.4 0.0 0.0 0.0 Enterprise NPV (10 years) 189 1.04
Debt proceeds 0.0 0.0 0.0 0.0 Terminal value 181 1.00
Debt repayment 0.0 0.0 0.0 0.0 Enterprise Value 370 2.04
Financing Cashflow 9.4 0.0 0.0 0.0 Net Cash 12 0.07
Net Cashflow 9.4 0.0 0.0 0.0 Equity Value 382 2.10
Assumption: Discount rate 10%, terminal growth rate 3%
Balance Sheet ($m) 2015e 2016e 2017e 2018e
Cash 8.9 6.6 13.2 23.0 Capital Structure
Receivables 0.1 0.5 2.9 4.0 Ordinary 139
Prepayments 0.6 0.6 0.6 0.6 Listed options 28
Inventories 6.0 7.0 5.2 7.2 Unquoted options 15
PPE 1.9 2.6 3.5 4.0 Fully Diluted 182
Intangibles 0.5 0.5 0.5 0.5
Total Assets 18.1 17.7 25.9 39.4 Major Shareholders %
Accounts payable 0.1 0.2 1.0 1.4 Keith Hudson 4.5%
Other 0.0 0.0 0.0 0.0 Abdallah Abdallah 4.1%
Total Liabilities 0.1 0.2 1.0 1.4 Wayne Loxton 3.8%
Reserves and capital 30.6 30.6 30.6 30.6
Retained earnings -12.4 -12.9 -5.5 7.5
Minorities 0.0 0.0 1.0 2.0
Total Equity 18.3 17.8 25.1 38.2
16 March 2015 Level 25, 52 Martin Place, Sydney, NSW 2000 | +61 2 9993 8100 | www.fostock.com.au 3
Yowie Group LTD (YOW.ASX)
COMPANY BACKGROUND – RELAUNCHING A PREVIOUSLY SUCCESSFUL BRAND
Yowie Group (‘YOW’) is an early stage growth company that is now well advanced on the re-
launch of the Yowie chocolate brand into the US market that will be followed by Australia and
New Zealand.
Yowie is similar to the Kinder Surprise chocolate/toy product with historical market sales data
indicating that it outsold Kinder Surprise in Australia back in the early 2000s, achieving more
than 40% of the $80m annual children's chocolate market.
YOW has a target to replicate the success of Kinder Surprise which is the only marketed
competitor in the encapsulated toy and chocolate space. Last year Kinder Surprise sold an
estimated 2B units globally; generating revenue of US$3.6B which excludes the US where
Kinder Surprise is not sold due to regulatory restrictions.
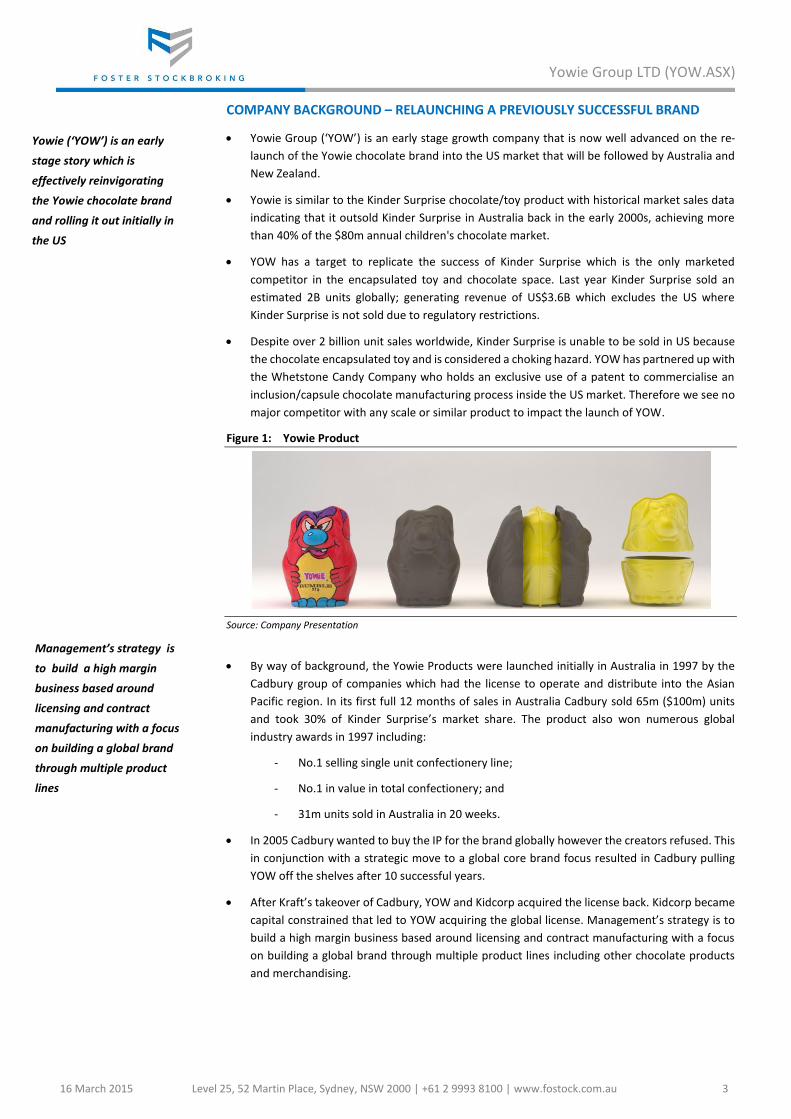
Despite over 2 billion unit sales worldwide, Kinder Surprise is unable to be sold in US because
the chocolate encapsulated toy and is considered a choking hazard. YOW has partnered up with
the Whetstone Candy Company who holds an exclusive use of a patent to commercialise an
inclusion/capsule chocolate manufacturing process inside the US market. Therefore we see no
major competitor with any scale or similar product to impact the launch of YOW.
Figure 1: Yowie Product
Source: Company Presentation
By way of background, the Yowie Products were launched initially in Australia in 1997 by the
Cadbury group of companies which had the license to operate and distribute into the Asian
Pacific region. In its first full 12 months of sales in Australia Cadbury sold 65m ($100m) units
and took 30% of Kinder Surprise’s market share. The product also won numerous global
industry awards in 1997 including:
- No.1 selling single unit confectionery line;
- No.1 in value in total confectionery; and
- 31m units sold in Australia in 20 weeks.
In 2005 Cadbury wanted to buy the IP for the brand globally however the creators refused. This
in conjunction with a strategic move to a global core brand focus resulted in Cadbury pulling
YOW off the shelves after 10 successful years.
After Kraft’s takeover of Cadbury, YOW and Kidcorp acquired the license back. Kidcorp became
capital constrained that led to YOW acquiring the global license. Management’s strategy is to
build a high margin business based around licensing and contract manufacturing with a focus
on building a global brand through multiple product lines including other chocolate products
and merchandising.
Yowie (‘YOW’) is an early
stage story which is
effectively reinvigorating
the Yowie chocolate brand
and rolling it out initially in
the US
Management’s strategy is
to build a high margin
business based around
licensing and contract
manufacturing with a focus
on building a global brand
through multiple product
lines
16 March 2015 Level 25, 52 Martin Place, Sydney, NSW 2000 | +61 2 9993 8100 | www.fostock.com.au 4
Yowie Group LTD (YOW.ASX)
WALMART SIGNS ON AS THE BEACHHEAD CUSTOMER
YOW is entering an exciting period as the company seeks to convert significant interest across
numerous trade channels to sales/distribution agreements. A number of sales/distribution
agreements have already been signed with the largest being retailing giant Walmart.
This is a very significant endorsement of the brand as Walmart is the largest retailer in the
world and the largest grocery retailer in the United States, with more than 4,000 stores and
800 club stores across the U.S. (this compares to Coles and Woolworths combined 1613
number of stores in Australia).
Yowie product is scheduled to be rolled out across 1,505 Walmart stores nationally during
March post a successful trial which was conducted in Q4CY14 across 50 stores in Texas. In our
view, to have the product progressed from a trial to a rollout is a significant endorsement
given the high attrition rate of products that progress from a trial to a rollout.
Our understanding is that an expanded rollout beyond the 1,500 stores (with a potential
+4,500 stores) is contingent on the product continuing to sell above a minimum sales
threshold which we believe to be in the range of 15-25 units per store per week. We highlight
positive sales rates were achieved during the trial ranging from 20-100 units per week per
store supporting the push for a broader rollout.
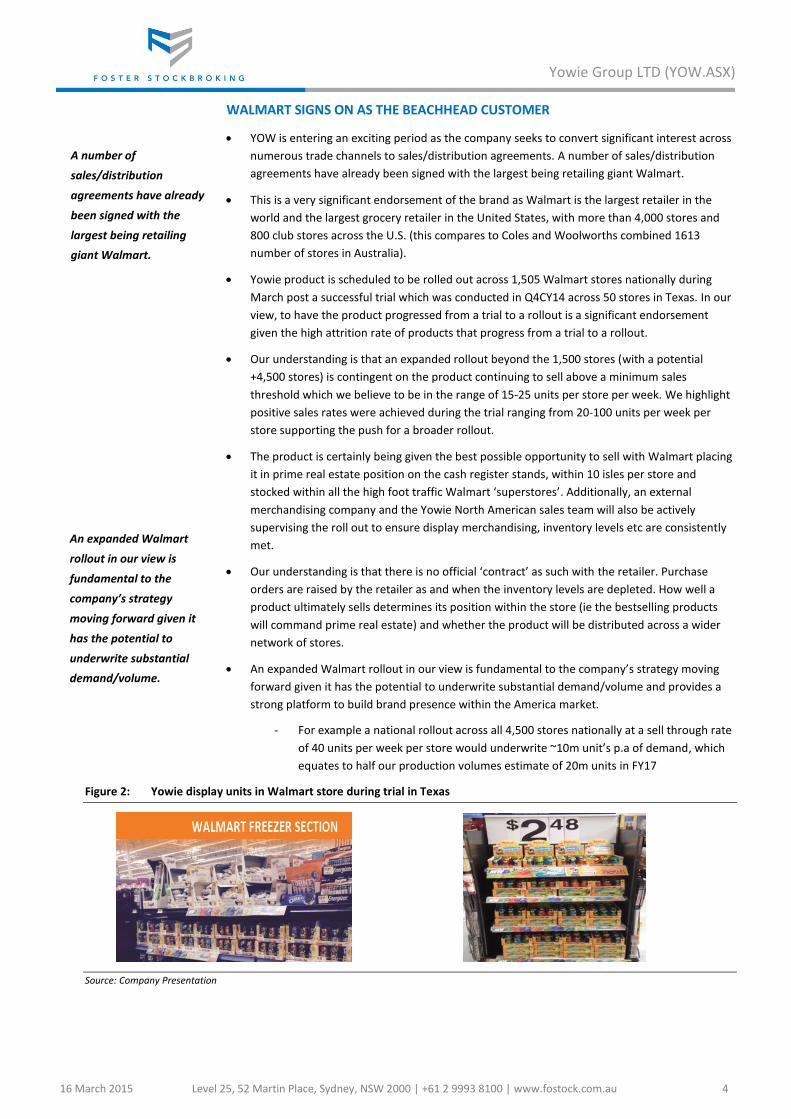
The product is certainly being given the best possible opportunity to sell with Walmart placing
it in prime real estate position on the cash register stands, within 10 isles per store and
stocked within all the high foot traffic Walmart ‘superstores’. Additionally, an external
merchandising company and the Yowie North American sales team will also be actively
supervising the roll out to ensure display merchandising, inventory levels etc are consistently
met.
Our understanding is that there is no official ‘contract’ as such with the retailer. Purchase
orders are raised by the retailer as and when the inventory levels are depleted. How well a
product ultimately sells determines its position within the store (ie the bestselling products
will command prime real estate) and whether the product will be distributed across a wider
network of stores.
An expanded Walmart rollout in our view is fundamental to the company’s strategy moving
forward given it has the potential to underwrite substantial demand/volume and provides a
strong platform to build brand presence within the America market.
- For example a national rollout across all 4,500 stores nationally at a sell through rate
of 40 units per week per store would underwrite ~10m unit’s p.a of demand, which
equates to half our production volumes estimate of 20m units in FY17
Figure 2: Yowie display units in Walmart store during trial in Texas
Source: Company Presentation
A number of
sales/distribution
agreements have already
been signed with the
largest being retailing
giant Walmart.
An expanded Walmart
rollout in our view is
fundamental to the
company’s strategy
moving forward given it
has the potential to
underwrite substantial
demand/volume.
16 March 2015 Level 25, 52 Martin Place, Sydney, NSW 2000 | +61 2 9993 8100 | www.fostock.com.au 5
Yowie Group LTD (YOW.ASX)
DISTRIBUTION INCREASING IN THE US In addition to Walmart Yowie has quickly established distribution network across 35 US
mainland States and in ~4,500 outlets. Sales and distribution are being led by in-country
management in conjunction with confectionary broker networks to provide national reach
across various trade channels. Yowie will be in 48 states with the initial Walmart roll out.
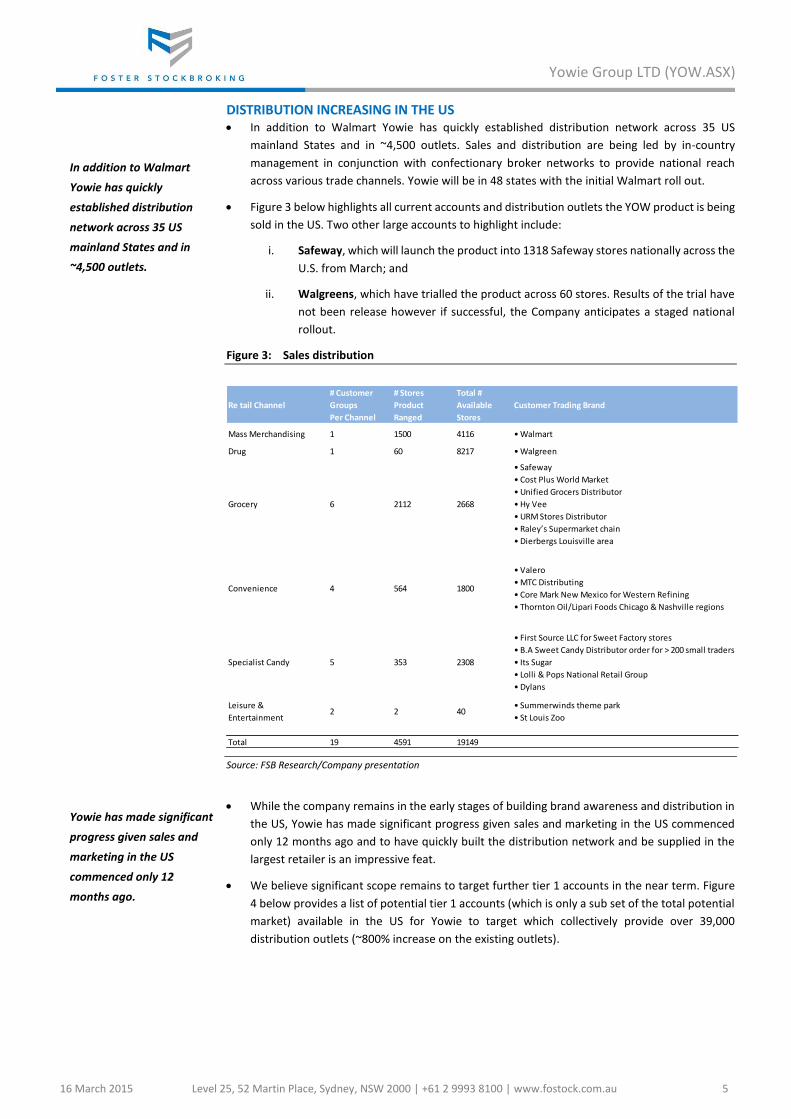
Figure 3 below highlights all current accounts and distribution outlets the YOW product is being
sold in the US. Two other large accounts to highlight include:
i. Safeway, which will launch the product into 1318 Safeway stores nationally across the
U.S. from March; and
ii. Walgreens, which have trialled the product across 60 stores. Results of the trial have
not been release however if successful, the Company anticipates a staged national
rollout.
Figure 3: Sales distribution
Source: FSB Research/Company presentation
While the company remains in the early stages of building brand awareness and distribution in
the US, Yowie has made significant progress given sales and marketing in the US commenced
only 12 months ago and to have quickly built the distribution network and be supplied in the
largest retailer is an impressive feat.
We believe significant scope remains to target further tier 1 accounts in the near term. Figure
4 below provides a list of potential tier 1 accounts (which is only a sub set of the total potential
market) available in the US for Yowie to target which collectively provide over 39,000
distribution outlets (~800% increase on the existing outlets).
Re tail Channel
# Customer
Groups
Per Channel
# Stores
Product
Ranged
Total #
Available
Stores
Customer Trading Brand
Mass Merchandising 1 1500 4116 • Walmart
Drug 1 60 8217 • Walgreen
Grocery 6 2112 2668
• Safeway
• Cost Plus World Market
• Unified Grocers Distributor
• Hy Vee
• URM Stores Distributor
• Raley’s Supermarket chain
• Dierbergs Louisville area
Convenience 4 564 1800
• Valero
• MTC Distributing
• Core Mark New Mexico for Western Refining
• Thornton Oil/Lipari Foods Chicago & Nashville regions
Specialist Candy 5 353 2308
• First Source LLC for Sweet Factory stores
• B.A Sweet Candy Distributor order for > 200 small traders
• Its Sugar
• Lolli & Pops National Retail Group
• Dylans
Leisure &
Entertainment2 2 40
• Summerwinds theme park
• St Louis Zoo
Total 19 4591 19149
In addition to Walmart
Yowie has quickly
established distribution
network across 35 US
mainland States and in
~4,500 outlets.
Yowie has made significant
progress given sales and
marketing in the US
commenced only 12
months ago.
16 March 2015 Level 25, 52 Martin Place, Sydney, NSW 2000 | +61 2 9993 8100 | www.fostock.com.au 6
Yowie Group LTD (YOW.ASX)
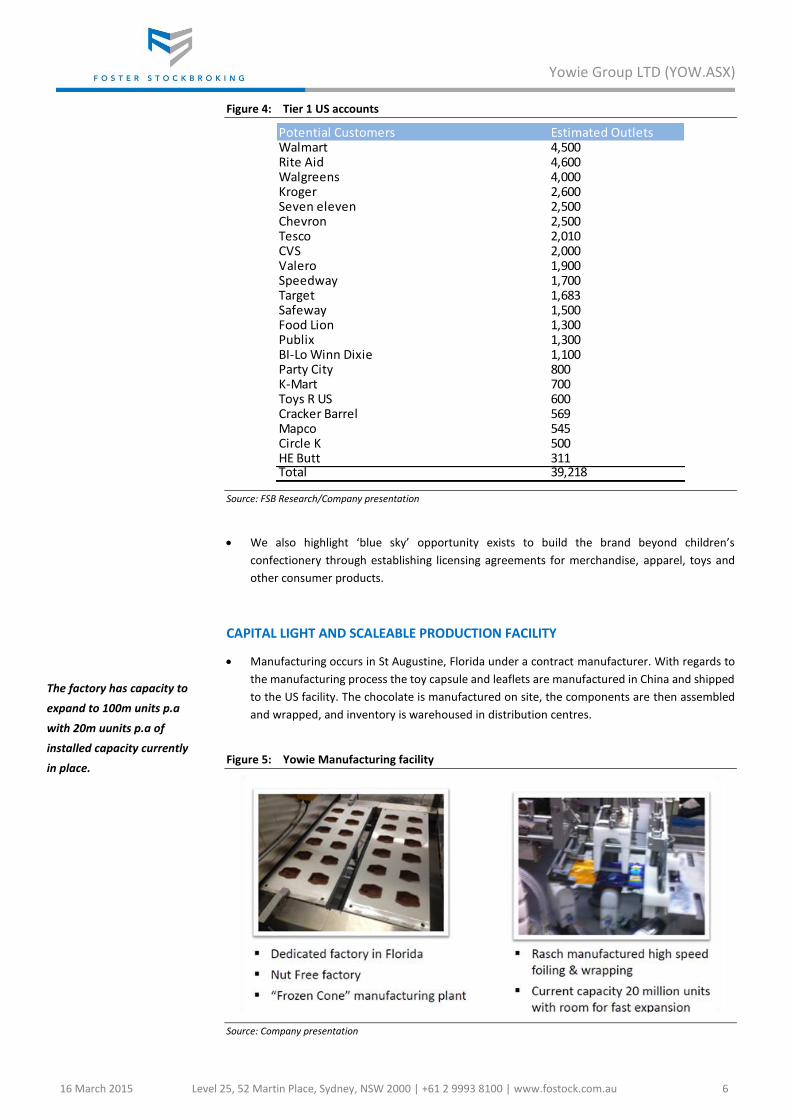
Figure 4: Tier 1 US accounts
Source: FSB Research/Company presentation
We also highlight ‘blue sky’ opportunity exists to build the brand beyond children’s
confectionery through establishing licensing agreements for merchandise, apparel, toys and
other consumer products.
CAPITAL LIGHT AND SCALEABLE PRODUCTION FACILITY
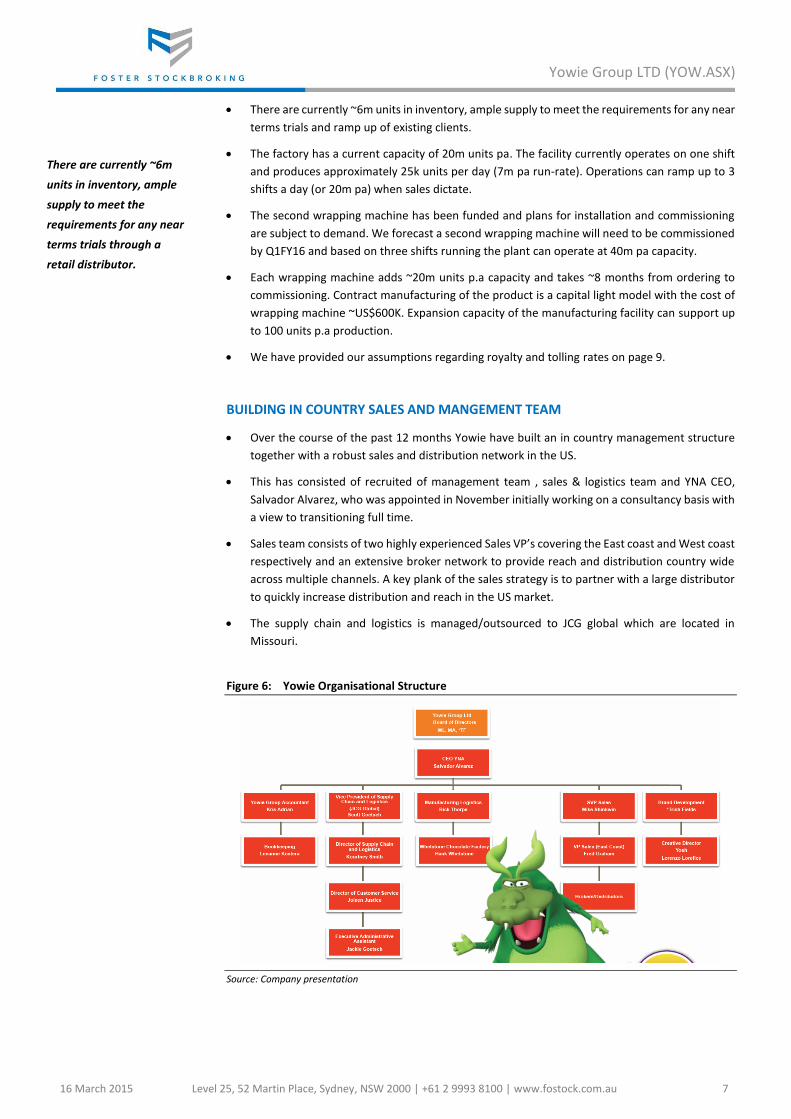
Manufacturing occurs in St Augustine, Florida under a contract manufacturer. With regards to
the manufacturing process the toy capsule and leaflets are manufactured in China and shipped
to the US facility. The chocolate is manufactured on site, the components are then assembled
and wrapped, and inventory is warehoused in distribution centres.
Figure 5: Yowie Manufacturing facility
Source: Company presentation
Potential Customers Estimated OutletsWalmart 4,500Rite Aid 4,600Walgreens 4,000Kroger 2,600Seven eleven 2,500Chevron 2,500Tesco 2,010CVS 2,000Valero 1,900Speedway 1,700Target 1,683Safeway 1,500Food Lion 1,300Publix 1,300BI-Lo Winn Dixie 1,100Party City 800K-Mart 700Toys R US 600Cracker Barrel 569Mapco 545Circle K 500HE Butt 311Total 39,218
The factory has capacity to
expand to 100m units p.a
with 20m uunits p.a of
installed capacity currently
in place.
16 March 2015 Level 25, 52 Martin Place, Sydney, NSW 2000 | +61 2 9993 8100 | www.fostock.com.au 7
Yowie Group LTD (YOW.ASX)
There are currently ~6m units in inventory, ample supply to meet the requirements for any near
terms trials and ramp up of existing clients.
The factory has a current capacity of 20m units pa. The facility currently operates on one shift
and produces approximately 25k units per day (7m pa run-rate). Operations can ramp up to 3
shifts a day (or 20m pa) when sales dictate.
The second wrapping machine has been funded and plans for installation and commissioning
are subject to demand. We forecast a second wrapping machine will need to be commissioned
by Q1FY16 and based on three shifts running the plant can operate at 40m pa capacity.
Each wrapping machine adds ~20m units p.a capacity and takes ~8 months from ordering to
commissioning. Contract manufacturing of the product is a capital light model with the cost of
wrapping machine ~US$600K. Expansion capacity of the manufacturing facility can support up
to 100 units p.a production.
We have provided our assumptions regarding royalty and tolling rates on page 9.
BUILDING IN COUNTRY SALES AND MANGEMENT TEAM
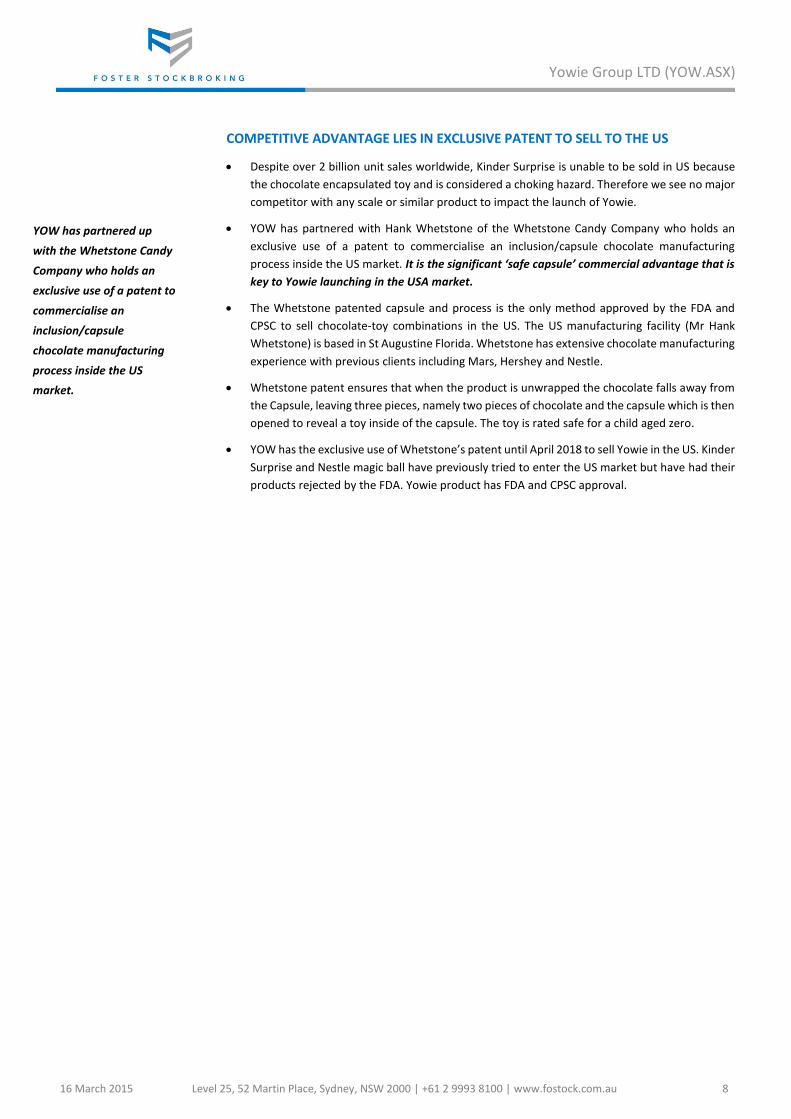
Over the course of the past 12 months Yowie have built an in country management structure
together with a robust sales and distribution network in the US.
This has consisted of recruited of management team , sales & logistics team and YNA CEO,
Salvador Alvarez, who was appointed in November initially working on a consultancy basis with
a view to transitioning full time.
Sales team consists of two highly experienced Sales VP’s covering the East coast and West coast
respectively and an extensive broker network to provide reach and distribution country wide
across multiple channels. A key plank of the sales strategy is to partner with a large distributor
to quickly increase distribution and reach in the US market.
The supply chain and logistics is managed/outsourced to JCG global which are located in
Missouri.
Figure 6: Yowie Organisational Structure
Source: Company presentation
There are currently ~6m
units in inventory, ample
supply to meet the
requirements for any near
terms trials through a
retail distributor.
16 March 2015 Level 25, 52 Martin Place, Sydney, NSW 2000 | +61 2 9993 8100 | www.fostock.com.au 8
Yowie Group LTD (YOW.ASX)
COMPETITIVE ADVANTAGE LIES IN EXCLUSIVE PATENT TO SELL TO THE US
Despite over 2 billion unit sales worldwide, Kinder Surprise is unable to be sold in US because
the chocolate encapsulated toy and is considered a choking hazard. Therefore we see no major
competitor with any scale or similar product to impact the launch of Yowie.
YOW has partnered with Hank Whetstone of the Whetstone Candy Company who holds an
exclusive use of a patent to commercialise an inclusion/capsule chocolate manufacturing
process inside the US market. It is the significant ‘safe capsule’ commercial advantage that is
key to Yowie launching in the USA market.
The Whetstone patented capsule and process is the only method approved by the FDA and
CPSC to sell chocolate-toy combinations in the US. The US manufacturing facility (Mr Hank
Whetstone) is based in St Augustine Florida. Whetstone has extensive chocolate manufacturing
experience with previous clients including Mars, Hershey and Nestle.
Whetstone patent ensures that when the product is unwrapped the chocolate falls away from
the Capsule, leaving three pieces, namely two pieces of chocolate and the capsule which is then
opened to reveal a toy inside of the capsule. The toy is rated safe for a child aged zero.
YOW has the exclusive use of Whetstone’s patent until April 2018 to sell Yowie in the US. Kinder
Surprise and Nestle magic ball have previously tried to enter the US market but have had their
products rejected by the FDA. Yowie product has FDA and CPSC approval.
YOW has partnered up
with the Whetstone Candy
Company who holds an
exclusive use of a patent to
commercialise an
inclusion/capsule
chocolate manufacturing
process inside the US
market.
16 March 2015 Level 25, 52 Martin Place, Sydney, NSW 2000 | +61 2 9993 8100 | www.fostock.com.au 9
Yowie Group LTD (YOW.ASX)
EARNINGS FORECAST
Given Yowie is in its early stages of growth and management is yet to provide meaningful
guidance to the market we have made an estimate on future revenue and earnings on the basis
of unit volume growth, which is a function of accounts/distribution outlets and the average
weekly sales rate. Figure 7 highlights our projections for number of units sold per annum which
we forecast to grow from 11.7m units in FY16 to 24.95m by FY17. These estimates are for the
US market only.
We have assumed a sales rate of 32 units per store per week on average across all the stores.
Average weekly sales rate is the key driver in our volume forecast and we will adjust accordingly
as actual numbers are communicated. We consider this to be conservative.
We have assumed that Walmart will progressively expand their distribution through FY15 from
1,500 stores to across 4,500 stores and in the early years represents a significant portion (~45%)
of total production volume.
We have assumed Growth in distribution/outlets from 3,500 to 9,996 in FY16 which is primarily
a function of new accounts and organic growth of existing accounts.
Figure 7: Unit volume projections
Source: FSB Research
Figure 8 below provides a conceptual earnings model key assumptions include:
- Net sell price $1.40/unit: Our understanding is the listed sell price between accounts
varies from $1.60 - $1.90 per unit. We have assumed net sell price $1.40 per unit which
factors in any promotional discounts, spoilage and commissions.
- Cost of goods $0.70/unit: We have assumed variable costs of $0..70 per unit which
accounts for raw materials (chocolate, foils, labels, toys, capsules etc), warehousing,
freight and packaging. We have kept the COG per unit constant to ere on the
conservative side, this should theoretically decrease with economies of scale.
- Royalty $0.04/unit: Our understanding is that the royalty payable to Whetstone for
the exclusive use of the patent is $0.04 per unit and is applicable until April 2018.
- Tolling Cost $0.24 reducing to $0.12/unit: We have assumed a sliding scale tolling
cost as production increases starting at $0.24 per unit based on production of 7m units
p.a (1 wrapper and 1 shift) reducing to $0.12 per unit as production ramps up to 40m
units p.a.
Based on our assumption outlined in Figure 8 we believe YOW can achieve profitability at a
sales run rate of ~12m units p.a which we forecast to occur in Q3 FY16 with NPAT growing to
A$20.79m by FY19 based on annual sales of 49m units.
We forecast EBIT margin per unit of $0.30 growing to $0.40 based on 20m and 40m units p.a
respectively.
Unit volume projection FY15 Q1 Q2 Q3 Q4 FY16 FY17 FY18 FY19
Total stores outlets 3,500 4,550 5,915 7,690 9,996 9,996 14,995 20,992 29,389
sell through rate p/w 32 32 32 32 32 32 32 32 32
Total Volume (m) 5.82 1.89 2.46 3.20 4.16 11.71 24.95 34.93 48.90
Walmart
# Stores 1,500 1,950 2,535 3,296 4,284 4,500 4,500 4,500 4,500
% of total store 43% 43% 43% 43% 43% 45% 30% 21% 15%
16 March 2015 Level 25, 52 Martin Place, Sydney, NSW 2000 | +61 2 9993 8100 | www.fostock.com.au 10
Yowie Group LTD (YOW.ASX)
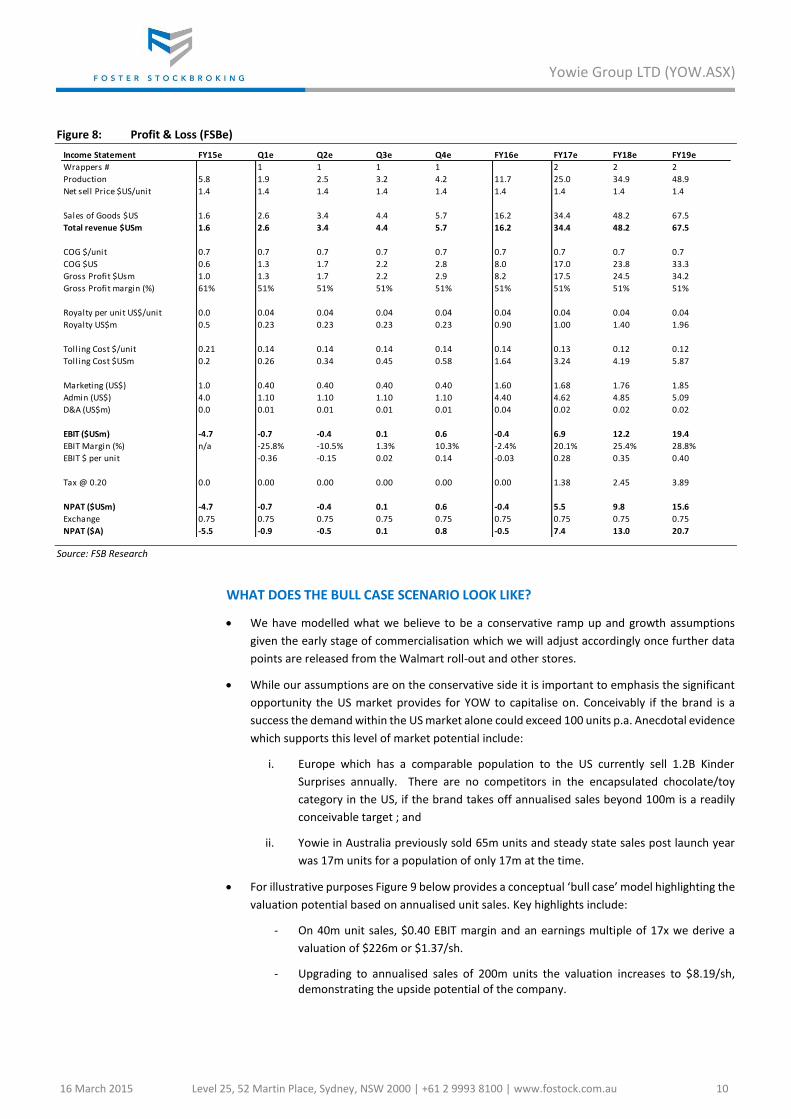
Figure 8: Profit & Loss (FSBe)
Source: FSB Research
WHAT DOES THE BULL CASE SCENARIO LOOK LIKE?
We have modelled what we believe to be a conservative ramp up and growth assumptions
given the early stage of commercialisation which we will adjust accordingly once further data
points are released from the Walmart roll-out and other stores.
While our assumptions are on the conservative side it is important to emphasis the significant
opportunity the US market provides for YOW to capitalise on. Conceivably if the brand is a
success the demand within the US market alone could exceed 100 units p.a. Anecdotal evidence
which supports this level of market potential include:
i. Europe which has a comparable population to the US currently sell 1.2B Kinder
Surprises annually. There are no competitors in the encapsulated chocolate/toy
category in the US, if the brand takes off annualised sales beyond 100m is a readily
conceivable target ; and
ii. Yowie in Australia previously sold 65m units and steady state sales post launch year
was 17m units for a population of only 17m at the time.
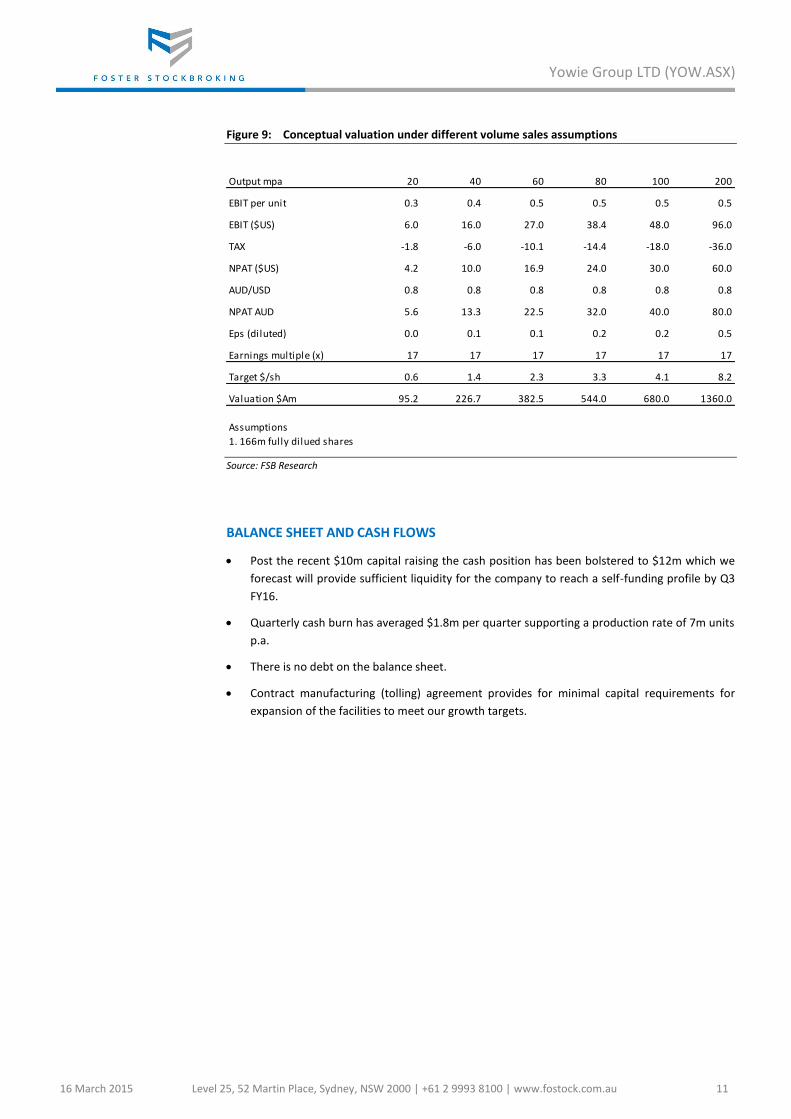
For illustrative purposes Figure 9 below provides a conceptual ‘bull case’ model highlighting the
valuation potential based on annualised unit sales. Key highlights include:
- On 40m unit sales, $0.40 EBIT margin and an earnings multiple of 17x we derive a
valuation of $226m or $1.37/sh.
- Upgrading to annualised sales of 200m units the valuation increases to $8.19/sh, demonstrating the upside potential of the company.
Income Statement FY15e Q1e Q2e Q3e Q4e FY16e FY17e FY18e FY19e
Wrappers # 1 1 1 1 2 2 2
Production 5.8 1.9 2.5 3.2 4.2 11.7 25.0 34.9 48.9
Net sell Price $US/unit 1.4 1.4 1.4 1.4 1.4 1.4 1.4 1.4 1.4
Sales of Goods $US 1.6 2.6 3.4 4.4 5.7 16.2 34.4 48.2 67.5
Total revenue $USm 1.6 2.6 3.4 4.4 5.7 16.2 34.4 48.2 67.5
COG $/unit 0.7 0.7 0.7 0.7 0.7 0.7 0.7 0.7 0.7
COG $US 0.6 1.3 1.7 2.2 2.8 8.0 17.0 23.8 33.3
Gross Profit $Usm 1.0 1.3 1.7 2.2 2.9 8.2 17.5 24.5 34.2
Gross Profit margin (%) 61% 51% 51% 51% 51% 51% 51% 51% 51%
Royalty per unit US$/unit 0.0 0.04 0.04 0.04 0.04 0.04 0.04 0.04 0.04
Royalty US$m 0.5 0.23 0.23 0.23 0.23 0.90 1.00 1.40 1.96
Tolling Cost $/unit 0.21 0.14 0.14 0.14 0.14 0.14 0.13 0.12 0.12
Tolling Cost $USm 0.2 0.26 0.34 0.45 0.58 1.64 3.24 4.19 5.87
Marketing (US$) 1.0 0.40 0.40 0.40 0.40 1.60 1.68 1.76 1.85
Admin (US$) 4.0 1.10 1.10 1.10 1.10 4.40 4.62 4.85 5.09
D&A (US$m) 0.0 0.01 0.01 0.01 0.01 0.04 0.02 0.02 0.02
EBIT ($USm) -4.7 -0.7 -0.4 0.1 0.6 -0.4 6.9 12.2 19.4
EBIT Margin (%) n/a -25.8% -10.5% 1.3% 10.3% -2.4% 20.1% 25.4% 28.8%
EBIT $ per unit -0.36 -0.15 0.02 0.14 -0.03 0.28 0.35 0.40
Tax @ 0.20 0.0 0.00 0.00 0.00 0.00 0.00 1.38 2.45 3.89
NPAT ($USm) -4.7 -0.7 -0.4 0.1 0.6 -0.4 5.5 9.8 15.6
Exchange 0.75 0.75 0.75 0.75 0.75 0.75 0.75 0.75 0.75
NPAT ($A) -5.5 -0.9 -0.5 0.1 0.8 -0.5 7.4 13.0 20.7
16 March 2015 Level 25, 52 Martin Place, Sydney, NSW 2000 | +61 2 9993 8100 | www.fostock.com.au 11
Yowie Group LTD (YOW.ASX)
Figure 9: Conceptual valuation under different volume sales assumptions
Source: FSB Research
BALANCE SHEET AND CASH FLOWS
Post the recent $10m capital raising the cash position has been bolstered to $12m which we
forecast will provide sufficient liquidity for the company to reach a self-funding profile by Q3
FY16.
Quarterly cash burn has averaged $1.8m per quarter supporting a production rate of 7m units
p.a.
There is no debt on the balance sheet.
Contract manufacturing (tolling) agreement provides for minimal capital requirements for
expansion of the facilities to meet our growth targets.
Output mpa 20 40 60 80 100 200
EBIT per unit 0.3 0.4 0.5 0.5 0.5 0.5
EBIT ($US) 6.0 16.0 27.0 38.4 48.0 96.0
TAX -1.8 -6.0 -10.1 -14.4 -18.0 -36.0
NPAT ($US) 4.2 10.0 16.9 24.0 30.0 60.0
AUD/USD 0.8 0.8 0.8 0.8 0.8 0.8
NPAT AUD 5.6 13.3 22.5 32.0 40.0 80.0
Eps (diluted) 0.0 0.1 0.1 0.2 0.2 0.5
Earnings multiple (x) 17 17 17 17 17 17
Target $/sh 0.6 1.4 2.3 3.3 4.1 8.2
Valuation $Am 95.2 226.7 382.5 544.0 680.0 1360.0
Assumptions
1. 166m fully dilued shares
16 March 2015 Level 25, 52 Martin Place, Sydney, NSW 2000 | +61 2 9993 8100 | www.fostock.com.au 12
Yowie Group LTD (YOW.ASX)
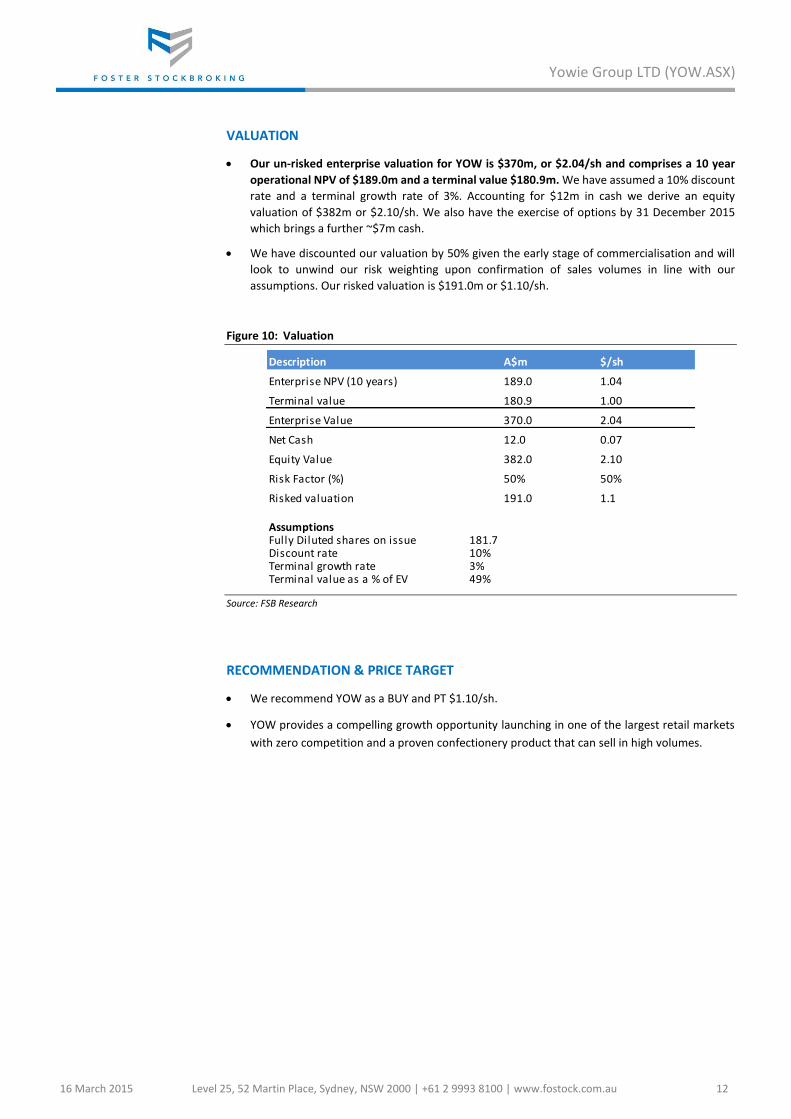
VALUATION
Our un-risked enterprise valuation for YOW is $370m, or $2.04/sh and comprises a 10 year
operational NPV of $189.0m and a terminal value $180.9m. We have assumed a 10% discount
rate and a terminal growth rate of 3%. Accounting for $12m in cash we derive an equity
valuation of $382m or $2.10/sh. We also have the exercise of options by 31 December 2015
which brings a further ~$7m cash.
We have discounted our valuation by 50% given the early stage of commercialisation and will
look to unwind our risk weighting upon confirmation of sales volumes in line with our
assumptions. Our risked valuation is $191.0m or $1.10/sh.
Figure 10: Valuation
Source: FSB Research
RECOMMENDATION & PRICE TARGET
We recommend YOW as a BUY and PT $1.10/sh.
YOW provides a compelling growth opportunity launching in one of the largest retail markets
with zero competition and a proven confectionery product that can sell in high volumes.
Description A$m $/sh
Enterprise NPV (10 years) 189.0 1.04
Terminal value 180.9 1.00
Enterprise Value 370.0 2.04
Net Cash 12.0 0.07
Equity Value 382.0 2.10
Risk Factor (%) 50% 50%
Risked valuation 191.0 1.1
AssumptionsFully Diluted shares on issue 181.7Discount rate 10%Terminal growth rate 3%Terminal value as a % of EV 49%
16 March 2015 Level 25, 52 Martin Place, Sydney, NSW 2000 | +61 2 9993 8100 | www.fostock.com.au 13
Yowie Group LTD (YOW.ASX)
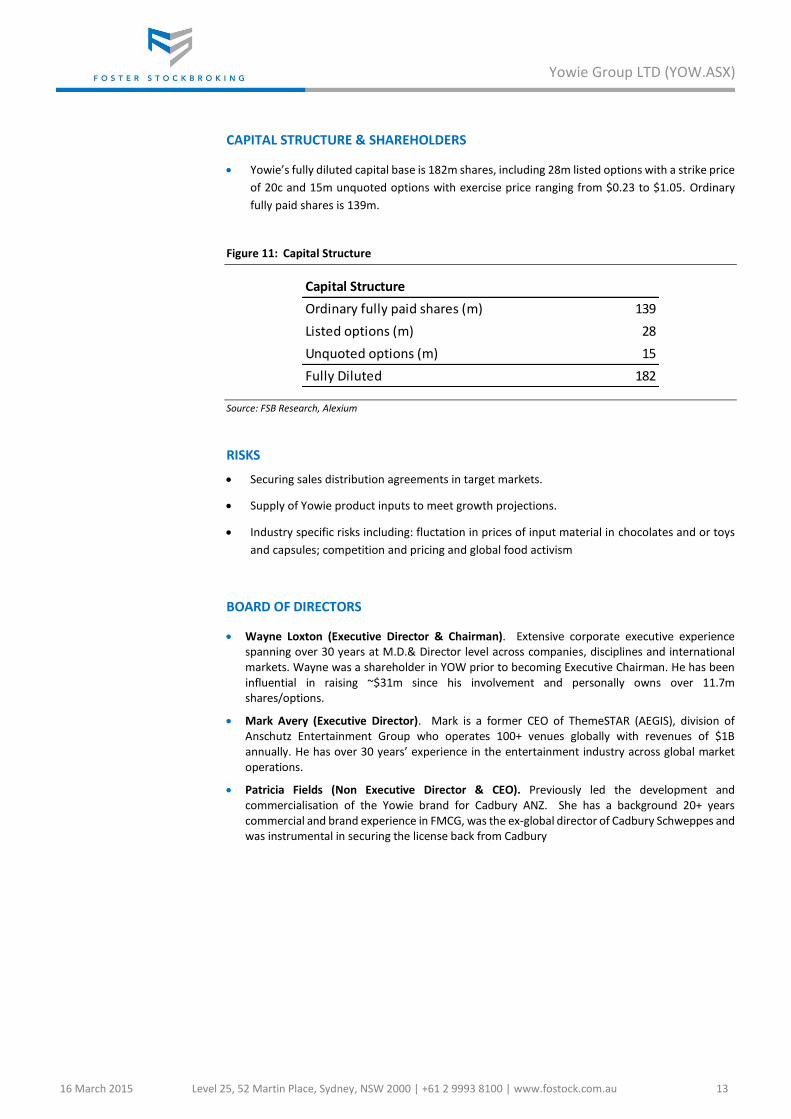
CAPITAL STRUCTURE & SHAREHOLDERS
Yowie’s fully diluted capital base is 182m shares, including 28m listed options with a strike price
of 20c and 15m unquoted options with exercise price ranging from $0.23 to $1.05. Ordinary
fully paid shares is 139m.
Figure 11: Capital Structure
Source: FSB Research, Alexium
RISKS
Securing sales distribution agreements in target markets.
Supply of Yowie product inputs to meet growth projections.
Industry specific risks including: fluctation in prices of input material in chocolates and or toys
and capsules; competition and pricing and global food activism
BOARD OF DIRECTORS
Wayne Loxton (Executive Director & Chairman). Extensive corporate executive experience spanning over 30 years at M.D.& Director level across companies, disciplines and international markets. Wayne was a shareholder in YOW prior to becoming Executive Chairman. He has been influential in raising ~$31m since his involvement and personally owns over 11.7m shares/options.
Mark Avery (Executive Director). Mark is a former CEO of ThemeSTAR (AEGIS), division of Anschutz Entertainment Group who operates 100+ venues globally with revenues of $1B annually. He has over 30 years’ experience in the entertainment industry across global market operations.
Patricia Fields (Non Executive Director & CEO). Previously led the development and commercialisation of the Yowie brand for Cadbury ANZ. She has a background 20+ years commercial and brand experience in FMCG, was the ex-global director of Cadbury Schweppes and was instrumental in securing the license back from Cadbury
Capital Structure
Ordinary fully paid shares (m) 139
Listed options (m) 28
Unquoted options (m) 15
Fully Diluted 182
9 March 2015 Level 25, 52 Martin Place, Sydney, NSW 2000 | +61 2 9993 8100 | www.fostock.com.au 14
Yowie Group Ltd (YOW.ASX)
FOSTER STOCKBROKING DIRECTORY
Name Role Phone Email
Stuart Foster Chief Executive Officer +61 2 9993 8131 [email protected]
Chris Francis Executive Director +61 2 9998 8167 [email protected]
Haris Khaliqi Executive Director +61 2 9993 8152 [email protected]
Martin Carolan Executive Director +61 2 9993 8168 [email protected]
Mark Fichera Executive Director +61 2 9993 8162 [email protected]
Mark Hinsley Executive Director +61 2 9993 8166 [email protected]
Kevin Massey Senior Equities Dealer +61 2 9993 8130 [email protected]
Tolga Dokumcu Execution & Dealing +61 2 9993 8144 [email protected]
George Mourtzouhos Execution & Dealing +61 2 9993 8136 [email protected]
Foster Stockbroking Pty Ltd
A.B.N. 15 088 747 148 AFSL No. 223687
Level 25, 52 Martin Place, Sydney, NSW 2000 Australia
General: +612 9993 8111 Equities: +612 9993 8100 Fax: +612 9993 8181
Email: [email protected]
PARTICIPANT OF ASX GROUP
Foster Stockbroking Pty Limited (Foster Stockbroking) has prepared this report by way of general information. This document contains only general securities information. The information contained in this report has been obtained from sources that were accurate at the time of issue. The information has not been independently verified. Foster Stockbroking does not warrant the accuracy or reliability of the information in this report. The report is current as of the date it has been published. In preparing the report, Foster Stockbroking did not take into account the specific investment objectives, financial situation or particular needs of any specific recipient. The report is published only for informational purposes and is not intended to be advice. This report is not a solicitation or an offer to buy or sell any financial product. Foster Stockbroking is not aware whether a recipient intends to rely on this report and is not aware of how it will be used by the recipient. Investors must obtain personal financial advice from their own investment adviser to determine whether the information contained in this report is appropriate to the investor’s financial circumstances. Recipients should not regard the report as a substitute for the exercise of their own judgment. The views expressed in this report are those of the analyst/s named on the cover page. No part of the compensation of the analyst is directly related to inclusion of specific recommendations or views in this report. The analyst/s receives compensation partly based on Foster Stockbroking revenues, including any investment banking and proprietary trading revenues, as well as performance measures such as accuracy and efficacy of both recommendations and research reports. Foster Stockbroking believes that the information contained in this document is correct and that any estimates, opinions, conclusions or recommendations are reasonably held or made at the time of its compilation in an honest and fair manner that is not compromised. However, no representation is made as to the accuracy, completeness or reliability of any estimates, opinions, conclusions or recommendations (which may change without notice) or other information contained in this report. To the maximum extent permitted by law, Foster Stockbroking disclaims all liability and responsibility for any direct or indirect loss that may be suffered by any recipient through relying on anything contained in or omitted from this report. Foster Stockbroking is under no obligation to update or keep current the information contained in this report and has no obligation to tell you when opinions or information in this report change. Foster Stockbroking and its directors, officers and employees or clients may have or had interests in the financial products referred to in this report and may make purchases or sales in those the financial products as principal or agent at any time and may affect transactions which may not be consistent with the opinions, conclusions or recommendations set out in this report. Foster Stockbroking and its Associates may earn brokerage, fees or other benefits from financial products referred to in this report. Furthermore, Foster Stockbroking may have or have had a relationship with or may provide or has provided investment banking, capital markets and/or other financial services to the relevant issuer or holder of those financial products. For an overview of the research criteria and methodology adopted by Foster Stockbroking; the spread of research ratings; and disclosure of the cessation of particular stock coverage, refer to our website http://www.fostock.com.au. Specific disclosure: Foster Stockbroking was the Lead manager to the placement of 20m shares at $0.50 per share to raise A$10m in February and received fees for this service
Specific disclosure: The analyst, Foster Stockbroking and/or associated parties have beneficial ownership or other interests in securities issued by YOW at the time of this report. Diligent care has been taken by the analyst to maintain an honest and fair objectivity in writing the report and making the recommendation.
![LEAP@HK “Leading Enterprises Acceleration Programme” · Coaching [HKD 600K] Professional Services [HKD 960K] Business Expansion [HKD 600K] 6 We Create Value Beyond Money through](https://img.pdfslide.us/doc/110x75/6051af1923a5480ec20c8336/leaphk-aoeleading-enterprises-acceleration-programmea-coaching-hkd-600k-professional.jpg)