Embed Size (px)
Citation preview

1Private and Confidential
Equity market - way forward
AcePro Advisors Pvt. Ltd.Asset Management
2018
2Private and Confidential
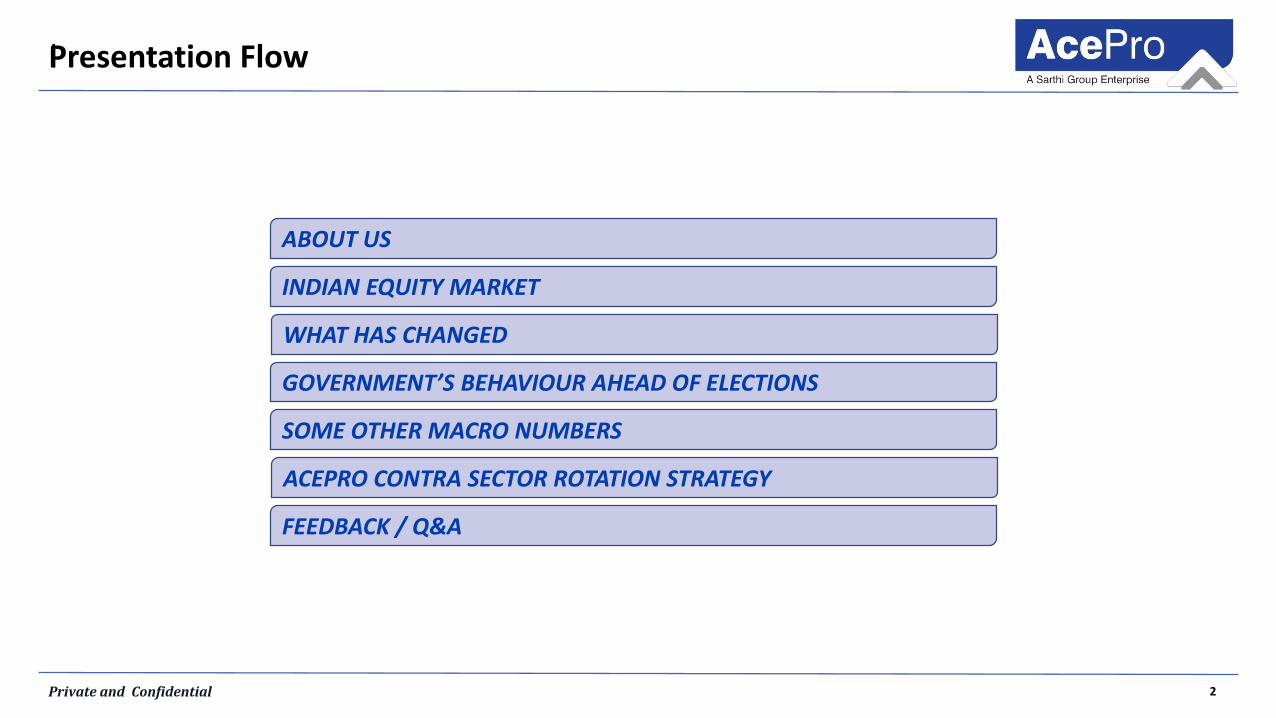
Presentation Flowl
ABOUT US
GOVERNMENT’S BEHAVIOUR AHEAD OF ELECTIONS
WHAT HAS CHANGED
INDIAN EQUITY MARKET
SOME OTHER MACRO NUMBERS
FEEDBACK / Q&A
ACEPRO CONTRA SECTOR ROTATION STRATEGY
3Private and Confidential
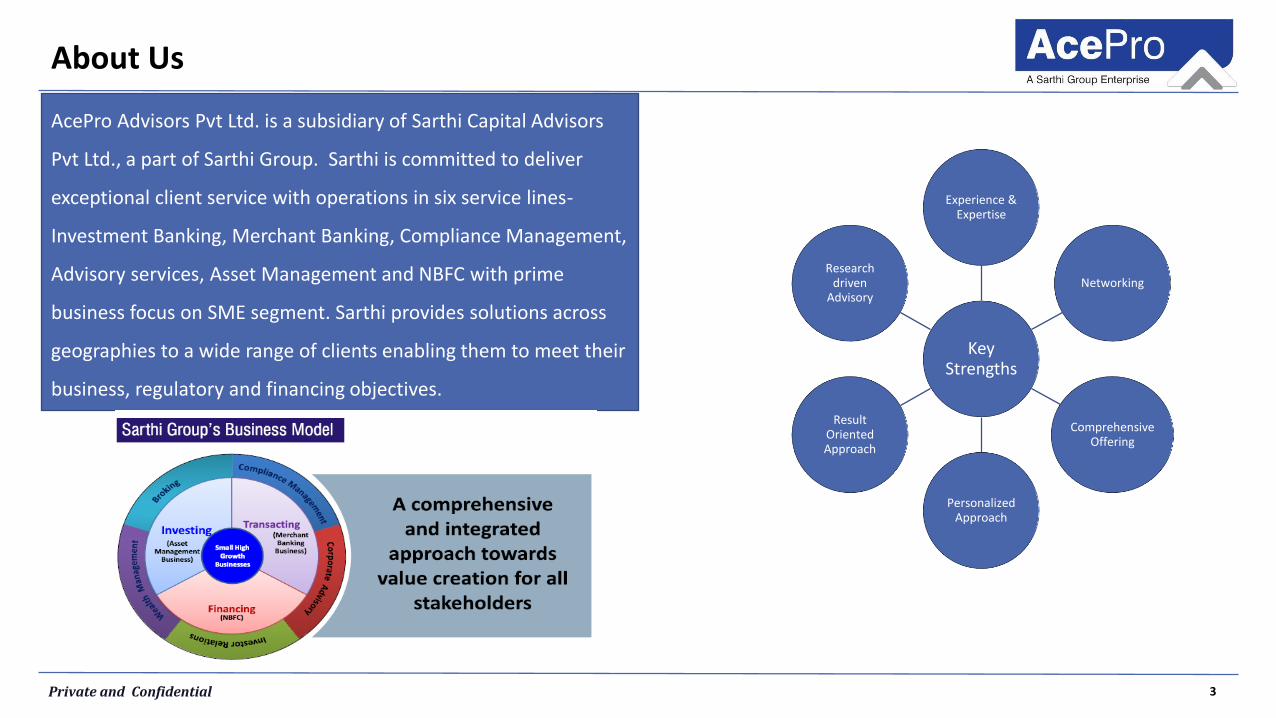
About Us
AcePro Advisors Pvt Ltd. is a subsidiary of Sarthi Capital Advisors
Pvt Ltd., a part of Sarthi Group. Sarthi is committed to deliver
exceptional client service with operations in six service lines-
Investment Banking, Merchant Banking, Compliance Management,
Advisory services, Asset Management and NBFC with prime
business focus on SME segment. Sarthi provides solutions across
geographies to a wide range of clients enabling them to meet their
business, regulatory and financing objectives.
Key Strengths
Experience & Expertise
Networking
Comprehensive Offering
Personalized Approach
Result Oriented Approach
Research driven
Advisory
4Private and Confidential
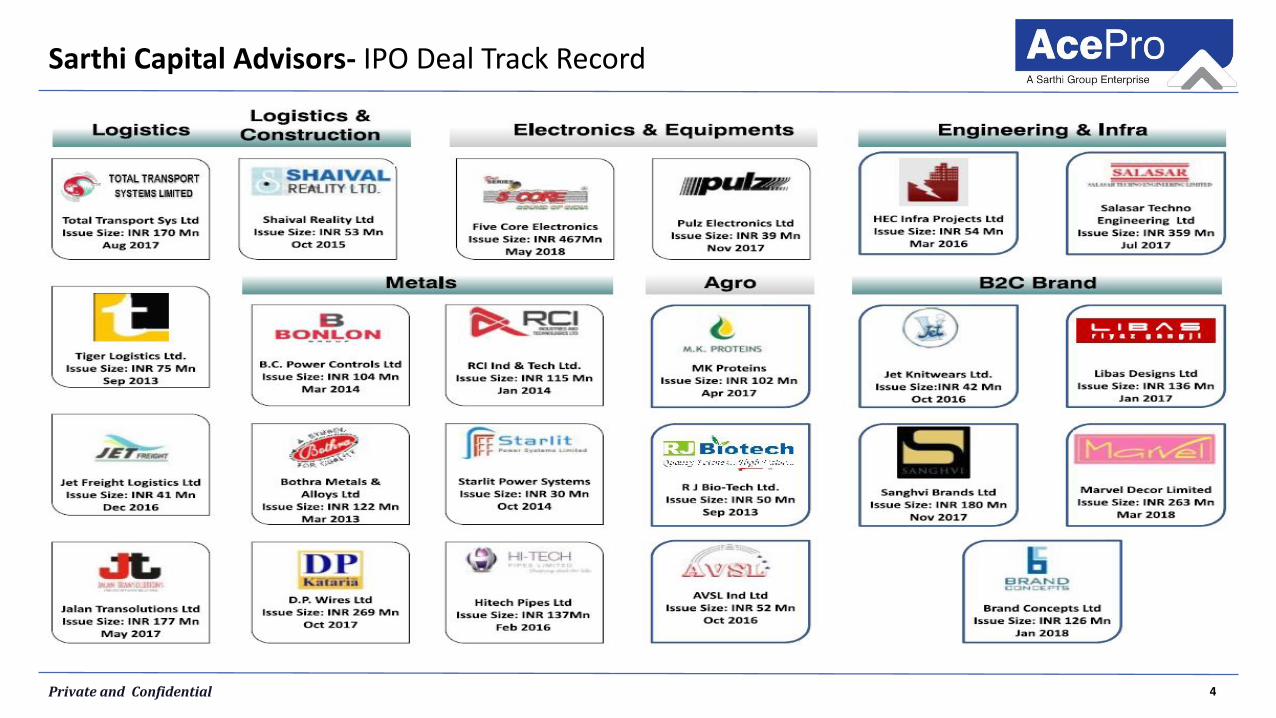
Sarthi Capital Advisors- IPO Deal Track Record
5Private and Confidential
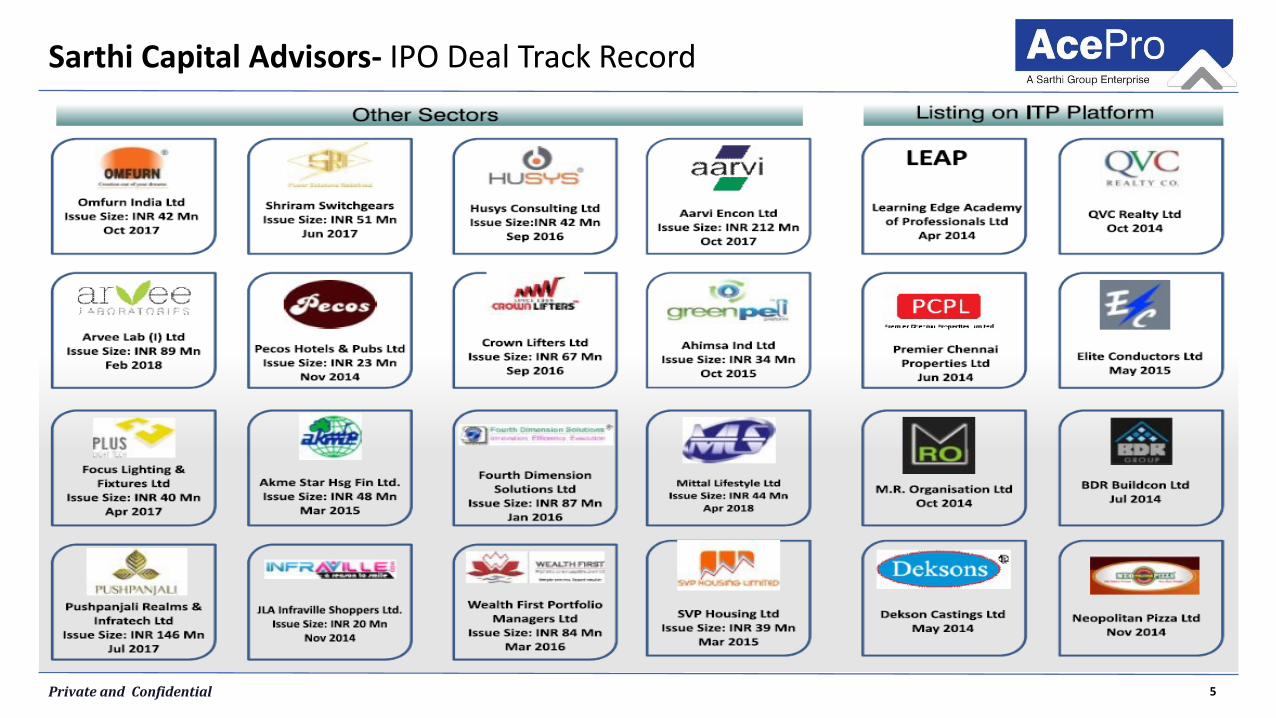
Sarthi Capital Advisors- IPO Deal Track Record

6Private and Confidential
Sarthi Capital Advisors- Best In The League….
7Private and Confidential
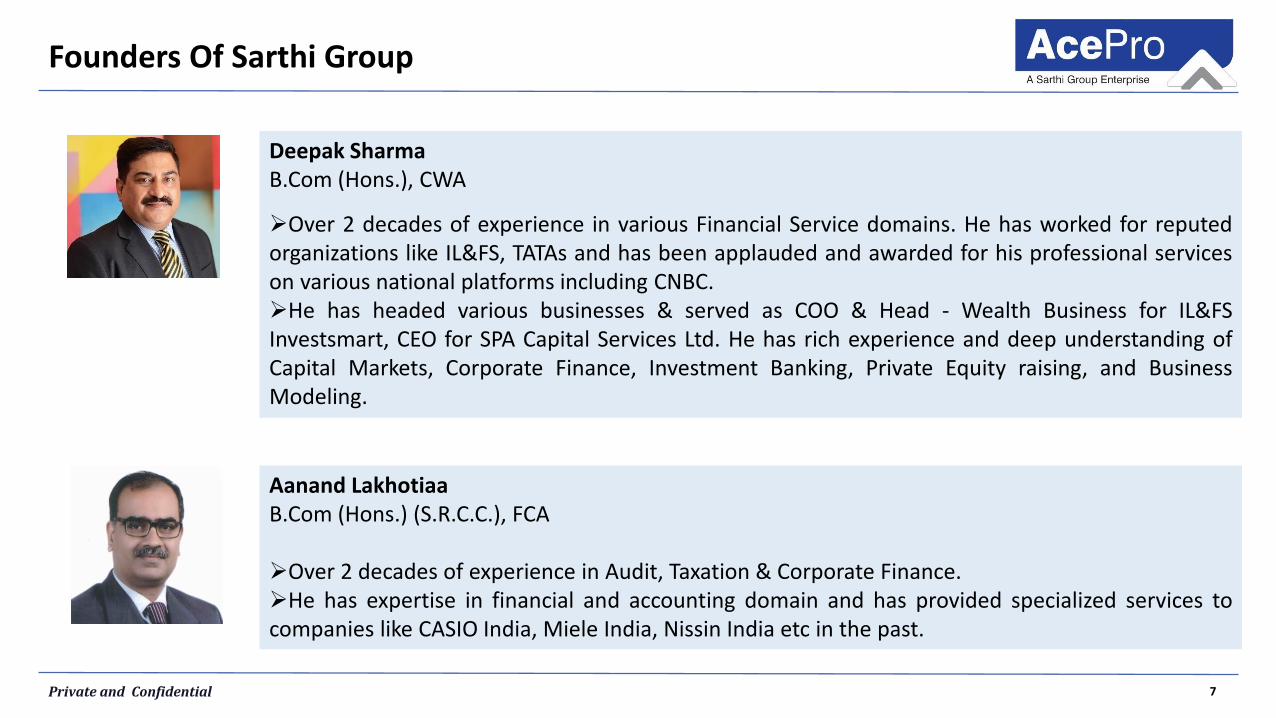
Founders Of Sarthi Group
Deepak SharmaB.Com (Hons.), CWA
Over 2 decades of experience in various Financial Service domains. He has worked for reputedorganizations like IL&FS, TATAs and has been applauded and awarded for his professional serviceson various national platforms including CNBC.He has headed various businesses & served as COO & Head - Wealth Business for IL&FSInvestsmart, CEO for SPA Capital Services Ltd. He has rich experience and deep understanding ofCapital Markets, Corporate Finance, Investment Banking, Private Equity raising, and BusinessModeling.
Aanand LakhotiaaB.Com (Hons.) (S.R.C.C.), FCA
Over 2 decades of experience in Audit, Taxation & Corporate Finance.He has expertise in financial and accounting domain and has provided specialized services tocompanies like CASIO India, Miele India, Nissin India etc in the past.
8Private and Confidential
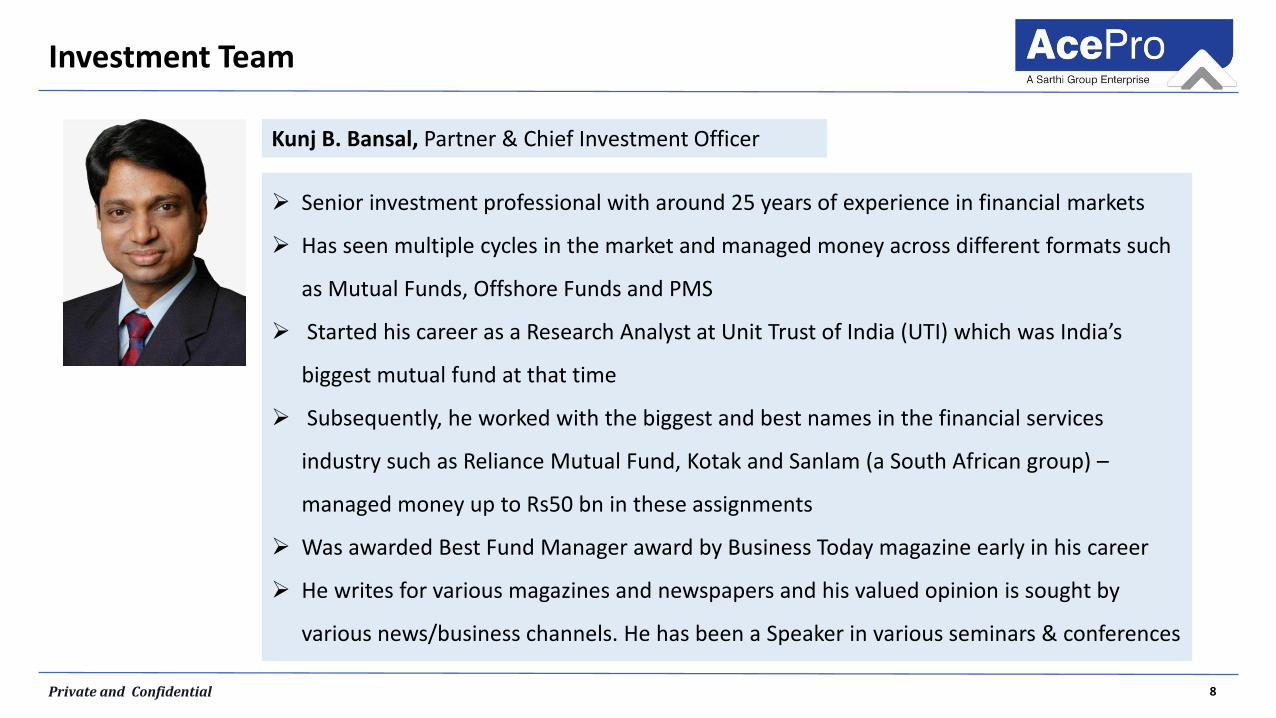
Senior investment professional with around 25 years of experience in financial markets
Has seen multiple cycles in the market and managed money across different formats such
as Mutual Funds, Offshore Funds and PMS
Started his career as a Research Analyst at Unit Trust of India (UTI) which was India’s
biggest mutual fund at that time
Subsequently, he worked with the biggest and best names in the financial services
industry such as Reliance Mutual Fund, Kotak and Sanlam (a South African group) –
managed money up to Rs50 bn in these assignments
Was awarded Best Fund Manager award by Business Today magazine early in his career
He writes for various magazines and newspapers and his valued opinion is sought by
various news/business channels. He has been a Speaker in various seminars & conferences
Kunj B. Bansal, Partner & Chief Investment Officer
Investment Team
9Private and Confidential
Investment Team
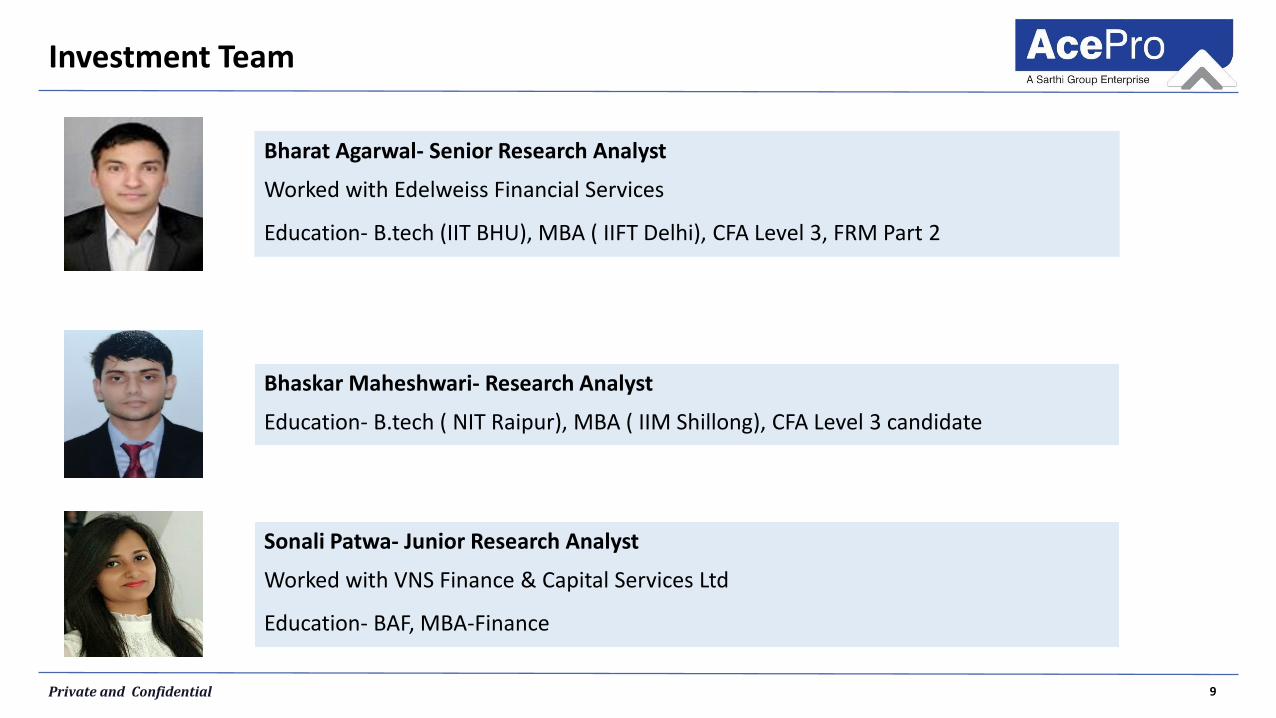
Bhaskar Maheshwari- Research Analyst
Education- B.tech ( NIT Raipur), MBA ( IIM Shillong), CFA Level 3 candidate
Bharat Agarwal- Senior Research Analyst
Worked with Edelweiss Financial Services
Education- B.tech (IIT BHU), MBA ( IIFT Delhi), CFA Level 3, FRM Part 2
Sonali Patwa- Junior Research Analyst
Worked with VNS Finance & Capital Services Ltd
Education- BAF, MBA-Finance

10Private and Confidential
INDIAN EQUITY MARKET
11Private and Confidential
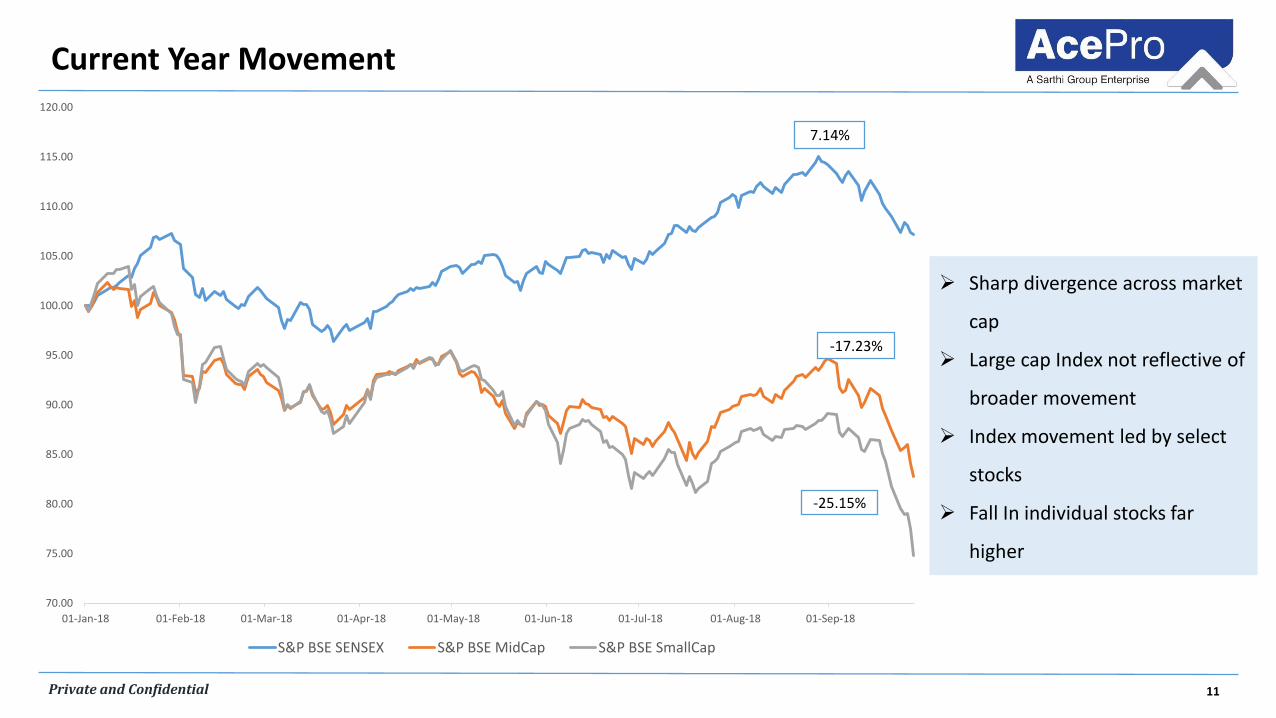
Current Year Movement
Sharp divergence across market
cap
Large cap Index not reflective of
broader movement
Index movement led by select
stocks
Fall In individual stocks far
higher
70.00
75.00
80.00
85.00
90.00
95.00
100.00
105.00
110.00
115.00
120.00
01-Jan-18 01-Feb-18 01-Mar-18 01-Apr-18 01-May-18 01-Jun-18 01-Jul-18 01-Aug-18 01-Sep-18
S&P BSE SENSEX S&P BSE MidCap S&P BSE SmallCap
7.14%
-17.23%
-25.15%
12Private and Confidential
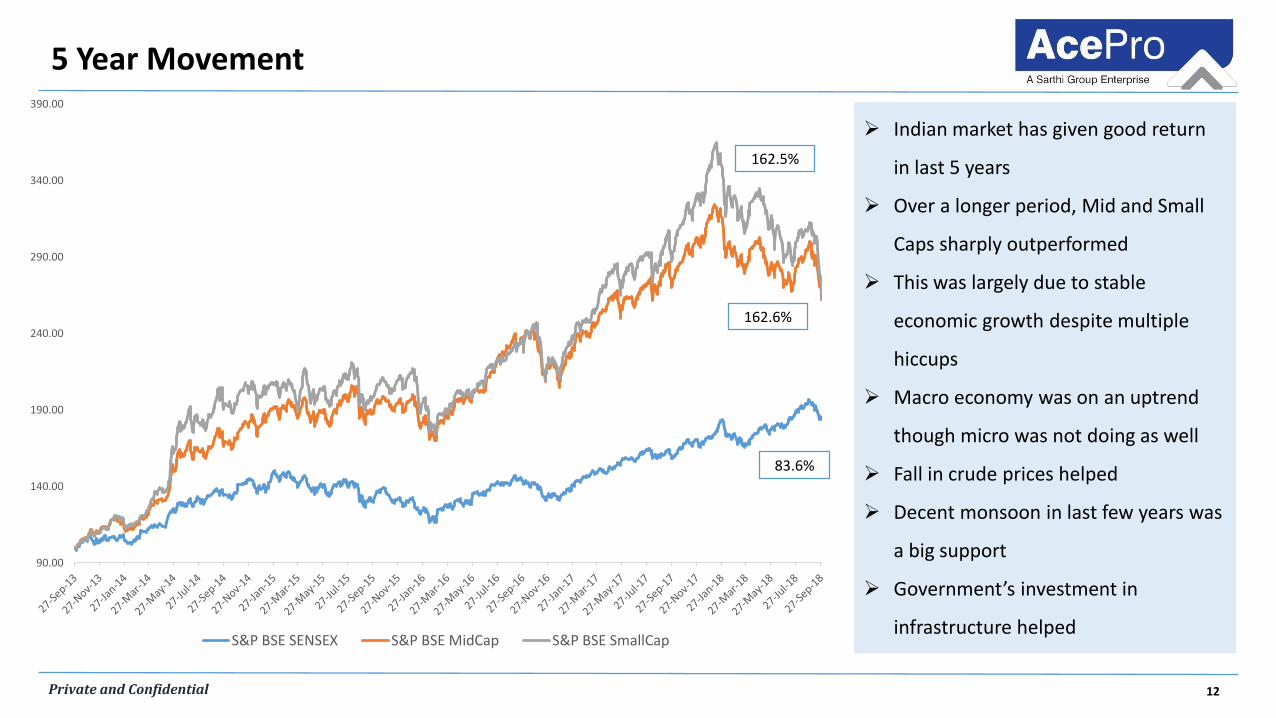
5 Year Movement
Indian market has given good return
in last 5 years
Over a longer period, Mid and Small
Caps sharply outperformed
This was largely due to stable
economic growth despite multiple
hiccups
Macro economy was on an uptrend
though micro was not doing as well
Fall in crude prices helped
Decent monsoon in last few years was
a big support
Government’s investment in
infrastructure helped
90.00
140.00
190.00
240.00
290.00
340.00
390.00
S&P BSE SENSEX S&P BSE MidCap S&P BSE SmallCap
83.6%
162.6%
162.5%
13Private and Confidential
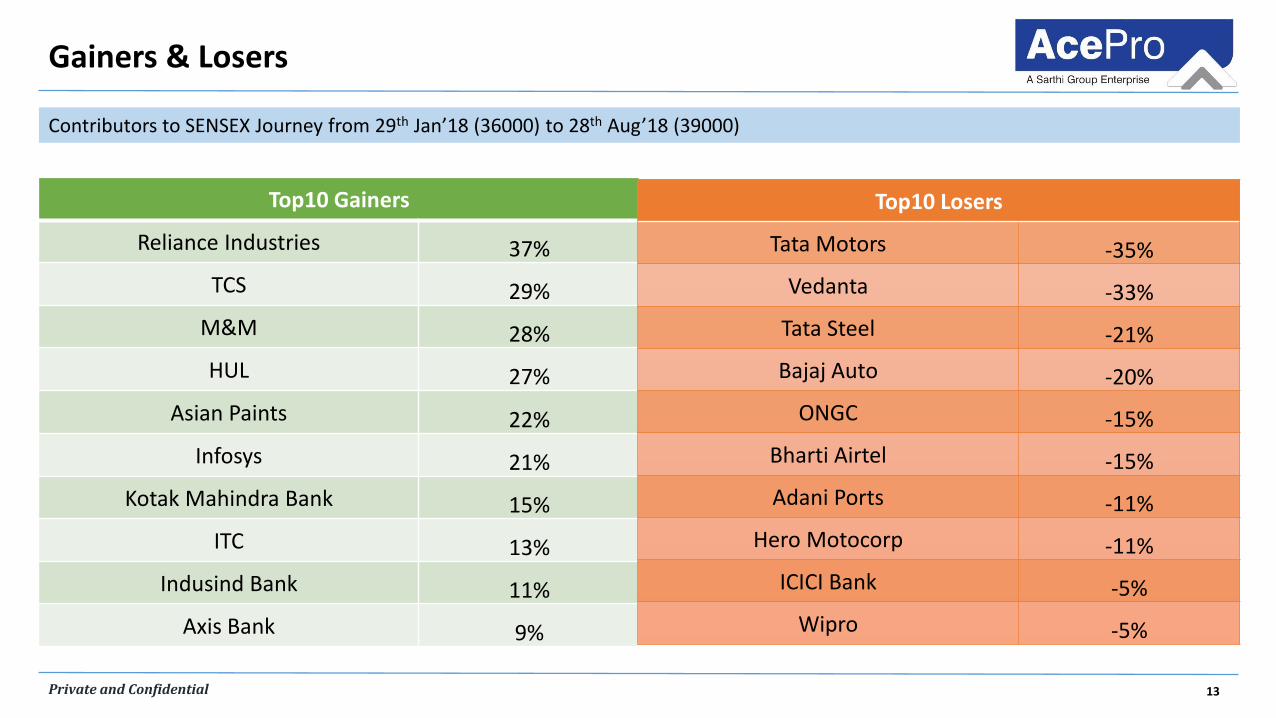
Gainers & Losers
Contributors to SENSEX Journey from 29th Jan’18 (36000) to 28th Aug’18 (39000)
Top10 Gainers
Reliance Industries 37%
TCS 29%
M&M 28%
HUL 27%
Asian Paints 22%
Infosys 21%
Kotak Mahindra Bank 15%
ITC 13%
Indusind Bank 11%
Axis Bank 9%
Top10 Losers
Tata Motors -35%
Vedanta -33%
Tata Steel -21%
Bajaj Auto -20%
ONGC -15%
Bharti Airtel -15%
Adani Ports -11%
Hero Motocorp -11%
ICICI Bank -5%
Wipro -5%
14Private and Confidential
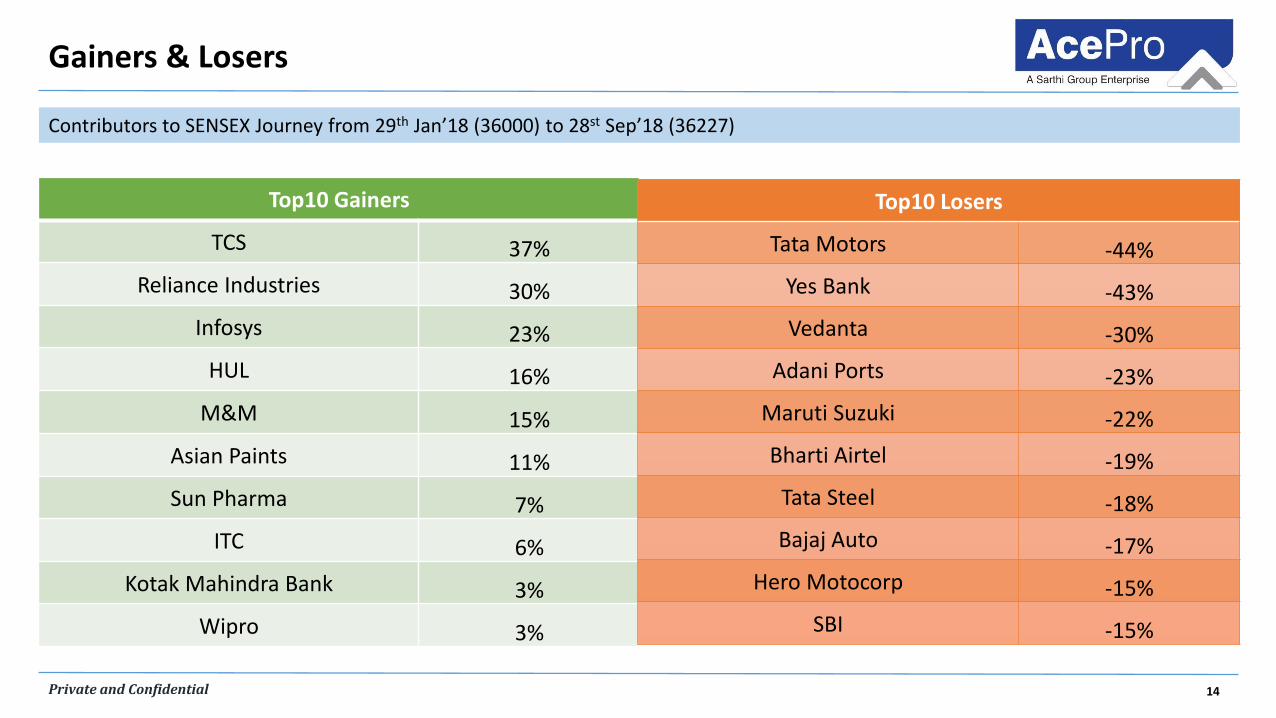
Gainers & Losers
Contributors to SENSEX Journey from 29th Jan’18 (36000) to 28st Sep’18 (36227)
Top10 Gainers
TCS 37%
Reliance Industries 30%
Infosys 23%
HUL 16%
M&M 15%
Asian Paints 11%
Sun Pharma 7%
ITC 6%
Kotak Mahindra Bank 3%
Wipro 3%
Top10 Losers
Tata Motors -44%
Yes Bank -43%
Vedanta -30%
Adani Ports -23%
Maruti Suzuki -22%
Bharti Airtel -19%
Tata Steel -18%
Bajaj Auto -17%
Hero Motocorp -15%
SBI -15%

15Private and Confidential
WHAT HAS CHANGED….?
16Private and Confidential
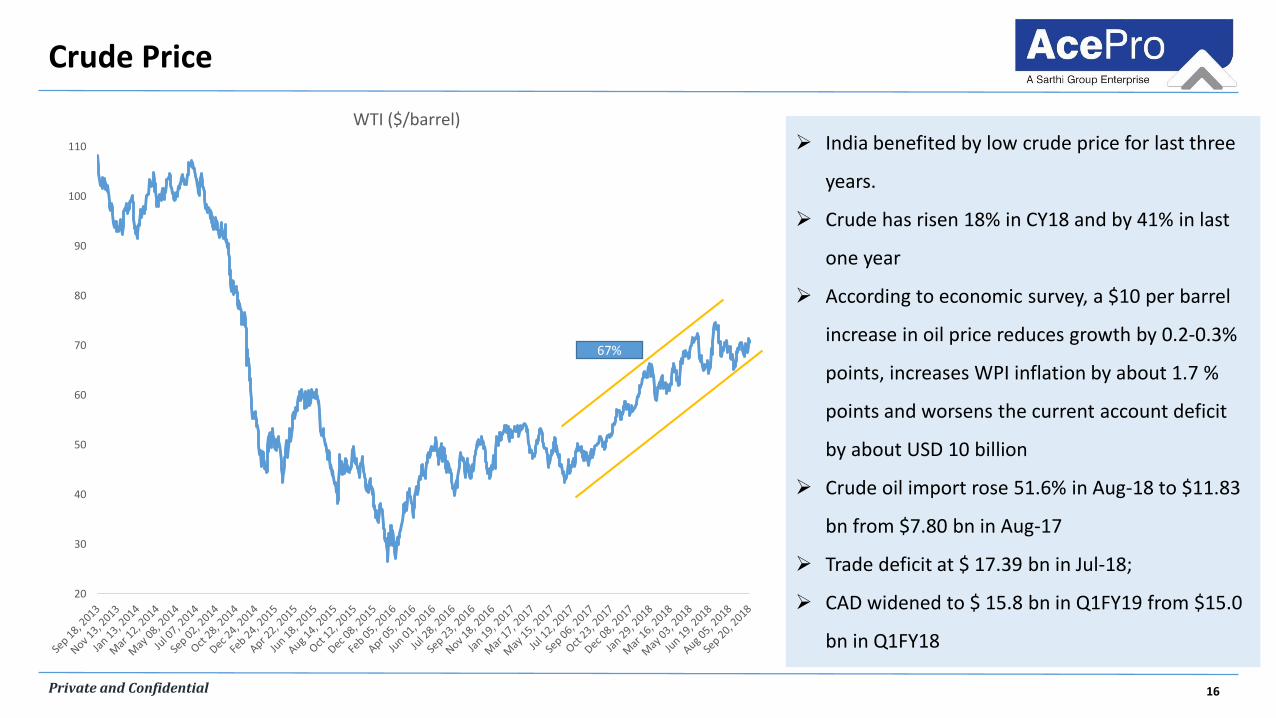
Crude Price
India benefited by low crude price for last three
years.
Crude has risen 18% in CY18 and by 41% in last
one year
According to economic survey, a $10 per barrel
increase in oil price reduces growth by 0.2-0.3%
points, increases WPI inflation by about 1.7 %
points and worsens the current account deficit
by about USD 10 billion
Crude oil import rose 51.6% in Aug-18 to $11.83
bn from $7.80 bn in Aug-17
Trade deficit at $ 17.39 bn in Jul-18;
CAD widened to $ 15.8 bn in Q1FY19 from $15.0
bn in Q1FY18
20
30
40
50
60
70
80
90
100
110
WTI ($/barrel)
67%
17Private and Confidential
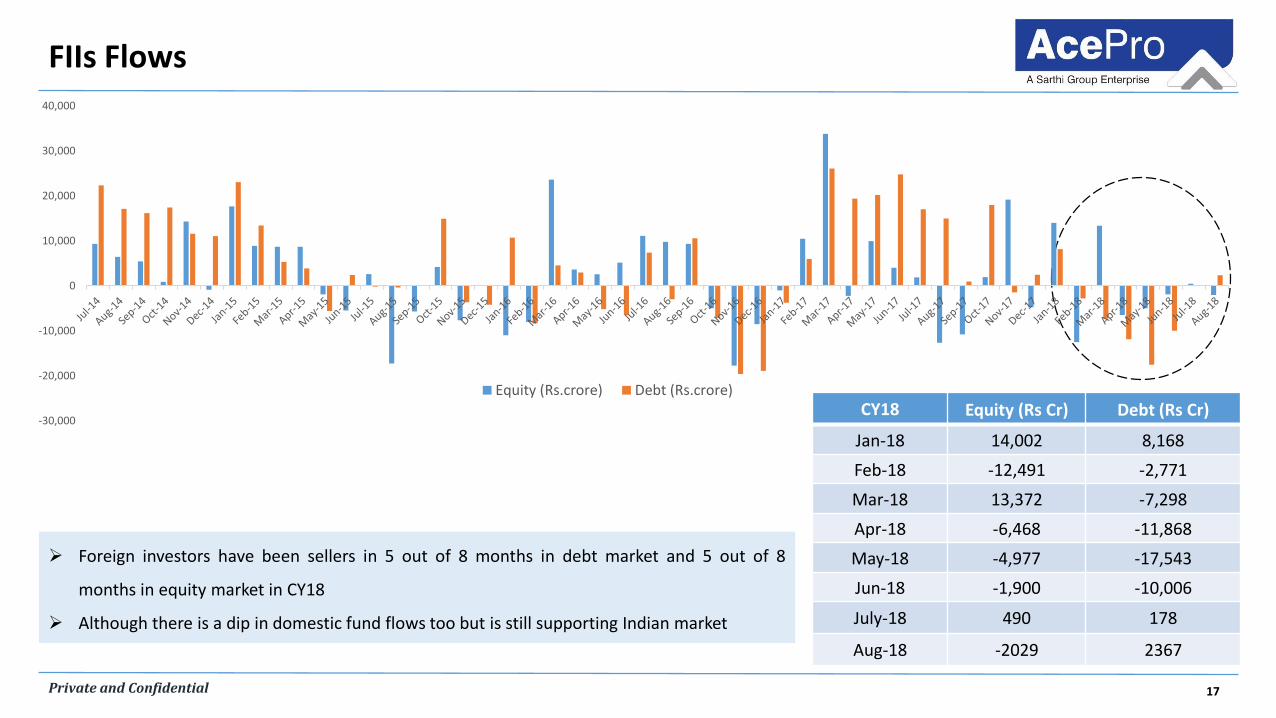
FIIs Flows
Foreign investors have been sellers in 5 out of 8 months in debt market and 5 out of 8
months in equity market in CY18
Although there is a dip in domestic fund flows too but is still supporting Indian market
-30,000
-20,000
-10,000
0
10,000
20,000
30,000
40,000
Equity (Rs.crore) Debt (Rs.crore)
CY18 Equity (Rs Cr) Debt (Rs Cr)
Jan-18 14,002 8,168
Feb-18 -12,491 -2,771
Mar-18 13,372 -7,298
Apr-18 -6,468 -11,868
May-18 -4,977 -17,543
Jun-18 -1,900 -10,006
July-18 490 178
Aug-18 -2029 2367
18Private and Confidential
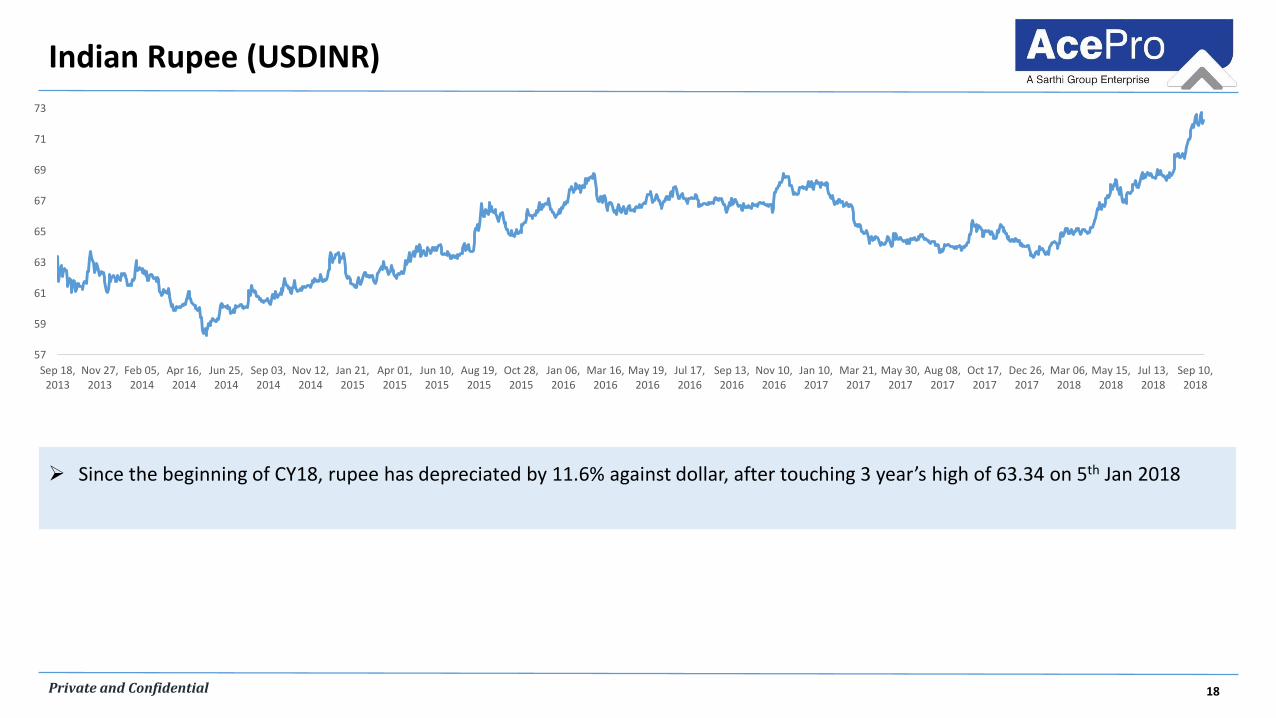
Indian Rupee (USDINR)
Since the beginning of CY18, rupee has depreciated by 11.6% against dollar, after touching 3 year’s high of 63.34 on 5th Jan 2018
57
59
61
63
65
67
69
71
73
Sep 18,2013
Nov 27,2013
Feb 05,2014
Apr 16,2014
Jun 25,2014
Sep 03,2014
Nov 12,2014
Jan 21,2015
Apr 01,2015
Jun 10,2015
Aug 19,2015
Oct 28,2015
Jan 06,2016
Mar 16,2016
May 19,2016
Jul 17,2016
Sep 13,2016
Nov 10,2016
Jan 10,2017
Mar 21,2017
May 30,2017
Aug 08,2017
Oct 17,2017
Dec 26,2017
Mar 06,2018
May 15,2018
Jul 13,2018
Sep 10,2018
19Private and Confidential
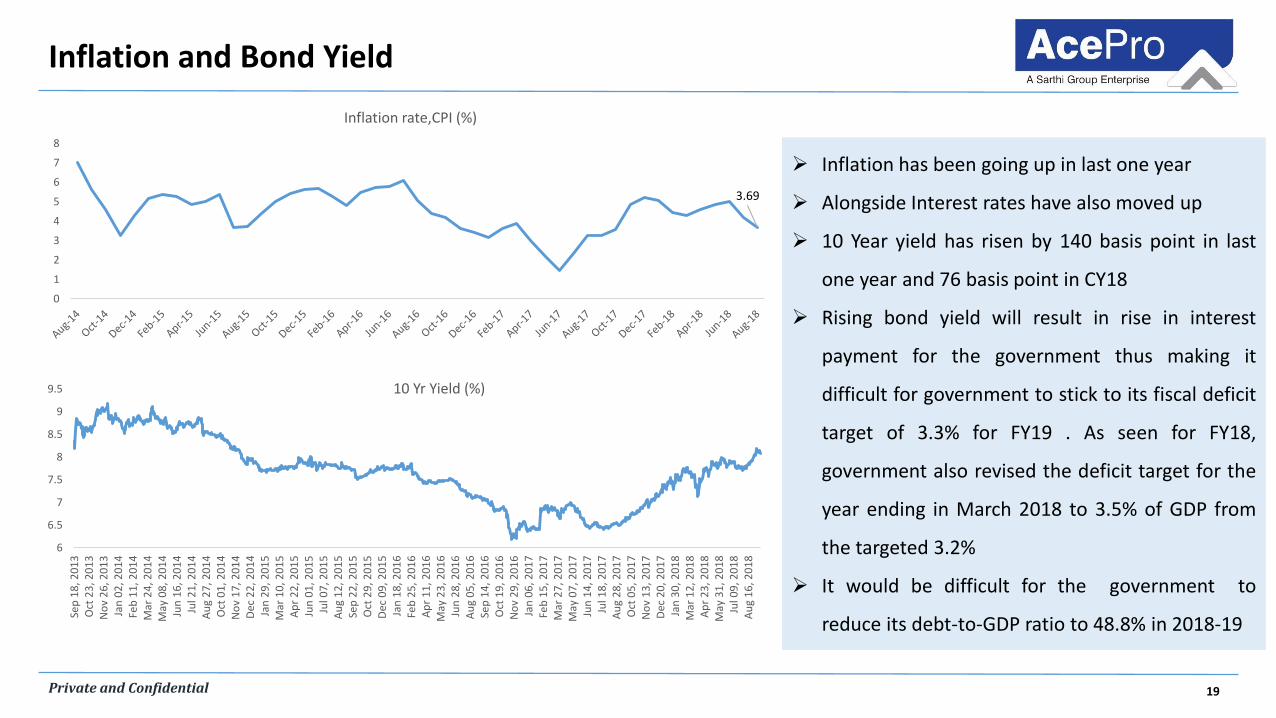
Inflation and Bond Yield
Inflation has been going up in last one year
Alongside Interest rates have also moved up
10 Year yield has risen by 140 basis point in last
one year and 76 basis point in CY18
Rising bond yield will result in rise in interest
payment for the government thus making it
difficult for government to stick to its fiscal deficit
target of 3.3% for FY19 . As seen for FY18,
government also revised the deficit target for the
year ending in March 2018 to 3.5% of GDP from
the targeted 3.2%
It would be difficult for the government to
reduce its debt-to-GDP ratio to 48.8% in 2018-19
6
6.5
7
7.5
8
8.5
9
9.5
Sep
18
, 20
13
Oct
23
, 20
13
No
v 2
6, 2
01
3Ja
n 0
2, 2
01
4Fe
b 1
1, 2
01
4M
ar 2
4, 2
01
4M
ay 0
8, 2
01
4Ju
n 1
6, 2
01
4Ju
l 21
, 20
14
Au
g 2
7, 2
01
4O
ct 0
1, 2
01
4N
ov
17
, 20
14
Dec
22
, 20
14
Jan
29
, 20
15
Mar
10
, 20
15
Ap
r 2
2, 2
01
5Ju
n 0
1, 2
01
5Ju
l 07
, 20
15
Au
g 1
2, 2
01
5Se
p 2
2, 2
01
5O
ct 2
9, 2
01
5D
ec 0
9, 2
01
5Ja
n 1
8, 2
01
6Fe
b 2
5, 2
01
6A
pr
11
, 20
16
May
23
, 20
16
Jun
28
, 20
16
Au
g 0
5, 2
01
6Se
p 1
4, 2
01
6O
ct 1
9, 2
01
6N
ov
29
, 20
16
Jan
06
, 20
17
Feb
15
, 20
17
Mar
27
, 20
17
May
07
, 20
17
Jun
14
, 20
17
Jul 1
8, 2
01
7A
ug
28
, 20
17
Oct
05
, 20
17
No
v 1
3, 2
01
7D
ec 2
0, 2
01
7Ja
n 3
0, 2
01
8M
ar 1
2, 2
01
8A
pr
23
, 20
18
May
31
, 20
18
Jul 0
9, 2
01
8A
ug
16
, 20
18
10 Yr Yield (%)
3.69
0
1
2
3
4
5
6
7
8
Inflation rate,CPI (%)
20Private and Confidential
State Of Macros
Interest Rate
The increase in inflation has already resulted in interest ratesmoving up which is likely to continue.
Spate of elections
Assembly elections are due in states of Rajasthan, Madhya Pradesh,Chhattisgarh and Mizoram in next few months to be followed bygeneral elections in 2019
Worsening Deficit/ Macroeconomic numbers
Historically, governments are known to spend aggressively ahead ofgeneral elections. This is likely to put pressure on fiscal deficit.
Trade War Impact
The global trade war initiated by the US and followed by othercountries has created uncertainty and needs to be monitored
Crude Price
The recent rise in crude price will increase the import burdenthus affecting the current account deficit. Indian currency hasalready witnessed sharp pressure due to this. Companiesdependent on crude derivatives for their raw materialrequirement will see increased manufacturing costs.
Global fund flows
Indian market has been witnessing an outflow of global funds.With US fed continuing its tightening monetary policy, futurefund flows will be a key monitorable
Higher inflation Rate/ MSP Hike
Government has sharply increased MSP for crops. This alongwith increased deficit and currency depreciation effects will leadto higher inflation which is already visible

21Private and Confidential
GOVERNMENT’S BEHAVIOUR AHEAD OF
ELECTIONS
22Private and Confidential
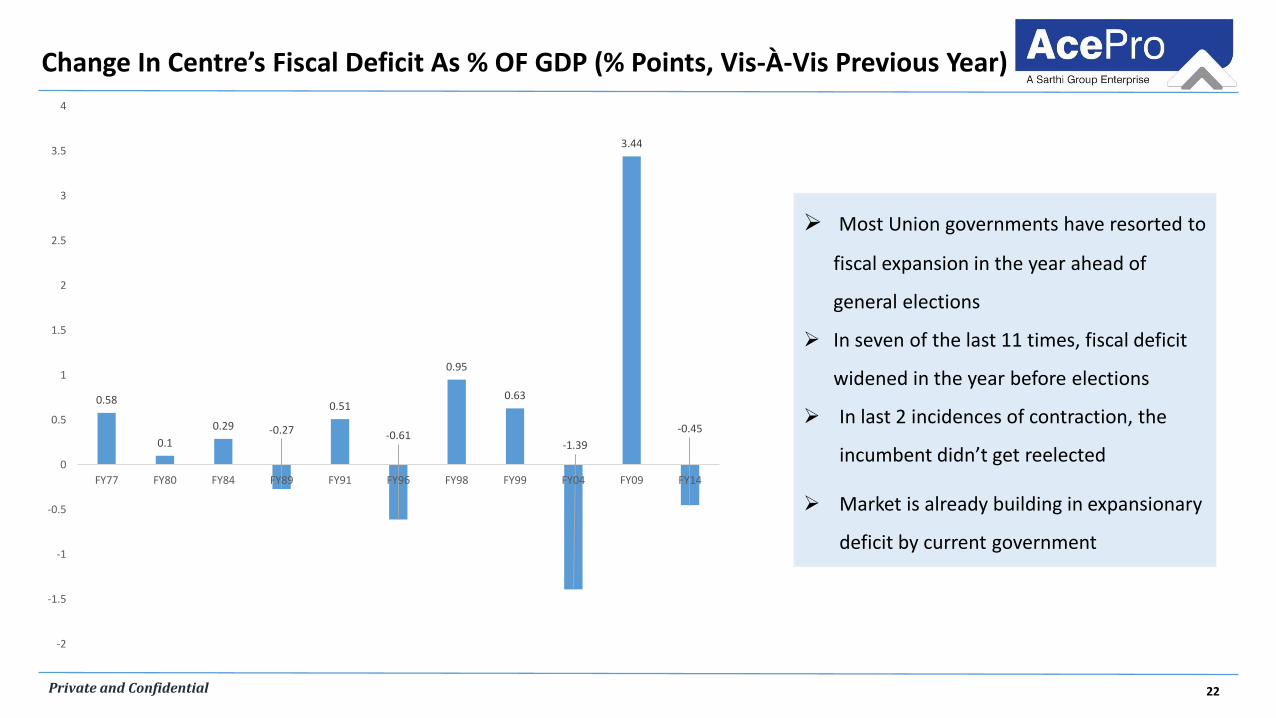
0.58
0.1
0.29 -0.27
0.51
-0.61
0.95
0.63
-1.39
3.44
-0.45
-2
-1.5
-1
-0.5
0
0.5
1
1.5
2
2.5
3
3.5
4
FY77 FY80 FY84 FY89 FY91 FY96 FY98 FY99 FY04 FY09 FY14
Most Union governments have resorted to
fiscal expansion in the year ahead of
general elections
In seven of the last 11 times, fiscal deficit
widened in the year before elections
In last 2 incidences of contraction, the
incumbent didn’t get reelected
Market is already building in expansionary
deficit by current government
Change In Centre’s Fiscal Deficit As % OF GDP (% Points, Vis-À-Vis Previous Year)
23Private and Confidential
Deviation Of Actual Expenditure From Budget Estimate (%)
4.35
-3.8-3.4
0.7
7.4
4.3
-1.7
3.4
4.7
17.7
0.4
8
3.7
-5.4
-6.4
-7.3
0.7
-0.1
-10
-5
0
5
10
15
20
1998-99 2000-01 2002-03 2004-05 2006-07 2008-09 2010-11 2012-13 2014-15 2016-17
Governments in democracies are tempted
to raise spending before elections
Increase in deficit in the election year, in
general, can be attributed to excess of
actual spending over the budgeted
estimates for populist policies.
Government expenditure exceeded
estimates in the last year of NDA-1 and
UPA-1
24Private and Confidential
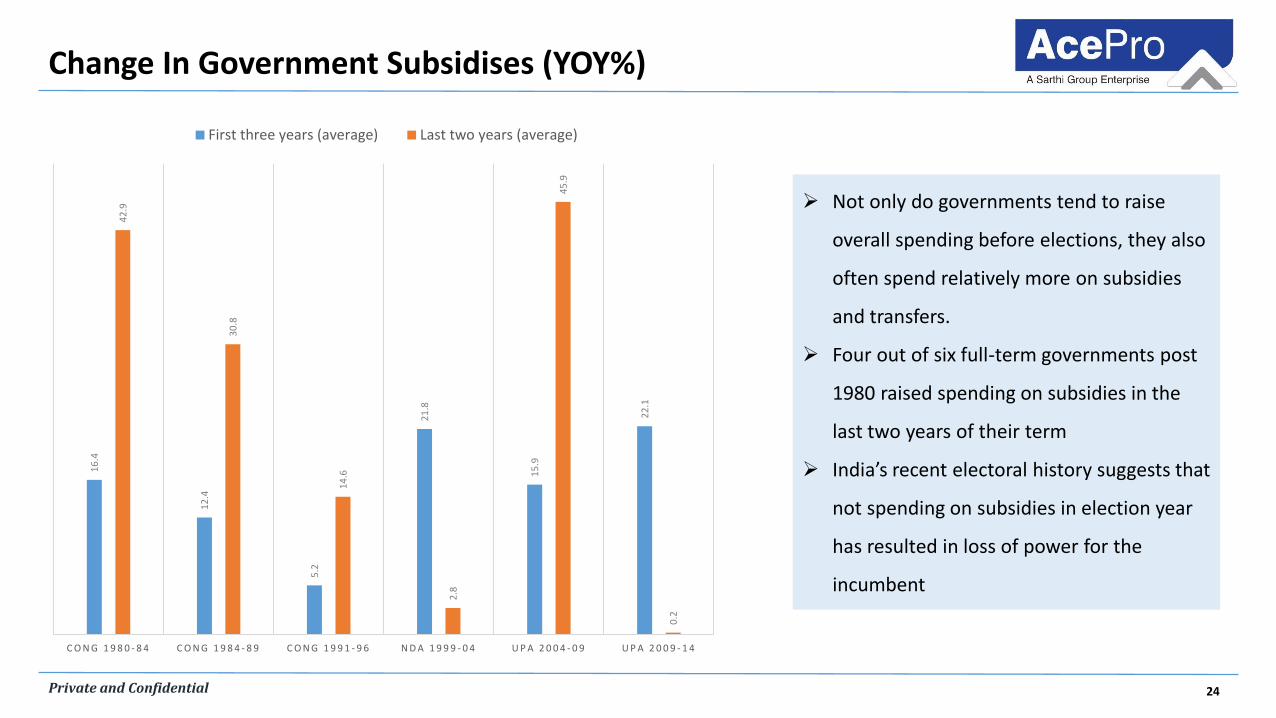
16
.4
12
.4
5.2
21
.8
15
.9
22
.1
42
.9
30
.8
14
.6
2.8
45
.9
0.2
C O N G 1 9 8 0 - 8 4 C O N G 1 9 8 4 - 8 9 C O N G 1 9 9 1 - 9 6 N D A 1 9 9 9 - 0 4 U P A 2 0 0 4 - 0 9 U P A 2 0 0 9 - 1 4
First three years (average) Last two years (average)
Not only do governments tend to raise
overall spending before elections, they also
often spend relatively more on subsidies
and transfers.
Four out of six full-term governments post
1980 raised spending on subsidies in the
last two years of their term
India’s recent electoral history suggests that
not spending on subsidies in election year
has resulted in loss of power for the
incumbent
Change In Government Subsidises (YOY%)
25Private and Confidential
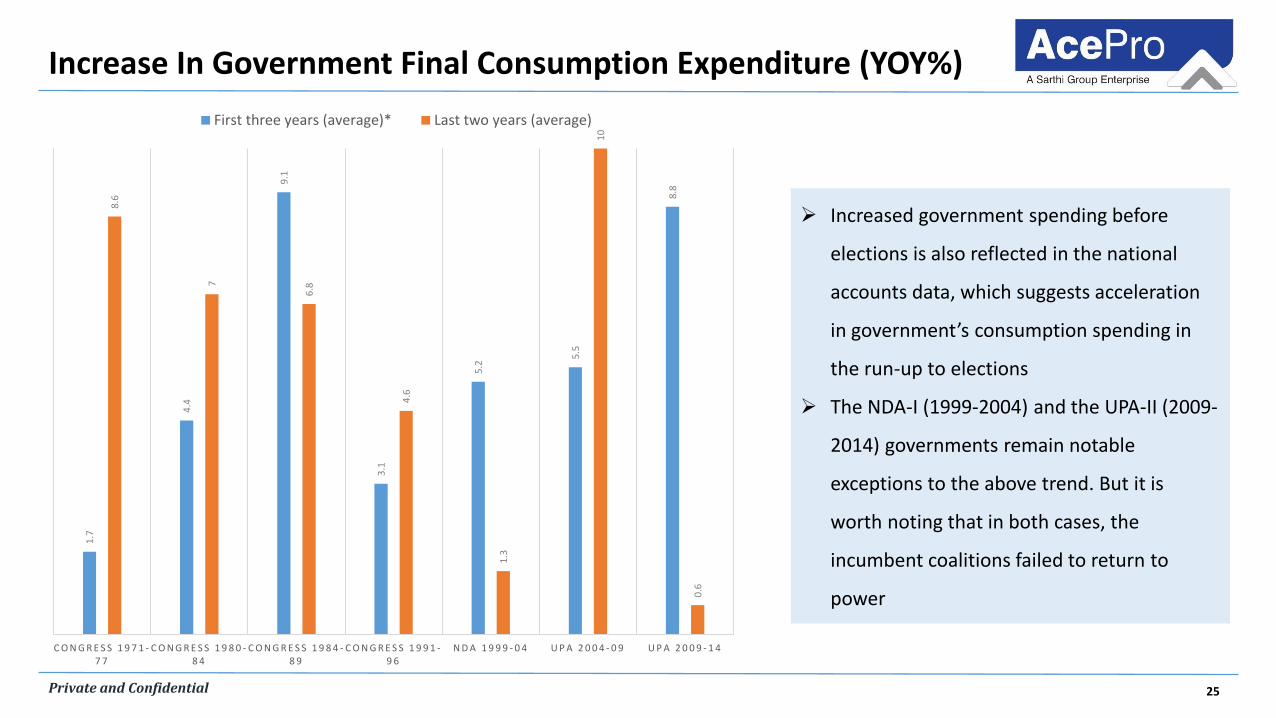
1.7
4.4
9.1
3.1
5.2
5.5
8.8
8.6
7
6.8
4.6
1.3
10
0.6
C O N G R E S S 1 9 7 1 -7 7
C O N G R E S S 1 9 8 0 -8 4
C O N G R E S S 1 9 8 4 -8 9
C O N G R E S S 1 9 9 1 -9 6
N D A 1 9 9 9 - 0 4 U P A 2 0 0 4 - 0 9 U P A 2 0 0 9 - 1 4
First three years (average)* Last two years (average)
Increase In Government Final Consumption Expenditure (YOY%)
Increased government spending before
elections is also reflected in the national
accounts data, which suggests acceleration
in government’s consumption spending in
the run-up to elections
The NDA-I (1999-2004) and the UPA-II (2009-
2014) governments remain notable
exceptions to the above trend. But it is
worth noting that in both cases, the
incumbent coalitions failed to return to
power

26Private and Confidential
SOME OTHER MACRO NUMBERS
27Private and Confidential
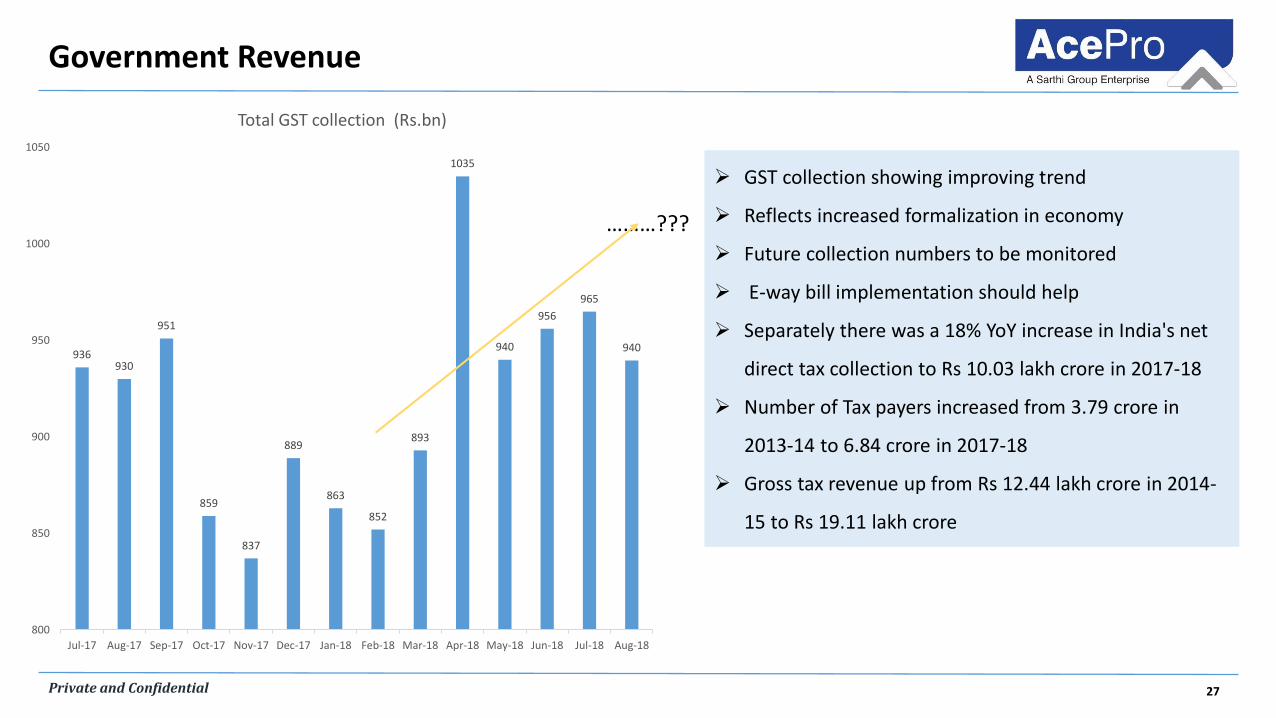
Government Revenue
GST collection showing improving trend
Reflects increased formalization in economy
Future collection numbers to be monitored
E-way bill implementation should help
Separately there was a 18% YoY increase in India's net
direct tax collection to Rs 10.03 lakh crore in 2017-18
Number of Tax payers increased from 3.79 crore in
2013-14 to 6.84 crore in 2017-18
Gross tax revenue up from Rs 12.44 lakh crore in 2014-
15 to Rs 19.11 lakh crore
………???
936930
951
859
837
889
863
852
893
1035
940
956
965
940
800
850
900
950
1000
1050
Jul-17 Aug-17 Sep-17 Oct-17 Nov-17 Dec-17 Jan-18 Feb-18 Mar-18 Apr-18 May-18 Jun-18 Jul-18 Aug-18
Total GST collection (Rs.bn)
28Private and Confidential
Infrastructure Activity
5013
5732
4250 4410
6061
8231
9829
4000
5500
7000
8500
10000
FY12 FY13 FY14 FY15 FY16 FY17 FY18
NH Constructed (in Km)
NH Constructed
12%
6491
1116 14383069 4368 4337
7396
3303
8004883
48215730
11934
9659
0
4000
8000
12000
16000
20000
FY12 FY13 FY14 FY15 FY16 FY17 FY18
NH Projects awarded (Km)
NHAI MORT and others
10%
Good growth in national highway projects awarded and highway construction in last few years
Proxy to infrastructure growth
Shows increase in investment by country
Has helped economic growth when private capex was low
Incremental Govt. spend over FY16-18 averaged Rs 5.3tn per annum vs. Rs 3.1tn per annum over the FY12-15 period adding ~1% to GDP
growth each year.
FY19 budget envisages a roads capital outlay of Rs. 1.21tn, a 10% increase over FY18
NHAI is slated to award 8,000kms of road projects in FY19
29Private and Confidential
Consumption Activity
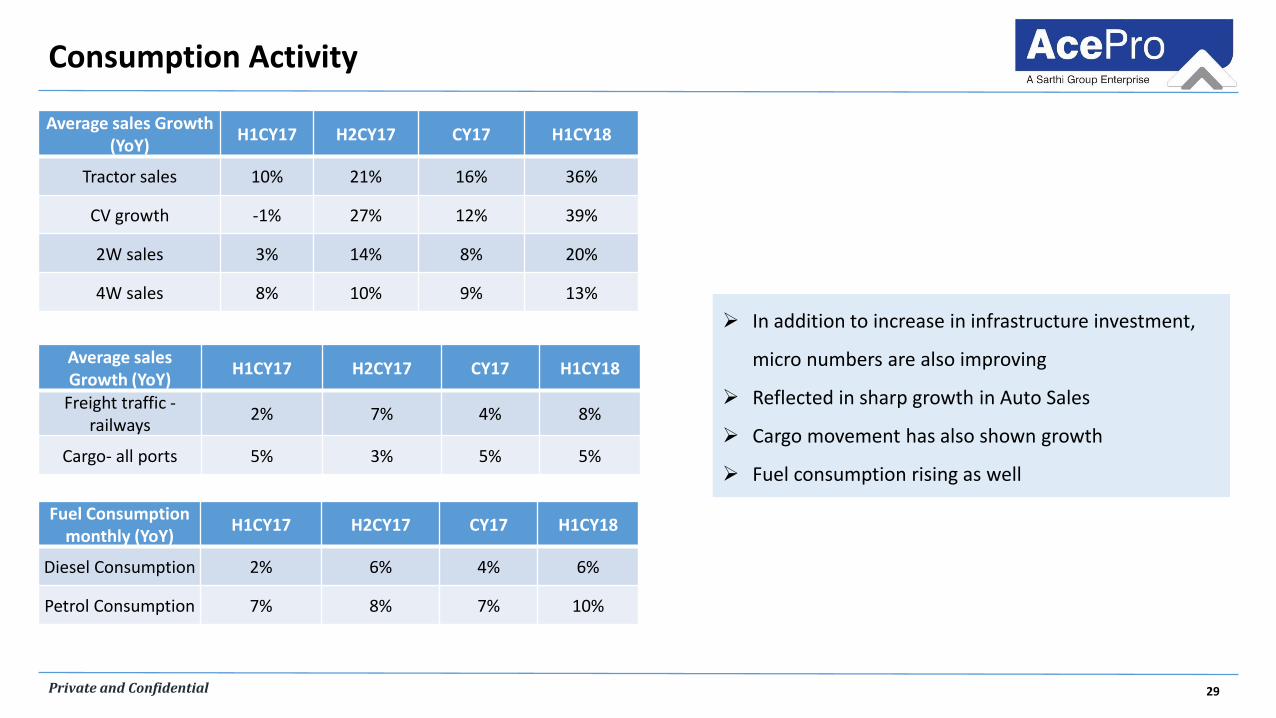
In addition to increase in infrastructure investment,
micro numbers are also improving
Reflected in sharp growth in Auto Sales
Cargo movement has also shown growth
Fuel consumption rising as well
Average sales Growth (YoY)
H1CY17 H2CY17 CY17 H1CY18
Tractor sales 10% 21% 16% 36%
CV growth -1% 27% 12% 39%
2W sales 3% 14% 8% 20%
4W sales 8% 10% 9% 13%
Average sales Growth (YoY)
H1CY17 H2CY17 CY17 H1CY18
Freight traffic -railways
2% 7% 4% 8%
Cargo- all ports 5% 3% 5% 5%
Fuel Consumption monthly (YoY)
H1CY17 H2CY17 CY17 H1CY18
Diesel Consumption 2% 6% 4% 6%
Petrol Consumption 7% 8% 7% 10%
30Private and Confidential
Primary Market Activity
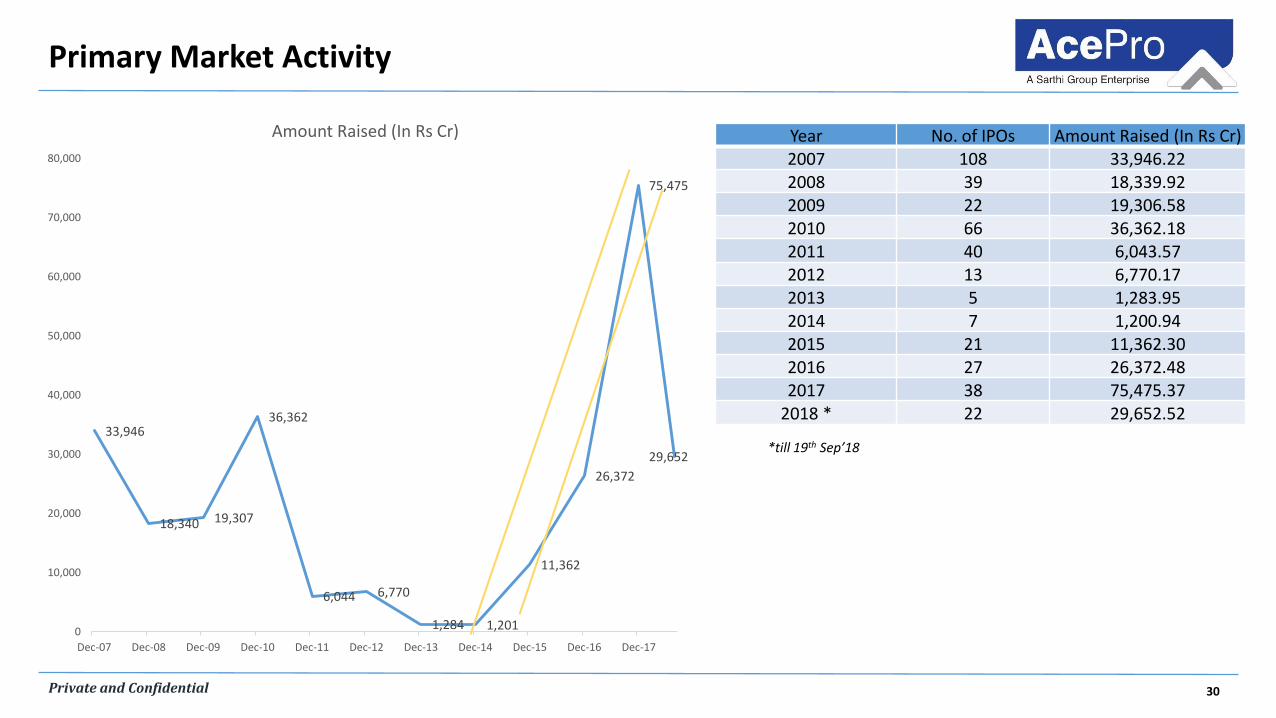
Year No. of IPOs Amount Raised (In Rs Cr)2007 108 33,946.222008 39 18,339.922009 22 19,306.582010 66 36,362.182011 40 6,043.572012 13 6,770.172013 5 1,283.952014 7 1,200.942015 21 11,362.302016 27 26,372.482017 38 75,475.37
2018 * 22 29,652.52
*till 19th Sep’1833,946
18,340 19,307
36,362
6,044 6,770
1,284 1,201
11,362
26,372
75,475
29,652
0
10,000
20,000
30,000
40,000
50,000
60,000
70,000
80,000
Dec-07 Dec-08 Dec-09 Dec-10 Dec-11 Dec-12 Dec-13 Dec-14 Dec-15 Dec-16 Dec-17
Amount Raised (In Rs Cr)
31Private and Confidential
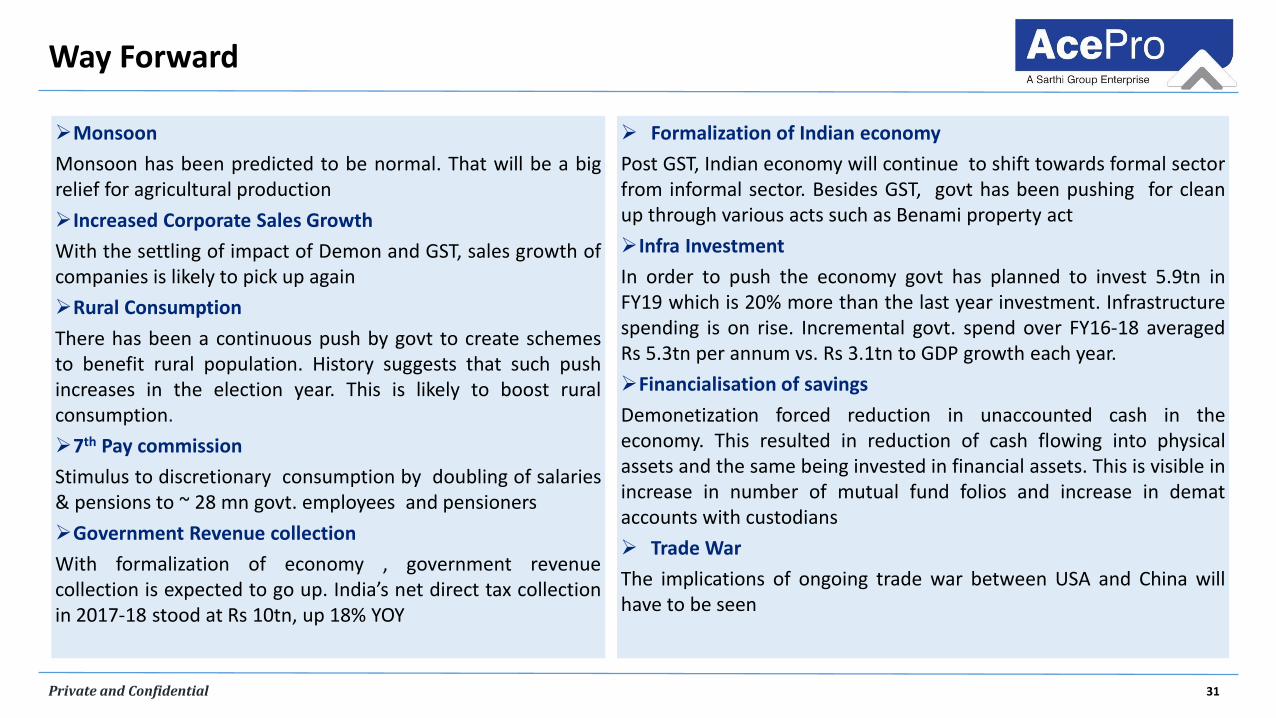
Way Forward
Formalization of Indian economy
Post GST, Indian economy will continue to shift towards formal sectorfrom informal sector. Besides GST, govt has been pushing for cleanup through various acts such as Benami property act
Infra Investment
In order to push the economy govt has planned to invest 5.9tn inFY19 which is 20% more than the last year investment. Infrastructurespending is on rise. Incremental govt. spend over FY16-18 averagedRs 5.3tn per annum vs. Rs 3.1tn to GDP growth each year.
Financialisation of savings
Demonetization forced reduction in unaccounted cash in theeconomy. This resulted in reduction of cash flowing into physicalassets and the same being invested in financial assets. This is visible inincrease in number of mutual fund folios and increase in demataccounts with custodians
Trade War
The implications of ongoing trade war between USA and China willhave to be seen
Monsoon
Monsoon has been predicted to be normal. That will be a bigrelief for agricultural production
Increased Corporate Sales Growth
With the settling of impact of Demon and GST, sales growth ofcompanies is likely to pick up again
Rural Consumption
There has been a continuous push by govt to create schemesto benefit rural population. History suggests that such pushincreases in the election year. This is likely to boost ruralconsumption.
7th Pay commission
Stimulus to discretionary consumption by doubling of salaries& pensions to ~ 28 mn govt. employees and pensioners
Government Revenue collection
With formalization of economy , government revenuecollection is expected to go up. India’s net direct tax collectionin 2017-18 stood at Rs 10tn, up 18% YOY
32Private and Confidential
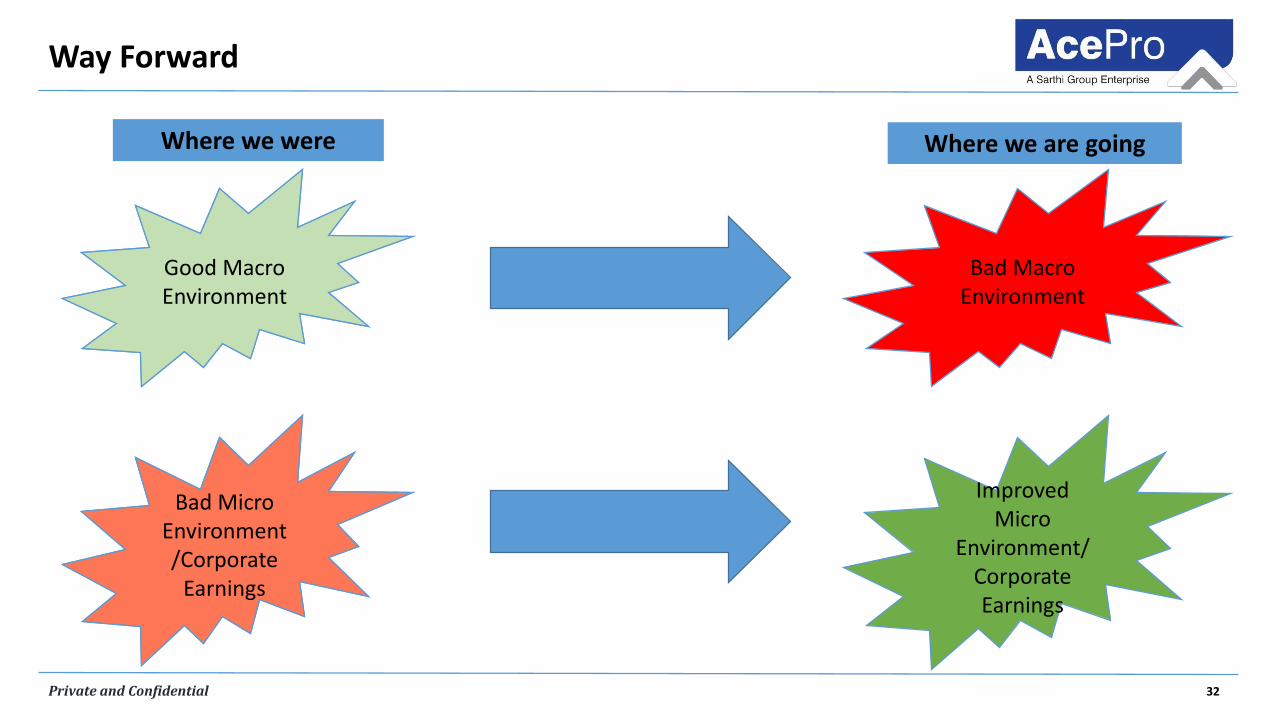
Way Forward
Good Macro Environment
Where we were
Bad Micro Environment/Corporate
Earnings
Good Macro Environment
Bad Macro Environment
Where we are going
Bad Micro Environment/Corporate
Earnings
Improved Micro
Environment/Corporate Earnings
33Private and Confidential
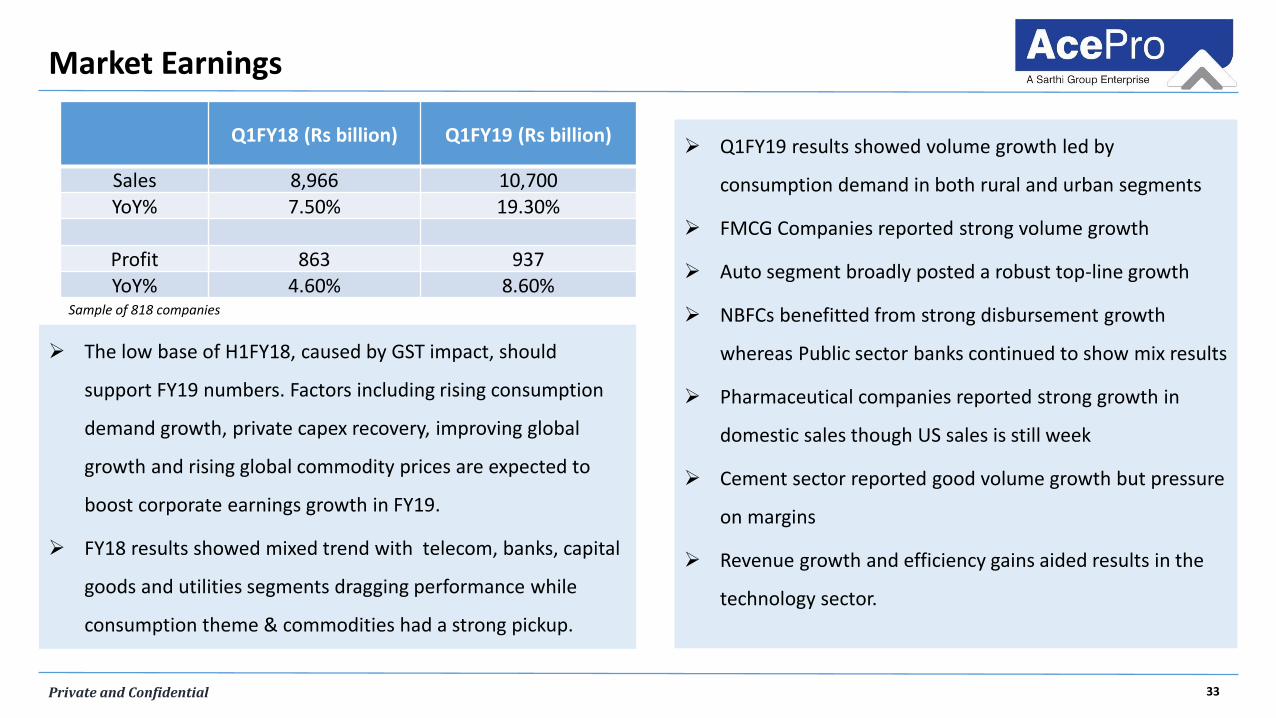
Market Earnings
Q1FY19 results showed volume growth led by
consumption demand in both rural and urban segments
FMCG Companies reported strong volume growth
Auto segment broadly posted a robust top-line growth
NBFCs benefitted from strong disbursement growth
whereas Public sector banks continued to show mix results
Pharmaceutical companies reported strong growth in
domestic sales though US sales is still week
Cement sector reported good volume growth but pressure
on margins
Revenue growth and efficiency gains aided results in the
technology sector.
The low base of H1FY18, caused by GST impact, should
support FY19 numbers. Factors including rising consumption
demand growth, private capex recovery, improving global
growth and rising global commodity prices are expected to
boost corporate earnings growth in FY19.
FY18 results showed mixed trend with telecom, banks, capital
goods and utilities segments dragging performance while
consumption theme & commodities had a strong pickup.
Q1FY18 (Rs billion) Q1FY19 (Rs billion)
Sales 8,966 10,700YoY% 7.50% 19.30%
Profit 863 937YoY% 4.60% 8.60%
Sample of 818 companies
34Private and Confidential
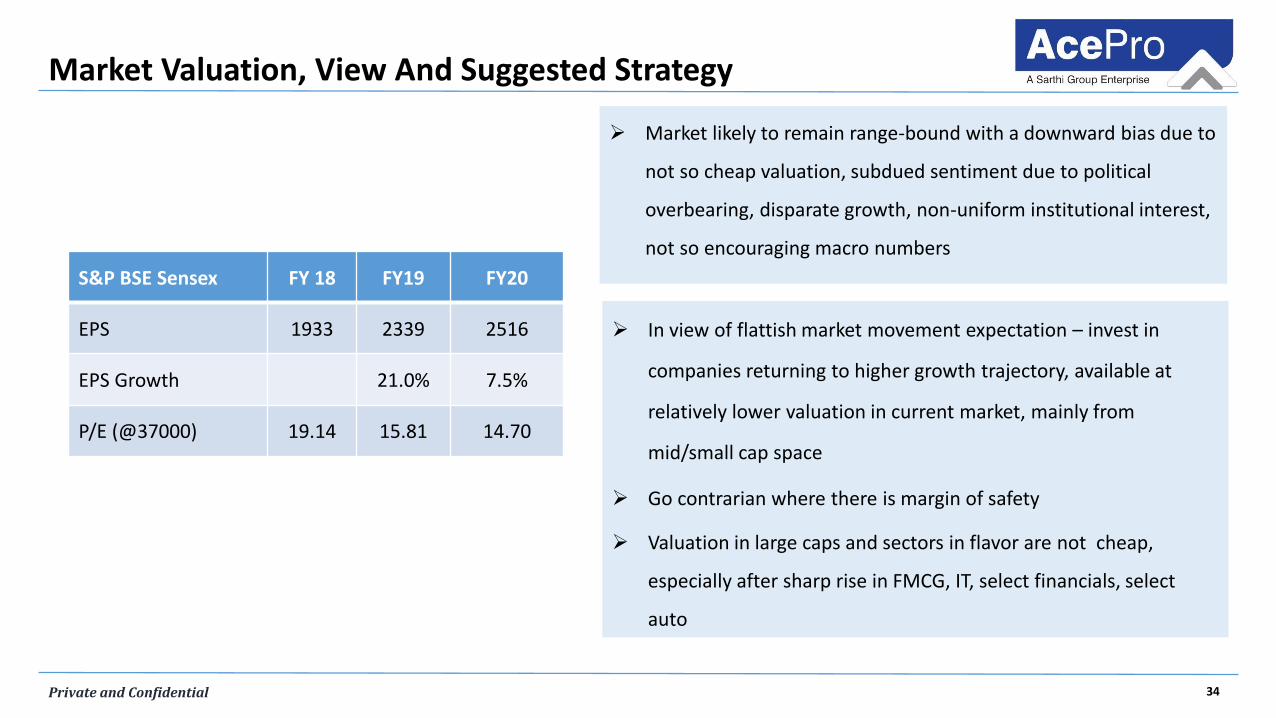
Market Valuation, View And Suggested Strategy
Market likely to remain range-bound with a downward bias due to
not so cheap valuation, subdued sentiment due to political
overbearing, disparate growth, non-uniform institutional interest,
not so encouraging macro numbers
In view of flattish market movement expectation – invest in
companies returning to higher growth trajectory, available at
relatively lower valuation in current market, mainly from
mid/small cap space
Go contrarian where there is margin of safety
Valuation in large caps and sectors in flavor are not cheap,
especially after sharp rise in FMCG, IT, select financials, select
auto
S&P BSE Sensex FY 18 FY19 FY20
EPS 1933 2339 2516
EPS Growth 21.0% 7.5%
P/E (@37000) 19.14 15.81 14.70
35Private and Confidential
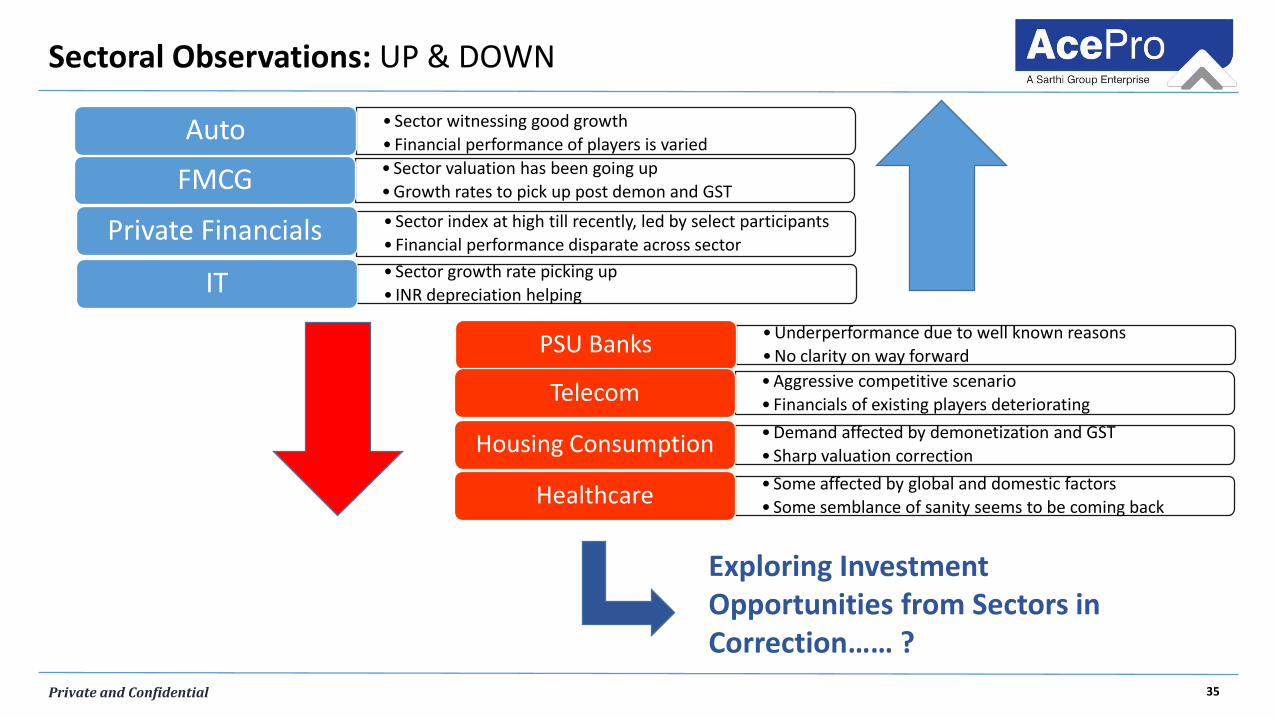
Sectoral Observations: UP & DOWN
Exploring Investment Opportunities from Sectors in Correction…… ?
• Sector witnessing good growth
• Financial performance of players is varied Auto
• Sector valuation has been going up
• Growth rates to pick up post demon and GSTFMCG• Sector index at high till recently, led by select participants
• Financial performance disparate across sectorPrivate Financials
• Sector growth rate picking up
• INR depreciation helping IT
• Underperformance due to well known reasons
• No clarity on way forwardPSU Banks
• Aggressive competitive scenario
• Financials of existing players deterioratingTelecom
• Demand affected by demonetization and GST
• Sharp valuation correctionHousing Consumption
• Some affected by global and domestic factors
• Some semblance of sanity seems to be coming backHealthcare
36Private and Confidential
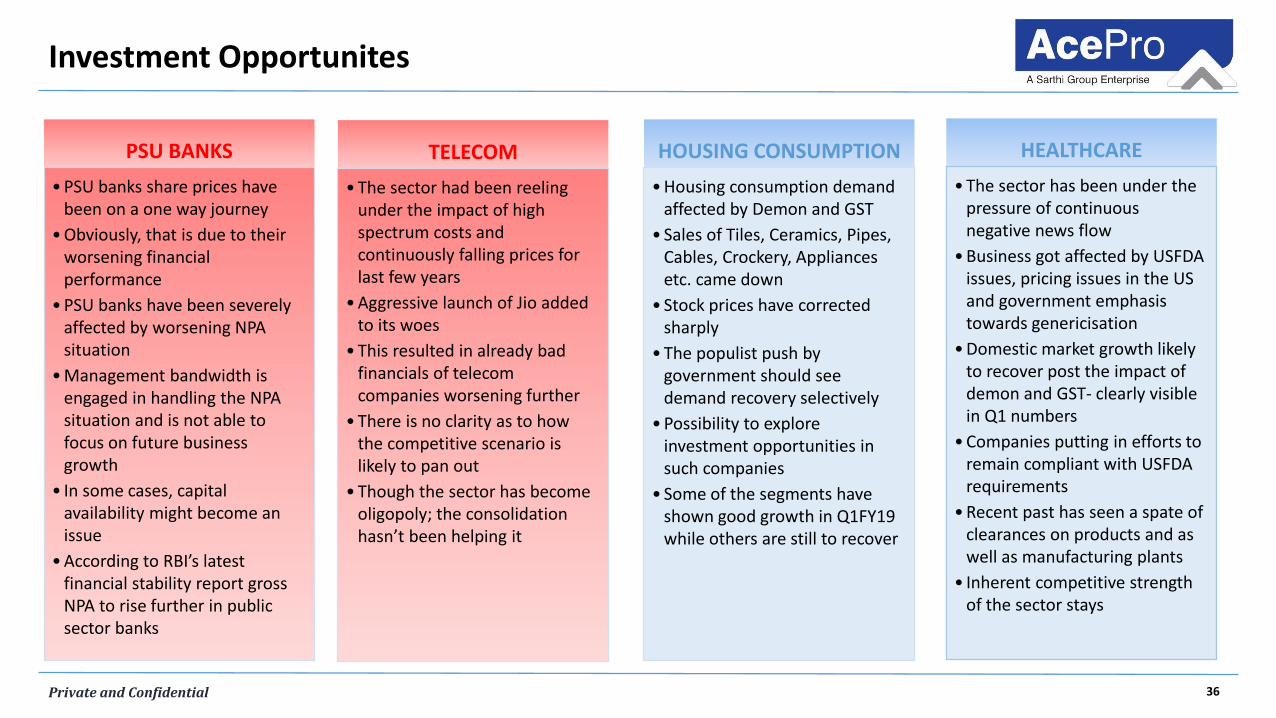
Investment Opportunites
TELECOM
• The sector had been reeling under the impact of high spectrum costs and continuously falling prices for last few years
• Aggressive launch of Jio added to its woes
• This resulted in already bad financials of telecom companies worsening further
• There is no clarity as to how the competitive scenario is likely to pan out
• Though the sector has become oligopoly; the consolidation hasn’t been helping it
HOUSING CONSUMPTION
• Housing consumption demand affected by Demon and GST
• Sales of Tiles, Ceramics, Pipes, Cables, Crockery, Appliances etc. came down
• Stock prices have corrected sharply
• The populist push by government should see demand recovery selectively
• Possibility to explore investment opportunities in such companies
• Some of the segments have shown good growth in Q1FY19 while others are still to recover
HEALTHCARE
• The sector has been under the pressure of continuous negative news flow
• Business got affected by USFDA issues, pricing issues in the US and government emphasis towards genericisation
• Domestic market growth likely to recover post the impact of demon and GST- clearly visible in Q1 numbers
• Companies putting in efforts to remain compliant with USFDA requirements
• Recent past has seen a spate of clearances on products and as well as manufacturing plants
• Inherent competitive strength of the sector stays
PSU BANKS
• PSU banks share prices have been on a one way journey
• Obviously, that is due to their worsening financial performance
• PSU banks have been severely affected by worsening NPA situation
• Management bandwidth is engaged in handling the NPA situation and is not able to focus on future business growth
• In some cases, capital availability might become an issue
• According to RBI’s latest financial stability report gross NPA to rise further in public sector banks
37Private and Confidential
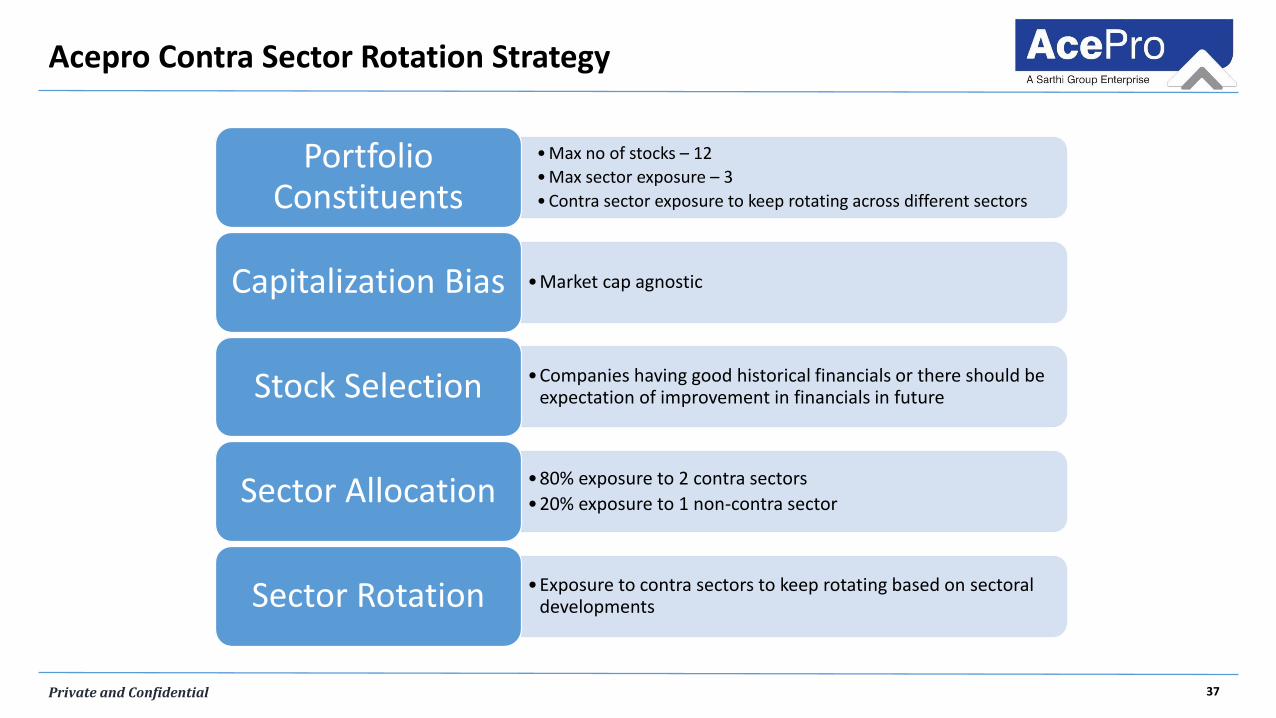
Acepro Contra Sector Rotation Strategy
• Max no of stocks – 12
• Max sector exposure – 3
• Contra sector exposure to keep rotating across different sectors
Portfolio Constituents
•Market cap agnosticCapitalization Bias
•Companies having good historical financials or there should be expectation of improvement in financials in futureStock Selection
•80% exposure to 2 contra sectors
•20% exposure to 1 non-contra sectorSector Allocation
•Exposure to contra sectors to keep rotating based on sectoraldevelopmentsSector Rotation

38Private and Confidential
FEEDBACK / Q&A

HAPPY TO HELP…
Corporate Headquarters:Mumbai401, 4th floor, Manek Plaza,
167,Vidya NagariMarg, Kalina,Santacruz(E), Mumbai-400 098Landline: (022) 26528671-72, Fax: (022) 26528673E-mail: [email protected]
Regional Office:New Delhi411, 4th Floor, Pratap Bhawan,5, Bahadurshah Zafar Marg,New Delhi – 110002Tel.: 011-23739425-27, Fax: 011-23739424
DisclaimerAll data and information is provided for informational purposes only and is not intended for any factual use. Itshould not be considered as binding / statutory provisions. Neither AcePro Advisors nor any of its group company,directors, or employees shall be liable for any of the data or content provided for any actions taken in reliancethereon.
AcePro ADVISORS PRIVATE LIMITEDA Sarthi Group Enterprise


![Untitled-2 [] · FS 78 FS 68 , FOCUS ÉkJ ËFOCUS FS 78 FS 68 FS 68 , , , FS 68 Foundation FS 68 , FS 68 68 fi , FOCUS F-s 688 , , 68 , 688 FOCUS FS , FS 68 , , , 688 ,](https://img.pdfslide.us/doc/110x75/5b75f9b67f8b9a3b7e8b5e04/untitled-2-fs-78-fs-68-focus-ekj-efocus-fs-78-fs-68-fs-68-fs-68.jpg)