Embed Size (px)
Citation preview

EquityImpactsofFeeSystemstoSupportZeroEmissionVehicleSalesinCalifornia
June2016 AResearchReportfromtheNationalCenterforSustainableTransportation
LewFulton,UniversityofCalifornia,Davis
JulieSchiffman,UniversityofCalifornia,Davis
GilTal,UniversityofCalifornia,Davis

i
AbouttheNationalCenterforSustainableTransportationTheNationalCenterforSustainableTransportationisaconsortiumofleadinguniversitiescommittedtoadvancinganenvironmentallysustainabletransportationsystemthroughcutting-edgeresearch,directpolicyengagement,andeducationofourfutureleaders.Consortiummembersinclude:UniversityofCalifornia,Davis;UniversityofCalifornia,Riverside;UniversityofSouthernCalifornia;CaliforniaStateUniversity,LongBeach;GeorgiaInstituteofTechnology;andUniversityofVermont.Moreinformationcanbefoundat:ncst.ucdavis.edu.U.S.DepartmentofTransportation(USDOT)DisclaimerThecontentsofthisreportreflecttheviewsoftheauthors,whoareresponsibleforthefactsandtheaccuracyoftheinformationpresentedherein.ThisdocumentisdisseminatedunderthesponsorshipoftheUnitedStatesDepartmentofTransportation’sUniversityTransportationCentersprogram,intheinterestofinformationexchange.TheU.S.Governmentassumesnoliabilityforthecontentsorusethereof.AcknowledgmentsThisstudywasfundedbyagrantfromtheNationalCenterforSustainableTransportation(NCST),supportedbyUSDOTthroughtheUniversityTransportationCentersprogram.TheauthorswouldliketothanktheNCSTandUSDOTfortheirsupportofuniversity-basedresearchintransportation,andespeciallyforthefundingprovidedinsupportofthisproject.WewouldalsoliketothankreviewersfromtheCaliforniaAirResourcesBoardandvariousothercompaniesandnon-governmentalorganizations.

ii
EquityImpactsofFeeSystemstoSupportZeroEmissionVehicleSalesinCalifornia
ANationalCenterforSustainableTransportationResearchReport
June2016
LewFulton,UniversityofCalifornia,Davis
JulieSchiffman,UniversityofCalifornia,Davis
GilTal,UniversityofCalifornia,Davis

iii
[pageleftintentionallyblank]

iv
TABLEOFCONTENTSEXECUTIVESUMMARY....................................................................................................................v
Introduction...................................................................................................................................3
ABriefReviewofRelevantLiterature............................................................................................4
CurrentCaliforniaPolicy................................................................................................................6
AnalysisApproach..........................................................................................................................7
AnalysisofAlternativeFeeStructures.........................................................................................17
Results..........................................................................................................................................19
SummaryofFindingsandPolicyImplications..............................................................................23
Lookingtoward2025...................................................................................................................24
PotentialFutureResearch............................................................................................................26
References...................................................................................................................................27

v
EquityImpactsofFeeSystemstoSupportZeroEmissionVehicleSalesinCalifornia
EXECUTIVESUMMARYToacceleratethemarketintroductionofzero-emissionvehicles(ZEVs,includingbatteryelectricandfuelcellelectricvehicles)andtransitionalZEVs(TZEV,includingplug-inhybridvehicles),customerincentivesandsubsidiesmaybeneededformanyyears—untiltheadditionalcosttomanufacturethesevehiclesdecreasesconsiderably.Currently,Californiaprovides$5,000forthepurchaseoflightdutyfuelcellvehicles,$2,500forbatteryelectricvehicles,and$1,500forplug-inhybridelectricvehicles,aspartofitsCleanVehicleRebateProject(CVRP-2,2015),currentlyfundedfromrevenuescollectedbythecarboncapandtradeprogram,aswellasmotorvehiclefees.InFY2015-2016,thestateallocated$75millionforrebatesundertheprogram,whichwasnotsufficienttocovertheCVRPpayments.Thisreportpresentsanalysisresultsofpotentialdesignsoffeesystemsforthepurchaseofnew(non-ZEV)vehiclesthatcouldhelpfundCalifornia’sCVRP.DifferentCO2-basedfeestructureswereconsidered,andthepotentialincidenceofthesefeesacrosshouseholdgroupswithdifferentincomelevelswasestimated.Thestudyassessesdifferentfeestructuresforthegivenrebateprogram,butitdoesnotconsideralternativerebatesystems(onlytheexistingCVRPsystem),sotheterm“feebate”isnotused,butrather“vehiclefees”todescribethescenarios.Inthescenarios,eachincomegrouphasbeenrelatedtothetypicalCalifornianumberandtypesofnewlight-dutyvehiclespurchased,includingaverageCO2emissionsofthesenewvehicles,tothefeestheywouldpay(individuallyandasincomegroups)underthedifferentfeestructures.The2010-2012CaliforniaHouseholdTravelSurveydata(including2011-2012andlimited2013vehiclemodels)toexploretheserelationships,sotheyareatbestonlyindicativeofcurrentandfuturerelationships.Sixdifferentfeestructurepolicyscenariosweredevelopedthatapplyvariousvehiclefeesdependingona)theCO2emissionsofindividualnon-ZEVvehiclemodels,b)possibleadjustmentstofeespaidbylowerincomegroups,andc)possibleadjustmentoffeesbyMSRP.Allcasesrequirethesametotalrevenuetargetraisedviathesevehiclefees,sotheyrepresentsixalternativewaystoraiseasetlevelofrevenuestopayforCVRPrebates.Thesixfeestructurescenariosallappearcapableofraising$200millionperyear,whichisalevelthatshouldbesufficienttopayforCVRPrebatesforZEVs,atleastthrough2018.Thepresentedscenariosallincludea$100minimumfeeonthosevehicleschargedafee,withvaryingmaximumfeesdependingontheindividualscenarioassumptions.Forexample,Scenario1appliesfeestothepurchaseofallnew(non-ZEVorTZEV)vehicles,withfeesincreasinginproportiontoeachmodel’stestedfueleconomy(convertedtoCO2emissions).Usingthe$100minimumfeeforpurchasingthelowestCO2-emittingcarsresultsin

vi
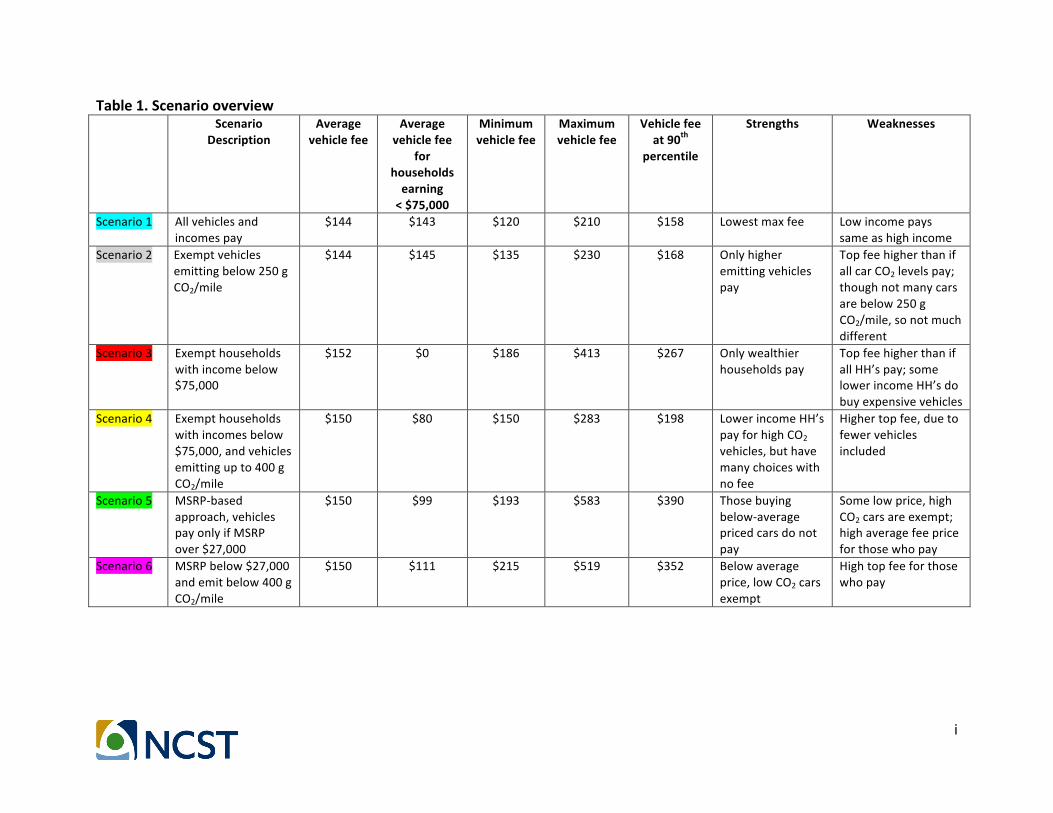
$210high-endfeeforthehighestemittingcars,whichwhenmultipliedacrosssalesof1.5millionvehicles,reachesthe$200millionrevenuetarget.InScenario2,thefeewasonlyappliedtocarsemittingover250gCO2/mile;allcarsbelowthisemissionslevel(mostlyhybridcars)areexempt.Inthatcase,thehighestemittingcarsarechargedafeeof$230.Inyetanotherscenario,feeswereonlyappliedtohouseholdswithannualincomesabove$75,000;lowerincomelevelhouseholdsareexempt.Thisraisesthehigh-endfeeto$413.Inall,Table1summarizesdevelopmentofthesixscenariosandcomparesthemintermsoffeesassessedbyhouseholdincomegroup.
i
Table1.Scenariooverview Scenario
DescriptionAverage
vehiclefeeAverage
vehiclefeefor
householdsearning<$75,000
Minimumvehiclefee
Maximumvehiclefee
Vehiclefeeat90th
percentile
Strengths Weaknesses
Scenario1 Allvehiclesandincomespay
$144 $143 $120 $210 $158 Lowestmaxfee Lowincomepayssameashighincome
Scenario2 Exemptvehiclesemittingbelow250gCO2/mile
$144 $145 $135 $230 $168 Onlyhigheremittingvehiclespay
TopfeehigherthanifallcarCO2levelspay;thoughnotmanycarsarebelow250gCO2/mile,sonotmuchdifferent
Scenario3 Exempthouseholdswithincomebelow$75,000
$152 $0 $186 $413 $267 Onlywealthierhouseholdspay
TopfeehigherthanifallHH’spay;somelowerincomeHH’sdobuyexpensivevehicles
Scenario4 Exempthouseholdswithincomesbelow$75,000,andvehiclesemittingupto400gCO2/mile
$150 $80 $150 $283 $198 LowerincomeHH’spayforhighCO2
vehicles,buthavemanychoiceswithnofee
Highertopfee,duetofewervehiclesincluded
Scenario5 MSRP-basedapproach,vehiclespayonlyifMSRPover$27,000
$150 $99 $193 $583 $390 Thosebuyingbelow-averagepricedcarsdonotpay
Somelowprice,highCO2carsareexempt;highaveragefeepriceforthosewhopay
Scenario6 MSRPbelow$27,000andemitbelow400gCO2/mile
$150 $111 $215 $519 $352 Belowaverageprice,lowCO2carsexempt
Hightopfeeforthosewhopay

i
Mainanalysisinsights:• Forthosehouseholdsbuyingnewcars,boththeexpenditurelevelpercarandtheaverage
CO2emissionspercarincreasesubstantiallyfromlowertohigherincomehouseholds.Wealthierhouseholdsbuymanymorevehiclesemittingover400gCO2/mile,althoughtheyalsobuymorevehiclesbelow200gCO2/mile(suchastheToyotaPrius).
• TocoverCVRPcostsofupto$200millionperyear(asignificantamountmorethanwhatwasspentin2015,andwithintheexpectedrequirementsthrough2018)theimplementationofanaveragefee,ontheorderof$140pernon-ZEV/TZEVcarwillbeneeded.Alternatively,aflat0.5%taxonvehiclepricewouldalsoachievethis.
• ThefeefordifferenttypesofcarswithdifferentCO2levels,andaveragefeesfordifferentincomehouseholdsvariesconsiderablydependingonscenarioassumptions.
• Feestructuresthatexemptverylow-CO2emittingcarsdonotchangetherelativefeeincidenceondifferentincomehouseholdssignificantly.
• Acrossthesixscenarios,thefeepercarpurchasedcanbezeroformanyhouseholds,butcanreachnearly$600forhouseholdsbuyingveryhighCO2vehicles.Theaveragefeeperhouseholdbuyinganewcardoesnotriseabove$150,evenforthewealthiesthouseholds,withasmallerfeeforlowerincomehouseholdsinseveralscenarios.
• Feelevelswouldneedtoriseasthetargetrevenuegenerationexceeds$200millionperyear,whichmayoccurfrom2019onwardtosupporthigherZEV/TZEVsaleslevels.
• Exemptinghouseholdsthatearnlessthan$75,000peryearshiftstheaveragefeeforotherhouseholdsfromabout$150uptoover$200pervehicle.Combiningthe$75,000incomeexemptionwitharequirementthatvehicleCO2bebelow400gCO2/miletobeexemptedresultsinabouta$50averagefeeforthoselowerincomehouseholds(withsomepayingnothingandotherspayingmorethan$100percar).
• Exemptingvehiclespriced(MSRP)lessthan$16,000hasarelativelysmalleffect,butsettingtheexemptionatanMSRPof$27,000hasasignificanteffect,since55%ofallnewvehiclespurchasedwerebelowthisprice.Inthiscase,householdaveragefeesriseindirectproportiontoincome.Also,requiringvehiclestohavelessthan400gCO2/miledoesnotsubstantiallychangethisresult.
• Overallitappearspossibletoconstructvehiclefeesystemsthatraise$200millionwithfairlyequalimpactsacrosshouseholdsofdifferentincomelevels,orwithsignificantlygreaterimpactsonhigherincomehouseholds,dependingonthedesign.Theaveragefeepervehiclesoldwouldlikelybeunder$150andthehighestfeespervehiclecouldbekeptbelow$250,dependingondesign.
Lookingoutto2025• Theresultsinthisstudy,focusedonraising$200millionperyear,areatmostrelevantto
theCVRPthrough2018.Afterthatyearandwiththecurrentincentivelevels,itislikelythatasZEVandTZEVsalesriserapidly,ascouldtherequiredrebateexpenditures.Ifthisoccurred,onefactorthatcouldbecomemorerelevantistheconsumerresponsetohigherper-vehiclefees,suchasshiftstolowerCO2vehicles.
ii
• Inthisproject,suchpotentialshiftsinvehiclepurchasesasaresultofthesixproposedfeestructureswerenotassessed.ThehighestratioofvehiclefeetovehicleMSRPinanyscenarioconsideredhereisabout1.8%,withanaverageratioofabout0.5%.Thisisnotexpectedtotriggerasignificantshiftinvehiclepreferencesorpurchasepatterns.However,ifrevenuerequirementsriseandfeesriseaccordingly,analysisofpotentialpurchaseshiftsrelatedtofeestructurescouldbecomeanimportantconsideration.PurchaseshiftstendtohelpincreasethesalesofZEVsandTZEVssincetheywillreceiverebates,whileothervehicleswouldbeassessedfees.Futureresearchcouldconsiderthisdynamic.
• Asimplifiedprojectionofthefeestructuresto2025,assumingslowgrowthinLDVsales(reachingabout1.8millionin2025,butwithrisingZEVandTZEVsalesandmarketsharesasforeseenintheCaliforniaZEVmandate,causesanincreaseinaveragefeesuptoover$700by2025.Thisalsoreflectsadeclineinthenumberofvehiclesthatwouldbeassessedfees,since22%ofvehiclesinthatyearareassumedtobeZEVorTZEV.Thisestimateisa“ballpark”estimate,sincea)thestructureofsalesandthenumberofvehiclessoldmaychangedramaticallyby2025,andb)feesapproaching$1,000pervehiclemaytriggerpurchaseshiftsthatshouldbetakenintoaccount.Afullanalysislookingoutto2025wouldbemuchmorecomplexthanthisstudy,butwouldbeusefulfollow-onresearch.
PotentialFutureResearch
ThisprojecthasundertakenwhatcouldbecalledfirststepsofresearchininvestigatingpossiblefundingsystemsfortheCVRP.Follow-upresearchcouldincludeanumberofactivities,including:
• CreatingamoredetailedprojectionofCaliforniavehiclesalesto2025byhouseholdtype,incorporatingexpectedevolutionofincomeanddemographiccharacteristicsaswellaschangingvehicletechnologiesandpotentialreductionsinnewconventionalvehicleCO2levels.
• Alsofora2025projection,applyingmarketpurchaseresponsefunctionstochangesinvehicleprices,usinganappropriatevehiclemarketmodel.
• Investigationofotherrevenueraisingconceptsandtheirequityimpacts,suchasannualregistrationfeesacrossallownedvehicles(notjustnewones)orvehiclein-usefees(e.g.fuelpricing,roadpricingorVMTfees)thatcouldberelatedbothtoCO2emissionsandtoelectricv.non-electricdriving.
• Broadeningthegeographicscopeoftheworktoincludeotherstatesornationallevelanalysis(suchasanationalfeebate).
3
IntroductionTheStateofCaliforniaisinterestedinacceleratingthepenetrationoflow-carbonvehicles,includingzero-emissionsvehicles(ZEV)andtransitionalZEVs(TZEV).California’sZEVmandatewillrequire22%ofvehiclessoldinthestatetobeZEVorTZEVby2025(ARB-22014).Currentregulationsrequire3%ofvehiclessoldinCaliforniatobeZEVorTZEV,whichwillremainthecasethrough2017(ARB-12014).Developmentofthismarketwillrequiresupportbyvehiclemanufacturers,government,consumers,andotherstakeholderstohelpthemarketreachthispoint.AkeypolicytosupporttheZEVprogramistheCleanVehicleRebateProject(CVRP).Thisprogramprovidesrebatesofupto$5,000pervehicle,andinFY2015-2016thestateallocated$75millionforrebatesundertheprogram.
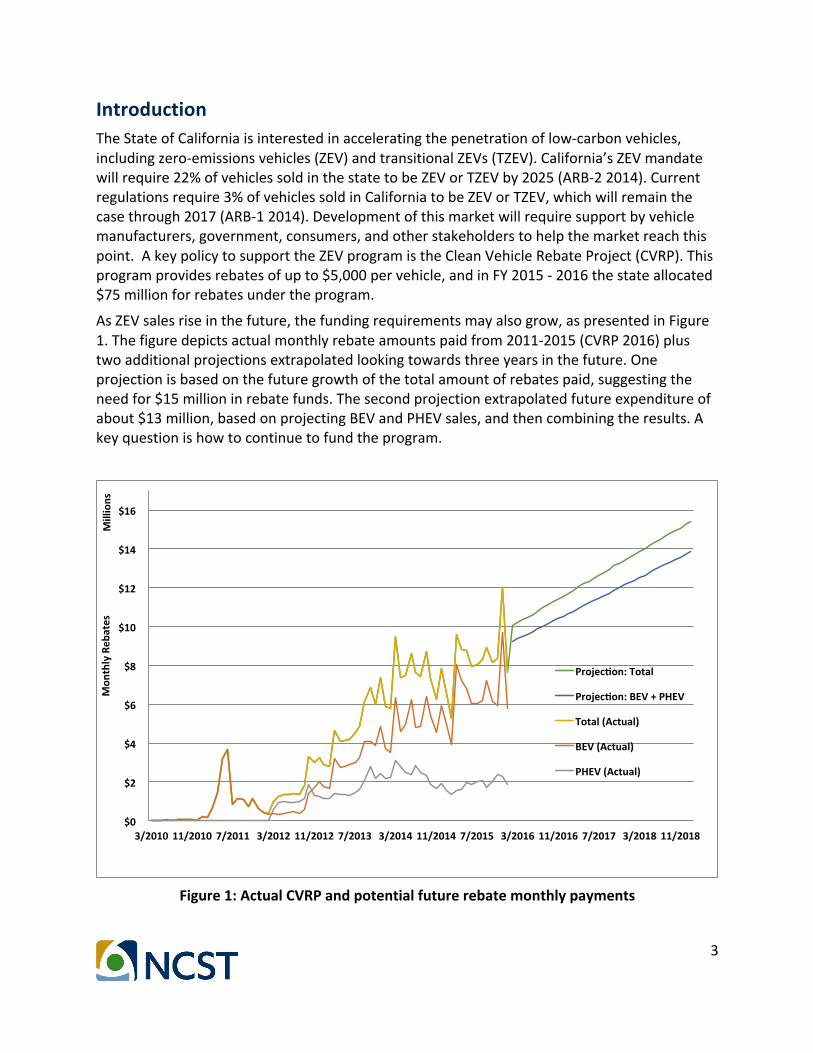
AsZEVsalesriseinthefuture,thefundingrequirementsmayalsogrow,aspresentedinFigure1.Thefiguredepictsactualmonthlyrebateamountspaidfrom2011-2015(CVRP2016)plustwoadditionalprojectionsextrapolatedlookingtowardsthreeyearsinthefuture.Oneprojectionisbasedonthefuturegrowthofthetotalamountofrebatespaid,suggestingtheneedfor$15millioninrebatefunds.Thesecondprojectionextrapolatedfutureexpenditureofabout$13million,basedonprojectingBEVandPHEVsales,andthencombiningtheresults.Akeyquestionishowtocontinuetofundtheprogram.
Figure1:ActualCVRPandpotentialfuturerebatemonthlypayments
!$0!!
!$2!!
!$4!!
!$6!!
!$8!!
!$10!!
!$12!!
!$14!!
!$16!!
3/2010! 11/2010! 7/2011! 3/2012! 11/2012! 7/2013! 3/2014! 11/2014! 7/2015! 3/2016! 11/2016! 7/2017! 3/2018! 11/2018!
Mon
thly!Reb
ates!
!Millions!
Projec>on:!Total!
Projec>on:!BEV!+!PHEV!
Total!(Actual)!
BEV!(Actual)!
PHEV!(Actual)!
4
Onepotentialmechanismtodothisisbyapplyingafeetothesalesofnon-ZEV/TZEVvehicles.Afeestructurecanbeapowerfulmechanism,sincethispolicyapproachcangenerateasustainablerevenuestreamtosupporttheneededincentivesandrelatedexpenses,andcanalsodirectlyencourageconsumerstobuyZEVsviathepricesignalstheyprovideinthemarketplace.Additionally,feestructureshavethepotentialtoaddressequityimplicationsconcerningpolicymakersaboutcurrentfederalandstateincentives,andthefundingsourcesoftheseincentives.ThisstudybuildsontheITS-Davisfeebatestudyconductedduring2008to2010(BunchandGreene,2010)byexploringfeestructurescenarioalternativesintermsoftheirimpactondifferenttypesofvehiclesandhouseholdsinCalifornia.Thisprojectfocusesonanear-termdistributionalimpactanalysisoftheincidenceofdifferentfeestructuresondifferenthouseholds(brokenoutbyincomegroups),withoutlookingatmorecomplexfeestructureissuessuchasvehiclemanufacturerresponsesorconsumerpurchaseresponses.Further,thedatausedinthisprojectfocusesontherecentnewcarmarket(basedon2011-2013data)andhowthedifferentfeestructureswouldimpactthismarket.(Amoreforwardlookinganalysis,withprojectionsofhouseholdincome,purchasepatternsandZEV-relatedfeesandrebatesoutto2025couldbeconsideredasafollow-onstudy.)Thisreportincludesabriefreviewofrecentresearchonfeebatesandvehiclefee-relatedpolicies(particularlytheBunchandGreene(2010)studythatincludedCaliforniainitsanalysis),areviewoftherelevantCaliforniapolicycontext,asnapshotofrecentCaliforniahouseholdcharacteristics(andincomedistributionalaspects),andananalysisofsixdifferenttypesofpotentialfeestructuresbasedonnewcarpurchasesthatappearcapableofraisingenoughrevenuetofundtheCVRP,atleastintheshorttermthrough2018.Finally,potentialextensionsofthisanalysisareidentified,includingmakingprojectionsto2025thatcouldbeundertakeninafollow-onproject.
ABriefReviewofRelevantLiteratureManystudieshaveassessedthepotentialforfeestructurestoimpactvehiclesales,energyuse,andCO2emissions.Somestudieshaveusedmodelingapproaches(e.g.BunchandGreene,2010)andsomehaveassessedexistingfeestructureprograms(mostlyinEurope).Thecurrentresearchonfeestructuresgenerallysuggeststhatfeesystemsprovidepowerfulincentivestovehiclepurchaserstoshifttomoreefficient,lowercarbonvehiclesandtovehiclemanufacturerstoproducesuchvehicles,asevidenceintheUnitedKingdom(Brand,etal,2011)andIreland(RoganandDennehy,etal,2011).BunchandGreeneprovideadetailedreviewintheirreport;therearealsoanumberofpapersonEuropeanfeestructuresystems.TheBunchandGreene(2010)studyisespeciallyrelevantforthecurrentprojectsinceitcoveredtheCaliforniaandU.S.light-dutyvehicle(LDV)market.Theirpaperusedfeebates,acombinationoffeesandrebatesbasedonvehicleemissions,anddeterminedthatarangeofdifferentfeebatescouldsignificantlyreducegreenhousegas(GHG)emissionsinCalifornia,with

5
othernetpositivesocietalbenefitssuchasreducedvehiclelifetimefuelcosts.However,implementingafeebatepolicyonlyinCaliforniawillcreateasystemthatlackstheleveragetochangetheproductionplansofmanufacturerssignificantly,aswellasthebuyinghabitsandpreferencesoftherestofthenation.Anation-widepolicyhasgreaterpotentialtoreduceCO2emissions.BunchandGreenealsofoundthatdesigningafeebateprogramtobearevenueneutralsystemischallengingsinceitinvolvespredictingpurchasingpatternswithperiodicadjustmentstothefeebate.TheydidnotlookspecificallyatfeebateprogramsinvolvingZEVsorthecurrentCVRPprogram,sincetheirstudywasundertakenpriortothecurrentCVRPprogram.RecentstudiesinSwedenandNorwayprovedbeneficialinaidingrebatesforlow-emittingvehicles.Europetendstofavorcompactvehicles.However,largervehiclestendtodominateSweden’sroads.This,alongwithaEuropeanUniondirectivestatingthattheaverageCO2emissionsfornewcarsmustbelessthan200gCO2/mileby2015and153gCO2/mileby2021(EuropeanCommission2015),hasmotivatedSwedentomakechanges.Sweden’sgoalistohaveafossilindependentcarfleetby2030andtobefossilfreeby2050.A2015Swedishstudy(Habibi,Hugosson,etal,2015)basedonthe2013carfleetlookedatfourdifferentfeestructures(referredtoasbonus-malus)andwaystoincorporateemissionsfeesasdifferenttaxes.Theirresultsshowthatconsumerswillnotchangepurchasingdecisionsbasedonafeeassessment,andwillcontinuetopurchasetheirvehicleofchoice.Swedenalsodidnotachievetheiremissionsgoals.However,thebonus-malusissuccessfulingeneratingenoughmoneytofundtherebateportion.ThestudysuggestsSwedenneedsadditionalpoliciesinordertoreachitstargetemissionsgoalsandfindwaystomotivateconsumerstopurchasecleanervehicles.Norwayfacessimilaremissionsproblemssinceitwitnessedanincreaseinpersonalvehiclesandvehiclemilestraveled.Duetotheseincreases,Norway’svehicleemissionsare30%higherthannumbersrecordedin1990.A2014studylookedatNorway’s2007vehicleregistrationtaxreform(Ciccone2014),whichaimstoreduceemissionsbydisincentivizinghighemittingvehicles.Norwaydoesnotmanufactureanycars,soitmustimplementpoliciesinordertobeeffectiveatreducingvehicleemissions.Norway’semissionstaxisattimeofpurchase,andismosteffectivebecausetheirconsumersaretypicallyswayedbyprice.Previoustaxeswerebasedonengine-size,buthavebeenupdatedtoreflectCO2emissions.Norway’sbonus-malusispoliticallyacceptablebecauseitsgoalisrevenueneutrality.In2007,theaveragecaremitted257gCO2/mile.Norwaysuccessfullyreducedemissionsofnewvehiclesby10gCO2/milewhenthepolicywasfirstenactedin2007.Researchersestimatethiswaspartiallyduetoa23%increaseinthemarketshareofdieselcarsanda12%decreaseinthemarketshareforhigh-emittingvehicles,aswellasimprovementsinfueleconomy.WhatisclearisthatwiththecurrentCVRPpurchaseincentiveprogramforZEVandTZEVvehicles,afeestructureoverlaidonthiscouldprovide:revenuestohelppayfortheexistingincentives,andastrongerincentiveforconsumerstoshifttheirpurchasestoloweremittingvehicleswithincentives(sincemorevehicleswouldalsohavefeesassociatedwiththeirpurchase).

6
AnelementmissinginBunchandGreene,aswellasotherstudies,isananalysisofthepotentialimpactofdifferentfeestructuresondifferenttypesofhouseholds(intermsofincome,purchasepatterns,orothercharacteristics).ThisprojectinvestigatesthisquestionandprovidesaninitialanalysisoffeestructuresintheCaliforniacontext,providingacontributionthatbuildsonthispreviouswork.
CurrentCaliforniaPolicyCaliforniahasarangeofcurrentpoliciesthatincentivizepurchasinglow-emittingpersonalvehicles.TheseincludetheCVRPandrelatedbillsAB118andSB1275,amongothers.ARB’sLowCarbonTransportationandAQIP(AirQualityImprovementProgram)fundtheCVRP,whichisthecurrentsourceforplug-invehiclerebates.ForFY2015-2016,theCaliforniaAirResourcesBoard(ARB)allocated$75millioninrebates,andhasalreadyrunoutoffunding.CVRPincentivesareasfollows:ZEVspoweredonlybyabattery(BEVs)andproducenotailpipeemissionsqualifyforarebateof$2,500,FuelCellElectricVehicles(FCEVs)receive$5,000,andPlug-inHybridElectricVehicles(PHEVs)receivea$1,500rebate.SenateBill1275,TheChargeAheadCaliforniaInitiative,aidslower-incomecarbuyersintheireffortstosupporttheenvironmentandpurchasecleanvehicles.ThebillplacesacaponthemaximumallowableannualhouseholdincomeeligiblefortheCVRP.IncomethresholdsbasedontaxreturnsrequireZEVrebateeligibilitybasedonsinglefilersearninglessthan$250,000,$340,000forheadofhouseholds,and$500,000forfilingjoint,whichwentintoeffectinMarch2016.HouseholdspurchasingFCEVsarenotsubjecttotheincomecapforthefirstthreeyearsofthebill.Additionally,thelawincreasestherebateamountforlower-incomehouseholdsby$1,500.Furthermore,SB1275givesauthoritytoARBtodecreaserebateamountsasnecessary,inordertocontinueincentivizingcleanvehiclepurchases.AstheZEVmarketgrows,ARBsuggeststherebateamountswilldiminish,thoughincentivizingpurchasesisimportanttoenticeconsumerstobuythesevehiclesinordertomeettheZEVmandaterequirements.ThevehicleincentiveamountsbytypeofvehicleandhouseholdincomeareshowninTable2.

7
Table2.SummaryofCVRPincentiveamountsunderSB1275
Source:ARB2015
AnalysisApproachThisfeestructureanalysisfocusesnotonfuturepotentialstructuresofrebatesundertheCVRPorrelatedprograms,butinsteadonpotentialfeesonnon-ZEV/TZEVsthatcouldbedeployedtocoverrebatecostsundertheCVRP.Thisstudyalsodoesnotestimatemarketresponsestothevariousfeestructuresconsidered,butfocusesonassessingandreportingtheincidenceoftheparticularfeestructuresondifferenttypesofcarsanddifferenthouseholdincomecategories.Thisanalysisisbasedonhistoricaldata.Noprojectionshavebeenmadeatthistime,thoughthatwouldbeanextphaseoftheanalysis.ThegoalistofirstunderstandthecurrentandrecentnatureofvehiclepurchasesacrossdifferenthouseholdincomesforpotentialCVRPcostsinthenextfewyears,beforelookingoutto2020andbeyond.Datausedforthisanalysiswascollectedfromthe2010-2012CaliforniaHouseholdTravelSurvey(CHTS).Therewere42,431householdswhocompletedthesurvey,dividedinto10incomegroups,andencompassingover70,000vehicles.Asubsetwascreatedbasedonnewvehiclepurchases,encompassingModelYear2011-2013vehicles.Some2013vehiclesareincludedinthissurveysincetheywereavailableforpurchaseattheendof2012.Thesubsetrepresentsabout13%ofallCHTShouseholds.NotmanyTZEVsandZEVsweresoldintheseyears.Asaresult,thestudyfocusesontherestofthevehiclemarket,andlooksatfeestructuresonthesenon-TZEVsandnon-ZEVsthatwouldraiseenoughrevenuetopayforalltherebatesactuallydistributedbytheCVRP.Itisestimatedtorequire$200million(arough
8
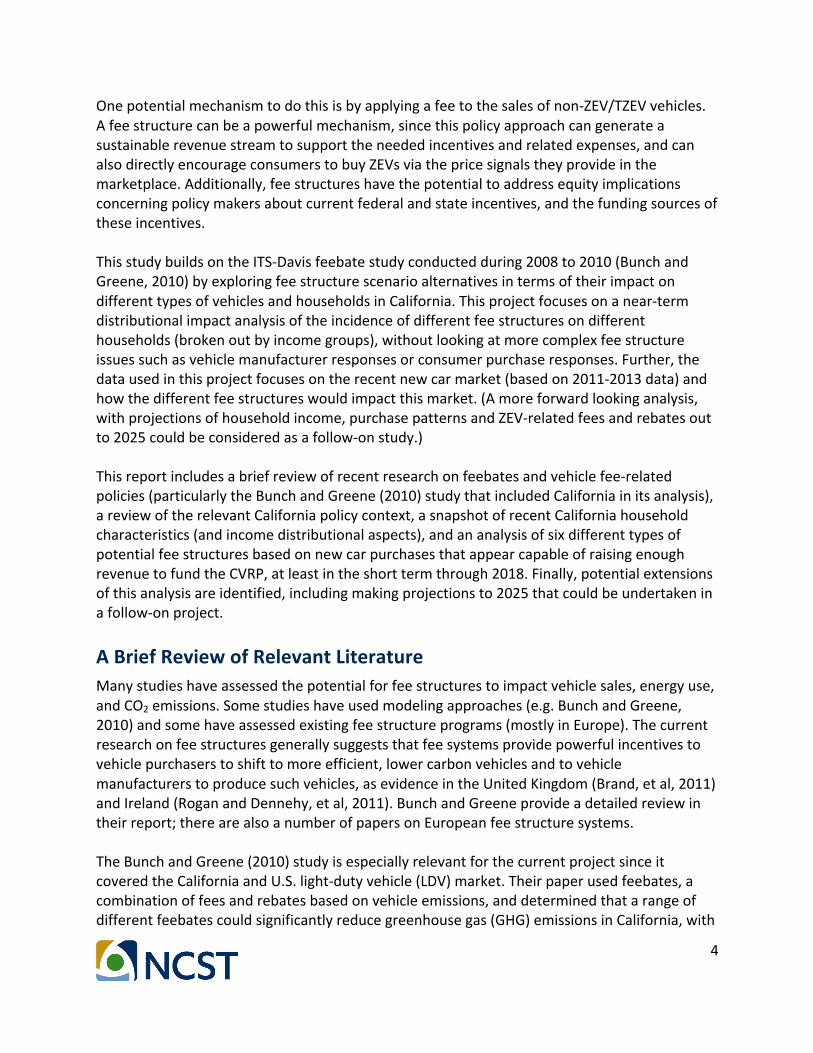
estimatebasedonpreviousrebatetotalsandbudgetedpaymentsof$160millionduring2015)1.Tounderstandwhichhouseholdsarepurchasingnewvehiclesandthekindsofvehiclesthatarepurchased,thestudyfirstlookedathouseholdincomesofnewcarbuyers,theirexpendituresonnewlight-dutyvehicles,andtheemissionsassociatedwiththosepurchases.Thehouseholdincomeswereself-reportedaspartoftheCHTS,andwerenotverified.Figure2showsthepopulationdistributionofthosehouseholdsparticipatingintheCHTS,weightedbyregiontodenotethestate’spopulation,ascomparedtothosehouseholdswhoactuallypurchasedatleastonemodelyear2011-2013vehicle,basedonhouseholdincome.ItalsoshowsthepercentageofhouseholdswithineachincomegroupoftheCHTSwhopurchasednewvehicles,aswellasthepercentofnewvehiclebuyersperincomegroup.ThesurveyincludessomeModelYear2013vehicles,sincetheywereavailableforpurchaseattheendof2012.
Figure2.Populationrepresentationofnewcarbuyersascomparedtooverallpopulation
1However,in2015thefinalbudgetallocationwasonly$75million,withrequestspendingforadditionalfunding.
0%#
5%#
10%#
15%#
20%#
25%#
30%#
35%#
40%#
0.0#
0.2#
0.4#
0.6#
0.8#
1.0#
1.2#
1.4#
1.6#
1.8#
2.0#
10,000#-#24,999#
25,000#-#34,999#
35,000#-#49,999#
50,000#-#74,999#
75,000#-#99,999#
100,000#-#149,999#
150,000#-#199,999#
200,000#-#249,999#
250,000+#
Millions#
Households#who#par@cipated#in#CHTS#
Households#who#purchased#2011-2013#vehicles#
%#of#Households#within#income#group#who#purchased#new#vehicles#
%#of#All#new#vehicle#buyers#
9
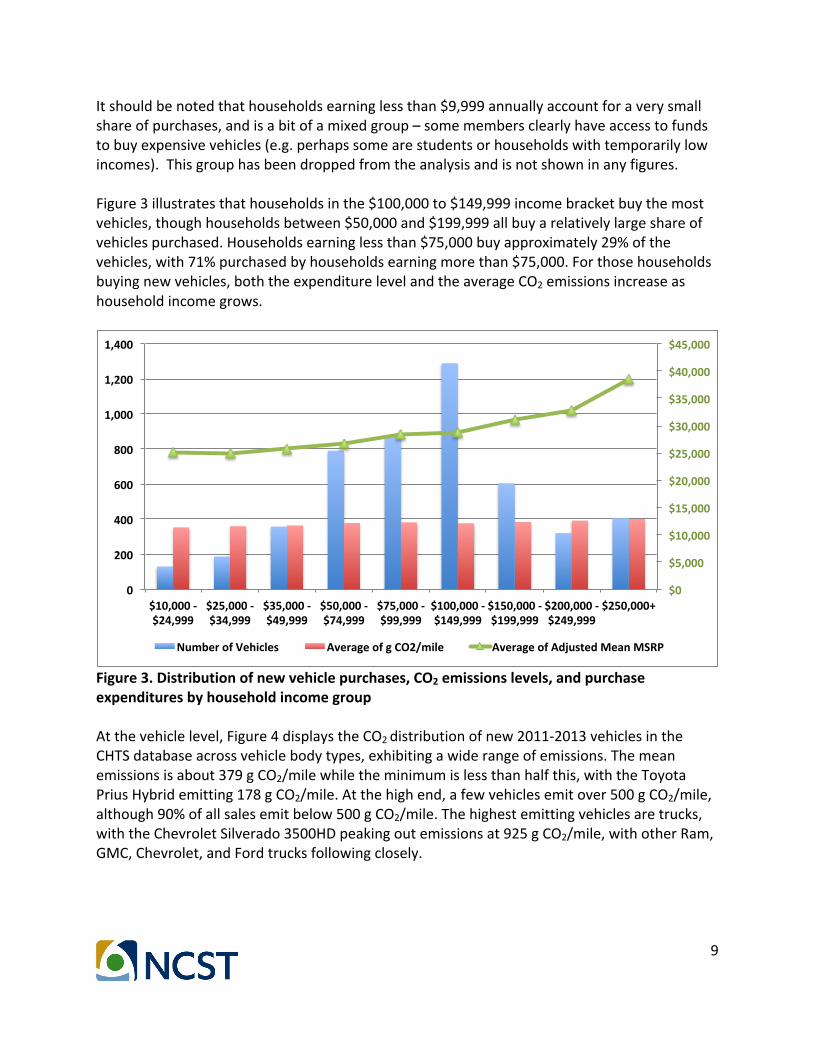
Itshouldbenotedthathouseholdsearninglessthan$9,999annuallyaccountforaverysmallshareofpurchases,andisabitofamixedgroup–somemembersclearlyhaveaccesstofundstobuyexpensivevehicles(e.g.perhapssomearestudentsorhouseholdswithtemporarilylowincomes).Thisgrouphasbeendroppedfromtheanalysisandisnotshowninanyfigures.Figure3illustratesthathouseholdsinthe$100,000to$149,999incomebracketbuythemostvehicles,thoughhouseholdsbetween$50,000and$199,999allbuyarelativelylargeshareofvehiclespurchased.Householdsearninglessthan$75,000buyapproximately29%ofthevehicles,with71%purchasedbyhouseholdsearningmorethan$75,000.Forthosehouseholdsbuyingnewvehicles,boththeexpenditurelevelandtheaverageCO2emissionsincreaseashouseholdincomegrows.
Figure3.Distributionofnewvehiclepurchases,CO2emissionslevels,andpurchaseexpendituresbyhouseholdincomegroupAtthevehiclelevel,Figure4displaystheCO2distributionofnew2011-2013vehiclesintheCHTSdatabaseacrossvehiclebodytypes,exhibitingawiderangeofemissions.Themeanemissionsisabout379gCO2/milewhiletheminimumislessthanhalfthis,withtheToyotaPriusHybridemitting178gCO2/mile.Atthehighend,afewvehiclesemitover500gCO2/mile,although90%ofallsalesemitbelow500gCO2/mile.Thehighestemittingvehiclesaretrucks,withtheChevroletSilverado3500HDpeakingoutemissionsat925gCO2/mile,withotherRam,GMC,Chevrolet,andFordtrucksfollowingclosely.
$0#
$5,000#
$10,000#
$15,000#
$20,000#
$25,000#
$30,000#
$35,000#
$40,000#
$45,000#
0#
200#
400#
600#
800#
1,000#
1,200#
1,400#
$10,000#,#$24,999#
$25,000#,#$34,999#
$35,000#,#$49,999#
$50,000#,#$74,999#
$75,000#,#$99,999#
$100,000#,#$149,999#
$150,000#,#$199,999#
$200,000#,#$249,999#
$250,000+#
Number#of#Vehicles# Average#of#g#CO2/mile# Average#of#Adjusted#Mean#MSRP#

10
Figure4.CO2characteristicsandweighteddistributionfornewcars,2011-2013Theexpenditureeffect,showninFigure5,presentstheshareofpurchasesbyvehicleprice(ManufacturerSuggestedRetailPrice,MSRP)acrossdifferenthouseholdincomegroups.Asincomeincreases,householdspurchasemoreexpensivevehicles.Edmunds.comdataaddedMSRPvalues,waslinkedtotheCHTSsurveybycomparingself-reportedvehiclecharacteristicstotheEdmundsinformation,andthenadjustedto2011dollars.
Figure5.DistributionofnewvehicleadjustedMSRPperannualhouseholdincome
0"
50,000"
100,000"
150,000"
200,000"
250,000"
300,000"
350,000"
400,000"
150)200"
200)250"
251)300"
301)350"
351)400"
401)450"
451)500"
501)550"
551)600"
601)650"
651)700"
701)750"
751)800"
801)850"
851)900"
901)950"
g"CO2/mile"
wagon"
van"
SUV"
sedan"
pick)up"
minivan"
hatchback"
coupe"
converHble"
0%#
10%#
20%#
30%#
40%#
50%#
60%#
70%#
80%#
90%#
100%#
10,000#.#24,999#
25,000#.#34,999#
35,000#.#49,999#
50,000#.#74,999#
75,000#.#99,999#
100,000#.#149,999#
150,000#.#199,999#
200,000#.#249,999#
250,000+# All#Households#
Annual#Household#Income#
$55,000+#
$40,000.$55,000#
$34,000.$40,000#
$27,000.$34,000#
$19,000.$27,000#
$16,000.$19,000#
<$16,000#

11
ThetotalMSRPexpenditureasapercentageoftotalhouseholdincomeisdisplayedinFigure6.Therelationshipbetweenvehicleexpenditurechangesdrasticallyasincomeincreases.Thelowerincomehouseholdsspendmorethantheirincomewhenpurchasingnewvehicles.Forthosehouseholdsearninglessthan$75,000,53%oftheirincomewasspentonanewvehicle,whereashouseholdsearningmorethan$75,000used21%oftheirincomeonanewvehicle.Thisalsoassumesthevehiclewaspaidforinitsentiretyattimeofpurchaseandignoresthepossibilityofvehiclefinancing.
Figure6.ShareofnewvehicleexpenditurebytotalincomeFigure7showsCO2emissionsdistributionfromnewvehicles,whichwereassignedtoeightdifferentemissionscategories.Thereisashiftfrommodelsinthe300-400gCO2/milerangeintothe400-500gCO2/milerange,ashouseholdincomeincreases,mostvisibleasincomegrowsabove$150,000.
0%#
20%#
40%#
60%#
80%#
100%#
120%#
140%#
160%#
10,000#*#24,999#
25,000#*#34,999#
35,000#*#49,999#
50,000#*#74,999#
75,000#*#99,999#
100,000#*#149,999#
150,000#*#199,999#
200,000#*#249,999#
250,000+#
Share#of#MSRP#per#Household#Income#Group#

12
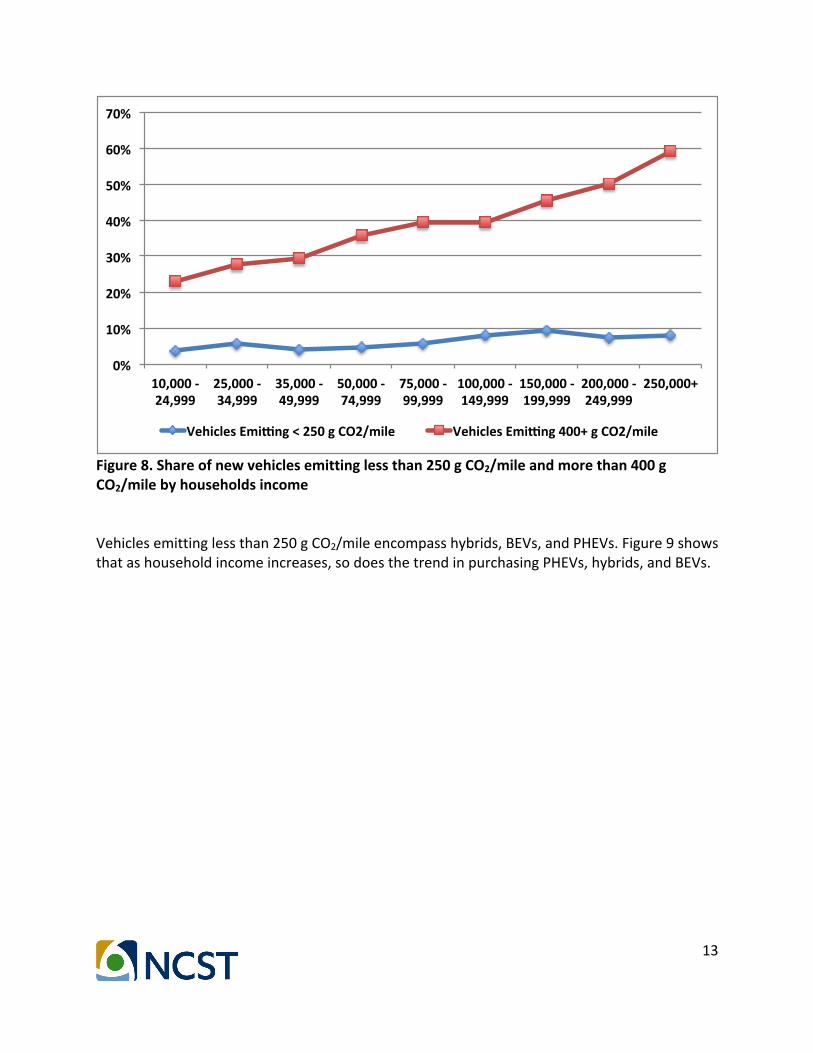
Figure7.DistributionofvehicleGHGemissions(gCO2/mile)perannualhouseholdincomeAlsonoticeable,inFigure8,aremodelsemittinglessthan250gCO2/mileperaremorecommoninthehigherincomehouseholds.Householdsearninglessthan$75,000purchase20%oftheselowemissionvehicles,withtheremaining80%purchasedbyhouseholdsearningmorethan$75,000.However,theneteffectonaverageCO2isrelativelyminor(asshowninFigure3),sincethenumberofhatchbacksandSUVsincreasedandpickuptrucksdecreaseinthehighestincomehouseholds.
0%#
10%#
20%#
30%#
40%#
50%#
60%#
70%#
80%#
90%#
100%#
10,000#.#24,999#
25,000#.#34,999#
35,000#.#49,999#
50,000#.#74,999#
75,000#.#99,999#
100,000#.#149,999#
150,000#.#199,999#
200,000#.#249,999#
250,000+# All#Households#
Annual#Household#Income#
500+#
450.500#
400.450#
350.400#
300.350#
250.300#
200.250#
<200#
13
Figure8.Shareofnewvehiclesemittinglessthan250gCO2/mileandmorethan400gCO2/milebyhouseholdsincomeVehiclesemittinglessthan250gCO2/mileencompasshybrids,BEVs,andPHEVs.Figure9showsthatashouseholdincomeincreases,sodoesthetrendinpurchasingPHEVs,hybrids,andBEVs.
0%#
10%#
20%#
30%#
40%#
50%#
60%#
70%#
10,000#,#24,999#
25,000#,#34,999#
35,000#,#49,999#
50,000#,#74,999#
75,000#,#99,999#
100,000#,#149,999#
150,000#,#199,999#
200,000#,#249,999#
250,000+#
Vehicles#Emi8ng#<#250#g#CO2/mile# Vehicles#Emi8ng#400+#g#CO2/mile#
14
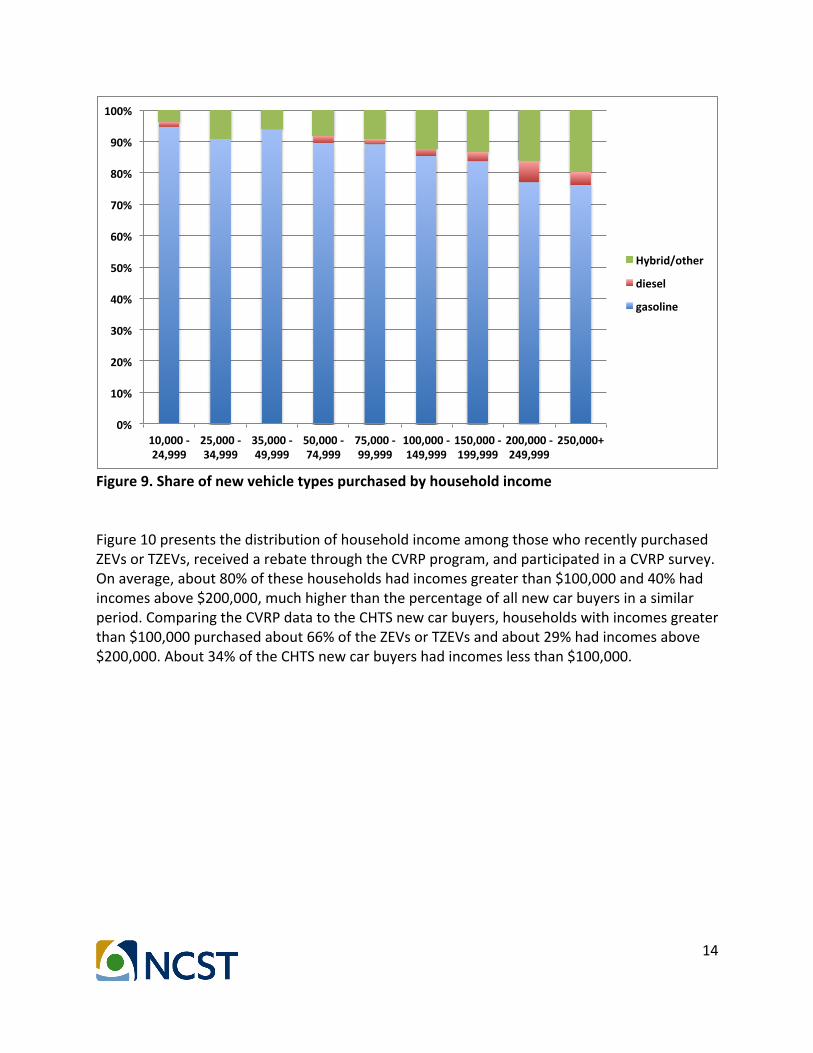
Figure9.ShareofnewvehicletypespurchasedbyhouseholdincomeFigure10presentsthedistributionofhouseholdincomeamongthosewhorecentlypurchasedZEVsorTZEVs,receivedarebatethroughtheCVRPprogram,andparticipatedinaCVRPsurvey.Onaverage,about80%ofthesehouseholdshadincomesgreaterthan$100,000and40%hadincomesabove$200,000,muchhigherthanthepercentageofallnewcarbuyersinasimilarperiod.ComparingtheCVRPdatatotheCHTSnewcarbuyers,householdswithincomesgreaterthan$100,000purchasedabout66%oftheZEVsorTZEVsandabout29%hadincomesabove$200,000.About34%oftheCHTSnewcarbuyershadincomeslessthan$100,000.
0%#
10%#
20%#
30%#
40%#
50%#
60%#
70%#
80%#
90%#
100%#
10,000#.#24,999#
25,000#.#34,999#
35,000#.#49,999#
50,000#.#74,999#
75,000#.#99,999#
100,000#.#149,999#
150,000#.#199,999#
200,000#.#249,999#
250,000+#
Hybrid/other#
diesel#
gasoline#
15
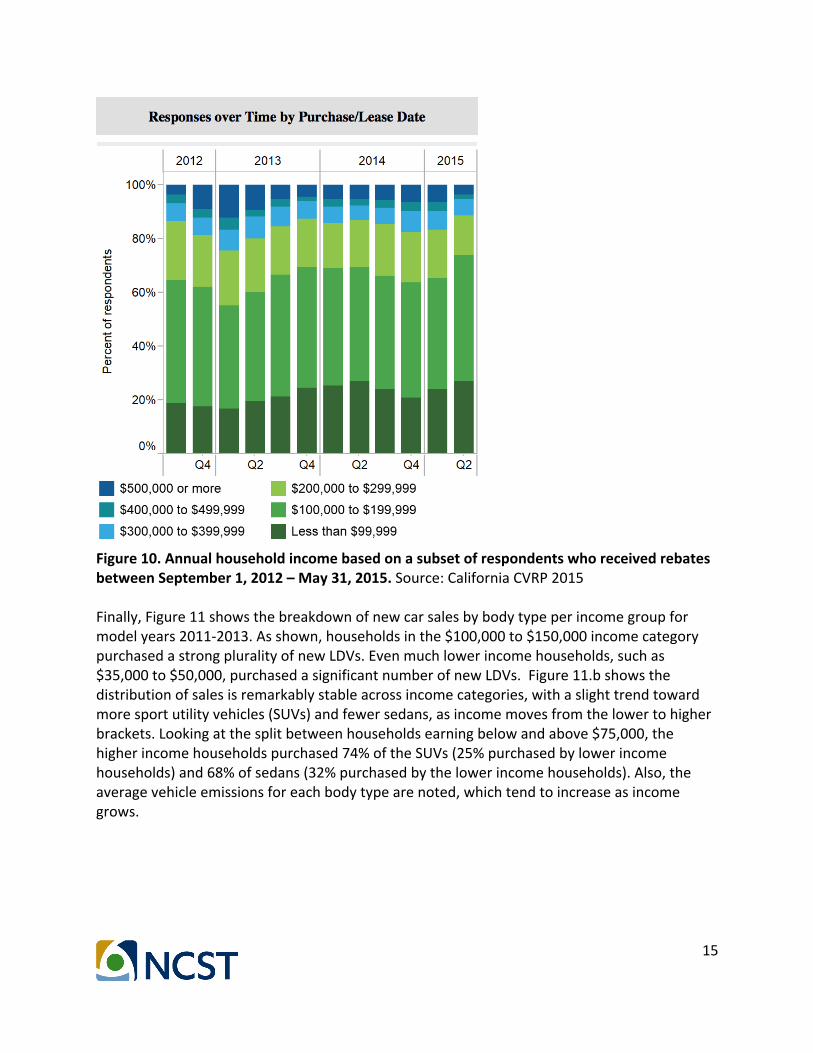
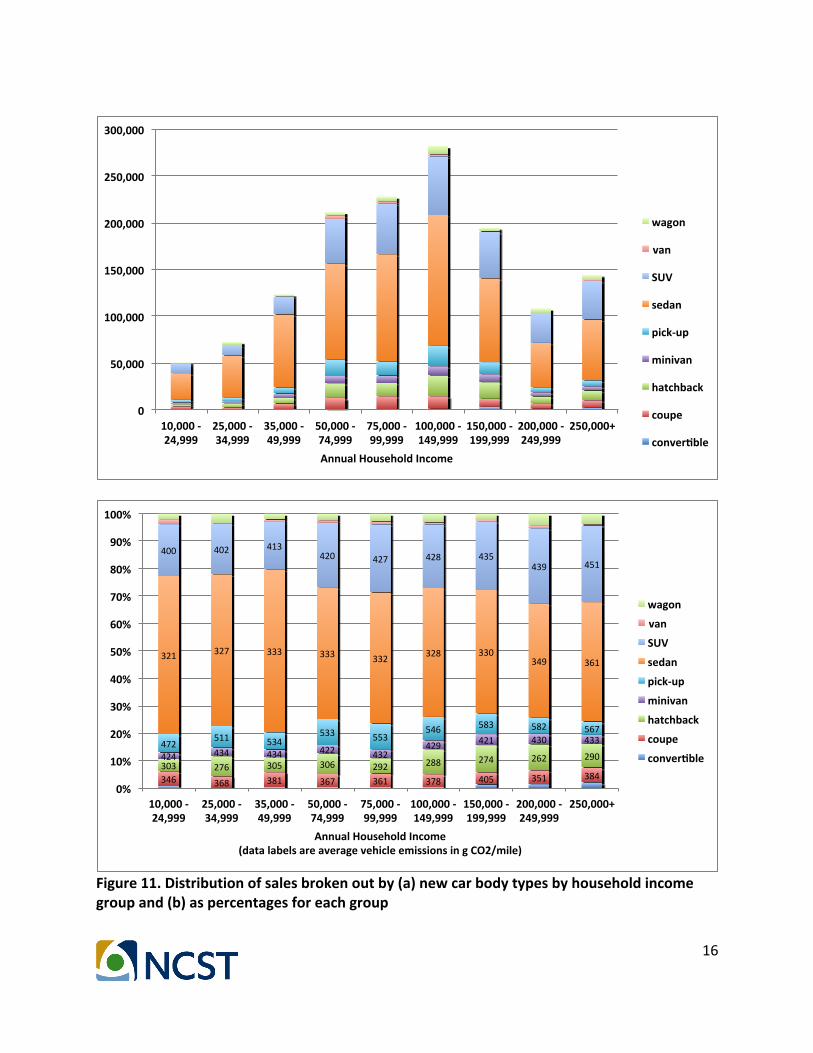
Figure10.AnnualhouseholdincomebasedonasubsetofrespondentswhoreceivedrebatesbetweenSeptember1,2012–May31,2015.Source:CaliforniaCVRP2015Finally,Figure11showsthebreakdownofnewcarsalesbybodytypeperincomegroupformodelyears2011-2013.Asshown,householdsinthe$100,000to$150,000incomecategorypurchasedastrongpluralityofnewLDVs.Evenmuchlowerincomehouseholds,suchas$35,000to$50,000,purchasedasignificantnumberofnewLDVs.Figure11.bshowsthedistributionofsalesisremarkablystableacrossincomecategories,withaslighttrendtowardmoresportutilityvehicles(SUVs)andfewersedans,asincomemovesfromthelowertohigherbrackets.Lookingatthesplitbetweenhouseholdsearningbelowandabove$75,000,thehigherincomehouseholdspurchased74%oftheSUVs(25%purchasedbylowerincomehouseholds)and68%ofsedans(32%purchasedbythelowerincomehouseholds).Also,theaveragevehicleemissionsforeachbodytypearenoted,whichtendtoincreaseasincomegrows.
16
Figure11.Distributionofsalesbrokenoutby(a)newcarbodytypesbyhouseholdincomegroupand(b)aspercentagesforeachgroup
0"
50,000"
100,000"
150,000"
200,000"
250,000"
300,000"
10,000"("24,999"
25,000"("34,999"
35,000"("49,999"
50,000"("74,999"
75,000"("99,999"
100,000"("149,999"
150,000"("199,999"
200,000"("249,999"
250,000+"
Annual"Household"Income"
wagon"
van"
SUV"
sedan"
pick(up"
minivan"
hatchback"
coupe"
converGble"
346$ 368$ 381$ 367$ 361$ 378$ 405$ 351$ 384$303$ 276$ 305$ 306$ 292$ 288$ 274$ 262$ 290$424$ 434$ 434$ 422$ 432$
429$ 421$ 430$ 433$472$511$ 534$
533$ 553$546$ 583$ 582$ 567$
321$ 327$ 333$ 333$ 332$ 328$ 330$349$ 361$
400$ 402$ 413$420$ 427$ 428$ 435$
439$ 451$
0%#
10%#
20%#
30%#
40%#
50%#
60%#
70%#
80%#
90%#
100%#
10,000#.#24,999#
25,000#.#34,999#
35,000#.#49,999#
50,000#.#74,999#
75,000#.#99,999#
100,000#.#149,999#
150,000#.#199,999#
200,000#.#249,999#
250,000+#
Annual#Household#Income#(data#labels#are#average#vehicle#emissions#in#g#CO2/mile)#
wagon#
van#
SUV#
sedan#
pick.up#
minivan#
hatchback#
coupe#
converOble#

17
AnalysisofAlternativeFeeStructuresAsdescribedabove,thedataanalyzedrepresentsvehiclesalesbetween2011and2013,andthecharacteristicsofthehouseholdsthatboughtthesevehicles.ThefundsgeneratedarebasedonthetotalpaidCVRPincentives.Varioustypesofvehiclefeestructuresweredevelopedtoexploretheimpactonequitywhileexcludinglowincomeorbelowaverage-pricedvehicles,basedonCO2emissions.Theanalysisobserveshowthesefeeswouldbedistributedacrosshouseholds,giventhehouseholdincomeandvehiclesalesdistributionsintheCHTS.Asimplecalculationrevealsthatifallnon-ZEVbuyerspaidthesamefee,thisfeewouldbeabout$140pervehicle.Buildingoffthissimplescenario,twobroadtypesofCO2-basedfeestructureswereexamined.Scenario1requiresallnon-ZEVpurchaserstopayafeedifferentiatedbyvehicleCO2.Scenario2exemptspurchasersofcarsemittingbelow250gCO2/milelevelfrompayinganyfee-effectivelya“donuthole”structuresincePHEVsreceivearebateundertheCVRP.Ahouseholdincomescenarioisalsoincludedintheanalysistotesttheeffectofexcludinglowerincomehouseholds,whereonlyhouseholdsearningmorethan$75,000peryearpayanyfeewhenbuyingacar(Scenario3).The$75,000annualincomethresholdwasselected,asitseparatedCHTSnewcarbuyersintoaboutequalhalves.Further,inScenario4,onlythosehouseholdsthatearnmorethan$75,000annuallyandpurchaseavehicleemittingmorethan400gCO2/milepayafee.Itwouldbedifficulttoaddincomeverificationtothefeeprocess,soMSRPscenariosarethesecondbestoptiontoreducetheburdenonlowerincomebuyers.InScenarios5and6,vehicleMSRPplayedaroleindeterminingwhichhouseholdspayafee.ThiswastoexaminewhetherexemptingvehicleswithMSRPlessthan$27,000wouldplacelessofaburdenonlowerincomehouseholds,andwhetherithasaneffectonfeespaidbyotherhouseholds.Thisthresholdwasestablishedbecauseitisbelow$29,000,theaverage-pricedvehicleinthedataset.Thecombinationofthesevariantscreatedsixseparatescenarios,asshowninTable3.Scenario4and6assessedallvehiclesemittingover400gCO2/mileafee,regardlessofincomeorMSRP.Thetypicalvehiclesexcludedbasedonemittinglessthan250gCO2/mileareamixtureofhybrids,someofwhicharetheHondaCivichybrid,ToyotaPrius,Smartfor2,amongothers.Commonvehiclesemittingover400gCO2/mileincludeminivans,SUVs,andpick-uptrucks.Thosecarsemittingover400gCO2/mileinclude76%ofthevehiclesforincomegroupsearningabove$75,000.

18
Table3.FeestructurescenariosconsideredScenarioDescription
CO2 Income MSRP
Scenario1 Allpay Allpay Allpay
Scenario2 Vehiclesemittinglessthan250gCO2/mileareexempt
---- ----
Scenario3 --- Exempthouseholdswithincomebelow$75,000
---
Scenario4 Vehiclesemittinglessthan400gCO2/mileareexempt
Exempthouseholdswithincomebelow$75,000
---
Scenario5 --- --- ExemptvehicleswithMSRPbelow$27,000
Scenario6 Vehiclesemittinglessthan400gCO2/mileareexempt
--- ExemptvehicleswithMSRPbelow$27,000
Inallscenarios,thegoalistogenerate$200millioninrevenuefortheCVRPrebates,withaminimumfeeof$100pernewvehicle,forthosevehiclesthatincurafee.The$200millionperyearshouldbesufficienttocoverCVRPcostsoverthenext3years,beforehighertotalrevenuestreamsmaybeneededasaresultofincreasedZEVsalesrequirements(whichwillbeaddressedinalaterphaseofthisanalysisthatlooksoutto2025).Theminimum$100pervehiclereflectstheideathatanyamountbelowthisismorenuisancethanusefulrevenuecollector.Inordertogeneratethetarget$200millionineachofthesixscenarios,themaximumfeepaidforthehighestCO2vehicleswasadjustedhigherorlower(thusaffectingtheslopeofthefeescheduleandthefeepaidforallcars)asneededtoachievethetargetedrevenue.TheCO2emissionsstartingfeeandtheincomelevelsofhouseholdsexemptfromthefeewerealsoadjustedupordowndependingonthescenario.Itisimportanttonoteatthistime,thatthepossibilitythefeeswillinanywayalterthechoicespeoplemakeofwhichvehicletopurchasewasnotconsidered.Excludingconsumerchoiceisamajorsimplification,sincetheapplicationofvehiclepurchasefeeswilllikelyaffectthecarmodelsthatpeoplepurchase.However,aswillbeseenbelow,thelevelsoffeenecessarytogeneratethetargetrevenuesconstitute0.5%ofthevehiclecost,andarelowenoughthatconsumerpurchaseshiftsinresponsearesmallandcanperhapsbeneglected.Athigherfees(neededforhigherrevenuetargetsandaslessnon-ZEV/TZEVvehiclesaresold),this
19
assumptionwillbecomemoreunrealistic.Thisissuewillbefurtherexploredinalaterphaseofstudy.
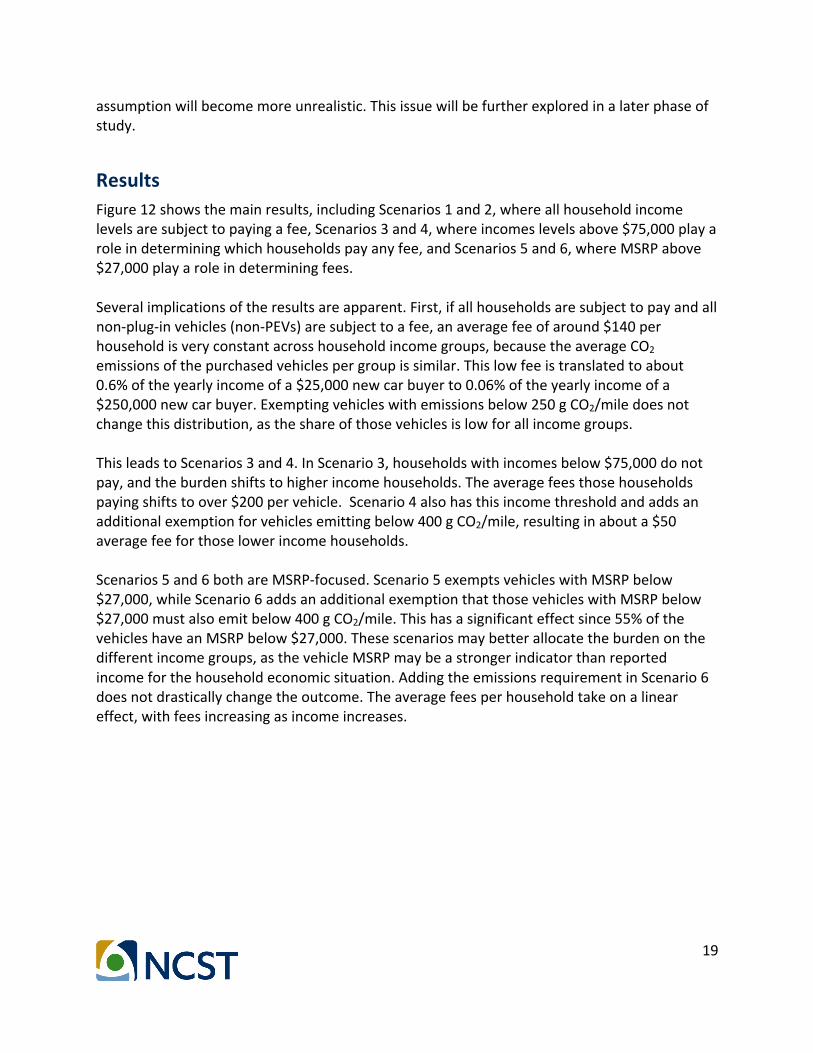
ResultsFigure12showsthemainresults,includingScenarios1and2,whereallhouseholdincomelevelsaresubjecttopayingafee,Scenarios3and4,whereincomeslevelsabove$75,000playaroleindeterminingwhichhouseholdspayanyfee,andScenarios5and6,whereMSRPabove$27,000playaroleindeterminingfees.Severalimplicationsoftheresultsareapparent.First,ifallhouseholdsaresubjecttopayandallnon-plug-invehicles(non-PEVs)aresubjecttoafee,anaveragefeeofaround$140perhouseholdisveryconstantacrosshouseholdincomegroups,becausetheaverageCO2
emissionsofthepurchasedvehiclespergroupissimilar.Thislowfeeistranslatedtoabout0.6%oftheyearlyincomeofa$25,000newcarbuyerto0.06%oftheyearlyincomeofa$250,000newcarbuyer.Exemptingvehicleswithemissionsbelow250gCO2/miledoesnotchangethisdistribution,astheshareofthosevehiclesislowforallincomegroups.ThisleadstoScenarios3and4.InScenario3,householdswithincomesbelow$75,000donotpay,andtheburdenshiftstohigherincomehouseholds.Theaveragefeesthosehouseholdspayingshiftstoover$200pervehicle.Scenario4alsohasthisincomethresholdandaddsanadditionalexemptionforvehiclesemittingbelow400gCO2/mile,resultinginabouta$50averagefeeforthoselowerincomehouseholds.Scenarios5and6bothareMSRP-focused.Scenario5exemptsvehicleswithMSRPbelow$27,000,whileScenario6addsanadditionalexemptionthatthosevehicleswithMSRPbelow$27,000mustalsoemitbelow400gCO2/mile.Thishasasignificanteffectsince55%ofthevehicleshaveanMSRPbelow$27,000.Thesescenariosmaybetterallocatetheburdenonthedifferentincomegroups,asthevehicleMSRPmaybeastrongerindicatorthanreportedincomeforthehouseholdeconomicsituation.AddingtheemissionsrequirementinScenario6doesnotdrasticallychangetheoutcome.Theaveragefeesperhouseholdtakeonalineareffect,withfeesincreasingasincomeincreases.

20
Figure12.AveragefeepervehicleperannualhouseholdincomeThefulldistributionoffeelevelsasafunctionofvehicleCO2levelsisshowninFigures13-15below.Figure13comparesScenario1,wherethefeestartsat177gCO2/mile(thebestnon-PHEV)toScenario2,wherethefeestartsat250gCO2/mile(exempting7%ofthenewvehicles).Withthefeestartingat177gCO2/mile,thefeeneedstorisetoabout$210forthehighestemittingvehiclesandthefeeneedstobeabout$160forthehighestemitters(500gCO2/mile)togeneratetheneeded$200million.Thustherevenuecanberaisedwith0.62%ofhouseholdspayingmorethan$200whenpurchasingavehicle.Withonlycarsaboveaminimumof250gCO2/milepayingafee,theupperlimitrisesfrom$208toabout$228andthefeeforcarsat500gCO2/mileisabout$170.
$0#
$50#
$100#
$150#
$200#
$250#
10,000#(#24,999#
25,000#(#34,999#
35,000#(#49,999#
50,000#(#74,999#
75,000#(#99,999#
100,000#(#149,999#
150,000#(#199,999#
200,000#(#249,999#
250,000+#
Average#Fee#pe
r#Veh
icle#
Annual#Household#Income#
Scenario#1:#All#Pay#
Scenario#2:#CO2#<#250#g#CO2/mile#exempt#
Scenario#3:#Income#<#$75k#exempt#
Scenario#4:#Income#<#$75k#and#CO2#<#400#g/mile#exempt##
Scenario#5:#Vehicles#MSRP#<#$27,000#exempt#
Scenario#6:#Vehicles#MSRP#<#$27,000#and#CO2#<#400#g/mile#exempt#
21
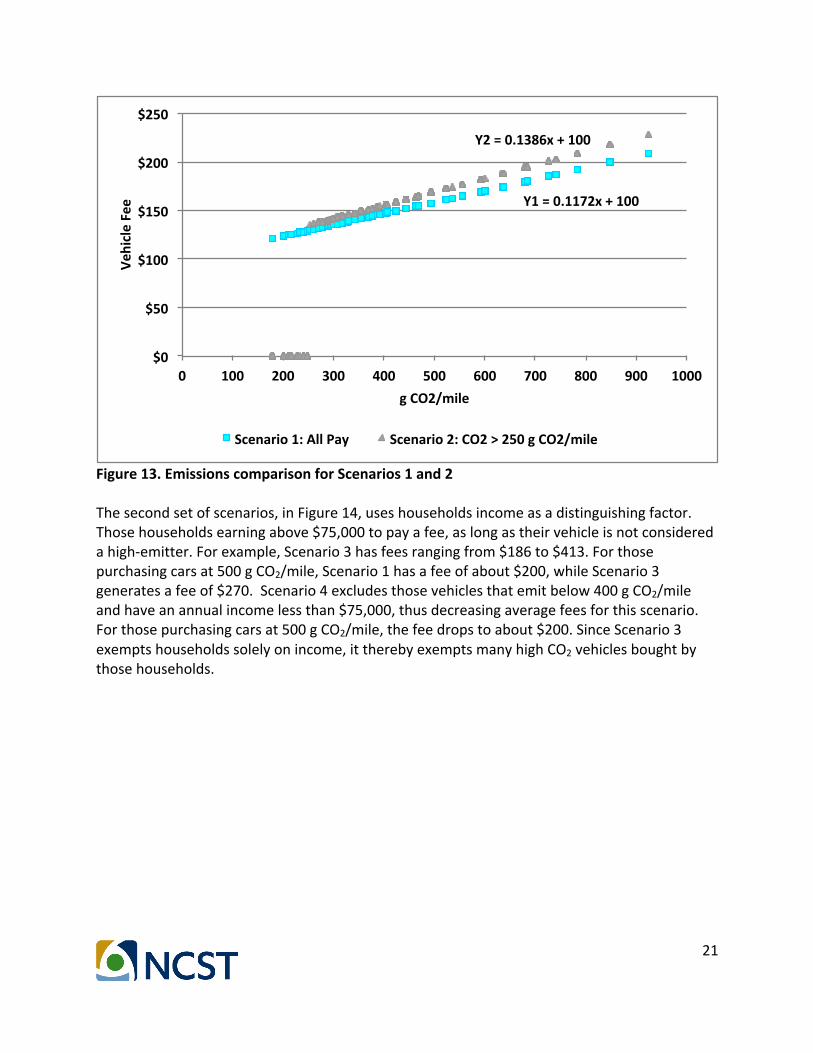
Figure13.EmissionscomparisonforScenarios1and2Thesecondsetofscenarios,inFigure14,useshouseholdsincomeasadistinguishingfactor.Thosehouseholdsearningabove$75,000topayafee,aslongastheirvehicleisnotconsideredahigh-emitter.Forexample,Scenario3hasfeesrangingfrom$186to$413.Forthosepurchasingcarsat500gCO2/mile,Scenario1hasafeeofabout$200,whileScenario3generatesafeeof$270.Scenario4excludesthosevehiclesthatemitbelow400gCO2/mileandhaveanannualincomelessthan$75,000,thusdecreasingaveragefeesforthisscenario.Forthosepurchasingcarsat500gCO2/mile,thefeedropstoabout$200.SinceScenario3exemptshouseholdssolelyonincome,ittherebyexemptsmanyhighCO2vehiclesboughtbythosehouseholds.
Y1#=#0.1172x#+#100#
Y2#=#0.1386x#+#100#
$0#
$50#
$100#
$150#
$200#
$250#
0# 100# 200# 300# 400# 500# 600# 700# 800# 900# 1000#
Vehicle#Fee#
g#CO2/mile#
Scenario#1:#All#Pay# Scenario#2:#CO2#>#250#g#CO2/mile#

22
Figure14.EmissionscomparisonforScenarios3and4,basedonannualhouseholdincomeAnalternativetoexemptinghouseholdsbasedonincomeisonebasedonvehicleMSRP.Thefinaltwoscenarios,Scenarios5and6(Figure15)useavehiclefeeexclusioniftheMSRPislessthan$27,000,representing55%ofthevehiclesintheCHTS.Scenario5onlylooksatprice,anditisevidentthatthisallowshigh-emittingvehiclestoavoidpayingafee.Therefore,arestrictioncanbeaddedtoalsoexemptvehiclesemittinglessthan400gCO2/milefrompayingafee,asdemonstratedinScenario6.Whenallvehiclescostingbelow$27,000areexempt,thehighestfeeonremainingvehiclesrisesto$583.Withanexemptionlimitatthe400gCO2/mile,themaximumfeedropsto$519.
Y3#=#0.3377x#+#100#
Y4#=#0.1978x#+#100#
$0#
$50#
$100#
$150#
$200#
$250#
$300#
$350#
$400#
$450#
0# 100# 200# 300# 400# 500# 600# 700# 800# 900# 1000#
Vehicle#Fee##
g#CO2/mile#
Scenario#3:#Income#>#$75k# Scenario#4:#CO2#>#400#g#CO2/mile#and#Income#>#$75k#

23
Figure15.EmissionscomparisonforScenarios5and6,basedonvehicleMSRPTable1showsasummaryofallsixscenarios,outliningtheaverageandtopvehiclefeesandashortdescriptionofstrengthsandweaknessesofeachapproach.Ofcourse,manymorecasesandscenarioscouldbecreated,buttheseprovidearoughideaofhowsomedifferent,andpotentiallyimportant,approachescompare.SummaryofFindingsandPolicyImplicationsTheforegoingalternativefeestructureanalysisforraising$200milliontopayfortheCVRPyieldsanumberofinsightsintermsoffeerequirements,impactsacrosshouseholds,andforpolicymakinginthisarea.Theseinclude:• Toraise$200millionwithavehiclefeesystem,theaveragefeewouldbealowpercentage
ofaveragevehiclepricesin2016(e.g.around$140outof$30,000+averagevehicleprice,lessthan0.5%).Italsoisnotasignificantshareofincomeformosthouseholdsthatbuyanewcar.
• ItshouldbepossibletocontinueincentivizingZEVandTZEVpurchasesundertheCVRPprogramwitharelativelysmall($140)averagefeeonnon-eligiblevehicles.
• ByfocusingthefeeonvehicleCO2emissions,thiscansendasignaltobuyersofthosevehiclesregardingtheCO2impactsoftheirpurchases.However,varyingfeestructuresbyhouseholdincomeorvehicleMSRPcanhaveasignificantimpactonthedistributionoffeesacrosshouseholdincomelevels.
Y5#=#0.5224x#+#100#
Y6#=#0.4533x#+#100#
$0#
$100#
$200#
$300#
$400#
$500#
$600#
$700#
0# 100# 200# 300# 400# 500# 600# 700# 800# 900# 1000#
Vehicle#Fee##
g#CO2/mile#
Scenario#5:#Vehicles#MSRP#<#$27,000#
Scenario#6:#Vehicles#MSRP#<#$27,000#and#CO2#<#400#g/mile#

24
• Excludingvehiclesemittingunder250gCO2/milehasasmallimpactontheaveragefeesforvehiclesemittingabove250gCO2/mile,butmaybeanimportantelementtoofferconsumerssomezerofeeoptionsandhighlightwhichmodelsachievethis.
• Feestructuresmaycreatepricedifferentialsforthesamemodelvehicle,dependingontheengineconfiguration(gasolineorPHEV).Thiswasnotexploredinthisstudy.
• Forthoselowerincomehouseholdsbuyinganewcar,alargeshareoftheirincomeappearstobeneededforthis(neglectingfinancingoptionstospreadoutcostsovertime).Suchhouseholdsmaybequitesensitivetoincentiveschemesforpurchasingcleanervehicles.
• Anyincentivesorfeesystemsshouldincludethisinformationaspartofthecarwindowstickersoitisobviousattimeofsale.
• Inthefuture,therewillbelessnon-ZEV/TZEVvehiclessold,asZEV/TZEVsalesincrease,sothefeelevelspernon-ZEV/TZEVwillneedtoincrease(apartfromincreasingasthetotalnumbersofincentivizedvehiclesincreases).
• Asvehicletechnologiesadvance,fueleconomywillincreaseandCO2emissionswilldecrease.ThiswouldimpacttheCO2thresholdsindicatedinthisstudy.FeesthatautomaticallyadjustwiththeaverageCO2levelsofnewcarswillhelpmaintainrevenuestreams.
• Whenexcludingbyincome,asinScenario3,33%ofnewcarswithaverageMSRPof$25,500andaverageemissionsof367gCO2/mileareexemptfrompayingafee.
• ExcludinglessthanaverageMSRP,likeScenario5,allowsthehigherincomehouseholds,whichmakesup63%ofthisgroup(oraboutone-thirdofallnewcarbuyers),tobeexemptfrompayingafee,butreducespolicycomplicationsandmaybebettercorrelatedwithpurchasingpower.
• Assessingfeesonvehiclesemittingover400gCO2/milemaybeanimportantmessage,butmayaddadditionalburdenonhouseholdswhorequirebiggervehicles.Thisresearchdidnottakeintoaccountfamilysize.
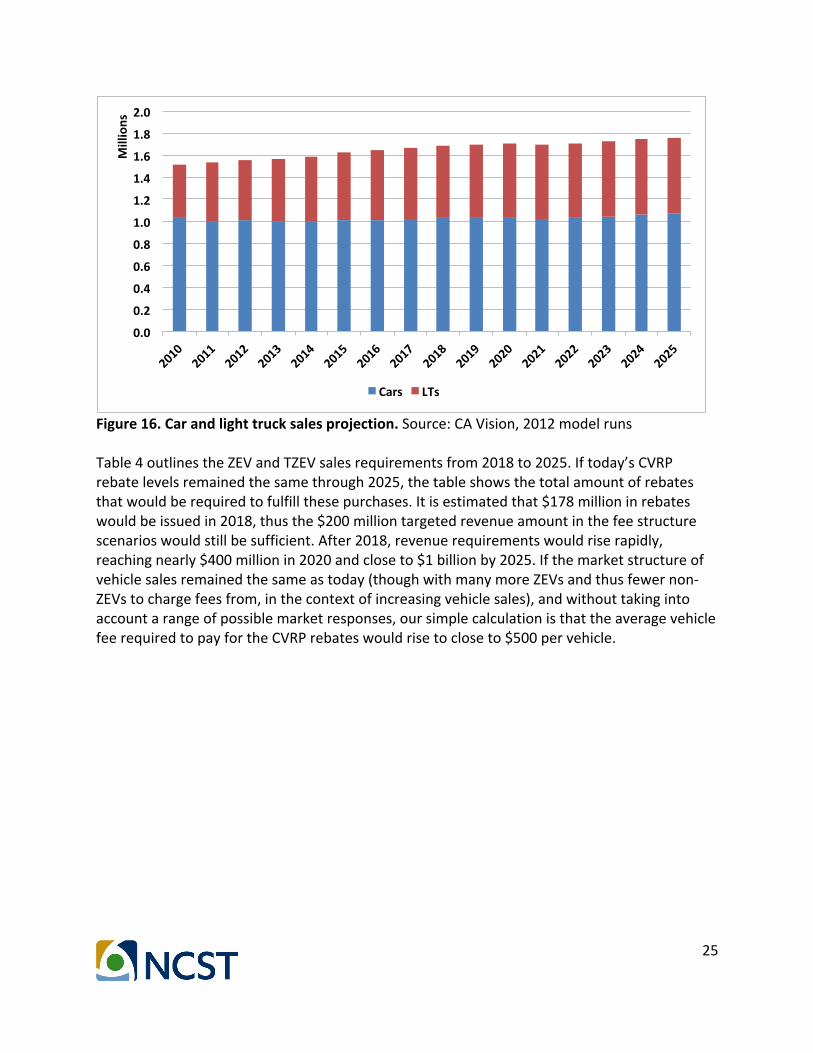
• Acombinationofsomescenariosmaybebetterthantheindividual6presented.Lookingtoward2025Althoughadetailedanalysisoffuturemarketevolution,incentiveexpendituresonZEVsandTZEVs,relatedrevenueneedsandpossiblefeestructuresarebeyondthescopeofthisreport,afewsimpleprojectionsandcalculationsareprovidedhere.Additionalresearchinthisarearepresentsanimportantpotentialfollow-upstudy.UsingARB’spreviousprojectionfromtheCaliforniaVision2012,basedonEMFAC(ARB’sEmissionsFactorsformobilesourcesdatabase),LDVsalesareprojectedtoincreasefromabout1.6millionin2015tonearly1.8millionin2025,anoverallincreaseof8%(comprisedofabouta7%increaseincarsalesand12%inlighttrucksales),asseeninFigure16.
25
Figure16.Carandlighttrucksalesprojection.Source:CAVision,2012modelrunsTable4outlinestheZEVandTZEVsalesrequirementsfrom2018to2025.Iftoday’sCVRPrebatelevelsremainedthesamethrough2025,thetableshowsthetotalamountofrebatesthatwouldberequiredtofulfillthesepurchases.Itisestimatedthat$178millioninrebateswouldbeissuedin2018,thusthe$200milliontargetedrevenueamountinthefeestructurescenarioswouldstillbesufficient.After2018,revenuerequirementswouldriserapidly,reachingnearly$400millionin2020andcloseto$1billionby2025.Ifthemarketstructureofvehiclesalesremainedthesameastoday(thoughwithmanymoreZEVsandthusfewernon-ZEVstochargefeesfrom,inthecontextofincreasingvehiclesales),andwithouttakingintoaccountarangeofpossiblemarketresponses,oursimplecalculationisthattheaveragevehiclefeerequiredtopayfortheCVRPrebateswouldrisetocloseto$500pervehicle.
0.0#
0.2#
0.4#
0.6#
0.8#
1.0#
1.2#
1.4#
1.6#
1.8#
2.0#
2010#
2011#
2012#
2013#
2014#
2015#
2016#
2017#
2018#
2019#
2020#
2021#
2022#
2023#
2024#
2025#
Millions#
Cars# LTs#

26
Table4.ProjectionofCVRPRebatesbasedonProgramtargetsandprojectedvehiclesales
ModelYears ZEVsRequiredProjectedLDV
sales(Vision2.0)(millions)
ZEVRebates(millions)
Averagefeepernon-ZEV
purchasedtopayforrebates
2018 2% 1.58 $79 $512019 4% 1.61 $161 $1042020 6% 1.62 $244 $1602021 8% 1.64 $327 $2172022 10% 1.66 $414 $2782023 12% 1.68 $503 $3412024 14% 1.70 $594 $4072025 15% 1.72 $644 $441
(Note:Totalrebatesbasedon$2,500pervehicleforZEVsthrough2025.)ResearchNextStepsPotentialFutureResearchThisprojecthasundertakenwhatcouldbecalledfirststepsofresearchininvestigatingpossiblefundingsystemsfortheCVRP.Follow-upresearchcouldincludeanumberofactivities,including:
1) CreatingamoredetailedprojectionofCaliforniavehiclesalesto2025byhouseholdtype,incomeand/ordemographiccharacteristics,andlinkingthisprojectiontotheZEVsalesrequirementsalongwithpotentialrequiredfundingforCVRP.ThisshouldalsotakeintoaccountchangingvehicletechnologiesandpotentialreductionsinnewconventionalvehicleCO2levels.Takingintoaccountsuchchangeswillenableabetterforward-lookinganalysisofdifferentfeestructures,inthecontextofrisingprogrambudgetneedsandchangingdemographicsandmarketenvironments.
2) Alsofora2025projection,applyingmarketpurchaseresponsefunctionstochangesinvehicleprices,suchasbyusingtheMA3Tmodel(amarketsimulationmodelcalledMarketAcceptanceofAdvancedAutomotiveTechnologies)oranothermodel.Asfeeandrebatelevelspervehiclerise,thelikelihoodofasignificantconsumerresponsewouldalsorise,andthusshouldnotbeneglected.Infact,consumerresponsetofeesandrebatescouldstrengthentheZEVprogrambyhelpingincreasedemandforZEVandTZEVsalesanddecreasingfundingrequirements,apotentiallyimportantdynamic.
3) Investigationofotherrevenueraisingconceptsandtheirequityimpacts,suchasin-usefees(e.g.VMTfees)thatcouldberelatedtoelectricv.non-electricdriving.
4) Broadeningthegeographicscopeoftheworktoincludeotherstatesornationallevelanalysis(suchasanationalfeebate).
27
ReferencesBrand,Christian,JillianAnable,andMartinoTran."Acceleratingthetransformationtoalowcarbonpassengertransportsystem:Theroleofcarpurchasetaxes,feebates,roadtaxesandscrappageincentivesintheUK."TransportationResearchPartA:PolicyandPractice49(2013):132-148.Bunch,DavidS.,andDavidL.Greene.Potentialdesign,implementation,andbenefitsofafeebateprogramfornewpassengervehiclesinCalifornia:interimstatementofresearchfindings.InstituteofTransportationStudies,UniversityofCalifornia,Davis,2010.CaliforniaAirResourcesBoard(ARB-1).July10,2014.Zero-emissionvehiclestandardsfor2009through2017modelyearpassengercars,light-dutytrucks,andmedium-dutyvehicles.www.arb.ca.gov/msprog/zevprog/zevregs/1962.1_Clean.pdf.AccessedMarch29,2016.CaliforniaAirResourcesBoard(ARB-2).July10,2014.Zero-emissionvehiclestandardsfor2018andsubsequentmodelyearpassengercars,light-dutytrucks,andmedium-dutyvehicles.www.arb.ca.gov/msprog/zevprog/zevregs/1962.2_clean.pdf.AccessedSeptember6,2015.CaliforniaAirResourcesBoard(ARB).June25,2015.Proposedfiscalyear2015-2016fundingplanforlowcarbontransportationinvestmentsandtheairqualityimprovementprogram.www.arb.ca.gov/msprog/aqip/fundplan/proposed_fy15-16_funding_plan.pdf.AccessedNovember1,2015.CaliforniaCleanVehicleRebateProject(CaliforniaCVRP-1).2015.EligibleVehicleRebates.https://cleanvehiclerebate.org/eng/eligible-vehicles.AccessedNovember1,2015.CaliforniaCleanVehicleRebateProject(CaliforniaCVRP-2).2015.EVconsumersurveydashboard.http://energycenter.org/clean-vehicle-rebate-project/survey-dashboard.AccessedNovember1,2015.CaliforniaCleanVehicleRebateProject(CaliforniaCVRP).2016.CVRPRebateStatisticshttps://cleanvehiclerebate.org/eng/rebate-statistics.AccessedApril12,2016.Ciccone,Alice.IsitallaboutCO2emissions?TheenvironmentaleffectsofataxreformfornewvehiclesinNorway.No.19/2014.Memorandum,DepartmentofEconomics,UniversityofOslo,2014.EuropeanCommission.2015.ReducingCO2emissionsfrompassengercars.http://ec.europa.eu/clima/policies/transport/vehicles/cars/index_en.htm.AccessedNovember1,2015.

28
Habibi,Shiva,MurielBeserHugosson,PiaSundbergh,andStaffanAlgers.Evaluationofbonus-malussystemsforreducingcarfleetCO2emissionsinSweden.No.2015:6.CTS-CentreforTransportStudiesStockholm(KTHandVTI),2015.Liu,Changzheng,ElizabethCooke,DavidGreene,andDavidBunch."Feebatesandfueleconomystandards:impactsonfueluseinlight-dutyvehiclesandgreenhousegasemissions."TransportationResearchRecord:JournaloftheTransportationResearchBoard2252(2011):23-30.Rogan,Fionn,EmerDennehy,HannahDaly,MartinHowley,andBrianP.Ó.Gallachóir."Impactsofanemissionbasedprivatecartaxationpolicy–firstyearex-postanalysis."TransportationResearchPartA:PolicyandPractice45,no.7(2011):583-597.