Embed Size (px)
Citation preview
Equity & Debt Strategy
Mid Dec’2016 - Jan’2017

Equity Market Update &
Equity MF Strategy
Confidential | 3
95.84
98.35
101.21101.49
100.77
94.00
96.00
98.00
100.00
102.00
3 MonthsBack
1 MonthBack
2 WeekBack
1 WeekBack
Today
Dollar Index
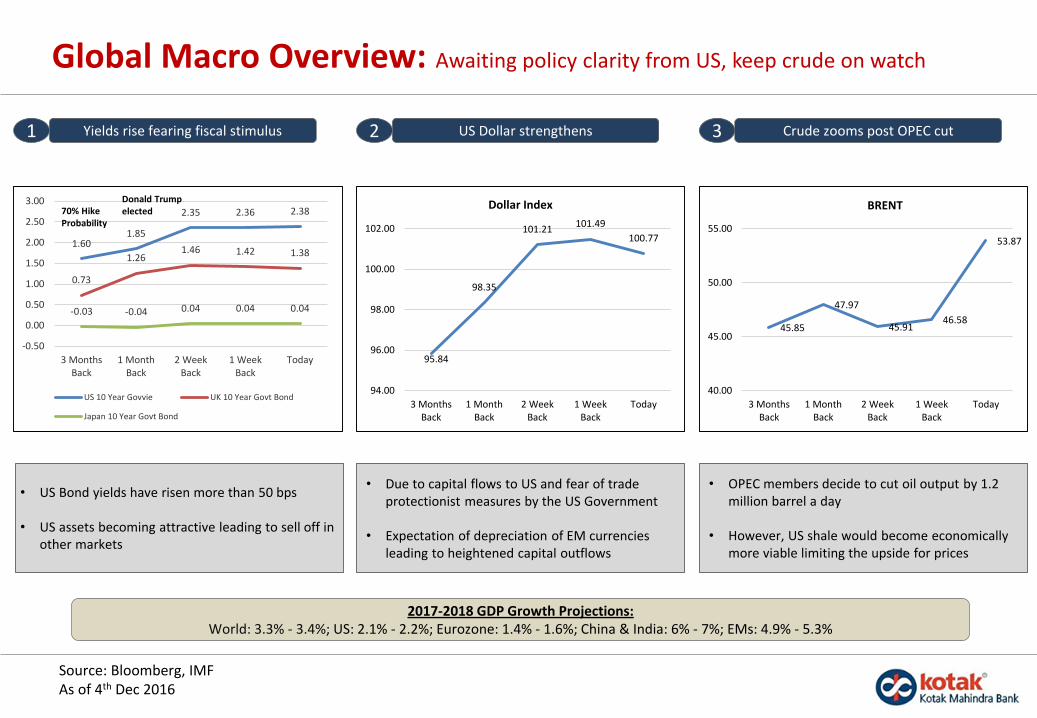
Global Macro Overview: Awaiting policy clarity from US, keep crude on watch
• US Bond yields have risen more than 50 bps
• US assets becoming attractive leading to sell off in other markets
• Due to capital flows to US and fear of trade protectionist measures by the US Government
• Expectation of depreciation of EM currencies leading to heightened capital outflows
Yields rise fearing fiscal stimulus1
%
US Dollar strengthens 2 Crude zooms post OPEC cut3
• OPEC members decide to cut oil output by 1.2 million barrel a day
• However, US shale would become economically more viable limiting the upside for prices
Source: Bloomberg, IMFAs of 4th Dec 2016
2017-2018 GDP Growth Projections:World: 3.3% - 3.4%; US: 2.1% - 2.2%; Eurozone: 1.4% - 1.6%; China & India: 6% - 7%; EMs: 4.9% - 5.3%
1.601.85
2.35 2.36 2.38
0.73
1.261.46 1.42 1.38
-0.03 -0.04 0.04 0.04 0.04
-0.50
0.00
0.50
1.00
1.50
2.00
2.50
3.00
3 MonthsBack
1 MonthBack
2 WeekBack
1 WeekBack
Today
US 10 Year Govvie UK 10 Year Govt Bond
Japan 10 Year Govt Bond
70% Hike Probability
Donald Trump elected
45.85
47.97
45.9146.58
53.87
40.00
45.00
50.00
55.00
3 MonthsBack
1 MonthBack
2 WeekBack
1 WeekBack
Today
BRENT
Confidential | 4
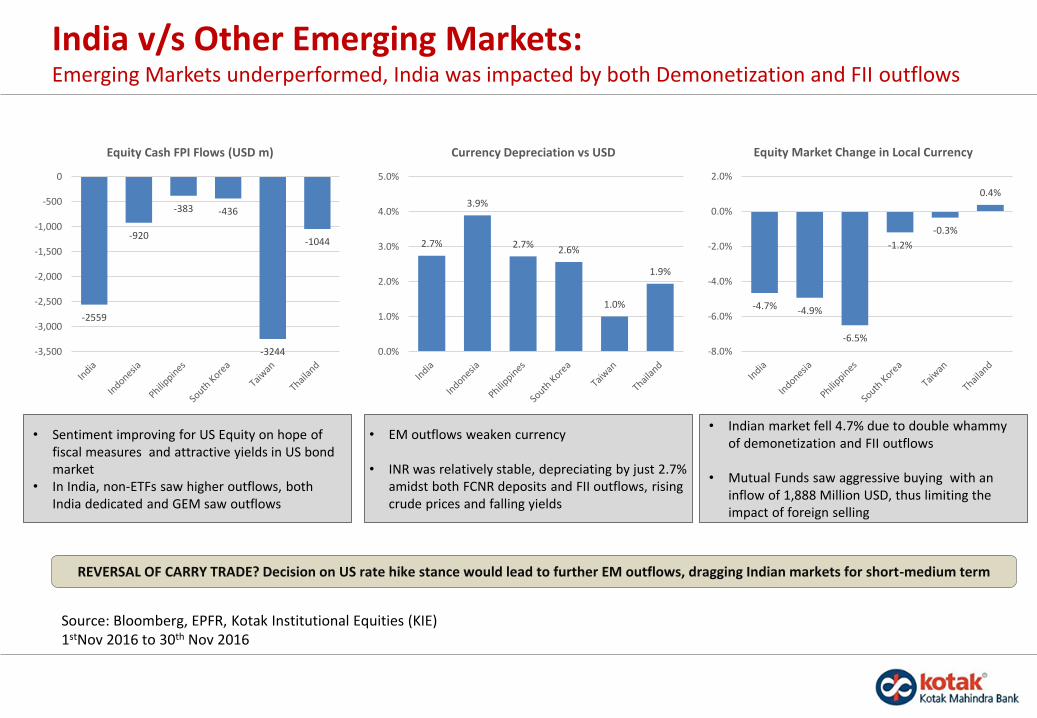
India v/s Other Emerging Markets:Emerging Markets underperformed, India was impacted by both Demonetization and FII outflows
2.7%
3.9%
2.7%2.6%
1.0%
1.9%
0.0%
1.0%
2.0%
3.0%
4.0%
5.0%
Currency Depreciation vs USD
• EM outflows weaken currency
• INR was relatively stable, depreciating by just 2.7% amidst both FCNR deposits and FII outflows, rising crude prices and falling yields
-2559
-920
-383 -436
-3244
-1044
-3,500
-3,000
-2,500
-2,000
-1,500
-1,000
-500
0
Equity Cash FPI Flows (USD m)
• Sentiment improving for US Equity on hope of fiscal measures and attractive yields in US bond market
• In India, non-ETFs saw higher outflows, both India dedicated and GEM saw outflows
-4.7% -4.9%
-6.5%
-1.2%
-0.3%
0.4%
-8.0%
-6.0%
-4.0%
-2.0%
0.0%
2.0%
Equity Market Change in Local Currency
• Indian market fell 4.7% due to double whammy of demonetization and FII outflows
• Mutual Funds saw aggressive buying with an inflow of 1,888 Million USD, thus limiting the impact of foreign selling
Source: Bloomberg, EPFR, Kotak Institutional Equities (KIE)1stNov 2016 to 30th Nov 2016
REVERSAL OF CARRY TRADE? Decision on US rate hike stance would lead to further EM outflows, dragging Indian markets for short-medium term
Confidential | 5
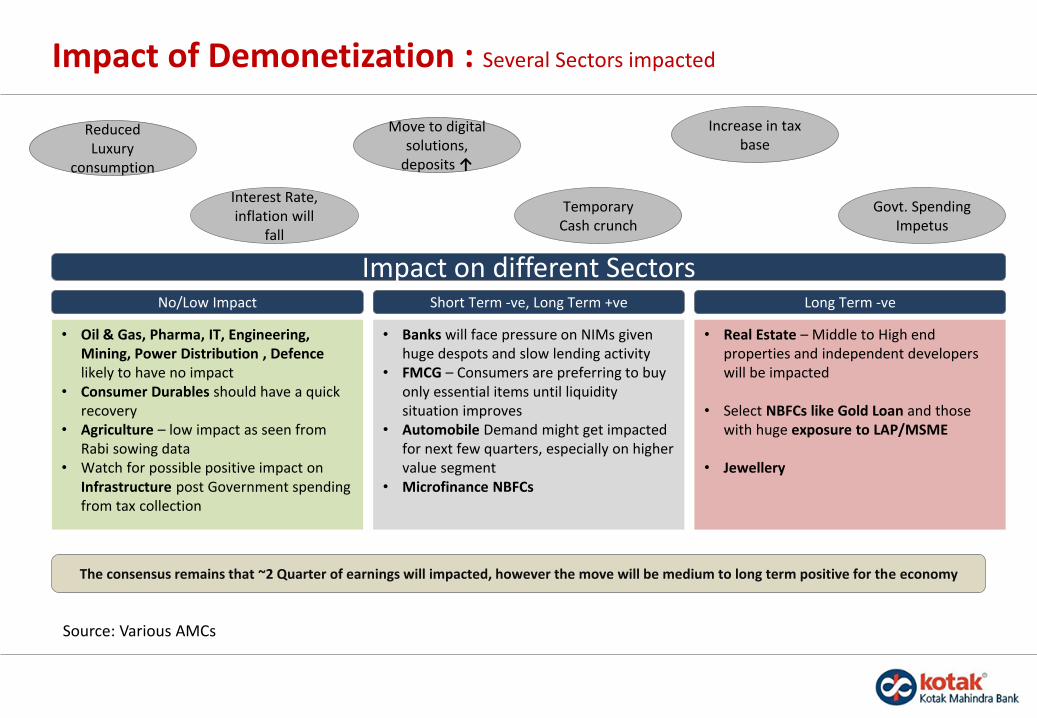
Impact of Demonetization : Several Sectors impacted
No/Low Impact
• Oil & Gas, Pharma, IT, Engineering, Mining, Power Distribution , Defencelikely to have no impact
• Consumer Durables should have a quick recovery
• Agriculture – low impact as seen from Rabi sowing data
• Watch for possible positive impact on Infrastructure post Government spending from tax collection
The consensus remains that ~2 Quarter of earnings will impacted, however the move will be medium to long term positive for the economy
Reduced Luxury
consumption
Interest Rate, inflation will
fall
Move to digital solutions,
deposits ↑
Temporary Cash crunch
Impact on different Sectors
Increase in tax base
Govt. Spending Impetus
Short Term -ve, Long Term +ve
• Banks will face pressure on NIMs given huge despots and slow lending activity
• FMCG – Consumers are preferring to buy only essential items until liquidity situation improves
• Automobile Demand might get impacted for next few quarters, especially on higher value segment
• Microfinance NBFCs
Long Term -ve
• Real Estate – Middle to High end properties and independent developers will be impacted
• Select NBFCs like Gold Loan and those with huge exposure to LAP/MSME
• Jewellery
Source: Various AMCs
Confidential | 6
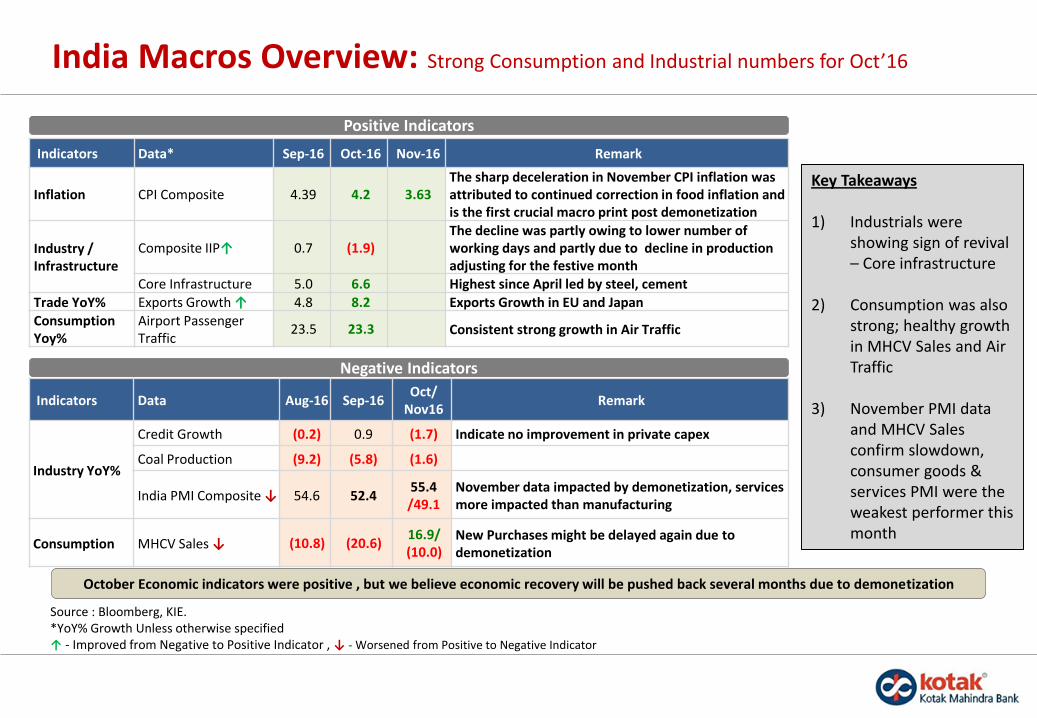
Indicators Data Aug-16 Sep-16Oct/
Nov16Remark
Industry YoY%
Credit Growth (0.2) 0.9 (1.7) Indicate no improvement in private capex
Coal Production (9.2) (5.8) (1.6)
India PMI Composite ↓ 54.6 52.455.4/49.1
November data impacted by demonetization, services more impacted than manufacturing
Consumption MHCV Sales ↓ (10.8) (20.6)16.9/(10.0)
New Purchases might be delayed again due to demonetization
Indicators Data* Sep-16 Oct-16 Nov-16 Remark
Inflation CPI Composite 4.39 4.2 3.63The sharp deceleration in November CPI inflation was attributed to continued correction in food inflation and is the first crucial macro print post demonetization
Industry / Infrastructure
Composite IIP↑ 0.7 (1.9)The decline was partly owing to lower number of working days and partly due to decline in production adjusting for the festive month
Core Infrastructure 5.0 6.6 Highest since April led by steel, cementTrade YoY% Exports Growth ↑ 4.8 8.2 Exports Growth in EU and Japan Consumption Yoy%
Airport Passenger Traffic
23.5 23.3 Consistent strong growth in Air Traffic
India Macros Overview: Strong Consumption and Industrial numbers for Oct’16
Source : Bloomberg, KIE. *YoY% Growth Unless otherwise specified↑ - Improved from Negative to Positive Indicator , ↓ - Worsened from Positive to Negative Indicator
Negative Indicators
Positive Indicators
October Economic indicators were positive , but we believe economic recovery will be pushed back several months due to demonetization
Key Takeaways
1) Industrials were showing sign of revival – Core infrastructure
2) Consumption was also strong; healthy growth in MHCV Sales and Air Traffic
3) November PMI data and MHCV Sales confirm slowdown, consumer goods & services PMI were the weakest performer this month
Confidential | 7
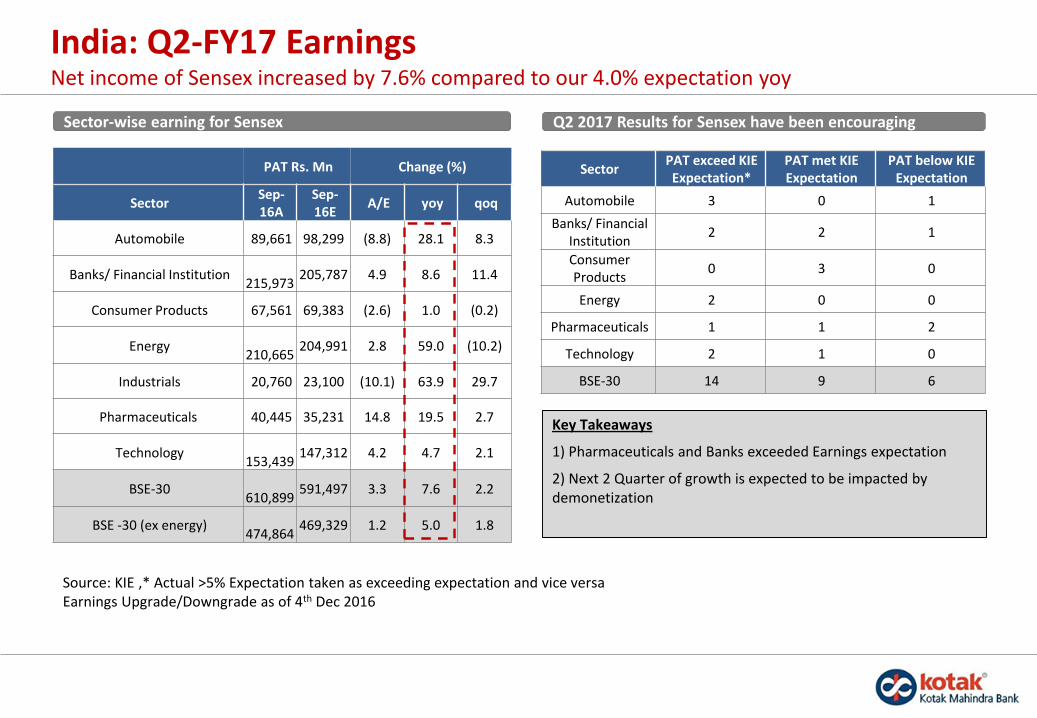
India: Q2-FY17 Earnings Net income of Sensex increased by 7.6% compared to our 4.0% expectation yoy
Key Takeaways
1) Pharmaceuticals and Banks exceeded Earnings expectation
2) Next 2 Quarter of growth is expected to be impacted by demonetization
Q2 2017 Results for Sensex have been encouraging
PAT Rs. Mn Change (%)
SectorSep-16A
Sep-16E
A/E yoy qoq
Automobile 89,661 98,299 (8.8) 28.1 8.3
Banks/ Financial Institution215,973
205,787 4.9 8.6 11.4
Consumer Products 67,561 69,383 (2.6) 1.0 (0.2)
Energy210,665
204,991 2.8 59.0 (10.2)
Industrials 20,760 23,100 (10.1) 63.9 29.7
Pharmaceuticals 40,445 35,231 14.8 19.5 2.7
Technology153,439
147,312 4.2 4.7 2.1
BSE-30610,899
591,497 3.3 7.6 2.2
BSE -30 (ex energy)474,864
469,329 1.2 5.0 1.8
Sector-wise earning for Sensex
Source: KIE ,* Actual >5% Expectation taken as exceeding expectation and vice versaEarnings Upgrade/Downgrade as of 4th Dec 2016
SectorPAT exceed KIE Expectation*
PAT met KIE Expectation
PAT below KIE Expectation
Automobile 3 0 1
Banks/ Financial Institution
2 2 1
Consumer Products
0 3 0
Energy 2 0 0
Pharmaceuticals 1 1 2
Technology 2 1 0
BSE-30 14 9 6
Confidential | 8
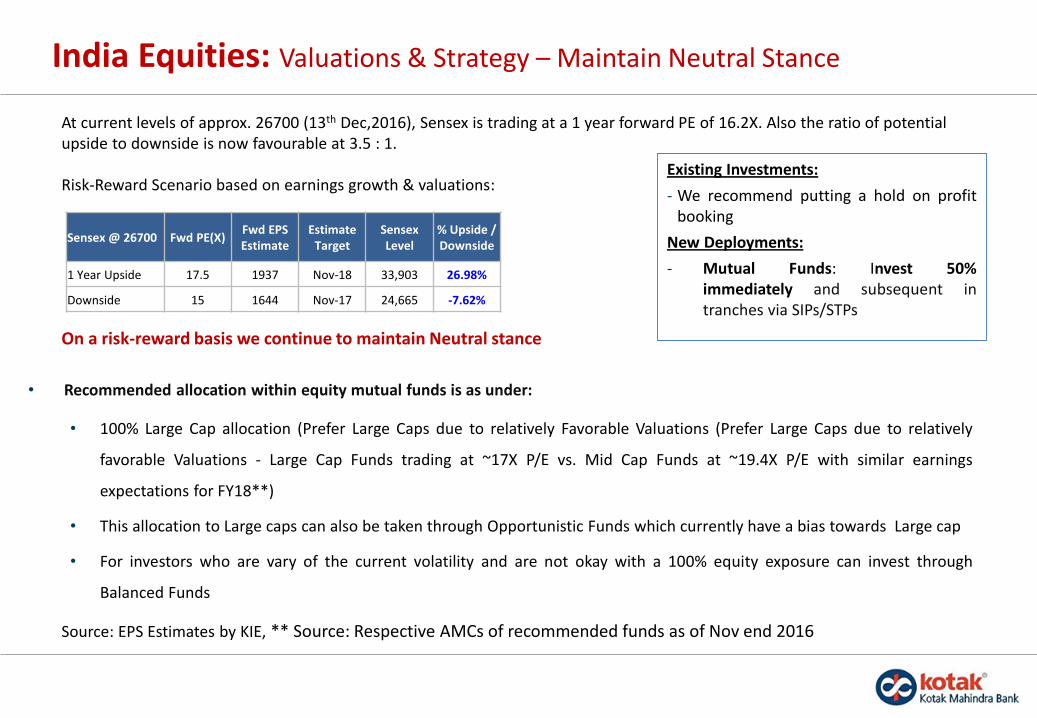
India Equities: Valuations & Strategy – Maintain Neutral Stance
At current levels of approx. 26700 (13th Dec,2016), Sensex is trading at a 1 year forward PE of 16.2X. Also the ratio of potential upside to downside is now favourable at 3.5 : 1.
Risk-Reward Scenario based on earnings growth & valuations:Existing Investments:
- We recommend putting a hold on profitbooking
New Deployments:
- Mutual Funds: Invest 50%immediately and subsequent intranches via SIPs/STPs
On a risk-reward basis we continue to maintain Neutral stance
• Recommended allocation within equity mutual funds is as under:
• 100% Large Cap allocation (Prefer Large Caps due to relatively Favorable Valuations (Prefer Large Caps due to relatively
favorable Valuations - Large Cap Funds trading at ~17X P/E vs. Mid Cap Funds at ~19.4X P/E with similar earnings
expectations for FY18**)
• This allocation to Large caps can also be taken through Opportunistic Funds which currently have a bias towards Large cap
• For investors who are vary of the current volatility and are not okay with a 100% equity exposure can invest through
Balanced Funds
Source: EPS Estimates by KIE, ** Source: Respective AMCs of recommended funds as of Nov end 2016
Sensex @ 26700 Fwd PE(X)Fwd EPS Estimate
Estimate Target
Sensex Level
% Upside / Downside
1 Year Upside 17.5 1937 Nov-18 33,903 26.98%
Downside 15 1644 Nov-17 24,665 -7.62%
Confidential | 9
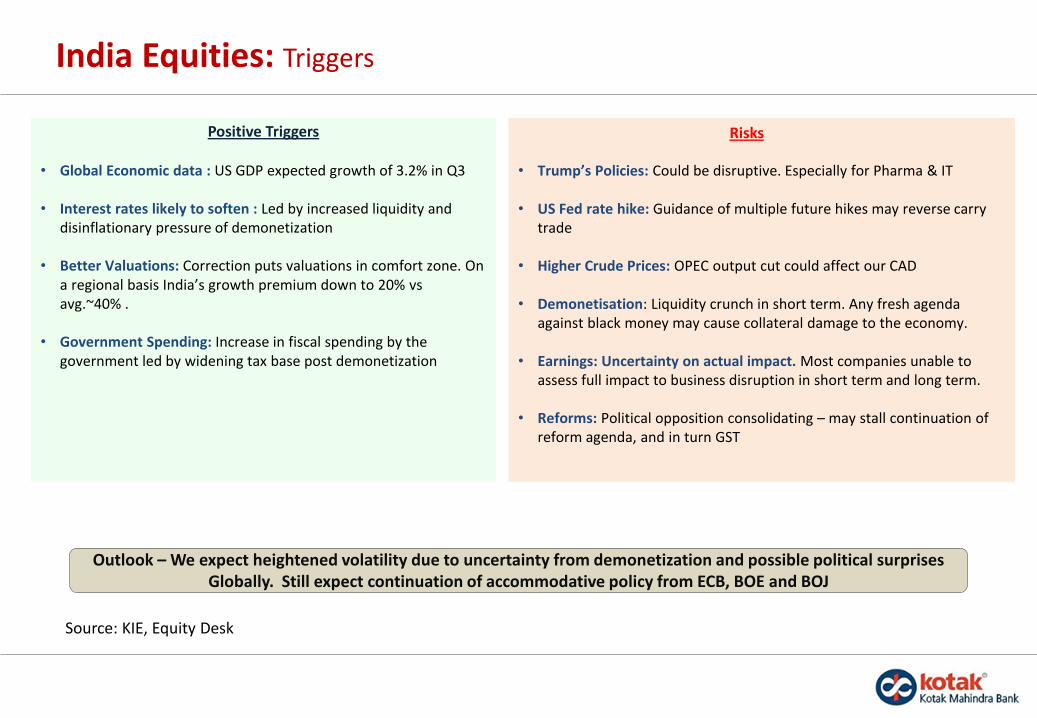
India Equities: Triggers
• Global Economic data : US GDP expected growth of 3.2% in Q3
• Interest rates likely to soften : Led by increased liquidity and disinflationary pressure of demonetization
• Better Valuations: Correction puts valuations in comfort zone. On a regional basis India’s growth premium down to 20% vsavg.~40% .
• Government Spending: Increase in fiscal spending by the government led by widening tax base post demonetization
Positive Triggers
• Trump’s Policies: Could be disruptive. Especially for Pharma & IT
• US Fed rate hike: Guidance of multiple future hikes may reverse carry trade
• Higher Crude Prices: OPEC output cut could affect our CAD
• Demonetisation: Liquidity crunch in short term. Any fresh agenda against black money may cause collateral damage to the economy.
• Earnings: Uncertainty on actual impact. Most companies unable to assess full impact to business disruption in short term and long term.
• Reforms: Political opposition consolidating – may stall continuation of reform agenda, and in turn GST
Risks
Outlook – We expect heightened volatility due to uncertainty from demonetization and possible political surprises Globally. Still expect continuation of accommodative policy from ECB, BOE and BOJ
Source: KIE, Equity Desk
Debt Market Update &
Debt MF Strategy
Confidential | 11Source : Bloomberg, KIE
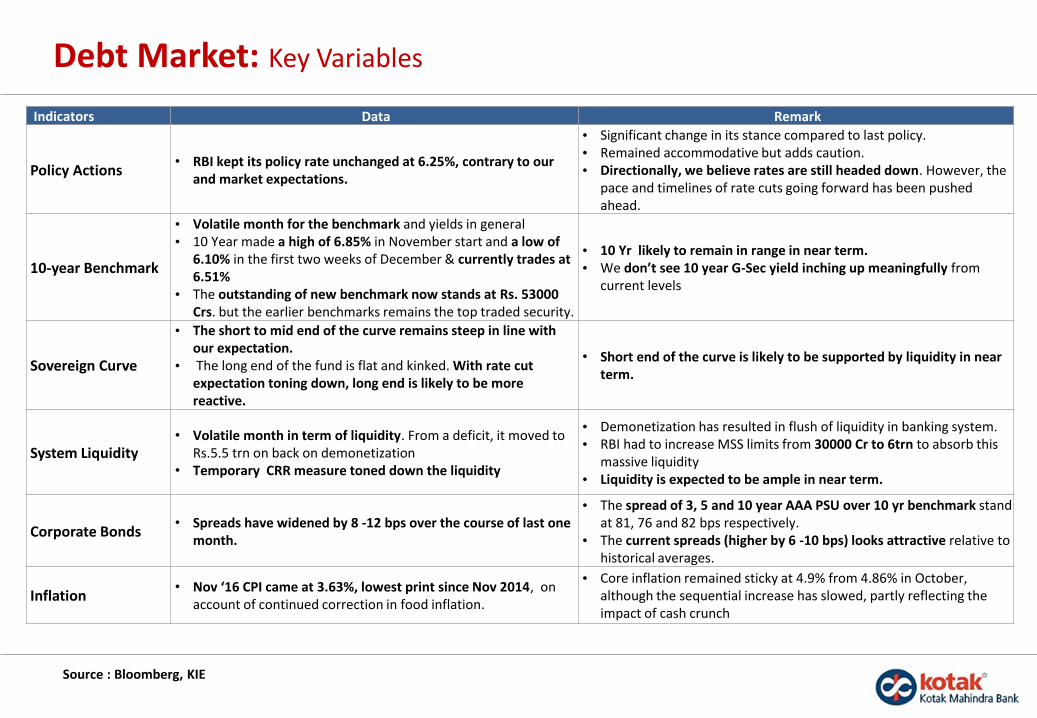
Debt Market: Key Variables
Indicators Data Remark
Policy Actions• RBI kept its policy rate unchanged at 6.25%, contrary to our
and market expectations.
• Significant change in its stance compared to last policy.• Remained accommodative but adds caution.• Directionally, we believe rates are still headed down. However, the
pace and timelines of rate cuts going forward has been pushed ahead.
10-year Benchmark
• Volatile month for the benchmark and yields in general• 10 Year made a high of 6.85% in November start and a low of
6.10% in the first two weeks of December & currently trades at 6.51%
• The outstanding of new benchmark now stands at Rs. 53000 Crs. but the earlier benchmarks remains the top traded security.
• 10 Yr likely to remain in range in near term.• We don’t see 10 year G-Sec yield inching up meaningfully from
current levels
Sovereign Curve
• The short to mid end of the curve remains steep in line with our expectation.
• The long end of the fund is flat and kinked. With rate cut expectation toning down, long end is likely to be more reactive.
• Short end of the curve is likely to be supported by liquidity in near term.
System Liquidity• Volatile month in term of liquidity. From a deficit, it moved to
Rs.5.5 trn on back on demonetization• Temporary CRR measure toned down the liquidity
• Demonetization has resulted in flush of liquidity in banking system.• RBI had to increase MSS limits from 30000 Cr to 6trn to absorb this
massive liquidity• Liquidity is expected to be ample in near term.
Corporate Bonds• Spreads have widened by 8 -12 bps over the course of last one
month.
• The spread of 3, 5 and 10 year AAA PSU over 10 yr benchmark stand at 81, 76 and 82 bps respectively.
• The current spreads (higher by 6 -10 bps) looks attractive relative to historical averages.
Inflation• Nov ‘16 CPI came at 3.63%, lowest print since Nov 2014, on
account of continued correction in food inflation.
• Core inflation remained sticky at 4.9% from 4.86% in October, although the sequential increase has slowed, partly reflecting the impact of cash crunch

Confidential | 12
• The curve has shifted up to the tune of 20-25 bps across the curve post RBI Policy
• The short to mid end of the curve remains steep in line with our expectation.
• The long end of the curve is flat and kinked. With rate cut expectation toning down, long end is likely to be more reactive.
• Short end of the curve is likely to be supported by liquidity in near term.
Sovereign Yield Curve
7.778
7.487
7.056
6.668
6.187 6.2156.399
66.26.46.66.8
77.27.47.67.8
8
1 YearBack
6 MonthsBack
3 MonthsBack
1 MonthBack
2 WeekBack
1 WeekBack
Today
42347 42530 42620 42683 42698 42705 42712
10 Year Gsec
Source : Bloomberg
Confidential | 13
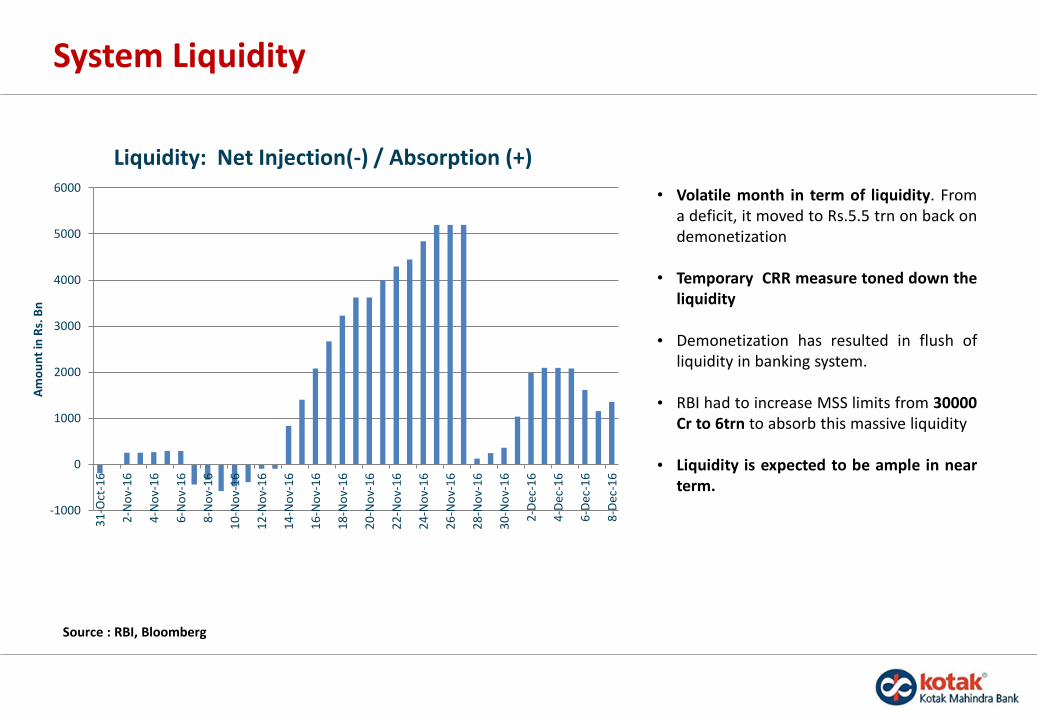
System Liquidity
-1000
0
1000
2000
3000
4000
5000
6000
31
-Oct
-16
2-N
ov-
16
4-N
ov-
16
6-N
ov-
16
8-N
ov-
16
10
-No
v-1
6
12
-No
v-1
6
14
-No
v-1
6
16
-No
v-1
6
18
-No
v-1
6
20
-No
v-1
6
22
-No
v-1
6
24
-No
v-1
6
26
-No
v-1
6
28
-No
v-1
6
30
-No
v-1
6
2-D
ec-1
6
4-D
ec-1
6
6-D
ec-1
6
8-D
ec-1
6
Am
ou
nt
in R
s. B
n
Liquidity: Net Injection(-) / Absorption (+)
• Volatile month in term of liquidity. Froma deficit, it moved to Rs.5.5 trn on back ondemonetization
• Temporary CRR measure toned down theliquidity
• Demonetization has resulted in flush ofliquidity in banking system.
• RBI had to increase MSS limits from 30000Cr to 6trn to absorb this massive liquidity
• Liquidity is expected to be ample in nearterm.
Source : RBI, Bloomberg
Confidential | 14
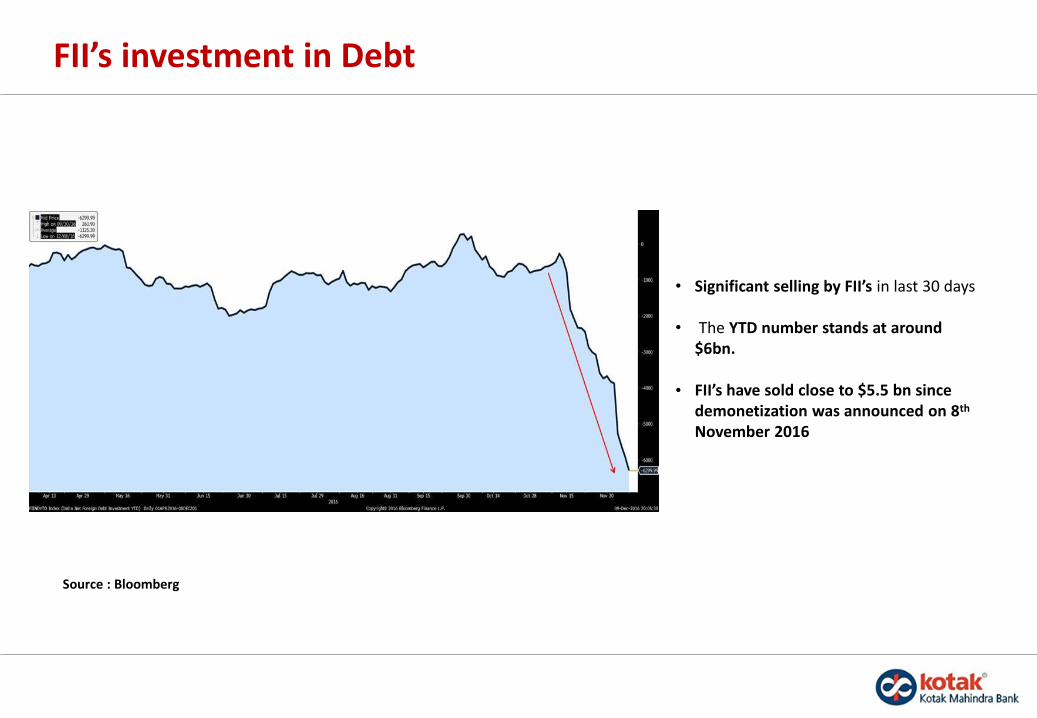
FII’s investment in Debt
• Significant selling by FII’s in last 30 days
• The YTD number stands at around $6bn.
• FII’s have sold close to $5.5 bn since demonetization was announced on 8th
November 2016
Source : Bloomberg
Confidential | 15
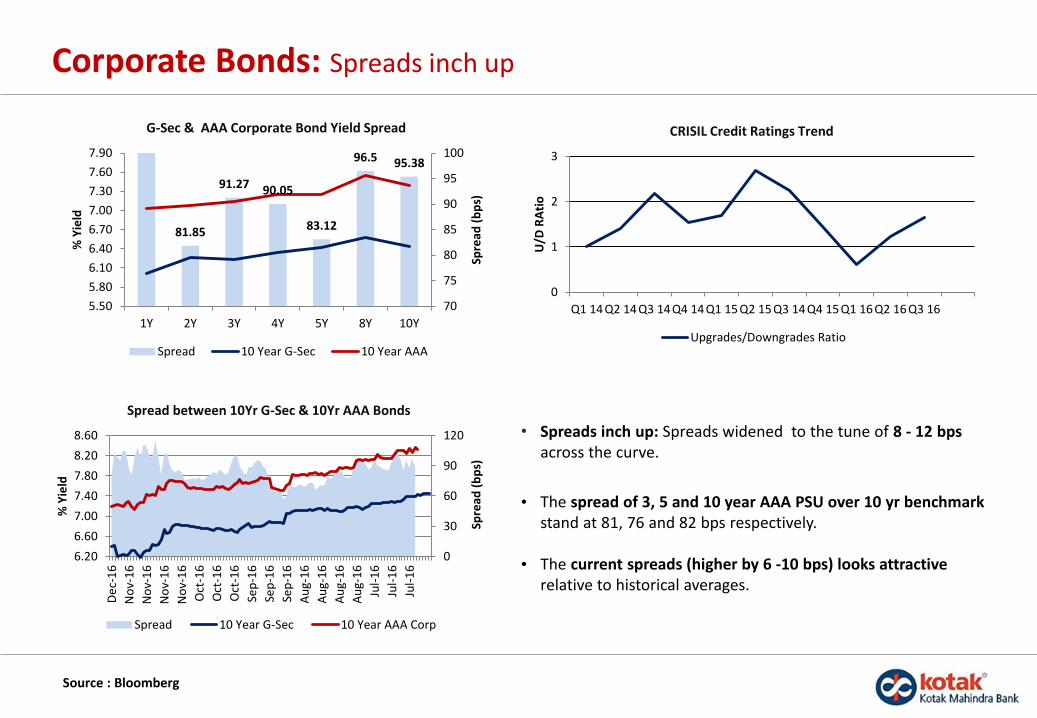
Corporate Bonds: Spreads inch up
• Spreads inch up: Spreads widened to the tune of 8 - 12 bps across the curve.
• The spread of 3, 5 and 10 year AAA PSU over 10 yr benchmark stand at 81, 76 and 82 bps respectively.
• The current spreads (higher by 6 -10 bps) looks attractive relative to historical averages.
0
30
60
90
120
6.20
6.60
7.00
7.40
7.80
8.20
8.60
De
c-1
6
No
v-1
6
No
v-1
6
No
v-1
6
No
v-1
6
Oct
-16
Oct
-16
Oct
-16
Sep
-16
Sep
-16
Sep
-16
Au
g-1
6
Au
g-1
6
Au
g-1
6
Au
g-1
6
Jul-
16
Jul-
16
Jul-
16
Spre
ad (
bp
s)
% Y
ield
Spread between 10Yr G-Sec & 10Yr AAA Bonds
Spread 10 Year G-Sec 10 Year AAA Corp
0
1
2
3
Q1 14 Q2 14 Q3 14 Q4 14 Q1 15 Q2 15 Q3 14 Q4 15 Q1 16 Q2 16 Q3 16
U/D
RA
tio
CRISIL Credit Ratings Trend
Upgrades/Downgrades Ratio
81.85
91.27 90.05
83.12
96.5 95.38
70
75
80
85
90
95
100
5.50
5.80
6.10
6.40
6.70
7.00
7.30
7.60
7.90
1Y 2Y 3Y 4Y 5Y 8Y 10Y
Spre
ad (
bp
s)
% Y
ield
G-Sec & AAA Corporate Bond Yield Spread
Spread 10 Year G-Sec 10 Year AAA
Source : Bloomberg
Confidential | 16
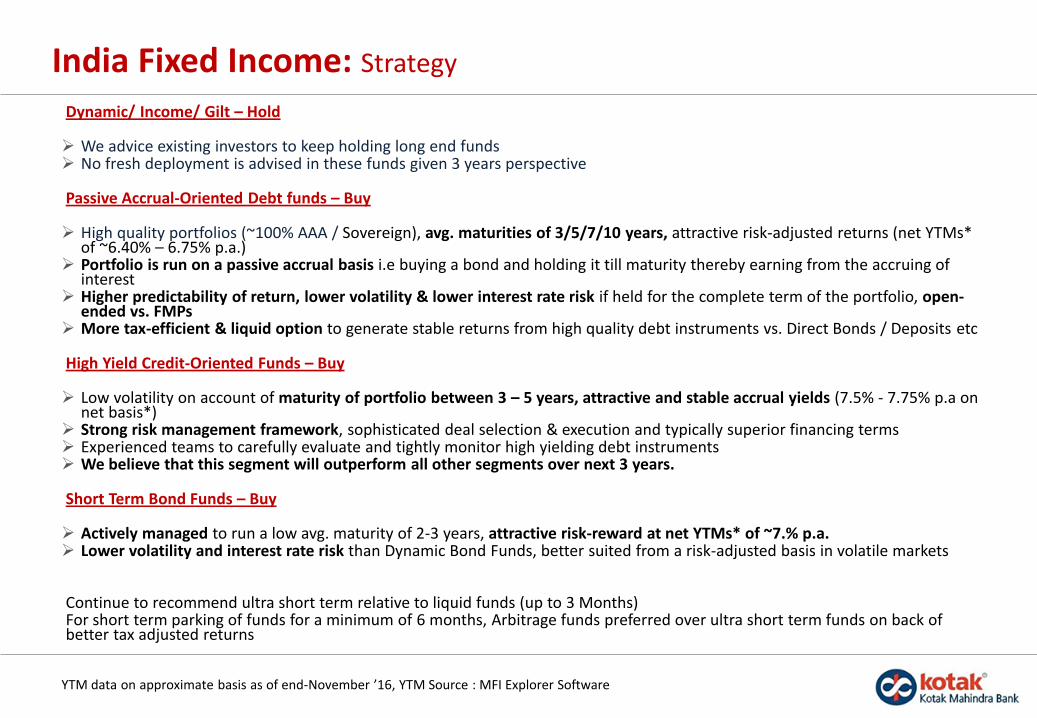
India Fixed Income: Strategy
Dynamic/ Income/ Gilt – Hold
We advice existing investors to keep holding long end funds No fresh deployment is advised in these funds given 3 years perspective
Passive Accrual-Oriented Debt funds – Buy
High quality portfolios (~100% AAA / Sovereign), avg. maturities of 3/5/7/10 years, attractive risk-adjusted returns (net YTMs* of ~6.40% – 6.75% p.a.)
Portfolio is run on a passive accrual basis i.e buying a bond and holding it till maturity thereby earning from the accruing of interest
Higher predictability of return, lower volatility & lower interest rate risk if held for the complete term of the portfolio, open-ended vs. FMPs
More tax-efficient & liquid option to generate stable returns from high quality debt instruments vs. Direct Bonds / Deposits etc
High Yield Credit-Oriented Funds – Buy
Low volatility on account of maturity of portfolio between 3 – 5 years, attractive and stable accrual yields (7.5% - 7.75% p.a on net basis*)
Strong risk management framework, sophisticated deal selection & execution and typically superior financing terms Experienced teams to carefully evaluate and tightly monitor high yielding debt instruments We believe that this segment will outperform all other segments over next 3 years.
Short Term Bond Funds – Buy
Actively managed to run a low avg. maturity of 2-3 years, attractive risk-reward at net YTMs* of ~7.% p.a. Lower volatility and interest rate risk than Dynamic Bond Funds, better suited from a risk-adjusted basis in volatile markets
Continue to recommend ultra short term relative to liquid funds (up to 3 Months)For short term parking of funds for a minimum of 6 months, Arbitrage funds preferred over ultra short term funds on back of better tax adjusted returns
YTM data on approximate basis as of end-November ’16, YTM Source : MFI Explorer Software
Confidential | 17
DisclaimerThe aforesaid is for information purposes only and should not be construed to be investment advice under SEBI (Investment Advisory) Regulations.
In the preparation of the material contained in this document, Kotak Mahindra Bank has used information that is publicly available, including information developed in-house. Some of the material used in the document may have been obtained from members/persons other than the Kotak Mahindra Bank and/or its affiliates and which mayhave been made available to Kotak Mahindra Bank and/or its affiliates. Information gathered & material used in this document is believed to be from reliable sources. KotakMahindra Bank however does not warrant the accuracy, reasonableness and/or completeness of any information. For data reference to any third party in this material nosuch party will assume any liability for the same. Kotak Mahindra Bank and/or any affiliate of Kotak Mahindra Bank does not in any way through this material solicit any offerfor purchase, sale or any financial transaction/commodities/products of any financial instrument dealt in this material. All recipients of this material should before dealingand or transacting in any of the products referred to in this material make their own investigation, seek appropriate professional advice
We have included statements/opinions/recommendations in this document which contain words or phrases such as "will", "expect" "should" and similar expressions orvariations of such expressions, that are "forward looking statements". Actual results may differ materially from those suggested by the forward looking statements due torisks or uncertainties associated with our expectations with respect to, but not limited to, exposure to market risks, general economic and political conditions in India andother countries globally, which have an impact on our services and / or investments, the monetary and interest policies of India, inflation, deflation, unanticipatedturbulence in interest rates, foreign exchange rates, equity prices or other rates or prices, the performance of the financial markets in India and globally, changes indomestic and foreign laws, regulations and taxes and changes in competition in the industry. By their nature, certain market risk disclosures are only estimates and could bematerially different from what actually occurs in the future. As a result, actual future gains or losses could materially differ from those that have been estimated
Kotak Mahindra Bank (including its affiliates) and any of its officers directors, personnel and employees, shall not liable for any loss, damage of any nature, including but notlimited to direct, indirect, punitive, special, exemplary, consequential, as also any loss of profit in any way arising from the use of this material in any manner. The recipientalone shall be fully responsible/ are liable for any decision taken on the basis of this material. The investments discussed in this material may not be suitable for all investors.Any person subscribing to or investing in any product/financial instruments should do so on the basis of and after verifying the terms attached to such product/financialinstrument. Financial products and instruments are subject to market risks and yields may fluctuate depending on various factors affecting capital/debt markets. Please notethat past performance of the financial products and instruments does not necessarily indicate the future prospects and performance thereof. Such past performance mayormay not be sustained in future. Kotak Mahindra Bank (including its affiliates) or its officers, directors, personnel and employees, including persons involved in thepreparation or issuance of this material may; (a) from time to time, have long or short positions in, and buy or sell the securities mentioned herein or (b) be engaged in anyother transaction involving such securities and earn brokerage or other compensation in the financial instruments/products/commodities discussed herein or act as advisoror lender / borrower in respect of such securities/financial instruments/products/commodities or have other potential conflict of interest with respect to anyrecommendation and related information and opinions. The said persons may have acted upon and/or in a manner contradictory with the information contained here. Nopart of this material may be duplicated in whole or in part in any form and or redistributed without the prior written consent of Kotak Mahindra Bank. This material is strictlyconfidential to the recipient and should not be reproduced or disseminated to anyone else
This material is not a research report as per the SEBI (Research Analyst) Regulations, 2014.
Mutual Fund investments are subject to market risks, read all scheme related documents carefully.