Embed Size (px)
DESCRIPTION
Equity and Economic Growth. University of Warsaw, School of Economic science Zoljargal Munkhsaikhan. Introduction. - PowerPoint PPT Presentation
Citation preview

Equity and Economic Equity and Economic GrowthGrowth
University of Warsaw, School University of Warsaw, School of Economic science of Economic science
Zoljargal MunkhsaikhanZoljargal Munkhsaikhan

IntroductionIntroduction
The relationship between equity and The relationship between equity and economic growth has long attracted the economic growth has long attracted the interest of researchers.interest of researchers. Whether inequality Whether inequality helps or harms future economic growth? The helps or harms future economic growth? The issue remains contentious. Past studies find issue remains contentious. Past studies find differing effects when considering rich and differing effects when considering rich and poor countries, regions versus nations and poor countries, regions versus nations and so on.so on.

Economic theories that hypothesize Economic theories that hypothesize that income inequality harms growth that income inequality harms growth can be grouped into three can be grouped into three categoriescategories::

First, the political-economy approachFirst, the political-economy approach hypothesizes that in unequal hypothesizes that in unequal societies redistribute resources from societies redistribute resources from rich to poor . rich to poor . IIncrease in income ncrease in income inequality inhibits economic growth. inequality inhibits economic growth.

Second, income inequality retards Second, income inequality retards growth by encouraging growth by encouraging social conflict social conflict within societies. In this manner, within societies. In this manner, inequality results in more crime and inequality results in more crime and unlawful activities, which threaten unlawful activities, which threaten investment and property rights. investment and property rights.

Third, the imperfect capital marketThird, the imperfect capital market hypothesis suggests that inequality hypothesis suggests that inequality is associated with credit barriers that is associated with credit barriers that reduce the ability of lower classes to reduce the ability of lower classes to invest in physical and human capital. invest in physical and human capital.

Theoretical reviewTheoretical review

• Economic inequality:Economic inequality: comprises all comprises all disparities in the distribution of disparities in the distribution of economic economic assets and income. The and income. The term typically refers to inequality term typically refers to inequality among individuals and groups within among individuals and groups within a society or amona society or amongg countries. countries. Economic Inequality generally refers Economic Inequality generally refers to equality of outcome, and is related to equality of outcome, and is related to the idea of equality of opportunity. to the idea of equality of opportunity.

• Gini Coefficient:Gini Coefficient: Developed by an Italian Developed by an Italian statistician Corrado Gini in the 1910s, Ginistatistician Corrado Gini in the 1910s, Gini
Coefficient is commonly used to indicate Coefficient is commonly used to indicate income inequality in a society. Gini income inequality in a society. Gini Coefficient is a number which has a value Coefficient is a number which has a value between zero and one. As the value of the between zero and one. As the value of the Coefficient rises, the higher the degree of Coefficient rises, the higher the degree of income inequality in a society becomes income inequality in a society becomes

• A Kuznets curve:A Kuznets curve:
Simon Kuznets argued that levels of Simon Kuznets argued that levels of economic inequality are in large part economic inequality are in large part the result of stages of development. the result of stages of development. Kuznets saw a curve-like relationship Kuznets saw a curve-like relationship between level of income and between level of income and inequality, now known as Kuznets inequality, now known as Kuznets curve. curve.
• Economic growth: Economic growth:
Several recent economists have Several recent economists have investigated the relationship between investigated the relationship between inequality and economic growth using inequality and economic growth using econometrics.econometrics.
In their study for the World Institute for In their study for the World Institute for Development Economics ResearchDevelopment Economics Research, , They They conclude that too much equality (below conclude that too much equality (below a Gini coefficient of 0.25) negatively a Gini coefficient of 0.25) negatively impacts growth due to "incentive traps, impacts growth due to "incentive traps, free-riding, labour shirking, and high free-riding, labour shirking, and high supervision costs supervision costs

• Robert Barro wrote a paper arguing Robert Barro wrote a paper arguing that inequality reduces growth in that inequality reduces growth in poor countries and promotes growth poor countries and promotes growth in rich ones. in rich ones.
• A number of other researchers have A number of other researchers have derived conflicting results, some derived conflicting results, some concluding there is a negative effect concluding there is a negative effect of inequality on growthof inequality on growth..

Empirical researchEmpirical research

• The above-mentioned arguments The above-mentioned arguments reflect inequality does not always reflect inequality does not always have negative or positive effect on have negative or positive effect on economic growth directly economic growth directly

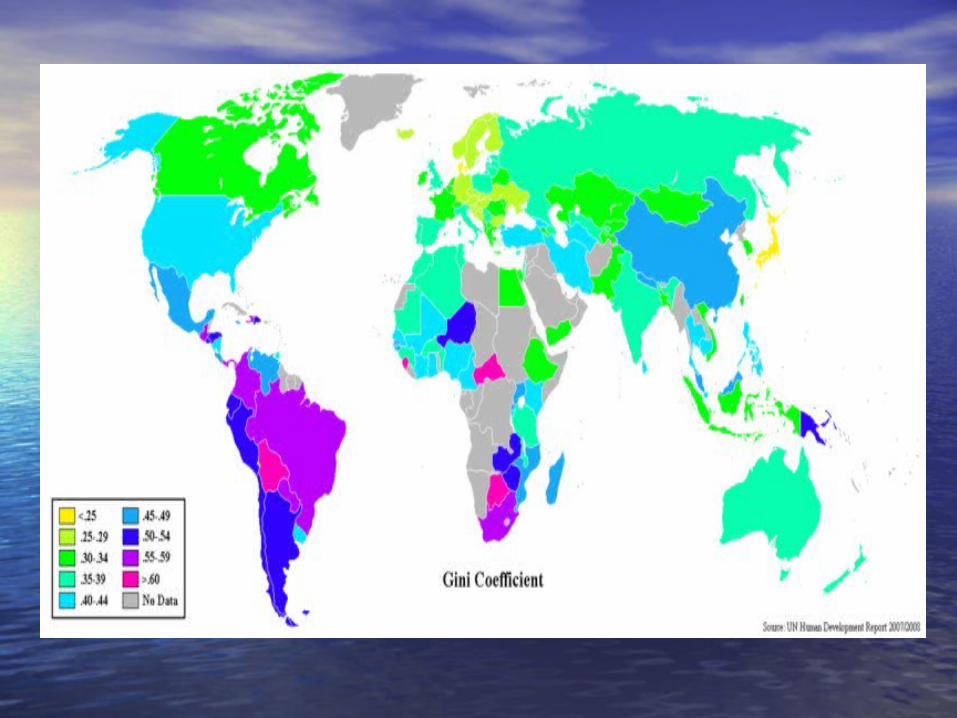
• Gini Coefficient in the worldGini Coefficient in the world
• Gini Coefficient Place Survey year Gini Coefficient Place Survey yearGini Coefficient Place Survey year Gini Coefficient Place Survey year• 0.244 Hungary 1999 0.325 India 1999-20000.244 Hungary 1999 0.325 India 1999-2000• 0.247 Denmark 1997 0.325 Spain 19900.247 Denmark 1997 0.325 Spain 1990• 0.249 Japan 1993 0.326 Netherlands 19940.249 Japan 1993 0.326 Netherlands 1994• 0.250 Belgium 1996 0.327 France 19950.250 Belgium 1996 0.327 France 1995• 0.250 Sweden 2000 0.330 Pakistan 1998-990.250 Sweden 2000 0.330 Pakistan 1998-99• 0.254 Czech Republic 1996 0.331 Canada 19980.254 Czech Republic 1996 0.331 Canada 1998• 0.258 Norway 2000 0.331 Switzerland 19920.258 Norway 2000 0.331 Switzerland 1992• 0.258 Slovak Republic 1996 0.333 Burundi 19980.258 Slovak Republic 1996 0.333 Burundi 1998• 0.262 Bosnia and Herzegovina 2001 0.334 Yemen, Republic 19980.262 Bosnia and Herzegovina 2001 0.334 Yemen, Republic 1998• 0.268 Uzbekistan 2000 0.343 Indonesia 20020.268 Uzbekistan 2000 0.343 Indonesia 2002• 0.269 Finland 2000 0.344 Egypt, Arab Republic 19990.269 Finland 2000 0.344 Egypt, Arab Republic 1999• 0.282 Albania 2002 0.344 Sri Lanka 19950.282 Albania 2002 0.344 Sri Lanka 1995• 0.282 Macedonia, FYR 1998 0.347 Tajikistan 19980.282 Macedonia, FYR 1998 0.347 Tajikistan 1998• 0.283 Germany 2000 0.352 Australia 19940.283 Germany 2000 0.352 Australia 1994• 0.284 Slovenia 1998-99 0.353 Algeria 19950.284 Slovenia 1998-99 0.353 Algeria 1995• 0.289 Rwanda 1983-85 0.354 Greece 19980.289 Rwanda 1983-85 0.354 Greece 1998• 0.290 Croatia 2001 0.355 Israel 19970.290 Croatia 2001 0.355 Israel 1997• 0.290 Kyrgyz Republic 2001 0.359 Ireland 19960.290 Kyrgyz Republic 2001 0.359 Ireland 1996• 0.290 Ukraine 1999 0.360 Italy 20000.290 Ukraine 1999 0.360 Italy 2000• 0.300 Austria 1997 0.360 United Kingdom 19990.300 Austria 1997 0.360 United Kingdom 1999• 0.300 Ethiopia 2000 0.361 Vietnam 19980.300 Ethiopia 2000 0.361 Vietnam 1998• 0.300 Ghana 1999 0.362 Moldova 20010.300 Ghana 1999 0.362 Moldova 2001• 0.303 Romania 2000 0.362 New Zealand 19970.303 Romania 2000 0.362 New Zealand 1997• 0.304 Belarus 2000 0.364 Jordan 19970.304 Belarus 2000 0.364 Jordan 1997• 0.308 Luxembourg 2000 0.365 Azerbaijan 20010.308 Luxembourg 2000 0.365 Azerbaijan 2001• 0.313 Kazakhstan 2001 0.367 Nepal 1995-960.313 Kazakhstan 2001 0.367 Nepal 1995-96• 0.316 South Korea 1998 0.369 Georgia 20010.316 South Korea 1998 0.369 Georgia 2001• 0.316 Poland 1999 0.370 Lao PDR 19970.316 Poland 1999 0.370 Lao PDR 1997• 0.318 Bangladesh 2000 0.372 Estonia 20000.318 Bangladesh 2000 0.372 Estonia 2000• 0.319 Bulgaria 2001 0.379 Armenia 19980.319 Bulgaria 2001 0.379 Armenia 1998• 0.319 Lithuania 2000 0.379 Jamaica 20000.319 Lithuania 2000 0.379 Jamaica 2000 0.324 Latvia 1998 0.380 Gambia 19980.324 Latvia 1998 0.380 Gambia 1998 0.408 United States 2000 0.408 United States 2000
0.425 Singapore 19980.425 Singapore 1998 0.465 China 20040.465 China 2004 0.525 Hong Kong, 20010.525 Hong Kong, 2001
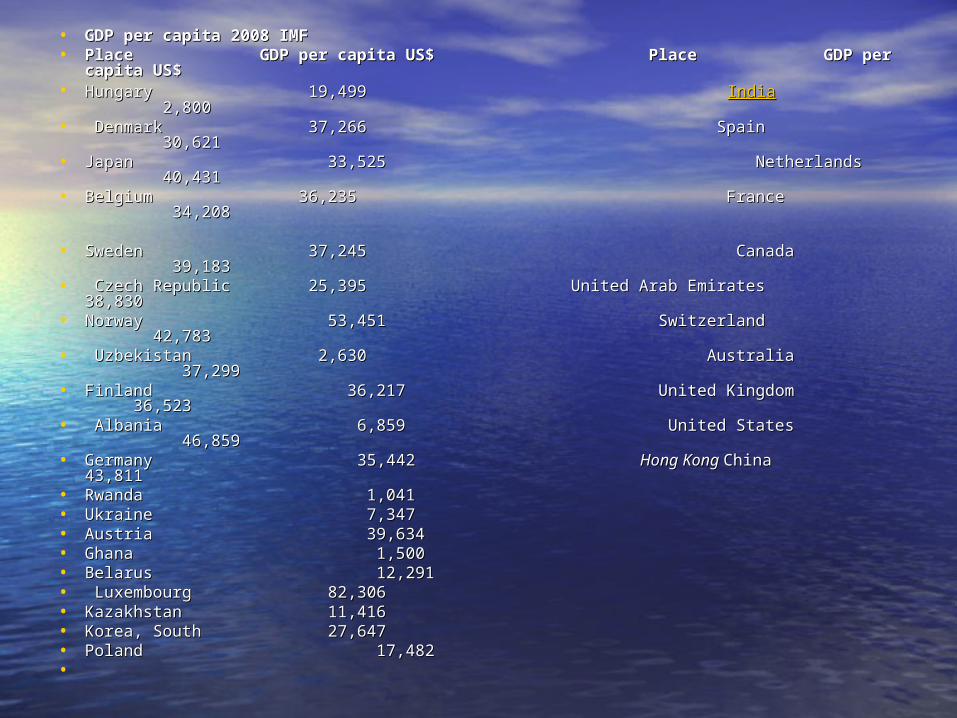
• GDP per capita 2008 IMFGDP per capita 2008 IMF• Place GDP per capita US$ Place GDP per Place GDP per capita US$ Place GDP per
capita US$capita US$• Hungary 19,499 Hungary 19,499 IndiaIndia 2,8002,800• Denmark 37,266 Spain 30,621Denmark 37,266 Spain 30,621• Japan 33,525 Netherlands 40,431 Japan 33,525 Netherlands 40,431 • Belgium 36,235 France 34,208Belgium 36,235 France 34,208 • Sweden 37,245 Canada 39,183Sweden 37,245 Canada 39,183• Czech Republic 25,395 United Arab Emirates 38,830 Czech Republic 25,395 United Arab Emirates 38,830
• Norway 53,451 Switzerland 42,783Norway 53,451 Switzerland 42,783• Uzbekistan 2,630 Australia 37,299Uzbekistan 2,630 Australia 37,299• Finland 36,217 United Kingdom 36,523Finland 36,217 United Kingdom 36,523• Albania 6,859 United States 46,859Albania 6,859 United States 46,859• GermanyGermany 35,442 35,442 Hong KongHong Kong China 43,811China 43,811• Rwanda 1,041Rwanda 1,041• Ukraine 7,347Ukraine 7,347• Austria 39,634Austria 39,634• Ghana 1,500Ghana 1,500• Belarus 12,291Belarus 12,291• Luxembourg 82,306Luxembourg 82,306• Kazakhstan 11,416Kazakhstan 11,416• Korea, South 27,647Korea, South 27,647• Poland 17,482Poland 17,482•
• From the empirical studies, we find From the empirical studies, we find that there is rather robust negative that there is rather robust negative relationship between inequality and relationship between inequality and economic growth in the developed economic growth in the developed countries and poor countries. Except countries and poor countries. Except some contradictions some contradictions

ConclusionConclusion
Studies of inequality and economic Studies of inequality and economic growth have been well conducted by growth have been well conducted by many other scholars and organizations. many other scholars and organizations. But the inequality-economic growth But the inequality-economic growth debate remains unsettled. We see debate remains unsettled. We see those contradictions in relationship those contradictions in relationship between Kuznetz curve, Gini between Kuznetz curve, Gini coefficient, economic growth and so on.coefficient, economic growth and so on.