Embed Size (px)
Citation preview

���������������
In our view, Emaar is probably one of the most misunderstood and undervalued USD20bn
market-cap companies that we cover globally. The stock is stuck at its post-2006 market-
crash level, mostly because of selling by retail investors. However, with the share-for-land
swap issue becoming a distant memory, we think institutional involvement and improving
corporate communication should lead to a strong recovery.
Last year, the market was euphoric about Abu Dhabi names (Aldar, Sorouh) and nervous
about an oversupply of real estate in Dubai. In reality, the two markets are essentially one. But
while Aldar and Sorouh have yet to build a track record, Emaar is a global player. The reward
is comparable (we see a 100% potential return for Emaar, c.75% for Aldar), the risk is not.
Colliers’ estimates suggest deliveries are being pushed back and scaled down. We think
that means the current housing shortage is here to stay at least until 2010. A negative real
rate environment (-8%) should further support the property market. And with c50% of
housing controlled by the government, supply can be managed to match demand.
Emaar is no longer just a Dubai story. Even if the market were to melt down in Dubai and the
company cancelled all future projects and halted construction on unsold developments,
theoretically only AED8.5 would be taken off our target price and AED6.4 off our estimated
2008 NAV. We believe the stock is currently trading at our estimated floor NAV of AED11.3.
We believe most of the negative news that we can think of is already in the price. The
shares-for-land swap has been called off. The struggling US business has only a marginal
effect on our valuation (AED0.1 per share). Negative earnings revisions (margins to
bottom in Q2 2008, we estimate) should be over. The Indian IPO was postponed and a
lower-than-expected dividend payout has already been made.
The current price seems to ignore potential margin recovery and foreign subsidiaries. We value
Emaar at AED23, implying a potential total return of 102%. Our 2008e NAV of AED17.7 per
share is at a 23% discount to our DCF value. We initiate with an Overweight (V) rating.
Overweight (V)
Target price (AED) 23.00 Share price (AED) 11.30 Potential total return (%) 103.5
Dec 2007a 2008e 2009e
HSBC EPS 1.08 1.10 1.70 HSBC PE 10.5 10.3 6.7
Performance 1M 3M 12M
Absolute (%) -22.1 -18.7 -15.0 Relative^ (%) -17.3
Note: (V) = volatile (please see disclosure appendix)
20 February 2008
Walid Khalfallah* Analyst HSBC Bank Middle East Ltd +971 4 5077458 [email protected]
Majed Azzam* Analyst HSBC Bank Middle East Ltd +971 4 5077380 [email protected]
Ankur Khetawat* Associate, Bangalore
View HSBC Global Research at http://www.research.hsbc.com
*Employed by a non-US affiliate of HSBC Securities (USA) Inc, and is not registered/qualified pursuant to NYSE and/or NASD regulations
Issuer of report: HSBC Bank Middle East Ltd
Disclaimer & Disclosures This report must be read with the disclosures and the analyst certifications in the Disclosure appendix, and with the Disclaimer, which forms part of it
Real Estate Equity – United Arab Emirates
Company report
Enterprise value (AEDm) 65169 Free float (%) 68 Market cap (USDm) 18,742 Market cap (AEDm) 68,831
Source: HSBC
Index^ DUBAI FINL MKT IDX Index level 5707.32 RIC EMAR.DU Bloomberg EMAAR UH
Source: HSBC
Emaar Properties PJSC
Overlooked for much too long: initiating coverage with a target price of AED23 and an Overweight (V) rating
� One of the most misunderstood and undervalued USD20bn market-cap companies that we cover globally, in our view
� The stock is currently trading at a NAV which is pricing in what we believe to be an unlikely Dubai property crash
� We initiate coverage with an Overweight (V) rating and AED23 target price
2
Emaar Properties PJSC Real Estate 20 February 2008
��
����
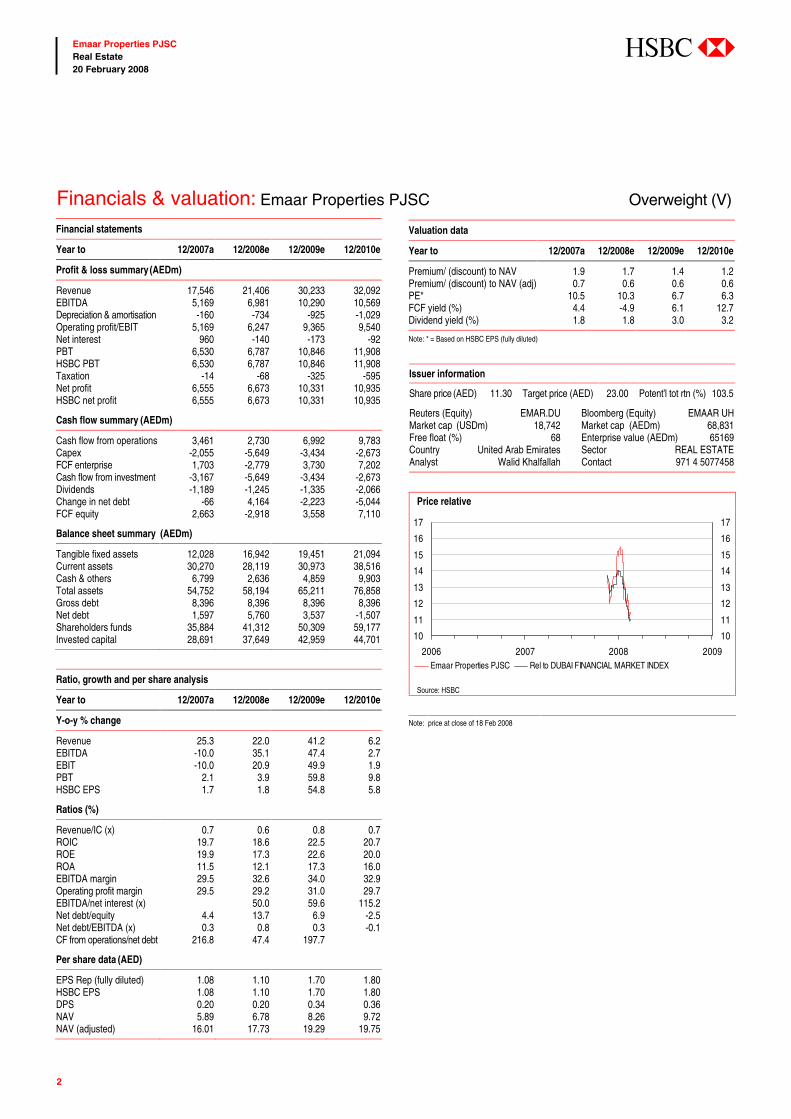
Financials & valuation: Emaar Properties PJSC Overweight (V) Financial statements
Year to 12/2007a 12/2008e 12/2009e 12/2010e
Profit & loss summary (AEDm)
Revenue 17,546 21,406 30,233 32,092 EBITDA 5,169 6,981 10,290 10,569 Depreciation & amortisation -160 -734 -925 -1,029 Operating profit/EBIT 5,169 6,247 9,365 9,540 Net interest 960 -140 -173 -92 PBT 6,530 6,787 10,846 11,908 HSBC PBT 6,530 6,787 10,846 11,908 Taxation -14 -68 -325 -595 Net profit 6,555 6,673 10,331 10,935 HSBC net profit 6,555 6,673 10,331 10,935
Cash flow summary (AEDm)
Cash flow from operations 3,461 2,730 6,992 9,783 Capex -2,055 -5,649 -3,434 -2,673 FCF enterprise 1,703 -2,779 3,730 7,202 Cash flow from investment -3,167 -5,649 -3,434 -2,673 Dividends -1,189 -1,245 -1,335 -2,066 Change in net debt -66 4,164 -2,223 -5,044 FCF equity 2,663 -2,918 3,558 7,110
Balance sheet summary (AEDm)
Tangible fixed assets 12,028 16,942 19,451 21,094 Current assets 30,270 28,119 30,973 38,516 Cash & others 6,799 2,636 4,859 9,903 Total assets 54,752 58,194 65,211 76,858 Gross debt 8,396 8,396 8,396 8,396 Net debt 1,597 5,760 3,537 -1,507 Shareholders funds 35,884 41,312 50,309 59,177 Invested capital 28,691 37,649 42,959 44,701
Ratio, growth and per share analysis
Year to 12/2007a 12/2008e 12/2009e 12/2010e
Y-o-y % change
Revenue 25.3 22.0 41.2 6.2 EBITDA -10.0 35.1 47.4 2.7 EBIT -10.0 20.9 49.9 1.9 PBT 2.1 3.9 59.8 9.8 HSBC EPS 1.7 1.8 54.8 5.8
Ratios (%)
Revenue/IC (x) 0.7 0.6 0.8 0.7 ROIC 19.7 18.6 22.5 20.7 ROE 19.9 17.3 22.6 20.0 ROA 11.5 12.1 17.3 16.0 EBITDA margin 29.5 32.6 34.0 32.9 Operating profit margin 29.5 29.2 31.0 29.7 EBITDA/net interest (x) 50.0 59.6 115.2 Net debt/equity 4.4 13.7 6.9 -2.5 Net debt/EBITDA (x) 0.3 0.8 0.3 -0.1 CF from operations/net debt 216.8 47.4 197.7
Per share data (AED)
EPS Rep (fully diluted) 1.08 1.10 1.70 1.80 HSBC EPS 1.08 1.10 1.70 1.80 DPS 0.20 0.20 0.34 0.36 NAV 5.89 6.78 8.26 9.72 NAV (adjusted) 16.01 17.73 19.29 19.75
Valuation data
Year to 12/2007a 12/2008e 12/2009e 12/2010e
Premium/ (discount) to NAV 1.9 1.7 1.4 1.2 Premium/ (discount) to NAV (adj) 0.7 0.6 0.6 0.6 PE* 10.5 10.3 6.7 6.3 FCF yield (%) 4.4 -4.9 6.1 12.7 Dividend yield (%) 1.8 1.8 3.0 3.2
Note: * = Based on HSBC EPS (fully diluted)
Issuer information
Share price (AED) 11.30 Target price (AED) 23.00 Potent’l tot rtn (%) 103.5
Reuters (Equity) EMAR.DU Bloomberg (Equity) EMAAR UH Market cap (USDm) 18,742 Market cap (AEDm) 68,831 Free float (%) 68 Enterprise value (AEDm) 65169 Country United Arab Emirates Sector REAL ESTATE Analyst Walid Khalfallah Contact 971 4 5077458
Price relative
10
11
12
13
14
15
16
17
2006 2007 2008 2009
10
11
12
13
14
15
16
17
Emaar Properties PJSC Rel to DUBAI FINANCIAL MARKET INDEX
Source: HSBC
Note: price at close of 18 Feb 2008

��
3
Emaar Properties PJSC Real Estate 20 February 2008
���
Value drivers Dubai remains the largest contributor
Value drivers: Dubai remains the largest contributor (AED)
0
5
10
15
20
25
Dubai Emerging Markets Developed Markets
Dubai R eal Es tate B us iness
B awadiAmlak15.9 India
Saudi Econ. CityEgyptMorocco
Other US7.0 0.1
Source: HSBC estimates
Emaar’s size and the extensive coverage of its story
lead us to focus on those areas that add the most
value. While the company has been expanding
overseas, as shown in the chart above, Dubai still
accounts for about 73% of its total value. It is the
main focus of this report, although other markets that
contribute significantly (particularly India, which
adds about AED2 per share) are also analyzed in
some detail.
We are grateful to Colliers International for providing the
industry data for our analysis. For further details please
contact Eamon Alashkar, Associate Director –
Consultancy Services (e-mail: ealashkar@colliers-
me.com, phone: +971 4 355 4177)
Dubai real estate business Shifting product mix impact on margins
Dubai business revenue breakdown (in AEDmn)
-
5,000
10,000
15,000
20,000
25,000
2006 2007 2008 2009 2010 2011 2012
Plot sales Unit sales R ental Hotel
40%
42%
44%
46%
48%
50%
52%
54%
56%
58%
60%
Margins
-
5,000
10,000
15,000
20,000
25,000
2006 2007 2008 2009 2010 2011 2012
Plot sales Unit sales R ental Hotel
40%
42%
44%
46%
48%
50%
52%
54%
56%
58%
60%
Margins
Source: Company data, HSBC estimates from 2008
Until 2006, plot sales accounted for more than
half of Emaar’s revenues. During those years, the
company recorded exceptionally high margins
(c60%), since the land was acquired for free. But
in 2007, Emaar entered a new stage, with more
revenues coming from unit sales and only 8%
from plot sales. Gross margins shrank to 48% (not
overall margin; see “Tying it all together,’’
below). We expect this trend to continue for the
Dubai business until rental income starts to
contribute more significantly, after which margins
should expand again (starting in 2009). In 2015,
we estimate, rental income will account for c30%
of Dubai revenues.
� Dubai remains the largest contributor to valuation …
� … however, other emerging markets are gaining significance
� Supply shortage in Dubai is here to stay

��
4
Emaar Properties PJSC Real Estate 20 February 2008
���
Emaar Dubai income statement (in AEDmn)
2007e 2008e 2009e 2010e
Revenue 14,055 16,064 21,132 18,801 Cost of revenue 7,339 8,968 11,144 10,170 Gross profit 6,716 7,096 9,988 8,632 Gross margin 48% 44% 47% 46% Associate Income* - - 75 213 Net Profit 6,173 5,810 8,070 7,031
Source: HSBC estimates
* Bawadi, UAQ Marina
Another year of delays
The widely anticipated oversupply in Dubai has
yet to materialize. Deliveries continue to be
pushed back and scaled down. Based on the latest
estimates by Colliers International, we forecast
the residential market in Dubai will remain
undersupplied at least until 2010.
Dubai residential cumulative demand/supply (in units)
0
50,000
100,000
150,000
200,000
250,000
300,000
2005 2006 2007 2008 2009 20102.6
2.7
2.8
2.9
3.0
3.1
3.2
3.3
3.4
3.5
Demand Dec. 2007 supply es t.Dec. 2006 supply es t. People per dwelling
Source: Colliers International, HSBC estimates from 2008
Emaar expects to deliver roughly 15,000 units
over the next three years. Of that, c10,000 (66%)
have been sold and 15% of revenues recognized.
Emaar uses the percentage of completion method,
in which revenues start to be recognized only
after 20% of construction is complete.
We estimate AED47bn of revenues in Dubai are
yet to be recognized.
Emaar Dubai residential developments (units)
-
5,000
10,000
15,000
20,000
25,000
30,000
Units revenue recognized Units sold Total units
Burj Dubai
Arabian Ranches
Dubai Marina
Emirates living
Emaar Towers
L’Ussailly UAQ Marina
JV with Bawadi
Source: Company data
Dubai secondary-market residential prices (in USD/m²)
Apr-07 Jan-08 Growth
International City 1,940 2,290 18% The Springs* 3,139 3,388 8% Arabian Ranches* 3,125 3,526 13% Jumeirah Lake Towers 2,647 3,690 39% Dubai Marina* 3,641 4,427 22% Jumeirah Beach Residences - 4,531 - The Greens* - 4,617 - Business Bay - 5,203 - Palm Jumeirah 4,455 5,331 20% Burj Dubai Development* 5,750 6,453 12% Emirates Hills* 7,936 Burj Dubai Tower* 11,790 18,456 57%
Source: Better Homes
* Emaar developments
In our model, for residential developments we
assume a net to gross area of 80%. Our price
assumptions range from a low of AED8,500 per
sq m for UAQ Marina and a high of AED23,000
per sq m for Burj Dubai Development. While
different developments might see varying price
movement (Burj Dubai Tower prices grew by
57% this year), for simplicity’s sake we apply a
uniform growth rate in line with our outlook for
the Dubai housing market – 14% followed by
10% until 2010.

��
5
Emaar Properties PJSC Real Estate 20 February 2008
���
Differentiation through branding
A recent survey conducted by Colliers within the
Dubai Marina area showed Emaar developments,
despite being priced at a premium, consistently
had above-average occupancy. We believe this is
a reflection of the company’s strong brand image
and commitment to after-sales services.
Office: Emaar’s exposure is limited
Emaar’s limited exposure to the office market
makes the segment dynamics almost irrelevant to
valuation. The company’s only office
developments are Burj Dubai Square and Emaar
Business Park.
Compared with other sectors, the office market in
Dubai is the tightest, with occupancy over 98%.
Taking just Dubai into account, it is still the most
at risk of oversupply. However, a large part of the
population of Sharjah and Ajman actually work in
Dubai; in our analysis we assume 50% and 30%
respectively. As such, the demand suggests the
market will reach equilibrium in 2009e.
Dubai office cumulative demand/supply (m²)
0
1,000,000
2,000,000
3,000,000
4,000,000
5,000,000
6,000,000
7,000,000
2006 2007 2008 2009 2010-
0.5
1.0
1.5
2.0
2.5
3.0
3.5
4.0
4.5
Demand SupplyDubai GLA/capita EUR GLA/capitaUS GLA/capita
Source: Colliers International, HSBC estimates from 2008
Dubai prime office rents by location
Rents in USD/m² p.a.
DIFC 1,100 SZR 985 Burj Dubai 600 Deira 570 TECOM 560 Garhoud 390
Source: Colliers International
Emaar Malls According to Colliers International, retail gross
leasable area (GLA) in Dubai is expected to triple,
from 1.4 million sq m in 2006 to 4.2 million sq m
by 2010. Emaar expects to supply about 0.5
million sq m, or c12%, by 2010 and 0.8 million sq
m by 2011. Dubai Mall will account for most of
that, with 0.35 million sq m of retail space.
Dubai cumulative retail demand/supply (m²)
0
500,000
1,000,000
1,500,000
2,000,000
2,500,000
3,000,000
3,500,000
4,000,000
4,500,000
2006 2007 2008 2009 20100.0
0.5
1.0
1.5
2.0
2.5
3.0
3.5
Demand Supply
Dubai GLA/capita EUR av. GLA/capitaUS av. GLA/capita Emaar Supply
0
500,000
1,000,000
1,500,000
2,000,000
2,500,000
3,000,000
3,500,000
4,000,000
4,500,000
2006 2007 2008 2009 20100.0
0.5
1.0
1.5
2.0
2.5
3.0
3.5
Demand Supply
Dubai GLA/capita EUR av. GLA/capitaUS av. GLA/capita Emaar SupplyEmaar Supply
Source: Colliers International, company data, HSBC estimates from 2008
While the city won’t be able to absorb all the new
supply by itself, Dubai has established itself as the
country’s retail hub and also caters to the nearby
emirates. If we look at the UAE as a whole, the
supply and demand numbers do not look too bad
in our view. Furthermore, we feel that given their
prime locations and branding, Emaar malls will
naturally cannibalize other, smaller malls.
Regional as well as international tourism is a big
part of demand, but it was excluded from our
analysis, which is based on the domestic
population only (GLA per capita). Retail tourism
in Dubai is substantial, given the influx of GCC
shoppers, especially during the Dubai Shopping
Festival, but it is difficult to quantify.

��
6
Emaar Properties PJSC Real Estate 20 February 2008
���
UAE cumulative retail demand/supply (m²)
0
1,000,000
2,000,000
3,000,000
4,000,000
5,000,000
6,000,000
7,000,000
8,000,000
9,000,000
2006 2007 2008 2009 2010
0.00
0.20
0.40
0.60
0.80
1.00
1.20
1.40
1.60
1.80
2.00
Demand SupplyUAE GLA/capita EUR av. GLA/capitaUS av. GLA/capita
Source: Colliers International, HSBC estimates from 2008
For both Dubai Mall and Marina Mall, we assume
an initial occupancy rate of 60%, which we
gradually increase to 90% by 2012e. We
conservatively assume a rental rate of AED3,200
per sq m per annum (below market average),
growing by 7% and 5% before stabilizing at 4%.
As the malls reach full capacity (2013), we
estimate they will contribute roughly AED2.2bn
of total Dubai revenue. Emaar Hospitality Group The Dubai Department of Tourism recently
revised its tourist target from 15 million by 2010
to 10 million. That has a significant impact on
hotel demand estimates, but in our view it will not
lead to an oversupply. We do expect a decline in
hotel occupancy rates from an average rate of
82% in 2006 to an average of 60% by 2009e, still
within globally acceptable levels.
However, five out of six of Emaar’s hotels are
located within the Burj Dubai development, which
is both a prime tourist destination (Armani Hotel,
Burj Dubai, Dubai Mall, etc.) and business centre
(between Business Bay and DIFC), so we feel that
occupancy should be higher. Additionally, the
various product offerings of ultra-luxury (Armani
Hotel), luxury (Burj Dubai Lake Hotel, Dubai
Mall Hotel, and the Palace) and four-star hotels
(Al Manzil and Qamardeen), should attract a
wider demographic. As a result, in our model we
assume 75% occupancy at full capacity.
Emaar Hospitality currently runs three hotels (625
rooms) and 318 serviced apartments in Dubai.
Three additional hotels (642 rooms) and 1,517
serviced apartments are under construction and
are expected by Emaar to be operational by 2008.
By 2010, we estimate the company will control a
c4% market share.
Dubai hotel cumulative demand/supply (in rooms)
0
10,000
20,000
30,000
40,000
50,000
60,000
70,000
80,000
90,000
2006 2007 2008 2009 20100%
10%
20%
30%
40%
50%
60%
70%
80%
90%
Demand Supply OccupancyEmaar Supply
0
10,000
20,000
30,000
40,000
50,000
60,000
70,000
80,000
90,000
2006 2007 2008 2009 20100%
10%
20%
30%
40%
50%
60%
70%
80%
90%
Demand Supply OccupancyEmaar Supply
Source: Colliers International, HSBC estimates from 2008
For hotels, we assume a 70% occupancy rate at
launch (2007 and 2008), rising to 75% the
following year. We assume an average room rate
of AED1,000 for four-star hotels (Al Manzil and
Qamardeen) and AED1,500 for five-star hotels
(The Palace Hotel, Dubai Mall Hotel, Burj Dubai
Lake Hotel). For Burj Dubai Armani Hotel we
assume AED2,000. We also assume a non-room
revenue (restaurants, bars, etc.) to room revenue
ratio of 40%, in line with global hospitality
standards.
Bawadi joint venture
We estimate Bawadi will contribute 6.5 million sq
m of land (valued at AED3.85bn) and Emaar will
contribute AED3.85bn in cash to fund the
construction work. Bawadi will progressively
transfer land rights as Emaar invests the
equivalent amount in construction.

��
7
Emaar Properties PJSC Real Estate 20 February 2008
���
Bawadi JV project overview
Total land area (in m²) 6,500,000 Total BUA 3,847,000 Density 59% Start date 2008 Completion date 2017 Residential units 18,000 Hotel & services apt. 6,350 Residential BUA 2,700,000 Commercial BUA 250,000 Retail BUA 297,000 Hotel & Services apt. BUA 600,000 NPV (in AEDmn) 4,873 Shares outstanding (in mn) 6,091 Value per share (in AED) 0.8 Emaar 50% (in AED) 0.4
Source: Company presentation, HSBC estimates
While the joint venture is not as lucrative for
Emaar as its other Dubai projects, since the land
was not acquired for free, it does add value. The
most obvious benefit to the company is the
replenishment of its quickly depleting land bank
in Dubai, which it increases by 38%, with no up-
front cash payment. If the land value remains
fixed at AED3.8bn, then Emaar would benefit
from land-price appreciation. If it is marked to
market in phases as rights are transferred, the
company’s margins may come under pressure.
Overall, Emaar expects an IRR of 15%,
significantly lower than its other projects.
Prices and rents still going strong Strong rental and price appreciation
Residential
Rent USD/m² p.a.
Price USD/m²
Yield
Q4 2006 319 3,371 9.5% Q4 2007 343 3,960 8.7% Growth 8% 17% Office Q4 2006 573 7,346 7.8% Q4 2007 692 9,227 7.5% Growth 21% 26% Retail Q4 2006 1,026 13,678 7.5% Q4 2007 1,233 16,440 7.5% Growth 20% 20% Hotel
Average Room rate in USD
RevPAR
Q4 2006 249 207 Q4 2007 296 255 Growth 19% 23%
Source: Colliers International, Deloitte HotelBenchmark survey
As the supply shortage widened, the property
market in Dubai saw strong rental and price
appreciation across all sectors in 2007. While
residential prices jumped 17%, rental rates only
grew by 8%, due to the government imposed 7%
rental cap, which resulted in a decline in yields
from 9.5% in 2006 to 8.7% last year. Overall, the
office market remains the most lucrative,
recording the strongest growth (26% in prices and
21% in rentals). The following chart highlights
our forecast of residential prices until 2010.Given
the tightness in the market, we still expect further
price and rental appreciation this year.

��
8
Emaar Properties PJSC Real Estate 20 February 2008
���
Dubai residential price forecasts
0
1,000
2,000
3,000
4,000
5,000
6,000
2007 2008 2009 20107.2%
7.4%
7.6%
7.8%
8.0%
8.2%
8.4%
8.6%
8.8%
Prices in USD/m² R ental yield
Source: HSBC estimates from 2008
On a relative basis, given the amount of wealth in
Dubai, prices are still cheap, in our view.
Residential price/sq m in USD (y-axis) vs. GDP/capita in USD (x-axis)
0
2,000
4,000
6,000
8,000
10,000
12,000
14,000
0 10,000 20,000 30,000 40,000 50,000 60,000
Cairo
B angkokWarsaw
B udapestPragueKiev
Shanghai
Dubai Abu Dhabi
MoscowR ome
Hong Kong
S ingapore
T okyoLondon
New Y ork
AmsterdamParis
B arcelona
Source: Colliers International, Jones Lang LaSalle, CB Richard Ellis, Pricewaterhouse, HSBC Research
Cost inflation: material costs not the full story
Going forward we expect some cost deceleration
Cost split 2007a 2008e 2009e 2010e
Labor costs 12% 25% 22% 15% 10% Cement 14% 3% -6% -4% -1% Steel 14% 33% 10% -4% -9% PEM&I* 60% 15% 15% 13% 12% Total dev. costs 100% 17% 13% 9% 7%
Source: Meed, HSBC estimates
* Plumbing, electro-mechanical, and interior finishing
While development costs are usually associated
with steel, cement, and labor, they apply more to
contractors, and only constitute about 40% of a
developer’s total costs. The remaining 60% relate
to plumbing, electro-mechanical and interior
finishing such as kitchens, bathrooms, cabinets
and tiles. Material and labor costs were more
pronounced last year, but PEM&I cost inflation
was broadly in line with overall inflation.
In our forecasts, we assume a 3% differential
between cost escalation and price appreciation.
Hence, for the next two years we are looking at
10% cost growth, followed by 8%, and then 5%,
mirroring long-term inflation.
Competitive landscape
Emaar’s two largest competitors in Dubai are
Nakheel and Dubai Holding, which are both
government-owned. Nakheel was mainly
commissioned to develop land-reclamation
projects (the three palm islands, The World, and
Dubai Water Front), although it has done some
land development (International City, Jumeirah
Lake Towers, etc.). Dubai Holding was mandated
to build knowledge hubs (Heathcare City, Media
City, Internet City, etc.) and amusement parks
(Dubai Land). Together, the three developers
control roughly 50% of the residential market.
Supply breakdown by developer (in units)
-
10,000
20,000
30,000
40,000
50,000
60,000
70,000
80,000
2008 2009 2010
Emaar Dubai Holding Nakheel Union Properties Other
Source: Colliers International
��
9
Emaar Properties PJSC Real Estate 20 February 2008
���
Main risks Oversupply remains the biggest risk
While the biggest risk in Dubai remains
oversupply, we believe that the real estate market
will remain strong for the following reasons:
� With c50% of forthcoming supply controlled
by the Dubai government through Emaar,
Nakheel, and Dubai Holding, we feel that
supply can be managed to match demand.
� The negative real interest rate environment
(-8%), is bound to boost investment in all
assets classes, particularly real estate.
Oversupply would have negative implications on
future sales, since it could force Emaar to abandon
some projects. For quantitative implications,
please see the valuation section.
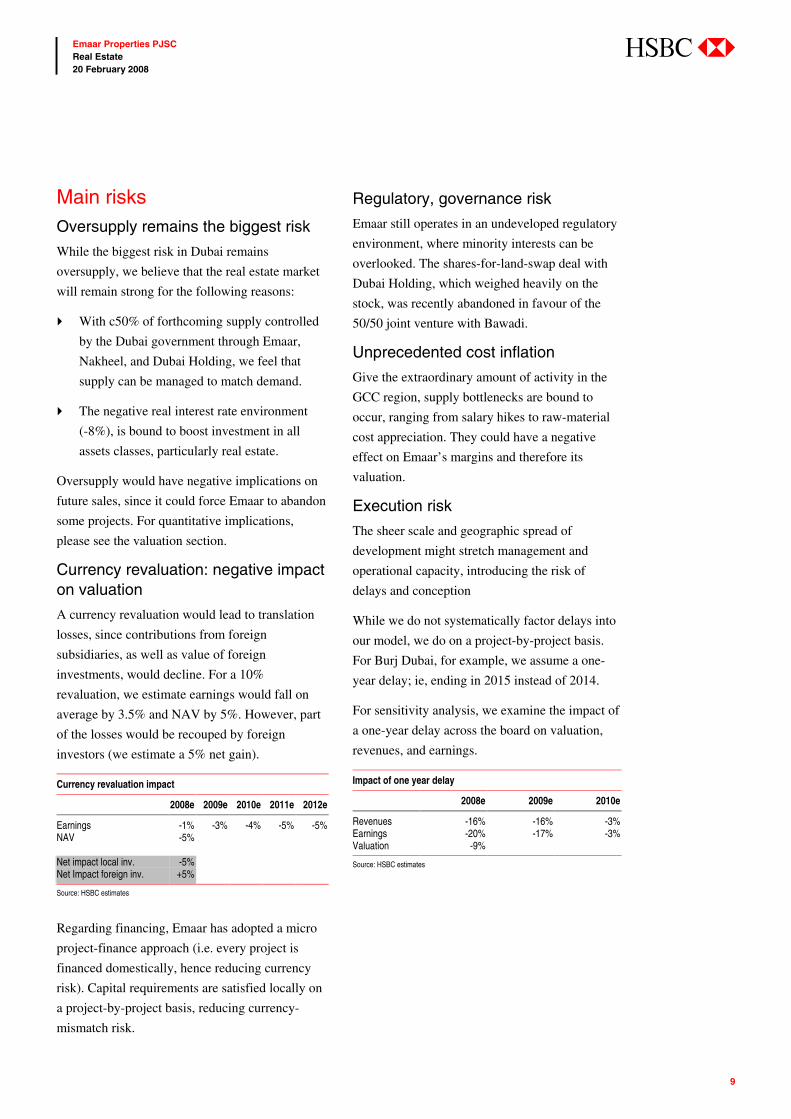
Currency revaluation: negative impact on valuation
A currency revaluation would lead to translation
losses, since contributions from foreign
subsidiaries, as well as value of foreign
investments, would decline. For a 10%
revaluation, we estimate earnings would fall on
average by 3.5% and NAV by 5%. However, part
of the losses would be recouped by foreign
investors (we estimate a 5% net gain).
Currency revaluation impact
2008e 2009e 2010e 2011e 2012e
Earnings -1% -3% -4% -5% -5% NAV -5% Net impact local inv. -5% Net Impact foreign inv. +5%
Source: HSBC estimates
Regarding financing, Emaar has adopted a micro
project-finance approach (i.e. every project is
financed domestically, hence reducing currency
risk). Capital requirements are satisfied locally on
a project-by-project basis, reducing currency-
mismatch risk.
Regulatory, governance risk
Emaar still operates in an undeveloped regulatory
environment, where minority interests can be
overlooked. The shares-for-land-swap deal with
Dubai Holding, which weighed heavily on the
stock, was recently abandoned in favour of the
50/50 joint venture with Bawadi.
Unprecedented cost inflation
Give the extraordinary amount of activity in the
GCC region, supply bottlenecks are bound to
occur, ranging from salary hikes to raw-material
cost appreciation. They could have a negative
effect on Emaar’s margins and therefore its
valuation.
Execution risk
The sheer scale and geographic spread of
development might stretch management and
operational capacity, introducing the risk of
delays and conception
While we do not systematically factor delays into
our model, we do on a project-by-project basis.
For Burj Dubai, for example, we assume a one-
year delay; ie, ending in 2015 instead of 2014.
For sensitivity analysis, we examine the impact of
a one-year delay across the board on valuation,
revenues, and earnings.
Impact of one year delay
2008e 2009e 2010e
Revenues -16% -16% -3% Earnings -20% -17% -3% Valuation -9%
Source: HSBC estimates

��
10
Emaar Properties PJSC Real Estate 20 February 2008
���
Emaar MGF Land Ltd. Conservative valuation: 30% lower than IPO bottom range
Emaar MGF, key assumptions
BUA (in mn m²)
Av. Price (in USD/m²)
Av. cost (in USD/m²)
Av. Cap rate
Residential 28.1 1,168 367 Plots 12.3 299 27 Commercial 8.1 11* 489 10% Retail 1.5 18* 543 10% BUA
(in mn m²)
ARR Av. Cost
( USD/room)
Hotel 0.3 139 176,768 9%
Source: HSBC estimates
* Rentals
India valuation very conservative, below IPO lower range
-
100
200
300
400
500
600
- 10 20 30 40 50 60 70 80
Land area (in mn sq m)
EV/L
and
(in U
SD/s
q m
)
we value Emaar MGF at 30% discount to lower range
Unitech
DLF
Indiabulls
Parsv
HDIL
Sobha
IPO range
Source: Company data, Bloomberg, Emaar MGF prospectus
The chart above shows the key listed real estate
developers in India. We believe our valuation is
conservative, as it is below the IPO lower range
and the comparative best-fit line.
Third-largest land bank in India
EMLL’s has acquired a 50 million sq m land bank
in India, with c70% of the cost already paid, and
the rest to be paid over the next few years. The
land bank is a good mix of large and upcoming
markets in our view. The majority of the
company’s land bank is in north India (c87%).
Overall, Tier I and II cities account for 54% of the
land bank.
EMLL land bank breakdown
North million m² South million m²
Chail 0.07 Chennai 0.21 Dehradun 4.57 Coimbatore 1.07 Delhi 5.31 Hyderabad 2.06 Ghaziabad 1.53 Kochi 1.46 Gurgaon 11.36 Mangalore 0.30 Jaipur 1.68 Mysore 0.62 Jalandhar 0.96 Total 5.72 Lucknow 1.58 Ludhiana 1.40 West million m² Mohali 11.23 Aibaugh 0.10 Total 39.71 Goa 1.95 Indore 0.83 East million m² Pune 2.10 Kolkata 0.02 Total 4.99 Shillong 0.32 Total 0.35 Grand Total 50.77
Source: Company
EMLL plans to sell 24% of its land bank as plots
and 55% as residential units, greatly minimizing
its working-capital requirements. Residential
development is more capital-intensive, because of
the investment in initial infrastructure and a
deferred payment scheme. But we estimate they
will become cash positive at 50-55% of cost. Most
of the remaining land bank will be held as
investment properties, which are cash-intensive.
Business model: geared towards residential and plot sales
Residential sale 55% Plots sale 24% Commercial lease 10% Commercial sale 6% Retail lease 2% Retail sale 1% Hotel 1% SEZ 1%
Source: Company data, HSBC estimates
EMLL to capture 20% of premium housing market by 2011
Growing affluence and income levels have had a
cascading effect on demand for premium residential
space in India. Since this segment represents
EMLL’s target market, it is the most relevant. We
estimate that from 2006 to 2010 roughly 158 million
sq m (c1.6 million units) of additional premium
residential space will be needed.

��
11
Emaar Properties PJSC Real Estate 20 February 2008
���
Knight Frank estimates Grade A and B+
residential supply of 49 million sq m (c490,000
units) over the next three years in the top seven
locations in India to meet this demand. As the chart on the top of the next page shows,
there is a huge undersupply in the premium
residential market in India. We estimate by the
end of 2010 the shortage will reach c46 million sq
meters or roughly 460,000 units. Overall, EMLL
plans to develop 40 million sq m of premium
residential property. Out of the total BUA (built-
up area) 31% (12 million sq m) will be sold as
land plots and the rest developed as community
housing. We estimate that by 2011, EMLL will
account for roughly 20% of total premium
housing supply.
India cum. premium residential demand/supply (million m²)
0
10
20
30
40
50
60
70
80
90
100
2009 2010 2011 2012 2013
Demand T otal Supply Emaar Supply
0
10
20
30
40
50
60
70
80
90
100
2009 2010 2011 2012 2013
Demand T otal Supply Emaar Supply
Source: Knight Frank, HSBC estimates from 2009
* Our estimate of Emaar supply is based on major planned residential developments
Office: a play on the growing IT/ITES sector
The IT/ITES sector has been growing at a c25%
CAGR over the past 5 years and has been the
biggest demand driver for commercial space. The
industry currently employs c300,000 people every
year. We expect the sector to add 3 million jobs
over the next five years, which would support
demand for commercial space of c28 million sq m
over 2007-12. We estimate demand by the
commercial, non- IT/ITES segment to reach 30%
of total commercial space, which would translate
into total space demand of c37 million sq m over
2007-2012. Our estimates are in line with most
property consultants, who are expecting 37
million to 42 million sq m over the same period.
As the following chart shows, by 2012, we
estimate EMLL will account for c20% of total
office supply.
India cumulative office demand (million m²)
0
5
10
15
20
25
30
35
40
2008 2009 2010 2011 2012
Non IT Emaar SupplyIT/ITES
0
5
10
15
20
25
30
35
40
2008 2009 2010 2011 2012
Non IT Emaar SupplyIT/ITES
Source: Company, HSBC estimates from 2008
Retail: shift towards malls
While organized retail (malls, etc.) in India
currently accounts for only c5% of total retail
space, we estimate it will grow at a 35% CAGR to
reach a 15% market share by 2012. We expect the
market to demand c32 million sq m of organized
retail space over the next five years. This is in line
with the expansion plans of most large retail
companies. Furthermore, we expect the absorption
rate to reach 30 million by 2012, although some
micro markets are likely to face problems of
oversupply. In total, EMLL plans to develop
roughly 1.6 million sq m of retail GLA across
different cities, of which c1 million sq m are
expected by the company to be ready by 2011.

��
12
Emaar Properties PJSC Real Estate 20 February 2008
���
India cumulative organized retail demand (million m²)
0
5
10
15
20
25
30
35
2007 2008 2009 2010 2011 2012
Source: HSBC estimates from 2008
Hotel: occupancy to reach 80% this year
Strong growth in domestic and foreign passenger
travel has led to unprecedented demand for hotel
rooms in India, with occupancy levels expected
by us to reach c80% in 2008. According to
government estimates, foreign tourist arrivals in
India grew 11% in 2005 and 15% in 2006, 50% of
which were estimated to be business travellers.
We estimate this number will grow by 8% to 10%
annually over the next 10 years. EMLL plans to
develop roughly 5,000 hotel rooms spread across
different geographies. This will be done through a
multiple product offering within the hospitality
segment. The company intends to cater to all
market segments by offering luxury, five-star,
budget, economy, and serviced apartments.
India cumulative hotel demand/supply (in rooms)
0
5,000
10,000
15,000
20,000
25,000
30,000
35,000
40,000
45,000
2007 2008 2009 2010 201164%
66%
68%
70%
72%
74%
76%
78%
80%
Demand Supply OccupancyEmaar supply
0
5,000
10,000
15,000
20,000
25,000
30,000
35,000
40,000
45,000
2007 2008 2009 2010 201164%
66%
68%
70%
72%
74%
76%
78%
80%
Demand Supply OccupancyEmaar supply
Source: CRIS INFAC
Cairo real estate business Demographic growth and middle-class expansion to boost demand
Cairo price comparison (in USD per m²)
Villa Apartment
Emaar 1,900 1,770 OHD 2,500 - SODIC 1,500 900 TMG 1,360 600 SODIC/Solidere - 1,400
Source: Company data, HSBC Research
Based on TMG numbers, we know that the real
estate market is Cairo was very vibrant last year.
The company recorded strong price growth, with
average prices at Madinaty (which accounted for
65% of total sales) for villas and apartments
growing by 37% to EGP7,510 per sq m and 34%
to EGP3,205 per sq m respectively, beating our
forecast of EGP6,000 per sq m and EGP2,600 per
sq m. This was driven by strong economic growth
and negative real rates.
In Cairo, Emaar is developing four upscale
residential communities targeted at the high-
income segment (USD1,900 per sq m for villas at
a 40% premium to TMG , which targets the
middle to high income). The company expects to
deliver roughly 15,000 units by 2015, about 3% of
overall forthcoming premium residential supply.
So far, only 450 units have been launched, of
which 320 were sold.

��
13
Emaar Properties PJSC Real Estate 20 February 2008
���
We estimate that at the end of 2006, the number
of housing units catering to the middle-to-high
income segment in Cairo stood at around 1.1
million, or c24% of overall supply. We forecast
that supply in this segment will reach 1.6 million
units by 2015. We also estimate that over the
same period, an additional 565,190 housing units
will be required.
Forthcoming supply breakdown (in units)
-
10,000
20,000
30,000
40,000
50,000
60,000
70,000
80,000
90,000
2007 2008 2009 2010 2011 2012 2013 2014 2015
T MG Emaar Heliopolis Nas r City SODIC Other developers
Source: USAID, Companies data, HSBC estimates from 2008
Cairo residential demand/supply (in units)
-
100,000
200,000
300,000
400,000
500,000
600,000
2007 2009 2011 2013 20153.62
3.64
3.66
3.68
3.70
Demand Supply People per dwelling
Source: USAID, CAPMAS, Companies data, HSBC estimates from 2008
In our model, we conservatively assume an
average price of EGP7,000 per sq m, almost in
line with TMG despite Emaar’s developments
being much more upscale. For Cairo Gate lease,
we assume an average rental rate of (EGP1,866
per sq m p.a.). We estimate that by 2010, Egypt
will contribute roughly 10% of Emaar’s
total revenue.
Morocco Vacation homes and tourist resorts
Morocco planned developments
Emaar ownership
Sale units
Lease units
Value per share (AED)
Amelkis II 50% 310 - Amelkis III 50% 440 - Bahia Bay 50% 2,730 - Saphira 100% 16,500 7,300 Oukaeimeden 100% 3,500 1,250 Tinja 100% 2,950 840 Total 26,430 9,390 1.9
Source: Company presentation, HSBC estimates for value per share data
In Morocco, Emaar is developing luxury
beachfront, mountain, and golfing resort
communities, targeting vacation home buyers
and tourists (similar to the OHD model, Al Guna).
More than a third of the units will be leased out.
Three of the projects will be developed in
conjunction with ONA through a 50/50 JV.
The projects will span from 2005 to 2016. In total,
293 units have been sold in Amelkis II and Tinja,
out of 381 units released.
Based on company guidance (townhouses starting
at AED1.5m and villas at AED2.3m), in our
valuation, we assume an average price of
AED6,000 per sq m (MAD12,000) and an average
rental rate of AED350 per sq m p.a. (MAD735).
Given the large rental component, we estimate
that Morocco will account for c10% of revenues
by 2010 and 16% by 2011.
Emaar the Economic City If you build it, they will come
Emaar the Economic City mega-project, is part of
the kingdom’s drive to expand and diversify its
economy, create employment opportunities, and
attract foreign investment. The development is
ambitious and has been received with a fair
amount of scepticism.
��
14
Emaar Properties PJSC Real Estate 20 February 2008
���
According to our strategist, John Lomax, who
visited the site, EEC, the company responsible for
developing the site, was very bullish. However,
apparently the king also recently visited and was
disappointed by the lack of progress.
Nonetheless, plans are being accelerated, doubling
the number of residential units scheduled for
Phase 1. Half of the first-phase leases in the
industrial zone have already been sold.
Furthermore, there seems to have been some
initial confusion about who would provide the
infrastructure for King Abdullah Economic City.
That has now been clarified – the government will
not invest in infrastructure; it is down to the city
itself.
Emaar thought that development margins would
end up being the same as in Dubai. However, a
project on this scale does seem to have a lot of
scope for a loss of financial discipline. The rollout
of the city master plan also has a great deal of
scope for delays in our view.
Given the scale of the project, implementation is
necessary to gain market confidence. Some
speculative demand exists, but residents appear
cautious and unwilling to commit until progress
becomes clearer.
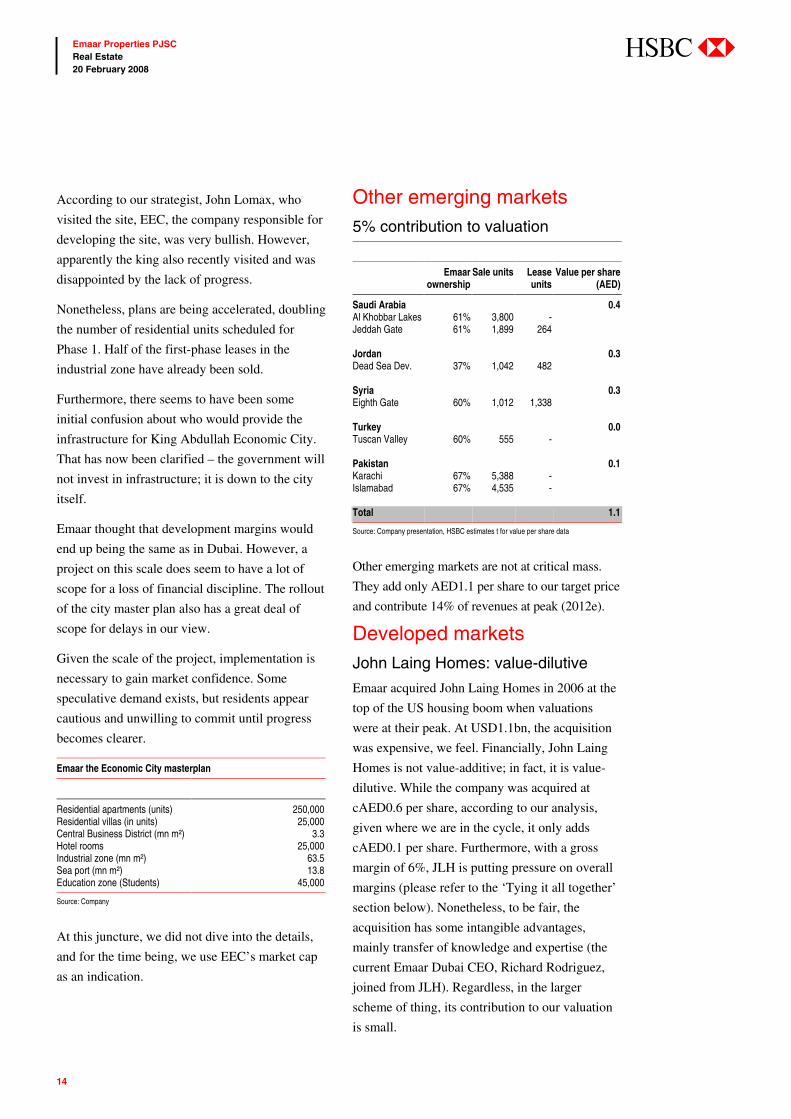
Emaar the Economic City masterplan
Residential apartments (units) 250,000 Residential villas (in units) 25,000 Central Business District (mn m²) 3.3 Hotel rooms 25,000 Industrial zone (mn m²) 63.5 Sea port (mn m²) 13.8 Education zone (Students) 45,000
Source: Company
At this juncture, we did not dive into the details,
and for the time being, we use EEC’s market cap
as an indication.
Other emerging markets 5% contribution to valuation
Emaar ownership
Sale units Lease units
Value per share (AED)
Saudi Arabia 0.4 Al Khobbar Lakes 61% 3,800 - Jeddah Gate 61% 1,899 264 Jordan 0.3 Dead Sea Dev. 37% 1,042 482 Syria 0.3 Eighth Gate 60% 1,012 1,338 Turkey 0.0 Tuscan Valley 60% 555 - Pakistan 0.1 Karachi 67% 5,388 - Islamabad 67% 4,535 - Total 1.1
Source: Company presentation, HSBC estimates t for value per share data
Other emerging markets are not at critical mass.
They add only AED1.1 per share to our target price
and contribute 14% of revenues at peak (2012e).
Developed markets John Laing Homes: value-dilutive
Emaar acquired John Laing Homes in 2006 at the
top of the US housing boom when valuations
were at their peak. At USD1.1bn, the acquisition
was expensive, we feel. Financially, John Laing
Homes is not value-additive; in fact, it is value-
dilutive. While the company was acquired at
cAED0.6 per share, according to our analysis,
given where we are in the cycle, it only adds
cAED0.1 per share. Furthermore, with a gross
margin of 6%, JLH is putting pressure on overall
margins (please refer to the ‘Tying it all together’
section below). Nonetheless, to be fair, the
acquisition has some intangible advantages,
mainly transfer of knowledge and expertise (the
current Emaar Dubai CEO, Richard Rodriguez,
joined from JLH). Regardless, in the larger
scheme of thing, its contribution to our valuation
is small.

��
15
Emaar Properties PJSC Real Estate 20 February 2008
���
Tying it all together Margins set to bottom out this year
Revenue breakdown and overall gross margin
0%
10%
20%
30%
40%
50%
60%
70%
80%
90%
100%
2006 2007 2008 2009 2010 2011
UAE USA Morocco Egypt KSA Rest
30%
35%
40%
45%
50%
55%
Margins
0%
10%
20%
30%
40%
50%
60%
70%
80%
90%
100%
2006 2007 2008 2009 2010 2011
UAE USA Morocco Egypt KSA Rest
30%
35%
40%
45%
50%
55%
Margins
Source: Company reports, HSBC estimates from 2008
We expect margins will bottom out in 2008 and
should progressively improve over the coming
years. Gross margins came under pressure in 2006
and 2007 as plot sales declined (at 90%, the
highest margins) and the US business was
included (6% gross margin). This was the main
reason behind the significant negative earnings
revision last year. However, increased
contributions from other emerging markets
(Egypt, Morocco, KSA, etc.) will mitigate the
struggling US business, in our view.
Revenue breakdown by mix and overall gross margin
0%
10%
20%
30%
40%
50%
60%
70%
80%
90%
100%
2006 2007 2008 2009 2010 2011
Plot sales Units sale Rental income Hotel
30%
35%
40%
45%
50%
55%
Margins
0%
10%
20%
30%
40%
50%
60%
70%
80%
90%
100%
2006 2007 2008 2009 2010 2011
Plot sales Units sale Rental income Hotel
30%
35%
40%
45%
50%
55%
Margins
Source: Company reports, HSBC estimates from 2008
In our view, also shifting product mix towards
investment properties, particularly in Dubai,
Morocco, and Syria, should further support
margin improvement. In Dubai, Dubai Mall,
Marina Mall and most hotels are scheduled for
completion at the end of 2008. In Morocco, the
company plans to lease out a third of total
residential units (9,390). We estimate that rental
income from Morocco will start to kick in by
early 2012. In Syria, 50% of residential units
(1,338) will be leased and will also start
contributing in 2012.
� Margins to bottom out in Q2 2008e and negative earnings revision
should be over
� Emerging markets to offset struggling US business
� Shifting mix towards investment properties to support margins
��
16
Emaar Properties PJSC Real Estate 20 February 2008
���
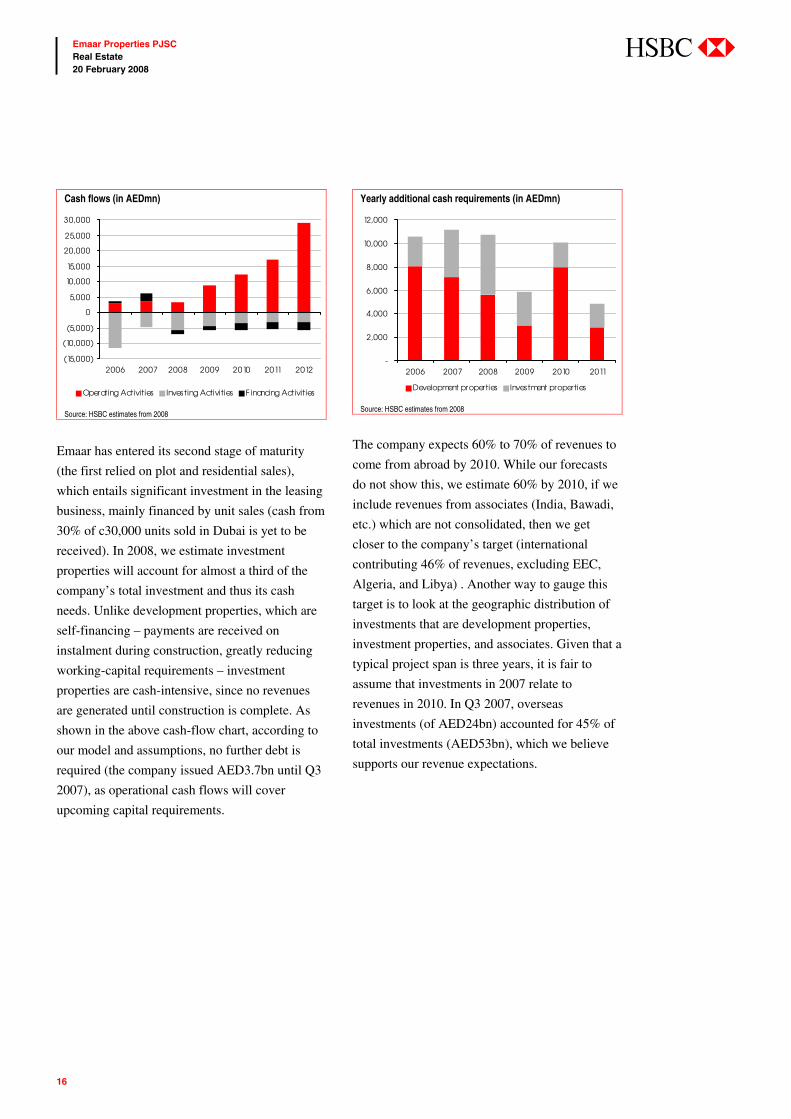
Cash flows (in AEDmn)
(15,000)
(10,000)
(5,000)
0
5,000
10,000
15,000
20,000
25,000
30,000
2006 2007 2008 2009 2010 2011 2012
Operating Activities Investing Activities F inancing Activities
Source: HSBC estimates from 2008
Emaar has entered its second stage of maturity
(the first relied on plot and residential sales),
which entails significant investment in the leasing
business, mainly financed by unit sales (cash from
30% of c30,000 units sold in Dubai is yet to be
received). In 2008, we estimate investment
properties will account for almost a third of the
company’s total investment and thus its cash
needs. Unlike development properties, which are
self-financing – payments are received on
instalment during construction, greatly reducing
working-capital requirements – investment
properties are cash-intensive, since no revenues
are generated until construction is complete. As
shown in the above cash-flow chart, according to
our model and assumptions, no further debt is
required (the company issued AED3.7bn until Q3
2007), as operational cash flows will cover
upcoming capital requirements.
Yearly additional cash requirements (in AEDmn)
-
2,000
4,000
6,000
8,000
10,000
12,000
2006 2007 2008 2009 2010 2011
Development properties Investment properties
Source: HSBC estimates from 2008
The company expects 60% to 70% of revenues to
come from abroad by 2010. While our forecasts
do not show this, we estimate 60% by 2010, if we
include revenues from associates (India, Bawadi,
etc.) which are not consolidated, then we get
closer to the company’s target (international
contributing 46% of revenues, excluding EEC,
Algeria, and Libya) . Another way to gauge this
target is to look at the geographic distribution of
investments that are development properties,
investment properties, and associates. Given that a
typical project span is three years, it is fair to
assume that investments in 2007 relate to
revenues in 2010. In Q3 2007, overseas
investments (of AED24bn) accounted for 45% of
total investments (AED53bn), which we believe
supports our revenue expectations.

��
17
Emaar Properties PJSC Real Estate 20 February 2008
���
Valuation
Value drivers: Dubai remains the largest contributor (AED per share)
0
5
10
15
20
25
Dubai Emerging Markets Developed Markets
Dubai R eal Es tate B us iness
B awadiAmlak15.9 India
Saudi Econ. CityEgyptMorocco
Other US7.0 0.1
Source: HSBC estimates
We use a DCF to value all projects where
development plans have been completed based on
built up areas. Hence projects such as Algeria and
Libya, although significant, are excluded. For
associates and subsidiaries, we use market cap
if available (EEC, Amlak) or net asset value
(Dubai Bank). Regarding MGF India, given the
IPO withdrawal, we apply a 30% discount to
the offering lower range (which was already
reduced twice).
DCF valuation (in AEDm)
Net Debt/ (Cash) 5,760.4 Total DCF value 123,631.4 Net DCF value 117,871.0 Total no of shares 6,091.2 Value per Share 19.4 KAEC 5,412.6 Emaar MGF 12,850.6 Dubai Bank 0.0 Amlak 3,456.0 Total value 21,719.2 No of shares 6,091.2 Value per share 3.6 Total value per share (AED) 23
Source: HSBC estimates
In our model, given Emaar’s geographic spread,
we use country-by-country discount rates and
effective tax rates.
WACC and tax assumptions
Country WACC Effective tax rate
UAE 9.4% 0% Saudi Arabia 9.5% 0% Egypt 14.4% 20% Morocco 11.0% 20% Turkey 18.0% 20% Syria 14.0% 20% Pakistan 16.5% 20% Jordan 12.5% 20% US 8.7% 30%
Source: HSBC estimates
� DCF value of AED23 implies a 100% potential return
� 2008e NAV at 25% discount to DCF, reflecting developer margin
� We estimate a floor NAV of AED11.3 if Dubai market were to
collapse

��
18
Emaar Properties PJSC Real Estate 20 February 2008
���
Valuation key assumptions
Residential 2007e 2008e 2009e 2010e 2011e 2012e 2013e 2014e 2015e Net to gross area 80% 80% 80% 80% 80% 80% 80% 80% 80% Dubai Prices in AED/m² min 11,000 12,540 13,794 14,484 15,208 15,968 16,767 17,605 18,485 Prices in AED/m² max 20,000 22,800 25,080 26,334 27,651 29,033 30,485 32,009 33,610 Growth rate 14% 10% 5% 5% 5% 5% 5% 5% Costs in AED/m² min 6,000 6,600 7,128 7,484 7,859 8,252 8,664 9,097 9,552 Costs in AED/m² max 8,000 8,800 9,504 9,979 10,478 11,002 11,552 12,130 12,736 Growth rate 10% 8% 5% 5% 5% 5% 5% 5% Morocco Prices in AED/m² min 5,214 5,996 6,776 7,521 8,123 8,772 9,299 9,857 10,349 Prices in AED/m² max 5,688 6,541 7,392 8,205 8,861 9,570 10,144 10,753 11,290 Growth rate 15% 13% 11% 8% 8% 6% 6% 5% Costs in AED/m² min 3,081 3,327 3,594 3,845 4,076 4,280 4,494 4,718 4,954 Growth rate 8% 8% 7% 6% 5% 5% 5% 5% Egypt Prices in AED/m² min 4,500 5,175 5,848 6,491 7,010 7,571 8,025 8,507 8,932 Prices in AED/m² max 7,500 8,625 9,746 10,818 11,684 12,619 13,376 14,178 14,887 Growth rate 15% 13% 11% 8% 8% 6% 6% 5% Costs in AED/m² min 2,250 2,430 2,624 2,808 2,977 3,125 3,282 3,446 3,618 Costs in AED/m² max 3,450 3,726 4,024 4,306 4,564 4,792 5,032 5,284 5,548 Growth rate 8% 8% 7% 6% 5% 5% 5% 5% Lease Business YR 1 YR 2 YR 3 YR 4 YR 5 YR 6 YR 7 YR 8 YR 9 Occupancy (60% at launch) 60% 70% 80% 90% 90% 90% 90% 90% 90% 2007 2008 2009 2010 2011 2012 2013 2014 2015 Dubai Rent in AED/m² p.a. min 2,940 3,146 3,303 3,435 3,573 3,716 3,864 4,019 4,179 Rent in AED/m² p.a. max 3,000 3,210 3,371 3,505 3,646 3,791 3,943 4,101 4,265 Growth rate 7% 5% 4% 4% 4% 4% 4% 4% Costs in AED/m² 5000 5400 5832 6240 6615 6945 7293 7657 8040 Growth rate 8% 8% 7% 6% 5% 5% 5% 5% Morocco Rent in AED/m² p.a. min 697 746 798 830 863 897 933 971 1,009 Rent in AED/m² p.a. max 722 772 826 859 894 929 967 1,005 1,045 Growth rate 7% 7% 4% 4% 4% 4% 4% 4% Costs in AED/m² 2,844 3,072 3,317 3,549 3,762 3,951 4,148 4,355 4,573 Growth rate 8% 8% 7% 6% 5% 5% 5% 5% Hotel 2007 2008 2009 2010 2011 2012 2013 2014 2015 Occupancy 75% 75% 75% 75% 75% 75% 75% 75% 75% NRR/ARR* 40% 40% 40% 40% 40% 40% 40% 40% 40% Dubai ARR in AED min 1,000 1,050 1,103 1,158 1,216 1,276 1,340 ARR in AED max 2,500 2,625 2,756 2,894 3,039 3,191 3,350 Growth rate 5% 5% 5% 5% 5% 5% Cost per room in AED min 1,000,000 1,000,000 1,080,000 1,166,400 1,248,048 1,322,931 1,389,077 1,458,531 1,531,458 Cost per room in AED max 2,000,000 2,160,000 2,332,800 2,496,096 2,645,862 2,778,155 2,917,063 3,062,916 3,216,062 Growth rate 8% 8% 7% 6% 5% 5% 5% 5% 2007 2008 2009 2010 2011 2012 2013 2014 2015 Selling & Marketing/Rev 5% 10% 11% 11% 11% 11% 11% 11% 11% G&A growth 10% 10% 10% 10% 10% 10% 10% 10% 10%
Source: HSBC estimates

��
19
Emaar Properties PJSC Real Estate 20 February 2008
���
Estimated floor NAV value of AED11.3 per share – if Dubai property market melts down
As we discussed earlier, we believe an oversupply
is unlikely. In this hypothetical scenario, we
analyse the impact on Emaar’s valuation of a real
estate market meltdown in Dubai. We assume that
the company would cancel all future projects
(L’Ussailly, Bawadi, and UAQ Marina, in total
56,000 units) and halt construction on current
projects that are being developed (Burj Dubai
roughly 9,000 units), except for those that have
already been sold. For lease projects (Dubai Mall,
Marina Mall, and office buildings) we assume a
drop in occupancy levels from 90% to 60% and a
20% decline in rental rates. For hotels (Al Manzil,
Qamardeen, The Palace, Burj Dubai Lake Hotel,
Dubai Mall Hotel, and Marina Mall Hotel) we
also assume a decline in occupancy to 60% from
75% and a 20% drop in room rates. This analysis
has two implications. First, it sets our estimated
floor NAV for this extreme scenario (-36%, NAV
2008 = AED11.3). Second, it illustrates the
impact on our DCF (-37%, TP = AED14.5).
2008e NAV at 23% discount to our DCF
NAV breakdown (AED per share)
0
2
4
6
8
10
12
14
16
18
20
2007 2008 2009
Adj. equity value* Associates Land Investment properties
Source: HSBC estimates
* Adj. for book value of Associates and IPs
Since Emaar’s land is not recognized on its books,
we value it at fair value using the residual method.
We assume a developer margin of 20% on
revenues and worked backwards to the value of
land based on prevailing market prices and costs.
We also marked to market the value of associates
and subsidiaries. Additionally, we revalued the
company’s investment property portfolio (malls,
offices and hotels), which is recognized at cost.
To value investment properties, we use a
capitalization rate of 7.4% (WACC – terminal
growth rate). To compute NOI (net operating
income), we apply a 75% margin for retail and
office, and 30% for hotels. On our estimates,
investment properties have a potential revaluation
of AED21bn to be released by 2010 (includes
lands pertaining to IPs). This is on top of
AED13bn already recognized on the balance sheet
at cost. Please note, Emaar so far has not reflected
any fair value gains.
Land valuation based on residual method (AED per sq m)
Burj Dubai 2007e
Average Price/m² (Net sellable area) 23,000 Average Price/m² (Gross BUA) 18,400 Development Cost/m² 9,000 Development Margin (20%)/m² 3,680 Average Land Price/m² 5,720
Source: HSBC estimates
Land value in AED/m
²
Burj Dubai 5,720 Other Dubai 2,600 Bawadi 1,680 UAQ Marina 260 UAE 2,784 Egypt 1,040 Morocco 548 KSA 760 Syria 740 Pakistan 260 Jordan 220 Turkey 292 Total 1,678 Weighted av. Emaar 2,700 Weighted av. Aldar 2,200
Source: HSBC estimates

��
20
Emaar Properties PJSC Real Estate 20 February 2008
���
While a typical developer margin is 15% (margin
on top of NAV), we derive a DCF value
(AED23), which is c30% higher than NAV
(AED17.7). We believe the difference is justified,
because our model implicitly includes price and
rental appreciation, while the static NAV
calculation does not. Furthermore, investment
properties are understated in our NAV calculation.
A project might be 90% complete, for example,
but it is still valued at cost under this
methodology. Indeed, if we were to apply a
percentage of completion to a project value, then
our NAV would increase considerably.
NAV to converge towards DCF value overtime
0
10
20
30
40
50
60
2008 2010 2012 2014 2016 2018 2020
NAV Value DCF Value
Source: HSBC estimates
As shown in the above chart, the NAV discount to
DCF will widen over the next two years before it
starts to converge. Since a DCF is the future value
of all projects discounted back, it will linearly
increase year on year by the discount rate.
However, NAV calculations do not capture profit
from future development projects as well as the
investment properties that will come on stream.
Once all land has been exhausted, and therefore
all that remains are investment properties
(reflected at fair value), the NAV and DCF will
converge. This is only a theoretical exercise, since
we believe Emaar is likely to replenish its land
bank, and hence continue development properties.
Comparative valuation Comparative valuation for real estate companies
is complicated by different accounting policies,
e.g. revenue recognition, (% of completion or
completed contract), or fair value adjustment
(land, investment properties, etc.). As such,
looking at P/E vs. growth (or EV/EBITDA) does
not provide a clear picture. The most indicative
would be P/B vs. ROE.
PE 2009e vs. EPS growth 2007-09e
0
5
10
15
20
25
30
0% 50% 100% 150%
Source: HSBC estimates
P/BV 2009 vs. ROE 2008e
Emaar Aldar
Sorouh
0.0
1.0
2.0
3.0
4.0
5.0
6.0
7.0
0% 10% 20% 30% 40% 50% 60%
TMG
Source: HSBC estimates

��
21
Emaar Properties PJSC Real Estate 20 February 2008
���
We initiate coverage with an Overweight (V) rating Under our research model, for stocks with a
volatility indicator, the Neutral band is 10
percentage points above and below the hurdle rate
for UAE stocks of 10.3%. Our target price of
AED23 provides total potential return of c100%,
above the Neutral band of our model; therefore,
we initiate coverage with an Overweight (V)
ratings.
Shareholder structure Shareholder structure
0%
20%
40%
60%
80%
100%
Dubai gov. 32%
Free float 68%
Nationals 76%
GCC 12%
Foreign 12%
Source: DFM
Comparative valuation
Peer Name
Reuters
Ticker
Country
Currency
Current Mkt Cap
(USDmn)
Current
Price
Target
Price
Rating
P/Book
PE
EV/
EBITDA
2008e 2009e 2008e 2009e 2008e 2009e Emaar Properties EMAR.DU UAE AED 18904 11.4 23 Overweight (V) 1.7 1.4 10.4 6.7 9.4 6.0 Aldar Properties ALDR.AD UAE AED 7022 11.3 20.3 Overweight (V) 2.2 1.5 12.2 6.2 56.2 10.8 Sorouh Real Estate SOR.AD UAE AED 6644 9.7 13.2 Overweight (V) 4.3 3.3 15.2 11.9 17.1 12.6 Echo Investment SA EPRS.WA POLAND PLN 1182 6.9 91.6 Overweight 1.4 0.9 6.0 2.3 6.4 3.1 GlobeTrade Centre GTCE.WA POLAND PLN 3378 37.6 15.7 Overweight (V) 1.3 0.7 3.6 1.7 33.4 13.0 Hammerson HMSO.L UNITED KINGDOM GBP 5942 10.5 7.6 Underweight 0.9 0.8 24.2 25.0 23.8 21.2 Land Securities Group LAND.L UNITED KINGDOM GBP 13884 15.3 15.6 Underweight 0.8 0.8 18.0 16.0 20.3 17.4 Nexity NEXI.PA FRANCE EUR 1411 29.8 73.0 Overweight 1.2 1.0 4.8 4.7 5.6 5.2 Orco Property Group ORCO.PR CZECH REPUBLIC CZK 844 1743.0 104.7 Neutral 0.8 0.8 6.8 6.4 60.6 209.2 Cyrela Braz Rlty CYRE3.SA BRAZIL BRL 5280 25.8 26.0 Neutral (V) 3.6 3.0 28.8 17.5 13.8 9.0 TMG TMGH.CA EGYPT EGP 4050 12.3 16.4 Overweight (V) 1.1 1.0 18.8 8.5 12.5 3.5 Gafisa SA GFSA3.SA BRAZIL BRL 2239 30.1 44.0 Overweight (V) 2.1 1.7 17.6 11.9 12.3 8.8 Sixth Of Oct. Dev OCDI.CA EGYPT EGP 1001 204.5 280.0 Overweight 3.2 2.8 36.0 24.3 36.6 46.9 DLF DLF.BO INDIA INR 36848 860.0 N/R N/R 5.6 4.0 15.0 11.6 12.5 10.3 Unitech UNTE.BO INDIA INR 16342 400.0 N/R N/R 10.3 6.2 21.1 13.0 14.7 9.8 Union Properties UPRO.DU UAE AED 3597 4.8 N/R N/R 2.3 1.6 18.3 3.9 29.6 4.6 Shimao Properties 0813.HK CHINA CNY 7450 17.6 N/R N/R 2.6 2.2 13.7 9.0 10.0 6.7 Agile Property 3383.HK CHINA CNY 5528 11.5 N/R N/R 3.8 2.9 13.2 9.8 9.9 7.4 Shui on Land 0272.HK CHINA HKD 4386 8.2 N/R N/R 1.9 1.7 17.8 13.7 14.6 12.3 Greentown China 3900.HK CHINA CNY 1951 10.0 N/R N/R 1.9 1.7 17.8 13.7 14.6 12.3
Source: Reuters, HSBC estimates

��
22
Emaar Properties PJSC Real Estate 20 February 2008
���
Aldar (ALDR.AD, AED20.30, Overweight (V)) Valuation
We value Aldar via a DCF as set out below.
Aldar DCF
Terminal Growth Rate 5.00% NPV: FCF 29,939.5 Net Debt/ (Cash) 1,469.9 Equity 28,469.6 Outstanding Shares 3,357 DCF Value (AED) 8.5 Value of Land (Al Yas Island) 23758.0 Value of Land (Al Raha Beach) 4257.0 Value of land (Mina Zayed 50% prob.) 11624.0 No of Shares 3357.3 Value of the Land (Per Share) 11.8 Total Value 20.3
Source: HSBC estimates
Company-specific risks
� Cost inflation: given the extraordinary
amount of activity in the GCC region, supply
bottlenecks are bound to occur, ranging from
salary hikes to raw material cost appreciation.
� Execution risk: the sheer scale of
development (AED184bn) will stretch
management and operational capacity, hence
introducing the risk of delays or even project
cancellation.
� Governance: Aldar is still operating in an
underdeveloped regulatory environment,
where minority interests can be overlooke

��
23
Emaar Properties PJSC Real Estate 20 February 2008
���
Emaar income statement (in AEDmn, except for per share data)
Year to December 2005a 2006a 2007a 2008e 2009e 2010e 2011e 2012e
Sale of Land 4,082.7 8,154.5 1,357.5 - - - - - Sale of Villas and Condominiums
4,153.1 5,240.7 16,188.5 19,961.7 27,142.1 27,619.6 28,999.1 40,579.6
Sale of Commercial Units - 410.9 - - - - - - Rental Income 125.6 199.4 - 997.2 2,371.8 2,694.6 3,306.3 4,415.3 Hotel Revenue - - - 447.4 718.6 1,778.1 1,864.8 1,955.8 Revenue 8,361.4 14,005.5 17,546.1 21,406.3 30,232.5 32,092.2 34,170.2 46,950.7 Cost of Land (1,604.0) (3,527.7) (163.5) - - - - - Cost of Villas & Condominiums
(1,963.5) (3,368.3) (10,477.0) (13,315.2) (17,816.3) (18,737.6) (19,166.6) (25,143.4)
Direct Rental Expenses (18.2) (12.8) - (99.7) (237.2) (269.5) (330.6) (441.5) Hotel Direct Costs - - - (246.1) (395.2) (977.9) (1,025.6) (1,075.7) (3,585.7) (7,039.4) (10,640.5) (13,661.0) (18,448.7) (19,985.0) (20,522.9) (26,660.6) % of sales 43% 50% 61% 64% 61% 62% 60% 57% Gross Profit 4,775.7 6,966.1 6,905.5 7,745.3 11,783.8 12,107.2 13,647.3 20,290.0 Margin 57% 50% 39% 36% 39% 38% 40% 43% Operating Expenses: SGA Expenses (1,021.8) (1,400.4) (2,119.0) (2,140.6) (3,325.6) (3,530.1) (3,758.7) (5,164.6) Other Operating Income 247.6 383.5 382.2 428.1 604.7 641.8 683.4 939.0 Other Income - - - 214.1 302.3 320.9 341.7 469.5 Other Operating Expenses (66.0) (207.0) - - - - - - Operating Expenses (840.2) (1,224.0) (1,736.8) (1,498.4) (2,418.6) (2,567.4) (2,733.6) (3,756.1) EBIT (incl Revaluation Gain) 3,935.5 5,742.1 5,168.7 6,246.9 9,365.2 9,539.8 10,913.7 16,534.0 Margin 47% 41% 29% 29% 31% 30% 32% 35% Net Financing cost 326.1 274.4 148.0 (139.5) (172.7) (91.7) 61.3 392.9 Other fin. Income/charges 122.5 253.3 811.6 - - - - - Associate Income 99.1 128.1 402.0 679.5 1,653.7 2,460.3 2,956.7 3,540.1 Gain on Disposal of Subsidiary
245.8 4.9 - - - - - -
Profit before Taxes 4,729.1 6,402.8 6,530.2 6,786.8 10,846.2 11,908.4 13,931.7 20,467.0 Income Taxes - -(47.1) (13.9) (67.9) (325.4) (595.4) (696.6) (1,023.3) Minority Shareholders’ Interest
2.2 15.4 (38.8) 46.2 189.4 377.9 609.1 920.7
Net Profit (Loss) 4,731.2 6,371.1 6,477.6 6,672.8 10,331.4 10,935.1 12,626.0 18,522.9 Margin 57% 46% 37% 31% 34% 34% 37% 39% Appropriation of Net Income Basic EPS 0.8 1.1 1.1 1.1 1.7 1.8 2.1 3.0 Number of shares 5,565.3 5,988.4 6,091.2 6,091.2 6,091.2 6,091.2 6,091.2 6,091.2 Fully Diluted EPS 0.8 1.1 1.1 1.1 1.7 1.8 2.1 3.0 Fully Diluted Shares 5,565.3 5,988.4 6,091.2 6,091.2 6,091.2 6,091.2 6,091.2 6,091.2
Source: Company reports, HSBC estimates

��
24
Emaar Properties PJSC Real Estate 20 February 2008
���
Emaar balance sheet (in AEDmn)
Year to December 2005a 2006a 2007a 2008e 2009e 2010e 2011e 2012e
Current Assets Cash and Cash Equivalents 10368.0 2329.3 6799.4 2635.5 4858.7 9902.9 19274.5 39626.3 Trade & Other Receivables 717.5 600.9 825.9 865.4 2156.8 330.4 165.2 0.0 Receivable from Project Finance 0.0 0.0 0.0 0.0 0.0 0.0 0.0 0.0 Development Properties 3025.8 11121.4 18269.0 20242.0 19582.1 23906.8 23071.5 17358.5 Development Work in Progress 0.0 0.0 0.0 0.0 0.0 0.0 0.0 0.0 Short term investment 2047.1 1518.6 1752.9 1752.9 1752.9 1752.9 1752.9 1752.9 Current Assets 18087 19129 30270 28119 30973 38516 46887 61360 Investments in Associates 3366.8 7043.5 8892.6 9572.1 11225.8 13686.1 16642.8 20182.8 Long Term Investments 1555.8 973.3 183.7 183.7 183.7 183.7 183.7 183.7 Long Term Assets/ Non Current 5317.9 8444.4 9492.2 10171.7 11825.4 14285.7 17242.3 20782.4 Intangible asset 0.0 2962.0 2962.0 2962.0 2962.0 2962.0 2962.0 2962.0 Hotels 0.0 0.0 0.0 1024.4 1895.4 1801.8 1712.9 1628.3 Property, Plant and Equipment 1875.6 4184.6 7109.2 7294.5 7470.7 7638.2 7797.4 7948.7 Investment Properties 6924.5 6970.5 4918.5 8623.3 10084.7 11654.2 13065.1 14442.0 Permanent 8800.1 14117.0 14989.7 19904.2 22412.8 24056.2 25537.3 26981.0 Total Assets 32204.7 41690.1 54751.8 58194.4 65211.4 76857.6 89666.5 109123.9 LIABILITIES Trade & Other Payables 5527.6 6265.4 8747.4 6997.9 5248.5 7891.1 9709.1 12251.7 Notes Payable 733.1 875.8 1005.2 723.7 304.0 60.8 3.6 0.0 Current Liabilities 6260.7 7141.3 9752.6 7721.7 5552.4 7951.9 9712.7 12251.7 Borrowing & long term debt 238.7 3992.2 8395.9 8395.9 8395.9 8395.9 8395.9 8395.9 Provision for employee services 9.0 12.0 16.3 16.3 16.3 16.3 16.3 16.3 Long Term Liabilities/Non current
247.7 4004.2 8412.3 8412.3 8412.3 8412.3 8412.3 8412.3
Minority Interest in Subsidiaries 135.4 565.9 702.6 748.7 938.2 1316.1 1925.2 2845.9 Paid - Up Capital 5780.2 6075.6 6091.2 6091.2 6091.2 6091.2 6091.2 6091.2 Statutory & Other Reserves 13922.7 14669.1 15197.7 15197.7 15197.7 15197.7 15197.7 15197.7 Retained Earnings 5862.5 9237.0 14596.9 20024.2 29021.0 37889.8 48328.8 64326.5 Shareholder’s Equity 25696.3 30544.7 36586.9 42060.4 51246.7 60493.4 71541.5 88459.9 Total Liabilities and Equity 32204.7 41690.1 54751.8 58194.4 65211.4 76857.6 89666.5 109123.9
Source: Company reports, HSBC estimates

��
25
Emaar Properties PJSC Real Estate 20 February 2008
���
Emaar cash flow statement (in AEDmn)
Year to December 2005a 2006a 2007a 2008e 2009e 2010e 2011e 2012e
Operating Activities: Net Profit before Minorities 4,729.1 6,355.7 3,266.9 6,719.0 10,520.8 11,313.0 13,235.1 19,443.6 Depreciation & amortization 99.0 118.0 77.2 734.2 925.2 1,029.3 1,105.8 1,179.8 Change in Working Capital 1,554.5 (3,491.2) (1,396.7) (4,043.3) (2,800.8) (98.8) 2,761.4 8,417.1 Interest Income & Exp - - - 139.5 172.7 91.7 (61.3) (392.9) Interest Recd - - - 175.3 79.2 160.2 313.1 644.8 Interest Paid - - - (314.8) (251.9) (251.9) (251.9) (251.9) Provision for employee end of service benefits
1.6 3.0 3.1 - - - - -
Net cash generated from operating activities
6,065.7 2,882.2 1,586.9 3,409.8 8,645.2 12,243.4 17,102.3 29,040.6
Investments activities: Capex (Excl Hotel Properties) (1,475.2) (2,501.4) (2,055.0) (4,598.3) (2,486.3) (2,672.7) (2,586.9) (2,623.5) Additions to Hotels Properties - - - (1,050.5) (947.5) - - - Additions to Investment Properties
(263.3) (183.7) - - - - - -
Associates (2,350.1) (3,387.9) (649.3) (679.5) (1,653.7) (2,460.3) (2,956.7) (3,540.1) Subsidiary (150.8) (4,223.4) (249.5) - - - - - Additions to Development WIP - - - - - - - - Acquisition/ sale of financial assets
(1,344.7) 152.8 623.0 - - - - -
Movement in >3 months bank deposits
(1,152.3) 252.2 (835.9) - - - - -
Net cash generated from investment activities
(6,736.5) (11,360.6) (3,166.6) (6,328.2) (5,087.5) (5,133.0) (5,543.6) (6,163.6)
Financing activities: Dividends paid (340.3) (2,355.2) (1,189.1) (1,245.5) (1,334.6) (2,066.3) (2,187.0) (2,525.2) Share issue 8,077.6 1,478.3 79.9 - - - - - Bank Borrowings Raised - 5,133.0 5,299.1 - - - - - Net Share Issuance Fee - - - - - - - - Borrowings Repaid (400.0) (3,567.0) (1,626.0) - - - - - Others 134.9 (5.2) 4.1 - - - - - -
- - - - - - - -
Net cash generated from financing activities
7,472.1 683.9 2,567.9 (1,245.5) (1,334.6) (2,066.3) (2,187.0) (2,525.2)
Net addition (deduction) in cash
6,801.4 (7,794.4) 988.1 (4,163.8) 2,223.2 5,044.2 9,371.6 20,351.8
Cash at beginning of fiscal year - - 6,799.4 6,799.4 2,635.6 4,858.7 9,902.9 19,274.5 Cash at end of fiscal year - - 7,787.5 2,635.6 4,858.7 9,902.9 19,274.5 39,626.4
Source: Company reports, HSBC estimates

��
26
Emaar Properties PJSC Real Estate 20 February 2008
���

��
27
Emaar Properties PJSC Real Estate 20 February 2008
���
Analyst certification The following analyst(s), who is(are) primarily responsible for this report, certifies(y) that the opinion(s) on the subject security(ies) or issuer(s) and any other views or forecasts expressed herein accurately reflect their personal view(s) and that no part of their compensation was, is or will be directly or indirectly related to the specific recommendation(s) or views contained in this research report: Walid Khalfallah and Majed Azzam
Important disclosures
Stock ratings and basis for financial analysis HSBC believes that investors utilise various disciplines and investment horizons when making investment decisions, which depend largely on individual circumstances such as the investor’s existing holdings, risk tolerance and other considerations. Given these differences, HSBC has two principal aims in its equity research: 1) to identify long-term investment opportunities based on particular themes or ideas that may affect the future earnings or cash flows of companies on a 12 month time horizon; and 2) from time to time to identify short-term investment opportunities that are derived from fundamental, quantitative, technical or event-driven techniques on a 0-3 month time horizon and which may differ from our long-term investment rating. HSBC has assigned ratings for its long-term investment opportunities as described below.
This report addresses only the long-term investment opportunities of the companies referred to in the report. As and when HSBC publishes a short-term trading idea the stocks to which these relate are identified on the website at www.hsbcnet.com/research. Details of these short-term investment opportunities can be found under the Reports section of this website.
HSBC believes an investor’s decision to buy or sell a stock should depend on individual circumstances such as the investor’s existing holdings and other considerations. Different securities firms use a variety of ratings terms as well as different rating systems to describe their recommendations. Investors should carefully read the definitions of the ratings used in each research report. In addition, because research reports contain more complete information concerning the analysts’ views, investors should carefully read the entire research report and should not infer its contents from the rating. In any case, ratings should not be used or relied on in isolation as investment advice.
Rating definitions for long-term investment opportunities
Stock ratings HSBC assigns ratings to its stocks in this sector on the following basis:
For each stock we set a required rate of return calculated from the risk free rate for that stock’s domestic, or as appropriate, regional market and the relevant equity risk premium established by our strategy team. The price target for a stock represents the value the analyst expects the stock to reach over our performance horizon. The performance horizon is 12 months. For a stock to be classified as Overweight, the implied return must exceed the required return by at least 5 percentage points over the next 12 months (or 10 percentage points for a stock classified as Volatile*). For a stock to be classified as Underweight, the stock must be expected to underperform its required return by at least 5 percentage points over the next 12 months (or 10 percentage points for a stock classified as Volatile*). Stocks between these bands are classified as Neutral.
Our ratings are re-calibrated against these bands at the time of any ’material change’ (initiation of coverage, change of volatility status or change in price target). Notwithstanding this, and although ratings are subject to ongoing management review, expected returns will be permitted to move outside the bands as a result of normal share price fluctuations without necessarily triggering a rating change.

��
28
Emaar Properties PJSC Real Estate 20 February 2008
���
*A stock will be classified as volatile if its historical volatility has exceeded 40%, if the stock has been listed for less than 12 months (unless it is in an industry or sector where volatility is low) or if the analyst expects significant volatility. However, stocks which we do not consider volatile may in fact also behave in such a way. Historical volatility is defined as the past month’s average of the daily 365-day moving average volatilities. In order to avoid misleadingly frequent changes in rating, however, volatility has to move 2.5 percentage points past the 40% benchmark in either direction for a stock’s status to change.
Prior to this, from 7 June 2005 HSBC applied a ratings structure which ranked the stocks according to their notional target price vs current market price and then categorised (approximately) the top 40% as Overweight, the next 40% as Neutral and the last 20% as Underweight. The performance horizon is 2 years. The notional target price was defined as the mid-point of the analysts’ valuation for a stock.
From 15 November 2004 to 7 June 2005, HSBC carried no ratings and concentrated on long-term thematic reports which identified themes and trends in industries, but did not make a conclusion as to the investment action that potential investors should take.
Prior to 15 November 2004, HSBC’s ratings system was based upon a two-stage recommendation structure: a combination of the analysts’ view on the stock relative to its sector and the sector call relative to the market, together giving a view on the stock relative to the market. The sector call was the responsibility of the strategy team, set in co-operation with the analysts. For other companies, HSBC showed a recommendation relative to the market. The performance horizon was 6-12 months. The target price was the level the stock should have traded at if the market accepted the analysts’ view of the stock.
Rating distribution for long-term investment opportunities
As of 19 February 2008, the distribution of all ratings published is as follows: Overweight (Buy) 55% (22% of these provided with Investment Banking Services)
Neutral (Hold) 31% (22% of these provided with Investment Banking Services)
Underweight (Sell) 14% (14% of these provided with Investment Banking Services)
Share price and rating changes for long-term investment opportunities
Aldar Properties Share Price performance AED Vs HSBC rating history
Source: HSBC
Recommendation & price target history
From To Date
N/A Overweight (V) 29 June 2007 Target Price Value Date
Price 1 14.24 29 June 2007 Price 2 20.30 29 November 2007
Source: HSBC
3
8
13
18
Feb-
03
Aug-
03
Feb-
04
Aug-
04
Feb-
05
Aug-
05
Feb-
06
Aug-
06
Feb-
07
Aug-
07
Feb-
08

��
29
Emaar Properties PJSC Real Estate 20 February 2008
���
HSBC & Analyst disclosures Disclosure checklist
Company Ticker Recent price Price Date Disclosure
ALDAR PROPERTIES ALDR.AD 11.40 19-Feb-2008 4Source: HSBC
1 HSBC* has managed or co-managed a public offering of securities for this company within the past 12 months. 2 HSBC expects to receive or intends to seek compensation for investment banking services from this company in the next
3 months. 3 At the time of publication of this report, HSBC Securities (USA) Inc. is a Market Maker in securities issued by this
company. 4 As of 31 January 2008 HSBC beneficially owned 1% or more of a class of common equity securities of this company. 5 As of 31 December 2007, this company was a client of HSBC or had during the preceding 12 month period been a client
of and/or paid compensation to HSBC in respect of investment banking services. 6 As of 31 December 2007, this company was a client of HSBC or had during the preceding 12 month period been a client
of and/or paid compensation to HSBC in respect of non-investment banking-securities related services. 7 As of 31 December 2007, this company was a client of HSBC or had during the preceding 12 month period been a client
of and/or paid compensation to HSBC in respect of non-securities services. 8 A covering analyst/s has received compensation from this company in the past 12 months. 9 A covering analyst/s or a member of his/her household has a financial interest in the securities of this company, as
detailed below. 10 A covering analyst/s or a member of his/her household is an officer, director or supervisory board member of this
company, as detailed below. 11 At the time of publication of this report, HSBC is a non-US Market Maker in securities issued by this company. Analysts are paid in part by reference to the profitability of HSBC which includes investment banking revenues.
For disclosures in respect of any company, please see the most recently published report on that company available at www.hsbcnet.com/research.
* HSBC Legal Entities are listed in the Disclaimer below.
Additional disclosures 1 This report is dated as at 20 February 2008. 2 All market data included in this report are dated as at close 18 February 2008, unless otherwise indicated in the report. 3 HSBC has procedures in place to identify and manage any potential conflicts of interest that arise in connection with its
Research business. HSBC’s analysts and its other staff who are involved in the preparation and dissemination of Research operate and have a management reporting line independent of HSBC’s Investment Banking business. Chinese Wall procedures are in place between the Investment Banking and Research businesses to ensure that any confidential and/or price sensitive information is handled in an appropriate manner.
4 As of 31 January 2008, HSBC beneficially owned 5% or more of a class of common equity securities of the following company(ies) : ALDAR PROPERTIES
5 As of 31 January 2008, HSBC beneficially owned 2% or more of a class of common equity securities of the following company(ies) : ALDAR PROPERTIES

��
30
Emaar Properties PJSC Real Estate 20 February 2008
���
* Legal entities as at 22 August 2007 ’UAE’ HSBC Bank Middle East Limited, Dubai; ’HK’ The Hongkong and Shanghai Banking Corporation Limited, Hong Kong; ’TW’ HSBC Securities (Taiwan) Corporation Limited; ’CA’ HSBC Securities (Canada) Inc, Toronto; HSBC Bank, Paris branch; HSBC France; ’DE’ HSBC Trinkaus & Burkhardt AG, Dusseldorf; 000 HSBC Bank (RR), Moscow; ’IN’ HSBC Securities and Capital Markets (India) Private Limited, Mumbai; ’JP’ HSBC Securities (Japan) Limited, Tokyo; ’EG’ HSBC Securities Egypt S.A.E., Cairo; ’CN’ HSBC Investment Bank Asia Limited, Beijing Representative Office; The Hongkong and Shanghai Banking Corporation Limited, Singapore branch; The Hongkong and Shanghai Banking Corporation Limited, Seoul Securities Branch; HSBC Securities (South Africa) (Pty) Ltd, Johannesburg; ’GR’ HSBC Pantelakis Securities S.A., Athens; HSBC Bank plc, London, Madrid, Milan, Stockholm, Tel Aviv, ’US’ HSBC Securities (USA) Inc, New York; HSBC Yatirim Menkul Degerler A.S., Istanbul; HSBC México, S.A., Institución de Banca Múltiple, Grupo Financiero HSBC, HSBC Bank Brasil S.A. - Banco Múltiplo.
Issuer of report HSBC Bank Middle East Ltd PO Box 4604 Dubai UAE Telephone: +97 14 5077333 Fax: +97 14 3535079 Website: www.research.hsbc.com
In the UAE this document has been approved by HSBC Bank Middle East Ltd (“HBME”) for the information of its customers and those of its affiliates only. HSBC Securities (USA) Inc. accepts responsibility for the content of this research report prepared by its non-US foreign affiliate. All U.S. persons receiving and/or accessing this report and wishing to effect transactions in any security discussed herein should do so with HSBC Securities (USA) Inc. in the United States and not with its non-US foreign affiliate, the issuer of this report. In the UK this report may only be distributed to persons of a kind described in Article 19(5) of the Financial Services and Markets Act 2000 (Financial Promotion) Order 2001. The protections afforded by the UK regulatory regime are available only to those dealing with a representative of HSBC Bank plc in the UK. It is not intended for Private Customers in the UK. If this research is received by a customer of an affiliate of HSBC, its provision to the recipient is subject to the terms of business in place between the recipient and such affiliate. In Australia, this publication has been distributed by HSBC Stockbroking (Australia) Pty Limited (ABN 60 007 114 605) for the general information of its “wholesale” customers (as defined in the Corporations Act 2001). It makes no representations that the products or services mentioned in this document are available to persons in Australia or are necessarily suitable for any particular person or appropriate in accordance with local law. No consideration has been given to the particular investment objectives, financial situation or particular needs of any recipient. This publication has been distributed in Japan by HSBC Securities (Japan) Limited. It may not be further distributed, in whole or in part, for any purpose. In Hong Kong, this document has been distributed by The Hongkong and Shanghai Banking Corporation Limited in the conduct of its Hong Kong regulated business for the information of its institutional and professional customers; it is not intended for and should not be distributed to retail customers in Hong Kong. The Hongkong and Shanghai Banking Corporation Limited makes no representations that the products or services mentioned in this document are available to persons in Hong Kong or are necessarily suitable for any particular person or appropriate in accordance with local law. All inquiries by such recipients must be directed to The Hongkong and Shanghai Banking Corporation Limited. In Singapore, this publication is distributed by The Hongkong and Shanghai Banking Corporation Limited, Singapore Branch for the general information of institutional investors or other persons specified in Sections 274 and 304 of the Securities and Futures Act (Chapter 289) (“SFA”) and accredited investors and other persons in accordance with the conditions specified in Sections 275 and 305 of the SFA. This publication is not a prospectus as defined in the SFA. It may not be further distributed in whole or in part for any purpose. The Hongkong and Shanghai Banking Corporation Limited Singapore Branch is regulated by the Monetary Authority of Singapore. This document is not and should not be construed as an offer to sell or the solicitation of an offer to purchase or subscribe for any investment. HSBC has based this document on information obtained from sources it believes to be reliable but which it has not independently verified; HSBC makes no guarantee, representation or warranty and accepts no responsibility or liability as to its accuracy or completeness. The opinions contained within the report are based upon publicly available information at the time of publication and are subject to change without notice. Past performance is not necessarily a guide to future performance. The value of any investment or income may go down as well as up and you may not get back the full amount invested. Where an investment is denominated in a currency other than the local currency of the recipient of the research report, changes in the exchange rates may have an adverse effect on the value, price or income of that investment. In case of investments for which there is no recognised market it may be difficult for investors to sell their investments or to obtain reliable information about its value or the extent of the risk to which it is exposed. HSBC Bank Middle East Ltd is registered in Jersey, Channel Islands, is authorised and regulated by the Jersey Financial Services Commission and is a member of the Dubai International Financial Exchange. © Copyright. HSBC Bank Middle East Ltd. 2008, ALL RIGHTS RESERVED. No part of this publication may be reproduced, stored in a retrieval system, or transmitted, on any form or by any means, electronic, mechanical, photocopying, recording, or otherwise, without the prior written permission of HSBC Bank Middle East Ltd. MICA (P) 316/06/2007
210600
���
Multi-asset Global Philip Poole Global Head of Emerging Markets Research +44 20 7991 5641 [email protected] Wietse Nijenhuis +44 20 7992 3680 [email protected]
Economics Latin America Javier Finkman +54 11 4344 8144 [email protected] Ramiro D Blazquez +54 11 4348 5759 [email protected] Alexandre Bassoli +55 11 3847 5744 [email protected] Paulo E Mateus +55 11 3847 5985 [email protected] Jonathan Heath +52 55 5721 2176 [email protected] Juan Pedro Trevino-Gutierrez +44 20 7991 5980 [email protected] Lorena Dominguez-Torres +52 55 5721 2172 [email protected] Marjorie Hernandez +1 212 525 4109 [email protected] Asia Peter Morgan +852 2822 4870 [email protected] Qu Hongbin +852 2822 2025 [email protected] Frederic Neumann +852 2822 4556 [email protected] Manas Paul +91 94 4827 1868 [email protected] Robert Prior-Wandesforde +65 6239 0840 [email protected] Christopher Wong +852 2996 6917 [email protected] Janus Chan +852 2996 6975 [email protected] CEMEA Juliet Sampson +44 20 7991 5651 [email protected] Alexander Morozov +7 49 5721 1577 [email protected] Murat Ulgen +90 21 2366 1625 [email protected] Simon Williams +971 4507 7614 [email protected] Dafydd Lewis +971 4 5077 815 [email protected] Esra Erisir +90 21 2366 1615 [email protected] John Lomax Head of Equity Strategy, GEMs +44 20 7992 3712 [email protected]
Credit Dilip Shahani +852 2822 4520 [email protected] Becky Liu +852 2822 4392 [email protected] Devendran Mahendran +852 2822 4521 [email protected] Zhiming Zhang +852 2822 4523 [email protected] Olga Fedatova +44 20 7992 3707 [email protected] Julia Kovach +44 20 7992 3706 [email protected] Chavan Bhogaita +971 4507 7695 [email protected] Keerthi Angammana Credit Strategy +44 20 79915431 [email protected] United Arab Emirates Chavan Bhogaita Head of Credit Research +971 450 77695 [email protected]
Currency Clyde Wardle +1 212 525 3345 [email protected] Paulo Hermanny +1 212 525 3084 [email protected] Richard Yetsenga +852 2996 6565 [email protected] Daniel Hui +852 2822 4340 [email protected] Perry Kojodjojo +852 2996 6568 [email protected]
Fixed Income Pieter Van Der Schaft +852 2822 4277 [email protected] Virgil Esguerra +852 2822 4665 [email protected] Alejandro Mártinez-Cruz Debt Markets +852 2822 4665 [email protected] Hernan M Yellati Debt Markets +1 212 525 6787 [email protected]
Equity
CEMEA Europe Will Manuel Head of CEMEA Company Research +44 20 7992 3602 [email protected] Maciej Baranski +44 20 7991 6782 [email protected] Anisa Redman +44 20 7991 6822 [email protected] Herve Drouet +44 20 7991 6827 [email protected] Sergey Fedoseev +44 20 7991 6831 [email protected] Veronika Lyssogorskaya +44 20 7992 3684 [email protected] Turkey Cenk Orcan Co-Head of Turkey Equity Research +90 212 366 1605 [email protected] Bulent Yurdagul Co-Head of Turkey Equity Research +90 212 366 1604 [email protected] Levent Bayar +90 212 366 1617 [email protected] Tamer Sengun +90 212 376 4615 [email protected] Pinar Ceritoglu +90 212 376 4613 [email protected] Erol Hullu +90 212 376 4616 [email protected] Cagan Orsun +90 212 376 46 20 [email protected] Egypt Alia El Mehelmy +20 27 396 441 [email protected] Wael Orban +202 27 396 462 [email protected] Ahmed Hafez SAAD +202 27 396 469 [email protected] Israel Avshalom Shimei +972 3 710 1197 [email protected] Yonah Weisz +972 3 710 1198 [email protected]
GEMs Research Team

���
Equity CEMEA (continued) United Arab Emirates Walid Khalfallah Head of Middle East and CEMEA Financials Equity Research +971 4 5077 458 [email protected] Karim Khadr +971 4 507 7231 [email protected] Kunal Bajaj +971 4 507 7458 [email protected] Nadia Kabbani +971 4 507 7157 [email protected] Arsalan Mustafa +971 4 507 7642 [email protected] Majed Azzam +971 4 507 7380 [email protected] Asia Real Estate Herald van der Linde +852 2996 6575 [email protected] Ashutosh Narkar +91 22 3023 1474 [email protected] Michelle Kwok +852 2996 6918 [email protected] Banks Todd Dunivant Head of Banks, Asia-Pacific +852 2996 6599 [email protected] York Pun +852 2822 4396 [email protected] Saumya Agarwal +91 22 2268 1235 [email protected] Kathy Park +82 2 3706 8755 [email protected] Shary Wu +852 2996 6585 [email protected] Katherine Lei +852 2996 6926 [email protected] Insurance John Russell Global Sector Advisor +852 2822 4321 [email protected] Anubhav Adlakha +852 2996 6592 [email protected] Patricia Cheng +852 2996 6584 [email protected] Industrials Sumeet Agrawal +91 22 2268 1243 [email protected] Steve Man +852 2822 4395 [email protected] Elvis Au-Yeung +852 2996 6555 [email protected] Sandeep Somani +91 22 2268 1245 [email protected] Sachin Gupta +91 22 2268 1079 [email protected] Mark Webb +852 2996 6574 [email protected] Azura Shahrim +852 2996 6976 [email protected] Eric Lin +852 2996 6570 [email protected] Healthcare Jatin Kotian +91 22 2268 1638 [email protected] Natural Resources Daniel Kang +852 2996 6669 [email protected] Sarah Mak +852 2822 4551 [email protected] Henik Fung +852 2996 6557 [email protected] Steven Hong Xing Li +852 2996 6941 [email protected] Andrew Chan +852 2996 6569 [email protected] Vishwas Katela +91 22 2268 1236 [email protected] Prasad Dahapute +91 22 2268 1246 [email protected]
Equity Strategy Garry Evans +852 2996 6916 [email protected] Steven Sun +852 2822 4298 [email protected] Leo Li +852 2822 6919 [email protected] Consumer Brands Matt Marsden +852 2996 6531 [email protected] Sean Yang +852 2822 4342 [email protected] Percy Panthaki +91 22 2268 1240 [email protected] Summer Wang +852 2822 4337 [email protected] TMT Steven C Pelayo +852 2822 4391 [email protected] Tse-yong Yao +852 2822 4397 [email protected] Tucker Grinnan +852 2822 4686 [email protected] Walden Shing +852 2996 6751 [email protected] Shishir Singh +852 2822 4292 [email protected] Rajiv Sharma +91 80 66272481 [email protected] Percy Panthaki +91 22 2268 1240 [email protected] Wanli Wang +8862 8725 6020 [email protected] Christine Wang +8862 8725 6024 [email protected] Leo Tsai +8862 8725 6022 [email protected] Small & Mid-cap Ken Ho +852 2996 6593 [email protected] Elaine Lam +852 2822 4398 [email protected] Nam Park +852 2996 6591 [email protected] Steve Bae +852 2996 6571 [email protected] Carolyn Poon +852 2996 6586 [email protected] Jenny Wang +886 8725 6023 [email protected] Parash Jain +852 2996 6717 [email protected] Latin America Victor Galliano +1 212 525 5253 [email protected] Pedro Herrera +1 212 525 5126 [email protected]
GEMs Research Team (continued)


![DUBAI CREEK HARBOUR - Emaar Properties PJSC | … Creek Harbour: The Cove Visualization - Docklands I Entrance Lobby [Block D] Latest Version For more information on The COVE in Dubai](https://img.pdfslide.us/doc/110x75/5afe6bbf7f8b9a814d8f0182/dubai-creek-harbour-emaar-properties-pjsc-creek-harbour-the-cove-visualization.jpg)