Embed Size (px)
Citation preview

São Paulo December, 2008
Equitable access to basic services: Equitable access to basic services: the case of Sabespthe case of Sabesp

Three highlights...
Sabesp is strongly committed to public policies and market
standards for efficiency and profitability
The new regulatory framework creates new challenges and
opportunities
Universal coverage of services and environmental solutions are
Sabesp´s top priorities

Outline
Sabesp
The new regulatory framework
Challenges and opportunities

1. Sabesp

Brazil
São Paulo
Source: IBGE, Seade and Banco Central de Brasil
41 million inhabitants 645 municipalities
The State of São Paulo in comparative perspective...

Source: IMF, Seade Foundation, IBGE
Indicators 2007/08 BrazilSão
Paulo
Argentina Chile China Índia Rússia USA
Population
(million)
186 41 40 16 1,321 1,123 142 298
Area(thousand Km2)
8,514 248 2,780 757 9,596 3,287 17,075 9,629
GDP
(US$ ‐
bi)1,313 445 259 163 3,250 1,098 1,289 13,844
GDP per capita(US$)
7,059 10,854 6,475 10,188 2,460 978 9,077 46,456
Inflation (%)
6,3 6,4 8,7 9,2 4,6 9,0 15,0 4,9
Brazil and São Paulo in comparative perspective...

7
Foundation in 1973Employees: 16,800Serves the City of São Paulo and 366 out of 645 municipalities in the StateProvides water to 23.1 million people and sewage services to 19.0 million people Also sells wholesale treated water to 6 municipalities (3.3 million people)Covers 60% of State's urban population
Water Sewage
(1) As of June 30, 2008(2) Treated sewage as percentage of collected sewage
Main Operational Indicators (1)
Regional Systems
Metropolitan Region
Brazil
São Paulo
Basic Information
Connections (million) 6.8 5.2
Coverage (%) 100% 79%
Treatment (%) 100% 70%(²)
Volume Billed (m³ million) 791.4 643.9
Network (km thousand) 62.5 40.9
Sabesp overview
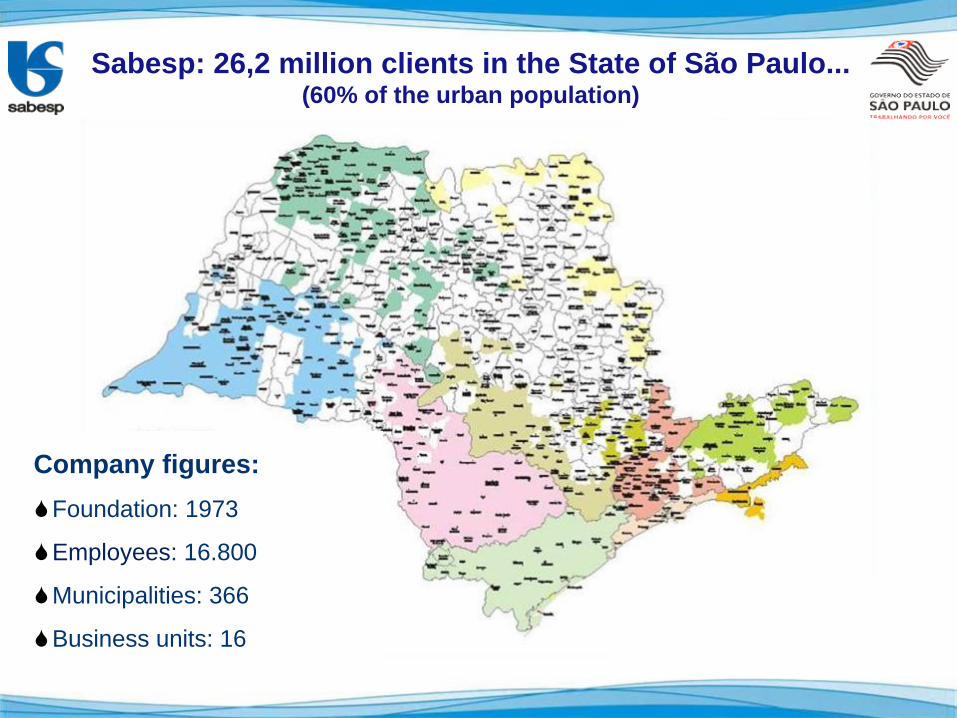
Sabesp: 26,2 million clients in the State of São Paulo... (60% of the urban population)
Company figures:Foundation: 1973
Employees: 16.800
Municipalities: 366
Business units: 16

One of the largest water and sewage service providers in the world…
Source: Pinsent Masons – water Yearbook – 2006- 2007(×) includes 3,1 million clients in municipalities currently served on a wholesale basis

Mixed capital companyListed on the “Novo Mercado” and NYSE, leading to high corporate governance standards100% common shares
Strong corporate governance…

In addition, net revenues have increased...

EBITDA margin has remained at a high level...

* In 1S08, EBITDA of the last twelve months
Net Debt / EBITDA ratio has declined...
Net Debt vs. EBITDA* (R$ million)

2. 2. The new regulatory framework

The regulatory framework has changed...
15
1970 - 2006 2007 – Sanitation Act and Arsesp Act
Concession contract Programme contract
Self-regulation Regulatory agency
Public funding Market and public funding
Focus on engineering works Focus on the client
Natural monopoly Competitive environment
Water as a free resource Scarcity of water resources

Changes in the legislation allow for new business opportunities...
Joint ventures with domestic and foreign companies
New business opportunities
Urban cleaning and waste management
Waste disposal
Energy
Urban runoff treatment and management

Sabesp´s vision of the future...
17

3.3. Challenges and opportunities

Key achievements since 2007...
Renewal of 156 concessions; commitment to renew the
remaining 210 by 2010
Pro-activity and partnership with clients and municipalities
Launching of focused and efficient investment programs
New products and services for environmental solutions
Strengthening corporate governance

Achieve universal coverage of core services by 2018...
111 municipalitiesalready
have full water and sewageservices
111 municipalitiesalready
have full water and sewageservices

São Paulo metropolitan region
Regional systems
Universal coverage will be achieved as a result of the implementation of structural programs...

Tietê program: one of the most ambitious environmental program for the Tietê Basin…
22
Period Phase Sewage collection Sewage treatment Investment
1992‐1998 1 70 ‐> 81% 24 ‐> 63% US$ 1,1 billion
2002‐2008 2 81 ‐> 84% 63 ‐> 70% US$ 500 million
2009‐2015 3 84 ‐> 88% 70 ‐> 79% *
* in negotiation
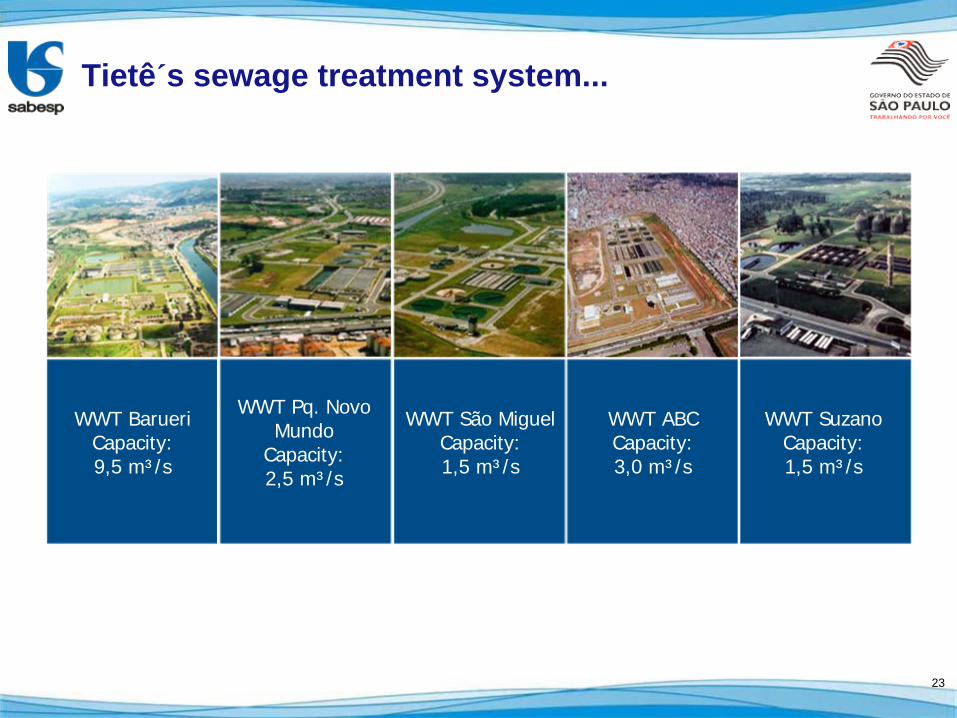
Tietê´s sewage treatment system...
23
WWT BarueriCapacity: 9,5 m³/s
WWT Pq. Novo Mundo
Capacity: 2,5 m³/s
WWT São MiguelCapacity: 1,5 m³/s
WWT ABCCapacity: 3,0 m³/s
WWT SuzanoCapacity: 1,5 m³/s

Investment in Baixada Santista region in 2007-11: US$ 780 million
Increase in sewage collection:to 95% from 53%
Onda Limpa (Clean Wave) program: one of the largests sanitation programs in Latin America…
24

02
Total investment plan of R$ 5.9 billion for 2007- 10
1,5911,745
1,574
960
Capex plan for 2007 – 2010…

26
Total debt´s average life of 7.2 years
Access to international and domestic capital markets and multilateral financing
83% of foreign currency debt is from multilateral financing
Total Debt BreakdownTotal Debt by Currency
Foreign Currency
Local Currency Local Capital
Markets
CEF and BB
Gov. Ag. Foreign
Others
Foreign Capital Markets
Gov. Ag. Local
Access to long term, low cost financing…

Water losses as “% of revenue” and “liters / connection x day”
Reduce water losses to enhance operational efficiency and financial and environmental sustainability...
27

Explore new business opportunities, such as the sale of wastewater reuse...
72%
12%9% 8%
5% 3.6% 1% 0.5%
Wastewater reuse / Treated wastewater

Explore new business opportunities, such as cooperation with other sanitation companies…
CORSAN -RS
CASAL -AL
CAGEPA - PB
signedto be signedbeing developed
CESAN - ES
CASAN - SC
CAERN - RN
CAERD - RO
SANESUL - MS
CAEMA - MA

Explore new business opportunities, such as the partnership with OHL and ETEP to undertake the sewage treatment services in Mogi-Mirim...

Remembering three highlights...
Sabesp is strongly committed to public policies and market
standards for efficiency and profitability
The new regulatory framework creates new challenges and
opportunities
Universal coverage of services and environmental solutions are
Sabesp´s top priorities
Brazil Day 2008 New York
October, 2008
ThankThank youyou!!
www.sabesp.com.brwww.sabesp.com.br

AnnexAnnex

34Note: Financials are in Brazilian Corporate Law.
(In R$ million)
*earnings per share
Financial Highlights
2003 2004 2005 2006 2007 1S08Net Revenues (R$) 4.130,8 4.397,1 4.953,4 5.527,3 5.970,8 3.053,4 EBITDA (R$) 2.076,5 1.927,0 2.285,6 2.446,0 2.698,9 1.410,4 EBITDA Margin (%) 50,3 43,8 46,1 44,3 45,2 46,2 Net Income (R$) 833,3 513,1 865,6 778,9 1.048,7 663,7 Net Margin (%) 20,2 11,7 17,5 14,1 17,6 21,7
Total Assets (R$) 16.590,1 16.783,8 17.431,1 17.999,9 18.663,4 18.702,1 Total Debt (R$) 7.264,3 7.050,7 6.664,2 6.326,7 5.685,2 5.801,4 Short-term Debt (R$) 997,0 1.496,8 759,0 852,5 742,1 1.131,9 Long-Term Debt (R$) 6.267,3 5.553,8 5.905,2 5.474,2 4.943,1 4.669,5 Foreign Currency Debt (R$) 3.012,7 2.680,9 1.575,9 1.472,2 1.242,3 1.391,2 Shareholders' Equity (R$) 7.576,9 7.951,6 8.482,5 9.018,5 9.784,0 10.247,0 Total Debt/Total Cap. (%) 48,9 47,0 44,0 41,2 36,8 36,1 Investments (R$) 594,0 601,0 678,2 904,9 921,1 583,0
Dividend Declared (R$/000 shares) 17,7 5,4 12,2 9,5 1,32* 0,88*Pay Out (%) 60,5 29,8 40,2 34,7 28,7 30,2
Dividend Yield (%) 10,8 3,4 7,8 3,2 3,2 2,2 Outstanding shares - 227.836.623Shares:ADR rate = 2:1

35
The US dollar-denominated debt is long-term and low cost (multilateral agencies). Currently, SABESP’s credit rating by S&P is brA+ (domestic) and BB- (international).
Year 2008 2009 2010 2011 2012 2013 2014 2015 2016 2017 2018 2019+Local Debt 282 1,240 820 865 455 453 141 22 19 19 20 76 Foreign Debt 43 60 60 100 102 102 102 102 325 78 59 256 Total 325 1,300 880 966 557 555 243 124 344 97 78 332
325
1,300
880 966
557 555
243124
344
97 7 8
332
Debt amortization profile…