Embed Size (px)
Citation preview
Surface Science 63 (1977) 377-389 0 North-Holland Publishing Company
EQUILIBRIUM SURFACE SEGREGATION OF DISSOLVED NONMETAL
ATOMS ON IRON( 100) FACES
H.J. GRABKE, W. PAULITSCHKE, G. TAUBER and H. VIEFHAUS Max-Planck-Institut fur Eisenforschung GmbH, Max-Planck-Strasse I, D-4000 Diisseldorf, Germany
At elevated temperatures equilibria of surface segregation X (dissolved) = X (adsorbed) have been studied for the nonmetal atoms X = C, N and S. Iron single crystals with (100)orientation have been doped with different concentrations of solute atoms (in the range about lo-100 wt ppm). The samples were introduced into the UHV chamber, cleaned and then heated to tem- peratures in the a-solid solution range. The surface concentration of the segregated nonmetal atoms was observed by AES for different bulk concentrations in dependence of the temper- ature. The LEED pattern was also observed during segregation equilibrium at temperatures up to about 750°C. The LEED patterns indicate a c(2 X 2) structure for carbon and nitrogen as weIl as for sulfur. The temperature dependence of the surface concentration for carbon on Fe(100) can be described by a Langmuir-McLean equation, an average segregation enthalpy of -85 kJ/mol”C is obtained. Since N2 desorption occurs the nitrogen segregation is in virtual equilibrium only at temperatures <5OO”C. The equilibrium surface concentration of sulfur on a-iron is virtually independent of the solute concentration and the temperature: there is always a saturated layer of sulfur on the (100) faces, even at smalI bulk concentrations. Since the thermodynamic activity of the nonmetal atoms is well defined in the segregation studies (except nitrogen at higher temperatures) , the results can be correlated with studies in gas atmospheres at atmospheric pressure. The relations to the kinetics of the carburization and the nitrogenation of iron are discussed and the influence of sulfur on these reactions.
1. Introduction
Chemisorption equilibrium on metal surfaces can be studied by LEED and AES by establishing the equilibrium of surface segregation
X (dissolved) f?I X (adsorbed) . (1)
This can be done on single crystal surfaces in UHV and should lead to the same adsorption states of the atom A as equilibrium adsorption from the gas phase [l]. The results reported here are part of studies on surface segregation of carbon, nitro- gen, sulfur and oxygen on iron single crystals [2-4]. The equilibrium surface con- centrations were measured by AES and the chemisorption structures observed by LEED.
Equilibrium segregation in a binary alloy occurs under conditions corresponding to the terminal solid solution in the phase diagram. The range of temperature and concentration for equilibrium segregation studies in the systems Fe-C [S], Fe-N
377
378 1I.J. Grabke et al. 1 Equilibrium surface segregation
I IX + GraphIt
500 I
I 400
300
i,.
500 I
LOO k
300 I
0 100 200 0 500 1000 0
ivm C wm N
a + Fe5
:oo 200 300
ppm S
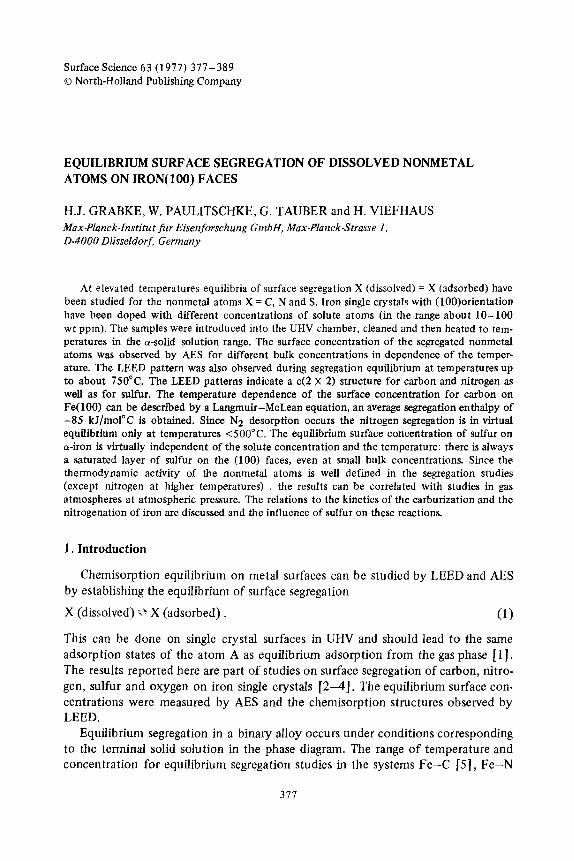
Fig. 1. Limits of the solid solubility of C, N and S in or-iron.
[6], and Fe-S [7] is shown in fig. 1. This figure shows the limits of solid solubil- ity of the solute X = C, N or S in a-iron, beyond which the formation of com- pounds or the transformation to y-iron occurs. In the case of the system Fe-C, graphite was formed on the surface of saturated &-Fe and not cementite (Fe&). Only results for the orientation Fe(lOO) will be reported, since their interpretation is clear. These results can be correlated with surface reaction studies at atmospheric pressure on iron foils [g-12].
2. Experimental
Iron specimens of (100) orientation were prepared from single crystals by orient- ing, cutting and mechanical polishing. The specimens were doped with well defined concentrations of carbon, nitrogen or sulfur by equilibration in flowing CH4-Hz [13], NH3-H2 [14], or H&H2 [15] g as mixtures at high temperatures. The
doped samples were mounted on a small heating stage which could be inserted into the UHV system through an airlock [16]. After removing the surface impurities by argon ion bombardment and annealing, the samples were heated into the solid solution range shown in fig. 1. Auger electron spectra were obtained at each
H.J. Grabke et al. /Equilibrium surface segregation 379
temperature; the LEED pattern could also be observed at temperatures up to about 750°C.
Because of the high diffusion coefficient of carbon in o-iron [ 171 the segregation equilibrium is established quickly. The desorption of carbon is negligible, since the vapor pressure of carbon is extremely low. In contrast, the equilibrium pressure of N, is rather high over solid solutions of nitrogen in a-iron. Beyond the line for the
equilibrium Nz (1 atm) + 2N’(dissolved) shown in fig. 1, the equilibrium pressure
of N, is >l atm, and increases to about lo4 atm with increasing concentration of N. Because the activation energy for desorption is high, the rate of desorption of N, from iron is rather slow; nevertheless desorption becomes considerable at tem- peratures >.500°C [9]. For the system Fe-N the true segregation equilibrium could therefore be measured only below this temperature. At temperatures below 700°C the segregation of sulfur fortunately occurs very slowly, since the diffusion coeff- cient of sulfur [18] is small compared to the diffusion coefficients of carbon and nitrogen [ 171. Otherwise, no measurements of carbon and nitrogen segregation would have been possible. The iron specimens always contain traces of sulfur, and after a sufficiently long time sulfur, which is highly surface active, would displace
all other segregated atoms. The segregation of sulfur was studied at temperatures between 700-900°C where equilibrium is established sufficiently quickly. The equilibration time (as calculated and observed) is in the range l/2 h to several
hours, depending on temperature and bulk concentration (>lO ppm). The vapor pressure of Sz is in the range psl G 10-l ’ atm, but no influence of sulfur evapora- tion on the segregation was detected.
3. Results
The LEED patterns as observed at the equilibrium temperature indicate a c(2 X 2) structure for C, N and S on the Fe(lOO) surface. Within the solid solution
range in each case only the c(2 X 2) structure was observed, independent of the bulk concentration of the nonmetals and of the temperature. This result shows that only one adsorption structure is thermodynamically stable for each system, Fe-C, Fe-N, and Fe-S.
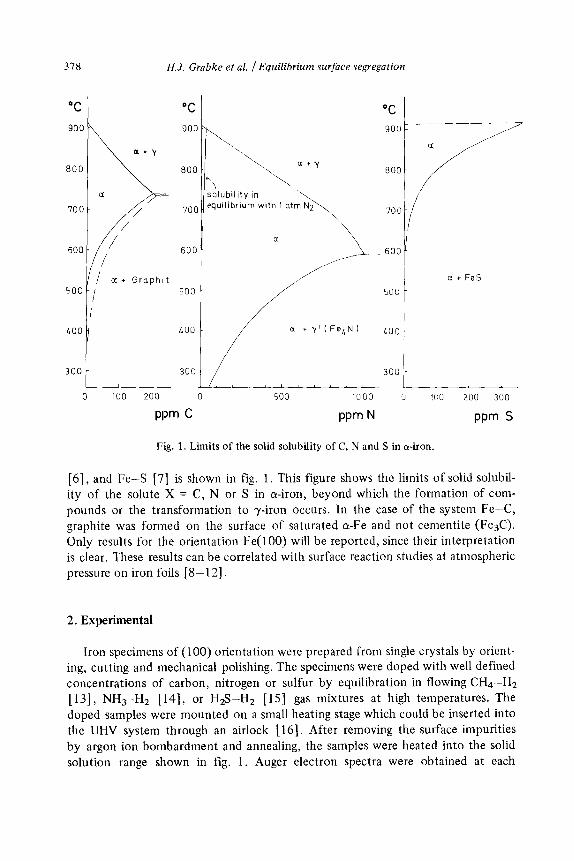
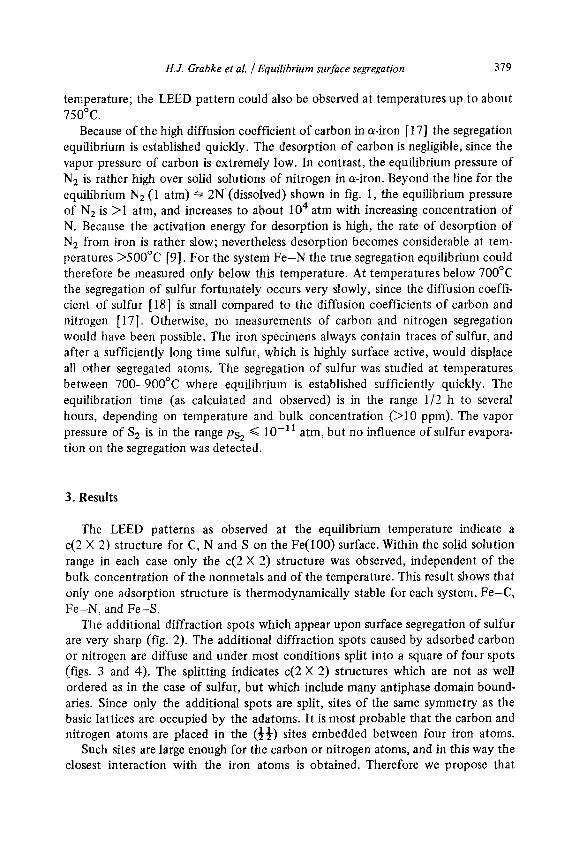
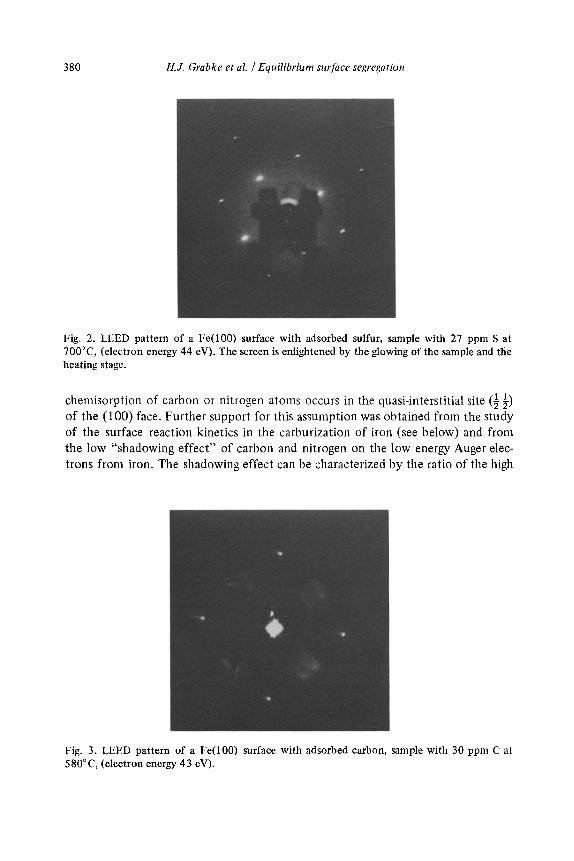
The additional diffraction spots which appear upon surface segregation of sulfur are very sharp (fig. 2). The additional diffraction spots caused by adsorbed carbon or nitrogen are diffuse and under most conditions split into a square of four spots (figs. 3 and 4). The splitting indicates c(2 X 2) structures which are not as well ordered as in the case of sulfur, but which include many antiphase domain bound- aries. Since only the additional spots are split, sites of the same symmetry as the basic lattices are occupied by the adatoms. It is most probable that the carbon and nitrogen atoms are placed in the (34) sites embedded between four iron atoms.
Such sites are large enough for the carbon or nitrogen atoms, and in this way the closest interaction with the iron atoms is obtained. Therefore we propose that
380 H.J. Grabke et al. /Equilibrium surface segregation
Fig. 2. LEED pattern of a Fe(100) surface with adsorbed sulfur, sample with 27 ppm S at 7OO”C, (electron energy 44 eV). The screen is enlightened by the glowing of the sample and the heating stage.
chemisorption of carbon or nitrogen atoms occurs in the quasi-interstitial site (ii) of the (100) face. Further support for this assumption was obtained from the study of the surface reaction kinetics in the carburization of iron (see below) and from the low “shadowing effect” of carbon and nitrogen on the low energy Auger elec- trons from iron. The shadowing effect can be characterized by the ratio of the high
Fig. 3. LEED pattern of a Fe(100) surface with adsorbed carbon, sample with 30 ppm C at 58O”C, (electron energy 43 eV).
H.J. Grabke et al. /Equilibrium surface segregation 381
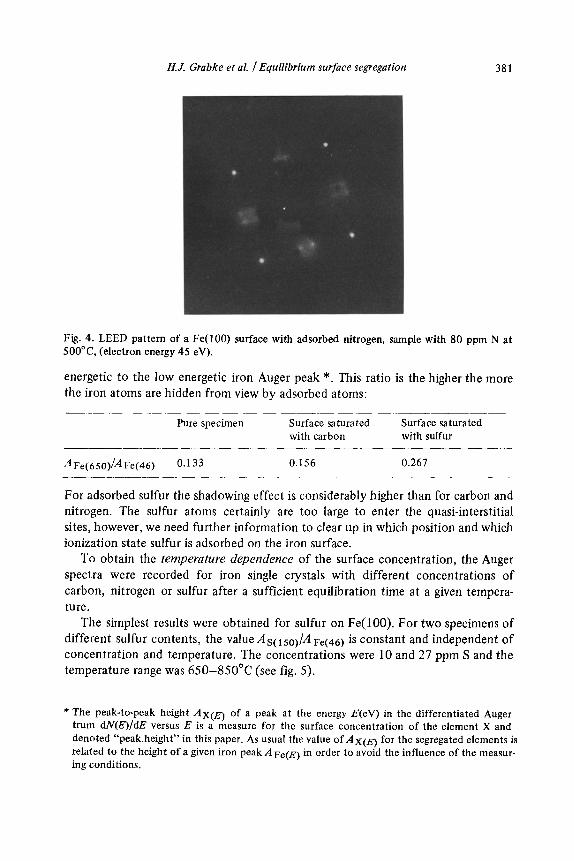
Fig. 4. LEED pattern of a Fe(lOO) surface with adsorbed nitrogen, sample with 80 ppm N at 5OO”C, (electron energy 45 eV).
energetic to the low energetic iron Auger peak *. This ratio is the higher the more the iron atoms are hidden from view by adsorbed atoms:
Pure specimen Surface saturated Surface saturated with carbon with sulfur
AFe(650)/AFe(46) 0.133 0.156 0.261
For adsorbed sulfur the shadowing effect is considerably higher than for carbon and nitrogen. The sulfur atoms certainly are too large to enter the quasi-interstitial sites, however, we need further information to clear up in which position and which ionization state sulfur is adsorbed on the iron surface.
To obtain the temperahue dependence of the surface concentration, the Auger spectra were recorded for iron single crystals with different concentrations of
carbon, nitrogen or sulfur after a sufficient equilibration time at a given tempera- ture.
The simplest results were obtained for sulfur on Fe(lOO). For two specimens of
different sulfur contents, the value As(rsO)/A Fe(46) is constant and independent of concentration and temperature. The concentrations were 10 and 27 ppm S and the temperature range was 650-85O’C (see fig. 5).
* The peak-to-peak height AX(q of a peak at the energy E(eV) in the differentiated Auger trum (wQ/dE versus E is a measure for the surface concentration of the element X and denoted “peak height” in this paper. As usual the value of AX(E) for the segregated elements is related to the height of a given iron peak AF~Q in order to avoid the influence of the measur- ing conditions.
382 H.J. Grabke et al. /Equilibrium surface segregation
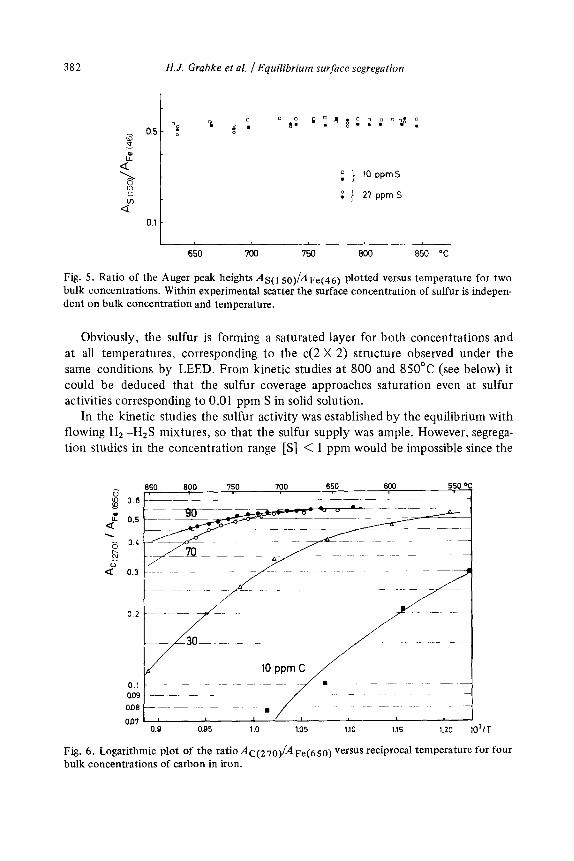
I 650 700 750 800 850 “C
Fig. 5. Ratio of the Auger peak heights As(~ ~o)/AF~(~Q plotted versus temperature for two bulk concentrations. Within experimental scatter the surface concentration of sulfur is indepen- dent on bulk concentration and temperature.
Obviously, the sulfur is forming a saturated layer for both concentrations and at all temperatures, corresponding to the c(2 X 2) structure observed under the same conditions by LEED. From kinetic studies at 800 and 850°C (see below) it could be deduced that the sulfur coverage approaches saturation even at sulfur activities corresponding to 0.01 ppm S in solid solution.
In the kinetic studies the sulfur activity was established by the equilibrium with flowing Ha-Has mixtures, so that the sulfur supply was ample. However, segrega- tion studies in the concentration range [S] < 1 ppm would be impossible since the
0’ cfl 9 0.6
If a 0.5
. o^ 04
k
P 0.3
6 I-
0.2
0.1
009
0.08
OD7
150 800 750 700 650 600 550%
Fig. 6. Logarithmic plot of the ratioAC(z,0)/AFe(650) versus reciprocal temperature for four bulk concentrations of carbon in iron.
H.J. Grabke et al. /Equilibrium surface segregation 383
supply of sulfur in the bulk is insufficient to saturate the surface in a reasonable time (some hours).
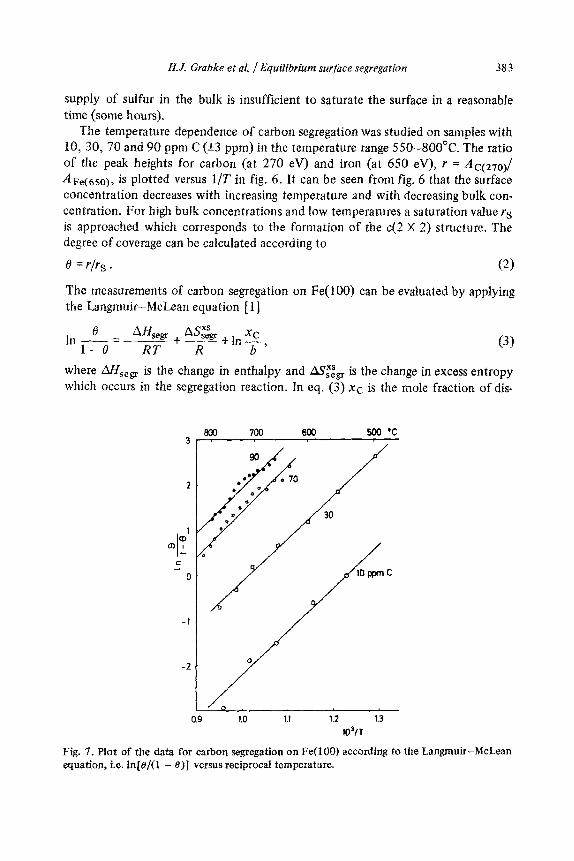
The temperature dependence of carbon segregation was studied on samples with IO, 30, 70 and 90 ppm C (53 ppm) in the temperature range 550400°C. The ratio of the peak heights for carbon (at 270 eV) and iron (at 650 eV), r = AC(s7e)/ At+(ese), is plotted versus l/T in fig. 6. It can be seen from fig. 6 that the surface concentration decreases with increasing temperature and with decreasing bulk con- centration. For high bulk concentrations and low temperatures a saturation value rs is approached which corresponds to the formation of the c(2 X 2) structure. The degree of coverage can be calculated according to
8 = Y/i-s . (2)
The measurements of carbon segregation on Fe(lOO) can be evaluated by applying the Langmuir-McLean equation [ I]
e In - AKWr + A%& _ __ ti2-
L--8 RT R b ’ (31
where AHSegr is the change in enthalpy and AS& is the change in excess entropy which occurs in the segregation reaction. In eq. (3) xc is the mole fraction of dis-
800 700 6W 500 ‘C r
Fig. 7. Plot of the data for carbon segregation on Fe(lO0) according to the Langmuir-McLean equation, i.e. ln[@/(l - @)I versus reciprocal temperature.
384 H.J. Grabke et al. /Equilibrium sur]bce segregation
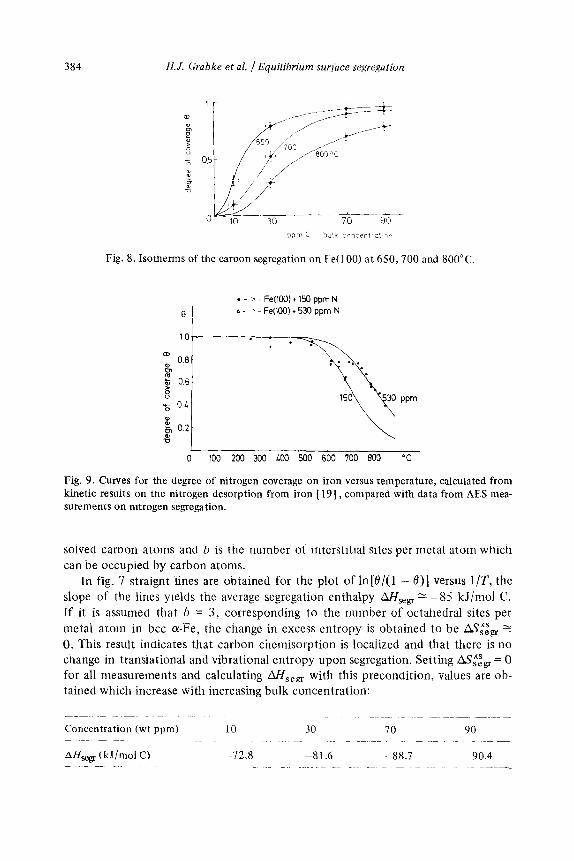
Fig. 8. Isotnerms of the caroon segregation on b’e(100) at 650,700 and 800°C.
.- x-Fe(lW+l'jOppmN
9 a- e-Fe(lOO)+SZOppm N
10
0 100 200 300 Loo 500 600 700 800 "C
Fig. 9. Curves for the degree of nitrogen coverage on iron versus Temperature, calculated from kinetic resuits on the nitrogen desorption from iron [ 191, compared with data from AES mea- surements on nitrogen segregation.
solved caroon atoms and b is the number of interstitial sites per metal atom which can be occupied by carbon atoms.
In fig. 7 straignt iines are obtained for the plot of ln[e/(l - 0)] versus l/T, the slope of the lines yields the average segregation enthalpy AHSgr z -85 kJ/mol C. If it is assumed that b = 3, corresponding to the number of octahedral sites per metal atom in bee o-Fe, the change in excess entropy is obtained to be AS$, 2 0. This result indicates that carbon chemisorption is localized and that there is no change in transiational and vibrational entropy upon segregation. Setting AS,“,s, = 0 for all measurements and calculating AHSepr with this precondition, values are ob- tained which increase with increasing bulk concentration:
-_ ~ ~~ Concentration (wt ppm) 10 30 70 90
AH- (kJ/mol C) -72.8 -81.6 -88.7 -90.4
H.J. Grabke et al. / Equiliurium sur]ace segregation 385
As the surface concemrarion is higher for high bulk concentrations, this result shows that the cnemisorption structure is stabilized by interaction of the adsorbed C atoms at high coverage. This is in agreement with the shape of the isotherms (fig. 8) as constructed from fig. 6.
The corresponaing values of AHSegr and AS& for nitrogen segregation could
not be obtained from AI3 measurements since in the nigh rernperature range nitro- gen desorpuon occurs and in the iow temperature range only saturation coverage could be observed. But kineric studies (see beiow) rendered data on the nitrogen segregation which are weli in agreement with the available Al3 measurements (fig.
9).
4. Relationship of surface segregation and surface reaction kinetics
The results on suri’ace segregation can be reiated to the kinetics of two impor- tant reactions: the carourizarion and decarburization of iron according to
CH 4 =+ C (dissolved) + 2 H, , (4)
and the nitrogenation and denitrogenation according to
Nz + 2 N (dissolved) . (5)
These reactions can be measured under conditions where the surface reactions, decomposition and formation of the molecules, are rate determining. Gravimetric and resistometric techniques have been applied [g-12]. For reaction (4) the rate equation has been obtained
u = dnc/A dt = kPc&‘~;- k’~$ [c] . (6)
The net rate v of carbon absorption per umt area A is given by the difference of an expression for the forward reaction and an expression for the back reaction. Here k
and k’ are rate constants, pCH4 and pHP are partial pressures of the gases, and [C] is the concentration of caroon in the solid solution.
It has been shown [8,10,1 I] that this equation is associated with the rate- deterrnmmg step
CHs (adsorbed) =+ CH* (adsorbed) + H (adsorbed) (7)
in the stepwise dehydrogenation of methane or hydrogenation (in the back reac- tion) of carbon on iron. According to rate equation (6) the forward reaction rate is independent of carbon concentration. With increasing carbon concentration no retardation of the carbon transfer occurs. This has been proved for the temperature range 500-800°C [ 11 J in which according to the segregation experiments (fig. 6) the adsorption sites for carbon atoms will be nearly saturated when the bulk con- centration N 100 ppm is reached. Therefore, the rate limiting step of reaction (4) does not take place on the sites in which the carbon atoms are chemisorbed. This
386 NJ. Gvabke et al. /Equilibrium surface segregation
conclusion is consistent with our model for the chemisorption of carbon atoms in the quasi-interstitial site (*k) of the (100) face and the mechanism of the carburiza- tion in which the decomposition of CHs (adsorbed) is rate determining. This reac- tion step must occur on the outer surface since the CHs radical cannot enter the adsorption sites of the carbon atoms.
In contrast, the rate determining step of the nitrogenation (5) presumably occurs on the interstitial sites of the iron surface where nitrogen atoms can be adsorbed.
This can be seen from the rate equation [9,19]
hN U=---=k PN2
A dt 1 +K [N] _ k’ ?!N]2_ .
1 +K [N] (8)
The rate of the forward reaction is retarded with increasing bulk concentration [N], presumably because reaction sites are occupied by nitrogen atoms which are in
segregation equilibrium with the bulk. The rate determining step, the dissociation of the nitrogen molecule, takes place when one of the nitrogen atoms can enter the interstitial site in the surface. The nitrogen atoms in these interstitial sites also par-
ticipate in the backward reaction, the desorption of nitrogen. Therefore, from the kinetic results information can be obtained on the segregation equilibrium
N (dissolved) f N (chemisorbed) (9)
The constant K in rate equation (8) is the equilibrium constant of the segregation reaction. From nitrogen desorption measurements the temperature dependence of the constant K could be determined [19]; the value AHseQ N -109 kJ/mol N was obtained for the segregation of the nitrogen atoms which are participating in reac- tion (5). This result can most probably be correlated with the observations on nitro- gen segregation on Fe( 100) surfaces. Using the value of K from the kinetic measure- ments [19] curves have been calculated for the degree of coverage e,(r) in depen- dence on temperature. These curves are well in agreement with values obtained by AES measurements (see fig. 9). Since the nitrogen dissociation on iron is the rate determining step of the ammonia synthesis, these results are most important for understanding the mechanism of this process [ 191.
The reactions (4) and (5) are strongly retarded by the presence of sulfur. This was shown by studying these reactions on thin iron foils in flowing gas mixtures and imposing a sulfur activity by a well controlled HaS/Ha ratio in the gas stream. The chemisorption equilibrium is established by the reaction
HaS + Hz + S (chemisorbed) , (10)
which should lead to the same adsorption state and coverage as in the case of segre- gation. By recrystallisation the iron foils had a preferential (100) orientation. Fig.
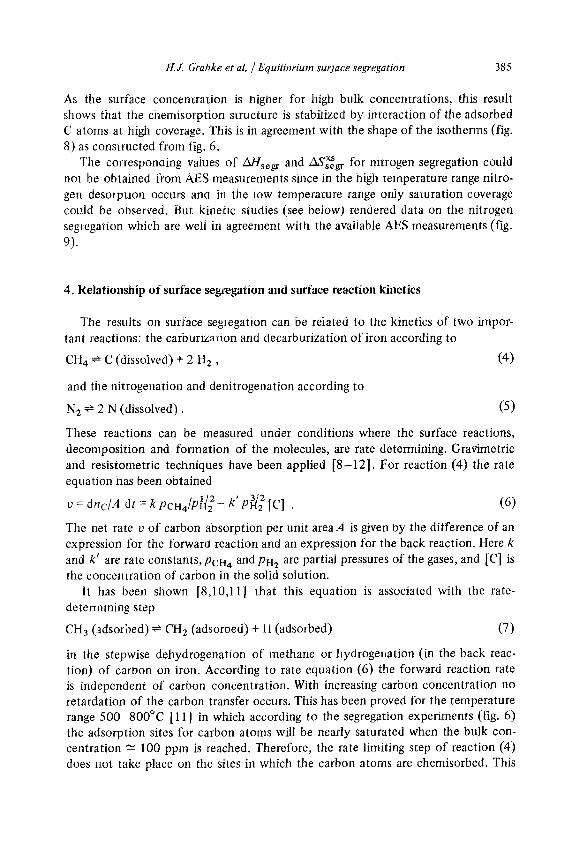
10 shows the initial rate of carburization in a CH4-Ha-Has mixture as a function of the HaS/Hz ratio. It can be seen that at 800°C retardation of the reaction (4) occurs even at very low sulfur activities. The ratio p~~~/p~~ = 10e7 at which retardation becomes considerable corresponds to a sulfur concentration of z 0.01
H.J. Grabke et al. /Equilibrium surface segregation 387
10-g 1,O’ , -6 PHZS IP”z
0.001 0.01 01 pns
0.1 1
8WC b = 127pm
““‘iL---_- > ,,1
IO'J 10-J 10-a sulfur actwty ( standard state:Fe - FeS equilibrium I
Fig. 10. Initial rate of the carburization of iron foils (thickness 6 = 12.7 pm) in CH4-H2-H2S mixtures, plotted double logarithmically versus sulfur activity.
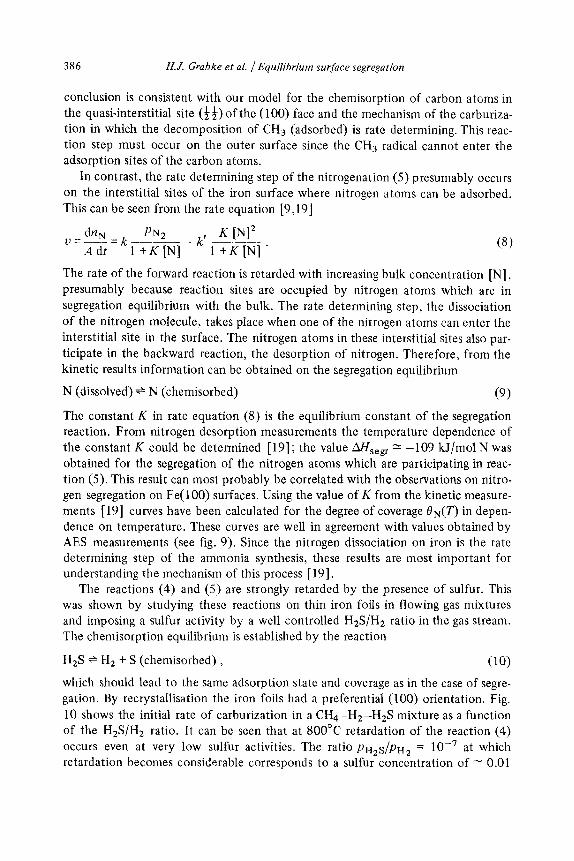
ppm in the bulk phase. The influence on reaction (5) is analogous. The nitrogena- tion has been measured at 85O’C in a mixture of Na, Hz and H$S, and the initial rate of nitrogenation is plotted versus ~~~~~~~~ in fig. 11. The retardation begins in the same range of sulfur activity as for reaction (4). The effect of sulfur on reaction (5) is even stronger than on reaction (4).
These results are in agreement with our LEED and AES studies on o-iron, in which saturation coverage was always observed, even for low bulk sulfur concen-
10-s L sulfur activity (standard %te: Fe - FeS equili briuk!-
3
Fig. 11. Initial rate of the nitrogenation of iron foils (thickness 6 = 12.7 pm) in N2-H2-H2S mixtures, plotted double logarithmically versus sulfur activity.
388 H.J. Grahke ef al. / E;quilibrium surface sepegation
trations. The kinetic results show that further sulfur segregation studies are sense- less, at least on a-iron below 900°C for there will always be saturation on the sur- face. Under these conditions, no dependence of segregation on the t~nl~e~ture or bulk concentrations will be observed.
5. Conclusions
Carbon or nitrogen atoms are adsorbed on F~(lOO) in domains, ordered in a c(2 X 2) structure. The segregation equilibria approximately can be described by the Langmuir-McLean equation. Data for the segregation of carbon were obtained from AES studies, data for the segregation of nitrogen were derived from AES and kinetic studies on the N, desorption. From the combination of LEED, AES and kinetic studies it was deduced that the carbon and the nitrogen atoms are placed in
the quasi-interstitial sites (&$) of the Fe(lOO) plane elnbedded between four iron atoms.
Sulfur is also adsorbed on Fe(lOO) in a c(2 X 2) structure. The layer is well ordered and saturated even up to 9OO’C and for very low sulfur activities. From kinetic studies on the influence of sulfur on surface reaction kinetics it was con-
cluded that at 8OO’C the saturation is approached already at ~~,~/~r-f~ N 2 X 10e7 corresponding to a bulk concentration a.01 ppm S.
Acknowledgement
Financial support of this work by the A.I.F. with funds from the ~ul~desmi~lister fiir Wirtschaft, Fed. Rep. Germany, is gratefully acknowledged.
References
[l] J.M. Blakely and J.C. Shelton, ~qu~ibrium Adsorption and Segregation, in: Surface Physics of Materials, Vol. I, Ed. J.M. Hlakely (Academic Press, 1975).
[2] H. Viefhaus, G. Tauber and H.J. Grahke, Microchim. Acta (Wien) Suppl. 6 (1975) 383. [3] H.J. Grabke, G. Tauber and H. Viefhaus, Scripta Met. 9 (1975) 1181. [4] H.J. Grabke, W. Paulitschke and S.R. Srinivasan, in: Proc. 8th Intern. Symp. Reactivity
of Solids, Gothenburg, 1976 (to be published). IS] J.C. Swartz, Trans. Met. Sot. AIME 245 (1969) 1083. [6] M. Hillert and M. Jar& Met. Trans. 6h (1975) 553. [7] N.G. Ainslie and A.V. Seybolt, J. Iron Steel Inst. (1960) 341. [S] H.J. Grabke, Ber. Bunsenges. Physik. Chem. 69 (1965) 409. [9 J H.J. Grabke, Ber. Bunsenges. Physik. Chem. 72 (1968) 533,541.
[lo] H.J. Grabke, Met. Trans. 1 (1970) 2972. [ll] H.J. Grabke and E. Martin, Arch. Eisenhiittenwes. 44 (1973) 837. [ 121 H.J. Grabke, Arch. Eisenhdttenwes. 46 (1975) 75.
H.J. Grabke et al. / Equilibrium surface segregation 389
[13] R.P. Smith, J. Am. Chem. Sot. 68 (1946) 1163. [ 141 E. Lehrer, 2. Elektrochem. 36 (1930) 383. [15] T. Rosenquist and B.L. Dunicz, J. Metals Trans. AIME (1952) 604. [16] G. Tauber and H. Viefhaus, Rev. Sci. Instr. 47 (1976) 772. [ 171 A.E. Lord and D.N. Beshers, Acta Met. 14 (1966) 1659. [18] S.J. Wang and H.J. Grabke, Z. Metallk. 61 (1970) 597. [19] H.J. Grabke, Z. Physik. Chem. NF 100 (1976) 185.
Discussion
S. Hofmann (Stuttgart): Why do you use the Auger peak-to-peak height ratio AJA ~~ as a mea- sure of 0? The coverage 0 should be proportional to the value of the segregant peak-to-peak height, A,, and not to the ratio AC/A p, since the 650 eV Fe Auger signal will be decreased by increasing coverage with C. In the special case you discussed here this influence may be within the experimental error, but in general 0 0~ Asegregant will be the more correct relation.
H. Viefhaus: We didn’t see any influence of the carbon coverage on the peak height of the Fe 650 eV Auger peak. This confirms our interpretation for the adsorption site of the carbon atom on the Fe(100) surface. The “shadowing effect” for the Fe substrate is only very small.