Embed Size (px)
Citation preview
Hitotsubashi University Repository
TitleEquilibrium in International Trade: A Diagrammatic
Analysis of the case of Increasing Cost
Author(s) Kojima, Kiyoshi
Citation The Annals of the Hitotsubashi Academy, 6(1): 27-42
Issue Date 1955-10
Type Departmental Bulletin Paper
Text Version publisher
URL http://doi.org/10.15057/11833
Right
EQUILIBRIUM IN INTERNATIONAL TRADE : A DIAGRAMMATIC ANALYSIS
OF THE CASE OF INCREASlNG COST
By KIYOSHI KOJIMA A**i*tant P.,f,ssor nf I~t,.^oti.nal L;cono~*i'*
The diagrammatic analysis of the equilibrium condition of and the gain
from international trade has been developed with reference to the case of increasing cost.1 The case of increasing cost is most convenient to deal with, because a double maximum condition required for the maximisation of entrepreneurial surplus and satisfactions are explained by the equi=marginal princ i ple .
It is the purpose of this paper to attempt a simple and exact diagram-matic representation of equilibrium and gain in international trade in the
case of increasing cost. A rigorous mathematical model is provided in Appendix. It is not the purpose of this paper to add new findings to the analysis hitherto develope'd, but to present a fundamental chart, particularly
a compound offer curve, for the analysis of transfer problem, optimum tariff, technological improvement, economic growth, and so forth.
Although the analysis is extended to a three country trade in the last
part of this paper, we shall confine ourselves to the models in which two
countries (say England and German as assumed by J. S. Mill) trade with respect to two commodities (say, E-goods and G-goods) which are produced with increasing costs. Each country is, however, assumed to be a single unit, as if it were an individual, or to be consisted of individuals who are exactly
alike. Each country is further assumed to have the utility function or com-munity preference scale of its own, although we do not have any intention
* Among the contributions to this subject, the following are important : ¥Vassily W. Leontief, "The Use of Indifference Curves in the Analysis of Foreign Trade," Quarterly Journal of ~conomics, 1933, reprinted in Readi,egs i,e the Theory of Interfeational Trade, ed. H. S. Ellis and Lloyd A. Metzler, 1949. Abba P. Lerner, "The 'Diagrammatical Representation of Cost Conditions in International Trade," Economica. Aug. 1932 ; " The Diagrammatical Representation of Demand Conditions in International Trade," L;conomica, Aug. 1934 ; both are reprinted in L;ssays i,4 L;conomic Analysis, Macmillan, 1953. R. E. Baldwin, "Equilibrium in International Trade : A Diagrammatic Analysis," Quarterly Journal of L;conomics, Nov. 1948. Gottfried Haberler, "Some Problems in the Pure Theory of International Trade," L;conomic
Jouneal. June 1950. , J. E. Meade, A Geometry of International Trade, Georg~ Allen & Unwin, 19J*2. Charles F. Haywood and Theodore K. Ruprecht, "A Note on the Use of the Box Diagram in International Trade Theory," America,4 ~co'tomic Review. June 1954.
28 THE ANNALS OF THE HITQTSUBASHI ACADEMY 【October
to inquire into the way of constructing the community preference scale.
All the models in this paper represent a static general e(luilibrium system,
in which production functioa,utility function,and pre-trade quantity of pro-
duction and consumption and prices are given at the outset. It is assumed
that both countries behave to maximise the sum of their gains from trade
and to keep the balance of trade in equilibrium. It is also assumed,as
usually done,that transportation costs and trade barriers do not exist.
1. 1吻4θ」∫’ P%グθ 5】クθ65α」φεα面o弼 E‘じ‘hα弼9θ
Let us suppose that two countries exchange between each other the
increment of production,in which each country has a comparative advant-
age,so as to maximise their entrepreneurial surplus。 The entrepreneurial
surplus means the difference between the revenue from exports an(i cost
needed to produce the exports,the revenue and cost being measured in terms
of num6raire(E-goods).We have then a pure specialisation exchange model.
It serves to explain the gain from the international division of labor carried
along the line of comparative advantage,since it does not take into consi-
deration changes in the consumption of both countries.
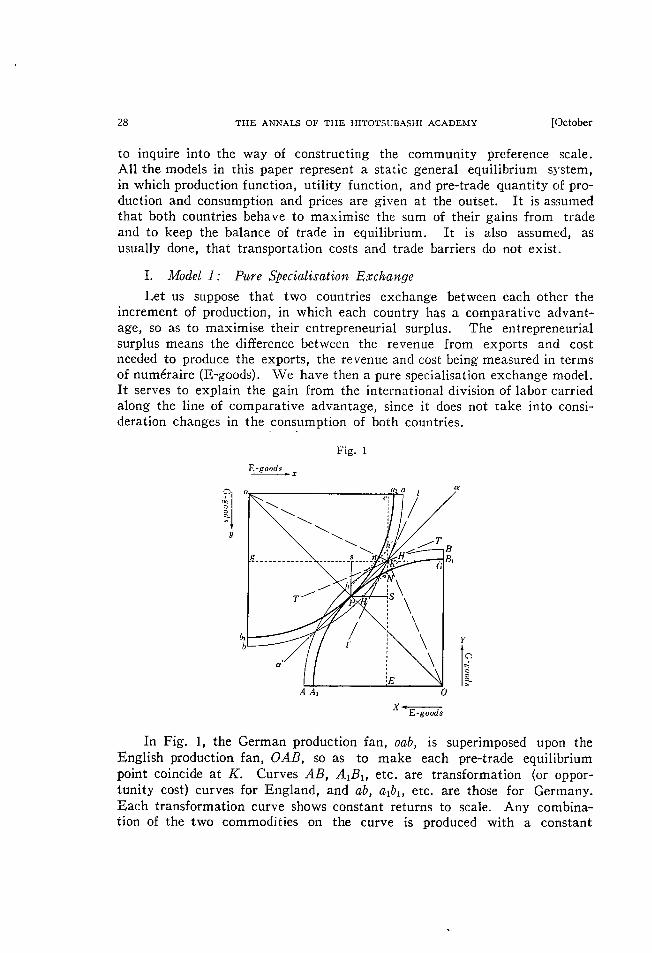
Fig.1
E-goor’5一一一一一一一 エ
OlIIIIII亨9
0・讐ミ㌃
畠ゐ
歎/髭
伊--…,,彰鴇ー
\㎜、
\sT
\ …
\ ㎜
\ …
コ
\ …
り
\ }
8-
…\ / 占
丁/ i\
/ …\
まI i \
α i \ lE
r9
B島
α
γ匿!1、41 0
X一一一 E・800ゴ3
In Fig.1,the German production fan,oの,is superimposed upon the
English production fan,α4β,so as to make each pre-trade equilibrium
point coincide at K.Curves∠4.β,141β1,etc.are transformation(or oPPor-
tunity cost)curves for Englan(i,an(iαわ,αψ1,etc。are those for Germany.
Each transformation curve shows constant retums to scale.Any combina-
tion of the two commodities on the curve is produce(1with a constant
1955] I~;QUILIBRIUM IN' INTERNATIONAL TRADE 29
amount of resources (or " bales " in Marshallian terminology). The trans-formation curve is concave to the origin because of the law of diminishing
returns to varying proportions of production factors, or, because of the increasing cost for each commodity.2 For the simplicity and exactness of charting, the transformation curves are supposed to be a concentric circle, the center of which is the origin, O for IE;ngland and o for Germany.
The pre-trade equilibrium is seen at K for both countries. England produced 0L; of I~;-goods and OG of G~goods at a price ratio shown by the slope of TT/ Iine, which is tangent to the transformation curve AB. Ger-many produced oe of I~;-goods and og of G-goods at a price ratio shown by the slope of ti/ Iine, which is tangent to the transformation curve ab.
Connecting the origins of both countries, we have a line Oo, which may
be called the producer's coeetract curve. The transformation curve of the two countries is always tangent to each other on Oo line, and, consequently,
the equilibriurn of trade falls on this line.
We may consider two cases for Model I. Model IA. Let us suppose that the two countries minimise the resources
required to obtain through trade the same cornbination of the two commo-dities as they had before the openin"> of trade.3 Then, the trade gives rise
to the economy of resources for both countries. In Fig. 1, the above assumption takes the form that both countries
are ready to obtain the combination of commodities at K. Let us draw a line aa/, the international price line, passing through K perpendicularly at
P to Oo line. P is the new production point for both countries. Since the line ad is tangent at P to the transformation curves of the two countries, AIBI for ~;ngland and blal for Germany, the new production point Psatisfies such a required equilibrium condition that the marginal rate of production substitution between the two commodities is equal in both countries to the
international price ratio.
Because of the above assumption, the difference of quantity of the two
commodities at P and at K is counterbalanced in the following way. Eng-land exports PS of E-goods in exchange for SK of G-goods, while Germany exports Ps (=SK) of G-goods in exchange for SK (=PS) of E-goods. The ratio of PS of E-goods to SK of G-goods is equal to the international price
ratio, which is represented by the slope of the line ad. The trade is
therefore balanced. The gain from the trade may be seen as the economy of resources for
' See, Paul A. Samuelson, Foundations of ~;cotzomic Ae~alysis, Cambridge, Harvard Univer-
sity Press, 1948, pp. 233-235. ' Harrod provides us with a formula ¥~'hich determines the equllibrium price ratio from
ordinar)' cost-and-quantity suppl)' schedules under simplified assumptions. One of his assumptions
is that the total producticn of the palticipants as a whole remains the same. See R. F. Harrod, h2terltatiolsal L;cotfoe'~ics, 1939, pp. 22-35 and Appendix (pp. 201-203). Our Model IA is accord
lvith his assumptions.
30 THE ANNALS OF TH~ HITOTSUBASHI ACADl~MY [Oetober
both countries, which is shown by the lowering of the transformation curve,
from AB to AIBI for England and from ba to blal for Germany. The gain from the trade may, however, be measured more exactly as
the entrepreneurial surplus. Let the intersection of the transformation curve
AIBI with vertical line KL; be N. Passing through N, Iet us draw line HNH! in parallel to the international price line ad. As is clear from the transformation curve, PS of E-goods is produced with the same resources as required to produce SN of G-goods. In other words, the cost of PS of E-goods is SN of 'G-goods. SN of G-goods is, however, equal to HS of E-goods
in terms of the international price ratio. Therefore, the entrepreneurial
surplus for. England is PS-HS=PH or KH/ in terms of E-goods (num~raire). If we calculate the entrepreneurial surplus for Germany in a similar way
as above, it will be leK in terms of Elgoods. The sum of the entrepreneurial
surplus of the two countries is eeK+KH/=,eH/ in terms of E-goods. If we measure the entrepreneurial surplus in terms of G-goods, it will be NK for England and Kh/ for Germany, their sum being Nh/. It is clear that the entrepreneurial surplus in this case is the same as the resources saved.
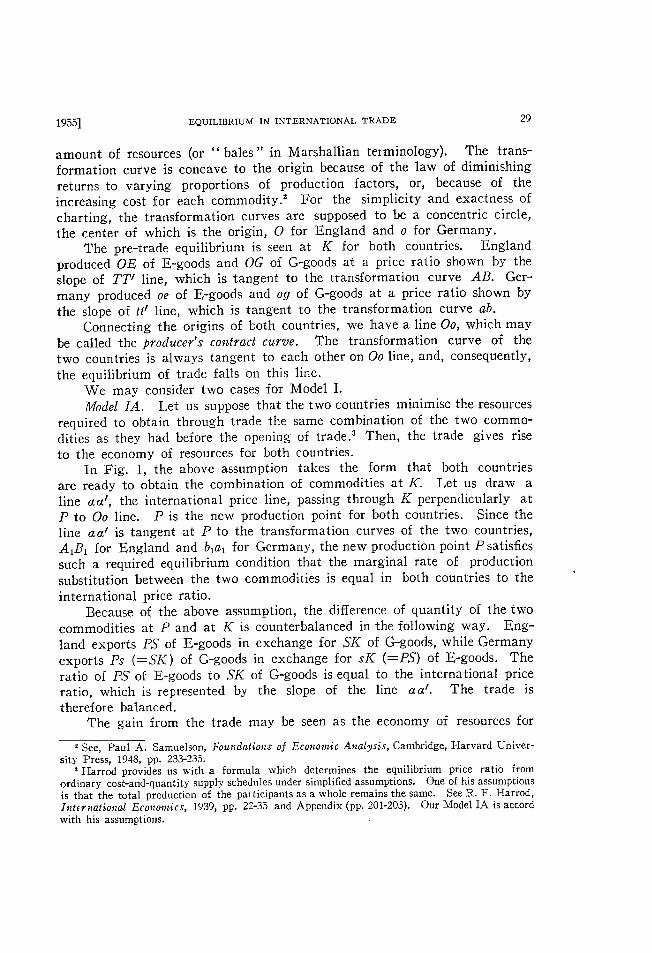
Model IB, Let us suppose that the two countries maximise the sum of their revenues in terms of num~raire or of the other commodities by using the same amount of resources as before the opening of trade.4 The trade has the effect to increase the quantity of commodities to be obiained by each country. .
Fig. 2
E.g"ed* *
Q" .~J
~ e ~ e'
y
b'
a
¥¥¥¥¥¥ ~_j__ _ _____ ___~~~'ri'lR_ H. B
¥¥ ~¥ *K is¥ PH : l ~~; :¥ :
¥ ¥
: ¥
, ¥
IF
O
X L-gu(,ds
Y f~
c
~L
' Model IB is originating from J. R. Hicks, "The Foundation of Welfare Economics," L;conon~ic Josernal, Dec. 1939, p. 702. Fig. 2.
1955] ' EQUILIBRIUM IN INTERNATIONAL TRADE 31'
In Fig. 2, the 1~)nglish production fan, OAB, and German production fan, oab, as well as the initial equilibrium point for both countries, K, are
the same as in Fig. I . Let us move the German production fan from oab to da/b/ until it touches the English production fan at P. As a result of
this'movement, the German origin o and its initial equilibrium point K move respectively to d and k/. Let us connect the English origin, O, with
the new German origin, d. Then we have a new producer's contract curve Od .
Let us extend a vertical line through K, 'the English initial equilibrium
point, and a horizontal line through k/, the German initial equilibrium point.
Let their intersection be R. Let us further draw the international price line, aa/ passing through R perpendicularly at P to the producer's contract curve, Od. Then, the equilibrium conditions of trade are explained in the
same way as in Model IA. At P, the new produ~tion point of the two countries, the marginal rate
of production substitution between the two commodities is equal with respect to both countries to the international price ratio. PS of English E-goods is exchanged for SR of German G-goods, the ratio of them being equal to the international price ratio. The trade is therefore balanced.
The gain from the trade may be seen as the increase of importable cornmodities in both countries. For I~)ngland, the combination of commodi-
ties at R as compared with that at K shows the same amount of exportable commodities (0L~ of E-goods) and a larger amount of importable commodi-ties (~;R of G-goods which is larger than L;K by the amount of KR). For Germany, the combination of commodities at R as compared with that at k/ shows the same amount of exportable commodities (dg/ of G-goods) and a larger amount of importable commodities (g!R of E-goods which is larger than g!k! by the amount of k/R).
The gain from trade may, however, be measured more exactly as the entrepreneurial surplus. Passing through K, Iet us draw a line HKH! in parallel to the international price line ad. Then, as in Model IA, it is clear that the cost of PS of E-goods for England is SK of C~goods or HS of E-goods. Therefore, the entrepreneurial surplus for England is PS-HS=PH or RH! in terms of E-goods (num~raire). By reasoning in similar way, we flnd that the entrepreneurial surplus for Germany is k!R in terms
of E-goods. The sum of the entrepreneurial surplus of these two countries is k/R+RH/=k/H/ in terms of E-goods. If we measure the entrepreneurial surplus in terms of G-goods, it will be KR for England and Rh/ for Ger-many, their sum being Kh!. It is clear that the sum of the entrepreneurial
surplus of both countries in this case is the same as the sum of increments
of importable commodities for both countries, which in turn is equal to vector od, or Kkl.
The r,esources are economised in Model IA, while the importable com-
32 THi~ ANNALS OF THE HITOTSUBASHI ACADEMY [October
modities are increased in Model IB. But, each of them shows that the sum of entrepreneurial surplus of both countries is maximised for di~erent levels
of employment of each country. Since the sum of entrepreneurial surplus is larger in Model IB than in Model IA, the former is more desirable than the latter from the standpoint of trade. The level of employment of an economy as a ¥vhole depend_~., however, upon effective demand or the relation
between saving and investment. It is possible that one of or both countries
may attain a trade equilibrium by leaving some resources unused5 as shown in Model IA. It is important to know that an equilibrium of trade is at-tained for each level of employment of the participating countries.
- I. Model II: Compouerd L;xchalege
Let us suppose that two countries maximise their entrepreneurial sur-plus, spending their revenue which includes the maximised entrepreneurial surplus, and also maximise their ~atisfactions. We have then a compound exchange model.
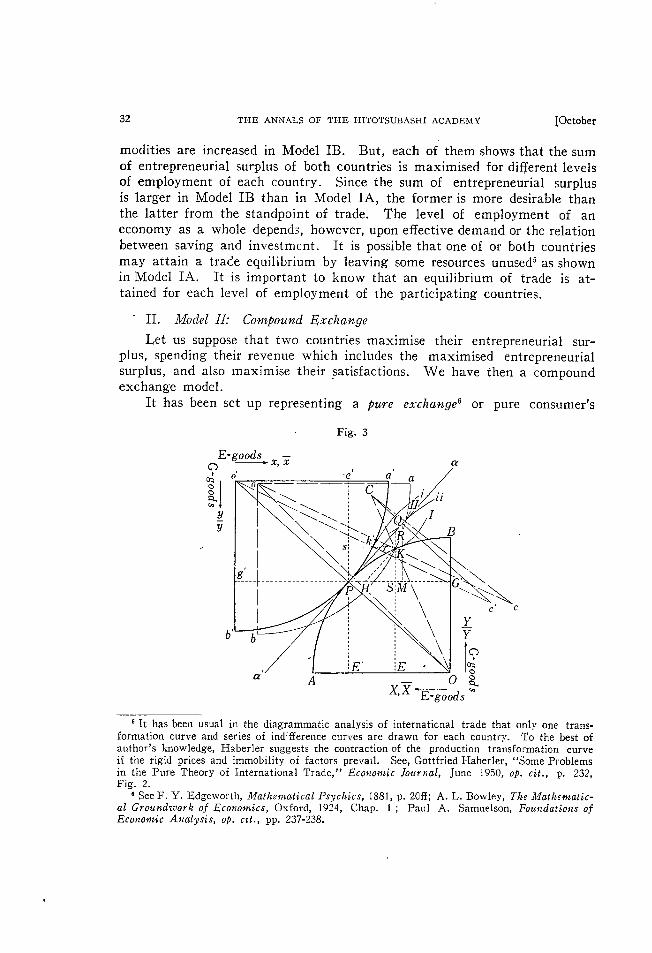
It has been set up representing a pure exchalege6 or pure consumer's
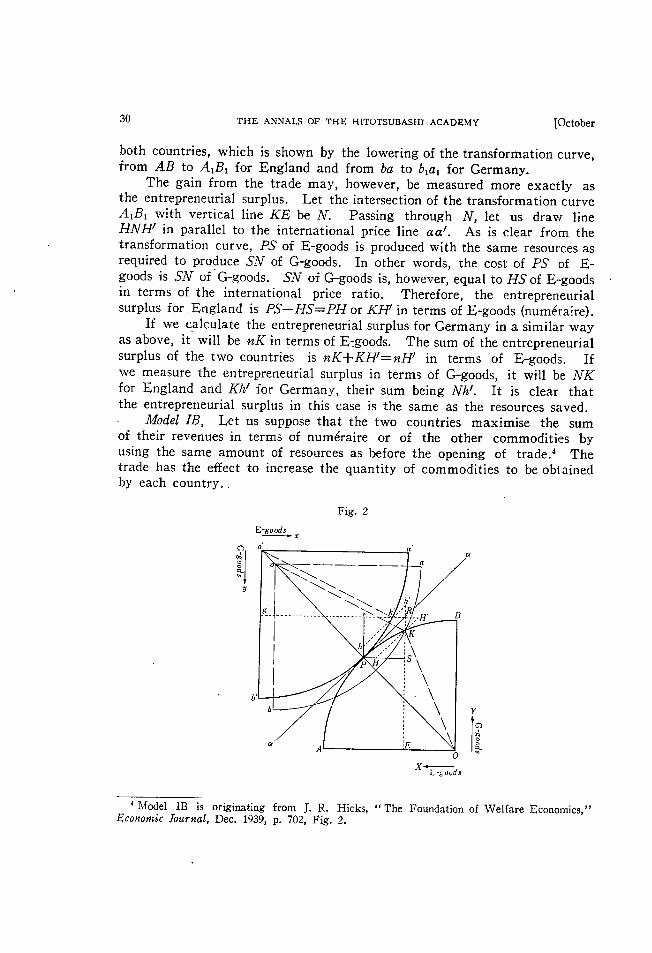
Fig. 3
E-goods x' ~ 'q! cr) , lli/ii crq oo ~J
~~¥¥ ¥¥¥ i s~
~ I ¥¥¥¥¥~ - ' :R 1~ k
.: ¥ ~¥ , I ¥ ~. ...~i jT¥¥¥¥¥G' ¥
~___[___________ - -*-'- S'il'l~~ ~~
P' i ~¥ : ¥ c' c Y_ Y :E ~. . ~ I~ ~c)
' E
X'X E-goods
5 It has been usual in the diagrammatic analysis of internaticnal trade that only one trans-formation curve and series of ind:fference curves are drawn fcr each countr~.'. To the best of author's knowledge. Haberler suggests the contraction of the producticn transformation curve if the rigid prices and immobility of factors prevall. See, Gottfried Haberler, "Sorne P]'oblems in the Pure Theory of International Trade," L;co,i0,1hic Journal. June 1950, op. cit., p. 232, Fig. 2.
6 SeeF. Y. IE:dgeworth, Mathe~t~atical Psychics, 1881, p. 2Cff; A. L. Bowley. The Mathematic-al Grou,edwork of L;co,ro,nics. Oxford, 1924. Chap. I ; Paul A. Samuelson. Foutfdatians of ~cono,,tic A,talysis, op. ctt., pp. 237-~,-38.
19551 EΩUILIBRIUM IN INTERNATIONAL TRADE 33
exchange which is based upon consumption(or utility)indifference curves
and initial stocks and which aims at the maximisation of satisfactions(or
total utilities)of participants of exchange.We have set up in the prevlous
section the pure specialisation exchange model which aims at the maximisa-
tion of entrepreneurial surplus of participants of exchange.The compoun4
exchange model in this section aims at the double maximisation of entre-
preneurial surplus and satisfactions of participants of exchange。
In Fig.3,the German production fan,oαみ,and its utility surface are
superimposed upon the English production fan,0∠1B,an(i its utility surface
so as to make each pre-trade equilibrium point coincide at K.The rule of
charting is the following:
(1〉 It is supPosed as before that the production transformation curves
for each country are concentric circles with the center at O for Englan(1
&nd o for Germany.By connecting the center of both comtries,the pro-
ducer’s contract curve Oo,may be drawn.
(2) It is supposed that consumption indifference curves for each country
are concentric circles with the center(bliss-point)at C for England and‘
for Germany.By connecting the center of both countries,the consumer’s
contrac㌻curveα’,may be drawn・ (3) The pre-trade equilibriロm for each comtry requires such conditions
that the marginal rate of consumption substitution equals the marginal rate
of production substitution and both of them equal the pre-trade price ratio
of the two commodities. This is seen for England at K,where English
transformation curve,z4β,is tangent to one of its consumption indifference
curves夕1,and the slope of the tangent is the pre-trade price ratio for Eng一’
1and.Similar situation is seen at K for Germany,but it is not shown in
Fig.3for avoiding the complexity of chart。German indiHlerence curves,ゼ,拓,etc.,correspond to its production fan,面ノδノ,which is moved from oαわ。
Therefore,the initial equilibrium condition for Germany can clearly be seenat々ノ.
(4)The above condition required for the pre-trade or closed-system
equilibrium is always satisfied with any point on line O6for Englan(i and
on line o6for Gemany.We may call O60r oo line theθ㈱o紘g70剛hρα飾.According to the amount of resources put in,a country will grow or
shrink along the economic growth path unless there happens any foreigntrade or change in util玉ty function (or tastes)and in production function(or
technological improvements).
Before the opening of trade,as it is seen in Fig.3,the consumer’s con-
tract curve (二6 is not parallel to the producer’s contract curve Oo. Let us
move German production fan a.nd utility surface keeping th弓former in
touch with English production fan until the consumer’s contract curve,αノ,
is parallel to the producerFs contract curve Ooノ.As a result of the move-
ment,German origin o,its initial equilibrium point’K,and its bliss-point‘,
34 THE ANNALS OF THE HITOTSUBASHI ACADEMY 【October
will respectively move to oノ,為ノ,and〆.
The German productlon fan,01αノグ,touches the English producti【)n fan,
0∠4β,at P which is on the producer’s contract curve Ooノ. Passing through
P,1et us draw a lineααノperpendicularly at g to the consumer,s contract
curveαノ. At g one of.English indifference curves,11,touches one of
German in(iifference curves,拓,and both are tangent to the intemationalprice line ααノ. .P is the post-trade production point an(1・g is the post-trade
consumption point for both countries.P and g satisfy such double equi-
marginal condition of intemational equilibrium th&t the marginal rate of
productlon substitutioa for each country an(1the marginal rate of consump-
tion substitution for each country are common乱n(1the same as the inter-
national price ratio.The(iouble equi-marginal condition satis丘es the double
Iτ1aximisation of entrepreneurial su1’Plus and satisfεしct三〇ns.
The diHlerence between production and con3umption in one country will
be exchanged for that in other. In other words,P盟of English E-goods is
exchanged forルηof German G-goods,the ratio of them being equal tothe international price ratio. The trade is therefore balanced.
The gain from the trade may be seen in two aspects. Firstly,the
trade gives rise to the entrepreneurial surplus for both countries. Passing
through K,1et us draw a line躍ぐin parallel to the line ααノ. Then,we
find the entrepreneurial surplus for England as.PH in terms of E-goods(num6raire).Let us draw a horizontal line throughた’,an(i let the illtersec-
tion of that line with ααノ1ine beγ. Then,we fin(1the entrepreneurial
surplus for Germany asたノ7in terms of E-goods。
Secondly,the tr&de gives more satisfactions to both countries.This is
shown by the fact th乱t the indifference curve has moved from the initial
one to a higher order one,i.e.,from l to ll for England and fromづto茄
for Germany.The increase in satisfactions is also shown by the fa(二t that
the ra(1ius of consumption indifference curves which are represented by con-
centric circle becomes smaller,i,e.,fromαζto Og for England and from
6κ=〆々!to〆9至or Germany.
It is important to recognise that the increase in satisfactions cannot be
attained without the maximisation oHhe entrepreneurial surplus.
We have explained in the above with reference to Fig.3a case in
which both countries maintain full employment and attain the equilibrium
of intemational tra.de. It is,however,possible that,because of the shortage
of effective demand on the part of a country as a whole,one of or both
countries attain the equilibrium of intemational tra(1e by leaving some
resources unused.
III.TんθGo卿o㈱40ガθグ0%耀
If a reciproca1(iemand and supply curve or ofモer、curve is(1rawn as the
locus of points of tangency of consumption ind玉Hlerence curves t(レ price
19551 JE;QUILIBRlUhl IN IN'TERN.'ATloNAL TRAD~ 35
lines which pass through an origin, it is Hicksian price-consumption curve.7
The offer curve of that nature is presented by Leontief.8 Since it does not involve any change in production due to the opening of trade, it may be called a si,~luple offer curve. It is questionable whether the offer cur~ve
drawn by Marshall9 or Edgeworthlo is that kind of cffer curve or a more complex one ¥vhich cornprises not only changes in consumption but also changes in production due to the opening of trade. It 'seems to the author that the latter alternative is true.
Let us call the offer curve involving chang"es both in consumption and
production a col~rpouet,d offer cetrve. The compound offer curve is, fust,
drawn by Baldwinll as the locus of vectors between production and con-sumption points for each price ratio, when those vectors are redrawn from
an origin.
Meadel2 was the second who drew the compound offer curve. He draws the trade ilrdifferee4ce curve as the locus !)f movement of the origin of pro-
duction fan when the production fan is slided along a consumption indiffer-
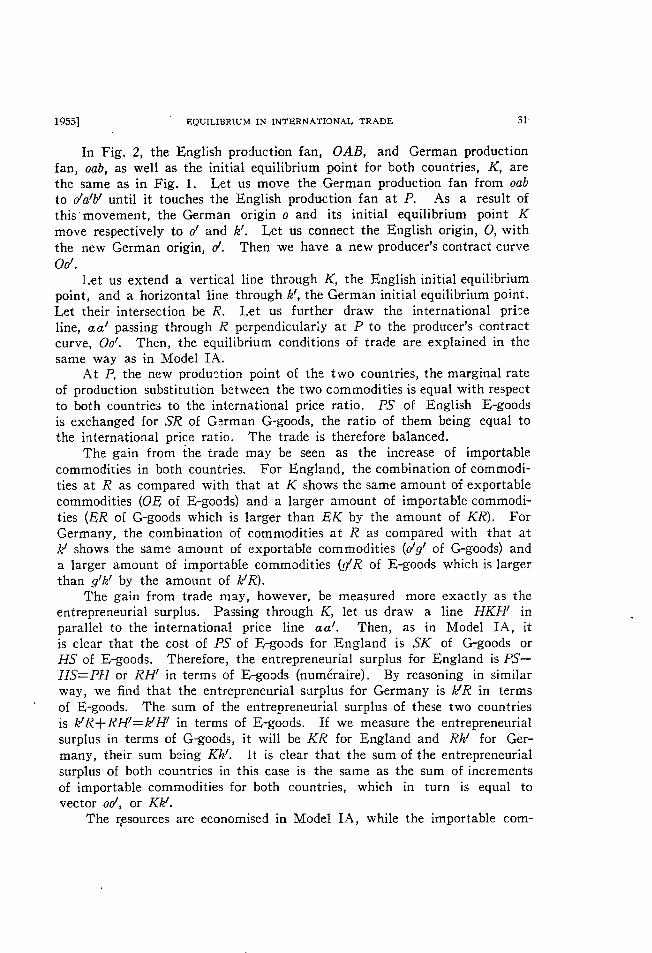
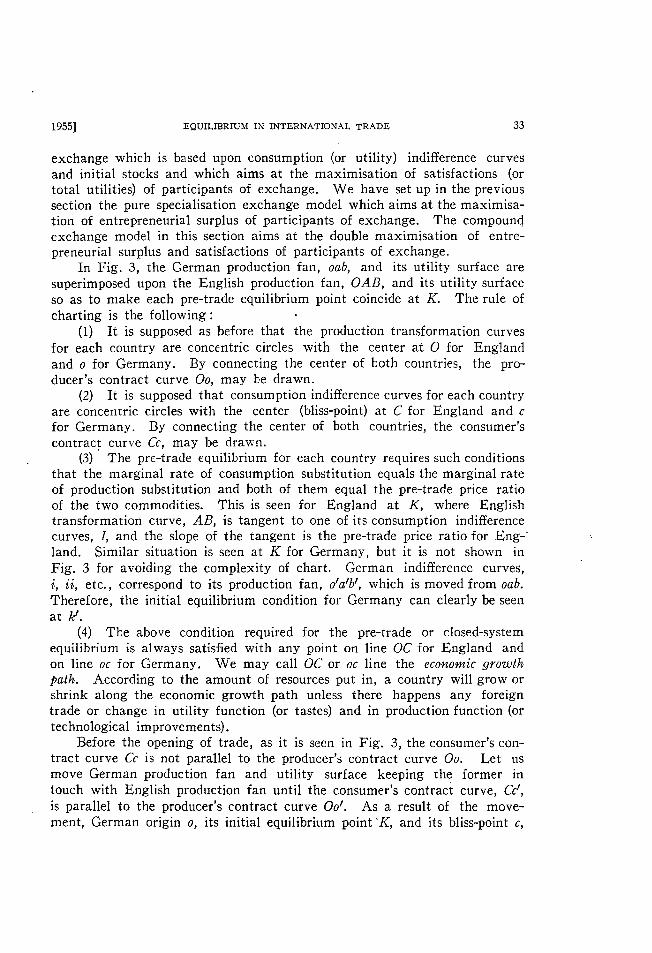
Fig. 4
G . g""d *
E - good s
f
? J. R. Hicks, Value atrd Capital, Oxford, 1939, p. 30. 8 ¥Vasslly W. Leontief, "The Use of Indlfference Curves in the Analysls of Foreign Trade,"
Readi,sgs, op. cit., p. 231, Fig. 2.
9 Alfred Marshall, The Pure Theory of Foreig'e Trade, 1879, reprinted in No. I in Series of Reprints of Scarce Tracts in I~;conomics and Political Science, London School of Economics, 1930 ; and Money, Credit and Contflterce, London, 1923, Appendix J.
lo F. Y. I~;dgevvorth, "The Pure Theory of International Trade," L;co'tott~ic Journal, 1894, p.
ll R. E. Baldwin, "Equilibrium in International Trade : A Diagrammatic Anal.vsis," op. cit., p. 751, Fig. 2.
is J. I~;. ~_'1eade, A Geometry of 1leter,2atio'~al Trade, op. cit., Figs. 1-IV and Chap. II.
~
o
Tnl~; AN~~'ALs OF THE HITOTSUBASHI AcAD1~;hiY
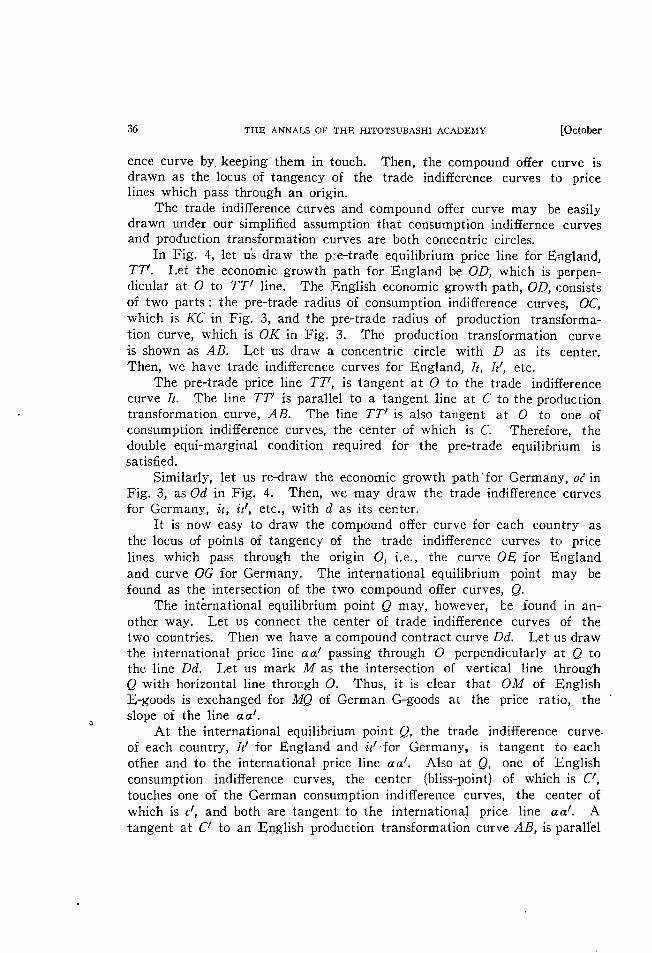
ence curve by, keeping them in touch. Then, the compound offer curve is drawn as the locus of tangency of the trade indifference curves to price lines which pass through an origin.
The trade indifference curves and compound offer curve may be easily drawn under our simplified assumption that consumption indiffernce curves and production transformation curves are both concentric circles.
In Fig. 4, Iet us draw the pre-trade equilibrium price line for England,
TT/. Let the economic growth path for England be OD, which is perpen-dicular at O to TT/ Iine. The IE;nglish economic growth path, OD, consists
of two parts : the pre-trade radius of consumption indifference curves, OC,
which is KC in Pig. 3, and the pre-trade radius of production transforma-
tion curve, which is OK in Fig. 3. The production transformation curve is shown as AB. Let us draw a concentric circle with D as its center. Then, we have trade indifference curves for England, It, Iy, etc.
The pre-trade price line TT/ is tangent at O to the trade indifference curve It. The line TTy is parallel to a tangent line at C to the production
transformation curve, AB. The line TT/ is also tangent at O to one of consumption indifference curves, the center of which is C. Therefore, the double equi-marginal condition required for the pre-trade equilibrium is satisfied.
Similarly, Iet us re~lraw the economic growth path'for Germanv. , oi in
Fig. 3, as Od in Fig. 4. Then, Iive may draw the trade indifference curves for Germany, it, iy, etc., with d as its center.
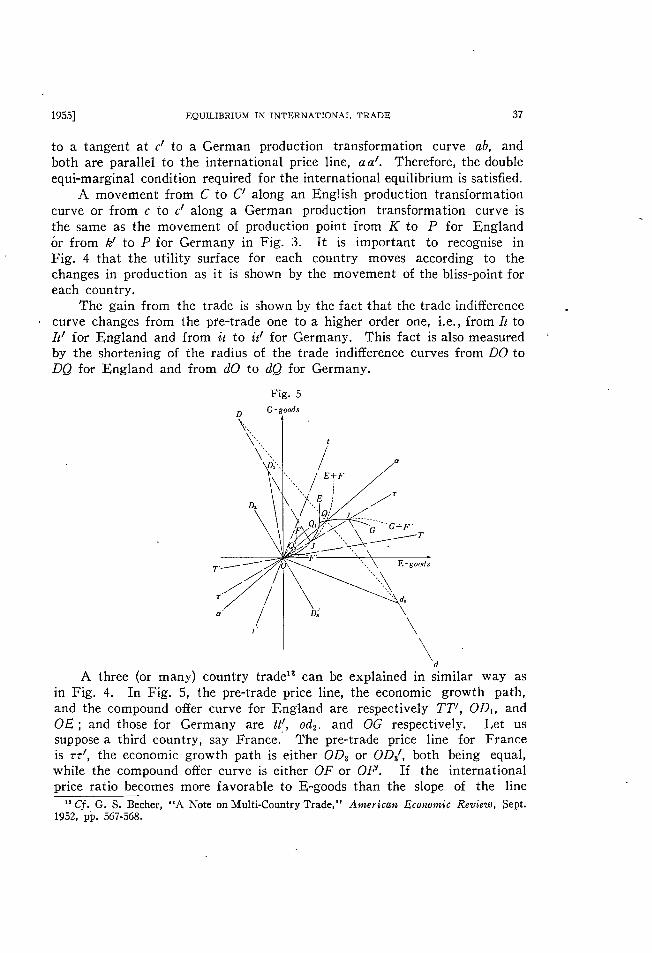
It is now easy to draw the compound offer curve for each country as the locus of points of tangency of the trade indifference curves to price
lines which pass through the origin O, i.e., the curve 0L~ for England and curve OG for Germany. The international equilibrium point may be found as the intersection of the two compound offer curves, Q.
The international equilibrium point Q may, however, be found in an-other way. Let us connect the center of trade indifference curves of the two countries. Then we have a compound contract curve Dd. Let us draw the international price line aa! passing through O perpendicularly at Q to the line Dd. Let us mark M as the intersection of vertical line through Q with horizontal line through O. Thus, it is clear that OM of English I~;-goods is exchanged for MQ of German G-goods at the price ratio, the slope of the line ad.
At the international equilibrium point Q, the trade indifference curve.
of each country, Iy for England and iy,for Germany, is tangent to each other and to the international price line ad. Also at Q, one of English consumption indiffcrence curves, the center (bliss-point) of which is Cl
touches one of the German consumption indifference curves, the center of which is d and both are tangent to the international price line ad. A tangent at C/ to an English production transformation curve AB, is parallel
1955] EQUILIBRlUM IN INT1~;RNATroNAL TRAD~; 37
to a tangent at d to a German production transformation curve ab, and both are parallel to the international price line, aa/. Therefore, the double
equi-marginal condition required for the international equilibrium is satisfied.
A movement from C to C/ along an English production transformation curve or from c to d along a German production transformation curve is the same as the movement of production point from K to P for England 6r from k! to P for Germany in Fig. 3. It is important to recognise in Fig. 4 that the utility surface for each country moves according to the changes in production as it is shown by the movement of the bliss-point for
each country. The gain from the trade is shown by the fact that the trade indifference
curve changes from the pte-trade one to a higher order one, i.e., from It to h! for IE)ngla~Id and from it to it/ for Germany. This fact is also measured
by the shortening of the radius of the trade indifference curves from DO to
DQ for I~;ngland and from dO to dQ for Germany.
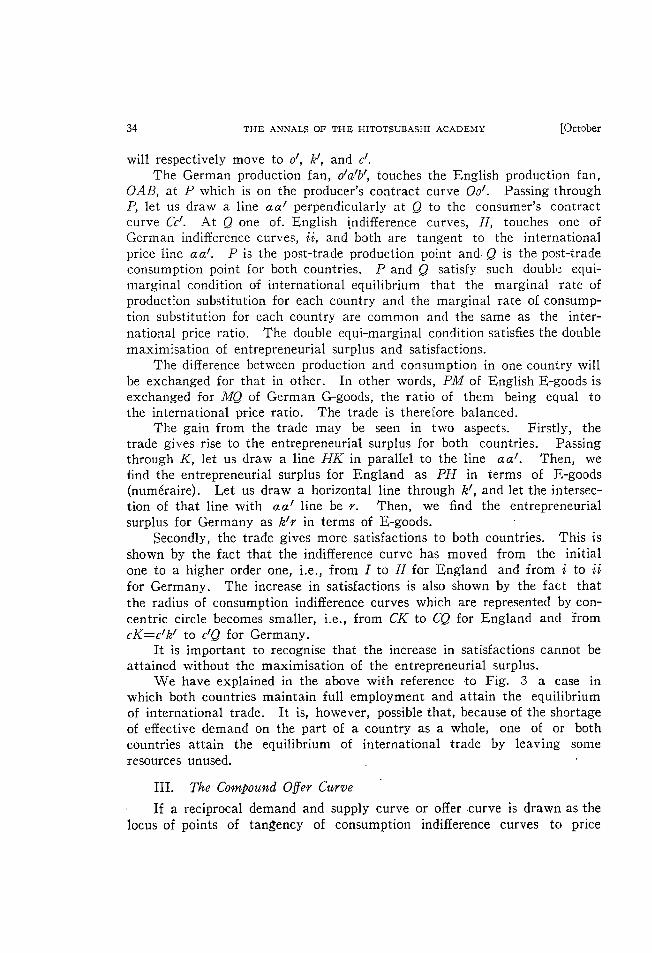
Fig. 5
D G - g""d *
"'
/ ¥
¥,/ A three (or many) country tradel3 can be explained in similar way as
in Fig. 4. In Fig. 5, the pre-trade price line, the economic growth path,
and the compound offer curve for England are respectively TT/, OD1' and 0L; ; and those for Germany are tt/ od2, and OG respectively. Let us suppose a third country, say France.' The pre-trade price line for France
is Tt!, the economic growth path is either OD3 or OD!, both being equal. while the compound offer curve is either OF or OF/. If the international price ratio becomes more favorable to E-goods than the slope of the line
' *' f.. G. S. Becher, "A Note on Multi-Country Trade," A,ttertcate ~conomtc Revtew 1952, pp. 567-568.
,
38 THE ANNALS OF THE HITOTSLJBASI{1 ACAD~;MY [October
tT!, then Prance will trade in the same line as England does and, conse-
quently, OD3 and OF are effective. If the international price line becomes
more. favorable to G-goods than the slope of the line Tr!, then France will
trade in the same line as Germany does and, consequently, OD3! and OFl are effective.
Let us draw a line DJ passing through D1 perpendicularly at J to the line TTl, the line DJ being necessarily parallel to the line OD3' Further let DDI be equal to D30. Until the international price ratio changes from the slope of the line TT/ (English pre-trade price line) to the slope of the line TT!, rrance cannot campete with Englznd. Therefore, the quantity of trade of E- and G-gocds shown by vector OJ is the non-competing quantity of England over France. Once the international price ratio becomes more fa¥'orable to E-goods than the slope of the line fr/, prance can export E-
goods and import G-goods in competition with England in exporting I;-*・oods
and importing G-goods. ・Then, the total of offer curves cf England and Prance will be shown by a dotted curve L;+F, which is drawn from the total trade indifference curves of England and France which take D as center.
Similarly, Iet us draw a line dj so as to pass through d2 and to be perpendicular at j to the line T.-/, Iine dj being necessarily parallel to the
line OD3/, and let dd2 be equal to D310. Until the international price ratio changes from the slope of the line tt/ (German pre-trade price line) to the slope cf the line TT/, France cannot compete with Germany in ex-porting G-goods and importing E-goods. Therefore, the quantity of IE;- and
G-gocds shown by vector Oj is the non-competing quantity cf trade cf Germany over rrance. Once the international price ratio becornes more favorable to G-goods than 'the slope of the line ?r/, France can export G-gocds and import E-goads in competiticn with Germany. Then, the total of offer curves of Germany and France will be shown by a dotted curve G+F/, which is dra¥vn from the total trade indifference curves of Germany
and rrance which take d as center.
Now the international equilibrium between the three countries may be easily determir*ed. Firstly, the trade equilibrium point is fcund as the intersection Q af English-and-French offer curve E+F, with German offer curve OG.14 Seccndly, Iet us connect the center of English-and-Prench trade indifference curves, D, and the center of German t'ade indifierence curves,
d2' We h.ave then a compcund contract curve betwern the three countries, Dd Let us draw the Intern^tronal pnce line ad so as to poss through the origin O, and to be perpendicular at Q to the line Dd2. Q is the inter-
national equilibrium point. , At the international eqilibrium point Q, one of I~;nglish-and-French trade
*' lt ,may be of no need to mention that OF/ and G+F/ offer curves are not effective, since the dotted offer curve, G+F!, does not intersect with 0L; ofler curve. ' '
1955] 1~QUILIBRlUM IN INTERNATIONAL TRADE 39 indifference curves, the cetrter of which is D, tduches one of German trade
indifference curves, the center cf vhich is d2, and both are tangent to the international price line ad. The equilibrium quantity of trade of I~;ngland-
and-France for Germany is shown by vector . OQ. One of I~;nglish trade indifference curves, the center of which is D1' is tangent at Q1 to the inter-
national price line aa/. Therefore, the quantity of ' trade for England is
shown by vectcr OQl' One of French trade indifference curves, tke center of which is DB, is tangent at Q; to the international price line ad. There-
fore, the quantity of trade fcr France is shown by vector OQ3. The total
of vectors OQI and OQ3 equals the vector OQ. '
Under such simplifled assumtions that both production transformation curves and cohsumption indifference curves are concentric circles, the max-
imum principle of the entrepreneurial surplus and that of satisfactions for ~he two countries, which are required for the equilibrium of international
trade, are geometrically analysed, first each principle separately and then
simultaneously. The simpl'fied geometrical analysis makes charting easy and exact.
It is particularly useful to draw the compound offer curve and to extend the analysis to a three or many country trade: It will be eificiently applied to
the further analysis of transfer problem, optimum tariff, technological im-
provement, economic growth, and s0' forth. If it is assumed that both prcductian transformation curves 'and con-
sumption indifference curves are riot concentric circles, the analysis in this
paper ought to be modified accordingly.15 The equilibrium conditions re-quired, however, remain unaltered as in this paper.
APPENDIX
Model I .' Pure Specialisatiow L;xchowge Let us suppose that two countries exchange bet~veen each other the increment
of production, in which each country has cornparative advantage, so as to maximise
their entrepreneurial surplus. The entrepreneurial sljrplus is the difference between
the revenue from export and its cost required. Then, ~ve have a pure specialisation
exchange model. Let A, B stand for the initial quantities of production of I~;-goods and G-goods
for the first cot!ntry (England) and a, b for the second conntry (Germany), X for the increment of production of E-goods in England and Y for the quantity of G-goods ¥vhich can be produced T1'ith the same amount of resources as required to produce X. Similarly, Iet y stand for the increment of production of G-goods in
*' uch an equilibrium condition that the international price line is perpendicular to contract lines ought to be shown that an international price line is perpendicular to the tangent of con-
tract curves.
e
40 THE ANNALS OF THJ:; HITOTSUBASHI ACADEMY [October
Germany and x for the quantity of E-goods which can be produced with the same
amount of resources as required to produce y. Let us further suppose that X is exchanged for y at a price ratio, p, which is the quantitative exchange ratio of E-goods (nurn~raire) per unit of G-goods.16
The production functions for each country are written
(1.1) G(A+X, B-Y)=N (constant),
where d (B-Y) d2 (B- Y) <0, and d (A+X)2 <0, or, since A and B are constant, d (A+X)
d Y
d 2 Y dX >0, and dXs >0.
(1.2) g(a-x, b+y)=,e (constant),
d (b+ y) d 2(b+ y) or dy where d(a-x) <0, and d(a-x)2 <0, ~l ~ > o
N and ee stand for a given amount of composite unit
each country.
Let the entrepreneurial surplus for each country
(1,3) V=X-p Y, (1.4) v=p y-x.
Subject to (1.1),, maximise V. Then, we have
W=V+ACN G(A+X B Y)] (1.
5)
(1.6)
(1.7)
(1.8)
(1 .9)
(1 .
lO)
(1.11)
Similarly, (1.12)
(1 . 1 3)
which of p
of
be
and d 2 y
f actors
aW ~~~ar=0 1-A aG . A-1 1 ac ' a(A+X) =0, . . - / a(A+X)
-p+A a(B-Y) =0, .'. A=p a(B-Y) ' a f=0,
aG / aG p= a(B-17) / a(A+X) '
Similarly, subject to (1.2), maximise v. Then, .we have
w=v+; [n-9(a-x, b+y)], aw ag ag /
~~x~~~=0, -1+1 a(a-x) =0, .'. I =1 a(a-x)
aw ag ' /
ag ay =0, p-~ a(b+y) =0, .'. 1=p a(b+y)
' ag ' ag /
p= a-(bTy) a(a-x)
From (1,1) and (1.7), it follows -X=X(p), Y= Y( p).
from (1.2) and (1,lO), it follows
x=x(p), y=y(p). We have an exchange equatian X-p y=0, or X(p)-p y(p)=0, determines the equilibriurn value of p. By substituting the
in (1.11) and (1.12), we have the equilibrium values of X, Y
15 In this
the second appendix, capital letters refer to the
corlntry (Germany) except p. first countr y (E;ngland)
d x2
of
>0.
production
equilibrium
, x and y.
and small
f or
value
Then,
letters to
1955] EQUILIBRlUM IN INT~RNATIONAL TRADE 41 we obtain the equilibrium value of revenue, A+p(B-Y+y) for England and (a-
x+X)+p b for Germany.
Model JI: Compou,ed L;xchalcge ,
Let us suppose that two countries maxlmise their entrepreneurial surplu3, spending their revenue which includes the maximised entrepreneurial surplus, and also maximise their total utilities. Then, we have a compound exchange model.
As in Model I, subject to production functions
(2.1) G(A+X, B-Y)=N, (2.2) g(a-x, b+y)=ee, maximise V and v. Then, we have
/
aG aG (2.3) p= a(B-Y) a(A+X)
l ag ag (2.4) p=a-(b+y) / a(a-x) '
(2.5) X=X(p), Y=Y(p). y = y( p) . (2.6) x=x(p),
Let us suppose that consumers in England choose to consume A+X-~ and B-Y+y and consumers in Germany a-x+~ and b+y-y so as to maximise their satisfactions. ~ is ~nglish excess supply of E-goods and y its excess demand for
G-goods, and ~ is German excess damand for E-goods and ~ its excess supply of
G-goods .
Budget equations for each country with reference to the foreign trade may be
written
(2.7) ~=py. (2.8) ~=py.
Let the utility functions for each country be
(2.9) U=F(A+X-~, ~- Y+Y), d (B - Y+y)
where d(A+X-)~) <0, or, since A and B are constant and since X and Y are
given for consumers dY ds(B-Y+~) dSY and . ' ~ ~ <0, d(A+X-~)2 = d~2 >0. (2.10) u=f(a-x+. ~, b+y-~),
d(b+y-~) dy de(b+y-~) d2y d(a-x+~) d~ <0, and d(a-x+i~)s =~~~~>0. where = -Subject to (2.7), maximise U. Differentiating F+A(~-py) with reference to
~ and y, we have
~ (A+X-~) +A=0 a(/~-Y+Y) ~Ap o Theref ore,
aF aF /
(2.11) p= a(~-Y+~) a(A+X-~) ' Similarly, subject to (2.8), maximise u. Then, we have
af ' af /
(2.12) p= a(b~+y-y) a(a-x+~) '
From (2.7) and (2.11), it follows
(2.13) ~=~(p). Y=~(p).
42 THJ~ AN+NALS OF TH~; HITOTSUB'¥SHI ACADJ~h{Y
Similarly, from (2.8) and (2.12), it 'follows'
(2.14) ~=~(p). y=y(p). Since in the equilibrium of international trade English export (or exce.ss
supply) of E-goods is equal to German import (or excess edemand) for the same
commodity, ¥~i'e have ' ' (2.15) ~(p)=~(p). By substituting (2,15) in (2.7) and (2.8), we obtain
(2.16) y(p)=~(p). Thus, the equilibrium value of p is determined either by (2.15) or by (2.16).
Let us denote equilibrium values by suffix o' Then, for England, the equilibrium
value of production is - ~ (A+ Xo) + po(B- I'o)'
and that of consumption is
(A+Xo~~o)+ po(B- Y0+ yo)' The tlvo values are equal, since
X0=p Yo' by equation (2.7).
Similarly, for Germany, the equilibrium value of production is (a- xo) + po(b+ yo) '
and that of consumption is
(a-x0+~o)+ po(b+ yQ- yo)'
The two values are equal, since
~ po~o, x by equation (2.8).