Embed Size (px)
DESCRIPTION
Description of demand and supply curves
Citation preview
Aggregate Demand, Aggregate Supply and
Inflation
Deriving the Aggregate Demand CurveAggregate demand is the total demand
for goods and services in the economy.To derive the aggregate demand curve, we
examine what happens to aggregate output (income) (Y) when the price level (P) changes, assuming no changes in government spending (G), net taxes (T), or the monetary policy variable (Ms).
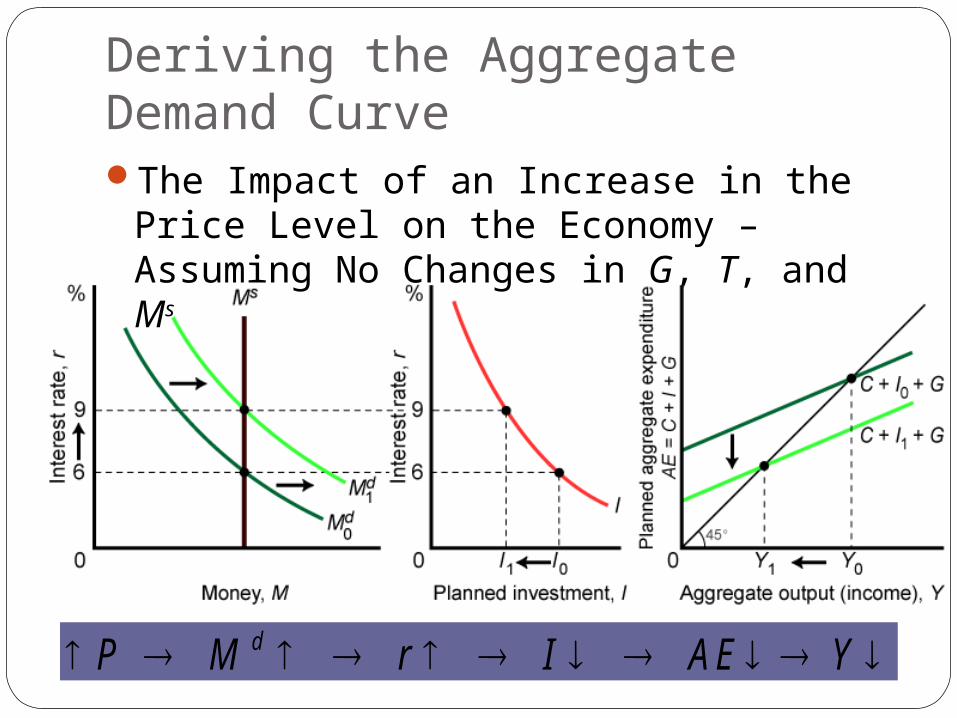
Deriving the Aggregate Demand CurveThe Impact of an Increase in the Price Level
on the Economy – Assuming No Changes in G, T, and Ms
P M r I A Ed Y
Deriving the Aggregate Demand Curve
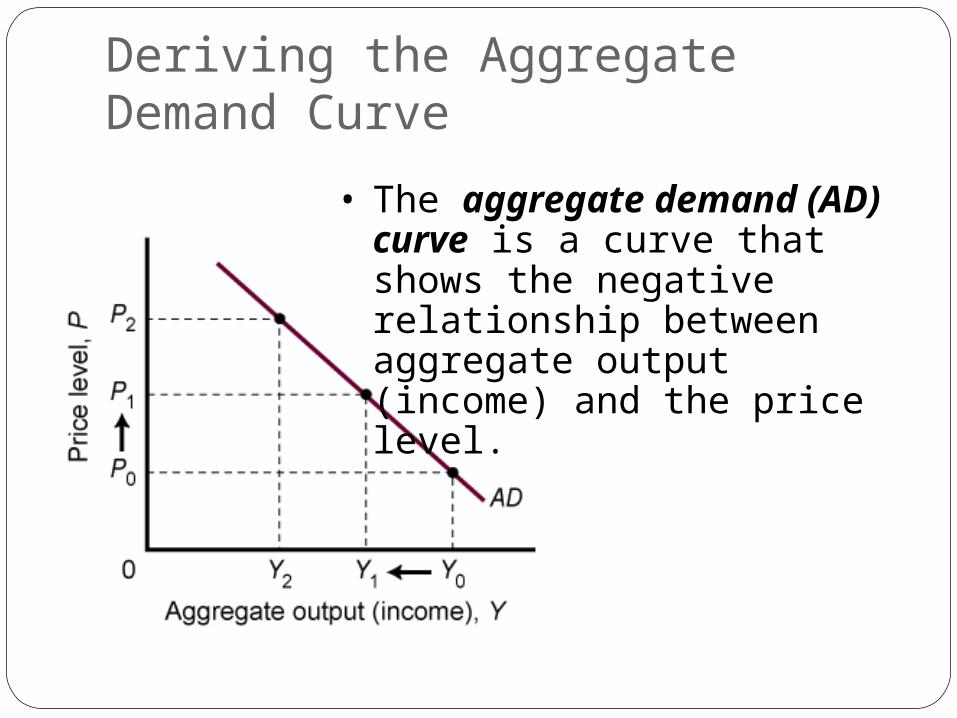
• The aggregate demand (AD) curve is a curve that shows the negative relationship between aggregate output (income) and the price level.
The Aggregate Demand Curve:
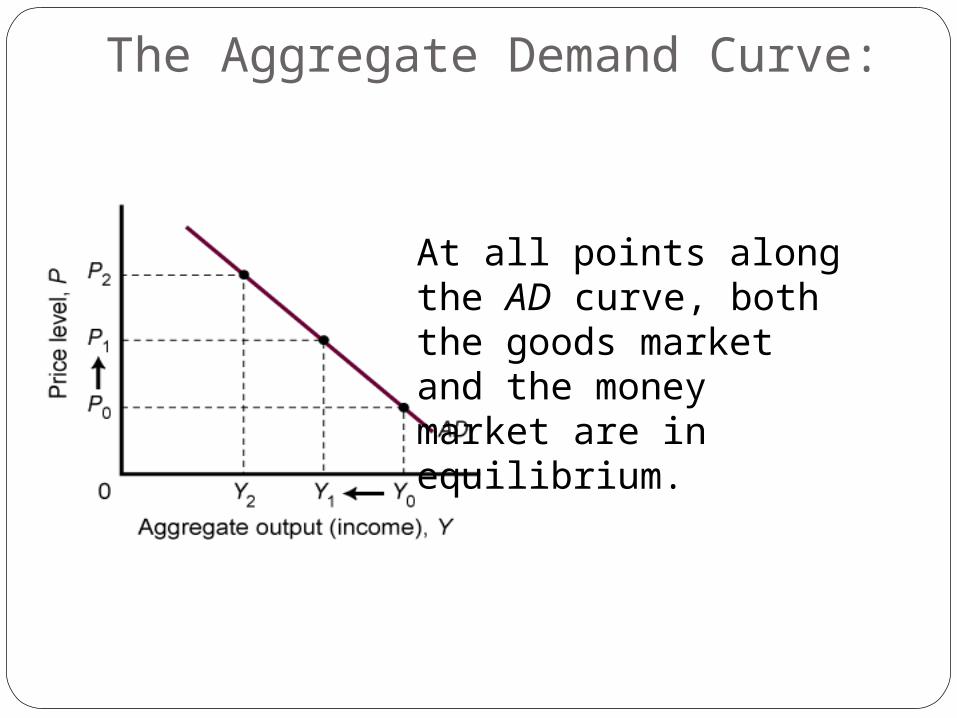
At all points along the AD curve, both the goods market and the money market are in equilibrium.
Reasons for a Downward-Sloping Aggregate Demand CurveThe consumption link: The decrease in
consumption brought about by an increase in the interest rate contributes to the overall decrease in output.
The real wealth effect, or real balance, effect is the change in consumption brought about by a change in real wealth that results from a change in the price level.
Aggregate Expenditureand Aggregate DemandAt every point along the aggregate demand
curve, the aggregate quantity of output demanded is exactly equal to planned aggregate expenditure.
Y = C + I + G
equilibrium condition
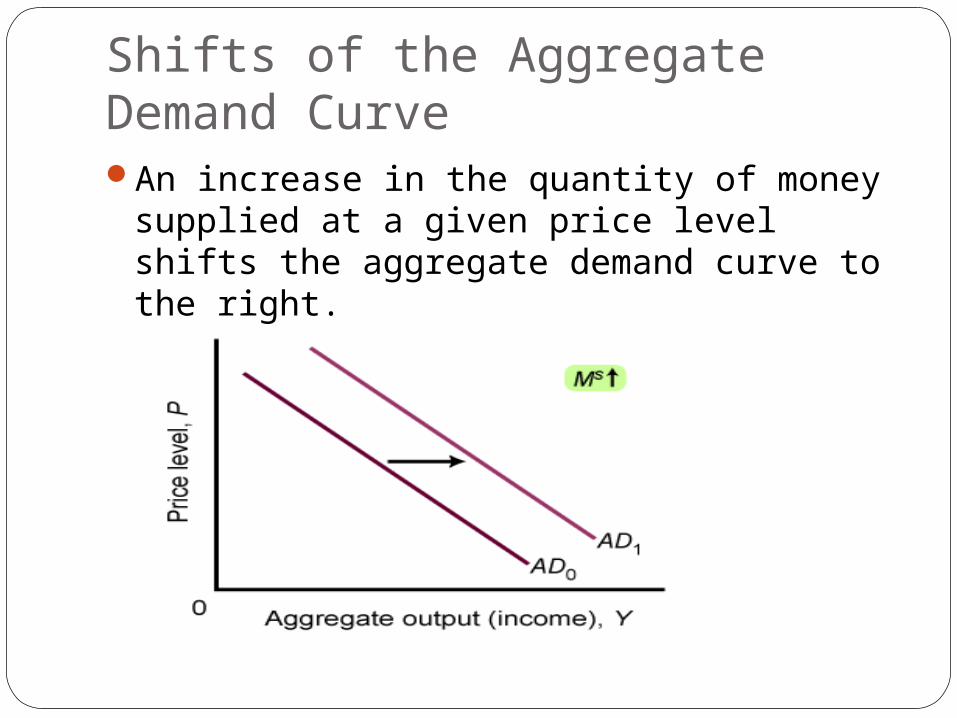
Shifts of the Aggregate Demand CurveAn increase in the quantity of money
supplied at a given price level shifts the aggregate demand curve to the right.
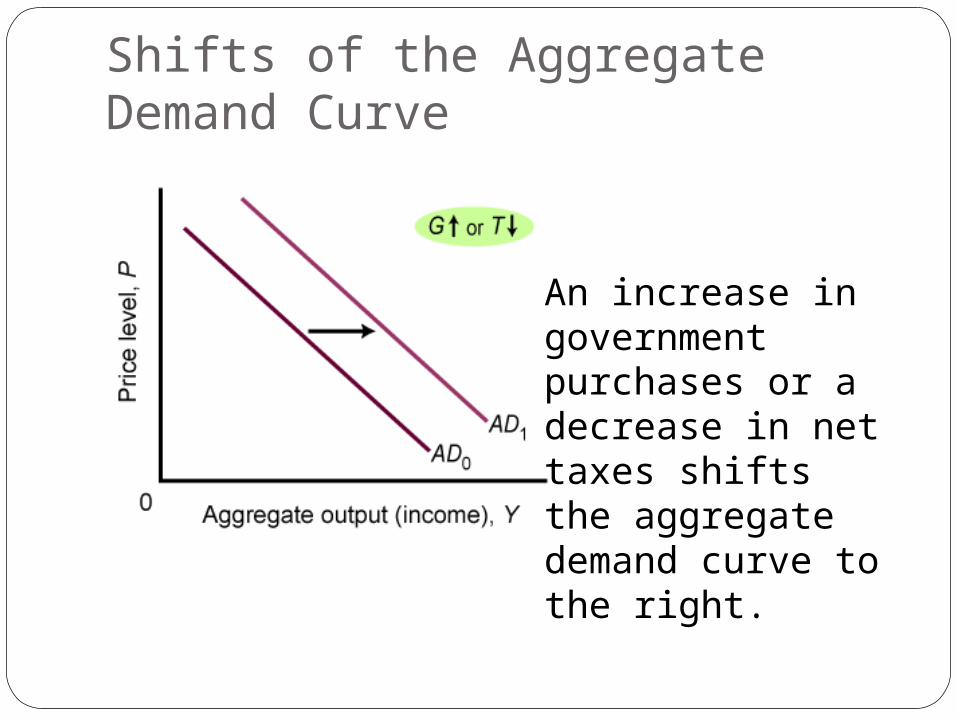
Shifts of the Aggregate Demand Curve
An increase in government purchases or a decrease in net taxes shifts the aggregate demand curve to the right.
The Aggregate Supply CurveAggregate supply is the total supply of all
goods and services in the economy.The aggregate supply (AS) curve is a
graph that shows the relationship between the aggregate quantity of output supplied by all firms in an economy and the overall price level.
When we draw a firm’s supply curve, we assume that input prices are constant. In macroeconomics, an increase in the overall price level means that at least some input prices will be rising as well.
The outputs of some firms are the inputs of other firms.
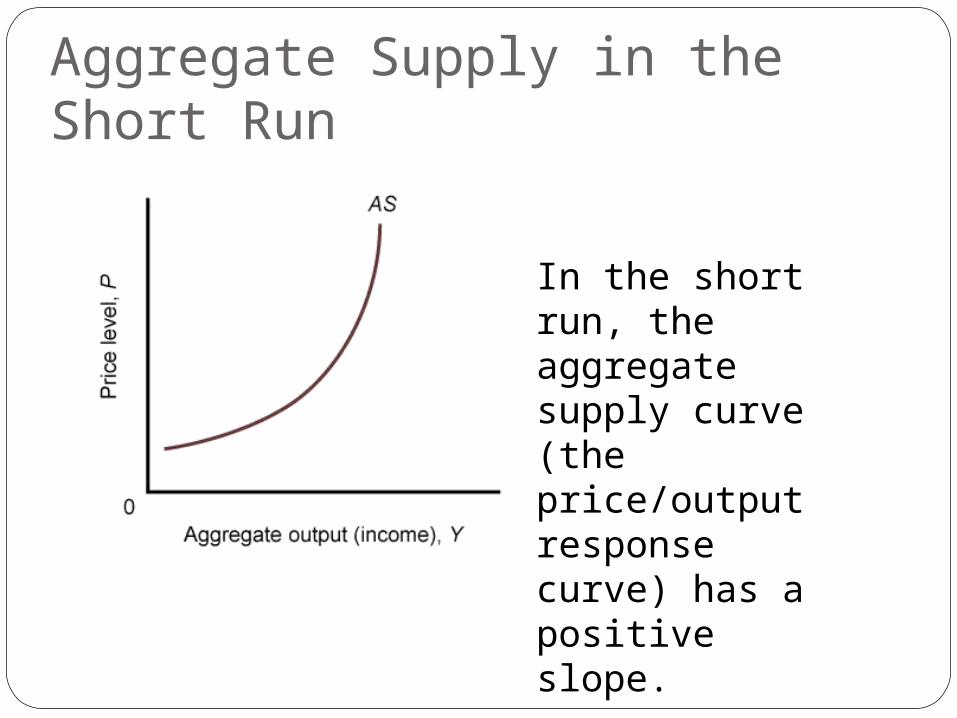
Aggregate Supply in the Short Run
In the short run, the aggregate supply curve (the price/output response curve) has a positive slope.
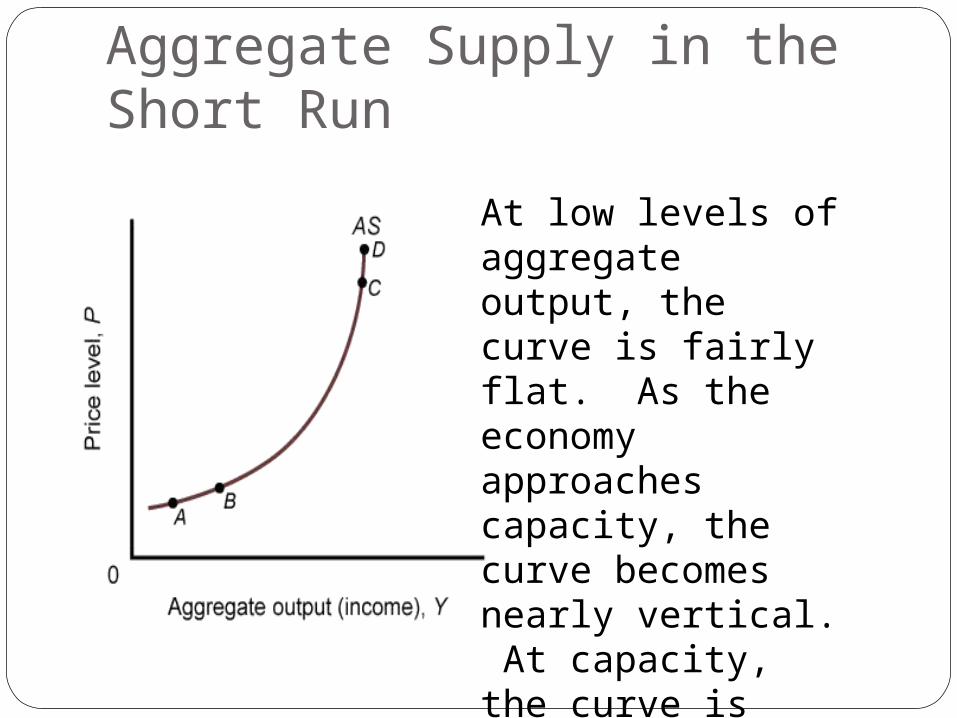
Aggregate Supply in the Short Run
At low levels of aggregate output, the curve is fairly flat. As the economy approaches capacity, the curve becomes nearly vertical. At capacity, the curve is vertical.
Aggregate Supply in the Short RunMacroeconomists focus on whether or not
the economy as a whole is operating at full capacity.
As the economy approaches maximum capacity, firms respond to further increases in demand only by raising prices.
Output Levels andPrice/Output ResponsesWhen the economy is operating at low
levels of output, an increase in aggregate demand is likely to result in an increase in output with little or no increase in the overall price level.
There must be a lag between changes in input prices and changes in output prices, otherwise the aggregate supply (price/output response) curve would be vertical.
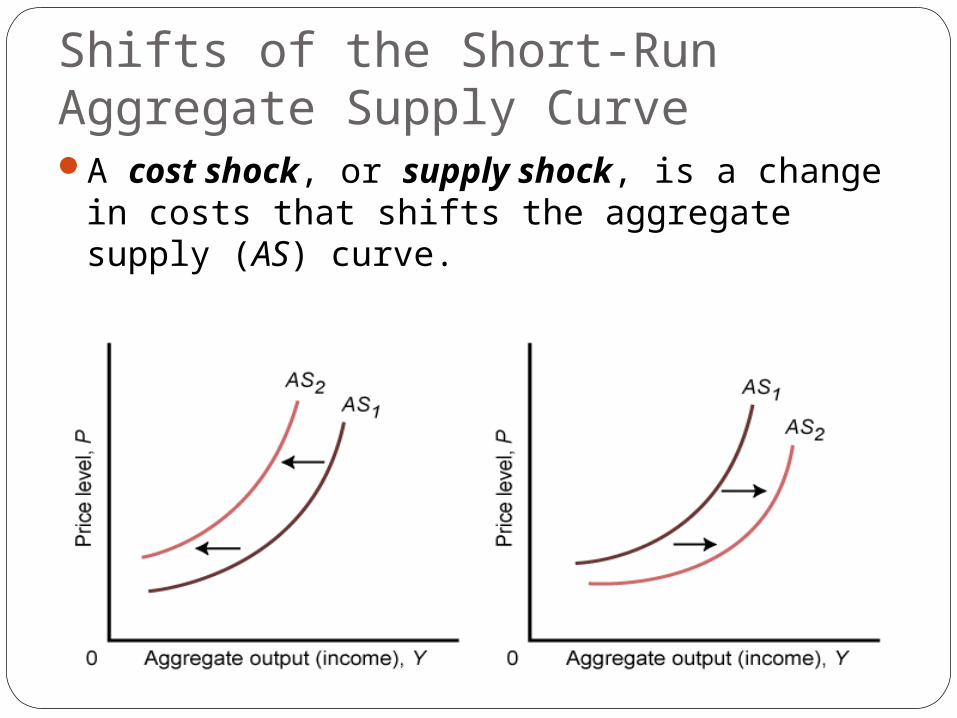
Shifts of the Short-RunAggregate Supply CurveA cost shock, or supply shock, is a change
in costs that shifts the aggregate supply (AS) curve.
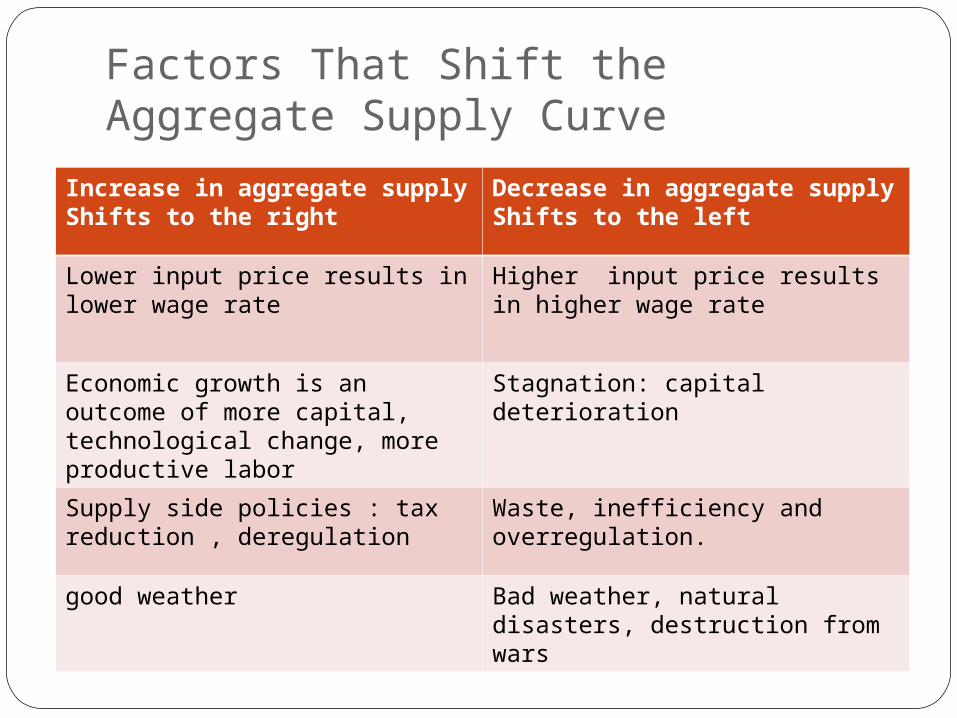
Factors That Shift the Aggregate Supply Curve
Increase in aggregate supplyShifts to the right
Decrease in aggregate supplyShifts to the left
Lower input price results in lower wage rate
Higher input price results in higher wage rate
Economic growth is an outcome of more capital, technological change, more productive labor
Stagnation: capital deterioration
Supply side policies : tax reduction , deregulation
Waste, inefficiency and overregulation.
good weather Bad weather, natural disasters, destruction from wars
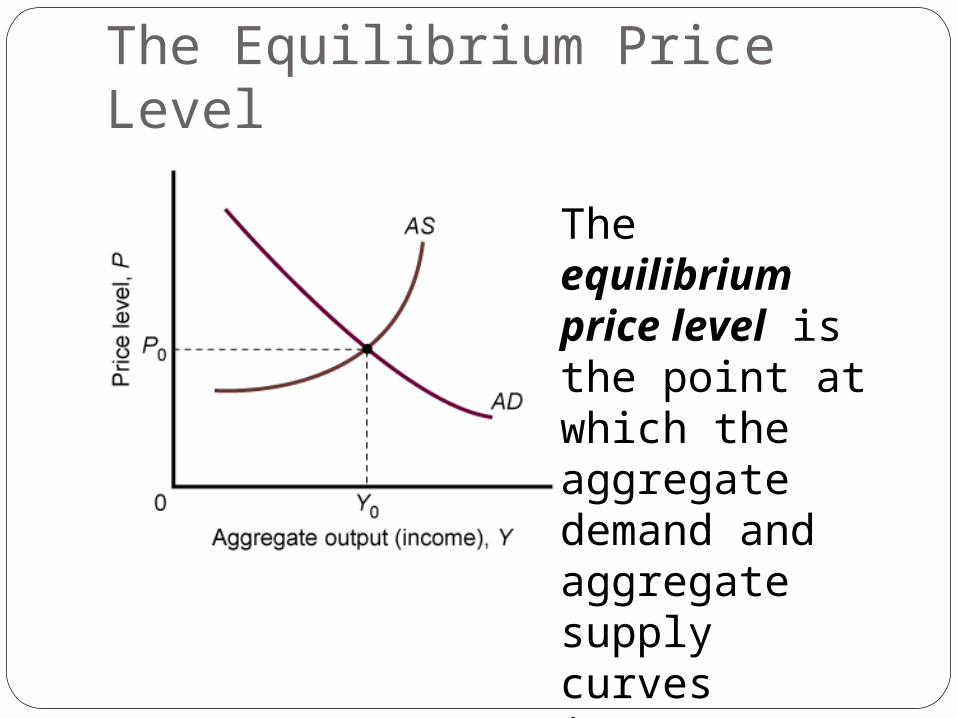
The Equilibrium Price Level
The equilibrium price level is the point at which the aggregate demand and aggregate supply curves intersect.
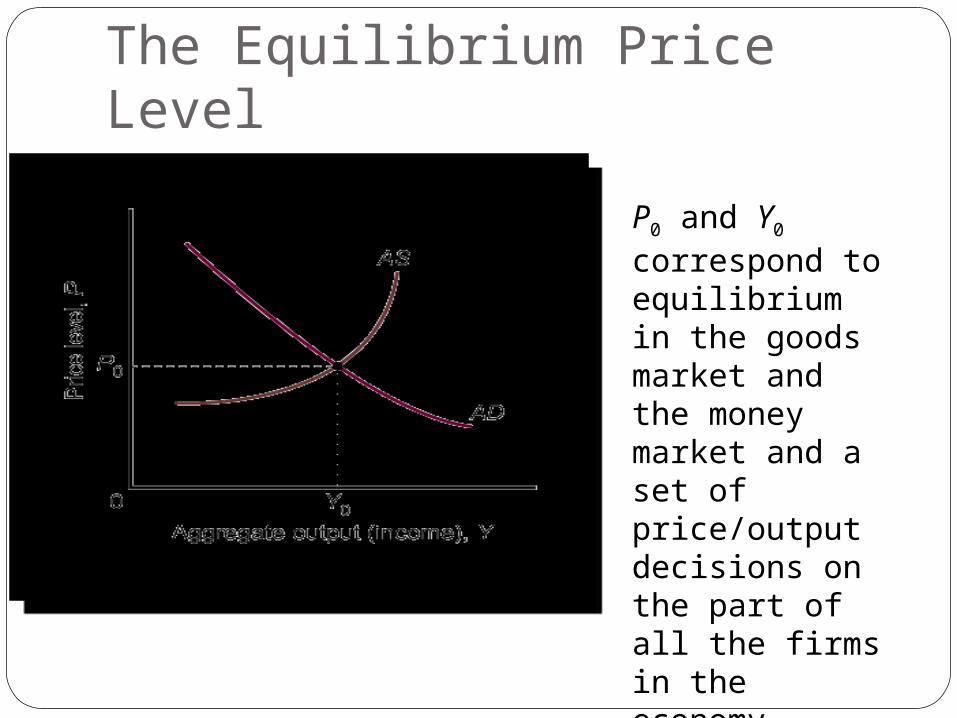
The Equilibrium Price Level
P0 and Y0 correspond to equilibrium in the goods market and the money market and a set of price/output decisions on the part of all the firms in the economy.
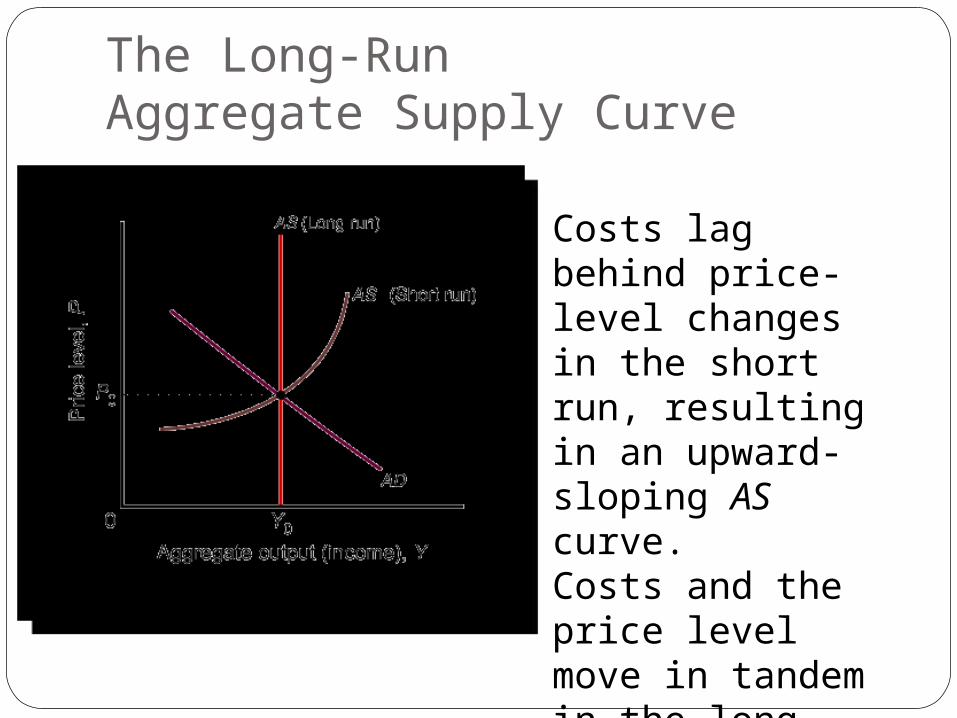
The Long-RunAggregate Supply Curve
Costs lag behind price-level changes in the short run, resulting in an upward-sloping AS curve. Costs and the price level move in tandem in the long run, and the AS curve is vertical.
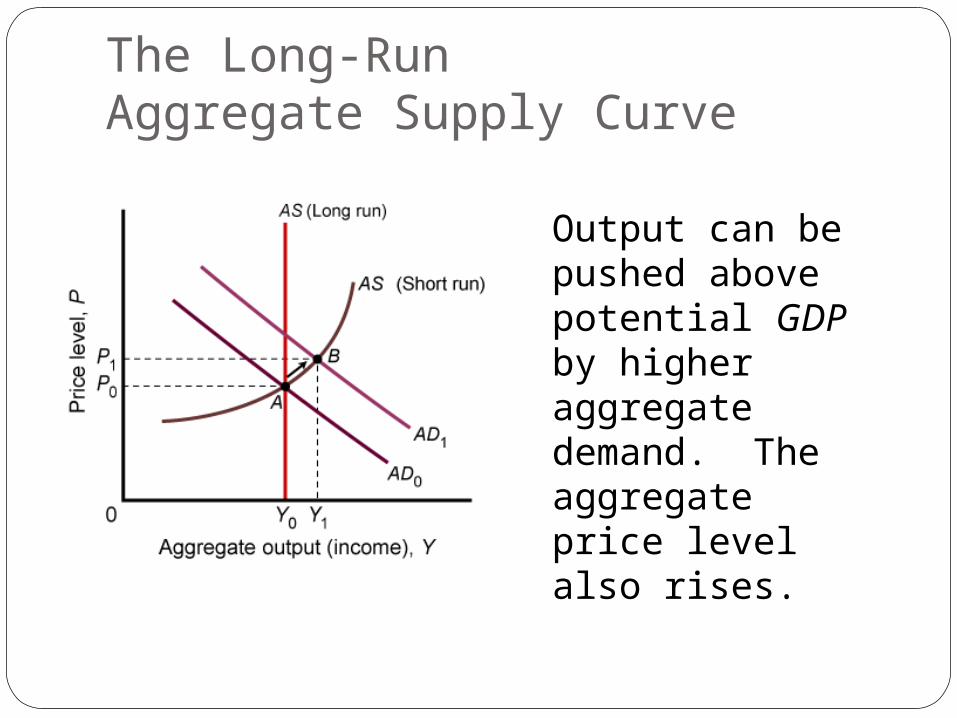
The Long-RunAggregate Supply Curve
Output can be pushed above potential GDP by higher aggregate demand. The aggregate price level also rises.
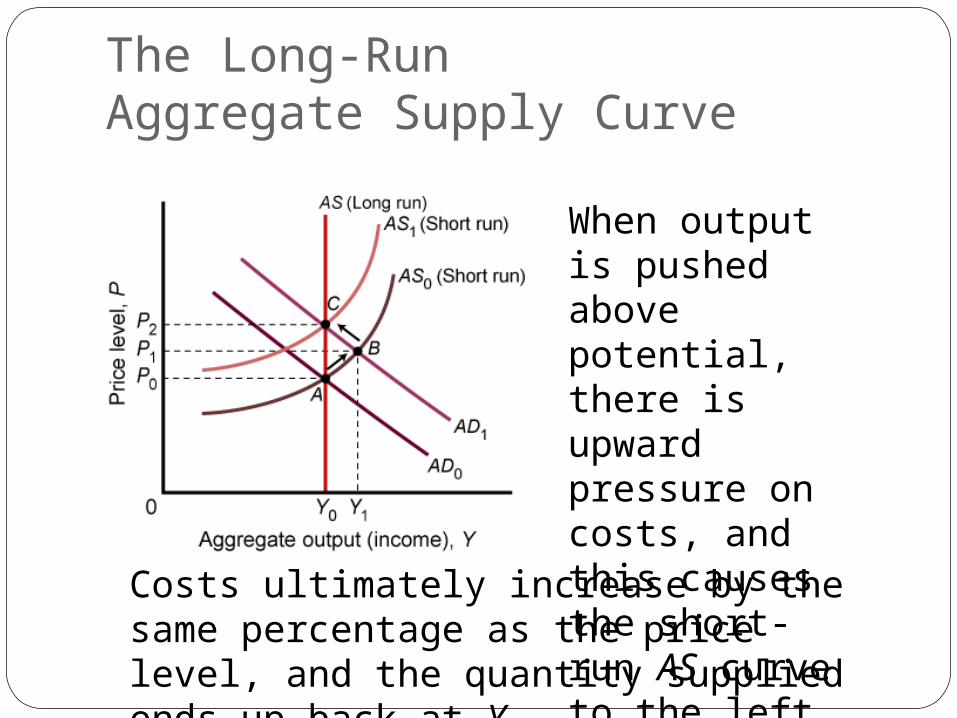
The Long-RunAggregate Supply Curve
When output is pushed above potential, there is upward pressure on costs, and this causes the short-run AS curve to the left.
Costs ultimately increase by the same percentage as the price level, and the quantity supplied ends up back at Y0.
The Long-RunAggregate Supply Curve
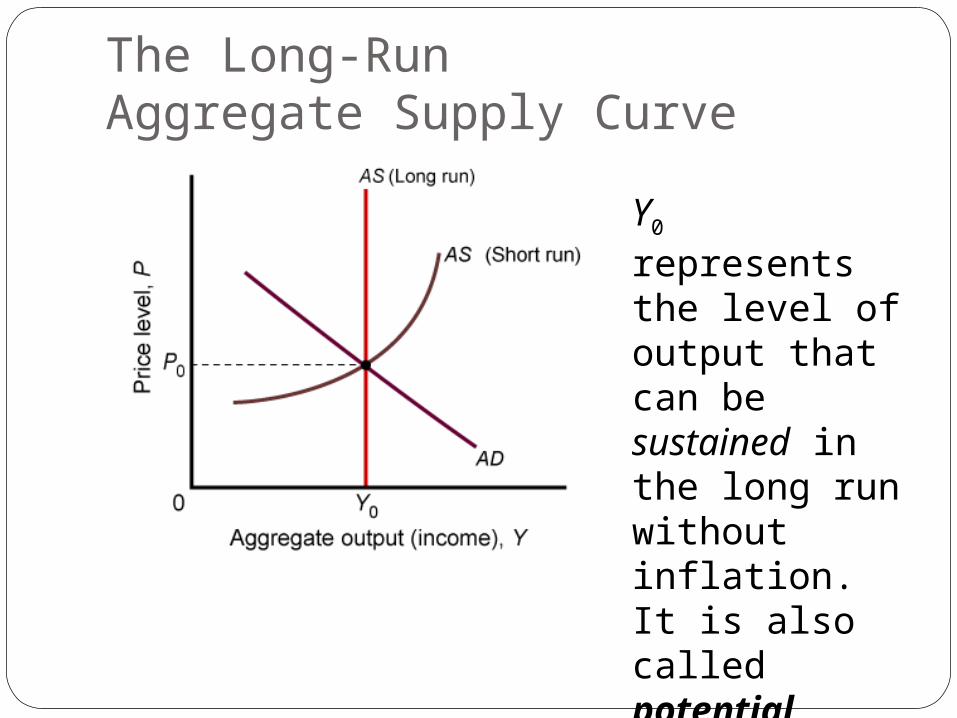
Y0 represents the level of output that can be sustained in the long run without inflation. It is also called potential output or potential GDP.
Aggregate Demand, AggregateSupply, and Monetary and Fiscal Policy
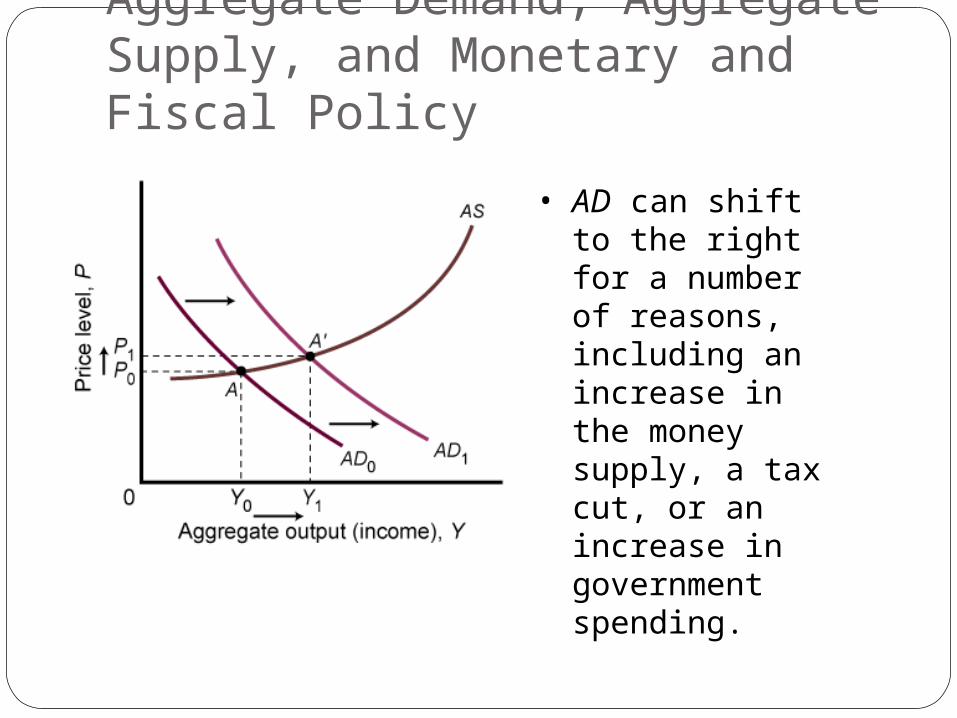
• AD can shift to the right for a number of reasons, including an increase in the money supply, a tax cut, or an increase in government spending.
The Simple “Keynesian”Aggregate Supply Curve
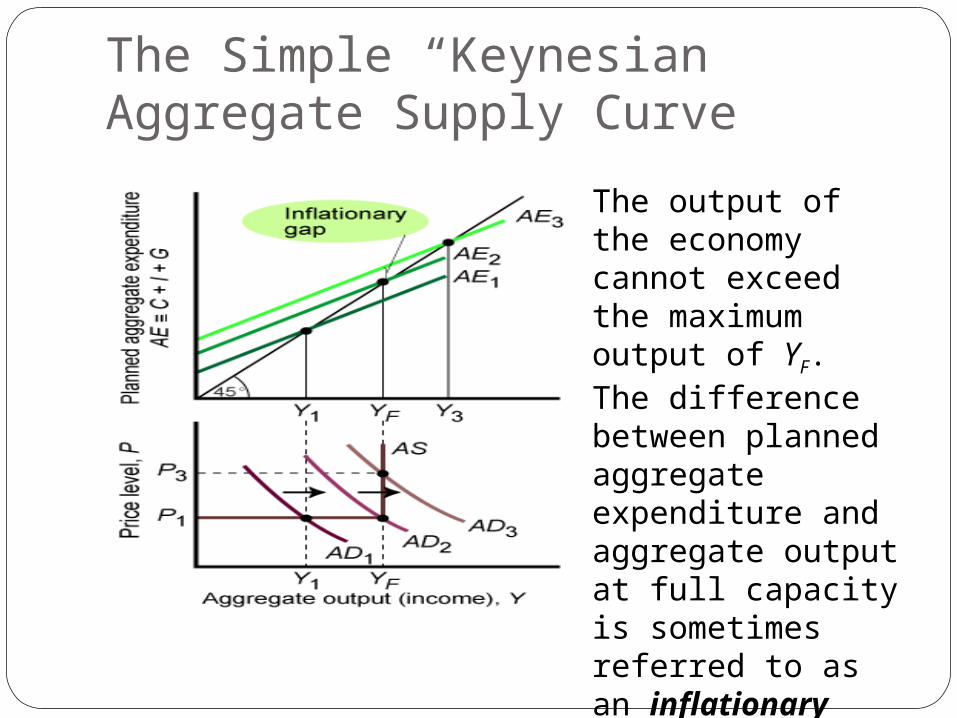
The output of the economy cannot exceed the maximum output of YF.The difference between planned aggregate expenditure and aggregate output at full capacity is sometimes referred to as an inflationary gap.
Causes of InflationInflation is an increase in the overall price
level.Sustained inflation occurs when the
overall price level continues to rise over some fairly long period of time.
Causes of Inflation
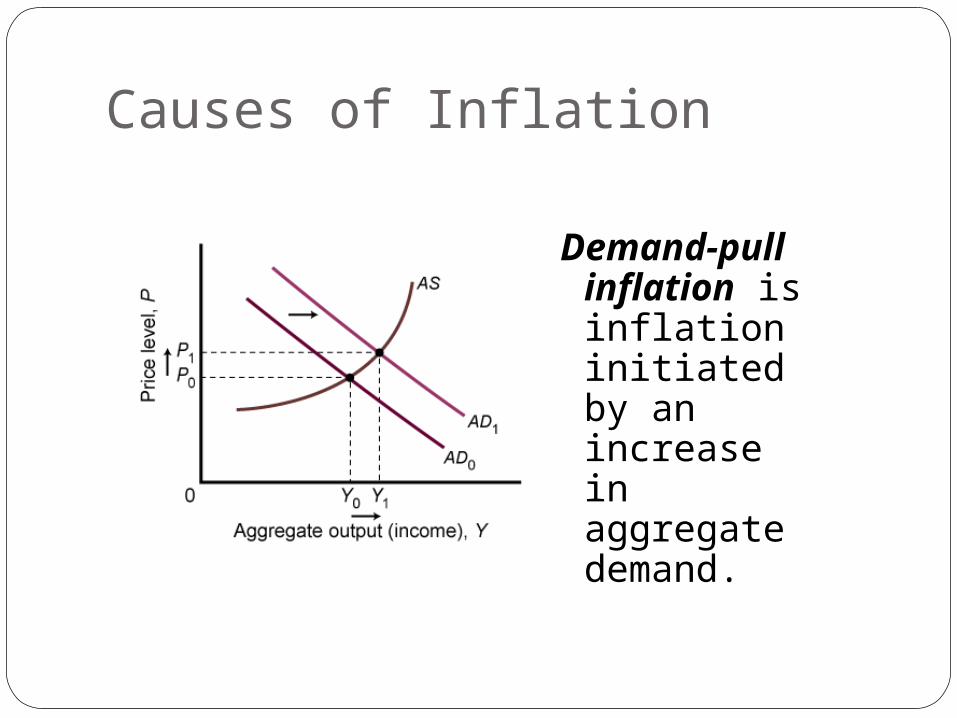
Demand-pull inflation is inflation initiated by an increase in aggregate demand.
Causes of Inflation
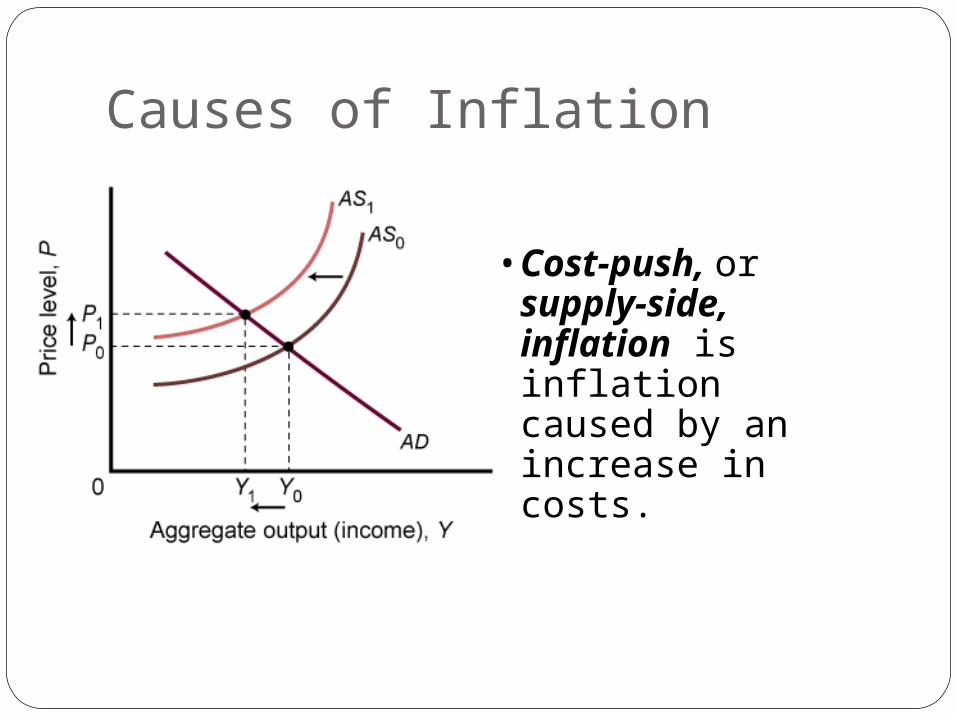
•Cost-push, or supply-side, inflation is inflation caused by an increase in costs.
Cost-Push, or Supply-Side Inflation
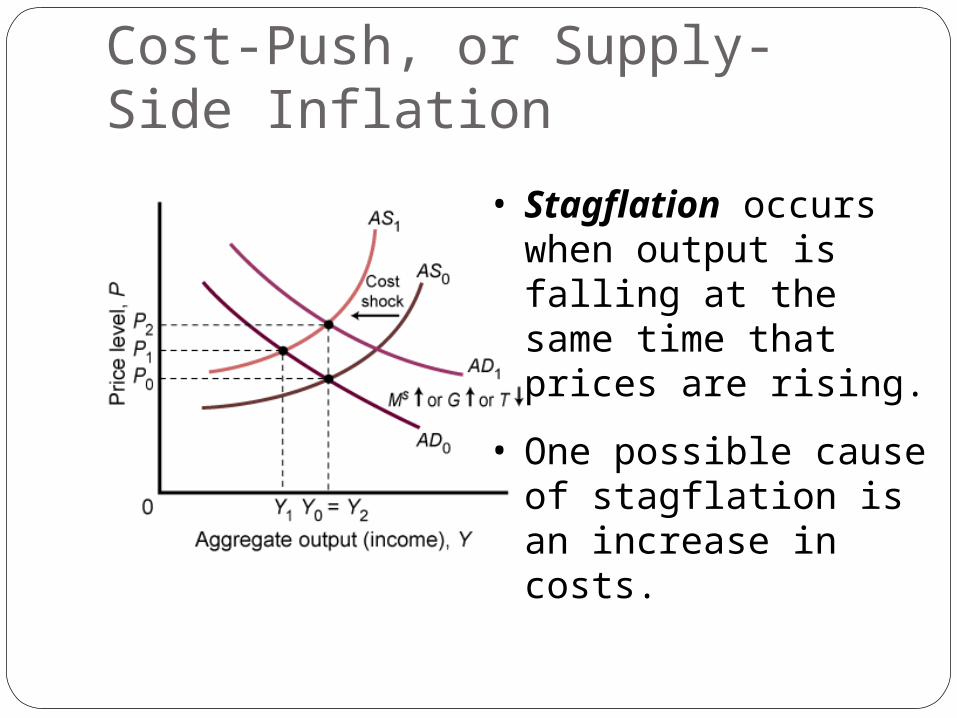
• Stagflation occurs when output is falling at the same time that prices are rising.
• One possible cause of stagflation is an increase in costs.
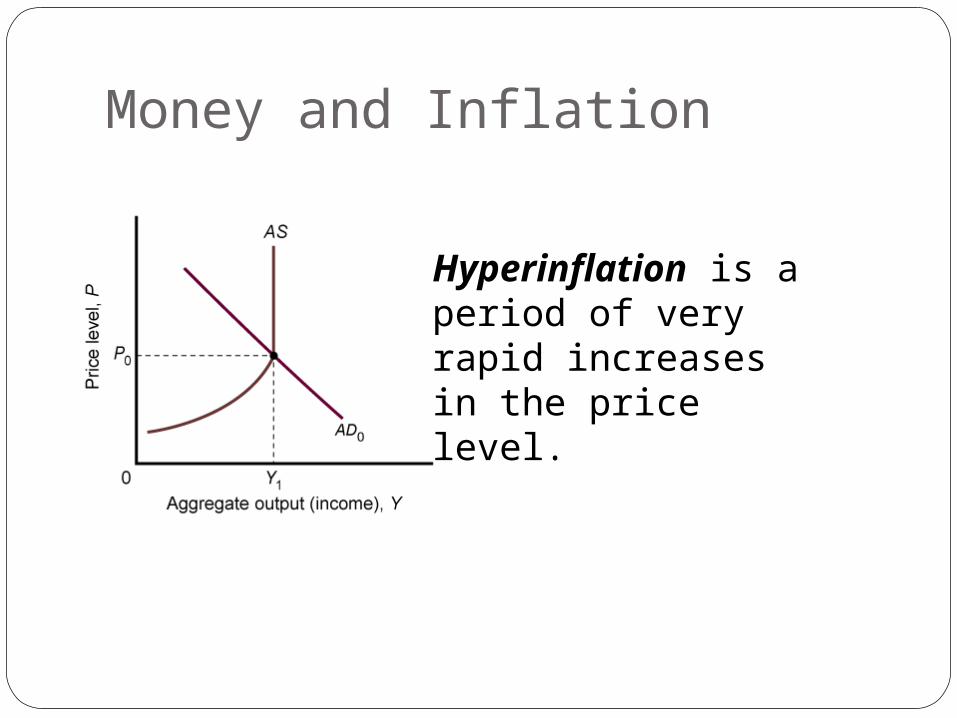
Money and Inflation
Hyperinflation is a period of very rapid increases in the price level.
THANX