Embed Size (px)
Citation preview
Magdy et al., J. Mater. Environ. Sci., 2018, 9 (2), pp. 570-584 570 !
J. Mater. Environ. Sci., 2018, Volume 9, Issue 2, Page 570-584
https://doi.org/10.26872/jmes.2018.9.2.63
http://www.jmaterenvironsci.com!
Journal(of(Materials(and((Environmental(Sciences(ISSN(:(2028;2508(CODEN(:(JMESCN(
Copyright(©(2018,(((((((((((((((((((((((((((((University(of(Mohammed(Premier(((((((Oujda(Morocco(
!
!
!
!
!
!
!
!
!
!
!
!!
!
!
1.( Introduction
Phenolic compounds occur both naturally and synthetically. In nature, phenolic compounds are present in fossil fuels and may be produced by the microbial decomposition of protein, humic acids and lignin [1]. Many industries produce wastewater containing phenolic compounds. These industries include oil refineries, paper, petroleum, pesticides, leather, paint, solvent, pharmaceutical, plastic, and iron-steel industries [2, 3]. Phenolic compounds may also be present in water bodies as a result of accidents. In 2002, a 100 m3 p-nitrophenol storage tank roof broke apart causing a severe pollution incident [4]. In another incident, following a spill in 2006 at a Chinese chemical plant, the phenol-related chemicals was found to be nearly 50 % above permitted level in the Amur River, Russia [5].
The discharge of wastewater containing phenolic compounds into water bodies has a severe problem since phenols impart toxicity to plants, animals, aquatic life and human being [6, 7]. The ingestion of phenolic compounds in the human body causes damage to the kidney, liver, pancreas. They also cause tissue erosion and paralysis of the central nervous system [8]. Due to its severe toxicity, phenols are considered as priority pollutants by the US Environmental Protection Agency [9]. Large volumes of phenolic compounds are disposed worldwide. For example in Europe more than 2000 ton/year of phenolic compounds are released as indirect emission to the environment [10].
Many methods are used for removal of phenolic compounds from water, e.g. biological processes, solvent extraction, irradiation, chemical oxidation, and incineration [2, 11]. However, the treatment efficiency is weak due to the resistant of phenolic compounds to the conventional treatment techniques [12].
Various studies have been performed to investigate the removal of phenolic compounds by adsorption [13] and several substances were tested for adsorption of these compounds from wastewater. These substances include activated carbon [3, 14-16], fly ash and impregnated fly ash [17], polymeric compounds [18], silica
Equilibrium and Kinetic Modeling for the Adsorption of Three Phenolic Compounds onto Cement Kiln Dust
1 E.A. Abdelghany, *2H. Altaher, 1Y. H. Magdy
1. Department of Chemical Engineering, Faculty of Engineering, El-Minia University P.O. Box 61511, Egypt 2. College of Health Sciences, Jumeira University, P.O.Box 555532, Dubai, United Arab Emirates
!
Abstract
Phenolic compounds; classified as priority pollutants by Environmental Protection Agency (EPA), exist widely in many of the industrial effluents such as those from oil refineries, coal tar, plastics, leather, paints, pharmaceutical and steel industry. In the present study, cement kiln dust (CKD) was investigated as an adsorbent for three phenolic compounds (o-cresol, o-chlorophenol and o-nitrophenol). Equilibrium and kinetics properties of the adsorption process were studied. The experimental data was found to best fit Langmuir model. Also, the results have been proven the favorability of cement kiln dust for removal of the phenolic compounds with chemisorption to be the mechanism of adsorption. The maximum adsorption capacity was found to be 100 mg/g for o-cresol, 167 mg/g for o-chlorophenol and 125 mg/g for o-nitrophenol. The adsorption process was found to be rapid for the three adsorbates. The equilibrium was attained faster in case of o-nitrophenol compared with the other two compounds. The film diffusion was found to control the adsorption process.
Received 22 Dec 2016, Revised 23 Mar 2017, Accepted 30Mar 2017
Keywords
!! Adsorption !! Cement Kiln Dust !! Isotherm !! Kinetic !! Phenols !! Wastewater
HAltaher [email protected] Phone : 9710582203458 Fax: +97104 346 5353
Magdy et al., J. Mater. Environ. Sci., 2018, 9 (2), pp. 570-584 571 !
[19], and zeolites [20]. Among these adsorbents, active carbon represents a good choice due to its high adsorption capacity. However, the cost of its production and regeneration is very high [21].
Cement kiln dust is a solid waste, but due to its very fine form it contaminates the air in open area around the cement mills. In general, the production of 1 ton of cement involves the comminution of about 2.6 to 2.8 tons of raw materials, clinker, gypsum, and blast-furnace slag. Between 5 and 10% of these finely powdered materials will be suspended as dust and will have to be substantially removed before discharge into the atmosphere. Depending on plant operating conditions, the quantity of air to be treated per kg of cement production is between 6 and 12 m3.
The objective of this research paper is to investigate the potential of cement kiln dust (CKD) as adsorbent for treatment of wastewater. It was tested for removal of three phenolic compounds; namely o-cresol, o-chlorophenol and o-nitrophenol from aqueous effluents. 2.(Experimental details
2.1.Adsorbent The experiments were conducted using white cement kiln dust (CKD) as an adsorbent. The cement kiln dust was collected from El-Minia White Portland Cement Factory, El-Minia Governorate, Egypt. It was obtained as a very fine powder. The CKD was used without any treatment. A sieve analysis was performed to characterize the cement dust. The chemical composition of CKD was determined using X-ray fluorescence (ARL, made in Switzerland). The cement kiln dust of powder form (particle sized ranged between 0.3 mm to less than 0.075 mm) was used for bench scale adsorption studies (equilibrium isotherm and kinetic studies). 2.2. Adsorbate Three different Phenolic compounds; o-cresol, o-chlorophenol and o-nitrophenol, were used as adsorbates. These compounds were A.R. grade (BDH Chemicals Ltd Poole, England). The absorbance values for a range of known concentration of the three solutes of phenolic compounds were determined at the maximum wavelengths shown in Table 1:
Table 1: Maximum Wavelength for Adsorbates (nm) Adsorbate λ Max., (nm)
o-cresol o-chlorophenol o-nitrophenol
271 274 351
A calibration curves for these compounds were prepared to calculate the concentration of phenolic compounds before and after adsorption using Shimadzu UV-Vis Spectrophotometer. 2.3. Equilibrium isotherm experiment Equilibrium isotherms were determined by the bottle-point method [22]. A fixed amount of adsorbents (0.2 g) was added to bottles containing 25 mL of organic solution (different initial concentrations Co ranging from 10 to 140 mg/l). The pH of all phenolic solution was adjusted at 11.35. The bottles were sealed and shaken at room temperature (22o C ±2) for a period of 3 hours. Solution concentration (Ce) was analyzed using UV-Spectrophotometer. The difference between the initial phenolic compounds concentration Co and the equilibrium concentration Ce was used to calculate the amount of phenolic compounds removed (qe , mg/g) from the solution as follows:
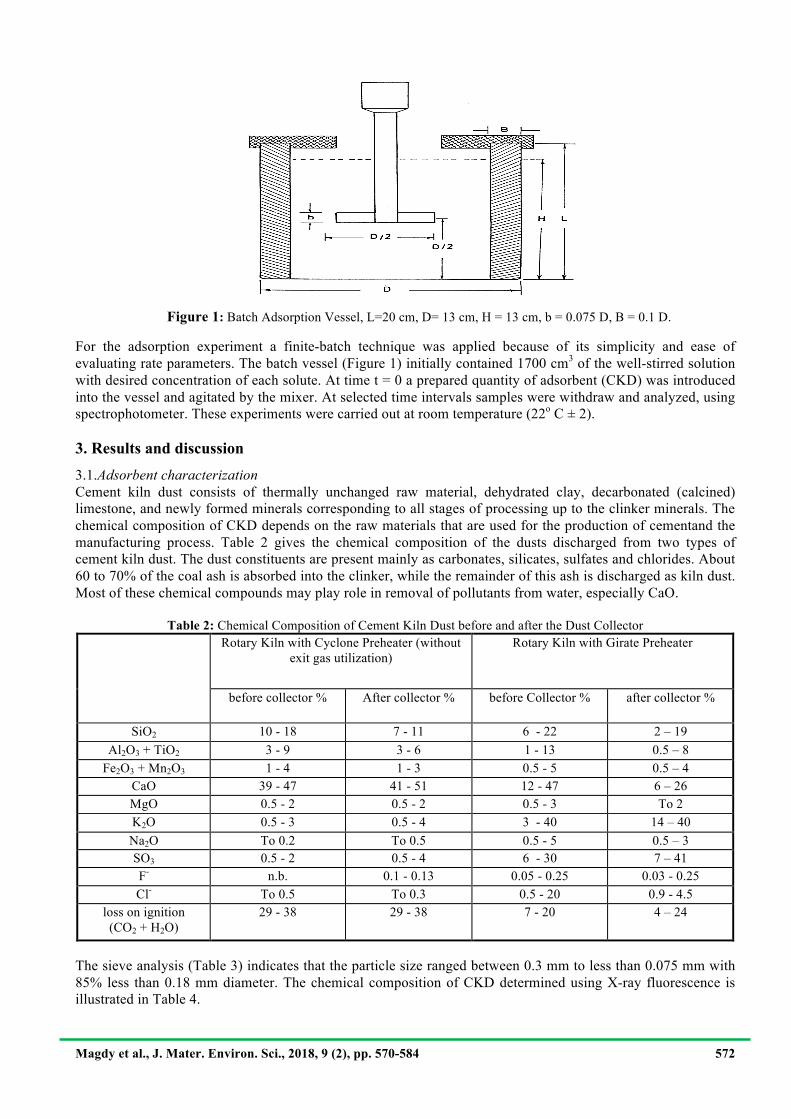
Where V is the volume of the solution (L), and M is the mass of adsorbent (g), and Co and Ce (mg/L) are the initial and final concentration of phenolic compounds, respectively. 2.4. Kinetics of adsorption in batch adsorbers An adsorber vessel is used as shown in Figure 1 [23-25]. Eight baffles were evenly spaced around the circumference of the vessel at 45o angles held firmly in place by PVC baffle holder. Evaporation of liquid was prevented by using a thick polyethylene sheet at the top of the Polyvinyl chloride (PVC) ring.
( ) )1(MCCVq e
e−
= ο
Magdy et al., J. Mater. Environ. Sci., 2018, 9 (2), pp. 570-584 572 !
For the adsorption experiment a finite-batch technique was applied because of its simplicity and ease of evaluating rate parameters. The batch vessel (Figure 1) initially contained 1700 cm3 of the well-stirred solution with desired concentration of each solute. At time t = 0 a prepared quantity of adsorbent (CKD) was introduced into the vessel and agitated by the mixer. At selected time intervals samples were withdraw and analyzed, using spectrophotometer. These experiments were carried out at room temperature (22o C ± 2). 3. Results and discussion
3.1.Adsorbent characterization!Cement kiln dust consists of thermally unchanged raw material, dehydrated clay, decarbonated (calcined) limestone, and newly formed minerals corresponding to all stages of processing up to the clinker minerals. The chemical composition of CKD depends on the raw materials that are used for the production of cementand the manufacturing process. Table 2 gives the chemical composition of the dusts discharged from two types of cement kiln dust. The dust constituents are present mainly as carbonates, silicates, sulfates and chlorides. About 60 to 70% of the coal ash is absorbed into the clinker, while the remainder of this ash is discharged as kiln dust. Most of these chemical compounds may play role in removal of pollutants from water, especially CaO.
Table 2: Chemical Composition of Cement Kiln Dust before and after the Dust Collector
Rotary Kiln with Cyclone Preheater (without exit gas utilization)
Rotary Kiln with Girate Preheater
before collector % After collector % before Collector % after collector %
SiO2 10 - 18 7 - 11 6 - 22 2 – 19 Al2O3 + TiO2
3 - 9 3 - 6 1 - 13 0.5 – 8
Fe2O3 + Mn2O3
1 - 4 1 - 3 0.5 - 5 0.5 – 4 CaO
39 - 47
41 - 51 12 - 47 6 – 26
MgO 0.5 - 2 0.5 - 2 0.5 - 3 To 2 K2O
0.5 - 3 0.5 - 4 3 - 40 14 – 40
Na2O
To 0.2 To 0.5 0.5 - 5 0.5 – 3 SO3
0.5 - 2 0.5 - 4 6 - 30 7 – 41
F- n.b. 0.1 - 0.13 0.05 - 0.25 0.03 - 0.25 Cl- To 0.5 To 0.3 0.5 - 20 0.9 - 4.5
loss on ignition (CO2 + H2O)
29 - 38 29 - 38 7 - 20 4 – 24
The sieve analysis (Table 3) indicates that the particle size ranged between 0.3 mm to less than 0.075 mm with 85% less than 0.18 mm diameter. The chemical composition of CKD determined using X-ray fluorescence is illustrated in Table 4.
Figure 1: Batch Adsorption Vessel, L=20 cm, D= 13 cm, H = 13 cm, b = 0.075 D, B = 0.1 D.
Magdy et al., J. Mater. Environ. Sci., 2018, 9 (2), pp. 570-584 573 !
Table 3: Sieve analysis of Cement Kiln Dust (CKD) Mesh No. 50 60 70 80 100 120 140 170 200 Less
Diam. mm 0.3 0.25 0.21 0.18 0.15 0.125 0.1 0.09 0.075 Less Remaining
wt. gm 2.68 8.9 40.8 59.85 74.55 48.9 42.39 40.5 21.62 9.31
% Occurrence 0.76 2.54 11.6 17.1 21.3 13.97 12.11 11.57 6.17 2.61
Table 4: Chemical analysis of Cement Kiln Dust (CKD) Compound Weight per cent
SiO2 Fe2O3 Al2O3 CaO MgO SO3 Cl2
22.2 0.11 2.78 45.0 0.21 4.0
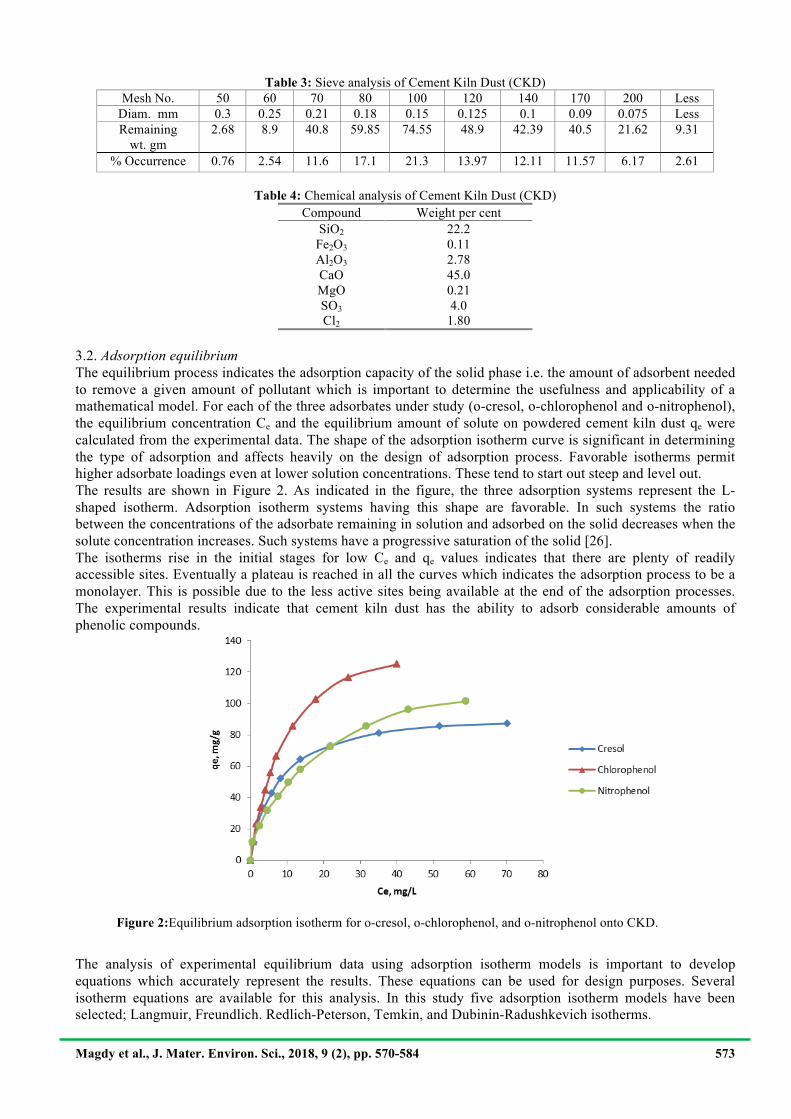
1.80 3.2. Adsorption equilibrium The equilibrium process indicates the adsorption capacity of the solid phase i.e. the amount of adsorbent needed to remove a given amount of pollutant which is important to determine the usefulness and applicability of a mathematical model. For each of the three adsorbates under study (o-cresol, o-chlorophenol and o-nitrophenol), the equilibrium concentration Ce and the equilibrium amount of solute on powdered cement kiln dust qe were calculated from the experimental data. The shape of the adsorption isotherm curve is significant in determining the type of adsorption and affects heavily on the design of adsorption process. Favorable isotherms permit higher adsorbate loadings even at lower solution concentrations. These tend to start out steep and level out. The results are shown in Figure 2. As indicated in the figure, the three adsorption systems represent the L-shaped isotherm. Adsorption isotherm systems having this shape are favorable. In such systems the ratio between the concentrations of the adsorbate remaining in solution and adsorbed on the solid decreases when the solute concentration increases. Such systems have a progressive saturation of the solid [26]. The isotherms rise in the initial stages for low Ce and qe values indicates that there are plenty of readily accessible sites. Eventually a plateau is reached in all the curves which indicates the adsorption process to be a monolayer. This is possible due to the less active sites being available at the end of the adsorption processes. The experimental results indicate that cement kiln dust has the ability to adsorb considerable amounts of phenolic compounds.
!
The analysis of experimental equilibrium data using adsorption isotherm models is important to develop equations which accurately represent the results. These equations can be used for design purposes. Several isotherm equations are available for this analysis. In this study five adsorption isotherm models have been selected; Langmuir, Freundlich. Redlich-Peterson, Temkin, and Dubinin-Radushkevich isotherms.
Figure 2:Equilibrium adsorption isotherm for o-cresol, o-chlorophenol, and o-nitrophenol onto CKD.
Magdy et al., J. Mater. Environ. Sci., 2018, 9 (2), pp. 570-584 574 !
3.2.1. Langmuir adsorption isotherm
The first isotherm tested was the Langmuir [27] which is represented by equation (2):
Equation (3) represents the linear form of this model. It is convenient for plotting and determining the constants KL and aL:
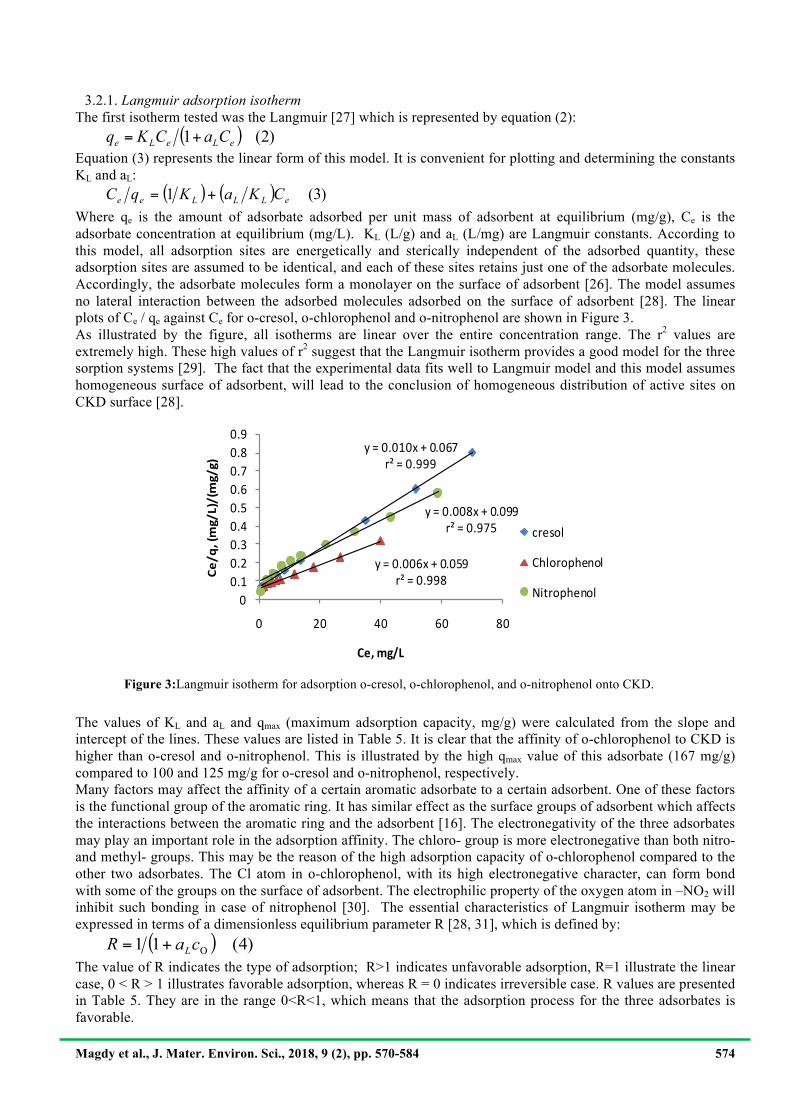
Where qe is the amount of adsorbate adsorbed per unit mass of adsorbent at equilibrium (mg/g), Ce is the adsorbate concentration at equilibrium (mg/L). KL (L/g) and aL (L/mg) are Langmuir constants. According to this model, all adsorption sites are energetically and sterically independent of the adsorbed quantity, these adsorption sites are assumed to be identical, and each of these sites retains just one of the adsorbate molecules. Accordingly, the adsorbate molecules form a monolayer on the surface of adsorbent [26]. The model assumes no lateral interaction between the adsorbed molecules adsorbed on the surface of adsorbent [28]. The linear plots of Ce / qe against Ce for o-cresol, o-chlorophenol and o-nitrophenol are shown in Figure 3. As illustrated by the figure, all isotherms are linear over the entire concentration range. The r2 values are extremely high. These high values of r2 suggest that the Langmuir isotherm provides a good model for the three sorption systems [29]. The fact that the experimental data fits well to Langmuir model and this model assumes homogeneous surface of adsorbent, will lead to the conclusion of homogeneous distribution of active sites on CKD surface [28].
!
The values of KL and aL and qmax (maximum adsorption capacity, mg/g) were calculated from the slope and intercept of the lines. These values are listed in Table 5. It is clear that the affinity of o-chlorophenol to CKD is higher than o-cresol and o-nitrophenol. This is illustrated by the high qmax value of this adsorbate (167 mg/g) compared to 100 and 125 mg/g for o-cresol and o-nitrophenol, respectively. Many factors may affect the affinity of a certain aromatic adsorbate to a certain adsorbent. One of these factors is the functional group of the aromatic ring. It has similar effect as the surface groups of adsorbent which affects the interactions between the aromatic ring and the adsorbent [16]. The electronegativity of the three adsorbates may play an important role in the adsorption affinity. The chloro- group is more electronegative than both nitro- and methyl- groups. This may be the reason of the high adsorption capacity of o-chlorophenol compared to the other two adsorbates. The Cl atom in o-chlorophenol, with its high electronegative character, can form bond with some of the groups on the surface of adsorbent. The electrophilic property of the oxygen atom in –NO2 will inhibit such bonding in case of nitrophenol [30]. The essential characteristics of Langmuir isotherm may be expressed in terms of a dimensionless equilibrium parameter R [28, 31], which is defined by:
The value of R indicates the type of adsorption; R>1 indicates unfavorable adsorption, R=1 illustrate the linear case, 0 < R > 1 illustrates favorable adsorption, whereas R = 0 indicates irreversible case. R values are presented in Table 5. They are in the range 0<R<1, which means that the adsorption process for the three adsorbates is favorable.
( ) )2(1 eLeLe CaCKq +=
( ) ( ) )3(1 eLLLee CKaKqC +=
y"="0.010x"+"0.067r²"="0.999
y"="0.006x"+"0.059r²"="0.998
y"="0.008x"+"0.099r²"="0.975
00.10.20.30.40.50.60.70.80.9
0 20 40 60 80
Ce/q,&(mg/L)/(mg/g)
Ce,&mg/L
cresol
Chlorophenol
Nitrophenol
( ) )4(11 Ο+= caR L
Figure 3:Langmuir isotherm for adsorption o-cresol, o-chlorophenol, and o-nitrophenol onto CKD.
Magdy et al., J. Mater. Environ. Sci., 2018, 9 (2), pp. 570-584 575 !
Table 5: Langmuir constants for phenolic solute adsorption systems
!
!
!
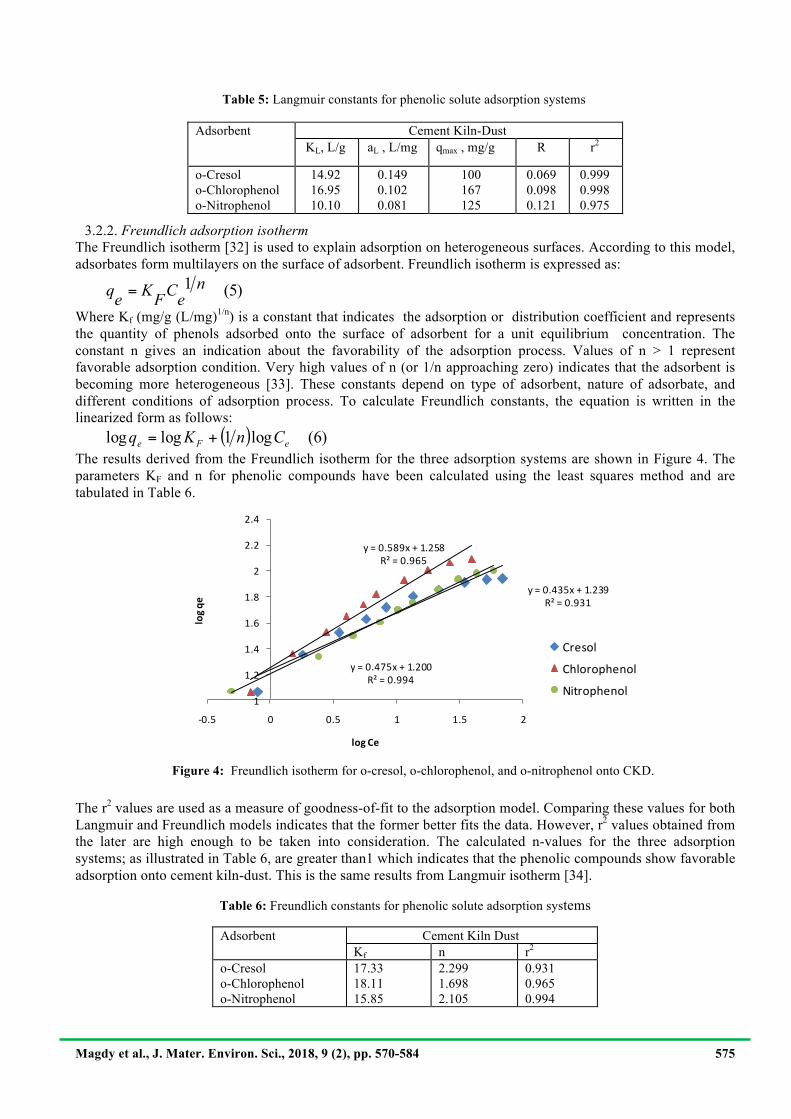
3.2.2. Freundlich adsorption isotherm The Freundlich isotherm [32] is used to explain adsorption on heterogeneous surfaces. According to this model, adsorbates form multilayers on the surface of adsorbent. Freundlich isotherm is expressed as:
Where Kf (mg/g (L/mg)1/n) is a constant that indicates the adsorption or distribution coefficient and represents the quantity of phenols adsorbed onto the surface of adsorbent for a unit equilibrium concentration. The constant n gives an indication about the favorability of the adsorption process. Values of n > 1 represent favorable adsorption condition. Very high values of n (or 1/n approaching zero) indicates that the adsorbent is becoming more heterogeneous [33]. These constants depend on type of adsorbent, nature of adsorbate, and different conditions of adsorption process. To calculate Freundlich constants, the equation is written in the linearized form as follows:
The results derived from the Freundlich isotherm for the three adsorption systems are shown in Figure 4. The parameters KF and n for phenolic compounds have been calculated using the least squares method and are tabulated in Table 6.
!The r2 values are used as a measure of goodness-of-fit to the adsorption model. Comparing these values for both Langmuir and Freundlich models indicates that the former better fits the data. However, r2 values obtained from the later are high enough to be taken into consideration. The calculated n-values for the three adsorption systems; as illustrated in Table 6, are greater than1 which indicates that the phenolic compounds show favorable adsorption onto cement kiln-dust. This is the same results from Langmuir isotherm [34].
Table 6: Freundlich constants for phenolic solute adsorption systems
Adsorbent Cement Kiln Dust Kf n r2
o-Cresol o-Chlorophenol o-Nitrophenol
17.33 18.11 15.85
2.299 1.698 2.105
0.931 0.965 0.994
)5(1 neCFKeq =
( ) )6(log1loglog eFe CnKq +=
y"="0.435x"+"1.239R²"="0.931
y"="0.589x"+"1.258R²"="0.965
y"="0.475x"+"1.200R²"="0.994
1
1.2
1.4
1.6
1.8
2
2.2
2.4
30.5 0 0.5 1 1.5 2
log$q
e
log$Ce
Cresol
Chlorophenol
Nitrophenol
Adsorbent Cement Kiln-Dust KL, L/g aL , L/mg qmax , mg/g R r2
o-Cresol o-Chlorophenol o-Nitrophenol
14.92 16.95 10.10
0.149 0.102 0.081
100 167 125
0.069 0.098 0.121
0.999 0.998 0.975
Figure 4: Freundlich isotherm for o-cresol, o-chlorophenol, and o-nitrophenol onto CKD.
Magdy et al., J. Mater. Environ. Sci., 2018, 9 (2), pp. 570-584 576 !
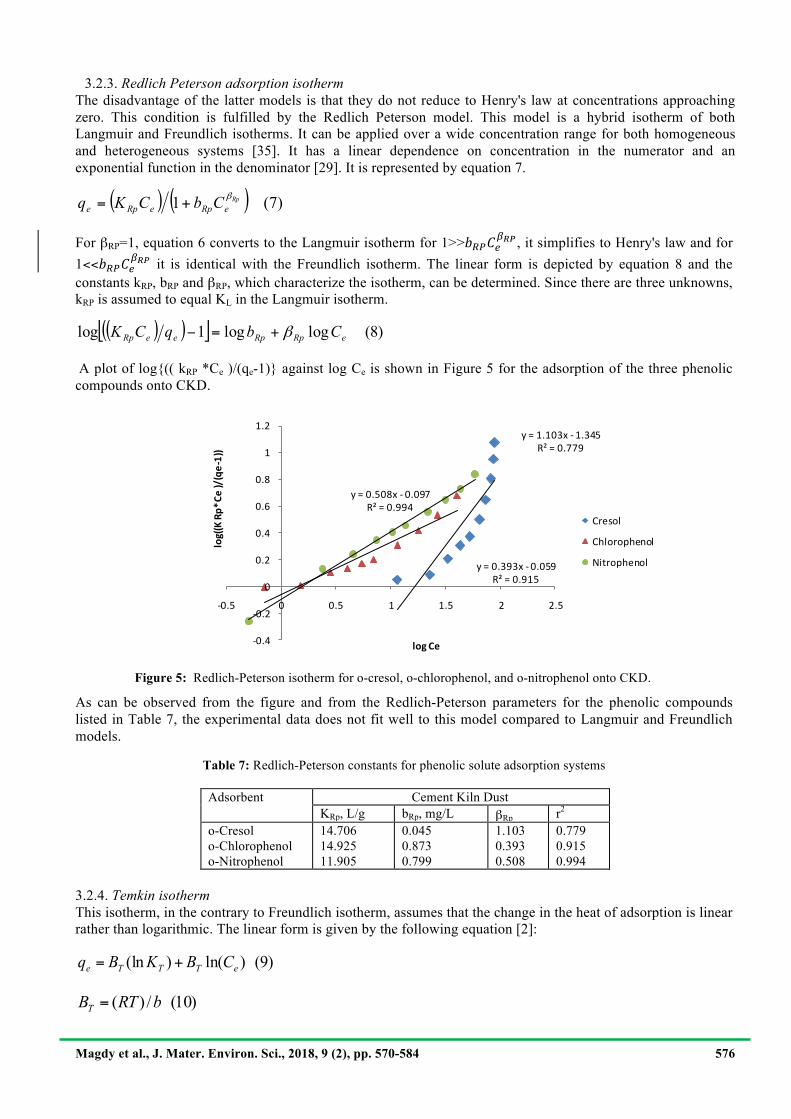
3.2.3. Redlich Peterson adsorption isotherm The disadvantage of the latter models is that they do not reduce to Henry's law at concentrations approaching zero. This condition is fulfilled by the Redlich Peterson model. This model is a hybrid isotherm of both Langmuir and Freundlich isotherms. It can be applied over a wide concentration range for both homogeneous and heterogeneous systems [35]. It has a linear dependence on concentration in the numerator and an exponential function in the denominator [29]. It is represented by equation 7.
For βRP=1, equation 6 converts to the Langmuir isotherm for 1>>!"#$%&'(, it simplifies to Henry's law and for 1<<!"#$%&'( it is identical with the Freundlich isotherm. The linear form is depicted by equation 8 and the constants kRP, bRP and βRP, which characterize the isotherm, can be determined. Since there are three unknowns, kRP is assumed to equal KL in the Langmuir isotherm.
A plot of log{(( kRP *Ce )/(qe-1)} against log Ce is shown in Figure 5 for the adsorption of the three phenolic compounds onto CKD.
As can be observed from the figure and from the Redlich-Peterson parameters for the phenolic compounds listed in Table 7, the experimental data does not fit well to this model compared to Langmuir and Freundlich models.
Table 7: Redlich-Peterson constants for phenolic solute adsorption systems
Adsorbent Cement Kiln Dust KRp, L/g bRp, mg/L βRp r2
o-Cresol o-Chlorophenol o-Nitrophenol
14.706 14.925 11.905
0.045 0.873 0.799
1.103 0.393 0.508
0.779 0.915 0.994
3.2.4. Temkin isotherm This isotherm, in the contrary to Freundlich isotherm, assumes that the change in the heat of adsorption is linear rather than logarithmic. The linear form is given by the following equation [2]:
!
( ) ( ) )7(1 RpeRpeRpe CbCKq β+=
( )( )[ ] )8(loglog1log eRpRpeeRp CbqCK β+=−
y"="1.103x") 1.345R²"="0.779
y"="0.393x") 0.059R²"="0.915
y"="0.508x") 0.097R²"="0.994
)0.4
)0.2
0
0.2
0.4
0.6
0.8
1
1.2
)0.5 0 0.5 1 1.5 2 2.5
log((K&Rp*
Ce&)/(qe/1))
log&Ce
Cresol
Chlorophenol
Nitrophenol
)9()ln()(ln eTTTe CBKBq +=
)10(/)( bRTBT =
Figure 5: Redlich-Peterson isotherm for o-cresol, o-chlorophenol, and o-nitrophenol onto CKD.
Magdy et al., J. Mater. Environ. Sci., 2018, 9 (2), pp. 570-584 577 !
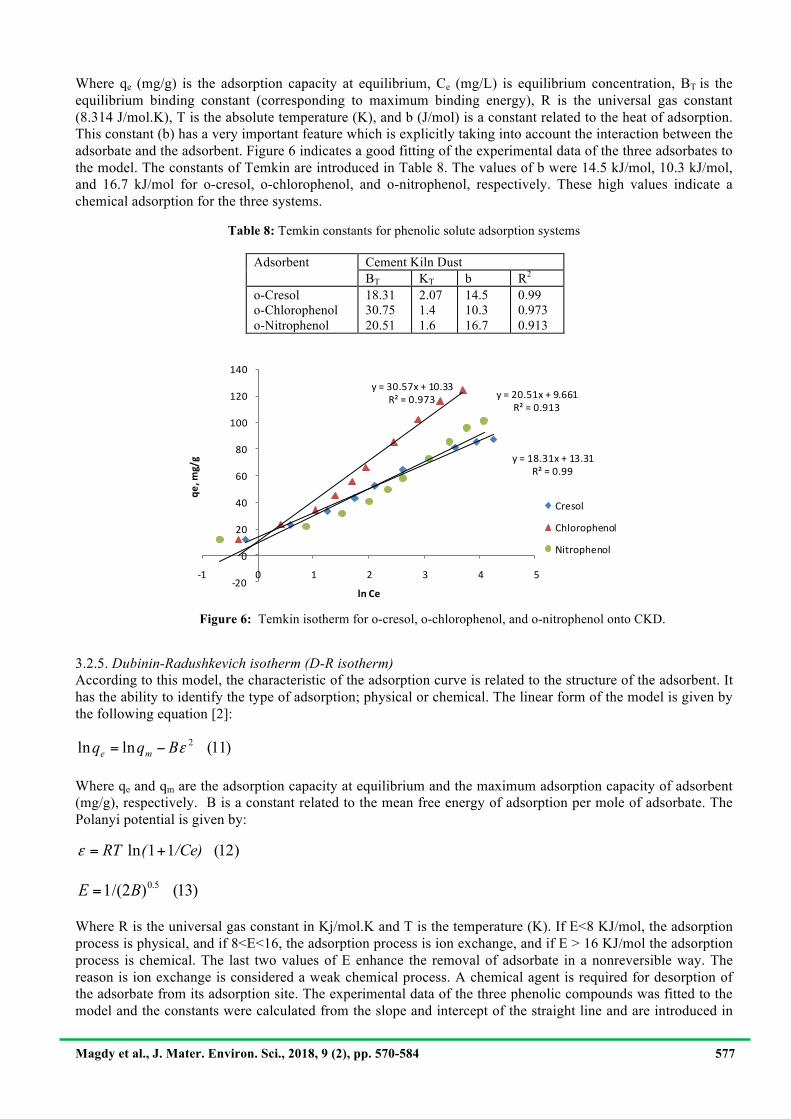
Where qe (mg/g) is the adsorption capacity at equilibrium, Ce (mg/L) is equilibrium concentration, BT is the equilibrium binding constant (corresponding to maximum binding energy), R is the universal gas constant (8.314 J/mol.K), T is the absolute temperature (K), and b (J/mol) is a constant related to the heat of adsorption. This constant (b) has a very important feature which is explicitly taking into account the interaction between the adsorbate and the adsorbent. Figure 6 indicates a good fitting of the experimental data of the three adsorbates to the model. The constants of Temkin are introduced in Table 8. The values of b were 14.5 kJ/mol, 10.3 kJ/mol, and 16.7 kJ/mol for o-cresol, o-chlorophenol, and o-nitrophenol, respectively. These high values indicate a chemical adsorption for the three systems.
Table 8: Temkin constants for phenolic solute adsorption systems
Adsorbent Cement Kiln Dust BT KT b R2
o-Cresol o-Chlorophenol o-Nitrophenol
18.31 30.75 20.51
2.07 1.4 1.6
14.5 10.3 16.7
0.99 0.973 0.913
3.2.5. Dubinin-Radushkevich isotherm (D-R isotherm) According to this model, the characteristic of the adsorption curve is related to the structure of the adsorbent. It has the ability to identify the type of adsorption; physical or chemical. The linear form of the model is given by the following equation [2]:
!
Where qe and qm are the adsorption capacity at equilibrium and the maximum adsorption capacity of adsorbent (mg/g), respectively. B is a constant related to the mean free energy of adsorption per mole of adsorbate. The Polanyi potential is given by:
!
!
Where R is the universal gas constant in Kj/mol.K and T is the temperature (K). If E<8 KJ/mol, the adsorption process is physical, and if 8<E<16, the adsorption process is ion exchange, and if E > 16 KJ/mol the adsorption process is chemical. The last two values of E enhance the removal of adsorbate in a nonreversible way. The reason is ion exchange is considered a weak chemical process. A chemical agent is required for desorption of the adsorbate from its adsorption site. The experimental data of the three phenolic compounds was fitted to the model and the constants were calculated from the slope and intercept of the straight line and are introduced in
y"="18.31x"+"13.31R²"="0.99
y"="30.57x"+"10.33R²"="0.973 y"="20.51x"+"9.661
R²"="0.913
220
0
20
40
60
80
100
120
140
21 0 1 2 3 4 5
qe,$m
g/g
ln$Ce
Cresol
Chlorophenol
Nitrophenol
)11(lnln 2εBqq me −=
)12(11ln /Ce)(RT +=ε
)13()2/(1 5.0BE =
Figure 6: Temkin isotherm for o-cresol, o-chlorophenol, and o-nitrophenol onto CKD.
Magdy et al., J. Mater. Environ. Sci., 2018, 9 (2), pp. 570-584 578 !
Table 9. The high values of E (>8 Kj/mol) indicates that chemisorption plays a significant role in the adsorption process. The correlation coefficients are less than that of Langmuir isotherm; however, they are high enough to rely on the obtained results.
Table 9: D-R constants for phenolic solute adsorption systems
Adsorbent Cement Kiln Dust E qm r2
o-Cresol o-Chlorophenol o-Nitrophenol
11.2 10 11.2
369 1234 248
0.962 0.984 0.984
3.3. Kinetics of Adsorption The study of the adsorption kinetics is very important since it provides valuable information that is needed for the design of the adsorption process. The kinetic study, for instance, determines the rate of adsorption. This rate of adsorption will help in the calculation of the time required for adsorption process in the batch reactor. It also determines the mechanism of the adsorption process which helps in controlling the adsorption reaction. The adsorption rates of the three phenolic compounds on CKD was investigated by fitting the experimental data to two models; pseudo first order and pseudo second order models. The linearized form of the pseudo first order equation [27] is given by:
Where qe (mg/g) and qt (mg/g) are the amounts of adsorbate adsorbed on the surface of the adsorbent at equilibrium and at any time t (min), respectively, and k1 (min-1) is the rate constant of the pseudo first order equation. The values of k1are calculated from the slope and intercept of the plot of ln(qe - qt) versus t. Pseudo second order model [36] is given by:
Where k2 (g/mg.min) is the rate constant of the pseudo second order equation, qm (mg/g) is the maximum adsorption capacity, qt (mg/g) is the amount adsorbed at time t (min). The constants of the second order equation can be calculated from the slope and intercept of the line obtained by plotting t/qt against t. The initial adsorption rate h (mg/g.min) can be calculated using the following equation [37]:
The constants and correlation coefficients of the first and second order equations for all adsorption systems are introduced in Table 10. The r2 values for second order equation for the three phenols are very close to unity confirming the applicability of the pseudo second order kinetic for the adsorption process. This is in agreement with the results of other researchers [38, 39]. This result is normal since pseudo second order describes data related to adsorption on heterogeneous and/or porous systems [16]. It can also be observed from Table 10 that the initial rate of adsorption h, and the rate constant k2 of nitrophenol was found to be much higher than that of o-cresol and o-chlorophenol. This result is supported by that of Tseng et al. [16].
Table 10: Kinetic data for phenolic compounds adsorption on CKD
Adsorbent First order Second order K1 r2 K2 r2 h
o-Cresol o-Chlorophenol o-Nitrophenol
0.037 0.026 0.026
0.924 0.997 0.933
2.688 1.821 4.608
0.998 0.998 0.999
1767 3762 8001
It is necessary to study the mechanisms of adsorption in batch systems in order to determine the rate limiting step in adsorption process. System kinetics may be obtained by the mathematical modeling of mass transfer mechanism in adsorbate/adsorbent contact systems. Basically, the adsorption process is described by the following four steps; diffusion of the adsorbate molecules from the bulk of the solution to the thin layer around
)14(ln)ln( 1tkqqq ete −=−
)15(//1/ 22 mmt qtqkqt +=
)16(22 eqkh =
Magdy et al., J. Mater. Environ. Sci., 2018, 9 (2), pp. 570-584 579 !
the adsorbent, diffusion of the adsorbate through this layer to the surface of the adsorbent, diffusion from the surface to the pores of the adsorbent, and uptake of the adsorbate. The first and last steps are usually fast and are not considered when determining the rate limiting step. Consequently, the two rate limiting steps considered are external mass transfer and intraparticle diffusion. To investigate the diffusion mechanism, Weber and Morris model [40] was applied.
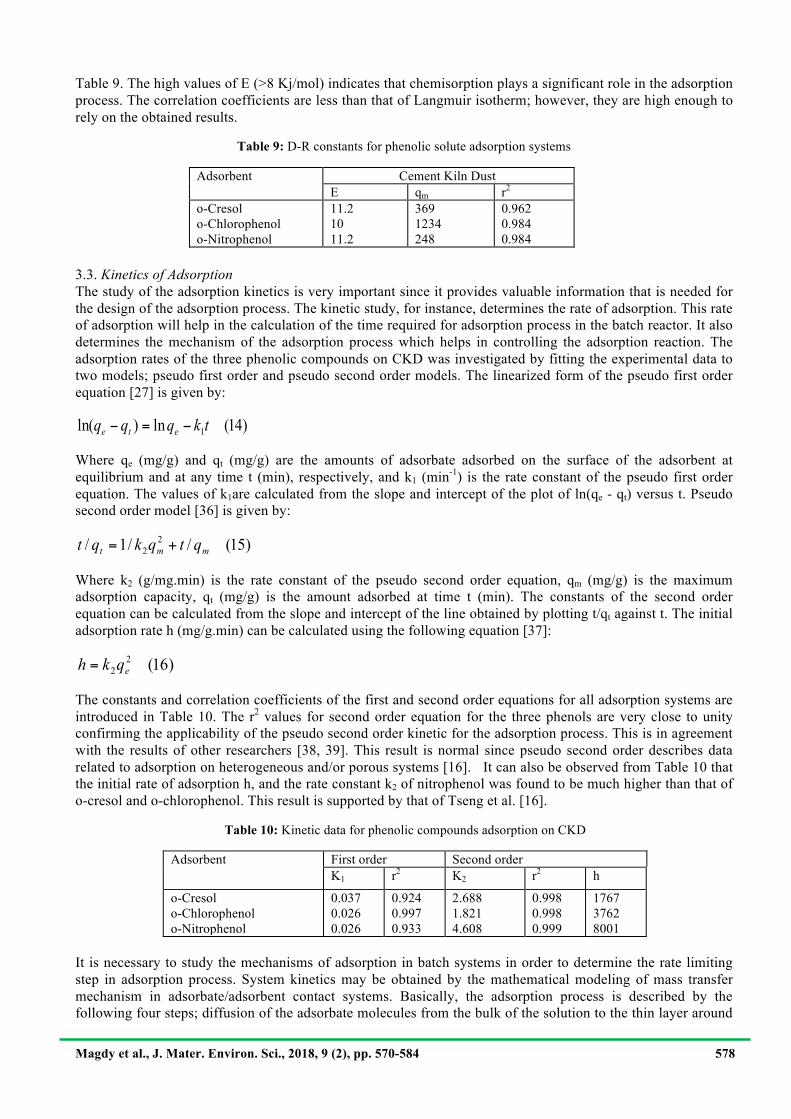
q* = K-./t1.3 + /C//////(17) Where qt (mg/g) is the adsorption capacity at any time t (min), Kid (mg/g min0.5) is the rate constant for the intraparticle diffusion model, and C is a constant that gives an indication about the thickness of the boundary layer. According to the model if the rate limiting step is intraparticle diffusion, a plot of qt against t0.5 should yield a straight line passing through the origin. As indicated by Figure 7, the data for all systems deviates from linearity and the lines do not pass by the origin which indicates that the intraparticle diffusion is not the rate limiting step.
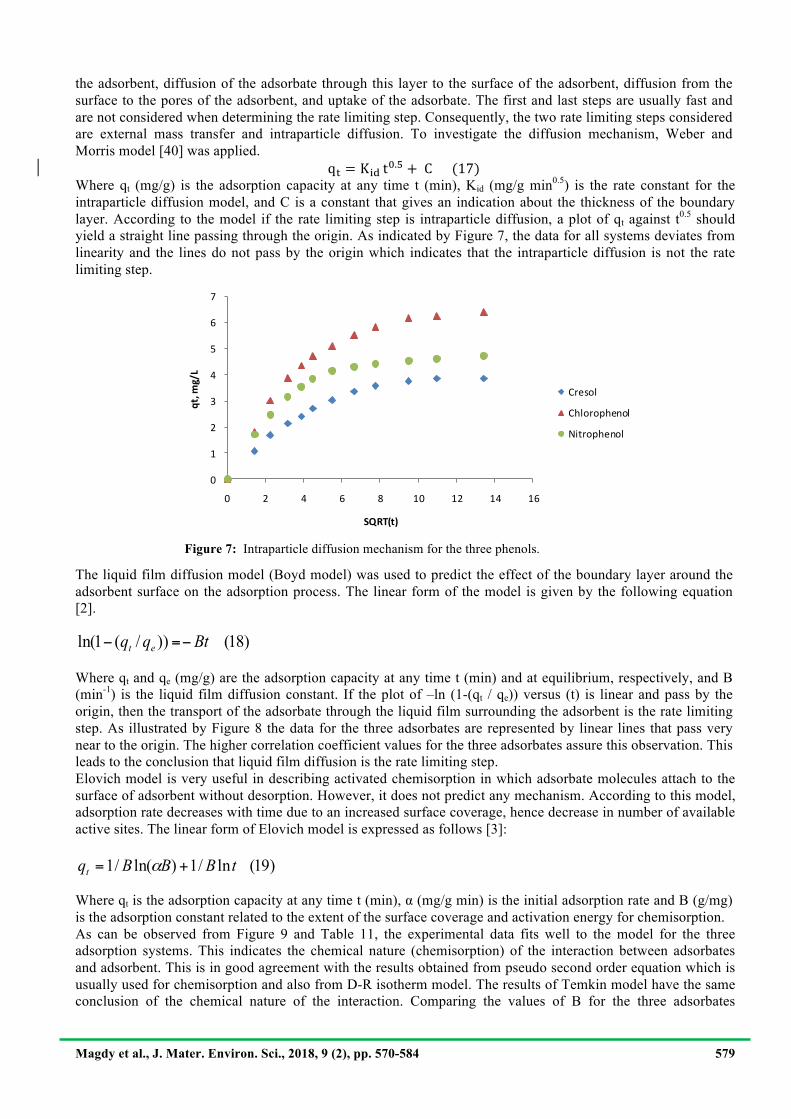
The liquid film diffusion model (Boyd model) was used to predict the effect of the boundary layer around the adsorbent surface on the adsorption process. The linear form of the model is given by the following equation [2].
Where qt and qe (mg/g) are the adsorption capacity at any time t (min) and at equilibrium, respectively, and B (min-1) is the liquid film diffusion constant. If the plot of –ln (1-(qt / qe)) versus (t) is linear and pass by the origin, then the transport of the adsorbate through the liquid film surrounding the adsorbent is the rate limiting step. As illustrated by Figure 8 the data for the three adsorbates are represented by linear lines that pass very near to the origin. The higher correlation coefficient values for the three adsorbates assure this observation. This leads to the conclusion that liquid film diffusion is the rate limiting step. Elovich model is very useful in describing activated chemisorption in which adsorbate molecules attach to the surface of adsorbent without desorption. However, it does not predict any mechanism. According to this model, adsorption rate decreases with time due to an increased surface coverage, hence decrease in number of available active sites. The linear form of Elovich model is expressed as follows [3]:
Where qt is the adsorption capacity at any time t (min), α (mg/g min) is the initial adsorption rate and B (g/mg) is the adsorption constant related to the extent of the surface coverage and activation energy for chemisorption. As can be observed from Figure 9 and Table 11, the experimental data fits well to the model for the three adsorption systems. This indicates the chemical nature (chemisorption) of the interaction between adsorbates and adsorbent. This is in good agreement with the results obtained from pseudo second order equation which is usually used for chemisorption and also from D-R isotherm model. The results of Temkin model have the same conclusion of the chemical nature of the interaction. Comparing the values of B for the three adsorbates
0
1
2
3
4
5
6
7
0 2 4 6 8 10 12 14 16
qt,$m
g/L
SQRT(t)
Cresol
Chlorophenol
Nitrophenol
)18())/(1ln( Btqq et −=−
)19(ln/1)ln(/1 tBBBqt += α
Figure 7: Intraparticle diffusion mechanism for the three phenols.
Magdy et al., J. Mater. Environ. Sci., 2018, 9 (2), pp. 570-584 580 !
indicates the high adsorption capacity of o-chlorophenol compared to other adsorbates which is in agreement with the results of Langmuir isotherm.
!
Table 11: Elovich data for phenolic compounds adsorption on CKD
Adsorbate α B r2
o-Cresol o-Chlorophenol o-Nitrophenol
1.79 4.04 6.67
1.48 0.96 1.48
0.981 0.979 0.945
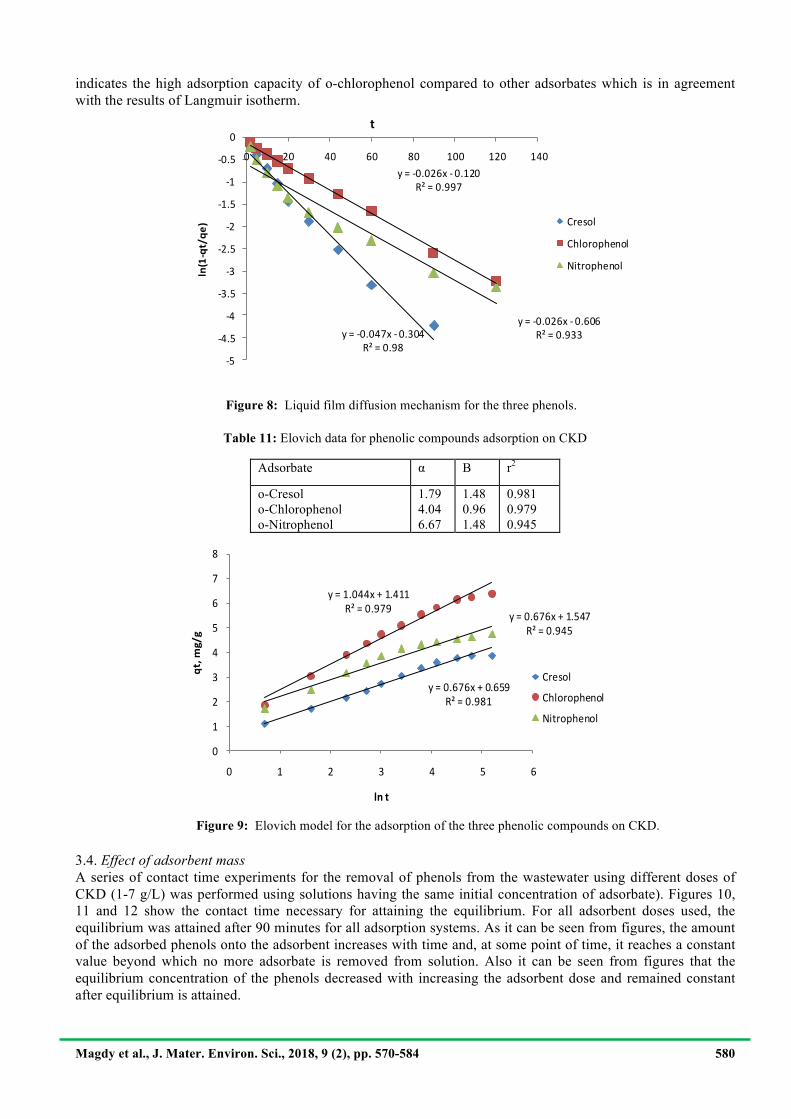
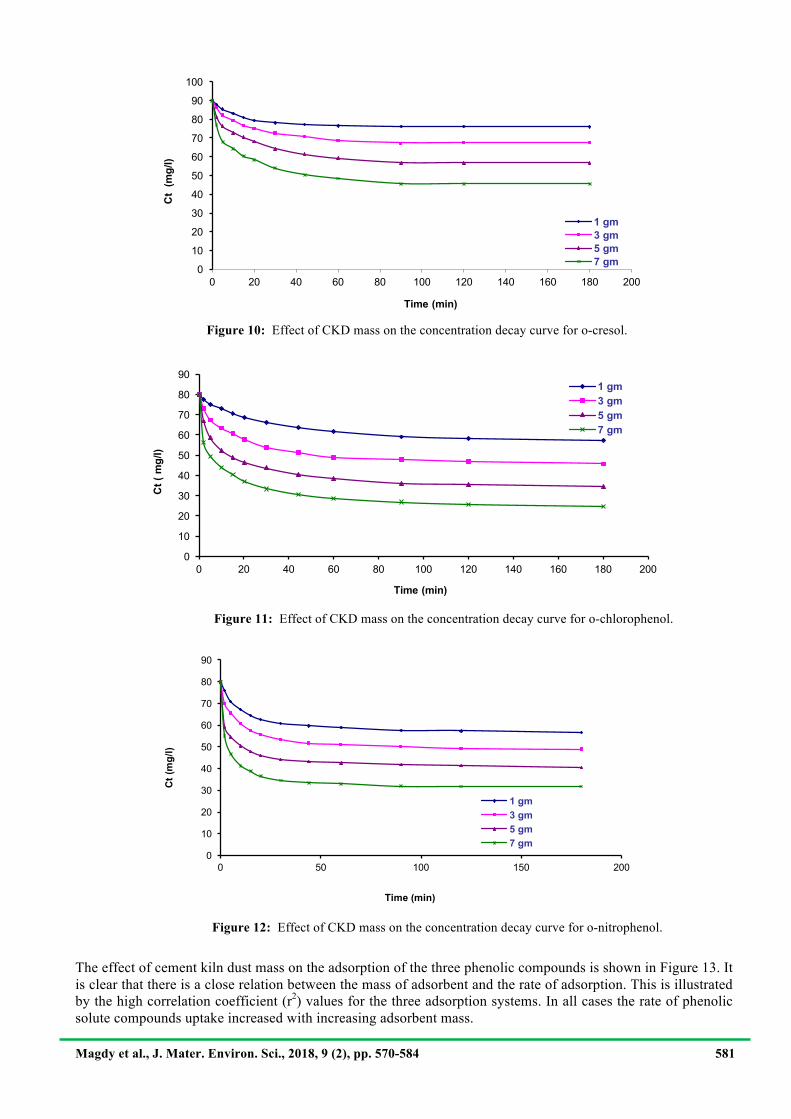
3.4. Effect of adsorbent mass A series of contact time experiments for the removal of phenols from the wastewater using different doses of CKD (1-7 g/L) was performed using solutions having the same initial concentration of adsorbate). Figures 10, 11 and 12 show the contact time necessary for attaining the equilibrium. For all adsorbent doses used, the equilibrium was attained after 90 minutes for all adsorption systems. As it can be seen from figures, the amount of the adsorbed phenols onto the adsorbent increases with time and, at some point of time, it reaches a constant value beyond which no more adsorbate is removed from solution. Also it can be seen from figures that the equilibrium concentration of the phenols decreased with increasing the adsorbent dose and remained constant after equilibrium is attained.
y"="$0.047x"$ 0.304R²"="0.98
y"="$0.026x"$ 0.120R²"="0.997
y"="$0.026x"$ 0.606R²"="0.933
$5
$4.5
$4
$3.5
$3
$2.5
$2
$1.5
$1
$0.5
0
0 20 40 60 80 100 120 140
ln(1%qt/qe
)
t
Cresol
Chlorophenol
Nitrophenol
y"="0.676x"+"0.659R²"="0.981
y"="1.044x"+"1.411R²"="0.979 y"="0.676x"+"1.547
R²"="0.945
0
1
2
3
4
5
6
7
8
0 1 2 3 4 5 6
qt,$m
g/g
ln$t
Cresol
Chlorophenol
Nitrophenol
Figure 8: Liquid film diffusion mechanism for the three phenols.
Figure 9: Elovich model for the adsorption of the three phenolic compounds on CKD.
Magdy et al., J. Mater. Environ. Sci., 2018, 9 (2), pp. 570-584 581 !
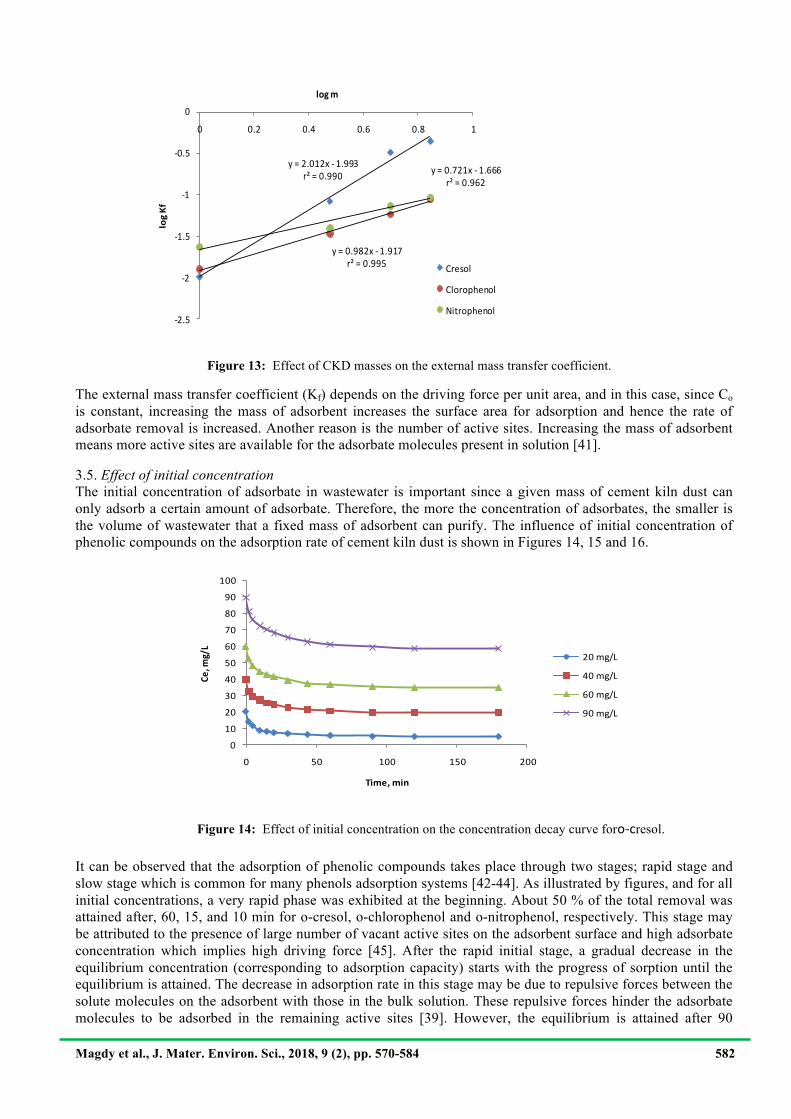
The effect of cement kiln dust mass on the adsorption of the three phenolic compounds is shown in Figure 13. It is clear that there is a close relation between the mass of adsorbent and the rate of adsorption. This is illustrated by the high correlation coefficient (r2) values for the three adsorption systems. In all cases the rate of phenolic solute compounds uptake increased with increasing adsorbent mass.
0
10
20
30
40
50
60
70
80
90
100
0 20 40 60 80 100 120 140 160 180 200
Ct(((mg/l)
Time((min)
1(gm(3(gm5(gm7(gm
0
10
20
30
40
50
60
70
80
90
0 20 40 60 80 100 120 140 160 180 200
Ct(((mg/l)
Time((min)
1(gm(3(gm5(gm7(gm
0
10
20
30
40
50
60
70
80
90
0 50 100 150 200
Ct((m
g/l)
Time((min)
1(gm(3(gm5(gm7(gm
Figure 12: Effect of CKD mass on the concentration decay curve for o-nitrophenol.
Figure 10: Effect of CKD mass on the concentration decay curve for o-cresol.
Figure 11: Effect of CKD mass on the concentration decay curve for o-chlorophenol.
Magdy et al., J. Mater. Environ. Sci., 2018, 9 (2), pp. 570-584 582 !
The external mass transfer coefficient (Kf) depends on the driving force per unit area, and in this case, since Co is constant, increasing the mass of adsorbent increases the surface area for adsorption and hence the rate of adsorbate removal is increased. Another reason is the number of active sites. Increasing the mass of adsorbent means more active sites are available for the adsorbate molecules present in solution [41].
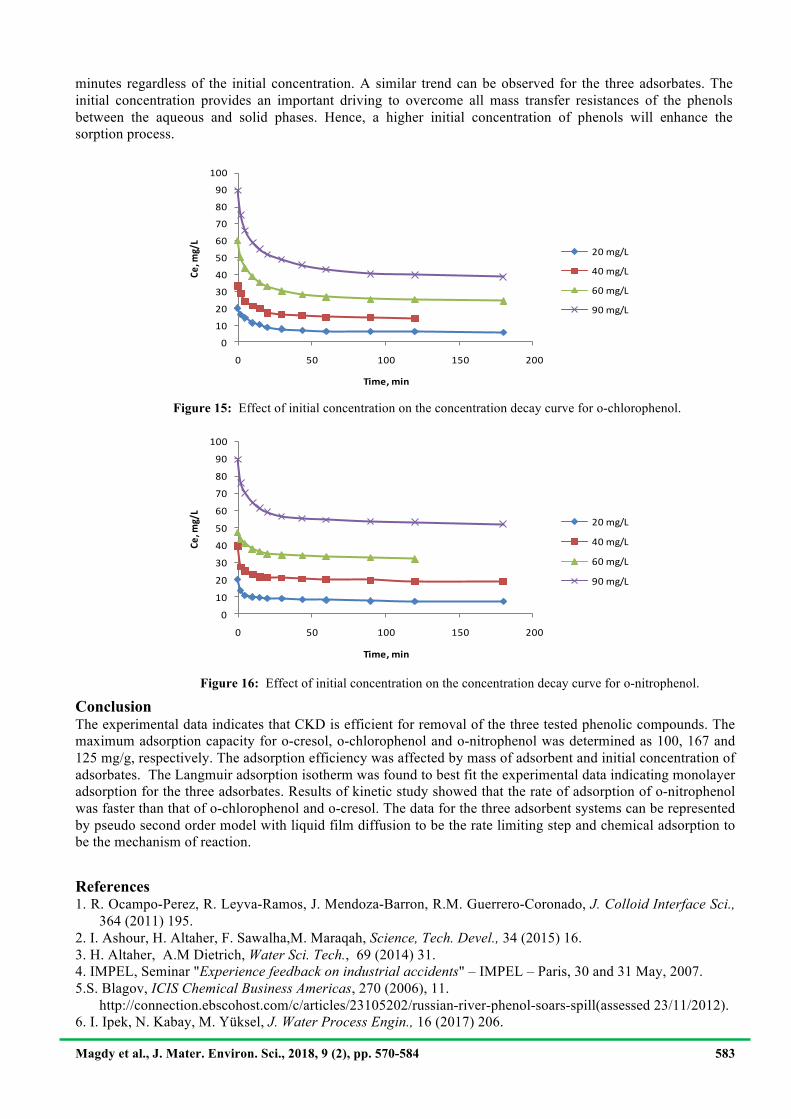
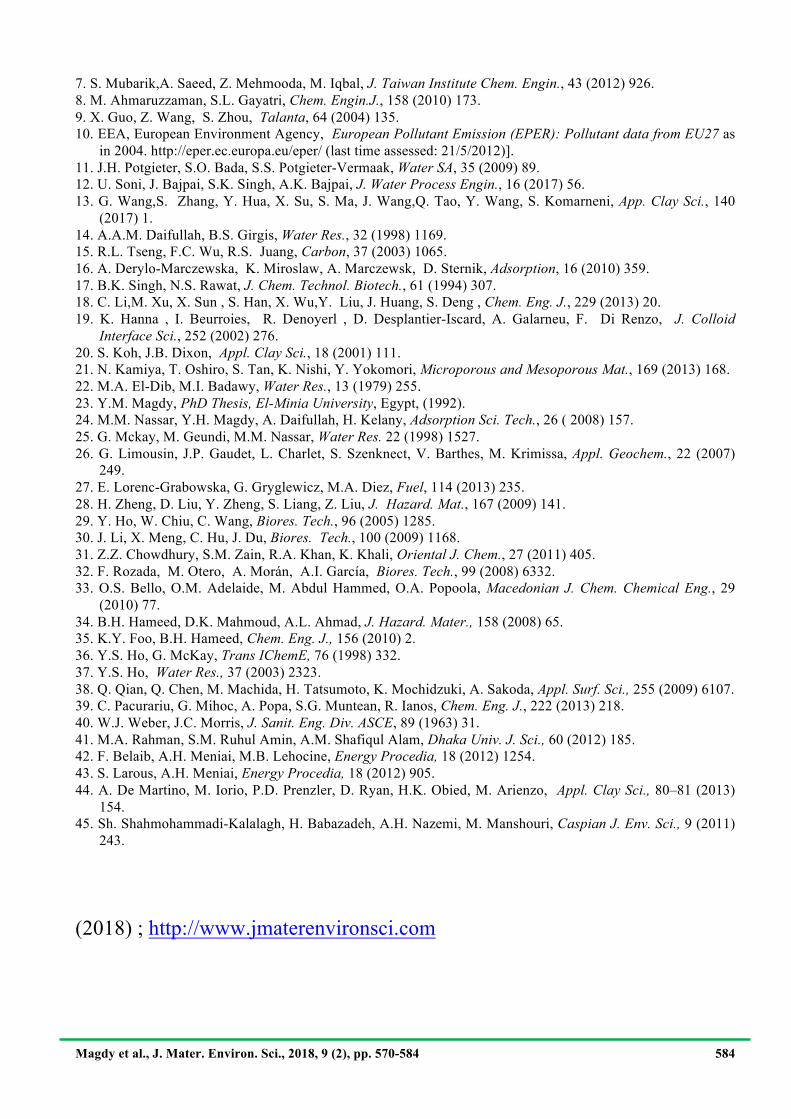
3.5. Effect of initial concentration The initial concentration of adsorbate in wastewater is important since a given mass of cement kiln dust can only adsorb a certain amount of adsorbate. Therefore, the more the concentration of adsorbates, the smaller is the volume of wastewater that a fixed mass of adsorbent can purify. The influence of initial concentration of phenolic compounds on the adsorption rate of cement kiln dust is shown in Figures 14, 15 and 16.
It can be observed that the adsorption of phenolic compounds takes place through two stages; rapid stage and slow stage which is common for many phenols adsorption systems [42-44]. As illustrated by figures, and for all initial concentrations, a very rapid phase was exhibited at the beginning. About 50 % of the total removal was attained after, 60, 15, and 10 min for o-cresol, o-chlorophenol and o-nitrophenol, respectively. This stage may be attributed to the presence of large number of vacant active sites on the adsorbent surface and high adsorbate concentration which implies high driving force [45]. After the rapid initial stage, a gradual decrease in the equilibrium concentration (corresponding to adsorption capacity) starts with the progress of sorption until the equilibrium is attained. The decrease in adsorption rate in this stage may be due to repulsive forces between the solute molecules on the adsorbent with those in the bulk solution. These repulsive forces hinder the adsorbate molecules to be adsorbed in the remaining active sites [39]. However, the equilibrium is attained after 90
010
20
304050
60
708090
100
0 50 100 150 200
Ce,$m
g/L
Time,$min
20+mg/L
40+mg/L
60+mg/L
90+mg/L
Figure 13: Effect of CKD masses on the external mass transfer coefficient.
Figure 14: Effect of initial concentration on the concentration decay curve foro#cresol.
y"="2.012x") 1.993r²"="0.990
y"="0.982x") 1.917r²"="0.995
y"="0.721x") 1.666r²"="0.962
)2.5
)2
)1.5
)1
)0.5
0
0 0.2 0.4 0.6 0.8 1
log$Kf
log$m
Cresol
Clorophenol
Nitrophenol
Magdy et al., J. Mater. Environ. Sci., 2018, 9 (2), pp. 570-584 583 !
minutes regardless of the initial concentration. A similar trend can be observed for the three adsorbates. The initial concentration provides an important driving to overcome all mass transfer resistances of the phenols between the aqueous and solid phases. Hence, a higher initial concentration of phenols will enhance the sorption process.
Conclusion The experimental data indicates that CKD is efficient for removal of the three tested phenolic compounds. The maximum adsorption capacity for o-cresol, o-chlorophenol and o-nitrophenol was determined as 100, 167 and 125 mg/g, respectively. The adsorption efficiency was affected by mass of adsorbent and initial concentration of adsorbates. The Langmuir adsorption isotherm was found to best fit the experimental data indicating monolayer adsorption for the three adsorbates. Results of kinetic study showed that the rate of adsorption of o-nitrophenol was faster than that of o-chlorophenol and o-cresol. The data for the three adsorbent systems can be represented by pseudo second order model with liquid film diffusion to be the rate limiting step and chemical adsorption to be the mechanism of reaction.
References 1. R. Ocampo-Perez, R. Leyva-Ramos, J. Mendoza-Barron, R.M. Guerrero-Coronado, J. Colloid Interface Sci.,
364 (2011) 195. 2. I. Ashour, H. Altaher, F. Sawalha,M. Maraqah, Science, Tech. Devel., 34 (2015) 16. 3. H. Altaher, A.M Dietrich, Water Sci. Tech., 69 (2014) 31. 4. IMPEL, Seminar "Experience feedback on industrial accidents" – IMPEL – Paris, 30 and 31 May, 2007. 5.S. Blagov, ICIS Chemical Business Americas, 270 (2006), 11.
http://connection.ebscohost.com/c/articles/23105202/russian-river-phenol-soars-spill(assessed 23/11/2012). 6. I. Ipek, N. Kabay, M. Yüksel, J. Water Process Engin., 16 (2017) 206.
010
20
304050
60
708090
100
0 50 100 150 200
Ce,$m
g/L
Time,$min
20+mg/L
40+mg/L
60+mg/L
90+mg/L
010
20
304050
60
708090
100
0 50 100 150 200
Ce,$m
g/L
Time,$min
20+mg/L
40+mg/L
60+mg/L
90+mg/L
Figure 15: Effect of initial concentration on the concentration decay curve for o-chlorophenol.
Figure 16: Effect of initial concentration on the concentration decay curve for o-nitrophenol.
Magdy et al., J. Mater. Environ. Sci., 2018, 9 (2), pp. 570-584 584 !
7. S. Mubarik,A. Saeed, Z. Mehmooda, M. Iqbal, J. Taiwan Institute Chem. Engin., 43 (2012) 926. 8. M. Ahmaruzzaman, S.L. Gayatri, Chem. Engin.J., 158 (2010) 173. 9. X. Guo, Z. Wang, S. Zhou, Talanta, 64 (2004) 135. 10. EEA, European Environment Agency, European Pollutant Emission (EPER): Pollutant data from EU27 as
in 2004. http://eper.ec.europa.eu/eper/ (last time assessed: 21/5/2012)]. 11. J.H. Potgieter, S.O. Bada, S.S. Potgieter-Vermaak, Water SA, 35 (2009) 89. 12. U. Soni, J. Bajpai, S.K. Singh, A.K. Bajpai, J. Water Process Engin., 16 (2017) 56. 13. G. Wang,S. Zhang, Y. Hua, X. Su, S. Ma, J. Wang,Q. Tao, Y. Wang, S. Komarneni, App. Clay Sci., 140
(2017) 1. 14. A.A.M. Daifullah, B.S. Girgis, Water Res., 32 (1998) 1169. 15. R.L. Tseng, F.C. Wu, R.S. Juang, Carbon, 37 (2003) 1065. 16. A. Derylo-Marczewska, K. Miroslaw, A. Marczewsk, D. Sternik, Adsorption, 16 (2010) 359. 17. B.K. Singh, N.S. Rawat, J. Chem. Technol. Biotech., 61 (1994) 307. 18. C. Li,M. Xu, X. Sun , S. Han, X. Wu,Y. Liu, J. Huang, S. Deng , Chem. Eng. J., 229 (2013) 20. 19. K. Hanna , I. Beurroies, R. Denoyerl , D. Desplantier-Iscard, A. Galarneu, F. Di Renzo, J. Colloid
Interface Sci., 252 (2002) 276. 20. S. Koh, J.B. Dixon, Appl. Clay Sci., 18 (2001) 111. 21. N. Kamiya, T. Oshiro, S. Tan, K. Nishi, Y. Yokomori, Microporous and Mesoporous Mat., 169 (2013) 168. 22. M.A. El-Dib, M.I. Badawy, Water Res., 13 (1979) 255. 23. Y.M. Magdy, PhD Thesis, El-Minia University, Egypt, (1992). 24. M.M. Nassar, Y.H. Magdy, A. Daifullah, H. Kelany, Adsorption Sci. Tech., 26 ( 2008) 157. 25. G. Mckay, M. Geundi, M.M. Nassar, Water Res. 22 (1998) 1527. 26. G. Limousin, J.P. Gaudet, L. Charlet, S. Szenknect, V. Barthes, M. Krimissa, Appl. Geochem., 22 (2007)
249. 27. E. Lorenc-Grabowska, G. Gryglewicz, M.A. Diez, Fuel, 114 (2013) 235. 28. H. Zheng, D. Liu, Y. Zheng, S. Liang, Z. Liu, J. Hazard. Mat., 167 (2009) 141. 29. Y. Ho, W. Chiu, C. Wang, Biores. Tech., 96 (2005) 1285. 30. J. Li, X. Meng, C. Hu, J. Du, Biores. Tech., 100 (2009) 1168. 31. Z.Z. Chowdhury, S.M. Zain, R.A. Khan, K. Khali, Oriental J. Chem., 27 (2011) 405. 32. F. Rozada, M. Otero, A. Morán, A.I. García, Biores. Tech., 99 (2008) 6332. 33. O.S. Bello, O.M. Adelaide, M. Abdul Hammed, O.A. Popoola, Macedonian J. Chem. Chemical Eng., 29
(2010) 77. 34. B.H. Hameed, D.K. Mahmoud, A.L. Ahmad, J. Hazard. Mater., 158 (2008) 65. 35. K.Y. Foo, B.H. Hameed, Chem. Eng. J., 156 (2010) 2. 36. Y.S. Ho, G. McKay, Trans IChemE, 76 (1998) 332. 37. Y.S. Ho, Water Res., 37 (2003) 2323. 38. Q. Qian, Q. Chen, M. Machida, H. Tatsumoto, K. Mochidzuki, A. Sakoda, Appl. Surf. Sci., 255 (2009) 6107. 39. C. Pacurariu, G. Mihoc, A. Popa, S.G. Muntean, R. Ianos, Chem. Eng. J., 222 (2013) 218. 40. W.J. Weber, J.C. Morris, J. Sanit. Eng. Div. ASCE, 89 (1963) 31. 41. M.A. Rahman, S.M. Ruhul Amin, A.M. Shafiqul Alam, Dhaka Univ. J. Sci., 60 (2012) 185. 42. F. Belaib, A.H. Meniai, M.B. Lehocine, Energy Procedia, 18 (2012) 1254. 43. S. Larous, A.H. Meniai, Energy Procedia, 18 (2012) 905. 44. A. De Martino, M. Iorio, P.D. Prenzler, D. Ryan, H.K. Obied, M. Arienzo, Appl. Clay Sci., 80–81 (2013)
154. 45. Sh. Shahmohammadi-Kalalagh, H. Babazadeh, A.H. Nazemi, M. Manshouri, Caspian J. Env. Sci., 9 (2011)
243. !
(2018) ; http://www.jmaterenvironsci.com