Embed Size (px)
Citation preview

Report No. 4011-EG
Equatorial GuineaAn Introductory Economic Report
June 15, 1983
Country Programs Department IIWest Africa Region
FOR OFFICIAL USE ONLY
Document of the U4'brld Bank
This document has a restricted distribution and may be used by recipientsonly in the performance of their official duties. Its contents may not otherwisebe disclosed without World Bank authorization.
Pub
lic D
iscl
osur
e A
utho
rized
Pub
lic D
iscl
osur
e A
utho
rized
Pub
lic D
iscl
osur
e A
utho
rized
Pub
lic D
iscl
osur
e A
utho
rized
Pub
lic D
iscl
osur
e A
utho
rized
Pub
lic D
iscl
osur
e A
utho
rized
Pub
lic D
iscl
osur
e A
utho
rized
Pub
lic D
iscl
osur
e A
utho
rized

CURRENY EQU4iALENTS
1.Currency Unit: E.kue'le (EK) (plural: bikuele)
2. The Ekuele is pegged to the Spanish peseta at a rate ofEK 2 Pta 1
3.- ExchangRe rate with'respect to the US dollar as,of May 1,983
US$ 1.000=E 274.00
EK 100 =us$ 0.365
1meter (in) =3.2'8 fee t1 kilometler (kin) =0.62 mile's1 hectare (ha) = 2.47 acrles,1: squarekilometer (km,2 0.386 square miles.
1. kilogram (kg) =2.205 pDounds1~ metric to-n (t) 2205 pounds1Iliter (1) =0.26 gallo~ns
Y I SCA YEAR
January 1I December 3

FOR OFFICIL USE ONLY
PREFACE
This memorandum provides a basis for resuming a dialoguebetween the Government and the Bank Group on the current economicsituation and outlook in Equatorial Guinea. The report is based on amission by Ulrich Hewer (economist) in November 1981. It also includesthe findings of a reconnaissance mission by Hilda Yumiseva (consul-tant). A draft report was sent to the Government in August 1982 anddiscussed with the Government in November 1982. This versionincorporates information and comments provided by the authorities atthat time.
This document has a restricted distribution and may be used by recipients only in the performanceof their official duties. Its contents may not otherwise be disclosed without World Bank authorization.

EQUATORIAL GUINEA: AN INTRODUCTORY ECONOMIC REPORT
Table of Contents
LIST OF ABBREVIATIONS AND ACRONYMSSOCIAL INDICATORS DATA SHEETSUMMARY AND CONCLUSIONS
I. INTRODUCTION ............................. ............... .*.... 1
II. ECONOMIC POTENTIAL AND DEVELOPMENT CONSTRAINTS ............. 3
Employment, Wages and Prices ............................... 3A&griculture ................................................... 4Agricultural Marketing and Extension Services ........... 9Industry, Mining, Commerce and Tourism .............. .10Infrastructure .......... ............... 13
III. PUBLIC FINANCE ................................ o.......... 14
The Budget .... .......... 14Public Enterprises ............................... .*........ 16
IV. MONEY AND CREDIT ........................................ 17
V. BALANCE OF PAYMENTS .. ..... ................................ 19
Merchandise Exports and Imports .................... ....... 21Services and Transfers .. .................................. 22Capital Movements ........ ................... .......... 22International Reserves ........................ . 22External Debt . . ................................... ... 23
VI. DEVELOPMENT STRATEGY AND PROSPECTS ....... .... .... 24
LIST OF TABLES IN THE TEXT
Table 1: Distribution of Cocoa Plantations on Biokoat the End of 1982 ...................... . 6
Table 2: Central Government Budget 1980-1982 .............15Table 3: Monetary and Credit Developments, 1979-1982. 18Table 4: Balance of Payments, 1976-1982 .20Table 5: Composition of Exports 1970 and 1976-1982...... 21Table 6: External Debt, 1980-1982 .......... .. .. ... 23

STATISTICAL APPENDIX
Table 1: National Accounts .............................. 29Table 2: Central Government Finance,
1970-1971 and 1980-1982 . . .......... 30Table 3: Central Government Revenue, 1980-1982 . .31Table 4: Central Government Expenditure, 1980-1982 ...... 32Table 5: International Reserves, 1979 - Sept. 1982 ...... 33Table 6: Selected Retail Prices in Malabo Market,
1979 - October 1982 ..... .............. . .... . 34Table 7: Commodity Producer Prices, 1979-1982 ........... 35Table 8: Selected Timber Export Prices, 1978-1982.......36Table 9: Summary of Export Tariffs, 1980-1982 ........... 37Table 10: Summary of Import Tariffs,
July - December 1980 ..................... .... 38Table 11: Production of Export Commodities ............... 39Table 12: Education--Main Indicators, 1980.............. 40Table 13: Structure of Main Petroleum Product Prices,
December 1981 ................................ 41
MAP - IBRD 10259R1

LIST OF ABBREVIATIONS AND ACRONYMS
ADF = African Development Fund
BCD Banco de Credito y Desarollo (Credit andDevelopment Bank)
BGE = Banco de Guinea Ecuatorial (Bank of EquatorialGuinea) (formerly Central Bank)
CEPE = Comite Ejecutivo para Politica Economica (ExecutiveCommittee for Economic Policy)
CMS = Consejo Militar Supremo (Supreme Military Council)
EC Eurcpean Community
FED = Fonds Europeen de Developpement (European DevelopmentFund)
GEMSA = Guineo Espanola Minera Sociedad Anonima (Guineo-Spahins Mining Ltd.)
GTZ = Gesellschaft fur Technische Zusammenarbeit (GermanAgency for Techn'ical Cooperation)
GUINEXTEBANK = Banco Exterior de Guinea Ecuatorial(External Bank of Equatorial Guinea)
SDR = Special Drawing Right
TA = Technical Assistance


Page 1 of 3TABLE 3A
EQUATarII TNEA - SOCIAL INDICATORS DATA SHEET
EQUAToRIAL GUINEA REFERENCE GROUPS (WEIGHTED AVE GESAREA (THOUSAND SQ. KM.) - HOST RECENT ESTIMATE)-
TOTAL 28.1AGRICULTURAL 3.3 MOST RECENT LOW INCOME MIDDLE INCOME
1960 /b 1970 /b ESTIMATE /b AFRICA SOUTH OF SAHARA AFRICA SOUTH OF SAHARA
GNP PER CAPITA (US$) .. .. .. * 250.8 1053.2
ENERGY CONSUMPTION PER CAPITA(KILOGRAMS OF COAL EQUIVALENT) 120.6 66.9 103.1 66.5 610.1
POPULATION AND VITAI STATISTICSPOPULATION, MID-YEAR (THOUSANDS) 244.0 274.0 311.0 *URBAN POPULATION (PERCENT OF TOTAL) .. .. 17.8 28.3
POPULATION PROJECTIONSPOPULATION IN YEAR 2000 (MILLIONS) 0.5STATIONARY POPULATION (MILLIONS) 1.5YEAR STATIONARY POPULATION IS REACHED 2130
POPULATION DENSITYPER SQ. KM. 8.7 9.8 10.9 27.7 54.7PER SQ. KM. AGRICULTURAL LAND 76.0 82.8 91.3 86.7 129.9
POPULATION AGE STRUCTURE (PERCENT)0-14 YRS. 38.9 40.4 41.8 44.8 46.0
15-64 YRS. 57.1 55.5 55.0 52.3 51.165 YRS. AND ABOVE 4.0 4.1 3.3 2.9 2.8
POPULATION GROWTH RATE (PERCENT)TOTAL 1.5 1.2 1.3 2.7 2.8URBAN .. .. .. 6.2 5.2
CRUDE BIRTH RATE (PER THOUSAND) 43.0 42.0 42.3 47.3 47.2CRUDE DEATH EATE (PER THOUSAND) 26.9 22.2 18.6 19.5 15.7GROSS REPRODUCTION RATE 2.8 2.8 2.8 3.2 3.2FAMILY PLANNING
ACCEPTORS, ANNUAL (THOUSANDS)USERS (PERCENT OF MARRIED WOMEN) ..
FOOD AND NUTRITIONINDEX OF FOOD PRODUCTION
PER CAPITA (1969-71-100) 100.0 100.0 .. 88.7 90.7
PER CAPITA SUPPLY OFCALORIES (PERCENT OF
REQUIREMENTS) .. .. .. 90.2 93.9PROTEINS (GRAMS PER DAY) .. .. .. 53.1 54.8
OF WHICH ANIMAL AND PULSE .. .. .. 18.4 17.0
CHILD (AGES 1-4) DEATH RATE 43.7 37.5 30.6 26.7 23.9
HEALTHtIFE EXPECTANCY AT BIRTH (YEARS) 37.2 42.2 47.1 45.6 51.0INFANT MORTALITY RATE (PERTHOUSAND) 187.8 166.6 142.9 129.9 118.5
ACCESS TO SAFE WATER (PERCENT OFPOPULATION)
TOTAL .. .. .. 23.9URBAN .. .. .. 54.9RURAL .. .. .. 18.5
ACCESS TO EXCRETA DISPOSAL (PERCENTOF POPULATION)
TOTAL .. .. .. 25.8URBAN .. .. .. 63.1RURAL .. .. .. 20.2
POPULATION PER PHYSICIAN 5809.5 11080.0 58000.0/c 32097.3 14185.2POPULATION PER NURSING PERSON 614.4 .. 843.067 3264.6 2213.2POPULATION PER HOSPITAL BED
TOTAL 193.8 .. 83.0/d 1225.0 1036.4URBAN 53.7 .. 52.37d 249.5 430.8RURAL 9048.2 .. 193.87- 1712.1 3678.6
ADMISSIONS PER HOSPITAL BED .. ..
HOUSINGAVERAGE SIZE OF HOUSEHOLD
TOTAL .. ..UREAN .. ..RURAL .. ..
AVERAGE NUMBER OF PERSONS PER ROOMTOTAL .. ..URBAN .. .. ..RURAL .. .. ..
ACCESS TO ELECTRICITY (PERCENTOF DWELLINGS)
TOTALURBANRURAL .. .. ..

Page 2 of 3TABLE 3A
EQUATORIAL GUINEA - SOCIAL INDICATORS DATA SHEET
EQUATORIAL GUINEA REFERENCE GROUPS (WEIGHTED AVER4 GES- MOST RECENT ESTIMATE)-
MOST RECENT LOW INCOME MIDDLE INCOME1960 /b 1970 /b ESTIMATE /b AFRICA SOUTH OF SAHARA AFRICA SOUTH OF SAHARA
EDUCATIONADJUSTED ENROLLMENT RATIOS
PRIMARY: TOTAL 85.0 73.0 81.O/c 63.2 83.3MALE 103.0 82.0 89.07W 72.7 96.1FEMALE 67.0 63.0 72.0/c 50.3 80.4
SECONDARY: TOTAL 2.0 16.0 11.0/c 10.2 15.3MALE 3.0 24.0 19.07 13.2 19.4FEMALE 1.0 8.0 4.07W 6.6 11.3
VOCATIONAL ENROL. (% OF SECONDARY) 37.8 10.0 8.2/c 7.9 4.7
PUPIL-TEACHER RATIOPRIMARY 75.6 57.0/e .. 47.4 38.6SECONDARY 36.4 34.4 27.
4/c 26.2 23.4
ADULT LITERACY RATE (PERCENT) .. .. .. 34.0 35.6
CONSUMPTIONPASSENGER CARS PER THOUSAND
POPULATION .. .. .. 3.0 31.9RADIO RECEIVERS PER THOUSAND
POPULATION .. 29.2 266.7 34.8 71.8TV RECEIVERS PER THOUSAND
POPULATION .. .. 3.3 1.7 17.9NEWSPAPER ("DAILY GENERALINTEREST") CIRCULATION PERTHOUSAND POPULATION 3.3 .. .. 2.9 19.1CINEMA ANNUAL ATTENDANCE PER CAPITA .. .. 1.7/d 1.1 0.6
LABOR FORCETOTAL LABOR FORCE (THOUSANIDS) 73.6 79.8 86.9
FEMALE (PERCENT) 3.8 4.2 4.7 34.1 36.5AGRICULTURE (PERCENT) 84.0 80.0 76.0 78.4 56.5INDUSTRY (PERCENT) 6.0 7.0 8.0 9.2 17.7
PARTICIPATION RATE (PERCENT)TOTAL 30.2 29.1 27.9 41.4 37.0MALE 59.6 57.1 54.3 53.9 46.9FEMALE 2.3 2.4 2.6 29.1 27.2
ECONOMIC DEPENDENCY RATIO 1.4 1.5 1.6 1.2 1.3
INCOME DISTRIBUTIONPERCENT OF PRIVATE INCOMERECEIVED BY
HIGHEST 5 PERCENT OF HOUSEHOLDSHIGHEST 20 PERCENT OF HOUSEHOLDS ..
LOWEST 20 PERCENT OF HOUSEHOLDSLOWEST 40 PERCENT OF HOUSEHOLDS ..
POVERTY TARGET GROUPSESTIMATED ABSOLUTE POVERTY INCOMELEVEL (USS PER CAPITA)
URBAN .. .. .. 134.3 507.0RURAL .. .. .. 82.9 200.6
ESTIMATED RELATIVE POVERTY INCOMELEVEL (US$ PER CAPITA)
URBAN .. .. 96.4 523.9RURAL .. .. .. 60.4 203.6
ESTIMATED POPULATION BELOW ABSOLUTEPOVERTY INCOME LEVEL (PERCENT)
URBAN ., .. .. 39.3RURAL .. .. .. 69.0
Not availableNot applicable.
NOTES
/a The group averages for each indicator are population-weighted arithmetic means. Coverage of countriesamong the indicators depends on availability of data and is not unifors.
/b Unless otherwise noted, data for 1960 refer to any year between 1959 and 1961; for 1970, between 1969and 1971; and for Most Recent Estimate, between 1978 and 1980.
/c 1975; /d 1977; /e 1973.
* 1981 estimates of population and GNP/capita are 350 thousand and$180.0 respectively. May, 1982

Page 3 of 3DEFINITIONS OF SOCIAL INDICATORS
RoI.n Although the dalt are dross frie sources -enerslly judged the not authoriacaive and reliable. 1t should also be noted that they eay vot be inter-tiolly comparable becoeo of the tack of stondardtzod dofinitlons sod concepts used by different ..ounr is in co1lectlig the dots. The daiS see, none
theless, useful to describe orders of sagnit.de, iedicate tronds, cod charact-rize certain major differenoes bet seen counnrie.
The rf erenc .. pt ore (1) the a country group of the tabj) ect ountry end (2) a country group ith no=ethat bhighor overage Ioose chan the cso-try groopof the sobjject coa-try (occept for "Slgh Income Oil IEporters" groap chore "Middle Incot North Afric and Middle tant" Is chosen because of sroegrsnoto-calcarol affinities). In the roforetco grasp daIs the averages are population weiShted aoithgetic nuns for each indicator and shbow only nhenmajority of the countries In o groap hss data for that tndicotor. Since the coverage ef countrels a-ong the indicators depends In the aIailabtlity of datasod is not tnifort, csotion must be exercised in relsting averages of one tndicator to onother. Thexe n -orages aeo only useful ine -poring the role ofone indicator at a tin h asong lbe ceoncry and reference groups.
AREA (thoasa.d tq.kz.) Population per Rospital BNd - total, rban., and rural - Popolstion (tocI.Total - Total surface urea co-prising land arce aed inlacd waters; 1979 dart. .Iban, aed rural) divided by their respec * ntsber of hoopital bedgricultural - Estimafe cf agriculcural area card temporarily or perraoently available in public and private goneral so. specialized hospital and re-
for cropt. pastarer. market and kitchee gardens or to le fallo.; 1979 data. habilitation teeters. Hospitals ahe -stobltubnnc peraently srcffedby at least one physician. Establiohzntu previding peincipally custo-
GNF PER CAPITA (CS) - GNP per capita estisates at curreot market prices. cal- dial caro are ono iocludod. ROIa h.pital. hb r, iloude healthculated by sz conrersion ethod as World Bask Atlas (1978-80 basis); 1960, and mdical cnera ct permanenly sffed by s physician (bot by a1970, and 1980 data. medical -ssistant, noose, midwife, ntc.) shieb offor in-patient accote-
dalton and.provIde,_ aI limted .... o of edia f Fiiie. r sta isENERGY CONSUMPTION PER CAPITA - Annua1 cons-plticn of cozeorcial energy (coal dealo parp arhsn h. pitols include oaHOn ptincipal/geoer-l hrspitlt.i
end lignIte, peteoleue. naotral ian anndhydr-.-l- an geotheral eiec- atd rural hospitals., locale or at hspitals ad medical cd matentytricity) in kilogreNs of ooal equioalent per tspita; 1960. 1970, and 1979 centers. -pecialiIed hospitals re included only onder total.data. -ddisnicnt per Eospital Sod - Total camber of admissions to or diacharges
Pfro hospitals diided by the neAbnr of bedt.POPULATION AND VITAL. OTiTSTIC
Total Ppoulation. Mid-Tear (thousands) - As of July i; 1960, 1970. and 19O 01USIldGdatajo. Aveoagn Sloe of Hnusehol,,d(ernsprhohud- total, otbn, and rorsI-
Peba 'Iolti", (percen t of coral) -Ratio of ceban tn ctatl popolatioc; A household -cnittnIageapo idoidult1 who bcetliolog qnartoesdifferent difinitiena of arban areas may a°ffrt cbant°bility of daa ond eheir maic .eIs.. A bade dge my mY ot inclded inazong coontries; 1960, 1970. and 1980 dsta. the heosehold forer sta tIst lptrpo
Population Projections Aneeage n Peo ci pertons per coos- total. arban, and rooa - average ne-Population in year 2oog - Current ppoplation prjecrcino. are boned On 1980 ber of persons per mae io all brhan, aod rural occ4pid ecoventional
total popolation by age sod nex aed choir soetmllty and fertilityrates. doelliogo, respectuvely. lvlliciecldo de -y aet cr ctr adProjection parameters for nteality rates comprise of three levels atsu-- onoccupied parts.ing life enpeconcy at hirth incrrasing vich coc-try't per capita income Access to Electriciy ipererey of dvellings) - total., rba, and eural -level, and female life ecpectancy stabilizicg cc 77.5 yeaes. The para- Coeventional d_mllcigs ci i.ectricity in living qoarters as perceotageeetert for fertility rate also have three levels assuming decline in of total, orban, and r-ral d-ellingu rep-ctinvely.fertility zccording to income loe-
1and past family planning performance.
Each couttry Is then asuigned One of these cite co obicaticonc mfzortality EDUrATIONnod fnrtility trends for prcjection p-rpo.s.. Adjusted Strollmant RatiIo
Stationary population - In a stationary pnpulatin there in no growth unco Primary scbhol - total. male ard fomale - Ctrps total. scle and femalethe birth rote is eqoal cc_the dnathb rote,od also oze_atet reclie to orolimant of al ages at the primary nola perceag of repetivma in ceost_._ Ti Iahieve.d clY after foeilicY ostes declIne tc poinry school-ago popalti..ot; -ntmaly inclcde children aged h-Ilthe replacnn-t level of otit ne_ reprodoctron rote., hen each generation ynstt djntd tot diff nret 1ugt of piy ed ;forIf woman replaces itself eoacIly. The stationary popolaciIo sleo can cotriet with ouiversal ed=cation enrollment may eceed 100 percent-ati ated on the baui of the projected characteristics of the poyulation since acme pupils are belo or sbove the official ochool age.
In the year 2000. amd the rate of declint of fertility yate to replaco- Seondary school - total, male cod femele - Compoted as abov; secondavyrenot level. education requires at leasn Ior years of approved primary icuccion;
Toor stationary opulation is reached - The year when -titioiary population providea gencral, vocI tional, or tra-her _ra"ning instructions for opileslia will be reached. usually of 12 to 17 -ears of ago; corresyondence coarsen ore generally
Fputlation Densitr occluded.Per sq. km. - Mid-year pepulation per sq-are kilometer flOO hectares) of Vorotional entoll. nt (percent of secondary) - VocationaI iostitnti
total ares; 1960, 1970 and 1979 date. - include technica;, industrial. c other programs which opate indopend-Per s. km. anoicoltatal land - Cotpnted as abooe for agricoluroal land ently or ds anpa.ttents of se-ondary tnstitution.
.nly; 1960, 1970 and 1979 date. Yupil-teaere ratio - primar, nd eco ndary - Total s.tdotsnroll d iPopalatio ARge Stroctare (perce.t) Children (0-14 year-). wcrkidg-arg (1)- primry andn tooedory leveis dioided by nabeet f ueo i t
h's poa..) . ad rectied fh5 years and coo) as pretgsof sld-ynar Pope- cece ndo lvls.lation; 1960, 1970, atd 1980 dsta. Adolt literacy rate (Irce.nt) - Literate adults (able I' reaa and riste)
PePoJation Grtnth Rate (percent) - total - AInnal growth rates of total mid- s a percncage of total adolt p opl tiu o agd 15 years ad ocr.year popalation for 19jO-60, 196O-70. and 1970-80.
Popula',", Grlonh Rate (pccons) -urbac - Annu.l greath ratcs of urban popu- CONSUMPTIONlationt for 195064. 19hO-7U, and 197U-SO. Pasnenger Cars (erC thoIanad cpoulatioe) - Posoe-g-r earn comprise motor
Crude Birth Rte (per thousand) - Annual lioe births per thousand of mid-year cart seating loss thao eight peso; n lden tsbla1ces, heceno andpepuiation; 1960 1970. and 1990 data. military vehicles.
Crude Death Sate (per th-uanad) - Annoal deaths per thousend of mid-year Rdo Receivern leer thoosand ppopltloc) - ill types of remeitern for radiopopulatioc; 1960, 1970, and 1980 data. broadcaPts to general puhlic pot thoausad of pepulacton, excludes un-
Gross Reprodoction Rtte - erage nonbot of daughteravotan sill bar to lice.n.ed receivers in countries cod J. yearn when regi-teation of radioh.er veral repoodoctioe period if she experiecces present age-opectfte fer- , non was in effect-; data for ro.en years may not be coparble sincetility prate;s, ally five-year averages ending in 1960, 1970, and 1980. moot countries abciished liceciLg.
pamily Plos.iss - Acceptlrn, Annual (Ahoandt) - hned. oambhr of acceptero IV Roceivers (pee thoasand population) - TV recoivers for broadcast toof birth-tentrol deoices under assp.ic- of natIonal fssily ylennicg program. genecal pelcic per thoo-and poyulsation oetludes aolicoosed TV receivers
roslily Plannlca -iUsers (po-ceni of ncoried woman) - Peruentege of mtrried In countrins ad In years h.e. regintotion of TV sets c in effect.mean of child-hearing age (15-44 years) who coo birth-coatrol devices to Neespaper Circulation (pot thounand pcpulation) - thows th eciroi tacnod womien in same age group. culation of 'daily general totercot nevspaper", defined astpeeiodical
pbIvotiac devoted prImarily cc te-rdleg ge..orol ne= It in ocidedFG3D ANDO StYtOllis ct hre "daily" if ita ppea- nt least four lin t a reek.
loden of Food Produoicot per Capita (1969-71=100) - loden of per capita annual Cloera Aual Attendace pet Capita per Yea - Bted cn the turhbr ofproductiIn of all food coweeditios. Produccitn etcludes neod nad feed and tickets sold during the poor. including admissions to drive-in ciensit cc calendar yerr basis. Commodities cover prima-y goods (e.g. sagrccane aId -bile unit.instead of sugsr) vhich sre edible aed concain nutrients (e.g. coffee andtea cre ocluded). Aggregate productiIo of each country in bated on LAOR FORCEnational avroage producer price eightsi 1961-h5, 1970, and 1930 data. Tocal vahbor rorce (thcocdnd) - icocuicully action persosnt including
Per capita supply of caloriet (percent of requireRnnts) - Computed free atred fertet cod .. erployed bct toclading ho.e.eives, students. etc.,e-ergy eqivalent of out food nupplies availhble ID countty per capita covering population of all age. Deficitio o i o ctri- reper day. Available supplies oooprite d-emtic pooduction. imports less too corparable; 1960, 1970 avd 1980 data.enportx, apd changeN to -tock. Net supplios exclude aniPal feed, aeeds., F-eml (percent) - remale loc force at percentage of tal Iabor force.quactities osed in food proce-sing, nod losI et in distribhtion. Require- Agriclture (perceot) - Labor farce in feesing. forestry, huntiog sodtents were estimaced by FAO bhasd on physiological needs foo cormat a-ti- fishIng at percentage o total abtot force, 1910, 19)0 cod 1980 dato.oity and health considering environrencal temporaure. body weights, age Industry (percent) - Labor force ietog. C i E ° stic, Ia ftaigand ten distribution of populatlon, ced allvintg 10 percent for wste at and electricity. vatr sod gas as pecent,ge of cta labor forc;household level; 1961-65, 1970 and 1977 date. 1960, 1970 and 1987 data.
Per capita supply of protein (grant per day) - Proteei content of per capitr Poeticipation late (percent) - total, male. and female - Participation ornet sapply of feed per day. Net supply of food in defined as above. Ro- ctiviiy rats are corputed 00 tal, m1o, and foa1 1bot force anquirerents fee oi countries I_ tablished by USDA provide fer minpe tg s toftal male cod fa , pce;pntioc ofa ag ort -peevly;allovences of 60 gra_s of total procoin p"r dry and 20 graps of animal 16. 1 nd I9' do-a he are b en 'pariesipticrae,pulse prote, of vbich 10 nraps should be an_mal procein. Thae _tand- reflecting ale-sen structure of the poy caiIon. and loot tie tnend. Aards are lowr thea these of 75 gSatm of tntal protei and 23 grams of few estimates are froo nasioat1a-i=l proteit an an averagv for the world, proposed by FAO in the Third o.u.oml. lepOed-e"y "ctio - Ratio of pplatio a rdo 15 sod 65 and
Forld Peed Survey; 196165, 1971 and 1977 data. to the total labor fecr.oPer capita protein -pEoly free animal and color - Proitei supply of food de-
rived from anirlsoand pnLses in grams per day; 19161-65, 1970 and 1977 data. INCOME DISTRIBUTIOsChild (aces 1-4) Death tte (rer th.ntand) - AncuaI deeths per thosanad le Porcevetoe of Privace Imon (both it cash and kind) - Rceitved by richeso
age group 1_4 yetrs, to children in this age greop, for nut developing coun- 5 percent. tichost 20 perce -t -poorest 20 percenc, cod poorest 40 percenttries dues derived from life tcbles; 1960, 1970 and 1980 data. of h..seholdo.
ERALTH POVERTY TARGET GROUPSLidfe Exectancy 01 Birth (years) - Average tamber of years of life reatooigi The tellowing osttmc.es ate ry approxirate qnaxuret of poverty levels,
at birth; 1960, 1970 _nd 1980 data. and should be interpreted vith considerable IcIticn.Infant Mrotaliso Rate (per ooosun-d) - Annual desths of infants- der one year Eftinted Ab te Povety Ic qe LveI (1 e ait) - ad rr
of age Per thusar.d live bircho; 1961. 1970 and 1900 dora. - Abste po-rtp iu lee in that io lev he a hi r aniruaMenus to hole aater (perecot of population) - total, orhu-, and -acul - Nno- -otritin-ully adeqpate iet plus ssential non-fond reqoir-ents Is out
boo of people (.t.l. urban, and craI) vith reassnable access to safe affordableester tupply (includes treated surface corers or sunteae- d but uEcoutauatod utlaned Reiative Povert Inome LeveI (S$ pr pit) -cron aud Irr woter s-eh a othat from pretecied borehales, springs, and sanitary calls) as Bara relative poEerty ic4een ievel (i on-r of a pe r apltoperc_ntages of their oupective populations. I. anrban area a pnbli personal income of the coantry. Urban ievel It derived frOt the rural
nountain or mianipust located nor mare tha- 200 macmrs frto s house ty he level with adjustment for higher cost of living it urban arean.considered on being within -emsocable sccess of that hease. D reral areas as.imated Poaulacion selew Absolute Poverty onc LaeI (pcet) -obareasenable accesmocld imply that the hb...oife or mebers of the h.ouehold and rural -Pter.t of population (uban and ru) ho re "do nat hsne to spend a disprepmrnIonste part of the day in fetching the . a u no e otalply' wrcaer nmede.
Aess to Etoree ta DiPorl (per-cet of roe Ilaciwo) - toss1
. sebma and rural -NumIer of people (total. amban, and rotal) served by macrots dispesel ampere.ntages of theti respecti_e ppopulatins. Enereto disposal may includetht allstin sd disposal. with or cim"s` s tomslmesut, of hsma -Irotaand canto-tmer by oster-borse ayste or the use of pit privies and simi-lar ina3tallutieus.
pu2lation per Ph-siai-a - Popalation dinided by number of prootistig phyct- EconoPie and Smei1 DNato Diviriociass qalitied from a sediral school at weiversity level. Econorie Analysis and Projetions Departmest
Peeulmsist rer Masrsiu Pe=wen - Popslat.ee divided by number at praetissag Mop 1982cl e *nd fenle Srmdmatm u -ses. wesissntt so tes pemcticol ma-m and

a

SUMMARY AND CONCLUSIONS
1. Equat rial Guinea is a small country situated between Cameroon andGabon. It includes several islands, the most important being Bioko, (formerlyFernando Po), where the nation's captial, Malabo, is located. In 1787,Fernando Po and the coasts of the Gulf of Guinea were given to Spain byPortugal, which had controlled the island during the preceding threecenturies. After having been temporarily under British influence in the early19th century, the island's administration returned to Spain in 1858. In the1960s, Equatorial Guinea's independence movements led to changes in Spain'scolonial policies. Between 1960 and 1963, the country was a Spanish territorywith two provinces sending deputies to the Spanish parliament, and in 1964, itwas granted autonomy, which meant self-administration for the provinces'internal affairs. In 1967 and 1968, representatives of Equatorial Guinea'sdifferent political parties and of Spain worked out a constitution, which wasadopted by almost two thirds of the voters. This constitution guaranteed thenational unity of the country which had been challenged by a separatistmovement led by the indigenous population of Bioko. Macias Nguema was electedPresident in September 1968, and the first Government of the Republic ofEquatorial Guinea took office on October 12, 1968. Equatorial Guinea became amember of the International Monetary Fund in December 1969 and the World Bankin July 1970.
2. At the time of Independence, Equatorial Guinea had one of the highestper capita incomes in sub-Saharan Africa. Income distribution was, however,highly uneven between the indigenous population and the expatriates and alsobetween the mainland Rio Muni and the island Bioko, which produces virtuallyall of Equatorial Guinea's high quality cacao. Rich timber forests and coffeeconstitute the country's other main resources and export products. During theeleven years following Independence, the country was dominated by a dictator-ship which demoralized the population and devastated the economy. Soon afterMacias' ascent to power, political dissidents and opponents were assassinated,a large number of people were killed, especially among the intelligentsia,fundamental constitutional rights were suspended, and approximately one thirdof the population fled the country. In early 1969, relations with Spaindeteriorated rapidly, and almost all of the 8,000 Spanish expatriates left thecountry. Teachers left and schools were closed. Spanish companies wereabandoned since they could not be taken over by Equato-Guineans due to a lackof trained managers. Increasingly bad treatment of the large number ofNigerian laborers who had been working on Equatorial Guinea's cocoa planta-tions since the end of the 19th century led to their exodus in 1976. TheGovernment reacted by introducing forced labor on the cocoa plantations, butfood production and exports of cocoa, timber, and coffee declined drasti-cally. Imports had to be cut, and the population survived at a subsistencelevel. In August 1979, a military junta overthrew the Macias regime andestablished a new Government, which has, under the presidency of Lt. Col.Obiang Nguema Mbasogo, begun to rebuild the economy and social institutions.
3. From the beginning, the new government was confronted with twoequally important tasks: (a) to create favorable conditions for raising foodand cash crop production and increasing exports, and (b) to rebuild the publicadministration and social institutions needed to support the country'sreconstruction. During the first two post-Macias years, the Government's

- ii -
policy decisions could not always be based on a sound medium and long-termdevelopment strategy due to the urgency with which these tasks had to beaddressed, the shortage of skilled administrators, and the rather hesitantforeign official and private capital aid. For example, the Government'sintention to have the private sector play a significant role in the recon-struction process has been frustrated by the shortage of local entrepreneursand the weakness and inconvertibility of the domestic currency. Consequently,in the first year of the new regime, much of the economic activity, especiallyin the import sector, was left to state enterprises or was under governmentalcontrol. The rehabilitation of the cocoa sector has also been slow becauseboth domestic and foreign labor has shown little interest in working the cocoaplantations because of the discouraging experience of forced labor under theformer regime and insufficient economic incentives. In an effort to overcomethe ad-hoc character of its development strategy and with the aim ofattracting foreign aid, the Government presented a three-year ReconstructionProgram 1982-1984 to an International Donors' conference in April 1982. TheProgram identifies agriculture and infrastructure as the main developmentpriorities, and several donors have expressed interest in financing projectsafter completion of necessary feasibility studies.
4. Equatorial Guinea's economic performance over the past two and halfyears has been mixed. Although per capita food crop production is low by WestAfrican standards, it has been increasing since farmers who had been forced towork on the cocoa plantations under the previous regime returned to cultiva-ting food crops in their fields. Any increase in food crop production beyondsubsistence levels has, however, been at best minimal, due apparently to theshortage of imported consumer goods and foodstuffs, the levels of which do notprovide sufficient incentive for increasing production of food crops.Fishermen whose boats had been destroyed to prevent them from fleeing thecountry have resumed artisanal fishing. Notwithstanding some distributionproblems and rapid price increases since 1979, basic necessities such asmanioc, fruits, sugar, rice, meat, and fish have reappeared in markets. Theelectricity supply has been improving since power stations are being repaired,and telecommunications are once again functioning. Air traffic betweenMalabo, the capital, and Africa and Europe is regular, and the two ports havebeen repaired and refurbished. A private company provides bus transportationservices on Bioko and Rio Muni. Hospitals and hotels are back in service, andschools have reopened. Even small industrial establishments such as repairand carpenter shops have resumed operations.
5. However, while Equatorial Guinea's export sector will remain thebasis of any economic recovery even if revenues from recently begun oilexploration become an important source of foreign exchange earnings, itsperformance has not been encouraging. Approximately three quarters of thecocoa plantations on Bioko and two thirds of the coffee growing areas on themainland have been abandoned and are not being harvested, and yields havefallen substantially since many plantations are poorly tended. Cocoa produc-tion, which during the 1970s had fallen to about one seventh of Independenceproduction levels, rose by 50 percent during 1980-82 since a few large growersand smallholders resumed cocoa cultivation. Equatorial Guinea's cocoaplantations, set up on Bioko by Spaniards and Fernandinos, were traditionallyworked by foreigners from Liberia, Sierra Leone, and Nigeria, since the Bubi,the island's indigenous population, refused to work on the plantations. Thescope for mechanizing cocoa production is rather limited. The Government has

- iii -
therefore made efforts to recruit foreign labor from neighboring countries,but so far no agreement has been reached. Timber exports, which at the end ofthe 1970s had dropped to one percent of average pre-Independence productionlevels, have risen twelvefold since the new government came to power.Although timber production is still considerably below its potential, it isexpected to continue to increase rapidly once the forestry administration hasbeen strenghtened.
6. Equatorial Guinea's inconvertible currency represents a majorobstacle to attracting foreign investors and laborers needed to expand cocoaproduction. Large balance of payments deficits accompanied by expansionaryfiscal and monetary policies have led to a weak national currency which istraded on the domestic market at a considerable discount from the officiallyfixed exchange rate. Equatorial Guinea has applied for membership in theBanque des Etats de l'Afriaue Centrale (BEAC, the Central Bank of UDEACcountries) within the CFA Franc Zone. Negotiations between the member states(Cameroon, the Congo, Chad, Gabon, the Central African Republic) andEquatorial Guinea are underway and membership in the Franc Zone could wellenhance prospects for the country's financial stability and economic recovery.


I. INTRODUCTION
1.1 Equatorial Guinea, a small and sparsely populated country of 28,051km2, is situated on the southern corner of the Gulf of Guinea, and consists oftwo parts: Continental Guinea and Insular Guinea. Continental Guinea, namedRio Muni, is bordered by Cameroon on the north and by Gabon on the south andeast. Insular Guinea comprises five islands: Bioko (formerly Fernando Po),home of the capital Malabo, and four smaller islands: Corisco, Grand Elobey,Little Elobey, and Annobon. Bioko and Annobon are volcanic islands withrugged and abrupt coastlines; the other three small islands are located in theestuary formed by three rivers in the southwest of the mainland. The capitalis situated at a distance of 250 km from Bata, the main city on the coast ofthe mainland, which renders communication and administration difficult. RioMuni is a peneplain consisting of granite and gneiss with an average height of650 m. The peneplain's relief originates in Cameroon and continues intoGabon. The coastal plain is preceded by a mountain range. Approximately 40percent of Rio Muni's two million ha are available for agriculture while therest of the land is covered with thick rain forests. The mainland has threemain waterways: the river Uoro Mbini divides the country into a northern andsourthern part, and the rivers Ntem and Utamboni Mitemele form part of theborders with Cameroon and Gabon. The climate is equatorial: warm and humidthroughout the year with two short dry seasons.
1.2 Equatorial Guinea's population has been estimated (with assistancefrom the World Bank) at 350,000 at the end of 1981, making it one of thesmallest West African countries after Cape Verde (300,000) and Sao Tome ePrincipe (80,000). Population growth has been estimated at 1.7 percent a yearwith growth rates varying between 2.5 percent on Bioko and 1.5 percent in RioMuni. At the end of the 1970s, Equatorial Guinea's literacy rate stood at 28percent, equal to the average rate in sub-Saharan African countries. Somewhatmore than four fifths of the population live in Rio Muni and the rest on Biokoand the other small islands. Almost 70 percent of Bioko's estimated popula-tion of 57,000 inhabitants live in the capital, whereas the rural populationon the mainland accounts for close to 90 percent of its inhabitants. Theaverage population density has been estimated at 12 persons per km2 with Biokoalmost three times more densely populated than Rio Muni. Less than one thirdof the population appears to live in urban areas of more than 5,000 inhabi-tants. The last population census was undertaken in 1960 and updated in 1965,and results of a census currently being carried out are expected to beavailable in 1983.
1.3 Equatorial Guinea's population is made up of several ethnic groups.The Fang, the most populous group, is of Bantu origin and migrated to Rio Munifrom Gabon during the 19th century. Although traditionally nomadic farmers,some Fang worked on plantations on Bioko at the beginning of the 20th centuryand brought with them cocoa and coffee farming when they returned to Rio Muniin the 1930s. Rio Muni is predominantly inhabited by Fang and divided intotwo linguistic areas: Ntumu in the north and Okak south of the river UoroMbini. Their political organization is based on consanguineous property underthe head of the family group. As currency, the Fang used spearheads, calledekuele, after which the Equato-Guinean currency unit was named in 1-975. TheBubi, the indigenous population of Bioko, estimated at about 15,000 in theearly 1980s, are racially close to the Fang and speak a Bantu language, but

various dialects have developed following their fragmented migrations from theCameroonian coast. Their society is divided according to individual socialfunctions such as farmers, hunters, and fishermen, and not according to theirincome. Like the Fang, the Bubi resisted foreign domination repeatedly andalways refused to mix with all foreigners, except the Nigerians. In 1907, theBubi refused forced labor on the plantations which led to the "Bubi war." Inthe mid-1960s and during the Constitutional Conference in 1968, the Bubi triedunsuccessfully to separate Bioko from Rio Muni. The Ndowe, numbering some20,000 people, are a Bantu group who settled on the coast of Rio Muni aroundthe 14th century. They had early close contacts with European sailors,merchants, and missionaries, for whom they often distributed merchandise tothe interior of the country. The Ndowe's social organization is similar tothat of the Fang. The Fernandinos, a small creole community of about 3,500people, live on Bioko and are descendants of Liberians, Sierra Leonians andliberated slaves. Originally large landowners, the Fenandinos have moved toindependent professions, due to their comparatively high level of education.During the 1960s and 1970s, the expatriate community consisted of Nigerians(mostly Ibos) on Bioko's cocoa plantations, 8,000 Spaniards at the time ofIndependence, and a small Cameroonian community. The diet of the indigenouspopulation consists mainly of manioc, bananas, groundnuts, some rice, palm oiland yams.
1.4 When Equatorial Guinea became independent in late 1968, it was evenless prepared to manage its economy and social institutions than other Africancountries which had gained political independence in the 1960s. Equato-Guineans had not been sufficiently trained to take over administrative andmanagerial positions in Government or business, a situation which wasaggravated by the rather sudden exodus of the Spanish expatriate communityfollowing the ascent of Macias Nguema to power. During the subsequent elevenyears of his regime, the economy was seriously mismanaged, agriculturalproduction declined drastically (Table 11, Appendix), basic services in healthcare, education and public utilities such as water and electricity were notmaintained, and roads and ports deteriorated. Foreign investment came to ahalt, and the state operated trading system broke down. The public adminis-tration virtually ceased to operate; barter trade increased; and thepopulation survived at a subsistence level. Consequently, Equatorial Guinea'sper capita income dropped from US$212 at the end of the 1960s to an estimatedUS$175 in 1981, both in current terms. Its decline in the standard of livingduring the 1970s was matched by few other countries in Africa. In addition,violations of human rights, including the arbitrary execution of thousands ofintellectuals and others, caused approximately one third of the population toflee the country.
1.5 In early August 1979, a military junta deposed the Macias regimeand established a Supreme Military Council, headed by the President,Lt. Col. Obiang Nguema Mbasogo, as the executive power of the country. Thenew Government immediately took steps aimed at revitalizing the economy andovercoming the country's isolation. In addition to measures in the agri-cultural sector, the Government promulgated a foreign investment law andstated its intention of pursuing a development strategy based on privateinitiative. A new Fundamental Law (Constitution), approved by the populationin a referendum on August 15, 1982, confirmed that the present President willremain in power for seven years; at the end of his tenure a president will beelected by universal suffrage.
II. ECONOMIC POTENTIAL AND DEVELOPMENT CONSTRAINTS
2.1 Equatorial Guinea's economy is based on agriculture, includingfishing and forestry, which provides a living for some 80 percent of thepopulation and accounts for about 50 percent of GDP and for virtually allexports. While predominantly a subsistence economy, the cash crops--cocoa,coffee, and timber--provide the population with monetary income. Manu-facturing exists only embryonically in the form of some wood and cocoaprocessing and has in the past accounted for approximately 5 percent of GDP.Commerce accounts for about 10 percent, and construction, public works, andservices comprise roughly one third of GDP. The island of Bioko, where thecountry's main cash crop, cocoa, is grown, benefits from rainfall throughoutthe year. Rio Muni, which is covered with large forests, has a morepronounced dry season. The Gulf of Guinea has abundant fish resources, andRio Muni offers good resources for river fishing. Preliminary surveys havefound encouraging indications of titanium, iron ore, silica, manganese,uranium and alluvial gold. Oil exploration has been going on since the middleof the 1960s; and recently exploration activities have increased due toassistance to the Government from Spain, the UN, and the World Bank in thissector.
2.2 The two main parts of the country have different economic bases.While on Bioko cocoa growing is the dominant economic activity with asecondary interest in food crop production (usually root crops are plantedwhere cocoa trees have died), farmers in Rio Muni concentrate on growing foodcrops with cocoa and coffee as supplementary cash crops. Bioko's cocoa wastraditionally sold on the world market and foodstuffs were imported to feedthe local population and the large numbers of foreign contract workers on theplantations. Consequently, shortages of imported food have a far more seriouseffect on living standards on Bioko than on the mainland. In Rio Muni, therewere few plantations, and the small farmers grew their own food and sold theircoffee and cocoa to estates or cooperatives. Farmers produce food on about0.75 ha utilizing a dual cropping system per year; standards of cropmanagement and yields are low and hardly any food crop surplus to familysubsistence is being produced.
Employment, Wages and Prices
2.3 Equatorial Guinea's total salaried labor force has been estimated atroughly 18,000 or about five percent of total population. Wage employment inagriculture amounts to about half of the total; approximately 6,000 people areemployed in the cocoa sector, about 2,500 in coffee production and around 600people in the forestry sector. While the latter group is employed on a full-time basis by the forestry companies, many cocoa and coffee producers are alsoengaged in subsistence food production. The public sector accounts for about7,000 people (including 3,000 in the army) or close to 40 percent of estimatedtotal salaried employment, and employment in commerce has been estimated atabout 2,000 people. During 1980-82, salary payments for civil servantsamounted on average to about half of budgetary current expenditures. Acomparatively low level of administrative training, the physical distance ofthe capital from the mainland, and a lack of alternative employment opportun-ities have contributed to the relatively high number of civil servants
- 4 -
compared to the size of the population and employment in the agriculturalsector. Minimum wages in agriculture and the public sector were raised fromEK 4,500 to EK 7,000 per month when the new Government came to power at theend of 1979, and in December 1980, the minimum agricultural wage was againraised to EK 8,500. Averge annual income in agriculture and civil serviceamounted thus to about EK 112,000 (taking into account two additional monthlypayments per year) which corresponds to US$224 a year, or some 28 percentabove GNP per capita in 1981 (calculated at the exchange rate applied in theGNP calculation for 1981). Actual wages, however, appear to be very sub-stantially above the minimum levels. Judging from budgeted expenditures onwages and salaries in the public sector, the average salary in 1981 amountedto EK 28,000 per month or four times the minimum wage level for civil servantswhile wages in agriculture appear to have reached EK 20,000 per month, or EK800-1000 per day.
Agriculture
2.4 Cocoa is the country's most important cash crop and Bioko is famousfor its high-quality cocoa. A favorable combination of climate and very goodsoils has created almost ideal conditions for producing cocoa on the island.Originally, the cocoa plantations were worked predominantly by Fang tribesmenfrom Rio Muni. From the 1930s on, however, the labor force on the plantationsconsisted increasingly of Nigerian contract workers, who numbered between30,000 and 40,000 at their peak. Before Independence, cocoa production hadreached a peak of almost 40,000 metric tons a year, and cocoa exportsaccounted for about 60 percent of merchandise exports. Cocoa was planted on53,400 ha, of which 45,700 ha were on Bioko and 7,700 ha on the mainland. Thelatter were exploited by small-scale producers while on Bioko 34,200 ha weremanaged by Spanish plantation owners and 11,500 ha by indigenous smallholders.
2.5 Cocoa production declined rapidly from 38,000 metric tons in 1967 toless than 20,000 tons in the early 1970s, following the departure of almostall of the 6,000 - 7,000 Spanish and Portugese plantation owners andtraders. It declined to about 7,000 tons a year after the exodus of theNigerian contract workers in the mid-1970s. In an effort to restore cocoaproduction, the previous Government introduced mandatory labor and broughtlarge numbers of people from Rio Muni to Bioko to work on state-ownedplantations. The sharp decline of cocoa production resulted from both thereduction in planted acreage and a significant decline of yields to less than500 kg/ha compared to 800 - 1000 kg/ha during the late 1960s. This was causedby inadequate management of the plantations by civil servants, an insufficientand unmotivated labor force, and the reduced application of insecticides andfungicides.
2.6 Equatorial Guinea's potential for growing high-quality cocoa isexceptionally good, and rehabilitation and production costs should not be highby international standards. Yields of 800-1000 kg/ha (compared to the WestAfrican average of 300 kg/ha) could probably be achieved within two to threeyears after relatively simple rehabilitation measures such as regularmaintenance and spraying. The plantations are in relatively good condition,even after many years of abandonment, and the control of diseases plaguingcocoa trees does not appear to pose any major problems.

-5-
2.7 When the new Government came to power in late 1979, it initiatedseveral steps to rehabilitate the cocoa sector. First, the former plantationowners were invited back to resume cocoa production on the conditions thatthey return within a certain time and that they invest a minimum amount ofcapital from their own resources to ensure a resumption of cocoa production.By the end of March 1980, a total of 66 estates or about half of the totalacreage under cocoa cultivation had formally been handed back to their formeroccupants or their representatives. Some growers began operating these farmswith dilapidated machinery and buildings, and with insufficient labor andagricultural inputs, while others returned to Europe, having officiallyregistered their interest in recovering their estates, but failing to make theinitial necessary investments. Still others obtained credits from thedomestic banks for resuming cocoa production but could not produce sufficientamounts to repay these credits and left the country without paying theirdebts. In early 1981, the Government decided to adjudicate the unexploitedfarms to interested Equato-Guinean farmers rather than leaving them un-occupied. Until September 1982, approximately 21,600 ha, some 47 percent ofthe total acreage under cocoa cultivation on Bioko, were adjudicated to some250 applicants on a year-to-year leasehold basis. The reallocated landincluded both plantations which had not been reclaimed by former occupants andthose which had been returned but later had been abandoned again. This lattercategory probably amounts to 14,000 ha of good cocoa plantations, and theirfuture status is now being negotiated between the Governments of EquatorialGuinea and Spain. In the meantime ownership rights of land have beensuspended for those foreigners who have abandoned their plantations since1980.
2.8 Less than one third of the 66 foreign cocoa plantation owners whoreturned to Equatorial Guinea in 1980 have actually revived their plantationsor have left a representative to take care of their interests. They accountfor nearly 6,000 ha or some 13 percent of Bioko's total cocoa acreage. Almost10,000 ha are held by about 10 individual cocoa growers or companies who haveremained or been represented in Equatorial Guinea since independence. Anothergroup of farmers is constituted by an estimated 500 family farms who are notworking as "parcelistas" or members of cooperatives; on average they each own3 ha and account for 1,500 ha of cocoa. Some 30 cooperatives, varyingsubstantially in size, account for almost 4,000 ha of cocoa or approximatelyeight percent of the total acreage under cocoa cultivation. In addition tothe cooperatives, IDEPA, the cocoa rehabilitation project financed by theAfrican Development Bank, is currently managing a total of 3,400 ha whichcomprise 16 former Spanish estates; only 710 ha, however, are actually inproduction by IDEPA-sponsored "parcelistas." The area of Bioko's cocoaplantations totaled 46,242 ha in 1983, compared to 45,700 ha in 1968. Thisindicates that there is little scope for further investment in cocoaplantations which have not yet been adjudicated. During the 1982/83 harvestonly roughly one third of the total area, however, was actually undercultivation.

-6-
Table 1: DISTRIBUTION OF COCOA PLANTATIONSON BIOKO AT THE END OF 1982
ha actuallyha % of total under cultivation
Allocated to Equato-Guineans 21,646 46.8 4,330 (20.0%)by Ministry of Agriculture
Foreign-owned plantations 9,950 21.5 3,570 (60.0%)Repossessed by former foreign owners 5,886 12.7 1,766 (30.0%)IDEPA (ADB Project) 3,400 7.4 710 (20.9%)Cooperatives 3,860. 8.4 3,774 (97.8%)Small family farmers 1,500 3.2 1,350 (90.0%)
TOTAL 46,242 100.0 15,500 (33.5%)
2.9 The Government also raised cocoa producer prices for dried beans fromEK 85/kg at the end of the Macias regime to EK 310/kg at the end of 1982(Table 7, Appendix). The small producer without drying equipment receives,however, a farm gate price of only EK 83/kg for wet cocoa, which amounts toabout 20 percent of the f.o.b. price in Malabo (EK 414/kg), compared to around60 percent received by cocoa growers in Cameroon. The substantial currencyovervaluation further diminishes cocoa growers' purchasing power andincentives. The cocoa export tax was reduced from 25 percent on the f.o.b.value in 1980 to eight percent in 1981, and it appears that it has since beenlowered further. However, the effect of these measures on cocoa productionhas been only marginal mainly because the available excess labor in Rio Municould not be attracted by cocoa producers even in cases where the latteroffered wages considerably above minimum wages. The farmers' reluctance toresume cocoa production is also due to their experience of forced labor underthe previous regime, the acute shortage of consumer goods and foodstuff, thelack of adequate housing and sanitation facilities, and the high cost ofliving, which over the past two years has risen considerably faster than wagesand cocoa producer prices (Table 6, Appendix).
2.10 Since the end of 1979, various donors have assisted the Government inits efforts to revitalize cocoa and coffee production. Spanish technicalassistance is strengthening the Ministry of Agriculture's extension service,and the UNDP Capital Development Fund is providing capital to cocoa and coffeecooperatives on the mainland. The African Development Bank has been rehabili-tating cocoa plantations on Bioko since 1980 (the loan had been signed alreadyin 1978), but so far only one fifth of the area earmarked for rehabilitationis actually being cultivated, due to difficulties in recruiting workers andother implementation difficulties. The Government has asked the World Bank toprovide financing for the longer term structural and institutional reformsnecessary to ensure a sustained increase in cocoa and coffee production. Inlate 1981, IDA approved an advance from the Project Preparation Facility and adetailed project preparation report has been prepared; appraisal of the pro-ject has been scheduled for June 1983.
2.11 Coffee, which was the country's second most important exportcommodity before Independence, was grown mainly by smallholders on some 50,000
ha in Rio Muni (along the Cameroonian border) and on 5,000 ha on Bioko.Exports amounted to some 6,000-7,000 tons a year shortly before Independenceand accounted, on average, for almost 20 percent of export earnings. Twothirds of the production was of the robusta variety, the rest of the liberiavariety. Because of (a) the forced transfer of labor from Rio Muni to Bioko,which left the coffee plantations abandoned, (b) the former government'sfailure to properly organize the collection of the crop, and (c) a lowproducer price, recorded coffee production fell steadily during the 1970s andcame practically to a standstill in 1979.
2.12 At the beginning of 1983, coffee appears to be actually grown on some20,000 ha on plots of two to five ha. Although the Government has raisedcoffee producer prices in order to stimulate production, the current producerprice of EK 70-90/kg of unhulled coffee (about 50 percent of export prices) istoo low. Considerable amounts of coffee produced in Rio Muni appear to besmuggled across the borders into Gabon and Cameroon because prices tend to betwo to three times higher there. Equatorial Guinea's actual coffee outputcould thus have been around 4,000 or 5,000 tons in 1982, ten times higher thanthe officially recorded production figure. The cocoa/coffee rehabilitationproject, prepared by the Government with the assistance of the World Bank,would also aim at substantial yield increases of coffee production, estimatedat 200 kg/ha in Rio Muni, through improved extension services, better market-ing incentives, and improved supply of inputs and consumer goods.
2.13 Equatorial Guinea has rich forests with high-quality timber. Atpresent, forestry exploita-tion represents, after cocoa production, the mostimportant economic activity. The forests are on the mainland, so, because ofits proximity to the coast, Equatorial Guinea has an advantage in timberproduction over the Central African Republic and the Congo. The main speciesare Okoume and Ayous, and yields, which are among the highest in Africa,commonly attain 25 cubic meters/ha of logs with a diameter of 50 cm or more.Of the estimated 800,000 ha of dense, unexploited forest on the mainland,315,000 ha have been allocated to 13 concessions of which only four were beingoperated in 1982. Though production has increased from an average of 6,000tons a year in the late 1970s to almost 90,000 in 1982, it is still far belowits potential, estimated at some 300,000 tons of marketable logs a year in themedium term. Only a small amount of timber production is transformed inEquatorial Guinea, and wage employment in the whole sector amounts to onlyabout 600 people. At present, local sawmills consume about 10,000 m3 of logsannually, sufficient for the local demand for sawn lumber. A new sawmill(being constructed by one of the four concessionnaires currently operating)would consume a further 12,000 m3 annually, producing lumber mainly forexport. A processing plant which has been built near the port of Bata willeventually produce sawn lumber and veneer for export, although in the earlyyears the company will export only logs. In 1981, the Government promulgateda new forestry law, intended to spur foreign investments in the forestrysector. Nevertheless, production has lagged, mainly because of the followingfactors: (a) the continued lack of confidence in the general economicsituation of the country on the part of potential investors; (b) a weak infra-structure, including roads and port facilities; (c) a shortage of trainedstaff and equipment in the forestry administration, which prevent it frommonitoring production and exports effectively; and (d) ambiguities in theforeign-investment and forestry laws which seem to restrict forestry companiesunduly in acquiring the foreign exchange they need for importing equipment,

- 8 -
goods, and spare parts. A well-rounded forestry specialist with experience indealing with concessionnaires, taxation matters, training of local staff, andestablishment of a central forestry administration appears to be the form ofassistance most urgently needed at this stage.
2.14 The main subsistence food crops are manioc, taro, fruits, vegetablesand maize. Given that the climate and soil conditions are favorable, foodproduction has expanded during the past three years and should increase sub-stantially once marketing, extension services, and the supply of goods havebeen improved. The distribution of food products is often irregular,especially on Bioko, mainly because of transport difficulties. The EC, FAO,the United States, and Spain are providing assistance in various areas of foodproduction.
2.15 At the time of Independence, the country's livestock resources metthe domestic demand for meat and dairy products. Over the past ten years,most of the more than 2,000 head of cattle on Bioko were slaughtered. Between1968 and 1979, the number of sheep fell from 22,000 to 5,000, and the numberof goats fell from 35,000 to 16,000. A broiler farm on Bioko has not beenoperational for several years. Today, the country imports almost all of itsmeat requirements. Pigs number an estimated 9,000 and are found mainly insmall villages on the mainland. Household poultry, rabbits, goats, and othersmall animals could serve as the basic protein element in the family diet.While poultry development projects are being funded by FAO and the UnitedStates, Spain is financing the re-establishment of the cattle, sheep, and pigherds through imported stock.
2.16 In the 1960s, about 8,200 ha of oil palms were cultivated, mainly inRio Muni, 2,000 ha of which were village palm groves. Production fell from3,700 tons of oil in 1965 to 700 tons in 1970. Today, some palm oil isproduced in small amounts for domestic consumption. The eight mills whichexisted at the end of the 1960s have not been functioning for a number ofyears. Some plantations are too old to be recuperated, but there are stillimportant stands of oil palms which would warrant rehabilitation investmentsin both factories and plantations. The most recent replanting appears to havebeen undertaken in 1967.
2.17 The Gulf of Guinea has abundant fish resources and Rio Muni offersgood opportunities for river fishing. At the time of Independence, proteinconsumption both in Rio Muni and on the islands consisted mainly of fish. In1967, the total catch of sea fish amounted to approximately 3,400 tons, morethan half of which were caught by traditional artisanal methods and the restby modern methods. By the end of the 1960s, modest amounts of frozen shrimpand fish were exported. At the same time, dried fish, an important part ofthe local population's food intake, was imported in amounts almost three timeshigher than domestic fish production. When the former regime destroyed thefishermen's canoes in order to prevent the island's population from fleeingthe country, the catch from artisanal fishing dropped to only 1,000 tons atthe end of the 1970s. Since 1973, the Soviet Union had the exclusive right tocommercially exploit Equatorial Guinea's fishing grounds. However, asdeliveries to the Government were considerably below the stipulated amount of6,000 tons of fish a year, the agreement was terminated in 1979.

-9-
2.18 The Government is trying to revitalize the country's industrial andartisanal fishing sectors and hopes to develop an export industry. France andthe EC are providing assistance to coastal fishing by promoting both tradi-tional and modern artisanal fishing; Spain is supporting industrial fishing byproviding refrigeration and storage facilities at Luba.
Agricultural Marketing and Extension Services
2.19 Under the former regime, Equatorial Guinea's institutions forsupporting and developing agricultural production and exports virtually ceasedto exist. The present Government has made progress in rebuilding and revital-izing agricultural extension and marketing services, but the general shortageof skilled administrators and managers is also felt in the still ratherfragile agricultural institutions. Civil servants in the Ministry ofAgriculture, Livestock and Fishing, which has the overall responsibility forsupporting agricultural production, are overburdened with daily routine tasksand therefore find insufficient time for developing an overall agriculturaldevelopment policy or creating the necessary institutions for implementingit. Spain is providing technical assistance to the Ministry of Agriculture,but there are only ten extension agents who actually visit and advisefarmers. A new Agricultural Training Centre was established in 1982 with thehelp of Spanish aid and will be staffed with the help of Canadian aid in 1983.
2.20 Agricultural cooperatives produced and marketed cocoa, coffee, and anumber of other products in the past. During the 1960s, 34 cooperatives (fourin Rio Muni and 30 on Bioko), which had roughly 4,000 members, represented 42percent of the small farmers with four ha or less on Bioko (totalling 3,800ha) and 7.5 percent in Rio Muni (totalling 35,000 ha). The cooperatives hadexpatriate managers but members elected their officials democratically. Theyhad considerable physical assets and facilities for processing their members'cocoa and coffee, similar to those of the large estates. There were alsostores for produce, materials, and equipment, and the cooperatives ownedtrucks for collecting members' produce from the farms and for delivering it tothe selling points after processing. Although the cooperatives underwentadministrative changes during the 1960s, they remained viable agriculturalmarketing agencies until they were nationalized at the beginning of 1970.During the 1970s, most cooperatives disintegrated as agricultural productiondeclined rapidly, buildings and equipment could not be maintained, and theGovernment interfered directly in the cooperatives' financial flows. Since1980, the Government has begun to revive the cooperatives with the help of theDevelopment Bank by providing them with credits and some technical assis-tance. At the end of 1982, 69 cocoa and/or coffee cooperatives (36 on thecontinent and 33 on the island) and two cooperatives for marketing vegetableshad been formed under the guidance of the Ministry of Agriculture. Inaddition, in the middle of 1982, the Ministry of Interior began to form anetwork of other cooperatives which appear to be geared to the production andmarketing of agricultural products other than cocoa and coffee.
2.21 The limited information on the cooperatives suggests that many ofthem experience substantial operating difficulties. Membership numbers varyconsiderably and some of the cooperatives are poorly administered or existonly on paper because they are too big. Few cooperatives apply proper book-keeping; systematic price or input supply policies appear to be lacking. Thecooperatives' access to the Development Bank's credits has been irregular, and

- 10 -
the latter has experienced difficulties in recovering agricultural credits.Consequently, the cooperatives have accumulated substantial debts which nowhamper their consolidation or development. However, the Government intends tomake use of the farmers' positive experience with cooperatives in the past;and the Ministry of Agriculture assists cooperatives with three specificprojects financed by Spain, the United States, and the UN Capital Fund. Thecocoa/coffee rehabilitation project currently being prepared with the help ofthe World Bank would also include a component for strengthening cooperatives.
2.22 The Chamber of Commerce, Agriculture and Forestry, a semi-autonomousagency representing cocoa and coffee growers and exporters, is handling themarketing of cocoa, but does not actually export cocoa. Since 1982, theChamber of Commerce has set, in close cooperation with the Government, minimumproducer and export prices. It also helps to grade the quality of cocoa forwhich service it receives a fee. Large cocoa producers export their cocoaindependently but inform the Chamber, while the smaller growers use theChamber as their export agent or sell their crop to larger growers. Itappears that the Chamber is often by-passed in organizing cocoa exports,particularly when exporters in Equatorial Guinea and importers in Spain workfor the same firms, represented in both countries. Underinvoicing seems tohave occurred in the past as cocoa world market prices were above those paidto Equatorial Guinea; this practice has become less common since a foreignexpert has been advising the Government on cocoa world market prices. TheChamber also imports agricultural inputs and equipments as well as consumergoods and sells them on its own accounts.
2.23 In theory, the Chamber of Agriculture in Bata, independent from itssister organization in Malabo, functions as marketing agency for coffee but inpractice has not played this role. Although not directly involved in timberexports, it also monitors minimum wood export prices, which are being set bythe Government. The Government's forestry administration appears to have onlylimited information regarding world market prices for timber and internationalmarketing practices, and substantial underinvoicing has taken place in recentyears.
Industry, Mining, Commerce and Tourism
2.24 A small manufacturing sector had evolved around timber and cocoaduring the 1960s, but most sawmills and cocoa-processing plants closed downduring the 1970s. Today only three sawmills are operating. A plywood andlumber factory was built in 1982 as a joint project between the Government andan Italian firm, and operations began in August 1982. A new sawmill has beenopened, and a brick factory built with Italian assistance is now operating.
2.25 There has been no significant mineral exploitation, but preliminarysurveys have found encouraging indications of titanium, silica, manganese,uranium, and alluvial gold. An aerial survey carried out in 1970 indicatedsome concentrations of iron in the south of Rio Muni. A mixed company, GEMSA,was formed in 1980 with Spanish and domestic capital to explore and exploitmineral resources other than oil. Mineral surveys have been carried out since1980 with technical assistance from France and Spain.
2.26 Equatorial Guinea's energy resource base is reasonably diversifiedbut underdeveloped. Dense forests (para. 2.13) provide the most important
- 11 -
energy source. The hydro potential on Bioko is estimated at 33 MW, of whichcurrently only 0.5 MW are being used. Rio Muni's hydro potential, notutilized at present, may be even larger. There is currently no production ofhydrocarbons but offshore drilling has found encouraging oil shows. The solarenergy potential is also significant but is not being used.
2.27 During the 1970s, domestic energy output and use were severelydepressed due to the economic decline. Overall energy consumption in 1980 isestimated to have been 65,000 toe or about 0.20 toe per capita. Per capitapetroleum product consumption accounts for less than 60 kg compared to anaverage consumption of 80-100 kg in sub-Saharan African countries. EquatorialGuinea's major source of energy consumed is firewood, which meets nearly 80percent of overall energy needs and virtually 100 percent of the energy needsof the rural sector, including agro-industries (mainly cocoa drying). Verylittle charcoal is used. Imports of petroleum products cover all commercialenergy requirements.
2.28 Petroleum imports were severely restricted during the 1970s becauseof the economic decline and the shortage of foreign exchange. Since the endof 1979, imports of automobiles and fuels have risen strongly and petroleumconsumption amounted to about 18,400 tons in 1980, nearly 70 percent more thanin the preceding year. Gasoil accounts for the largest share (42 percent in1980) because of its use in power generation and transport. Kerosene (22percent of consumption) is used for lighting and cooking. Gasoline accountsfor roughly one fifth of overall consumption and aviation fuels for 15 per-cent. Transportation accounts for 35 percent of consumption; power generationand residential/commercial consumption account for about 30 percent each; andindustrial consumption, including agro-industries accounts for five percent.Bioko accounts for about 60 percent of total consumption, Rio Muni for thebalance. Even in 1980, however, petroleum imports amounted to only about US$5million, or some 14 percent of merchandise imports. In 1981 and 1982, the oilimports increased to an estimated US$9 million a year which amounted to some44 percent of export earnings or roughly 20 percent of merchandise imports.While these figures compare favorably with other countries the reconstructionof the economy is expected to raise petroleum imports significantly. Also,because of small and irregular shipments, c.i.f. import prices tend to beabout one third above international refinery prices. Assuming a growth ofdomestic consumption of petroleum products averaging five percent a yearthroughout the 1980s, the petroleum import bill could amount to US$15 millionin 1985 and US$30 million in 1990 (in current prices). Expenditures of thatmagnitude would preempt a growing share of export earnings. The Government istherefore encouraging oil exploration as fast as possible in the hope ofeventually compensating for petroleum-product imports with exports of crudeand a new source of export earnings.
2.29 Equatorial Guinea's offshore area, totaling about 13,450 km2,includes parts of three distinct sedimentary basins. One of these, lyingnorth of Bioko, is an extension of the Niger Delta Basin, which contains alarge number of fields in Nigeria and Cameroon. The area south of Bioko ispart of the seaward extension of the Douala Basin of Cameroon, which issimilar to the Niger Delta Basin, and several gas fields have been discoveredboth on and offshore. The remaining basins, lying offshore from Rio Muni, arepart of the northern extension of the Gabon Basin, which is productive to thesouth in Gabon. Some 30 sizeable salt structures have also been identified

- 12 -
offshore from Rio Muni after seismic surveys in an area north of CoriscoIsland. Onshore geological work in Rio Muni has not been extensive and earlyindicators reveal little petroleum potential in this area.
2.30 In the late 1960s and early 1970s, a first round of exploration onEquatorial Guinea's continental shelf created substantial interest among oilcompanies. Four groups of companies spent approximately US$20 million toacquire 8,000 km of seismic lines and 6,000 km of airmag lines and to drillseven wells, three of which had oil shows. Exploration was interrupted in themLd-1970s because of a controversy with Gabon regarding the delimitation ofo 'fshore waters and a deteriorating investment climate. Shortly after the newGovernment took power in August 1979 and indicated its intention to encourageforeign investment, oil companies began requesting exploration permits off-shore. As a result of technical assistance provided by Spain, the Governmentand Hispanoil formed a joint company, GEPSA, to prospect for oil and toexploit any deposits found. A UNDP-financed and World Bank-executed projectprovided technical assistance in drawing up petroleum legislation, inevaluating the country's petroleum resources, and in training nationals in theoil sector. A World Bank-financed follow-up project is assisting the Govern-ment in establishing and staffing a Department of Petroleum Affairs and inestablishing an energy-sector data base. Several oil companies have made bidsfor exploration acreage and GEPSA has begun exploration activities in 1981,but no production is expected to begin before the late 1980s.
2.31 Prices of petroleum products are set by the Presidency on the basisof proposals from the state petroleum importing and marketing company(EEPGE). During most of the 1970s, these prices were held at levels insuf-ficient to cover costs. Since late 1980, however, prices of petroleumproducts have been increased by almost 400% on average. At present prices ofpremium motor gasoline gas oil and kerosene are roughly in line with pricelevels prevailing in other African countries (Table 13, Appendix). There issome subsidization of kerosene for social reasons, which is, however, morethan compensated for by the surplus obtained from the sale of other products.Electricity tariffs have been insufficient to cover costs. Tariffs werelowered in 1979 for social reasons and also in order to stimulate economicactivity. Present KWh charges are EK 20 for residential consumers and EK 30for industrial clients, compared to operating costs of approximately EK 50KWh. In practice, most residential users pay a flat fee irrespective of theiractual consumption. This has produced heavy losses for the state electricitycompany (ENEERGE) (para. 2.37), of which the 1981 budget projected revenuesamounting to only about two thirds of operating expenditures, leaving adeficit of EK 56 million.
2.32 Commerce was increasingly disrupted during the 1970s. When economicactivity declined, foreigners and nationals left the country, and many citydwellers moved back to rural areas. Most commerce was then handled by stateenterprises. In line with the Government's intention to limit the role of thestate enterprises, commerce is now handled predominantly by the privatesector; only petroleum and petroleum products are imported by the statepetroleum company EEPGE (Empresa Estatal Petrolifera de Guinea Ecuatorial).
2.33 With its beautiful scenery, beaches, and warm climate, EquatorialGuinea has a good potential for developing a viable tourist industry. Touristfacilities hardly exist at present, and it will take several years of prepara-tion before tourists can be received on a larger scale.

- 13 -
Infrastructure
2.34 Prior to Independence, Equatorial Guinea's educational system was oneof the most-developed in sub-Saharan Africa. In 1967, about 90 percent of therelevant age group was enrolled in primary schools. During the 1970s, manyschools were closed, school buildings were neglected, and most of the teachersleft. When the new Government came to power in 1979, the educational systemhad not been functioning properly for six or seven years. At present,approximately 65,000 students, nearly 60 percent'of the country's primary-school-aged population, are enrolled in primary schools. However, the resultsare less than satisfactory because curricula are poorly adapted to urgentmanpower needs, children belonging to different age groups are being taught inthe same primary classes, and qualified teachers, equipment, and teachingmaterials are lacking.
2.35 Transport and communication is hindered by the fact that the mainlandand the islands are situated at great distances from each other. Boat and airtraffic between the capital and Rio Muni is rather infrequent, resulting in aburdensome and costly administration. If not specially requested, informationon economic and social developments on the mainland reaches the governmentoffices with considerable delay, and application of policy measures andregulations in Rio Muni suffers from the large distance to the capital. Theroad network was well developed prior to 1969, but it has deteriorated afterten years of little or no maintenance, particularly in Rio Muni. The sharpreduction in traffic volume over the past years, illustrated by a decrease infuel consumption from 25 million liters in 1968 to an annual average of 4-5million liters over the period 1975-79, prevented the roads from deterioratingmore rapidly. At the beginning of 1981, the road system consisted of 1240 kaof roads, of which 528 km were paved roads and 712 km were laterite roads. Ofthe 1240 km of roads, 216 km were on Bioko and 1,024 km were on Rio Muni.Aside from obvious impediments such as broken bridges, all parts of the islandand mainland are accessible by heavy-duty automobile or pickup truck, thoughfour-wheel drive is required in some places during the rainy season. A Bankreconnaissance mission in 1980 estimated the short- and medium-term costs forrepairing and improving roads and bridges at approximately US$26 million. TheEuropean Community, Spain, and other donors are assisting the government in aroad-rehabilitation program as part of an emergency reconstruction program.
2.36 The country has two main airports, one at Malabo which can receiveinternational flights and another at Bata for small jet aircraft and turbo-props. A possible expansion of the Bata airport is currently being studied,and its facilities are being upgraded. Seaports are at Bata and Rio Bonito onthe mainland and at Malabo and Luba on Bioko. The port of Malabo has beenrepaired and improved with French assistance. The Bata port was extensivelyrebuilt during the 1970s and can handle four 20,000-tons ships at a time. Thesmaller ports are in poor condition and require refurbishing of handling gearand the construction of new warehouses. Boat service between Malabo and Batais assured by the Government's own 5,000-ton cargo boat, and an agreementsigned with Spain under that country's cooperative program with EquatorialGuinea envisages regular Spanish boat service between Spain and EquatorialGuinea and between Malabo and Bata.
2.37 The public electricity system, operated by the Empresa Nacional deEnergia Electrica de la Republica de Guinea Ecuatorial (ENEERGE) (National

- 14 -
Electrical Energy Agency of the Republic of Equatorial Guinea:, dependslargely on small diesel generators and covers only three citit s (Malabo andLuba on Bioko, Bata in Rio Muni). The system is poorly maint7-iqed, andsupplies are frequently interrupted. Only 4.3 MW of the 8.8 M4W of totalinstalled capacity are in operating condition, and transmissi3n losses areclose to 35 percent. Electricity consumption in 1980 probably did not exceed45 kilowatt-hours per capita, which is among the lowest in sub-SaharanAfrica. Because of the unreliability of the public system, many customershave increasingly relied on private generators. In view of the growing demandfor commercial energy resulting from resumed e3onomic activity, the Governmentl:is giving priority to restoring a reliable supply of electrLcity. TdheEuropean Community, UNDP, and the People's Republic of China are-providingfinancial and technical assistance for repairing the generators and the Musolahlydropower plant (in central Bioko), rebuilding the electrical distributionnetwork, and constructing an 800 kw hydroelectric power plant near Bata.
2.38 The telecommunications network became inoperative in 1970. At thattime, nine towns had a manual telephone exchange. A high-frequency radio-electric system in the 12 districts of Rio Muni and a connection betweenMalabo and Bata were established with the assistance of the People's Republicof China. Telephone connection with the outside world, which had been inter-rupted since 1976, was re-established recently, and a new telecommunicationscenter was built in Malabo with Chinese aid.
III. PUBLIC FINANCE
The Budget
3.1 Information on Equatorial Guinea's public finance situation is scarceand data on the Government's financial transactions often appear inconsis-tent. In April 1980, the first formal budget since 1974 was enacted, and sofar the budgets have covered only transactions of the central administra-tion. Equatorial Guinea's public sector consists of (a) the centralgovernment (Presidency, 18 ministries and several public entities responsiblefor such services as post and telecommunications); (b) 18 local municipali-ties, Malabo and Bata being the most important, which depend heavily onfinancial transfers from the central administration's budget; and (c) some 10public enterprises which operate without administrative autonomy and underdirect supervision of the ministries concerned in commerce, transportation,industry, electric power, and distribution of petroleum products.

- 15 -
Table 2: CENTRAL GOVERNMENT BUDGET 1980-1982(in millions of Ekueles)
Preliminary Estimates1980 1981 1982
Current Revenues 2,642 2,308 3,468Tax revenue 1,113 1,648 2,707
of which: taxes on int'l trade (832/ (1,312) (2,370)Non-tax revenue 1,529-/ 600 761
Current Expenditures 2,791 3,006 3,714of which: wages and salaries (1,280) (1,473) (2,020)
Current Deficit -149 -698 -246
Capital Expenditures 933 748 2,046
Overall Deficit -1,082 -1,446 -2,292
FinancingCentral Bank 1,189 1,622 2,353Accumulation of external debt -112 -219 -61Use of deposits 15 43 -
1/ Includes EK 853 million of funds left by previous regime.
Source: Equato-Guinean authorities and IMF staff estimates.
3.2 Equatorial Guinea's public finance situation is, at present,characterized by a very weak revenue base and large expenditures caused byreconstruction activities, including salary payments for civil servants.During 1980-82, revenues have increased by only 30 percent while overallexpenditures rose by more than 50 percent, resulting in large budgetarydeficits amounting to 57 percent of revenues or about 25 percent of estimatedannual average GDP. Actual deficits were, however, probably larger due tosubstantial extrabudgetary expenditures. The large public finance deficitsare a reflection of Equatorial Guinea's stage of reconstruction, which neces-sitates a certain level of expenditures without equivalent revenuegeneration. It is clear, however, that deficits of this order can only besustained for a short period.
3.3 Revenues almost doubled during 1980-82 (excluding the funds left bythe previous regime), resulting from a tripling of tax revenues from inter-national trade, the main revenue source. Their contribution to total revenueshas risen from close to half in 1980 to somewhat more than two thirds in1982. Customs data suggest that import duties account for about 80 percentand export duties for 20 percent of assessed taxes on international trade in1981. Actual tax collections fell, however, short of assessments because ofpoor collection and underinvoicing of timber exports. Export duties vary from

- 16 -
50 percent on the f.o.b. value for ivory goods, 25 percent and 10 percent forunprocessed and processed timber to 8 percent for cocoa and its residuals(reduced from 25 percent in mid-1980) (Table 9, Appendix). Import duties varyfrom 15 percent of the c.i.f. value of investment and consumption goods to 100percent on alcoholic beverages (Table 10, Appendix). The rates of customsduties appear to have been determined primarily with the aim of generatingrevenues since the authorities we're not in a position to evaluate other policyobjectives when Equatorial Guinea's foreign trade channels were re-opened atthe end of 1979. Import and export duties should therefore be readjusted oncethe export sector has recovered from its present weakness and has regained itsrile as a major source for budgetary revenues.
3.4 Total expenditures increased more than 50 percent in 1982 from theirlevels during the preceding two years due to a doubling of capital expendi-tures, including advance payments for construction works, and to wage andsalary payment increases of civil servants by more than 30 percent. During1980-82, current expenditures have, on average, accounted for 73 percent oftotal expenditures and salaries for civil servants amounted to almost 50percent of current and 34 percent of total expenditures, on average, duringthe same period. The resulting average annual current deficit of EK 364million amounted to somewhat less than one fourth of the overall budgetarydeficit. Capital expenditures, accounting for 27 percent of totalexpenditures, on average, during 1980-82, have been directed mainly toinfrastructural investments such as road construction, repair of power plants,reconstruction of ports, airports, telecommunication facilities, woodprocessing and brick making plants as well as the acquisition of a fishingvessel. Budgetary deficits have been financed almost exclusively by theCentral Bank. The budget for 1983 is currently being prepared with technicalassistance from the IMF.
3.5 The resumption of normal budgetary procedures in 1980, even iflimited to the central government, constituted an important step toward estab-lishing sound financial practices. But extra-budgetary spending has continuedand seriously limits the usefulness of the budget. In order to correct thissituation and to effectively control expenditures, the Government established,at the end of 1980, a new system whereby the President, assisted by the formerExecutive Committee for Economic Policy (CEPE), was to be responsible formaking economic policy decisions and for monitoring their implementation. TheCommittee was to be chaired by the Technical Secretary of the Ministry ofFinance and Commerce and was to comprise the Governor of the Central Bank anda representative of the Presidency. The Central Bank was supposed to honoronly payment orders issued by the Ministry of Finance, which is solely respon-sible for issuing such orders in adherence to expenditure resolutions approvedby the President within budgetary limits. Two government officials, one ofwhom was to be the Technical Secretary of the Ministry of Finance, were tosign all contracts that obligated the Government. In mid-1981, however, theCommittee was disbanded and replaced by the Technical Cabinet, which in themeantime appears also to have lost its functions.
Public Enterprises
3.6 In the past, public enterprises played an important role inEquatorial Guinea's economy. The present Government has encouraged theprivate sector to play an active role and some of the public enterprises'
- 17 -
activities have been curtailed. But no clear definition of their function orfinancial relationship with the central or local governments' budgets has yetevolved. Public enterprises have not yet been given financial autonomy,though some of them seem to enjoy a greater degree of administrative andfinancial autonomy than others, and dependency upon heavy government subsidiescontinues to be one of their main characteristics. They are partly financedwith proceeds from earmarked revenues, but few data are available regardingeither the nature of these revenues or their contribution to the enterprises'total revenues. It appears that most public enterprises are operatinginefficiently, and irregular accounting procedures make it impossible todetermine the extent of their losses.
3.7 Power plants, the national airline, telecommunications, the postalservice, and a transportation enterprise in Bata, for example, function aspublic enterprises attached to their appropriate ministries. The Chamber ofCommerce, performing a public function with only limited autonomy, receivespart of the taxes on production and exports of wood and is thus part of thepublic sector. The State Petroleum Enterprise, the largest non-financialpublic enterprise, is responsible for importing and distributing petroleum andpetroleum products. As an agency of the central administration it has its ownbudget, but it has no administrative or financial autonomy. It has a centraloffice in Malabo and a theoretically subordinate, local office in Bata; theseoffices, however, operate independently from each other, and their accountshave never been consolidated. No financial statements of any kind have beenprepared by the enterprise. The limited information available for a shortperiod in October 1980 indicates that the enterprise in Malabo is sustaininglosses, primarily because the prices it charges for imported petroleumproducts do not cover costs. Although imports of petroleum products aretaxable, taxes appear to have been collected only irregularly.
IV. MONEY AND CREDIT
4.1 After Independence, Equatorial Guinea's currency, the EG peseta, wasat par with the Spanish peseta, and it remained at par when the Ekuele (EK)was issued. Certain interim exchange quotations were in force until April 9,1979 when the Ekuele was pegged to the SDR at EK 90 = SDR 1, within margins of2 percent. From August 6, 1979 to June 20, 1980, the Ekuele was pegged at parto the Spanish peseta, and on June 21, 1980, the Ekuele was depreciated to arate of EK 1 = Pta 0.5. There reportedly exists a parallel exchange market,in which the Ekuele is traded at a rate of EK 1 = Pta 0.15. At the beginningof 1983, the EK stood at approximately EK 260 to the US dollar.
4.2 At the time of Independence, Equatorial Guinea's banking systemcomprised the Central Bank (the Banco Central de la Republica de GuineaEcuatorial), two branches of Spanish commercial banks, and a Spanish-ownedsavings bank. Various changes in the banking system took place throughout the1970s, and, in 1979, the new Government renamed the Central Bank the Banco deGuinea Ecuatorial (BGE). The former government-owned commercial and develop-ment bank was revived under a new name, the Banco de Credito y Desarrollo(BCD). The Banco Exterior de Guinea Ecuatorial (GUINEXTEBANK) was licensed inApril 1980; it is jointly owned by the Banco Exterior de Espana and theGovernment and is managed on strictly commercial lines, mainly in foreign

- 18 -
trade, while the BCD is meant to function as both a commercial and adevelopment bank.
4.3 Prior to 1979, the Central Bank played a passive role,and creditdecisions were taken by the Government. Since then, the Bank has become moreindependent and has been authorized to establish minimum reserve requirements,to rediscount bank credit, and to fix credit terms and conditions. The Bankseems to have been only marginally involved in controlling and allocatingimport credits.
Table 3: MONETARY AND CREDIT DEVELOPMENTS, 1979-1982(in millions of Ekueles, end of period)
1979 1980 1981 1982Dec. Dec. March June Sept. Dec. March June Sept.
Net foreign assets 1,326 788 258 -1,708 -2,075 -2,006 -3,059 -1,232 -3,583Assets 1,326 2,636 1,840 1,519 1,180 1,336 1,846 3,742 1,423Liabilities -- 1,848 1,582 3,227 3,255 3,344 4,905 4,974 5,006
Domestic credit 1,295 8,487 8,919 9,567 10,849 13,011 13,841 12,539 14,782Claims on government
sector (net) -959 254 14 105 322 950 1,904 408 2,119Claims on private
sector 2,254 8,233 8,905 9,462 10,527 12,061 11,937 12,131 12,663
money 2,435 4,938 5,459 4,612 4,819 5,773 5,962 7,391 7,350Currency in circulation 1,537 2,316 3,186 2,129 2,230 3,229 3,038 3,391 3,909Demand deposits 898 2,622 2,273 2,483 2,589 2,544 2,874 4,000 3,441
Quasi-money 899 644 1,513 669 1,033 1,050 1,454 1,021 1,636
Other items (net) -713 3,693 2,205 2,578 2,922 4,180 3,366 2,895 2,213
Source: Bank of Equatorial Guinea; IMF staff estimates.
4.4 Monetary and credit developments over the past three years reflectedthe revitalization of the economy. Following the change of Government in1979, substantial foreign aid was received, imports and economic activitiesincreased and remonetization of the economy began. In 1980, net foreignassets declined by some 40 percent as foreign liabilities rose substantiallyfaster than foreign assets. The increase in foreign liabilities reflectedprimarily the use of Fund resources in connection with a stand-by arrangementwith the IMF in that year. This trend continued throughout the following twoyears and net foreign assets became negative in mid-1981, and, towards the endof 1982, thley had declined by almost EK 5 billion from their end-1979 level.Large liquidity needs resulted in a strong domestic credit expansion in 1980which continued during 1981 and 1982, albeit at a somewhat slower speed.Credits to the private sector, financing both imports and renewed activitiesin the cocoa sector, represented by far the largest part of domestic credit
- 1 9 -
expansion; it increased by almost four times in 1980 and nearly sixfoldbetween the end of 1979 and 1982. This credit expansion was caused by thesurge in demand for imports, the remonetization of economic activities, andcredit needs on the part of foreigners who had returned to Equatorial Guineato reclaim their property. In addition, arrears on many existing loans hadbuilt up which meant that only a few new credits could be financed with fundsfrom repaid maturing loans. Credits to the private sector came from thecommercial banks but they were made available by credit expansion from theCentral Bank to them. Net credit to the Government (including public enter-prises) rose rapidly during 1980-82, reflecting the large budgetarydeficits. Monetary liabilities, which had risen by only EK 277 millionbetween 1976 and 1979, grew by about eight times as much in 1980 and increasedby another 60 percent before September 1982, a further indication of theremonetization of the economy.
4.5 In the course of the past three years the distribution of credits tothe various sectors of the economy extended by the Credit and Development Bank(BCD) has changed. The proportion of credit directed to agricultural andexport financing has fallen from 41 percent at the end of 1979 to 10 percentin mid-1982 as cocoa producers hesit4ted to invest and rehabilitate theirfarms. Credits to small-scale industry such as construction and woodprocessing have, on the other hand, more than doubled during 1980-82 andaccounted at the end of 1982 for almost a third of the credits awarded by theBCD; credits to finance imports and commerce accounted for somewhat more thanhalf of all credits given by this bank. GUINEXTEBANK's sector creditdistribution has, however, remained roughly unchanged during 1980-82 since itconcentrated on foreign trade financing. These changes reflect the stagnationin the cocoa sector, the revival of timber production and exports, the generallack of well-prepared investment projects and the need to finance imports ofconsumer goods. The monetary authorities took steps to channel credit to moreproductive activities by trying to restrict certain types of loans, establish-ing legal reserve requirements, and introducing a system of refinancing whichwas intended to channel commercial bank credits into productive sectors. Thispolicy was not successful mainly because BCD did not need to follow theprogram; its other sources of refinancing, such as overdrafts on its accountswith the Central Bank, were not curtailed and GUINEXTEBANK could not identifyenough creditworthy borrowers in foreign trade, in spite of strongly negativeinterest rates favoring borrowers.
V. BALANCE OF PAYMENTS
5.1 Following the change of Government in late 1979, Equatorial Guinea'sforeign trade underwent a rather drastic change. Under the previous regime,most international transactions were handled by the government or state enter-prises, and foreign trade was severely restricted because virtually no foreignexchange was available. Under the new Government, foreign trade is, inprinciple, free of restrictions but subject to some temporary exceptions, suchas an import licensing system which is being applied in order to relieve someof the pressure on the country's foreign exchange reserves. In 1980,potential private importers often failed to obtain a share of the scarceforeign exchange allocated by the Government and approximately two thirds oftotal registered imports were for official accounts. Since then, imports have

- 20 -
been handled predominantly by the private sector. In December 1980, thePresident approved wide-ranging legislation on urgent measures of economicreorganization which included revising the customs law, regulating foreigntrade, and creating a monthly budget for import licenses.
5.2 During the 1970s, Equatorial Guinea s overEll balance of paymentsusually recorded a surplus because import lerels were determined by foreignexchange earnings since access to foreign credit was 3everely restricted and,increasingly, imports had to be paid in cash. During the first three years ofthe 1980s, however, the current account and overall balance of payments showedsubstantial deficits. A combination of liberalization in the internationaltrade and payment system, supported by strong expansionary fiscal and monetarypolicies, and sluggish exports turned the current account surplus whichaveraged US$9 million a year during 1977-79 into an average annual deficit ofUS$29 million during 1980-82, amounting to roughly 35 percent of GDP onaverage. Substantial capital inflows during 1980-82 amounted to roughly onehalf of the current account deficits, leaving an overall deficit of aboutUS$14 million a year during that period. About one fourth of the deficitswere financed by drawing on Equatorial Guinea's reserves and three fourths byIMF facilities and short-term credits from Spain.
Table 4: BALANCE OF PAYMENTS, 1976-82
(in millions of current US$)
Estimates1976 1977 1978 1979 1980 1981 1982
Exports, fob 9.7 26.9 23.5 28.6 13.3 16.2 19.7Cocoa (8.4) (22.0) (23.0) (27.4) (11.3) (13.1) (14.1)Wood (0-3) (2.7) (0.5) (0.8) (2.0) (3.1) (5.0)Coffee (1.0) (2-.2) (-) (0-4) (-) (_) (0.6)
Imports, cif -12.2 -9.7 -16.1 -23.6 -37.0 -44.9 -47.2
Trade Balance -2.5 17.2 7.4 5.0 -23.7 -28.7 -27.5
Services (net) - - - -0.9 -0.8 -4.7 -6.6Transfers (net) 0.2 -0.4 -0.4 -0.1 0.6 0.9 5.0
Current Account Balance -2.3 16.8 7.0 4.0 -23.9 -32.5 -29.1
Capital (net) -0.1 -1.3 -0.8 (-) 6.4 8.4 21.9Spanish Credit lines
(medium and long term) - - _ (_) (7.0) (3.1) (12.9)Other - - - C-) (-0.6) (5.3) (9-0)
Capital grants - - - - 2.9 2.9 2.4SDFIt allocation - - - 1.3 1.3 1.2 -Short-term capital C-) 3.4 7.4 -4.4Trust Fund - - - - 5.9 - -Errors and Omissions -6.4 -12.9 -17.9 1.6 -9.3 -3.7 -1.3
Overall Balance (Increase in Reserves +) -8.8 2.6 -11.7 6.9 -13.3 -16.3 -10.5
FinancingSChanges in Foreign Assets 8.8 2.6 11.7 -6.9 1.1 7.2 3.4Other incl. Fund Resources - - - - 12.2 9.1 7.1
Source: Data provided by Government officials, IHF reports, and staff estimates.

- 21 -
Merchandise exports and imports
5.3 Equatorial Guinea's direction of trade is determined by its strongtraditional ties with Spain. In the past, imports-originated predominantly inSpain and, to a lesser extent, in neighboring countries. During the 1970s,however, the Soviet Union, China, and Cuba became the country's main tradingpartners. When policy orientation changed in 1980 and Spain promptly providedcredit lines for import financing, the traditional trading pattern was soonre-established. During the first ten months of 1980, imports from Spain(excluding imports into Rio Muni for which no data are available) accountedfor 84 percent of total imports, with most of the rest coming from Cameroonand Nigeria. Spain has also traditionally been the main export market forEquatorial Guinea, and exports experienced similar changes in direction.
Table 5: COMPOSITION OF EXPORTS 1970 AND 1976-1982(in percentages)
1970 1976 1977 1978 1979 1980 1981 1982
Cocoa and cocoaproducts 66 87 82 98 96 85 81 72
Timber 9 3 10 2 3 15 19 25Coffee 24 10 8 - 1 - - 3Other 1 - - - - - -
TOTAL 100 100 100 100 100 100 100 100
Source: Bank of Equatorial Guinea, and staff estimates
5.4 Equatorial Guinea's exports have traditionally consisted of cocoa,coffee and wood. Cocoa accounted for between two thirds and nearly 100percent of exports while coffee and timber accounted for roughly one quarterof export earnings at the beginning of the 1970s and in the early 1980srespectively (Table 5). Other products such as palm oil and fish wereexported only in small quantities. During the 1970s, cocoa, wood, and timberexports declined rapidly, but favorable world market prices for these com-modities during the second half of the 1970s, accompanied by a restrictiveimport policy, ensured positive current accounts. Following the change ofGovernment, timber exports almost tripled during 1980-82 as former conces-sionaires and new ones attracted by the comparatively high profitability ofthe sector expanded production and world market prices for timber remained atcomparatively high levels. The surge of timber exports is probably evenunderestimated since considerable underinvoicing took place before regulationsfor minimum timber export prices were issued in 1982. Production, quality,and world market prices of cocoa, however, dropped to record low levels at theend of the 1970s and at the beginning of the 1980s, resulting, during 1980-82,in export earnings almost one-third lower in current terms on an averageannual basis than during 1977-79. Officially recorded coffee exportsvirtually disappeared, though it has been estimated that unofficial exportsmay have amounted to some 4,000 tons in 1982.

- 22 -
5.5 Until 1979, Equatorial Guinea's imports were paid directly by drawingon foreign assets of the Central Bank. The lack of foreign exchange and theneed to pay in cash kept imports restricted to the most essential goods.After friendly countries and international organizations provided foreignexchange following the change of Government at the end of 1979, average annualimports rose from US$16 million during 1977-79 to US$37 million in 1980, andto USt46 million during 1981 and 1982. Little is known about the compositionof imports, but it appears that the share of equipment goods in total importshas somewhat increased in connection with reconstruction activities in housirngand infrastructure. Import figures are to be interpreted with caution since,in the past, imports have sometimes been authorized without correspondingimport licenses. Large discrepancies also exist between imports as recordedin the balance of payments, which is based on import payments, and importregistrations at Customs.
Services and Transfers
5.6 During most of the 1970s, receipts and payments for services andtransfers represented only a small fraction of Equatorial Guinea's currentaccount balance since its relations with other countries were greatlyreduced. When the Government expanded its relations with foreign countries atthe beginning of the 1980s, expenses for diplomatic representations andofficial travel abroad increased rapidly. The deficit on the services accounthas also risen substantially in 1981 and 1982 because of higher interestpayments on Equatorial Guinea's external debt. Unrequited transfer receiptshave been increasing steadily during 1980-82, and showed a substantialincrease in 1982, due to payments by oil companies for exploration rightsestimated at approximately US$4 million.
Capital movements
5.7 Equatorial Guinea's capital account recorded only insignificantmovements during the 1970s. After the change of Government, Spain grantedfour credit lines of about US$48 million for import financing, one line forconsumption goods amounting to US$8 million and three lines totalling US$40million for investment goods. In 1980, the capital accounts showed a surplusof US$6.4 million compared to US$1.3 million in 1979. Further drawing on theSpanish credit lines, on an Argentinian credit line for consumption andinvestment goods, and on a loan from the OPEC Fund resulted in a net capitalinflow (including grants) of almost US$20 million in 1981 and an equal amountin 1982. Capital grants, consisting mainly of consumer goods, averaged US$2.7million a year, or close to US$8 per capita. Little direct foreign investmenthas taken place in Equatorial Guinea during 1980-82 although a liberal invest-ment law was issued in November 1979. Foreign investors have been cautiousand appear to have been waiting for the results of the international donors'conference held in Geneva in early 1982. Also, the inconvertibility ofEquatorial Guinea's currency has proven to be a serious obstacle to foreigndirect investment and the country's application for membership in the CFAFranc Zone is expected, if approved, to attract investors on a larger scale.
International Reserves
5.8 Equatorial Guinea's gross foreign assets averaged almost US$18million, or some 13 months of imports (at very low levels), during 1975-79.

- 23 -
This comparatively high reserve level was needed because all internationalpayments had to be made in cash. In the course of 1980, when the balance ofpayments became negative, net foreign assets declined to less than a third oftheir end-1979 level, a result of a rapid build-up of foreign liabilitiesconsisting mainly of balance-of-payments support from the IMF in the form of astand-by arrangement and from the compensatory financing facility. The deter-ioration of Equatorial Guinea's balance of payments in 1981 and 1982 led to afurther depletion of its reserves, and net foreign assets declined from US$6.4million at the end of 1980 to minus US$10 million at the end of 1981 and anestimated minus US$20 million at the end of 1982. Gross foreign assetsdeclined from almost US$20 million or almost ten months equivalent of importsat the end of 1979 to US$6 million or one and a half months worth of importsin September 1982. (Table 5, Appendix).
External Debt
5.9 Following the re-opening of Equatorial Guinea's economy at the end of1979, its external debt almost doubled during the following three years.Approximately two thirds of the estimated outstanding and disbursed debt ofUS$80 million at the end of 1982 has been contracted since August 1979. Spainremains the largest creditor with 36 percent of the debt, followed by thePeople's Republic of China with 24 percent, and by Italian suppliers with 17percent. Most of the debt contracted since 1979 has been granted on conces-sional terms with regard to interest rates, but much of it has a relativelyshort repayment period. Debt service payments have consequently more thantripled between 1981 and 1982, and the debt service ratio has been estimatedat around 33 percent in 1982. Equatorial Guinea's debt service is expected toincrease considerably over the next few years and will become a substantialobstacle to devoting a larger part of foreign exchange to financing investmentprojects if the terms of debt contracting cannot be markedly improved.
Table 6: EXTERNAL DEBT, 1980 - 1982(in millions of US dollars)
1980 1981 1982
1. Outstanding and Disbursed 45.4 51.6 80.1
Spain 14.8 16.7 29.0China, Peoples' Republic of 20.8 20.6 19.5IMF Trust Fund 5.9 5.3 5.0Cuba 1.0 1.1 1.0U.S.S.R. 1.6 1.5 0.8OPEC 1.0 1.5 1.5African Dev. Bank 0.3 1.8 3.6Italy - suppliers' credits - 3.1 13.5France - Credit line - - 1.0Argentine - Credit line - - 5.2
2. Debt Service - 2.1 7.0
Source: Bank of Equatorial Guinea; IMF staff estimates.

- 24 -
VI. DEVELOPMENT STRATEGY AND PROSPECTS
6.1 The destruction of Equatorial Guinea's economy and socialinstitutions during the 1970s, the shortage of skilled manpower and theabsence of a functioning civil ser'vice at the time of the sudden takeover ofpower in late 1979 made it difficult for the new Government to elaborate andpursue a comprehensive development strategy. During the first years of itsrule, the Government concentrated on returning the country to politicalstability, re-establishing the legal and administrative framework needed tosupport the economic reconstruction process, and attracting and coordinatingthe expected foreign aid. Rebuilding ministries and public agencies has beena difficult and slow process. Both skilled Equato-Guinean cadres, who areoverburdened by their heavy daily workload, and foreign technical advisorsconcentrated first on the emergency-type tasks of the reconstruction processsuch as reopening schools, re-establishing domestic and international lines ofcommunication, providing medical services, and establishing administrativerules and procedures. The Government is aware of the very weak public admin-istration and the limited capacity for identifying and planning investmentprojects and has tried to overcome this constraint in several ways. Firstly,responsibilities for some key sectors of the economy have been transferredfrom the Ministries concerned to the Presidency in order to centralize thedecision-making process, minimize coordination problems, and economize thelimited skilled cadres. The transfer of responsibilities for the petroleumand forestry sectors into the Presidency are examples of this policy.Secondly, a new Ministry of Development Planning was created in late 1982 whena new Government was formed following the constitutional elections. TheMinistry is responsible for overall development planning, preparation ofprojects and foreign aid coordination. Another element of the Government'seffort to cope with the weak public administration is the extensive use offoreign technical assistance. Several infrastructure projects, the proposedcocoa/coffee rehabilitation project, and' the technical assistance project inthe petroleum sector provide the necessary support for project implementationand for building governmental institutions and agencies. The petroleum sectorT.A. project, for example, aims at assisting the Government in establishing aDepartment of Petroleum Affairs within the Presidency, which would administerthe country's petroleum sector and strengthen the energy sector's overallmanagement. The administrations's difficulty in evaluating the technicalassistance offered and the only slow progress in rebuilding public and socialinstitutions have, however, at times precluded a more effective use of foreignfinancial and technical aid. Thirdly, the Government has stated that itcounts on the private sector to play a significant role in the reconstructionprocess, but a shortage of entrepreneurs and foreign exchange, combined with astill dilapidated physical infrastructure, have so far hampered a moresuccessful implementation of this approach. Although a series of policymeasures (including the promulgation of the foreign investment law, a newcustoms and capital-control law and the conclusion of several cooperativeagreements with European and Latin American countries) have created a morefavorable climate for the country's economic reconstruction, foreign invest-ments have been made only at a moderate pace.
6.2 At an International Donors' Conference in April 1982, prepared withUNDP and Bank assistance, the Government presented an Economic Reconstruction

- 25 -
and Development Plan for 1982-84 which aims at revitalizing domestic foodproduction, stimulating production of export crops, and providing a basicinfrastructure. The program foresees investments in the amount of US$141million (in constant 1981 US dollars) during 1982-84, of which some 80 percentwould be for what the Government considers high priority projects. Some 20percent of total planned investments was earmarked for projects in 1982, about30 percent for 1983 and approximately half of the total for 1984. Overallinvestment expenditures over the next few years could be expected to be veryhigh in relation to GDP, since Equatorial Guinea finds itself in a recon-struction period with a considerable number of infrastructure projects andvirtually the whole investment program is expected to be financed by foreignsources. Indeed domestic savings are likely to continue to be negative duringmost of the 1980s. In addition, almost all proposed projects will containheavy technical assistance components in order to strengthen the Government'sabsorptive capacity and to make the projects economically viable. But evenassuming an average economic growth of five percent a year in real termsbetween 1981-84, the proposed investment program would amount to almost 70percent of GDP on average during 1982-84, compared to about 13 percent in1981. Notwithstanding the generally favorable response of foreign donors atthe Conference, the investment program is thus much too ambitious. Most ofthe proposed projects need considerable additional preparation and willtherefore have to be delayed. As a result, actual investments, includingtechnical assistance, are not expected to exceed US$15 million a year, orabout 20 percent of GD? during the first half of the 1980s.
6.3 The composition of the investment program reflects the Government'sshort- and medium-term objectives to achieve a more balanced development thanthe country inherited from its colonial past. The 1982-84 reconstructionprogram thus represents a link between the emergency measures taken during1980-82 and future economic and social development plans which are expected tocommence in 1985. The reconstruction program focuses on the resumption ofproductive activities in agriculture, the forestry sector and small-scaleindustry, the restoration of essential public services, and specific measuresto reduce Equatorial Guinea's external dependency, such as in food or energyconsumption. The Government has therefore decided to concentrate investmentsin the following areas of priority: agriculture, human resources, basiceconomic infrastructure, and management and administration. Slightly morethan half of programmed investments has been allocated to infrastructure andhousing, almost one quarter to agriculture, about one tenth to industry,mining and energy and the rest to education, health, and administrativesupport projects. In general, investment priorities have been well chosen,and they reflect the needs of the country in its present state. The compara-tively large share of investments programmed for physical infrastructure, i.e.roads, bridges, electricity and water supply, public building and housing, isdue to the serious dilapidation of Equatorial Guinea's infrastructurethroughout the 1970s and the necessity to rebuild a minimal basic infra-structure without which both domestic and foreign investments in productivesectors cannot be expected.
6.4 HIowever, the Government's capacity to prepare and implement projectsis still very limited, even assuming large foreign technical assistance. Aselective approach of tying, as much as possible, infrastructure projects tococoa, coffee and timber production and rehabilitation activities-would botheconomize on skilled cadres since integrated projects would mean a smaller

- 26 -
number of projects and generate foreign exchange and domestic employment. Thenumber of projects and amounts spent on infrastructure should therefore bereduced in favor of projects in agriculture, education, health, administrationand other support institutions rather than attempting to rebuild most of theneeded infrastructure over a comparatively short period. This approach wouldenhance the Government's capacity to generate public savings which could thencontribute to development expenditures. A reorientation of the investmentprogram towards directly productive activities would also help to alleviatethe substantial debt service burden the country will face during the next fewyears. Last but not least, these two factors would help to attract additionalforeign official and private project financing.
6.5 Equatorial Guinea's short- and medium-term development will belargely determined by two constraints: (a) the shortage of skilled adminis-trators and entrepreneurs, and (b) the probably only gradual increase offoreign aid over the next few years. Although petroleum may eventually becomeEquatorial Guinea's most important source of foreign exchange and budgetrevenues, the Government is aware of the fact that agriculture will remain themainstay of the economy in the short and medium term and has focused itsreconstruction efforts therefore on cocoa and coffee rehabilitation andforestry. The shortage of local skilled manpower, significantly higher laborcosts than in the past, unLavorable prospects for world market prices forcocoa throughout the 1980s, the need for extensive technical and managerialassistance, and (for the time being) a substantially overvalued currency arelikely to delay the cocoa sector's contribution to the country's reconstruc-tion and to reducing the pressure on the balance of payments. EquatorialGuinea's considerable forestry reserves, on the other hand, could helpincrease export earnings quickly. Wood production could be expanded rapidly,and world market prices are expected to rise in real terms throughout the1980s, such that timber export earnings could amount to as much as US$30million a year in the long run, compared to about US$5 million in 1982.Imports of food and other consumption goods are expected to grow moderatelyover the next few years while the reconstruction activities in infrastructureand agriculture will generate a strong demand for intermediate and capitalgoods, so merchandise imports are likely to continue to increase during thenext few years at a high average annual rate of some 20 percent. As a result,it is unlikely that the deficit for trade and services can be reduced below$20 million in the next three to five years. Although net foreign capitalinflows are expected to increase towards the mid-1980s, they will only sufficeto fund the most urgent projects presented at the donors' conference.
6.6 Over the next few years both investment and consumption levels areexpected to increase; thus positive domestic savings will be achievedslowly. During the transitional period of reconstruction, the Government'smost difficult policy objective will consist in obtaining foreign financing athighly concessional terms. Equatorial Guinea's good prospects for economicgrowth in the medium term and a selective approach in the investment programcombined with technical assistance at macro, sectoral and project levelsshould facilitate this task. Initially, most foreign exchange earnings fromexpanded cocoa, coffee and timber production will have to be used to pay formuch needed imports of foodstuffs and other consumer goods. Over time,however, incremental income should increasingly translate into demand fordomestically produced foodstuffs, provided the exchange rate and import dutieswill be adjusted with the aim of discouraging food imports. An increasing

- 27 -
share of foreign exchange earnings would then become available for investment
purposes which, together with foreign funds, could support the creation of
small-scale agro-industrial activities.

- 28 -
STATISTICAL APPENDIX
Statistical information on Equatorial Guinea's economic andsocial development is still very scarce. During the 1970s, statisticaldata were gathered only in the most rudimentary fashion, and currentdata are provided only unsystematically. This situation is reflected inthe presentation of the tables in the following Appendix. The WorldBank, the United Nations and the IMF continue to assist EquatorialGuinea in establishing basic data on population, national accounts,balance of payments, public finance, and other macroeconomic or sectoraldevelopments.

-29-
Table 1: NATIONAL ACCOUNTS APPENDIX
(in million of Ekueles)
Estimates Projection1970 1975 1976 1977 1978 1979 1980 1981 1982 1983
A. Sector Output
Value added 5,180 4,474 3,570 3,700 4,220 4,260 4,800 6,200 7,200 8,800
Agriculture 3,430 2,232 1,490 1,520 2,070 1,990 2,400 3,100 3,800 4,900Manufacturing 195 312 250 260 210 220 250 260 320 460Construction, public works 280 320 280 250 190 210 280 360 380 540Electricity, water 15 35 30 30 20 20 40 50 60 100Commerce 350 428 370 410 440 460 520 680 780 880Transport and Telecomm. 70 83 60 70 80 90 120 160 210 240Public Administration 630 810 900 980 1,060 1,110 1,000 1,300 1,400 1,500Other Services 210 254 190 180 150 160 190 290 250 180
B. Sectoral Output (in %)
Total 100.0 100.0 100.0 100.0 100.0 100.0 100.0 100.0 100.0 100.0
Agriculture 66.2 49.9 41.7 41.1 49.1 46.7 50.0 50.0 52.8 55.7Manufacturing 3.8 7.0 7.0 7.0 5.0 5.2 5.2 4.2 4.4 5.2Construction, public works 5.4 7.2 7.8 6.8 4.5 4.9 5.8 5.8 5.3 6.1Electricity, water 0.3 0.8 0.8 0.8 0.5 0.5 0.8 0.8 0.8 1.1Commerce 6.8 9.6 10.4 11.1 10.4 10.8 10.8 11.0 10.8 10.0Transport and Te:Lecomm. 1.4 1.9 1.7 1.9 1.9 2.1 2.5 2.6 3.0 2.7Public Administration 12.2 18.1 25.2 26.5 25.1 26.1 20.8 21.0 19.4 17.0Other Services 4.1 5.7 5.3 4.7 3.6 3.8 4.0 4.7 3.5 2.0
C. Gross Domestic Product, 1981(in millions of US dollars)
Consumption 73.4(Private) (70-9)(Public) (2.5)
Gross Domestic Investment 7.8Exports of goods and NFS 19.5Imports of goods and NFS 39.4
Gross Domestic Product 61.3
Net Factor Income from Abroad 0.1Gross National Product 61.4Domestic Savings -i,2.1Resource Gap -19.9
Memorandum Items (in %)
Investment to GDP 12.7Domestic Savings to GDP -19.7

- 30 -APPENDIX
Table 2: CENTRAL GOVERNMENT FINANCE,1970-1971 and 1980-1982
(in millions of Ekueles)
Prelim. Estimates1970o2/ 19711/ 1980 1981 1982
Total revenue 813 737 2,642 2,308 3,468
of which:Tax revenue -- -- 1,113 1,648 2,707Non-tax revenue -- -- 1, 5 2 9 2/ 600 761
T'otal expenditure 1,240 1,355 3,724 3,754 5,760
of which:Current expenditure 589 610 2,791 3,006 3,714Capital expenditure 651 745 933 748 2,046
Budget surplus or deficit -427 -618 -1,082 -1,446 -2,292
Financing
Central Bank -- 60 1,189 1,622 ,2,353Suppliers' Credits 172 211 ... ...Treasury 329 383 15 43 --
Accumulation of Ext. Debt -- -- -112 -219 -61
1/ In millions of EG pesetas (at par with Spanish peseta).2/ Includes EK 853 million of funds left by previous regime.
Source: Ministry of Finance, Central Bank, IMF reports and staffestimates.

- 31 - APPENDIX
Table 3: CENTRAL GOVERNMENT REVENUE, 1980-1982(in millions of' Ekueles)
Actual Estimate1980 1981 1982
Total Revenue 2,642 2,308 3,468
Tax Revenue 1,113 1,648 2,707Taxes on income and profits 135 170 178Rura.l property income (27) (50) (3)Urban property income (2) (11) (2)Individual income (21) (77) (115)Other income taxes (85) (32) (58)
Taxes on property 34 19 10Inheritance and transfers
of property (34) (19) (10)
Taxes on goods and services 101 136 142General sales (99) (135) (140)Other (2) (1) (2)
Taxes on international trade 832 1,312 2,370Import duties (.) (.) (1,640)Export duties (".) (..) (730)
Other taxes 11 11 7Stamp tax (11) (11) (7)
Nontax Revenue 1,529 660 761Nontax revenue (current) 676 501 577Property income (98) (106) (100)Administrative fees and
nonindustrial sales (353) (369) (366)Other (28) (26) (III)Transfers from nonfinancialentities (197) (--) (--)
Extraordinary and contingencyreceipts 853 159 184
Sources: Data provided by the Equatorial Guinean authorities; andstaff estimates

- 32 - APPENDIX
Table 4: CENTRAL GOVERNMENT EXPENDITURE, 1980-1982(in millions of Ekueles)
Actual Prel. Estimate1980 1981 1982
Total Expenditure 3,724 3,754 5,760
Current Expenditure 2,791 3,006 3,714
Wages and salaries 1,280 1,473 2,020
Other purchase of goodsand services 1,456 1,354 1,499
Subsidies and othercurrent transfers 55 159 195Municipalities (33) (55) (73)Decentralized entities (--) (6) (8)Nonfinancial enterprises (2) (64) (107)Households (2) -- (1)Int'l organizations (18) (34) (6)
Interest payments -- 20 --Domestic (--) (--) (-)Foreign (__) (20) (--)
Capital Expenditure 933 748 2,046
Acquisition of new and existingcapital assets 933 748 2,046Direct payments (933) (748) (1,046)Advance payments (--) (--) (1,000)
Sources: Data provided by the Equatorial Guinean authorities; and IMF staffestimates

33 -APPENDIX
Table 5: INTERNATIONAL RESERVES, 1979 - Sept. 1982(in millions of US$)
1979 1980 1981 1982Dec. Dec. Mar. June Sept. Dec. Mar. June Sept.
Net foreign assets 19.5 6.4 1.5 -9.2 -10.6 -10.3 -14.6 -5.7 -16.0
Foreign assets 19.5 16.9 10.8 8.1 6.0 6.7 8.9 17.2 6.2Correspondents (17.9) (16.5) (10.0) (7.4) (5.5) (6.1) (8.6) (16.8) (5.9)Foreign banknotes (0.1) (0.1) (0.1) (0.1) (0.1) (--) (--) (0.1) (--)SDR holdings (0.9) (--) (0.4) (0.4) (0.1) (0.1) (0.1) (0.1) (0.1)Reserve positionin Fund (0.3) (- (-) -) (-) (0.2) (_ _) (-
Gold 1/ (0.3) (0.3) (0.2) (0.2) (0.2) (0.2) (0.2) (0.2) (0.2)
Foreign liabilities -- 10.5 9.3 17.3 16.6 17.1 23.5 23.0 22.2Use of Fund credit (--) (10-5) (9.3) (17.3) (16.6) (17.1) (16.8) (16.5) (16.0)Spanish stand-by (--) (--) (--) (-_) (-_) (--) (6.7) (6.5) (6.2)
Memorandum item:Foreign assets inmonths of imports 12.8 7.2 3.3 2.6 1.9 2.1 2.5 4.8 1.7
1/ Valued at SDR 35 per fine ounce
Source: Data supplied by the Bank of Equatorial Guinea.

34 APPENDIX
Table 6: SELECTED RETAIL PRICES IN MALABO MARKET,1979 - OCTOBER 1982
(in Ekueles (EK) and U.S. dollars; end of period)
1979 Nov. 1980 1981 Oct. 1982EK US$ EK US$ EK US$ EK US$
Foam-rubber sandals 1,500 23.08 800 5.23 800 6.81 1,200 5.10Matches 25 0.38 25 0.15 50 0.26 50 0.21Soap (Cameroon) 75 1.15 75 0.49 150 0.77 250 1.0620 Benson & Hedges cigarettes 350 5.38 500 3.27 700 3.59 800 3.40Imported ladies' shoes (pair) 5,000 76.92 3,500- 22.88- 8,000 41.05 8,000 34.03
4,000 26.14Imported men's shoes (pair) 8,000 123.08 5,000 32.68 4,500 23.09 13,000 55.30Local dress 3,000 46.15 3,500 22.88 ... ... 4,500 19.14Men's shirt (sleeveless) 2,000 30.77 2,000- 13.07- 3,500 17.96 6,000 25.52
2,500 16.34Child's dress 1,500 23.08 1,500- 9.80- 1,800 9.24 4,500 19.14
2,000 13.07Envelopes (each) 25 0.38 25 0.16 25 0.13 50 0.21Watch 10,000 153.84 6,000- 39.22- 9,500 48.74 25,000 106.34
7,000 45.75Imported dress cloth (yard) 5,000 76.92 3,000 19.61 .4,500 23.09 4,500 19.14Pencil (Chinese) 25 0.38 25 0.16 25 0.13 50 0.21Shoe polish (tin) 150 2.30 150 0.98 ... ... 1,300 5.53Small padlock 300 4.61 400 2.61 ... ... 500 2.13Large padlock 500 7.69 600 3.92 ... ... 800 3.40Metal file 300 4.61 300 1.96 ... ... 500 2.13Fish hooks (each) 25 0.38 1'25 0.82 25 0.13 200 0.85Chinese condensed milk (tin) 300 4.61 200 1.31 600 3.08 1,100 4.68Cooking pot with lid 600 9.23 800 5.25 1,200 6.16 6,500 27.65Men's underwear 700 10.77 500 3.27 1,600 9.24 2,500 10.63Men's trousers (Spanish) 6,000 92.30 1,500- 9.80- 4,500 23.09 5,000 21.27
5,000 32.68Candle 300 4.61 50 0.33 100 0.51 250 1.06Javel (detergent) 500 7.69 300 1.96 ... ... 800 3.40Onions (each) 100 1.54 100- 0.65- 150 0.99 200 0.85
200 1.31Tomato paste (small tin,
Italian) 200 3.08 150 0.98 125 0.64 125 0.53Bananas (each). 5 0.08 5-10 0.03- 25 0.13 50 0.21
0.07Gin (bottle) 4,000 61.54 2,500 16.34 2,500 12.83 4,500 19.14Whiskey (bottle) 4,500 69.23 2,500 16.34 4,500 23.09 5,000 21.27Campari (bottle) 5,000 76.92 5,000 32.68 6,500 33.35 5,000 21.27Flashlight batteries (each) 200 3.08 150 0.98 350 1.80 300 1.28Bic biro 100 1.54 150 0.98 ... ... 200 0.85Bread (small loaf) 50 0.76 50 0.33 50 0.26 100 0.43Sardines (tin) 200 3.08 150- 0.98- ... ... 300 1.28
200 1.31Insecticide spray 900 13.85 ... ... 1,700 8.72 2,500 10.63
Sources: Statistical Office of Equatorial Guinea and staff estimates.

- 35 - APPENDIX
Table 7: COMMODITY PRODUCER PRICES, 1979-1982(in Ekueles per kg)
Cocoa 1/ Coffee
1976 - 1978 85 55
1978 - 1979 80 55
August 1979 - June 1980 125 55
June 1980 - September 1981 190 225
September 1981 - September 1982 270 225
September 1982 - present 310 225
1/ Superior quality dried beans.
Source: Equato-Guinean authorities.

- 36 -APPENDIX
Table 8: SELECTED TIMBER EXPORT PRICES,1978-1982 YEARLY AVERAGES
(in US dollars per cubic meter)
EquatorialGuinea's World Bank World Bank Marches
average price price price Tropicaux(all wood) (Lauan) (Sapelli) (Okoume) I/
1978 42 92 191 124
1979 103 160 212 160
1980 122 193 252 221
1981 53 144 213 175
1982 (est.) 58 150 200 147 2-
1/ Okoume, Loyal et Marchand, f.o.b., R6publique Populaire du Congo2/ Average through October 1982.
Sources: Customs manifests, Marches Tropicaux (various issues), and WorldBank forecasts.

-37 -APPENDIX
Table 9: SUMMARY OF EXPORT TARIFFS, 1980-1982(in percent of f.o.b. value)
1980 1981 1982July Dec. Nov. Oct.
Ivory goods 50 50 50 50
Coffee 25 15 15 15
Cocoa and its residuals 25 22 8 8
Cocoa cake, paste, and oil,and cocoa powder 25 14 14 14
Timber--unprocessed 30 30 30 25
Timber--semimanufactured products 30 20 20 20
Timber--manufactured products 30 10 10 10
Other items -- 30 30 30
Sources: Equato-Guinean governmental decree laws of July 23, 1980 andDecember 30, 1980

- 38 -APPENDIX
Table 10: SUMMARY OF IMPORT TARIFFS, JULY-DEC. 1980(in percent of c.i.f. value)
July December
Basic tariff--all investment andconsumption goods 10 15
Beer and wine 50 50Special wines and other light alcoholicbeverages 70 70
Other alcoholic beverages 100 100 1/Tobacco 70 70Gasoline and derivatives 60 60Kerosene and heating oil 10 15Diesel 10 40Motor oil, vaseline, and paraffin 10 20Perfumes and cosmetic items 60 80Chapter 36--Gunpowder, explosives,matches, etc. 20 20
Chapter 37--Photographic and cine-matographic products 20 30
Travelling bags and other items(leather goods) 15 (20) 30
Air conditioners, refrigerators,freezers 10 30
Radios (with special attachments) 20 (25) 30Televisions 40 60Sports cars and boats 100 60Other cars 30 60Photographic equipment 20 50Video equipment and sound systems 60 60Record players and tape recorders 40 50Sports and hunting guns 50 30Furniture 20 30Chapter 97--Toys and recreational items 40 30
1/ With a minimum tax of EK 500 a liter.
Sources: Equato-Guinean governmental decree laws of July 23, 1980 andDecember 30, 1980
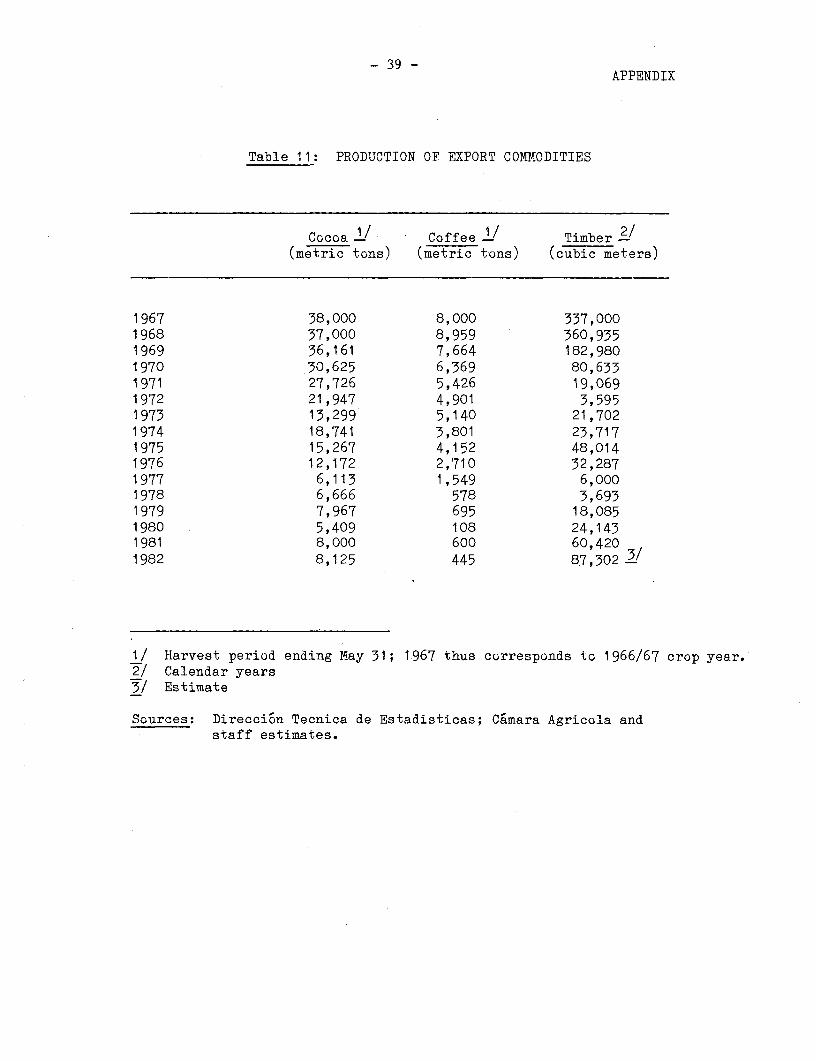
- 39 -APPENDIX
Table 11: PRODUCTION OF EXPORT COMMODITIES
Cocoa L/ Coffee 1/ Timber 2/(metric tons) (metric tons) (cubic meters)
1967 38,000 8,000 337,0001968 37,000 8,959 360,9351969 36,161 7,664 182,9801970 30,625 6,369 80,6331971 27,726 5,426 19,0691972 21,947 4,901 3,5951973 13,299 5,140 21,7021974 18,741 3,801 23,7171975 15,267 4,152 48,0141976 12,172 2,710 32,2871977 6,113 1,549 6,0001978 6,666 578 3,6931979 7,967 695 18,0851980 5,409 108 24,1431981 8,000 600 60,4201982 8,125 445 87,302 3/
1/ Harvest period ending May 31; 1967 thus corresponds to 1966/67 crop year.2/ Calendar years3/ Estimate
Sources: Direccion Tecnica de Estadisticas; Camara Agricola andstaff estimates.
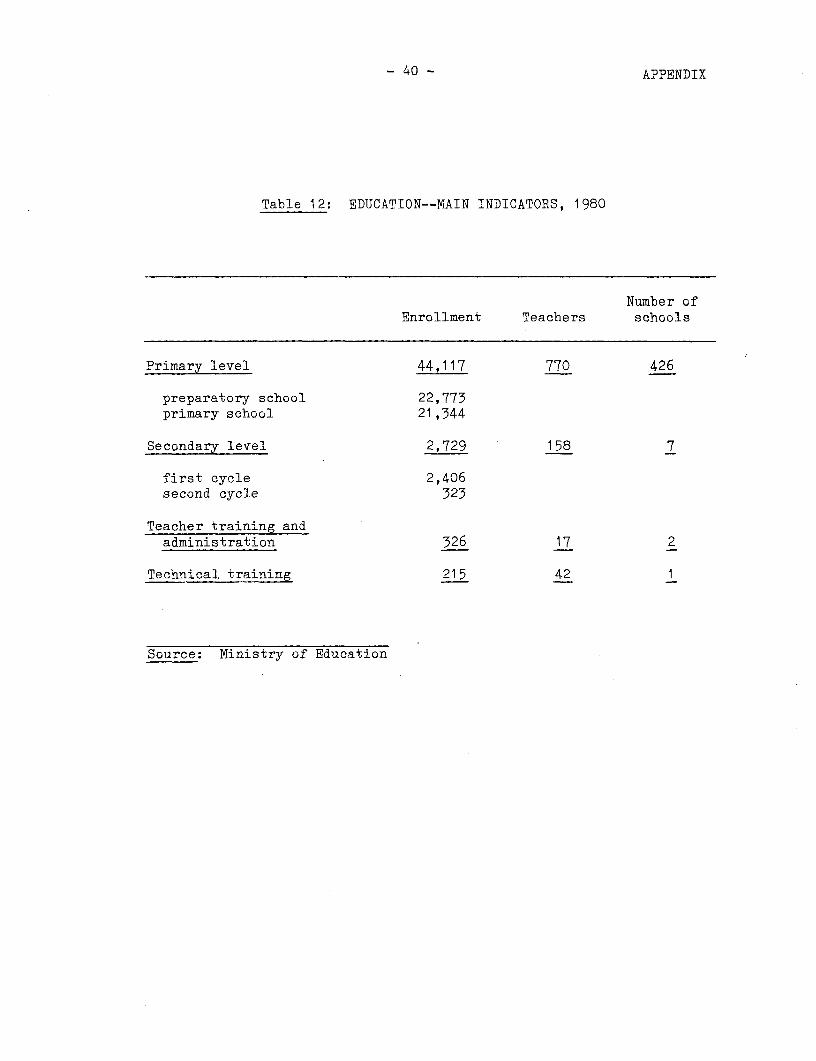
- 40 - APPENDIX
Table 12: EDUCATION--MAIN INDICATORS, 1980
Number ofEnrollment Teachers schools
Primary level 44,117 770 426
preparatory school 22,773primary school 21,344
Secondary level 2,729 158 7
first cycle 2,406second cycle 323
Teacher training andadministration 326 17 2
Technical training 215 42 1
Source: Ministry of Education

- 41 - APPENDIX
Table 13: STRUCTURE OF MAIN PETROLEUMPRODUCT PRICES - DECEMBER 1981
(US /gal. equivalent)
Regular PremiumGasoline Gasoline Kerosene Gas Oil
Import Price (cif) 122.6 125.7 137.0 135.0
Import Duty 73.6 75.4 13.7 13.5Marketing Cost 1/ 18.4 18.9 20.5 20.3
Cost to EEPGE_/ 214.6 220.0 171.2 168.8
EEPGE Margin 1/ 7.7 22.7 -30.0 5.3Sales Tax (3%) 6.7 7.3 4.2 5.2
Retail Price 229.0 250.0 145.4 179.3
1/ Mission estimates. Marketing costs are assumed to equal 15% of cifimport prices.
Source: EEPGE; Customs Department; mission estimates.


IBRD 10259R1
90- - -1r > 10° ~ I OCTOBER 1982Douala /
EQUATORIAL GUINEA,L.MALABO
0 Beney Existing asphalt roads
Beloerf Existing laterite roads
Planned roads
BIOKO / RiversLuba 4 Ports
- etete Airports
J( MusoIa l / a \ba Bridges
yusa . -.- International boundaries
: ' , .I
-34 f o° 0
..~~~~~~~~~~~~~~~~~~~~~~~~- I ~ ~ ~ ~ ~ ~ ~ ~ ~ ~ ~ ~ ~ ~ ~ ~ ~ ~ ~ ~ 3
Ebolowa
Gulf of Gt'/nea-
CAMEROON
Rio Campo
s*30. .r- . . . .
2 0~~~~~~~~~~~~~~~~~~~~~~~~~~~ Ken coesn e
.2 fNkue 2°
ANNOBON 1.
. 1'30I5330en 1g,30 /
Mbfn R I O MAU N Mongoo Z
_ _ ge rl 1 v? )c9. Aalabot > _i
I *--rt NIGER v nayo
VOI TA - CHADIf '~~ NIERIA /
o .- t-f /. Akalayong o
;4 t R W E | e (X0hure~~ ~ ~ ~~~~~~~~~~~~~~~~~~~~~~~~~~ncm NIsork
GVl/VEA i r o, t1, 0 20 40 60 80GA8ON;tl 1. COR[SCO 1. \_ _'_,_'_-_,_'_' __ Kilometers
Annobo-l. G A B O N 0 10 20 30 40 M itesL
; 5 AIRE r Thi s nap has been prepared bythe Whorld Banks staff-closirely for the con.en..ne.
Miles of the readers of the report to Which t is attached The de..n.at,ss oed d the
F _00 odar,es shown on this map ds not imply, on the part of the World Bank sod its
I o -~ affiiates, yf ldgment on the legal Va- of 1 ateiy or soy endo eto0 560 )Obo I ~ ~ N..~sne-ptasse of s-sh bo-odar,-.500 -1000 1500 ANGOLA lao 11~~~~~~~~~~I0