Embed Size (px)
Citation preview

EQUAL CHANCESIN EQUAL CHANCESIN USING MODERN USING MODERN TECHNOLOGIESTECHNOLOGIES
Bologna (Italy)
Iasi (Romania)
Adana (Turquie)
Monte Mor ò Veilhio (Portugal)
Usak (Turquie)


Geographic information system
A geographic information system (GIS), also known as a geographical information system or geospatial information system, is a system for capturing, storing, analyzing and managing data and associated attributes which are spatially referenced to the Earth. In the strictest sense, it is an information system capable of integrating, storing, editing, analyzing, sharing, and displaying geographically-referenced information. Geographic information science is the science underlying the geographic concepts, applications and systems, taught in degree and GIS Certificate programs at many universities.Geographic information system technology can be used for scientific investigations, resource management, asset management, Environmental Impact Assessment, Urban planning, cartography, criminology, history, sales, marketing, and logistics. For example, GIS might allow emergency planners to easily calculate emergency response times in the event of a natural disaster, GIS might be used to find wetlands that need protection from pollution, or GIS can be used by a company to site a new business to take advantage of a previously underserved market.

History of developmentAbout 35,000 years ago, on the walls of caves near Lascaux, France, Cro-Magnon hunters drew pictures of the animals they hunted. Associated withthe animal drawings are track lines and tallies thought to depict migrationroutes. While simplistic in comparison to modern technologies, these earlyrecords mimic the two-element structure of modern geographic informationsystems, an image associated with attribute information. Possibly the earliest use of the geographic method, in 1854 John Snowdepicted a cholera outbreak in London using points to represent thelocations of some individual cases. His study of the distribution of cholera led to the source of the disease, a contaminated water pump within theheart of the cholera outbreak.GIS was the world's first "system" and was animprovement over "mapping" applications as it provided capabilities foroverlay, measurement, and digitizing/scanning. It supported a nationalcoordinate system that spanned the continent, coded lines as "arcs" havinga true embedded topology, and it stored the attribute and locationalinformation in separate files.

Techniques used in GIS
Data creationModern GIS technologies use digital information, for which various digitized data creation methods are used. The most common method of data creation is digitization, where a hard copy map or survey plan is transferred into a digital medium through the use of a computer-aided design (CAD) program, and geo-referencing capabilities. With the wide availability of ortho-rectified imagery (both from satellite and aerial sources), heads-up digitizing is becoming the main avenue through which geographic data is extracted. Heads-up digitizing involves the tracing of geographic data directly on top of the aerial imagery instead of through the traditional method of tracing the geographic form on a separate digitizing tablet.

Data representationGIS data represents real world objects (roads, land use, elevation) with digital data. Real world objects can be divided into two abstractions: discrete objects (a house) and continuous fields (rain fall amount or elevation). There are two broad methods used to store data in a GIS for both abstractions: Raster and Vector.
RASTER
Raster data type consists of rows and columns of cells where in each cell is stored a single value. Raster data can be images (raster images) with each pixel (or cell) containing a color value. Additional values recorded for each cell may be a discrete value, such as land use, a continuous value, such as temperature, or a null value if no data is available. While a raster cell stores a single value, it can be extended by using raster bands to represent RGB (red, green, blue) colors, colormaps (a mapping between a thematic code and RGB value), or an extended attribute table with one row for each unique cell value. The resolution of the raster data set is its cell width in ground units.

A simple vector map, using each of the vector elements: points for wells, lines for rivers, and a polygon for the lake.
In a GIS, geographical features are often expressed as vectors, by considering those features as geometrical shapes. In the popular ESRI Arc series of programs, these are explicitly called shapefiles.
VECTOR
TYPES OF GEOMETRYTYPES OF GEOMETRY
Different geographical features are best
expressed by different types of geometry:

POINTS
1) Zero-dimensional points are used for geographical features that can best be expressed by a single grid reference; in other words, simple location. For example, the locations of wells, peak elevations, features of interest or trailheads. Points convey the least amount of information of these file types.

LINES
2) One-dimensional lines or polylines are used for linear features such as rivers, roads, railroads, trails, and topographic lines.

Polygons
3)Two-dimensional polygons are used for geographical features that cover a particular area of the earth's surface. Such features may include lakes, park boundaries, buildings, city boundaries, or land uses. Polygons convey the most amount of information of the file types.

Advantages and disadvantages
There are advantages and disadvantages to using a raster or vector data model to represent reality. Raster data sets record a value for all points in the area covered which may require more storage space than representing data in a vector format that can store data only where needed. RasterRaster data also allows easy implementation of overlay operations, which are more difficult with vector data.

VectorVector data can be displayed as vector graphics used on traditional maps, whereas raster data will appear as an image that may have a blocky appearance for object boundaries. Vector data can be easier to register, scale, and re-project. This can simplify combining vector layers from different sources. Vector data are more compatible with relational database environment. They can be part of a relational table as a normal column and processes using a multitude of operators.

Voxel
Selected GIS additionally support the voxel data model. A voxel (a portmanteau of the words volumetric and pixel) is a volume element, representing a value on a regular grid in three dimensional space. This is analogous to a pixel, which represents 2D image data. Voxels can be interpolated from 3D point clouds (3D point vector data), or merged from 2D raster slices.

Projections, coordinate systems and registration
A property ownership map and a soils map might show data at different scales. Map information in a GIS must be manipulated so that it registers, or fits, with information gathered from other maps. Before the digital data can be analyzed, they may have to undergo other manipulations—projection and coordinate conversions, for example—that integrate them into a GIS.

ProjectionProjection Projection is a fundamental component of map
making. A projection is a mathematical means of transferring information from a model of the Earth, which represents a three-dimensional curved surface, to a two-dimensional medium—paper or a computer screen. Different projections are used for different types of maps because each projection particularly suits certain uses. For example, a projection that accurately represents the shapes of the continents will distort their relative sizes. See Map projection for more information.

Spatial analysis with GIS

Topological modeling
In the past years, were there any gas stations or factories operating next to the swamp? Any within two miles (3 km) and uphill from the swamp? A GIS can recognize and analyze the spatial relationships that exist within digitally stored spatial data. These topological relationships allow complex spatial modelling and analysis to be performed. Topological relationships between geometric entities traditionally include adjacency (what adjoins what), containment (what encloses what), and proximity (how close something is to something else).
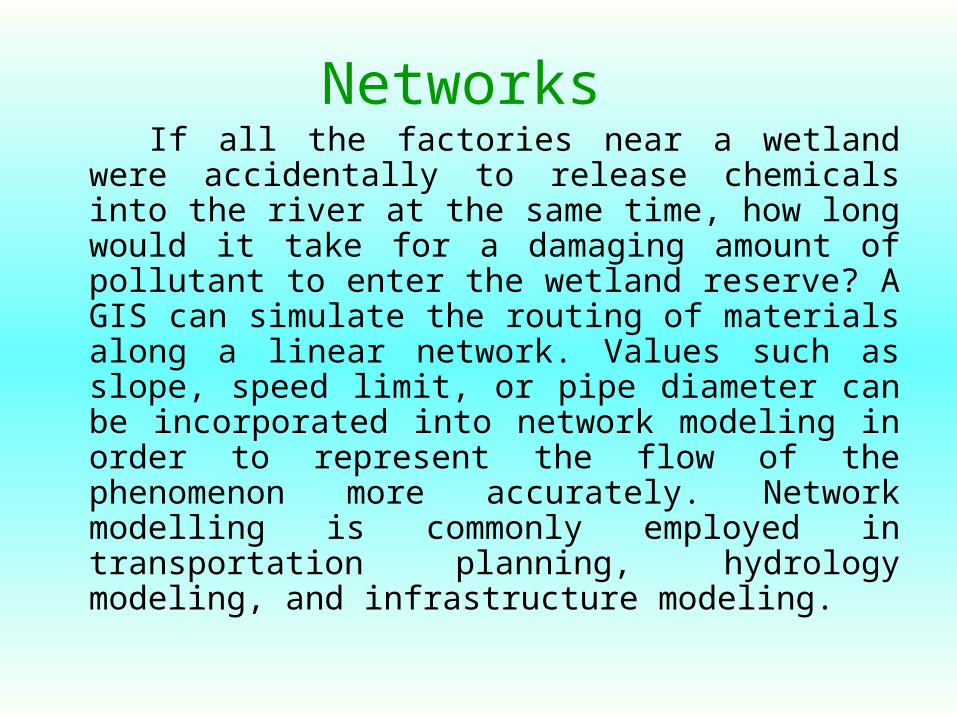
Networks If all the factories near a wetland were
accidentally to release chemicals into the river at the same time, how long would it take for a damaging amount of pollutant to enter the wetland reserve? A GIS can simulate the routing of materials along a linear network. Values such as slope, speed limit, or pipe diameter can be incorporated into network modeling in order to represent the flow of the phenomenon more accurately. Network modelling is commonly employed in transportation planning, hydrology modeling, and infrastructure modeling.

Cartographic modeling

Automated cartographyAutomated cartography
Digital cartography and GIS both encode spatial relationships in structured formal representations. GIS is used in digital cartography modeling as a (semi)automated process of making maps, so called Automated Cartography. In practice, it can be a subset of a GIS, within which it is equivalent to the stage of visualization, since in most cases not all of the GIS functionality is used. Cartographic products can be either in a digital or in a hardcopy format. Powerful analysis techniques with different data representation can produce high-quality maps within a short time period. The main problem in Automated Cartography is to use a single set of data to produce multiple products at a variety of scales, a technique known as Generalization.

GeostatisticsGeostatistics
Geostatistics is a point-pattern analysis that produces field predictions from data points. It is a way of looking at the statistical properties of those special data. It is different from general applications of statistics because it employs the use of graph theory and matrix algebra to reduce the number of parameters in the data. Only the second-order properties of the GIS data are analyzed.
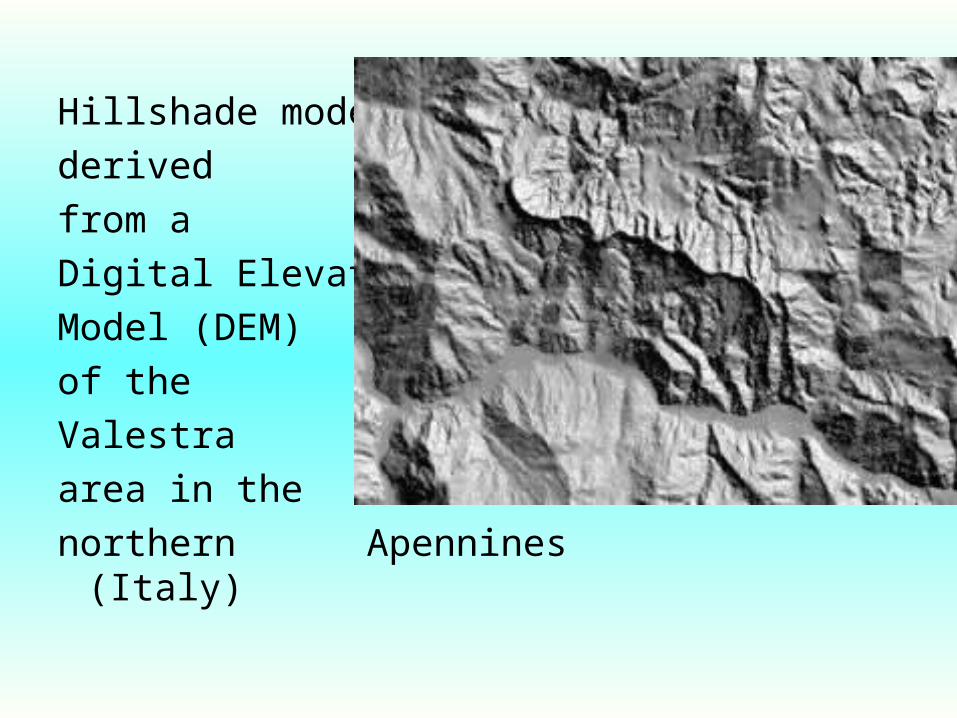
Hillshade model
derived
from a
Digital Elevation
Model (DEM)
of the
Valestra
area in the
northern Apennines (Italy)

Data output and cartographyData output and cartography
Cartography is the design and production of maps, or visual representations of spatial data. The vast majority of modern cartography is done with the help of computers, usually using a GIS. Most GIS software gives the user substantial control over the appearance of the data.
Cartographic work serves two major functions:
First, it produces graphics on the screen or on paper that convey the results of analysis to the people who make decisions about resources. Wall maps and other graphics can be generated, allowing the viewer to visualize and thereby understand the results of analyses or simulations of potential events.
Second, other database information can be generated for further analysis or use. An example would be a list of all addresses within one mile (1.6 km) of a toxic spill.

GIS softwareGIS software Geographic information can be accessed,
transferred, transformed, overlaid, processed and displayed using numerous software applications. Within industry commercial offerings from companies such as ESRI and Mapinfo dominate, offering an entire suite of tools. Government and military departments often use custom software, open source products, such as GRASS, or more specialized products that meet a well defined need. Although free tools exist to view GIS datasets, public access to geographic information is dominated by online resources such as Google Earth and interactive web mapping

Data creationData creation
GIS processing software is used for the task of preparing data for use within a GIS. This transforms the raw or legacy geographic data into a format usable by GIS products. For example an aerial photograph may need to be stretched (orthorectified) using photogrammetry so that its pixels align with longitude and latitude gradations (or what ever grid is needed). This can be distinguished from the transformations done within GIS analysis software by the fact that these changes are permanent, more complex and time consuming.

GeodatabasesGeodatabases
A geodatabase is a database with extensions for storing, querying, and manipulating geographic information and spatial data.

Management and analysisManagement and analysis GIS analysis software takes GIS data and
overlays or otherwise combines it so that the data can be visually analysed. It can output a detailed map, image or movie used to communicate an idea or concept with respect to a region of interest. This is usually used by persons who are trained in cartography, geography or a GIS professional as this type of application is complex and takes some time to master. The software performs transformation on raster and vector data sometimes of differing datums, grid system, or reference system, into one coherent image. It can also analyse changes over time within a region. This software is central to the professional analysis and presentaton of GIS data…

StatisticalStatistical GIS statistical software uses standard database
queries to retrieve data and analyse data for decision making. For example, it can be used to determine how many persons of an income of greater than 60,000 live in a given street block. The data is sometimes referenced with postal/zip codes and street locations rather than with geodetic data. This is used by computer scientists and statisticians with computer science skills, with an objective of characterizing an area for marketing or governing decisions. Standard DBMS can be used or specialized GIS statistical software. These are many times setup on servers so that they can be queried with web browsers. Examples are MySQL or ArcSDE.

ReadersReaders
GIS readers are computer applications that are designed to allow users to easily view digital maps as well as view and query GIS-managed data. By definition, they usually allow very little if any editing of the map or underlying map data. Readers can be normal standalone applications that need to be installed locally, though they are often designed to connect to data servers over the Internet to access the relevant information. Readers can also be included as an embedded application within a web page, obviating the need for local installation. Readers are designed to be relatively simple and easy to use as well as free.

The future of GISThe future of GIS

Many disciplines can benefit from GIS technology. An active GIS market has resulted in lower costs and continual improvements in the hardware and software components of GIS. These developments will, in turn, result in a much wider use of the technology throughout science, government, business, and industry, with applications including real estate, public health, crime mapping, national defense, sustainable development, natural resources, landscape architecture, archaeology, regional and community planning, transportation and logistics.

Global change and climate Global change and climate history programhistory program
Maps have traditionally been used to explore the Earth and to exploit its resources. GIS technology, as an expansion of cartographic science, has enhanced the efficiency and analytic power of traditional mapping. Now, as the scientific community recognizes the environmental consequences of human activity, GIS technology is becoming an essential tool in the effort to understand the process of global change. Various map and satellite information sources can combine in modes that simulate the interactions of complex natural systems.
Through a function known as visualization, a GIS can be used to produce images - not just maps, but drawings, animations, and other cartographic products. These images allow researchers to view their subjects in ways that literally never have been seen before. The images often are equally helpful in conveying the technical concepts of GIS study-subjects to non-scientists

Adding the dimension of timeAdding the dimension of time The condition of the Earth's surface, atmosphere,
and subsurface can be examined by feeding satellite data into a GIS. GIS technology gives researchers the ability to examine the variations in Earth processes over days, months, and years. This sensor system detects the amounts of energy reflected from the Earth's surface across various bands of the spectrum for surface areas of about 1 square kilometer. The satellite sensor produces images of a particular location on the Earth twice a day. AVHRR is only one of many sensor systems used for Earth surface analysis. More sensors will follow, generating ever greater amounts of data.

GIS and Society
With the popularization of GIS in decision making, scholars have began to scrutinize the social implications of GIS. It has been argued that the production, distribution, utilization, and representation of geographic information are largely related with the social context. For example, some scholars are concerned that GIS may turn into a tool of omni-surveillance for dictatorship. Other related topics include discussion on copyright, privacy, and censorship. A more optimistic social approach to GIS adoption is to use it as a tool for public participation.

The ISOLA projectThe ISOLA project
• ISOLA is a project aiming at the definition of an integrated, innovative approach to environmental accounting in a urban context in order to make town planning activities more consistent with local policies for sustainable development, following the Agenda 21 guidelines. The main ISOLA steps are:
• the design of the methods and the procedures for the environmental analyses;
• the build-up of a Geographical Information System finalized to perform these methods;
• the realization of a Geographic Information System prototype for the Modena case.

In the project framework our researches have been focused on the data and metadata archive structure and on the observations acquisition and processing problem for the ISOLA GIS; moreover, as starting point, an evaluation on the available GIS software to be used as project development tool has been performed and a first process prototype has been implemented: these topics are discussed in the following.