Embed Size (px)
Citation preview
Document No. SCCPL/EIA/01 Issue No. 01 R 01 1
December, 2018
EQMS India Pvt. Ltd.
304-305, Rishabh Corporate Tower, Plot No. 16,
Community Center, Karkardooma, Delhi – 110092,
Phone: 011-30003200; E-mail :[email protected];
Website : www.eqmsindia.com
Environmental Impact Assessment Report for
Manufacturing Unit of New Technical Pesticide at HD-
20, 21,22& HE 27, 28, 29, 30 UPSIDC Industrial area,
Sikanddrabad, District Bulandshahr.
By
M/s Samradhi Crop Chemicals Pvt Ltd

Document No. SCCPL/EIA/01 Issue No. 01 R 01 2
Table of Contents
Chapter 1. Introduction ............................................................................................. 14
1.1. Importance and Need of an EIA............................................................................... 14
1.2. Project& Project Proponent ..................................................................................... 14
1.3. Nature of the Project ................................................................................................ 14
1.4. Importance & Benefits of Project ............................................................................. 15
1.5. Size or Magnitude of Operation ............................................................................... 15
1.6. Purpose of the EIA Study ........................................................................................ 16
1.7. Project Site Location ................................................................................................ 16
1.8. Regulatory Framework ............................................................................................ 19
1.9. Approved Terms of Reference for EIA Study by MOEF&CC .................................... 19
1.10. Structure of the Report ............................................................................................ 29
Chapter 2. Project Description ................................................................................. 31
2.1. Site Details .............................................................................................................. 31
2.2. Land Requirement ................................................................................................... 33
2.3. Products with Capacities for Proposed Projects ...................................................... 34
2.4. Manufacturing Process: ........................................................................................... 35
2.5. Raw Materials .......................................................................................................... 57
2.6. Solvents Used in the Manufacturing Process........................................................... 60
2.5.1. Solvent Recovery System ......................................................................... 60
2.7. Infrastructure & Utilities Required for SCCPL Project .............................................. 61
2.7.1. Land .......................................................................................................... 61
2.7.2. Power & Fuel Requirements ..................................................................... 61
2.7.3. Employment .............................................................................................. 61
2.7.4. Water Requirement ................................................................................... 61
2.7.5. Cooling Water System .............................................................................. 62
2.7.6. Boiler ........................................................................................................ 62
2.7.7. Fuel ........................................................................................................... 63
2.7.8. Manpower ................................................................................................. 63
2.8. Generation of Pollutants & Its Control Strategy ........................................................ 63
2.8.1. Waste Water Generation ........................................................................... 63
2.8.2. Effluent Treatment Facility......................................................................... 64
2.8.3. Air Pollution Control System ...................................................................... 66
Document No. SCCPL/EIA/01 Issue No. 01 R 01 3
2.8.4. Solid and Hazardous Waste ...................................................................... 68
2.8.5. Noise Environment .................................................................................... 69
2.8.6. Green Belt Development ........................................................................... 70
2.9. Project Cost: ............................................................................................................ 70
2.10. Proposed CSR activities and budget ......................................................... 70
Chapter 3. : DESCRIPTION OF THE ENVIRONMENT .............................................. 71
3.1 Background and Salient Environmental Features of the Study Area ........................ 71
3.1.1 Environmental Setting and Salient Environmental Features of the Project Area ...... 71
3.1.2 Primary Data Collection: Monitoring Plan and Quality Assurance Procedures ......... 77
3.2 Physical Environment .............................................................................................. 80
3.2.1 Topography ............................................................................................................. 80
3.2.2 Drainage .................................................................................................................. 80
3.2.3 Geology & Hydrogeology ......................................................................................... 80
3.2.4 Ground water Resources ......................................................................................... 81
3.2.5 Depth to Ground Water Table .................................................................................. 81
3.2.6 Seismicity of the Study Area .................................................................................... 83
3.3 Land use ................................................................................................................. 83
3.4 Meteorology............................................................................................................. 86
3.4.1 Met Data Generated at Site ..................................................................................... 87
3.5 Ambient Air Quality .................................................................................................. 90
3.5.1 Observations on Ambient Air Quality: ..................................................................... 93
3.6 Noise Environment .................................................................................................. 94
3.6.1 Observation on Ambient Noise Quality: ................................................................... 95
3.7 Traffic Study ............................................................................................................ 95
3.8 Water Quality ........................................................................................................... 95
3.8.1 Ground Water Quality .............................................................................................. 95
3.8.2 Observation on Ground water Quality .................................................................... 101
3.8.3 Surface Water Quality ........................................................................................... 101
3.9 Soil Quality ............................................................................................................ 101
3.9.1 General Characteristics of the Soil in the District ................................................... 102
3.9.2 Methodology .......................................................................................................... 103
3.9.3 Soil Sampling Locations ........................................................................................ 104
3.9.4 Analysis of Soil Samples ....................................................................................... 105

Document No. SCCPL/EIA/01 Issue No. 01 R 01 4
3.9.5 Observation on Soil Quality ................................................................................... 106
3.9.6 Cropping Pattern ................................................................................................... 109
3.10 Ecological Environment ......................................................................................... 112
3.11 Socio-Economic Environment ................................................................................ 119
3.11.1 Demographic & Socio-Economic Features .............................................. 119
3.11.2 Population Distribution in the Study Area ................................................ 119
3.11.3 Sex Ratio ................................................................................................ 126
3.11.4 Scheduled Caste & Scheduled Tribe Population ..................................... 126
3.11.5 Literacy Rate ........................................................................................... 128
3.11.6 Workers Scenario ................................................................................... 133
3.11.7 Economic Structure ................................................................................. 145
3.11.8 Basic Infrastructure Facilities Availability (Census 2001) ......................... 145
3.11.9 Education Facilities................................................................................................ 145
3.11.10 Medical Facilities ................................................................................................... 146
3.11.11 Potable Water Facilities ......................................................................................... 146
3.11.12 Communication Facilities ....................................................................................... 147
3.11.13 Banking Facility ..................................................................................................... 147
3.11.14 Power Supply ........................................................................................................ 147
Chapter 4. Impacts Assessment and Prediction ................................................... 157
4.1. General ................................................................................................................. 157
4.2. Construction Phase ............................................................................................... 158
4.3. Operation Phase ................................................................................................... 160
4.3.1. Air Environment ..................................................................................................... 160
4.3.2. Model Details ......................................................................................................... 160
4.3.3. Predicted GLC due to proposed project ................................................................. 161
4.3.4. Meteorological Data ............................................................................................... 162
4.3.5. Receptor Locations................................................................................................ 162
4.3.6. Summary of Predicted GLC’s ................................................................................ 162
4.3.7. Discussion of the Cumulative Impacts at monitoring locations: .............................. 163
4.4. Noise Environment ................................................................................................ 167
4.4.1. Impacts due to Transportation ............................................................................... 167
4.4.2. Impact of noise on community ............................................................................... 167
4.5. Water Environment ................................................................................................ 168

Document No. SCCPL/EIA/01 Issue No. 01 R 01 5
4.5.1. Water Demand ...................................................................................................... 168
4.5.2. Effluent Generation and Discharge ........................................................................ 168
4.6. Land/Soil Environment .......................................................................................... 169
4.6.1. Land Diversion ...................................................................................................... 170
4.6.2. Land Deterioration ................................................................................................. 170
4.6.3. SOLID/HAZARDOUS WASTE ............................................................................... 170
4.7. Biological Environment .......................................................................................... 170
Operation stage Impacts ....................................................................................... 171
4.8. Socio – Economic Environment ............................................................................. 174
4.9. INFRASTRUCTURE .............................................................................................. 174
Chapter 5. ENVIRONMENTAL MANAGEMENT PLAN ........................................... 175
5.1. Environment Management Plan (Construction and Operation Phase) ................... 175
5.2. Fly ash Management plan ..................................................................................... 177
5.3. Rain Water Harvesting Plan .................................................................................. 177
5.4. Environment Management Cell (EMC) .................................................................. 177
5.5. Institutional Arrangement ....................................................................................... 179
5.6. Resource Conservation/ Waste Minimization ........................................................ 181
5.7. Facilities for Employees ......................................................................................... 181
5.8. Environment Policy ................................................................................................ 181
5.9. EMP for Biological Environment Quality ................................................................ 182
5.10. Greenery Development Plan ................................................................................. 182
5.11. Budget for EMP ..................................................................................................... 185
5.12. Conclusion ............................................................................................................ 186
Chapter 6. Risk Assessment& DISASTER MANAGEMENT PLAN ........................ 186
6.1. Introduction ........................................................................................................... 186
6.2. Risk Assessment ................................................................................................... 187
6.3. Risk Screening Approach ...................................................................................... 189
6.4. Hazardous Materials Storage ................................................................................ 200
6.5. QRA Approach ...................................................................................................... 201
6.6. Thermal Hazards ................................................................................................... 201
6.7. Damage due to Explosion...................................................................................... 203
6.8. Toxic Release ........................................................................................................ 204
6.9. Data Limitations ..................................................................................................... 204

Document No. SCCPL/EIA/01 Issue No. 01 R 01 6
6.10. Likely Failure Scenarios ........................................................................................ 204
6.11. Weather Effect ....................................................................................................... 204
6.12. Incidents Impacts .................................................................................................. 205
6.13. Consequential Impacts .......................................................................................... 210
6.14. Thermal and Explosion Hazards ............................................................................ 210
6.15. Toxic Hazards ....................................................................................................... 210
6.16. General Control Measures ..................................................................................... 210
6.17. Flammable Gas Fires ............................................................................................ 210
6.18. Process Safety System ......................................................................................... 210
6.19. Safety Recommendations...................................................................................... 214
6.20. Commonly Recommended Control Measures ....................................................... 214
6.21. Occupational Health and Safety ............................................................................ 214
6.22. Emergency Management Plan .............................................................................. 216
6.23. Many of the hazards are as result of working environment .................................... 216
6.24. Key Process Safety Measures ............................................................................... 217
6.25. Transportation: ...................................................................................................... 218
6.26. Emergency facilities ............................................................................................... 220
6.27. Objectives ............................................................................................................. 220
6.28. Emergency Management Plan [EMP] .................................................................... 220
6.29. Responsibilities & Role of Key Personnel .............................................................. 222
6.30. Over all In-charge –President (Operation) ............................................................. 222
6.31. Chief Site Coordinator- Manager (Prod.) ............................................................... 222
6.32. Chief Maintenance Coordinator- GM (Maintenance) .............................................. 222
6.33. Chief Service Coordinator - Manager (HR) ............................................................ 222
6.34. Chief Material Coordinator- Manager (Materials) ................................................... 223
6.35. Incident Controller Concerned Plant -Manager Concerned Plant ........................... 223
6.36. Shift In charge (Concerned Plant): ......................................................................... 224
6.37. Security Officer Vehicle Control and Security Personnel Deployment at the Locations
224
6.38. Fire & Safety Controller- Incharge (F&S) ............................................................... 225
6.39. Fire Control Room In-Charge ................................................................................ 225
6.40. Fire Supervisor should also ensure the following: .................................................. 225
6.41. Post Emergency Recovery .................................................................................... 226

Document No. SCCPL/EIA/01 Issue No. 01 R 01 7
6.42. Accident Investigation ............................................................................................ 226
6.43. Damage Assessment ............................................................................................ 227
6.44. Clean-up and Restoration ...................................................................................... 227
6.45. Conclusion & Recommendations ........................................................................... 227
Chapter 7. Summary and Conclusion .................................................................... 229
7.1. Prelude .................................................................................................................. 229
7.2. Regulatory Compliance ......................................................................................... 229
7.3. Baseline Conditions ............................................................................................... 229
7.4. Environmental Impacts and Mitigation Measures ................................................... 230
7.5. Project Benefits ..................................................................................................... 230
7.6. Conclusion and Recommendations ....................................................................... 230
Chapter 8. DISCLOSURE OF CONSULTANTS ....................................................... 232

Document No. SCCPL/EIA/01 Issue No. 01 R 01 8
List of Tables
Table 1.1 : TOR Compliance ............................................................................................... 20
Table 2.1 : Salient Features of the Project .......................................................................... 31
Table 2.2 : Land Distribution at Site .................................................................................... 33
Table 2.3 : List of Products.................................................................................................. 34
Table 2.4 : List of Raw Material ........................................................................................... 58
Table 2.5 :Solvents Used in the Manufacturing Process ..................................................... 60
Table 2.6 Area Break-up ..................................................................................................... 61
Table 2.7 : Details of Fuel Requirement .............................................................................. 63
Table 2.8 : Details of Water Usage and Waste Water Generation ....................................... 64
Table 2.9 :Stack Emission Details ....................................................................................... 67
Table 2.10 : Plant Stacks .................................................................................................... 67
Table 2.11 :Pollution Load .................................................................................................. 67
Table 2.12 National Emission Standards for Pesticide Manufacturing and Formulation Industry .................................................................................................................................... 68
Table 2.13 :Pollution Load .................................................................................................. 68
Table 2.14 :Hazardous Waste Generation Quantity ............................................................ 69
Table 2.15 :Proposed CSR Activities & Annual Allocation of Fund ...................................... 70
Table 3.1 : Salient Environmental Features of Proposed Site .............................................. 73
Table 3.2 : Summary of Methodology for Primary/Secondary Baseline Data Collection ...... 77
Table 3.3 : Geological Succession of the District ................................................................. 80
Table 3.4 : Land use of the Study Area ............................................................................... 84
Table 3.5 Long Term Meteorological Data of Meerut (30 years average) ............................ 86
Table 3.6 No. of days with zero oktas of cloud cover (Meerut IMD) ..................................... 87
Table 3.7 Site Specific Meteorological Data ........................................................................ 88
Table 3.8 Ambient Air Quality Monitoring Locations ............................................................ 90
Table 3.9 Ambient Air Quality Monitoring Results (24-hour average) .................................. 91
Table 3.10 Ambient Air Quality Monitoring Results (24-hour average) ................................ 92
Table 3.11 Ambient Air Quality Monitoring Results (24-hour average) ................................ 92
Table 3.12 Ambient Noise Quality Monitoring Locations ..................................................... 94
Table 3.13 Ambient Noise Quality in the Study Area ........................................................... 94
Table 3.14 Ground Water Sampling Locations .................................................................... 96
Table 3.15 Ground Water Quality in the Study Area ............................................................ 97
Table 3.16 Ground Water Quality in the Study Area ............................................................ 99
Table 3.17 Major Soil Classification of the District ............................................................. 102
Table 3.18 Legend as Follows, ......................................................................................... 103
Table 3.19 Soil Sampling Locations .................................................................................. 104

Document No. SCCPL/EIA/01 Issue No. 01 R 01 9
Table 3.20 Physicochemical Characteristics of Soil .......................................................... 105
Table 3.21 Area under Major Field Crops (As per latest figures 2008-09) ......................... 110
Table 3.22 Production and Productivity of Major Crops 2008-2009 ................................... 111
Table 3.23 List of Common Tree Species Present in Study Area ...................................... 113
Table 3.24 List of Shrub, Herbs and Grasses .................................................................... 114
Table 3.25 Mammalian Fauna reported in study area ....................................................... 116
*Conservation status is LC (Least Concerned species) ..................................................... 116
Table 3.26 Reptiles and Amphibian observed in Study Area ............................................. 116
Table 3.27 Avifauna Sighted during the primary survey .................................................... 117
Table 3.28 Caste-wise Population Distribution of 2.0-km Radial Zone .............................. 120
Table 3.29 Caste-wise Population Distribution of 10.0-km Radial Zone ............................ 120
Table 3.30 Male-Female wise Literates & Illiterates Population ......................................... 128
Table 3.31 Distribution of Work Participation Rate ............................................................ 133
Table 3.32 : Composition of Non-Workers ......................................................................... 135
Table 3.33 Village-wise Occupational Pattern ................................................................... 137
Table 3.34 Village wise Basic Amenities Availability in the Study Area ............................. 148
Table 4.1 :Stack Emission Details ..................................................................................... 161
Table 4.2 : Plant Stacks .................................................................................................... 161
Table 4.3 :Pollution Load .................................................................................................. 162
Table 4.4 Summary of Maximum 24-hour Incremental GLC due to the Proposed Project Stacks ........................................................................................................................ 162
Table 4.5 CREP Guidelines Compliance ........................................................................... 172
Table 5.1 Environment Management Plan ........................................................................ 175
Table 5.2 : Ecological criteria & Observations .................................................................. 182
Table 5.3 The 5-year greenbelt budget ............................................................................. 183
Table 5.4 Recommended Plant Species for Green Belt Development ............................... 184
Table 5.5 Proposed Environmental Monitoring Program ................................................... 184
Table 5.6 : EMP Budget .................................................................................................... 185
Table 6.1 Liquid/GaseousBulk Storages ........................................................................... 188
Table 6.2 Hazard Analysis Products ................................................................................. 190
Table 6.3 Hazard Analysis – Raw Materials ...................................................................... 194
Table 6.4 Risk Classification ............................................................................................. 201
Table 6.5 Effects due to Incident Radiation Intensity ......................................................... 202
Table 6.6 Thermal Radiation Impact to Human ................................................................. 202
Table 6.7 Tolerable Intensities for Various Objects ........................................................... 203
Table 6.8 Damage due to Overpressure ........................................................................... 203
Table 6.9 Different Failure Scenarios ................................................................................ 204
Document No. SCCPL/EIA/01 Issue No. 01 R 01 10
Table 6.10 : HazardsScenario Impact ............................................................................... 205
Table 6.11 Transportation, Unloading and Handling safety Measures ............................... 218

Document No. SCCPL/EIA/01 Issue No. 01 R 01 11
List of Figures
Figure 1.1 : Location Map of Project Site (Topo-sheet) ....................................................... 17
Figure 1.2 : Location Map of Project Site (Google image) ................................................... 18
Figure 2.1 : Location Map ................................................................................................... 32
Figure 2.2 : Site Layout ....................................................................................................... 34
Figure 2.3 Chemical Reaction ............................................................................................. 38
Figure 2.4 Process Flow with Material Balance ................................................................... 39
Figure 2.5 Chemical Reaction ............................................................................................. 40
Figure 2.6 Process Flow with Material Balance ................................................................... 41
Figure 2.7 Chemical Reaction ............................................................................................. 41
Figure 2.8 Process Flow with Material Balance ................................................................... 42
Figure 2.9 Chemical Reaction ............................................................................................. 42
Figure 2.10 Process Flow with Material Balance ................................................................. 46
Figure 2.11 Chemical Reaction ........................................................................................... 46
Figure 2.12 : Water Balance................................................................................................ 62
Figure 2.13 : Effluent Treatment Facilities ........................................................................... 65
Figure 3.1 Road Connectivity Map ...................................................................................... 72
Figure 3.2 Location Map of Study area ............................................................................... 75
Figure 3.3 Google Map of 10 km Study area ....................................................................... 76
Figure 3.4 Environment Sampling Location Map ................................................................. 79
Figure 3.5 Depth to water level (Pre Monsoon season) ....................................................... 82
Figure 3.6 Depth to water level (Post Monsoon Season) ..................................................... 82
Figure 3.7 Seismic Zones Map ............................................................................................ 83
Figure 3.8 Area statistics for Land Use / Land Cover Categories in the Study Area ............ 84
Source: Interpretation of Satellite image.............................................................................. 85
Figure 3.9 Land Use Map of the Study Area (10 km Radial Zone)....................................... 85
Figure 3.10 Wind Rose Diagram of Study Area (Pre Monsoon Season).............................. 89
Figure 3.11 Wind Class Frequency Distribution ................................................................... 90
Figure 3.12 Soil Map of BulandshahrDistrict ..................................................................... 103
Figure 3.13 Male-Female wise Population Distribution ...................................................... 126
Figure 3.14 : Male-Female wise ‘SC’ Population in Study Area ......................................... 127
Figure 3.15 : Male-Female wise ‘ST’ Population in Study Area ......................................... 127
Figure 3.16 : Male-Female wise Distribution of Literates & Illiterates ................................. 128
Figure 3.17 : Workers Scenario of the Study Area ............................................................ 134
Figure 3.18 : Composition of Main Workers Population ..................................................... 134
Figure 3.19 : Composition of Marginal Workers................................................................. 135

Document No. SCCPL/EIA/01 Issue No. 01 R 01 12
Figure 3.20 : Composition of Non-workers Population....................................................... 136
Figure 5.1 Structure of Environmental Management Department ...................................... 178
Document No. SCCPL/EIA/01 Issue No. 01 R 01 13
List of Annexure
Annexure I : Nabet Certificate
Annexure II : TOR Letter Prescribed by MOEF&CC
Annexure III : Raw data of all AAQ measurement for 12 weeks of all stations
carried by EQMS and monitoring team
Annexure IV : Material Safety Data Sheet for all the Chemicals
Annexure V : CGWA Application

Document No. SCCPL/EIA/01 Issue No. 01 R 01 14
CHAPTER 1. INTRODUCTION
1.1. Importance and Need of an EIA
Government of India, as per its policy has given emphasis on Sustainable Development.
While it is supporting the industrial growth, the environmental protection has been made
the integrated criteria for this support. In line with this policy, Ministry of Environment,
Forest and Climate Change has defined elaborated ‘Environment Clearance (EC)’
framework under The Environmental (Protection) Act, 1986 (Environmental Impact
Assessment Notification, 2006) for establishing/expanding an industry/development
project. The EC process takes into consideration local conditions, public concerns,
effectiveness of impact assessment and proposed mitigation measures in sustaining
environmental equilibrium. The base documentation/study report, called Environmental
Impact Assessment (EIA) detailing baseline conditions, environmental impacts,
mitigation measures and management plan is required to be prepared for start of EC
process. Prior Environmental Clearance is required from concerned authorities for all
projects and activities mentioned in “Schedule” as per Environmental Impact
Assessment notification dated September 14, 2006. The project comes under “project
and activity-5 (b) of schedule” Considering the products portfolio, the proposed projects
falls in “Category A” of Schedule of the EIA notification which requires Environmental
Clearance (EC) from MoEFCC, New Delhi. The proposed project is located in the
notified industrial estate,develop by UPSIDC. EIA report is mandatory for appraisal by
expert committee prior to EC. Since EIA preparation and compliance to EC requirement
is time consuming, MoEF&CC has started accepting one season based EIA study to
reduce the overall clearance cycle time.
1.2. Project& Project Proponent
The agrochemicals industry is very important industry for the Indian economy. The
Indian pesticides and insecticide industry is fourth largest in the world and the second
in the Asia-Pacific region only after China.
Samradhi Crop Chemicals Pvt Ltd (SCCPL) is a well-known company in agrochemical
industry. Banking on their rich collective experience of over 10 years, to the farmer
community it is simply known as SCCPL. It has been working extensively with the
farming community to help them raise better and healthy crops.
Samradhi Crop Chemicals Pvt Ltd (SCCPL) has proposed a new greenfield technical
pesticide unit at PLOT NO. HD 20, 21, 22 & PLOT NO.HE-27, 28, 29 & 30, UPSIDC
Industrial Area, Sikandrabad, Dist-Bulandshahr (UP)-203205.
1.3. Nature of the Project
This chapter provides background information of the project, need of the project,
need of the EIA study, scope and EIA methodology adopted and structure of the
report.
Document No. SCCPL/EIA/01 Issue No. 01 R 01 15
Samradhi Crop Chemicals Private Limited (SCCPL) has proposed a new technical
pesticide unit at PLOT NO. HD 20, 21, 22 & PLOT NO.HE-27, 28, 29 & 30, UPSIDC
Industrial Area, Sikandrabad, Dist-Bulandshahr (UP)-203205.
As per EIA Notification dated 14.09.2006 and as amended on 01.12.2009, the project
falls in Category ‘A’, S. No. – 5(b) and to be appraised in MOEF&CC.
Total cost of the proposed project is Rs. 5.0/- Crores.
1.4. Importance & Benefits of Project
The role of the pesticides in the wellbeing of human race needs no emphasis.
Insecticides are used to ward off or kill insects. Pesticide usage has become essential
in order to maximize agriculture production and reduce public health pestilence. The
rapid changes in cropping patterns, increased fertilization and adoption of programs for
high yielding varieties have all contributed to increased use of pesticides. Further, pest
problems keep on changing with the changing environment. New physiological kinds
evolve as a result of mutations to withstand new conditions in nature. Many pest species
develop resistant strains when the same Pesticide is used far too often. The problems
of pest resurgence and secondary pest out-breaks crop up with the indiscriminate use
of pesticides. These associated problems offer a great scope for revolutionizing the use
of pesticides. However, in India though the overcall pesticide growth figures may appear
impressive, the rate of consumption per hectare of cultivated land is very low in
comparison per hectare of cultivated land is very low in comparison to other countries.
India used 180 g of pesticides/ha. as against 10,790g, 1870 g and 1490 g/ha used in
Japan, Europe and U.S.A. respectively. India spent just Rs. 2.15/ha. on pesticides while
Japan and U.S.A spent Rs.110/ha and Rs.35/ha respectively during the same period.
India consumed 12 gm. of pesticides per kg. of fertilizer used against 146 gm. in Japan
and 19 gm in U.S.A. This is one of the major factors that can be attributed to low per
hectare yields in our country since the crops and especially the high yielding varieties
cannot manifest their production potential in absence of proper pest protection. That the
production potential remains suppressed for want of protection can be exemplified by
considering how in wheat, a crop comparatively resistant to insect pestilence, we have
had a “revolution” where as in paddy which is one of the most heavily infested crops,
we have had no break-through. In case of wheat, the per hectare yield in India rose from
827 kg.to 1338 kg. corresponding yields of paddy in India on the other hand was 1826
kg. as against 6185 kg., 5326 kg., 5105 kg. and 4000 kg., in Japan, Egypt, USA and
USSR respectively.
Within the country itself, there is a great imbalance between different regions with regard
to the use of pesticides. Of the total of approximately Rs.5000, million spent on
pesticides in at the farm level, south contributed for about 45 per cent of the total
consumption in the rest of the country.
M/s Samridhi Crop Chemical Pvt Ltd, proposed project is an attempt to close the gap
between supply and demand, reduce import and benefit the agriculture.
1.5. Size or Magnitude of Operation

Document No. SCCPL/EIA/01 Issue No. 01 R 01 16
Pesticides will be produced in batch process. The total installed capacity of proposed
plant will be of 760 TPA. This is a new project to manufacture technical grade pesticides.
Minimal construction is proposed as the existing building and infrastructure will be used
up. Total plot area is 4800 sqm. 33 % plant area is allocated for the greenbelt.
1.6. Purpose of the EIA Study
The objectives of the present EIA are to:
• To identify and describe the elements of the community and environment likely to be affected by the proposed project, and/or likely to cause impacts upon both the natural and man-made environment.
• To describe the proposed project and associated works together along with the requirements.
• To identify and quantify any environmental impacts associated with the proposed and recommend appropriate mitigation measures.
• To identify existing landscape and visual quality in the study area so as to evaluate the landscape and visual impacts of the proposed project.
• To propose mitigation measures to minimize pollution, environmental disturbance and nuisance during construction and operation of the proposed Project.
• To identify, assess and specify methods, measures and standards, to be included in the detailed design, construction and operation of the proposed project which are necessary to mitigate these impacts and reduce them to allowable levels within established standards/guidelines.
• To Propose environmental monitoring parameters as per norms. To ensure the implementation and the effectiveness of the environmental protection and pollution control measures adopted.
• To identify constraints associated with the mitigation measures recommended in this EIA.
• To identify any additional studies necessary to fulfil the objectives required for the EIA Study
1.7. Project Site Location
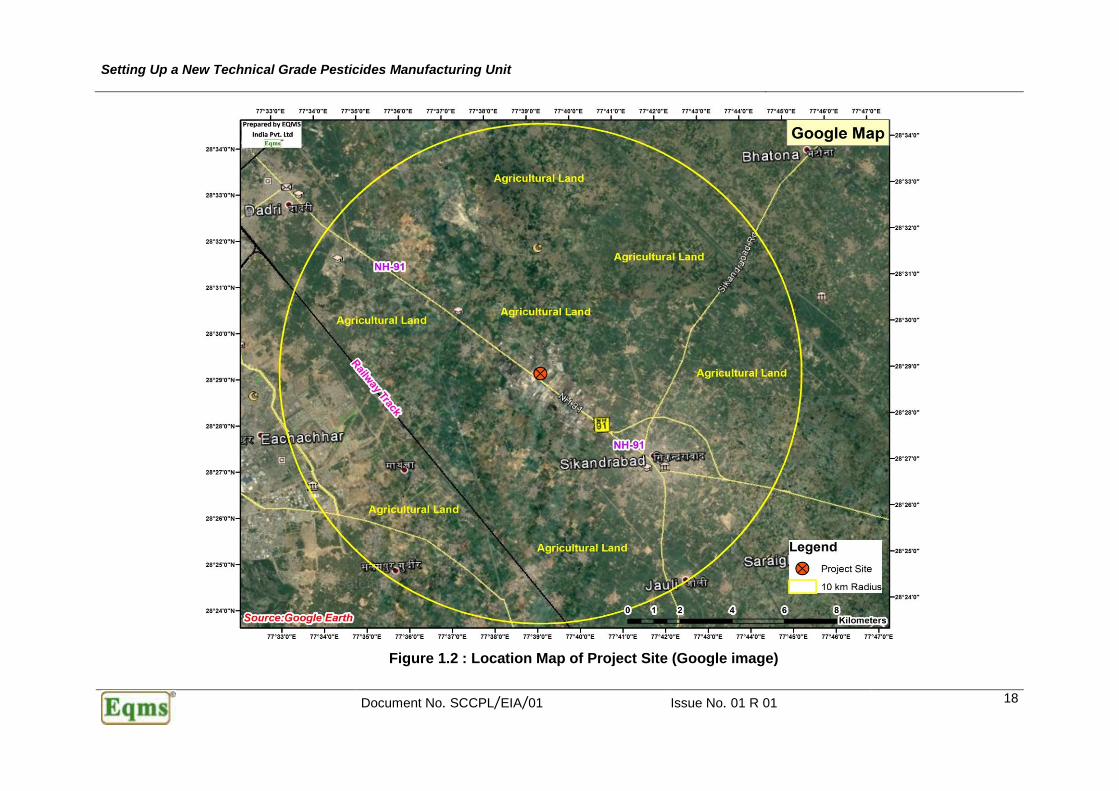
Samradhi Crop Chemicals Pvt Ltd (SCCPL) has proposed a new technical pesticide unit
at PLOT NO. HD 20, 21, 22 & PLOT NO.HE-27, 28, 29 & 30, UPSIDC Industrial Area,
Sikandrabad, Dist-Bulandshahr (UP)-203205.The proposed project is occupying an
area of about 4800 Sq. Meters. Site is well connected with National Highway NH- 91 is
300 M in South direction. Nearest Railway station is Dankaur railway station at a
distance of 8 km.Figure 1.1and Figure 1.2 shows location map shows the proposed
technical grade pesticide unit.

Setting Up a New Technical Grade Pesticides Manufacturing Unit
Document No. SCCPL/EIA/01 Issue No. 01 R 01 17
Figure 1.1 : Location Map of Project Site (Topo-sheet)
Setting Up a New Technical Grade Pesticides Manufacturing Unit
Document No. SCCPL/EIA/01 Issue No. 01 R 01 18
Figure 1.2 : Location Map of Project Site (Google image)

Setting Up a New Technical Grade Pesticides Manufacturing Unit
Document No. SCCPL/EIA/01 Issue No. 01 R 01 19
1.8. Regulatory Framework
Requirement of Environmental Clearance
Prior Environmental Clearance is required from concerned authorities for all projects
and activities mentioned in “Schedule” as per Environmental Impact Assessment
notification dated September 14, 2006. The project comes under “project and activity-5
(b) of schedule.” Considering the products portfolio, the proposed project falls in
“Category A” of Schedule of the EIA notification which requires Environmental
Clearance (EC) from MoEF&CC, New Delhi.
SCCPL has commenced the process of obtaining required statutory permission from
concerned authorities. Details of permits and clearance applicable to this project along
with status are as under.
S.No
Permit /Clearance/Standards For Proposed Project
Current Status
1 No Objection Certificate / Consent to Establish from Uttar Pradesh Pollution Control Board (UPPCB) for the project
Mandatory, Will be applied after getting Environmental Clearance
NA
2 Factory License Available Available
3 Water Permission Required Yet to apply to CGWA
5 The Hazardous Waste (Management, Handling and Trans boundary Movement) Rules 2008 amended to date.
Required Will be taken care aftter getting EC &
before Plant Commissioning
6 Water (Prevention and Control of Pollution) Act,1974
7 Air (Prevention and Control of Pollution) Act, 1981
(Source: EQMS)
In addition to environmental regulatory compliance, other applicable statutory rules and regulations including (but not limited to) are the following:
• Boiler Regulations as per Chief Inspector of Boilers, Government of Uttar Pradesh (if applicable).
• ESIC etc.
1.9. Approved Terms of Reference for EIA Study by MOEF&CC
Based on the documents submitted online proposal No. IA/UP/IND2/75285/2018 dated 2nd June 2018. Standard Terms of Reference (TOR) was issued by MoEF&CC vide their letter No:J-.11011/76/2017 dated 06th July 2018for preparation of EIA/EMP. During 37th EAC meeting, committee of MOEF&CC agreed to consider the baseline data of pre-monsoon season (15th March 2017 to 15th June 2017) and exempt from

Setting Up a New Technical Grade Pesticides Manufacturing Unit
Document No. SCCPL/EIA/01 Issue No. 01 R 01 20
public hearing because site located in UPSIDC industrial area.The compliance status of issued TOR are given in Table 1.1:
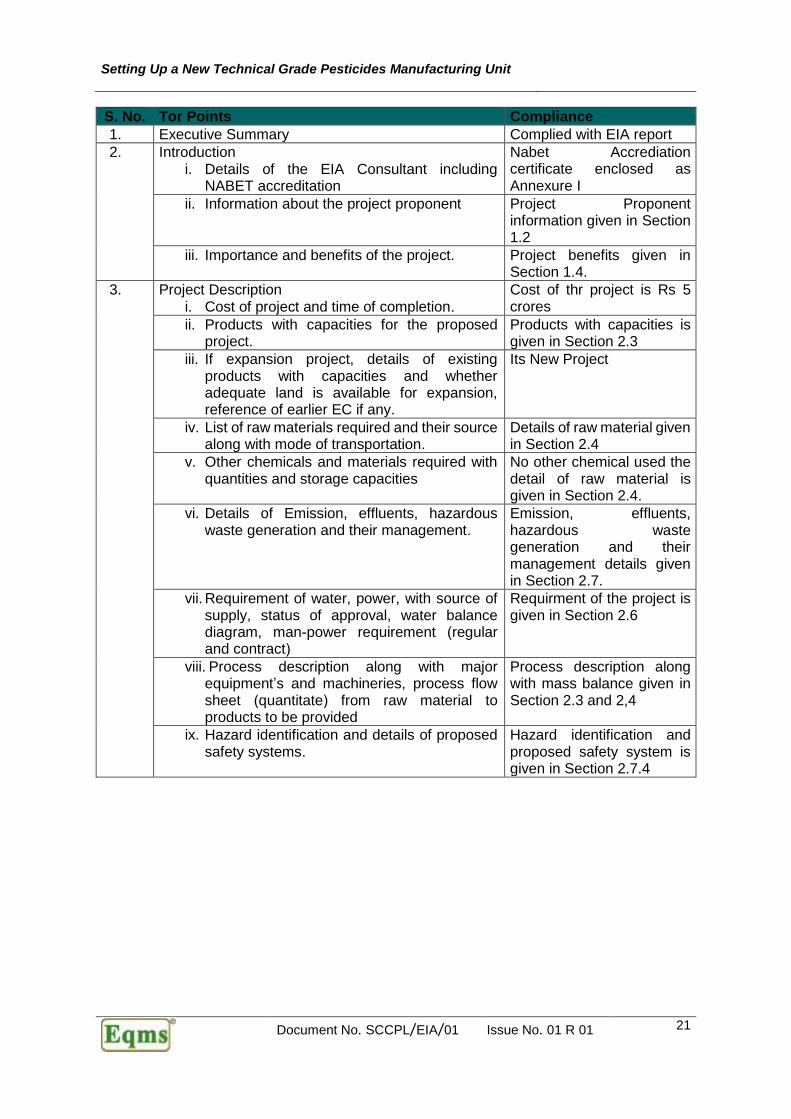
Table 1.1 : TOR Compliance
Setting Up a New Technical Grade Pesticides Manufacturing Unit
Document No. SCCPL/EIA/01 Issue No. 01 R 01 21
S. No. Tor Points Compliance
1. Executive Summary Complied with EIA report
2. Introduction i. Details of the EIA Consultant including
NABET accreditation
Nabet Accrediation certificate enclosed as Annexure I
ii. Information about the project proponent Project Proponent information given in Section 1.2
iii. Importance and benefits of the project. Project benefits given in Section 1.4.
3. Project Description i. Cost of project and time of completion.
Cost of thr project is Rs 5 crores
ii. Products with capacities for the proposed project.
Products with capacities is given in Section 2.3
iii. If expansion project, details of existing products with capacities and whether adequate land is available for expansion, reference of earlier EC if any.
Its New Project
iv. List of raw materials required and their source along with mode of transportation.
Details of raw material given in Section 2.4
v. Other chemicals and materials required with quantities and storage capacities
No other chemical used the detail of raw material is given in Section 2.4.
vi. Details of Emission, effluents, hazardous waste generation and their management.
Emission, effluents, hazardous waste generation and their management details given in Section 2.7.
vii. Requirement of water, power, with source of supply, status of approval, water balance diagram, man-power requirement (regular and contract)
Requirment of the project is given in Section 2.6
viii. Process description along with major equipment’s and machineries, process flow sheet (quantitate) from raw material to products to be provided
Process description along with mass balance given in Section 2.3 and 2,4
ix. Hazard identification and details of proposed safety systems.
Hazard identification and proposed safety system is given in Section 2.7.4

Setting Up a New Technical Grade Pesticides Manufacturing Unit
Document No. SCCPL/EIA/01 Issue No. 01 R 01 22
S. No. Tor Points Compliance
x. Expansion/modernization proposals: a. Copy of all the Environmental Clearance(s)
including Amendments thereto obtained for the project from MOEF/SEIAA shall be attached as an Annexure. A certified copy of the latest Monitoring Report of the Regional Office of the Ministry of Environment and Forests as per circular dated 30th May, 2012 on the status of compliance of conditions stipulated in all the existing environmental clearances including Amendments shall be provided. In addition, status of compliance of Consent to Operate for the ongoing I existing operation of the project from SPCB shall be attached with the EIA-EMP report.
b. In case the existing project has not obtained environmental clearance, reasons for not taking EC under the provisions of the EIA Notification 1994 and/or EIA Notification 2006 shall be provided. Copies of Consent to Establish/No Objection Certificate and Consent to Operate (in case of units operating prior to EIA Notification 2006, CTE and CTO of FY 2005-2006) obtained from the SPCB shall be submitted. Further, compliance report to the conditions of consents from the SPCB shall be submitted
It’s a new project
4. Site Details i. Location of the project site covering village,
Taluka/Tehsil, District and State, Justification for selecting the site, whether other sites were considered.
The project site is located in UPSIDC (in industrial area). Section 1.7.
ii. A toposheet of the study area of radius of 10km and site location on 1:50,000/1: 25,000 scale on an A3/A2 sheet. (including all eco-sensitive areas and environmentally sensitive places)
Toposheet of the study area of radius of 10km is given in Section 1.7 and Figure 1.1
iii. Details w.r.t. option analysis for selection of site
Site located in Notified industrial area develop by UPSIDC.
iv. Co-ordinates (lat-long) of all four corners of the site.
Google map with coordinates given in Figure 3.3
v. Google map-Earth downloaded of the project site.
Google map with coordinates given in Figure 3.3
Setting Up a New Technical Grade Pesticides Manufacturing Unit
Document No. SCCPL/EIA/01 Issue No. 01 R 01 23
S. No. Tor Points Compliance
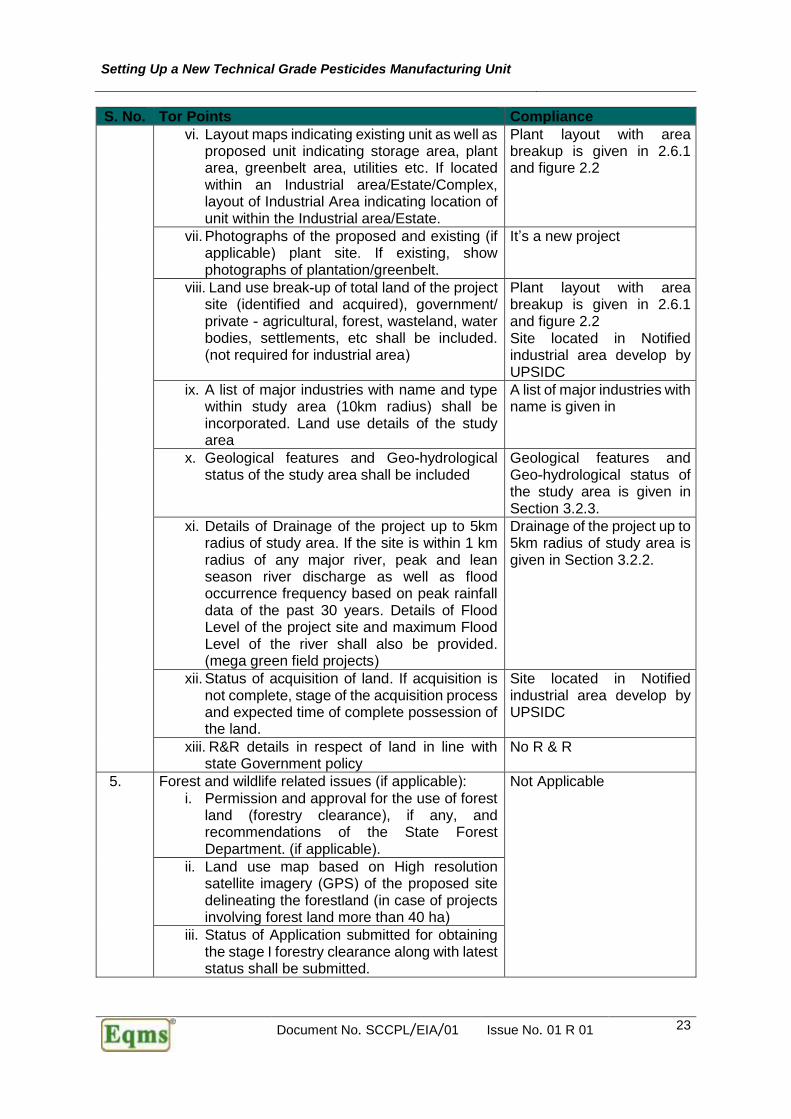
vi. Layout maps indicating existing unit as well as proposed unit indicating storage area, plant area, greenbelt area, utilities etc. If located within an Industrial area/Estate/Complex, layout of Industrial Area indicating location of unit within the Industrial area/Estate.
Plant layout with area breakup is given in 2.6.1 and figure 2.2
vii. Photographs of the proposed and existing (if applicable) plant site. If existing, show photographs of plantation/greenbelt.
It’s a new project
viii. Land use break-up of total land of the project site (identified and acquired), government/ private - agricultural, forest, wasteland, water bodies, settlements, etc shall be included. (not required for industrial area)
Plant layout with area breakup is given in 2.6.1 and figure 2.2 Site located in Notified industrial area develop by UPSIDC
ix. A list of major industries with name and type within study area (10km radius) shall be incorporated. Land use details of the study area
A list of major industries with name is given in
x. Geological features and Geo-hydrological status of the study area shall be included
Geological features and Geo-hydrological status of the study area is given in Section 3.2.3.
xi. Details of Drainage of the project up to 5km radius of study area. If the site is within 1 km radius of any major river, peak and lean season river discharge as well as flood occurrence frequency based on peak rainfall data of the past 30 years. Details of Flood Level of the project site and maximum Flood Level of the river shall also be provided. (mega green field projects)
Drainage of the project up to 5km radius of study area is given in Section 3.2.2.
xii. Status of acquisition of land. If acquisition is not complete, stage of the acquisition process and expected time of complete possession of the land.
Site located in Notified industrial area develop by UPSIDC
xiii. R&R details in respect of land in line with state Government policy
No R & R
5. Forest and wildlife related issues (if applicable): i. Permission and approval for the use of forest
land (forestry clearance), if any, and recommendations of the State Forest Department. (if applicable).
Not Applicable
ii. Land use map based on High resolution satellite imagery (GPS) of the proposed site delineating the forestland (in case of projects involving forest land more than 40 ha)
iii. Status of Application submitted for obtaining the stage I forestry clearance along with latest status shall be submitted.

Setting Up a New Technical Grade Pesticides Manufacturing Unit
Document No. SCCPL/EIA/01 Issue No. 01 R 01 24
S. No. Tor Points Compliance
iv. The projects to be located within 10 km of the National Parks, Sanctuaries, Biosphere Reserves, Migratory Corridors of Wild Animals, the project proponent shall submit the map duly authenticated by Chief Wildlife Warden showing these features vis-à-vis the project location and the recommendations or comments of the Chief Wildlife Warden-thereon.
v. Wildlife Conservation Plan duly authenticated by the Chief Wildlife Warden of the State Government for conservation of Schedule I fauna, if any exists in the study area
vi. Copy of application submitted for clearance
under the Wildlife (Protection) Act, 1972, to the Standing Committee of the National Board for Wildlife
6. Environmental Status i. Determination of atmospheric inversion level
at the project site and site-specific micro-meteorological data using temperature, relative humidity, hourly wind speed and direction and rainfall.
Atmospheric inversion level at the project site and site-specific micro-meteorological data is given in Section 3.4.1.
ii. AAQ data (except monsoon) at 8 locations for PM10, PM2.5, SO2, NOX, CO and other parameters relevant to the project shall be collected. The monitoring stations shall be based CPCB guidelines and consider the pre-dominant wind direction, population zone and sensitive receptors including reserved forests.
AAQ data (except monsoon) at 8 locations for PM10, PM2.5, SO2, NOX, CO is given in Section 3.5
iii. Raw data of all AAQ measurement for 12 weeks of all stations as per frequency given in the NAQQM Notification of Nov. 2009 along with - min., max., average and 98% values for each of the AAQ parameters from data of all AAQ stations should be provided as an annexure to the EIA Report.
Raw data of all AAQ measurement for 12 weeks of all stations enclosed as Annexure
iv. Surface water quality of nearby River (100m upstream and downstream of discharge point) and other surface drains at eight locations as per CPCB/MoEF&CC guidelines.
Surface water quality is given in Section 3.8.3
v. Whether the site falls near to polluted stretch of river identified by the CPCB/MoEF&CC, if yes give details.
Not Applicable
vi. Ground water monitoring at minimum at 8 locations shall be included.
Ground water monitoring at minimum at 8 locations is given in Section 3.8.1

Setting Up a New Technical Grade Pesticides Manufacturing Unit
Document No. SCCPL/EIA/01 Issue No. 01 R 01 25
S. No. Tor Points Compliance
vii. Noise levels monitoring at 8 locations within the study area.
Noise levels monitoring at 8 locations within the study area is given in Section 3.6.
viii. Soil Characteristic as per CPCB guidelines. Soil Characteristic is given in Section 3.11.
ix. Traffic study of the area, type of vehicles, frequency of vehicles for transportation of materials, additional traffic due to proposed project, parking arrangement etc.
Traffic study of the area is given in Section 3.7
x. Detailed description of flora and fauna (terrestrial and aquatic) existing in the study area shall be given with special reference to rare, endemic and endangered species. If Schedule-I fauna are found within the study area, a Wildlife Conservation Plan shall be prepared and furnished.
Biological environment of the study area is given in Section 3.10
xi. Socio-economic status of the study area. Demography of the study area is given in section 3.11
7. Impact and Environment Management Plan i. Assessment of ground level concentration of
pollutants from the stack emission based on site-specific meteorological features. In case the project is located on a hilly terrain, the AQIP Modelling shall be done using inputs of the specific terrain characteristics for determining the potential impacts of the project on the AAQ. Cumulative impact of all sources of emissions (including transportation) on the AAQ of the area shall be assessed. Details of the model used and the input data used for modelling shall also be provided. The air quality contours shall be plotted on a location map showing the location of project site, habitation nearby, sensitive receptors, if any.
Ground level concentration of pollutants from the stack emission based on site-specific meteorological features is given in Section 4.3
ii. Water Quality modelling - in case of discharge in water body
Follow Zero Liquid discharge
iii. Impact of the transport of the raw materials and end products on the surrounding environment shall be assessed and provided. In this regard, options for transport of raw materials and finished products and wastes (large quantities) by rail or rail-cum road transport or conveyor-cum-rail transport shall be examined.
No major impact generated, Traffic study of the area is given in Section 3.7
Setting Up a New Technical Grade Pesticides Manufacturing Unit
Document No. SCCPL/EIA/01 Issue No. 01 R 01 26
S. No. Tor Points Compliance
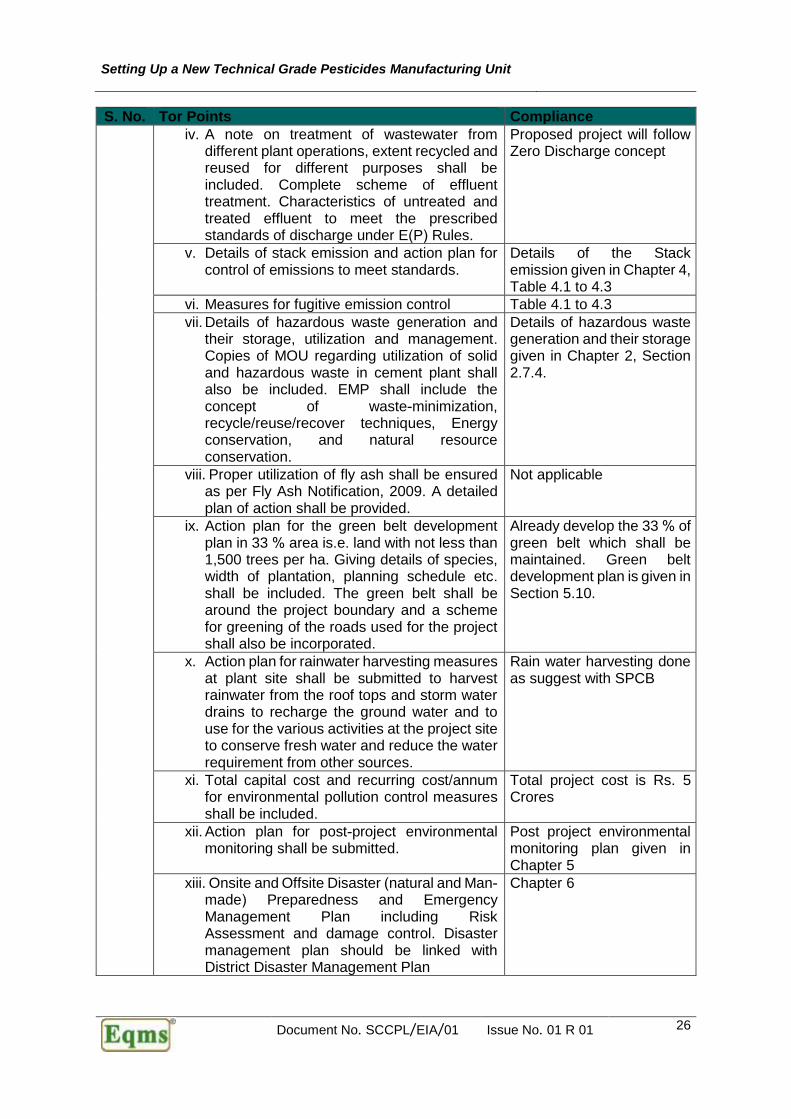
iv. A note on treatment of wastewater from different plant operations, extent recycled and reused for different purposes shall be included. Complete scheme of effluent treatment. Characteristics of untreated and treated effluent to meet the prescribed standards of discharge under E(P) Rules.
Proposed project will follow Zero Discharge concept
v. Details of stack emission and action plan for control of emissions to meet standards.
Details of the Stack emission given in Chapter 4, Table 4.1 to 4.3
vi. Measures for fugitive emission control Table 4.1 to 4.3
vii. Details of hazardous waste generation and their storage, utilization and management. Copies of MOU regarding utilization of solid and hazardous waste in cement plant shall also be included. EMP shall include the concept of waste-minimization, recycle/reuse/recover techniques, Energy conservation, and natural resource conservation.
Details of hazardous waste generation and their storage given in Chapter 2, Section 2.7.4.
viii. Proper utilization of fly ash shall be ensured as per Fly Ash Notification, 2009. A detailed plan of action shall be provided.
Not applicable
ix. Action plan for the green belt development plan in 33 % area is.e. land with not less than 1,500 trees per ha. Giving details of species, width of plantation, planning schedule etc. shall be included. The green belt shall be around the project boundary and a scheme for greening of the roads used for the project shall also be incorporated.
Already develop the 33 % of green belt which shall be maintained. Green belt development plan is given in Section 5.10.
x. Action plan for rainwater harvesting measures at plant site shall be submitted to harvest rainwater from the roof tops and storm water drains to recharge the ground water and to use for the various activities at the project site to conserve fresh water and reduce the water requirement from other sources.
Rain water harvesting done as suggest with SPCB
xi. Total capital cost and recurring cost/annum for environmental pollution control measures shall be included.
Total project cost is Rs. 5 Crores
xii. Action plan for post-project environmental monitoring shall be submitted.
Post project environmental monitoring plan given in Chapter 5
xiii. Onsite and Offsite Disaster (natural and Man-made) Preparedness and Emergency Management Plan including Risk Assessment and damage control. Disaster management plan should be linked with District Disaster Management Plan
Chapter 6

Setting Up a New Technical Grade Pesticides Manufacturing Unit
Document No. SCCPL/EIA/01 Issue No. 01 R 01 27
S. No. Tor Points Compliance
8. Occupational health i. Plan and fund allocation to ensure the
occupational health & safety of all contract and casual workers
Adequate fund is earmarked for CSR refer Section 2.9
ii. Details of exposure specific health status evaluation of worker. If the workers' health is being evaluated by pre-designed format, chest x rays, Audiometry, Spirometry, Vision testing (Far & Near vision, colour vision and any other ocular defect) ECG, during pre-placement and periodical examinations give the details of the same. Details regarding last month analysed data of above mentioned parameters as per age, sex, duration of exposure and department wise.
Occupational & Safety Hazards with safety measures and with respective responsibility given in Chapter 6
iii. Details of existing Occupational & Safety Hazards. What are the exposure levels of hazards and whether they are within Permissible Exposure level (PEL)?If these are not within PEL, what measures the company has adopted to keep them within PEL so that health of the workers can be preserved,
Occupational & Safety Hazards with safety measures and with respective responsibility given in Chapter 6
iv. Annual report of health status of workers with special reference to Occupational Health and Safety.
9. Corporate Environment Policy i. Does the company have a well laid down
Environment Policy approved by its Board of Directors? If so, it may be detailed in the EIA report.
Company will develop environmental management cell with respective responsibility
ii. Does the Environment Policy prescribe for standard operating process / procedures to bring into focus any infringement / deviation / violation of the environmental or forest norms / conditions? If so, it may be detailed in the EIA.
Company will develop environmental management cell with respective responsibility refer Section Section 5.4
iii. What is the hierarchical system or Administrative order of the company to deal with the environmental issues and for ensuring compliance with the environmental clearance conditions? Details of this system may be given.
Company will develop environmental management cell with respective responsibility refer Section Section 5.4
iv. Does the company have system of reporting of non-compliances / violations of environmental norms to the Board of Directors of the company and / or shareholders or stakeholders at large? This reporting mechanism shall be detailed in the EIA report
Complied
Setting Up a New Technical Grade Pesticides Manufacturing Unit
Document No. SCCPL/EIA/01 Issue No. 01 R 01 28
S. No. Tor Points Compliance
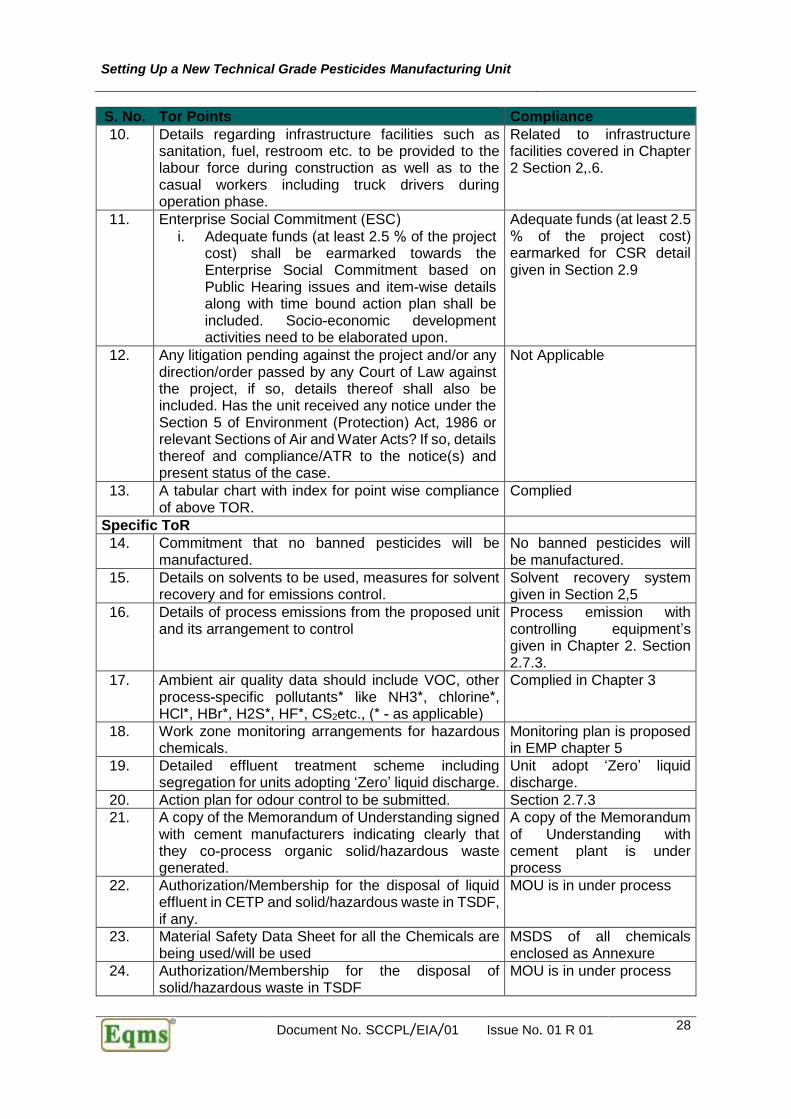
10. Details regarding infrastructure facilities such as sanitation, fuel, restroom etc. to be provided to the labour force during construction as well as to the casual workers including truck drivers during operation phase.
Related to infrastructure facilities covered in Chapter 2 Section 2,.6.
11. Enterprise Social Commitment (ESC)
i. Adequate funds (at least 2.5 % of the project cost) shall be earmarked towards the Enterprise Social Commitment based on Public Hearing issues and item-wise details along with time bound action plan shall be included. Socio-economic development activities need to be elaborated upon.
Adequate funds (at least 2.5 % of the project cost) earmarked for CSR detail given in Section 2.9
12. Any litigation pending against the project and/or any direction/order passed by any Court of Law against the project, if so, details thereof shall also be included. Has the unit received any notice under the Section 5 of Environment (Protection) Act, 1986 or relevant Sections of Air and Water Acts? If so, details thereof and compliance/ATR to the notice(s) and present status of the case.
Not Applicable
13. A tabular chart with index for point wise compliance of above TOR.
Complied
Specific ToR
14. Commitment that no banned pesticides will be manufactured.
No banned pesticides will be manufactured.
15. Details on solvents to be used, measures for solvent recovery and for emissions control.
Solvent recovery system given in Section 2,5
16. Details of process emissions from the proposed unit and its arrangement to control
Process emission with controlling equipment’s given in Chapter 2. Section 2.7.3.
17. Ambient air quality data should include VOC, other process-specific pollutants* like NH3*, chlorine*, HCl*, HBr*, H2S*, HF*, CS2etc., (* - as applicable)
Complied in Chapter 3
18. Work zone monitoring arrangements for hazardous chemicals.
Monitoring plan is proposed in EMP chapter 5
19. Detailed effluent treatment scheme including segregation for units adopting ‘Zero’ liquid discharge.
Unit adopt ‘Zero’ liquid discharge.
20. Action plan for odour control to be submitted. Section 2.7.3
21. A copy of the Memorandum of Understanding signed with cement manufacturers indicating clearly that they co-process organic solid/hazardous waste generated.
A copy of the Memorandum of Understanding with cement plant is under process
22. Authorization/Membership for the disposal of liquid effluent in CETP and solid/hazardous waste in TSDF, if any.
MOU is in under process
23. Material Safety Data Sheet for all the Chemicals are being used/will be used
MSDS of all chemicals enclosed as Annexure
24. Authorization/Membership for the disposal of solid/hazardous waste in TSDF
MOU is in under process
Setting Up a New Technical Grade Pesticides Manufacturing Unit
Document No. SCCPL/EIA/01 Issue No. 01 R 01 29
S. No. Tor Points Compliance
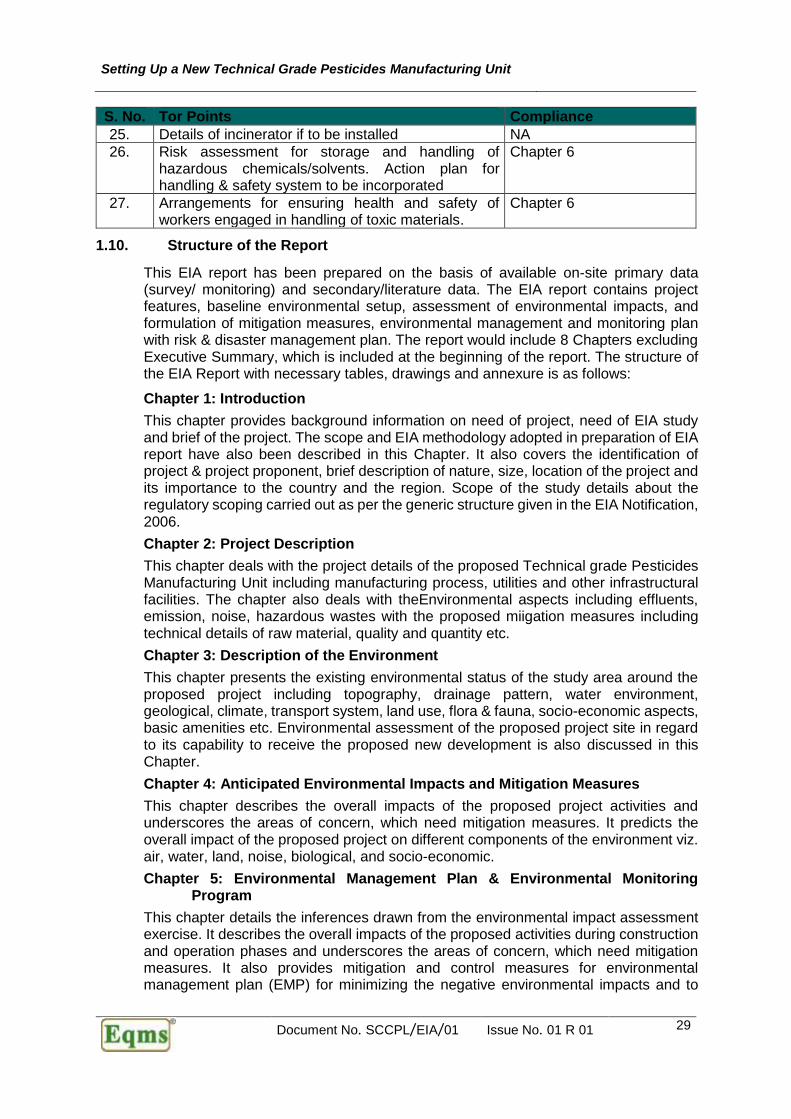
25. Details of incinerator if to be installed NA
26. Risk assessment for storage and handling of hazardous chemicals/solvents. Action plan for handling & safety system to be incorporated
Chapter 6
27. Arrangements for ensuring health and safety of workers engaged in handling of toxic materials.
Chapter 6
1.10. Structure of the Report
This EIA report has been prepared on the basis of available on-site primary data (survey/ monitoring) and secondary/literature data. The EIA report contains project features, baseline environmental setup, assessment of environmental impacts, and formulation of mitigation measures, environmental management and monitoring plan with risk & disaster management plan. The report would include 8 Chapters excluding Executive Summary, which is included at the beginning of the report. The structure of the EIA Report with necessary tables, drawings and annexure is as follows:
Chapter 1: Introduction
This chapter provides background information on need of project, need of EIA study and brief of the project. The scope and EIA methodology adopted in preparation of EIA report have also been described in this Chapter. It also covers the identification of project & project proponent, brief description of nature, size, location of the project and its importance to the country and the region. Scope of the study details about the regulatory scoping carried out as per the generic structure given in the EIA Notification, 2006.
Chapter 2: Project Description
This chapter deals with the project details of the proposed Technical grade Pesticides Manufacturing Unit including manufacturing process, utilities and other infrastructural facilities. The chapter also deals with theEnvironmental aspects including effluents, emission, noise, hazardous wastes with the proposed miigation measures including technical details of raw material, quality and quantity etc.
Chapter 3: Description of the Environment
This chapter presents the existing environmental status of the study area around the proposed project including topography, drainage pattern, water environment, geological, climate, transport system, land use, flora & fauna, socio-economic aspects, basic amenities etc. Environmental assessment of the proposed project site in regard to its capability to receive the proposed new development is also discussed in this Chapter.
Chapter 4: Anticipated Environmental Impacts and Mitigation Measures
This chapter describes the overall impacts of the proposed project activities and underscores the areas of concern, which need mitigation measures. It predicts the overall impact of the proposed project on different components of the environment viz. air, water, land, noise, biological, and socio-economic.
Chapter 5: Environmental Management Plan & Environmental Monitoring Program
This chapter details the inferences drawn from the environmental impact assessment exercise. It describes the overall impacts of the proposed activities during construction and operation phases and underscores the areas of concern, which need mitigation measures. It also provides mitigation and control measures for environmental management plan (EMP) for minimizing the negative environmental impacts and to
Setting Up a New Technical Grade Pesticides Manufacturing Unit
Document No. SCCPL/EIA/01 Issue No. 01 R 01 30
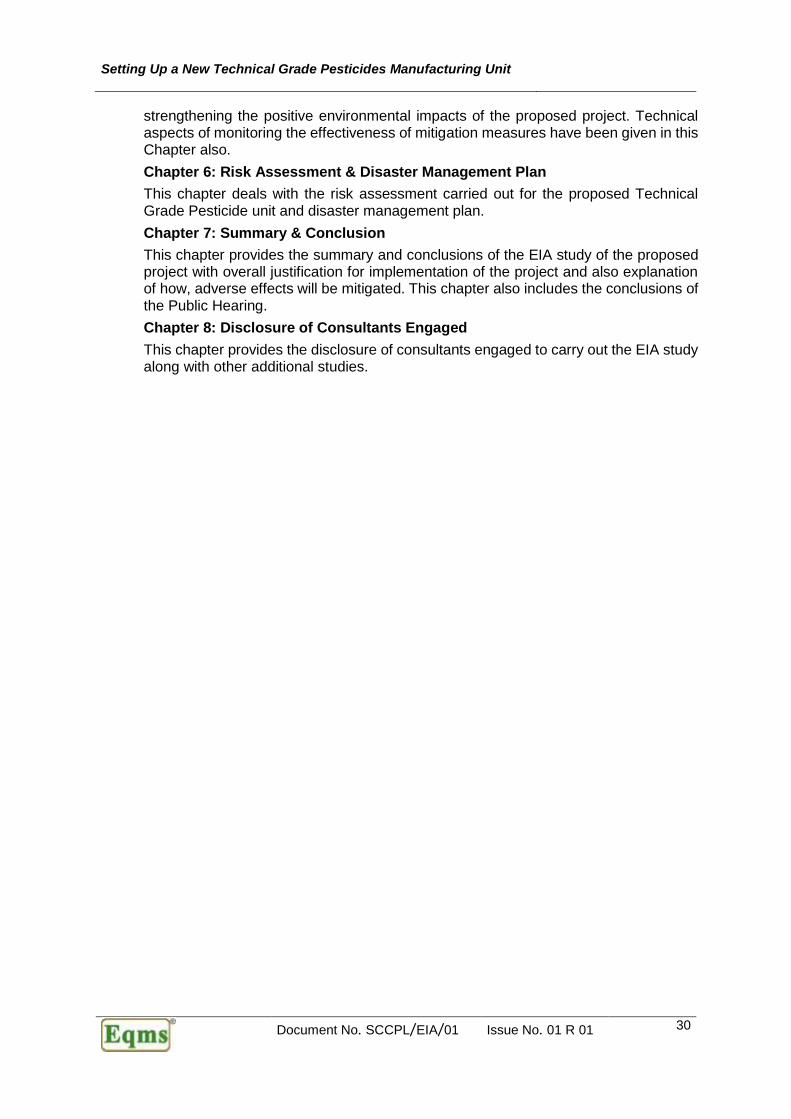
strengthening the positive environmental impacts of the proposed project. Technical aspects of monitoring the effectiveness of mitigation measures have been given in this Chapter also.
Chapter 6: Risk Assessment & Disaster Management Plan
This chapter deals with the risk assessment carried out for the proposed Technical Grade Pesticide unit and disaster management plan.
Chapter 7: Summary & Conclusion
This chapter provides the summary and conclusions of the EIA study of the proposed project with overall justification for implementation of the project and also explanation of how, adverse effects will be mitigated. This chapter also includes the conclusions of the Public Hearing.
Chapter 8: Disclosure of Consultants Engaged
This chapter provides the disclosure of consultants engaged to carry out the EIA study along with other additional studies.
Setting Up a New Technical Grade Pesticides Manufacturing Unit
Document No. SCCPL/EIA/01 Issue No. 01 R 01 31
CHAPTER 2. PROJECT DESCRIPTION
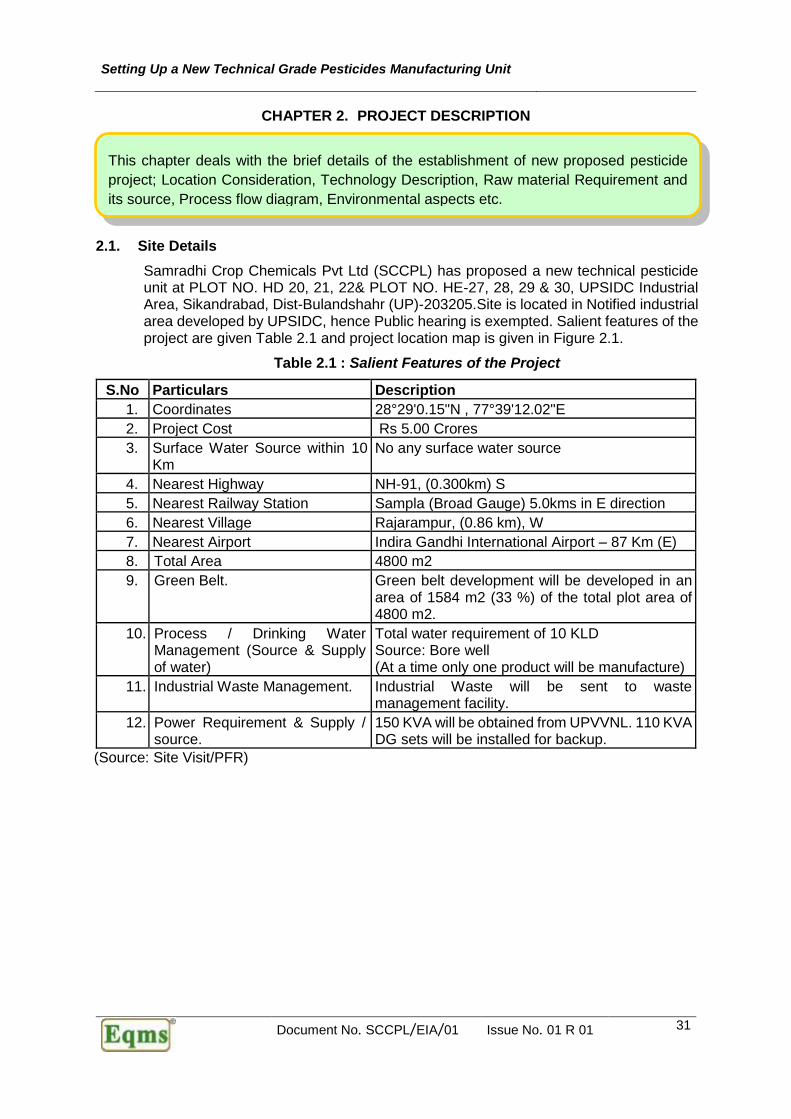
2.1. Site Details
Samradhi Crop Chemicals Pvt Ltd (SCCPL) has proposed a new technical pesticide unit at PLOT NO. HD 20, 21, 22& PLOT NO. HE-27, 28, 29 & 30, UPSIDC Industrial Area, Sikandrabad, Dist-Bulandshahr (UP)-203205.Site is located in Notified industrial area developed by UPSIDC, hence Public hearing is exempted. Salient features of the project are given Table 2.1 and project location map is given in Figure 2.1.
Table 2.1 : Salient Features of the Project
S.No Particulars Description
1. Coordinates 28°29'0.15"N , 77°39'12.02"E
2. Project Cost Rs 5.00 Crores
3. Surface Water Source within 10 Km
No any surface water source
4. Nearest Highway NH-91, (0.300km) S
5. Nearest Railway Station Sampla (Broad Gauge) 5.0kms in E direction
6. Nearest Village Rajarampur, (0.86 km), W
7. Nearest Airport Indira Gandhi International Airport – 87 Km (E)
8. Total Area 4800 m2
9. Green Belt. Green belt development will be developed in an area of 1584 m2 (33 %) of the total plot area of 4800 m2.
10. Process / Drinking Water Management (Source & Supply of water)
Total water requirement of 10 KLD Source: Bore well (At a time only one product will be manufacture)
11. Industrial Waste Management. Industrial Waste will be sent to waste management facility.
12. Power Requirement & Supply / source.
150 KVA will be obtained from UPVVNL. 110 KVA DG sets will be installed for backup.
(Source: Site Visit/PFR)
This chapter deals with the brief details of the establishment of new proposed pesticide
project; Location Consideration, Technology Description, Raw material Requirement and
its source, Process flow diagram, Environmental aspects etc.

EIA/EMP for Setting Up a New Technical Grade Pesticides Manufacturing Unit
Document No. SCCPL/EIA/01 Issue No. 01 R 01 32
Figure 2.1 : Location Map
EIA/EMP for Setting Up a New Technical Grade Pesticides Manufacturing Unit
Document No. SCCPL/EIA/01 Issue No. 01 R 01 33
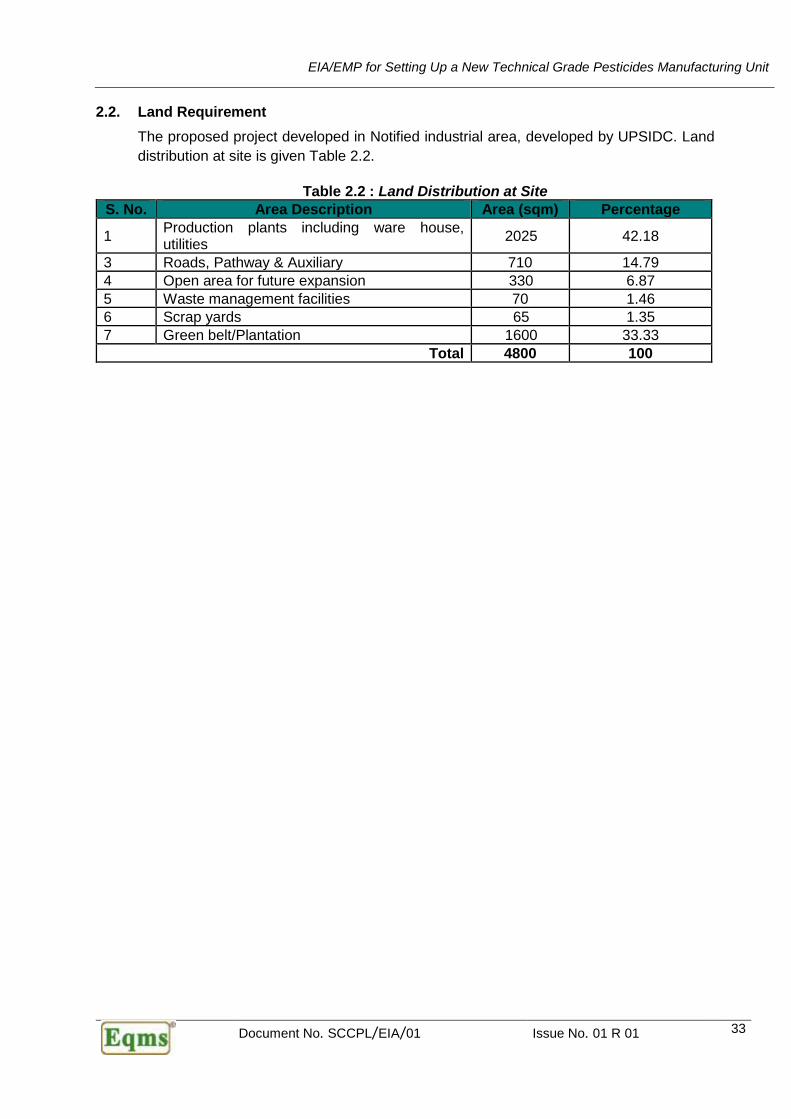
2.2. Land Requirement
The proposed project developed in Notified industrial area, developed by UPSIDC. Land
distribution at site is given Table 2.2.
Table 2.2 : Land Distribution at Site
S. No. Area Description Area (sqm) Percentage
1 Production plants including ware house, utilities
2025 42.18
3 Roads, Pathway & Auxiliary 710 14.79
4 Open area for future expansion 330 6.87
5 Waste management facilities 70 1.46
6 Scrap yards 65 1.35
7 Green belt/Plantation 1600 33.33
Total 4800 100
EIA/EMP for Setting Up a New Technical Grade Pesticides Manufacturing Unit
Document No. SCCPL/EIA/01 Issue No. 01 R 01 34
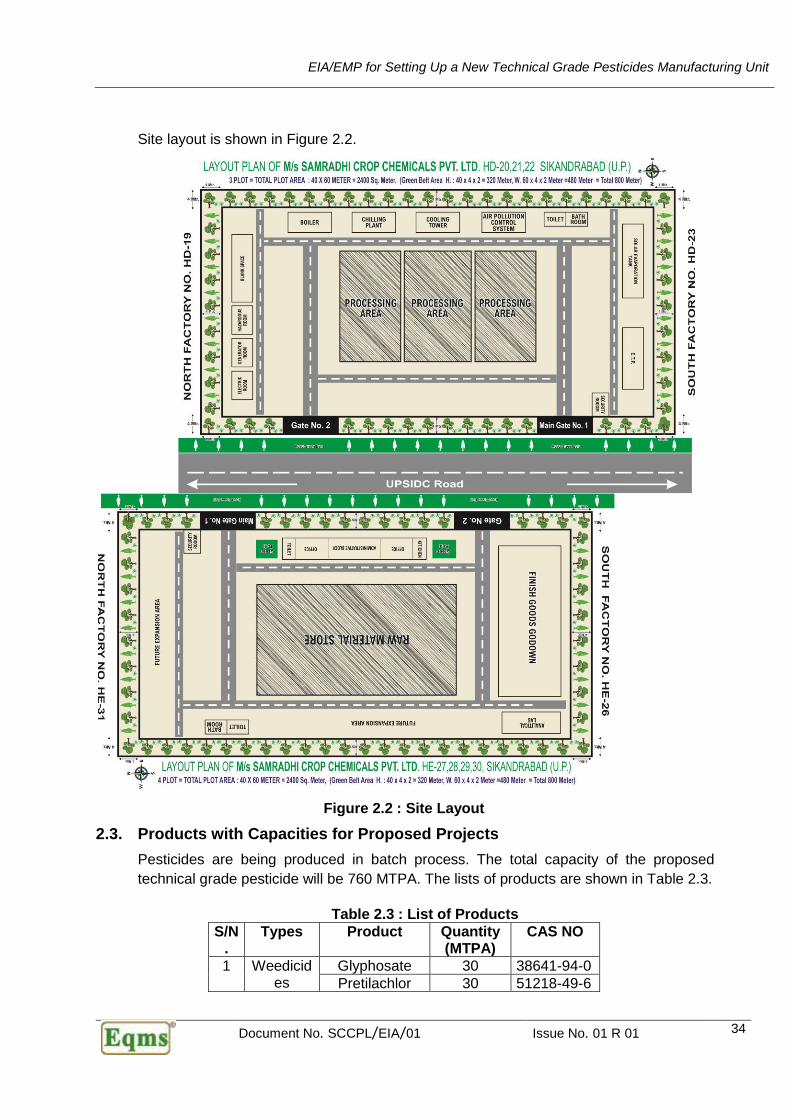
Site layout is shown in Figure 2.2.
Figure 2.2 : Site Layout
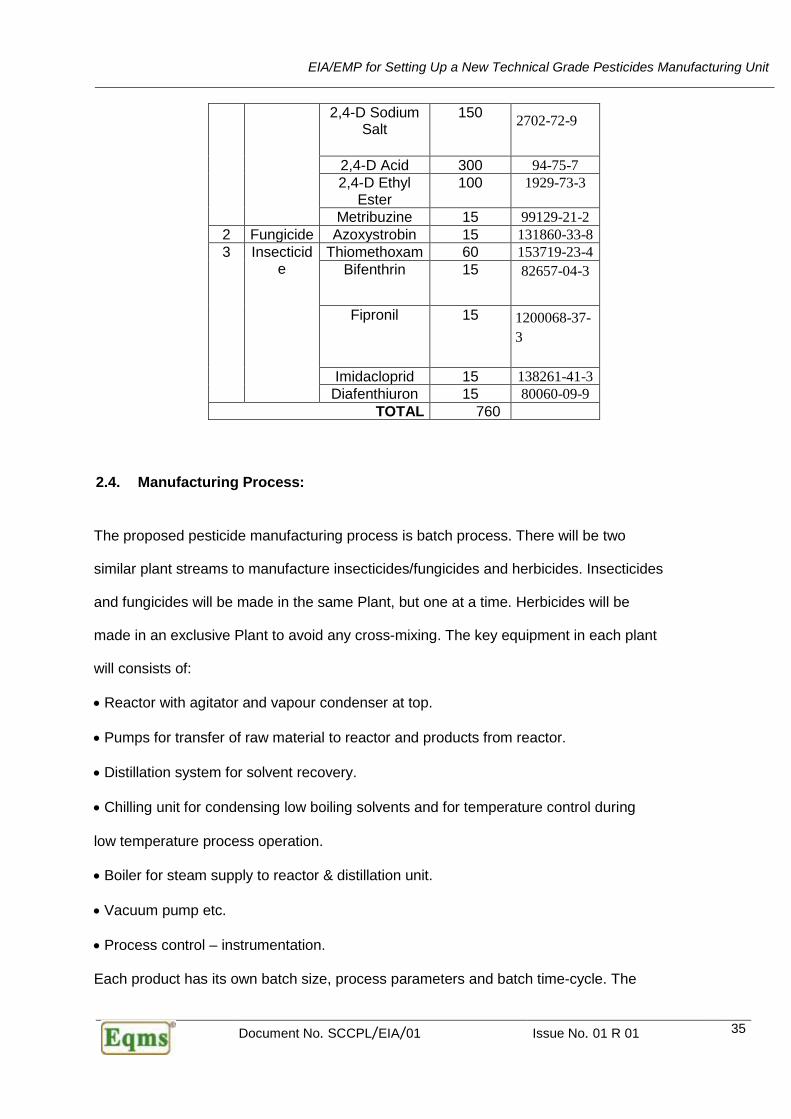
2.3. Products with Capacities for Proposed Projects
Pesticides are being produced in batch process. The total capacity of the proposed
technical grade pesticide will be 760 MTPA. The lists of products are shown in Table 2.3.
Table 2.3 : List of Products
S/N.
Types Product Quantity (MTPA)
CAS NO
1 Weedicides
Glyphosate 30 38641-94-0
Pretilachlor 30 51218-49-6
EIA/EMP for Setting Up a New Technical Grade Pesticides Manufacturing Unit
Document No. SCCPL/EIA/01 Issue No. 01 R 01 35
2,4-D Sodium Salt
150 2702-72-9
2,4-D Acid 300 94-75-7
2,4-D Ethyl Ester
100 1929-73-3
Metribuzine 15 99129-21-2
2 Fungicide Azoxystrobin 15 131860-33-8
3 Insecticide
Thiomethoxam 60 153719-23-4
Bifenthrin 15 82657-04-3
Fipronil 15 1200068-37-
3
Imidacloprid 15 138261-41-3
Diafenthiuron 15 80060-09-9
TOTAL 760
2.4. Manufacturing Process:
The proposed pesticide manufacturing process is batch process. There will be two
similar plant streams to manufacture insecticides/fungicides and herbicides. Insecticides
and fungicides will be made in the same Plant, but one at a time. Herbicides will be
made in an exclusive Plant to avoid any cross-mixing. The key equipment in each plant
will consists of:
• Reactor with agitator and vapour condenser at top.
• Pumps for transfer of raw material to reactor and products from reactor.
• Distillation system for solvent recovery.
• Chilling unit for condensing low boiling solvents and for temperature control during
low temperature process operation.
• Boiler for steam supply to reactor & distillation unit.
• Vacuum pump etc.
• Process control – instrumentation.
Each product has its own batch size, process parameters and batch time-cycle. The
EIA/EMP for Setting Up a New Technical Grade Pesticides Manufacturing Unit
Document No. SCCPL/EIA/01 Issue No. 01 R 01 36
process parameter terms used and applicable for the various products are as given
below:
Temperature & Pressure Terminology used is:
A. Temperature
High temp.--------- > 125°C.
Moderate temp. --------- 30 to 100°C.
Low temp. --------- -15 to 20°C.
B. Pressure
High vacuum --------- 1.0 mm Hg to 20 mm Hg
Medium vac. --------- 300 mm Hg to 500 mm Hg
Low vac. --------- 600 mm Hg to 700 mm Hg
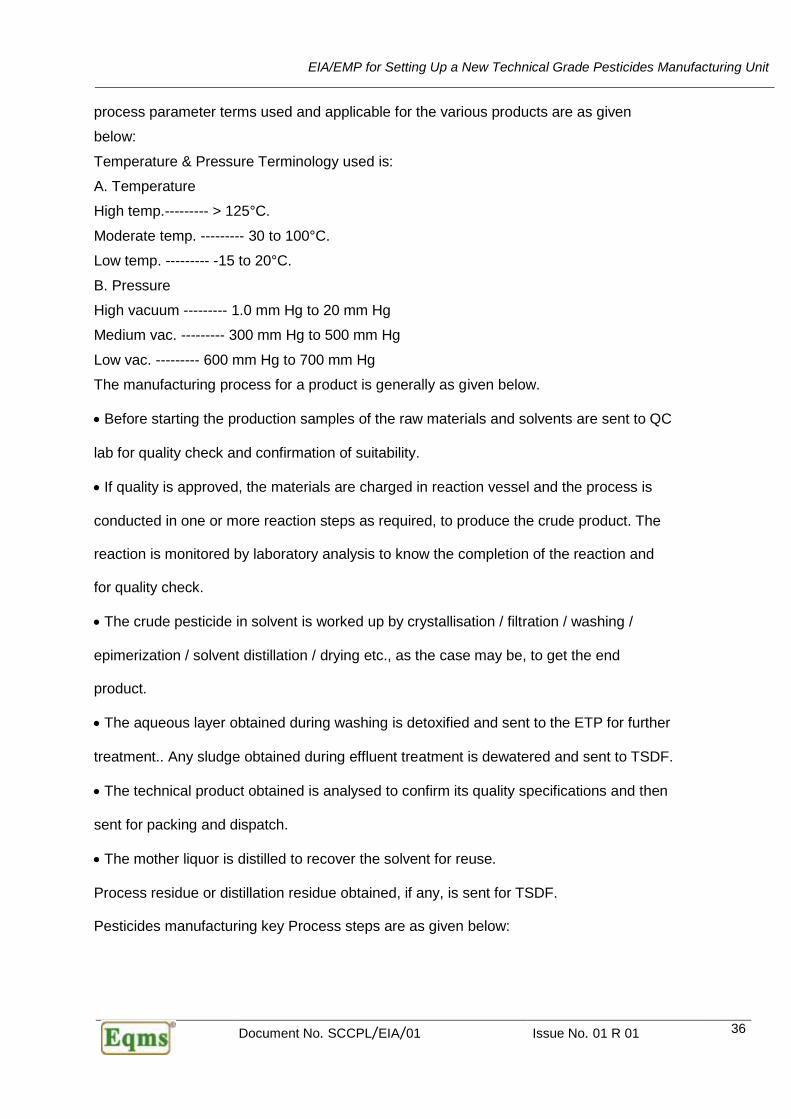
The manufacturing process for a product is generally as given below.
• Before starting the production samples of the raw materials and solvents are sent to QC
lab for quality check and confirmation of suitability.
• If quality is approved, the materials are charged in reaction vessel and the process is
conducted in one or more reaction steps as required, to produce the crude product. The
reaction is monitored by laboratory analysis to know the completion of the reaction and
for quality check.
• The crude pesticide in solvent is worked up by crystallisation / filtration / washing /
epimerization / solvent distillation / drying etc., as the case may be, to get the end
product.
• The aqueous layer obtained during washing is detoxified and sent to the ETP for further
treatment.. Any sludge obtained during effluent treatment is dewatered and sent to TSDF.
• The technical product obtained is analysed to confirm its quality specifications and then
sent for packing and dispatch.
• The mother liquor is distilled to recover the solvent for reuse.
Process residue or distillation residue obtained, if any, is sent for TSDF.
Pesticides manufacturing key Process steps are as given below:
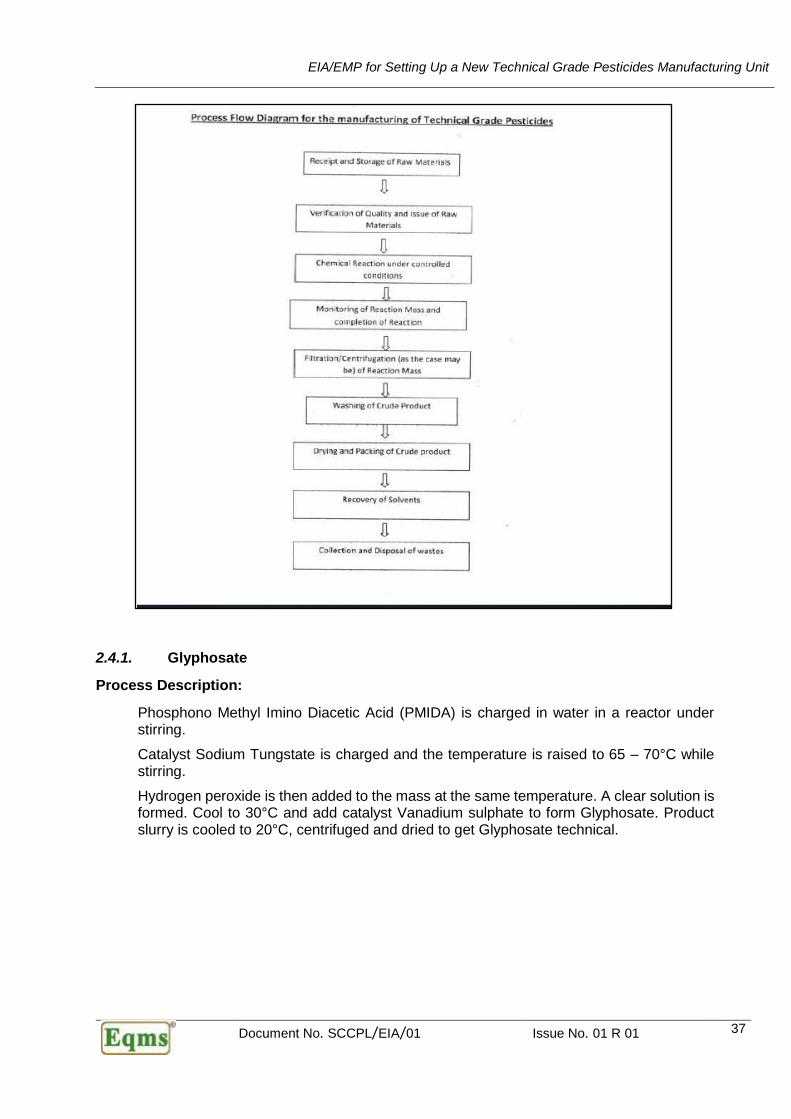
EIA/EMP for Setting Up a New Technical Grade Pesticides Manufacturing Unit
Document No. SCCPL/EIA/01 Issue No. 01 R 01 37
2.4.1. Glyphosate
Process Description:
Phosphono Methyl Imino Diacetic Acid (PMIDA) is charged in water in a reactor under stirring.
Catalyst Sodium Tungstate is charged and the temperature is raised to 65 – 70°C while stirring.
Hydrogen peroxide is then added to the mass at the same temperature. A clear solution is formed. Cool to 30°C and add catalyst Vanadium sulphate to form Glyphosate. Product slurry is cooled to 20°C, centrifuged and dried to get Glyphosate technical.

EIA/EMP for Setting Up a New Technical Grade Pesticides Manufacturing Unit
Document No. SCCPL/EIA/01 Issue No. 01 R 01 38
Process Flow Diagram:
N
OH
O
P OOH
OH
OH
O
PMIDAMW.= 227
+ OH OH
HYDROGEN PEROXIDEMW.= 34
NH
OH
O
P OOH
OH
+ OH2 + O
CH2
+ O O
MW.=30
MW.= 44
GLYPHOSATE
MW.= 169
Figure 2.3 Chemical Reaction
2.4.2. Pretilachlor Tech Manufacturing Process In the first step, 2,6- Diethylanilie ( DEA ) is taken excess in a reactor and is reacted with Propoxychloroethane at reflux temperature for 20 hours. After completion of the reaction, the
WATER 2385
SODIUM TUNGSTATE 5
PMIDA 1621
SODIUM METABISULFITE 21 CO2 247
VANADIUM SULPHATE 0.4
H2O2 604 1642
4389.8
WATER WASH 1333 AQUEOUS LAYER 4722.8
1000
GLYPHOSATE TECHNICAL - MATERIAL BALANCE (ALL QUANTITIES ARE IN KG/TONN)
GLYPHOSATE
REACTOR
CENTRIFUGE & DRYING
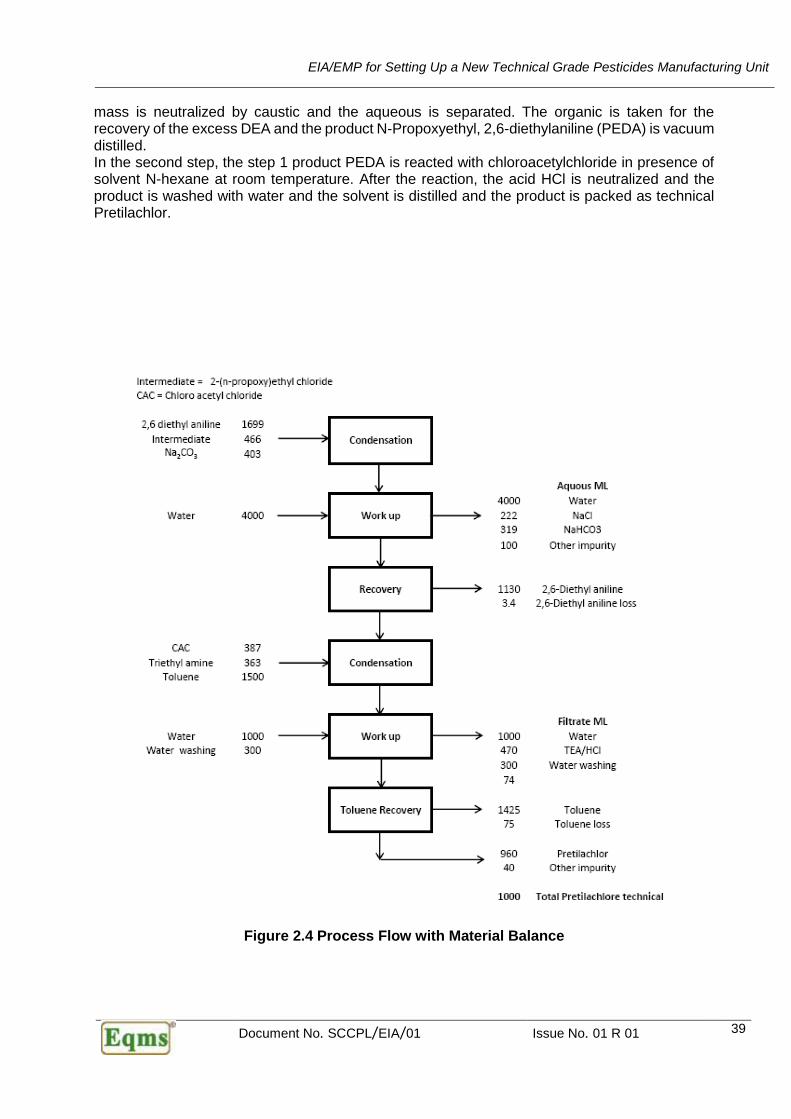
EIA/EMP for Setting Up a New Technical Grade Pesticides Manufacturing Unit
Document No. SCCPL/EIA/01 Issue No. 01 R 01 39
mass is neutralized by caustic and the aqueous is separated. The organic is taken for the recovery of the excess DEA and the product N-Propoxyethyl, 2,6-diethylaniline (PEDA) is vacuum distilled. In the second step, the step 1 product PEDA is reacted with chloroacetylchloride in presence of solvent N-hexane at room temperature. After the reaction, the acid HCl is neutralized and the product is washed with water and the solvent is distilled and the product is packed as technical Pretilachlor.
Figure 2.4 Process Flow with Material Balance
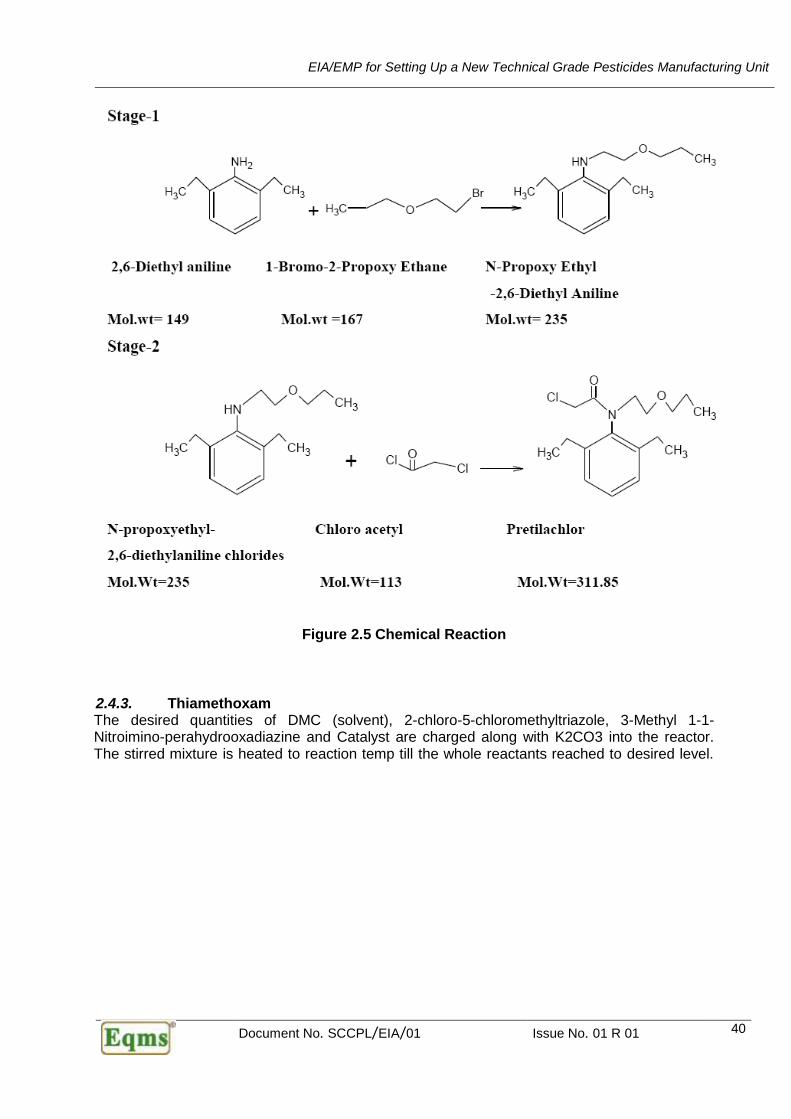
EIA/EMP for Setting Up a New Technical Grade Pesticides Manufacturing Unit
Document No. SCCPL/EIA/01 Issue No. 01 R 01 40
Figure 2.5 Chemical Reaction
2.4.3. Thiamethoxam The desired quantities of DMC (solvent), 2-chloro-5-chloromethyltriazole, 3-Methyl 1-1-Nitroimino-perahydrooxadiazine and Catalyst are charged along with K2CO3 into the reactor. The stirred mixture is heated to reaction temp till the whole reactants reached to desired level.
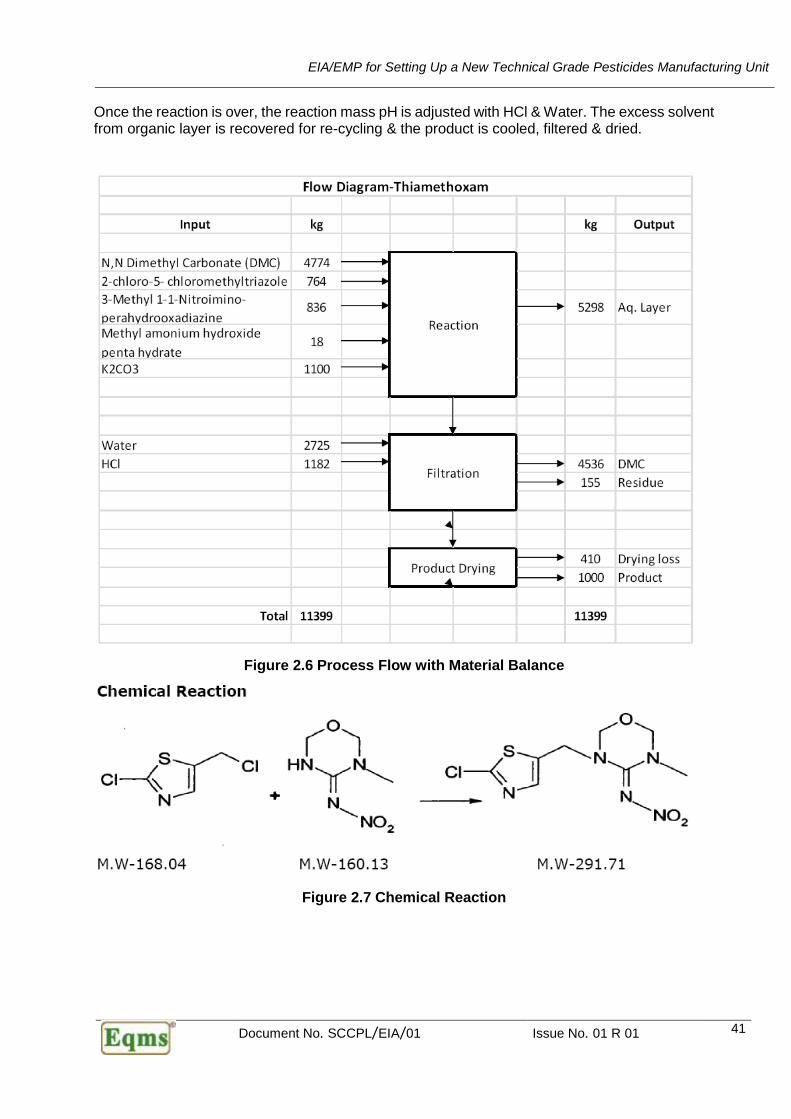
EIA/EMP for Setting Up a New Technical Grade Pesticides Manufacturing Unit
Document No. SCCPL/EIA/01 Issue No. 01 R 01 41
Once the reaction is over, the reaction mass pH is adjusted with HCl & Water. The excess solvent from organic layer is recovered for re-cycling & the product is cooled, filtered & dried.
Figure 2.6 Process Flow with Material Balance
Figure 2.7 Chemical Reaction
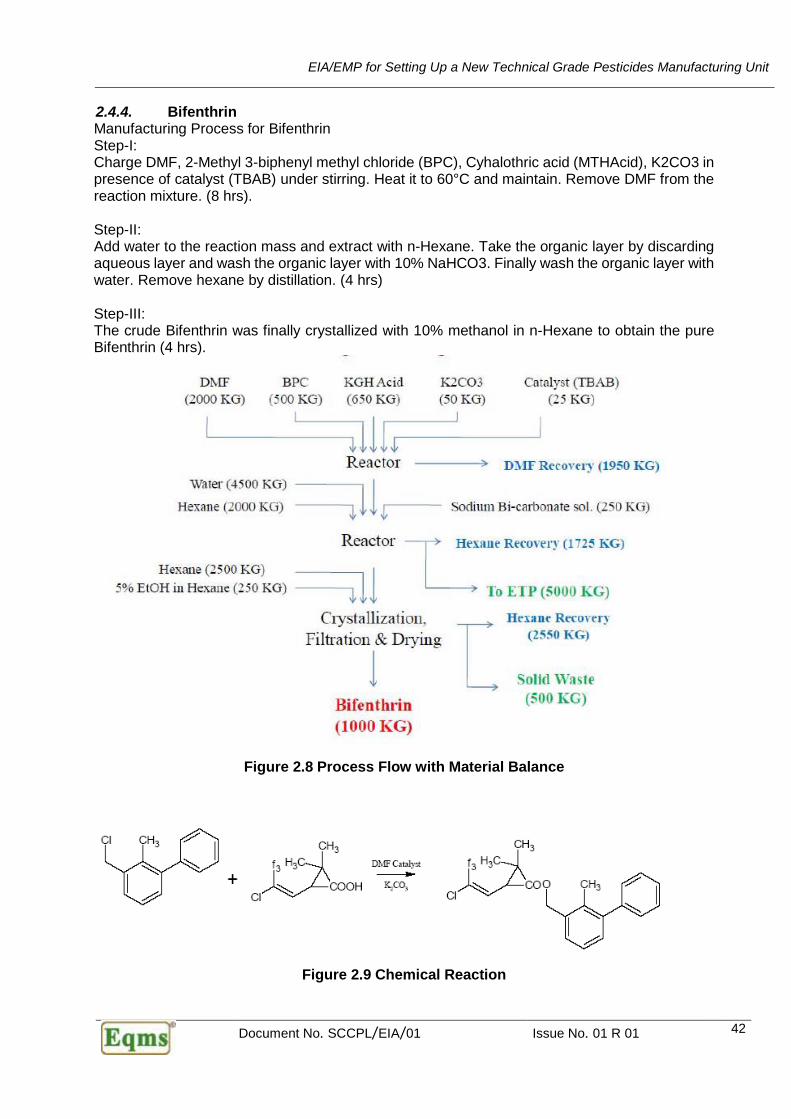
EIA/EMP for Setting Up a New Technical Grade Pesticides Manufacturing Unit
Document No. SCCPL/EIA/01 Issue No. 01 R 01 42
2.4.4. Bifenthrin Manufacturing Process for Bifenthrin Step-I: Charge DMF, 2-Methyl 3-biphenyl methyl chloride (BPC), Cyhalothric acid (MTHAcid), K2CO3 in presence of catalyst (TBAB) under stirring. Heat it to 60°C and maintain. Remove DMF from the reaction mixture. (8 hrs). Step-II: Add water to the reaction mass and extract with n-Hexane. Take the organic layer by discarding aqueous layer and wash the organic layer with 10% NaHCO3. Finally wash the organic layer with water. Remove hexane by distillation. (4 hrs) Step-III: The crude Bifenthrin was finally crystallized with 10% methanol in n-Hexane to obtain the pure Bifenthrin (4 hrs).
Figure 2.8 Process Flow with Material Balance
Figure 2.9 Chemical Reaction
EIA/EMP for Setting Up a New Technical Grade Pesticides Manufacturing Unit
Document No. SCCPL/EIA/01 Issue No. 01 R 01 43
2.4.5. Fipronil Technical Fipronil is manufactured by reaction of Fipronil pyrazole with Trifluoromethane sulphinyl chloride in Toluene at 15 to 20°C in presence of TMA-HCl. HCl gas evolved is scrubbed in water.
Check for unreacted pyrazole, if more than 2%, continue cooking for 2 more hours. After completion of reaction add water, stir and settle the layers. Send aq. layer to ETP.
Organic layer is distilled to recover solvent.
Charge Butyl acetate to the mass, centrifuge and dry at 60 -65°C to obtain Fipronil technical product.
The ML is distilled to recover butyl acetate which is recycled for next batch.

EIA/EMP for Setting Up a New Technical Grade Pesticides Manufacturing Unit
Document No. SCCPL/EIA/01 Issue No. 01 R 01 44
Process Reaction:
S
O
Cl
F
F
F
Trifluoro methane sulfinyl chlorideMW.= 152.5
+
FF
F
Cl
Cl N N
NH2
N
5-amino-1-[2,6-dichloro-4-(trifluoromethyl)phenyl]-1H-pyrazole-3-carbonitrileMW.= 321.085
+CH3
N
CH3
CH3
ClH.
trimethyl amine hydrochlorideMW.= 95.57
NN
F
FF
Cl
Cl
NH2
N
S
O
F
F
F
+ ClH +CH3
N
CH3
CH3
ClH.
trimethyl amine hydrochlorideMW.= 95.57
FIPRONIL
MW.= 437
Process Flow Diagram:
TMA HCl 250
TOLUENE 3800
FIPRONIL PYRAZOLE 850 TOLUENE 300
TFMSC 400
WATER 2540
LIQUOR AMMONIA 220 1250
7760
WATER WASH 2540 TOLUENE RECOVERY 3300
TOLUENE DISTILL. LOSS 200
AQUEOUS LAYER 5785
1015
DRYING LOSS 15
1000
FIPRONIL TECHNICAL - MATERIAL BALANCE (ALL QUANTITIES ARE IN KG.)
FIPRONIL
REACTOR
CENTRIFUGE
DRYING
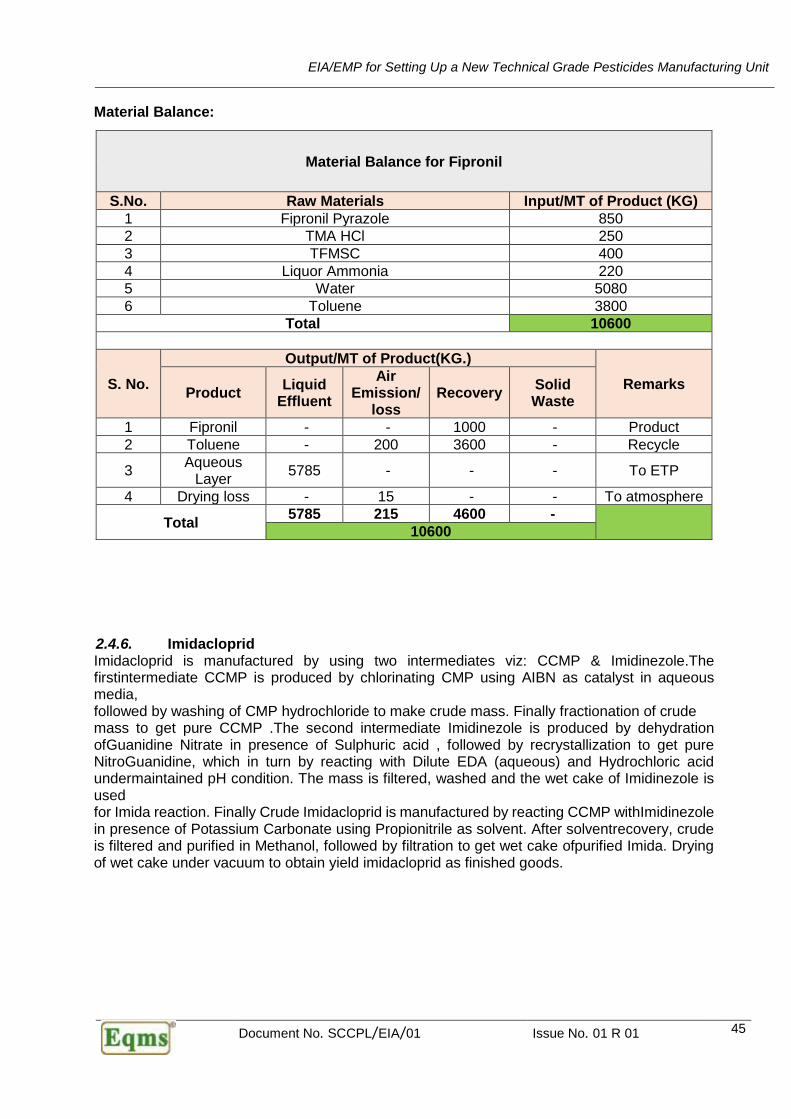
EIA/EMP for Setting Up a New Technical Grade Pesticides Manufacturing Unit
Document No. SCCPL/EIA/01 Issue No. 01 R 01 45
Material Balance:
Material Balance for Fipronil
S.No. Raw Materials Input/MT of Product (KG)
1 Fipronil Pyrazole 850
2 TMA HCl 250
3 TFMSC 400
4 Liquor Ammonia 220
5 Water 5080
6 Toluene 3800
Total 10600
S. No.
Output/MT of Product(KG.)
Remarks Product
Liquid Effluent
Air Emission/
loss Recovery
Solid Waste
1 Fipronil - - 1000 - Product
2 Toluene - 200 3600 - Recycle
3 Aqueous
Layer 5785 - - - To ETP
4 Drying loss - 15 - - To atmosphere
Total 5785 215 4600 -
10600
2.4.6. Imidacloprid Imidacloprid is manufactured by using two intermediates viz: CCMP & Imidinezole.The firstintermediate CCMP is produced by chlorinating CMP using AIBN as catalyst in aqueous media, followed by washing of CMP hydrochloride to make crude mass. Finally fractionation of crude mass to get pure CCMP .The second intermediate Imidinezole is produced by dehydration ofGuanidine Nitrate in presence of Sulphuric acid , followed by recrystallization to get pure NitroGuanidine, which in turn by reacting with Dilute EDA (aqueous) and Hydrochloric acid undermaintained pH condition. The mass is filtered, washed and the wet cake of Imidinezole is used for Imida reaction. Finally Crude Imidacloprid is manufactured by reacting CCMP withImidinezole in presence of Potassium Carbonate using Propionitrile as solvent. After solventrecovery, crude is filtered and purified in Methanol, followed by filtration to get wet cake ofpurified Imida. Drying of wet cake under vacuum to obtain yield imidacloprid as finished goods.
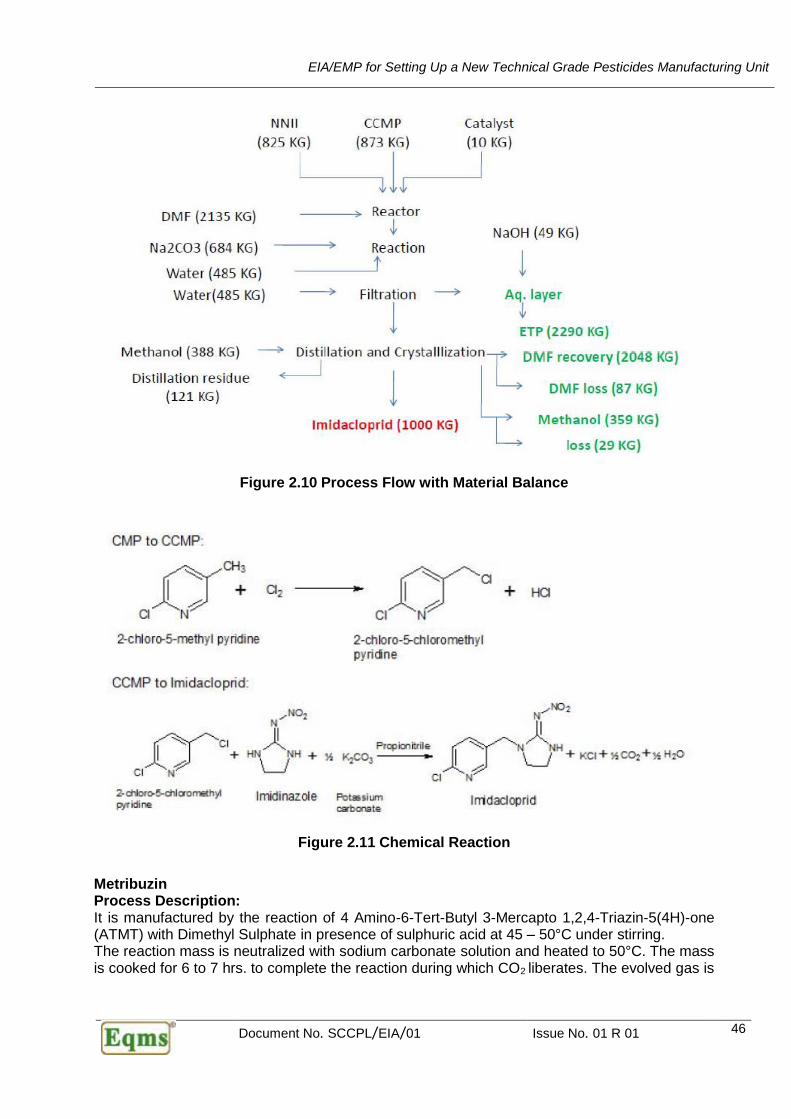
EIA/EMP for Setting Up a New Technical Grade Pesticides Manufacturing Unit
Document No. SCCPL/EIA/01 Issue No. 01 R 01 46
Figure 2.10 Process Flow with Material Balance
Figure 2.11 Chemical Reaction
Metribuzin Process Description: It is manufactured by the reaction of 4 Amino-6-Tert-Butyl 3-Mercapto 1,2,4-Triazin-5(4H)-one (ATMT) with Dimethyl Sulphate in presence of sulphuric acid at 45 – 50°C under stirring. The reaction mass is neutralized with sodium carbonate solution and heated to 50°C. The mass is cooked for 6 to 7 hrs. to complete the reaction during which CO2 liberates. The evolved gas is
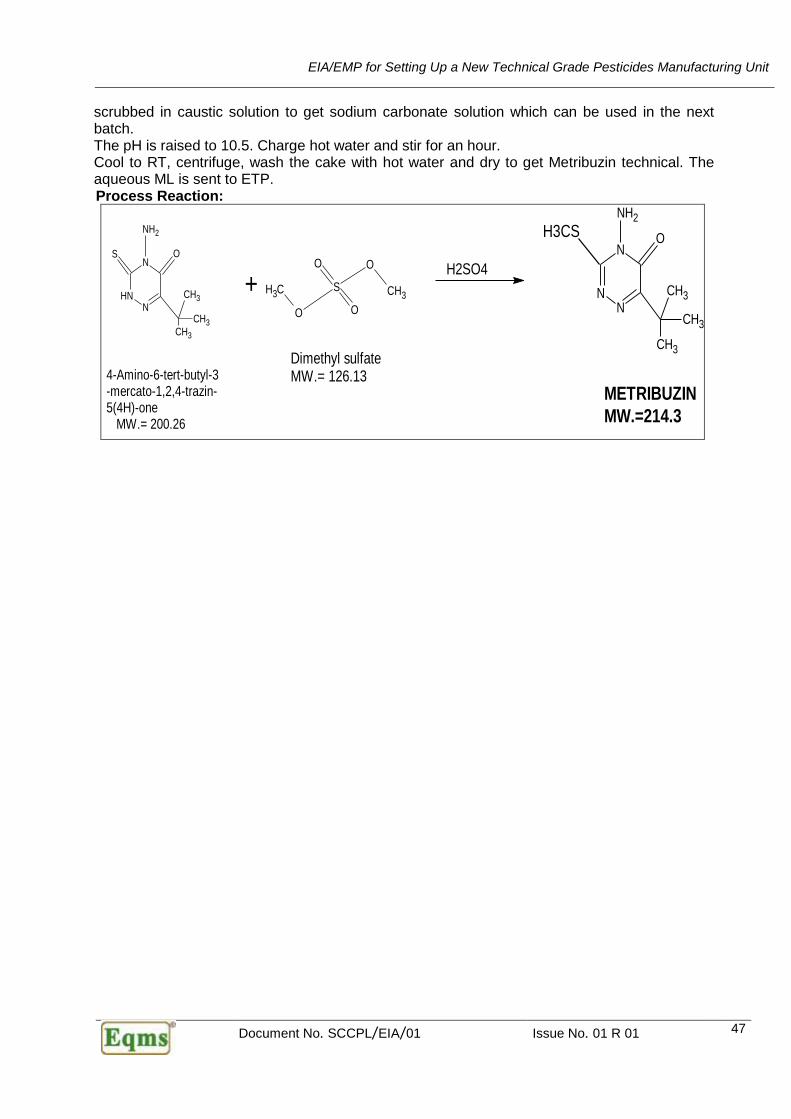
EIA/EMP for Setting Up a New Technical Grade Pesticides Manufacturing Unit
Document No. SCCPL/EIA/01 Issue No. 01 R 01 47
scrubbed in caustic solution to get sodium carbonate solution which can be used in the next batch. The pH is raised to 10.5. Charge hot water and stir for an hour. Cool to RT, centrifuge, wash the cake with hot water and dry to get Metribuzin technical. The aqueous ML is sent to ETP. Process Reaction:
N
NNH
S
NH2
O
CH3
CH3CH3
+ S
O
CH3
O
CH3
O
O
N
NN
NH2
O
CH3
CH3
CH3
H3CS
4-Amino-6-tert-butyl-3-mercato-1,2,4-trazin-5(4H)-one MW.= 200.26
Dimethyl sulfateMW.= 126.13
METRIBUZIN
MW.=214.3
H2SO4
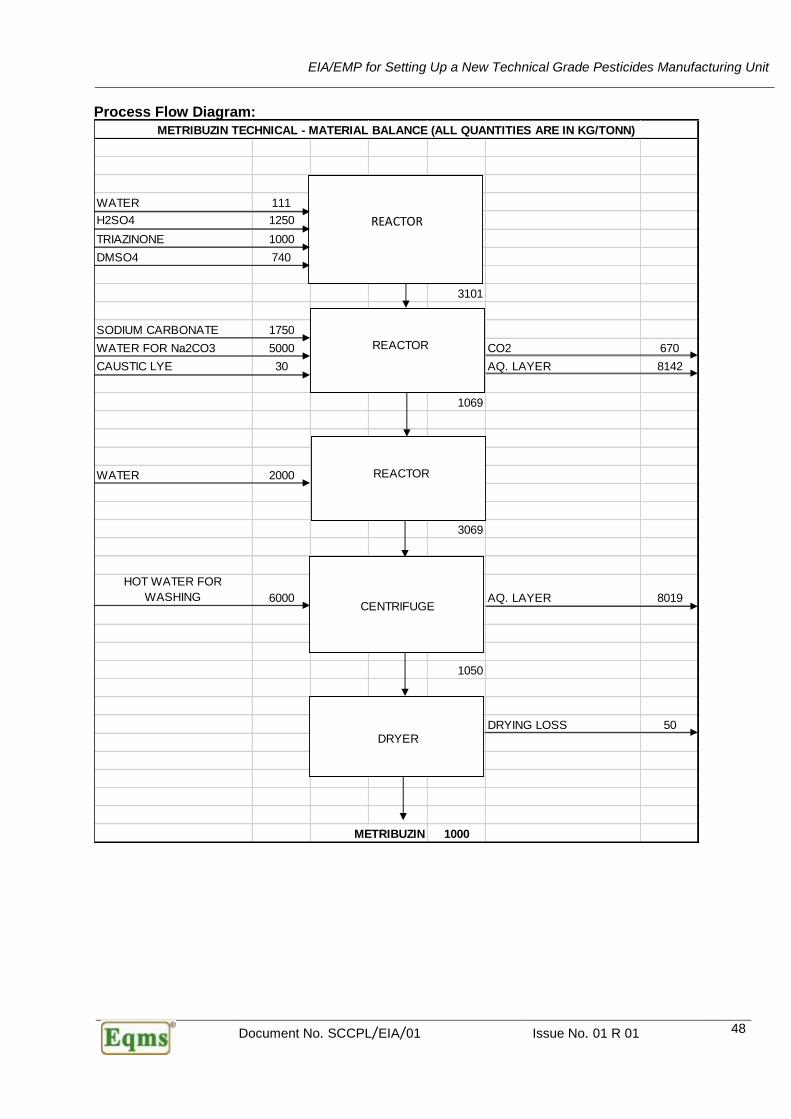
EIA/EMP for Setting Up a New Technical Grade Pesticides Manufacturing Unit
Document No. SCCPL/EIA/01 Issue No. 01 R 01 48
Process Flow Diagram:
WATER 111
H2SO4 1250
TRIAZINONE 1000
DMSO4 740 111
3101
SODIUM CARBONATE 1750
WATER FOR Na2CO3 5000 CO2 670
CAUSTIC LYE 30 AQ. LAYER 8142
1069
WATER 2000
3069
HOT WATER FOR
WASHING 6000 AQ. LAYER 8019
1050
DRYING LOSS 50
1000
METRIBUZIN TECHNICAL - MATERIAL BALANCE (ALL QUANTITIES ARE IN KG/TONN)
METRIBUZIN
REACTOR
REACTOR
REACTOR
CENTRIFUGE
DRYER

EIA/EMP for Setting Up a New Technical Grade Pesticides Manufacturing Unit
Document No. SCCPL/EIA/01 Issue No. 01 R 01 49
Material Balance:
Material Balance for Metribuzin
S. No. Raw Materials Input/MT of Product (KG)
1 Water 13111
2 H2SO4 1250
3 Triazinone 1000
4 DMSO4 740
5 Sodium Carbonate 1750
6 Caustic Lye 30
Total 17881
S. No.
Output/MT of Product (KG)
Remarks Product
Liquid Effluent
Air Emission/ loss
Recovery Solid Waste
1 Metribuzin - - 1000 - Product
2 CO2 - 670 - - To Scrubber
3 Aqueous Layer 16161 - - - To ETP
4 Drying Loss - 50 - - To atmosphere
Total 16161 720 1000 0
17881
Azoxystrobin
Process Description:
MMCPOA (Methyl-3-methoxy-2-2-6-chloropyrimidine-4-4-iyl-oxyphenyl- acrylate) and anhydrous
Potassium carbonate are charged in DMF. Charge 2 cyano Phenol to the above reaction mass,
add catalytic amount of Cuprous Chloride and heat the reaction mass to 100°C for few hours.
Filter the reaction mass to remove inorganics and distil out DMF from reaction mass. Add hexane
and wash the reaction mass with dilute caustic to remove unreacted cyano phenol from the
reaction mass.Crystallize the crude with methanol, centrifuge and dry to get technical grade
Azoxystrobin as white crystalline solid.

EIA/EMP for Setting Up a New Technical Grade Pesticides Manufacturing Unit
Document No. SCCPL/EIA/01 Issue No. 01 R 01 50
Process Reaction:
+
2-CYANO PHENOLMW.= 119.12 AZOXYSTROBIN
MW.= 403.4
Methyl-3-methoxy-2-2-6-chloropyrimidine-4-4-iyl-oxyphenyl-acrylateMW.= 320.78
+ KHCO3 KCl+
Potassium bicarbonateMW.= 100
O
NN
O O
CH3
OCH3
Cl
CN
OH
O
NN
O O
CH3
OCH3
OK2CO3, CuCl2
DMF
Process Flow Diagram:
MMCPOA 880
K2CO3 379
DMF 2500
2 CYANO PHENOL 327
CuCl2 11
4097
INORGANIC SALTS 120
DMF LOSS 100
DMF RECOVERY 2400
1477
CAUSTIC SODA 23
WATER 500
HEXANE 2500 AQ. LAYER 1000
3500
3500
METHANOL 2200 METHANOL RECOVERY 2070
METHANOL LOSS 130
HEXANE RECOVERY 2400
HEXANE LOSS 100
AZOXYSTROBIN
1000
AZOXYSTROBIN TECHNICAL - MATERIAL BALANCE (ALL QUANTITIES ARE IN KG/TONN)
REACTOR
FILTRATION & DISTILLATION
WASHING
CRYSTALLIZATION & SOLVENT RECOVERY
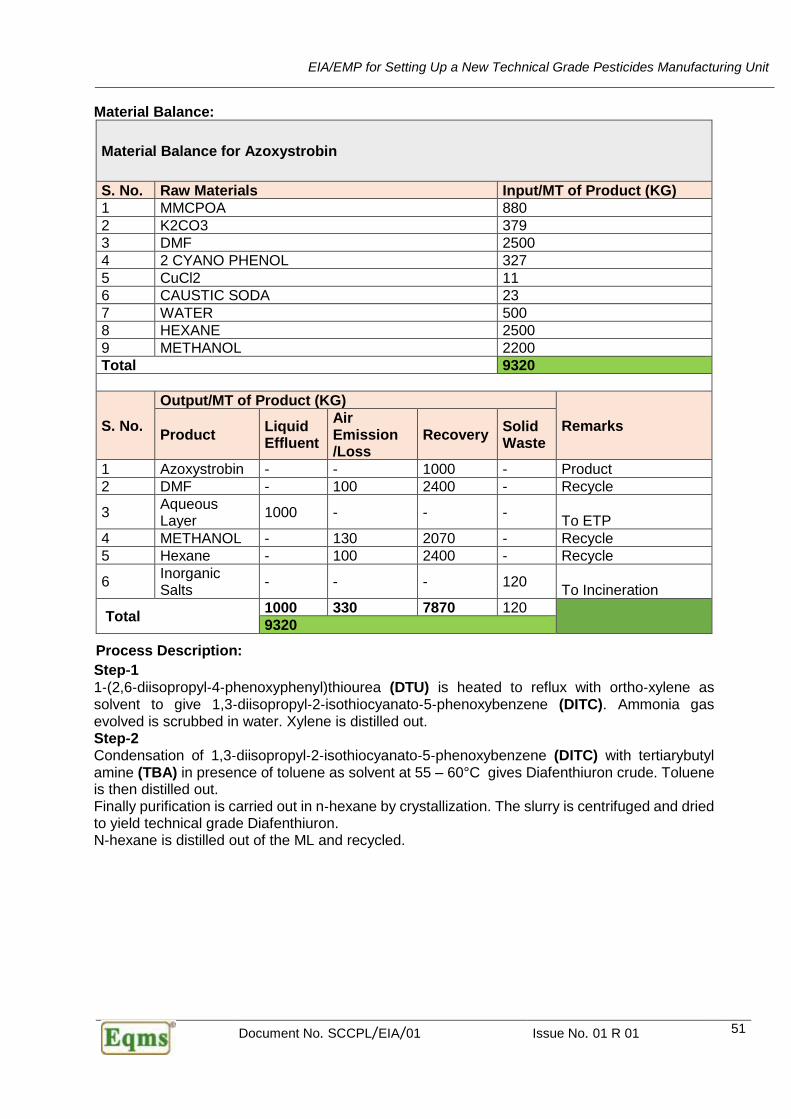
EIA/EMP for Setting Up a New Technical Grade Pesticides Manufacturing Unit
Document No. SCCPL/EIA/01 Issue No. 01 R 01 51
Material Balance:
Material Balance for Azoxystrobin
S. No. Raw Materials Input/MT of Product (KG)
1 MMCPOA 880
2 K2CO3 379
3 DMF 2500
4 2 CYANO PHENOL 327
5 CuCl2 11
6 CAUSTIC SODA 23
7 WATER 500
8 HEXANE 2500
9 METHANOL 2200
Total 9320
S. No.
Output/MT of Product (KG)
Remarks Product
Liquid Effluent
Air Emission /Loss
Recovery Solid Waste
1 Azoxystrobin - - 1000 - Product
2 DMF - 100 2400 - Recycle
3 Aqueous Layer
1000 - - - To ETP
4 METHANOL - 130 2070 - Recycle
5 Hexane - 100 2400 - Recycle
6 Inorganic Salts
- - - 120 To Incineration
Total 1000 330 7870 120
9320
Process Description:
Step‐1
1‐(2,6‐diisopropyl‐4‐phenoxyphenyl)thiourea (DTU) is heated to reflux with ortho‐xylene as solvent to give 1,3‐diisopropyl‐2‐isothiocyanato‐5‐phenoxybenzene (DITC). Ammonia gas evolved is scrubbed in water. Xylene is distilled out. Step‐2 Condensation of 1,3‐diisopropyl‐2‐isothiocyanato‐5‐phenoxybenzene (DITC) with tertiarybutyl amine (TBA) in presence of toluene as solvent at 55 – 60°C gives Diafenthiuron crude. Toluene is then distilled out. Finally purification is carried out in n‐hexane by crystallization. The slurry is centrifuged and dried to yield technical grade Diafenthiuron. N-hexane is distilled out of the ML and recycled.
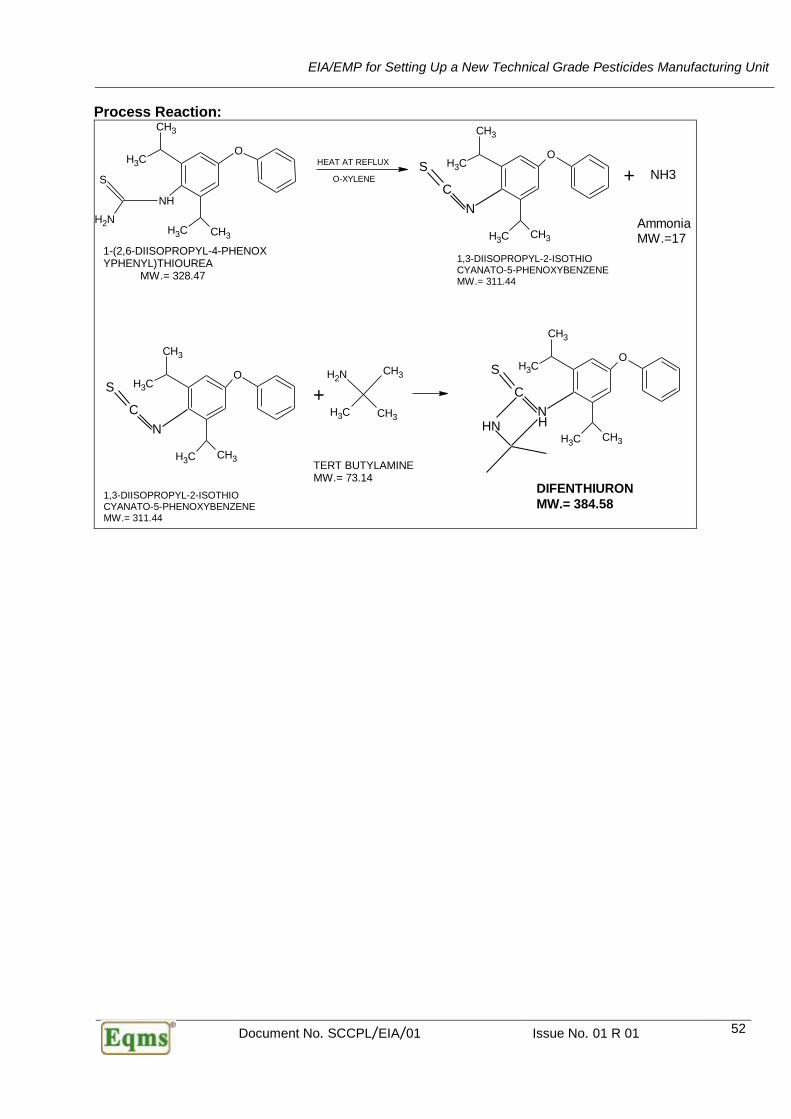
EIA/EMP for Setting Up a New Technical Grade Pesticides Manufacturing Unit
Document No. SCCPL/EIA/01 Issue No. 01 R 01 52
Process Reaction:
CH3 CH3
O
CH3
CH3
NH
S
NH2
1-(2,6-DIISOPROPYL-4-PHENOXYPHENYL)THIOUREA MW.= 328.47
HEAT AT REFLUX
O-XYLENE
O
CH3CH3
CH3
CH3
N
C
S
1,3-DIISOPROPYL-2-ISOTHIO CYANATO-5-PHENOXYBENZENEMW.= 311.44
O
CH3CH3
CH3
CH3
N
C
S
1,3-DIISOPROPYL-2-ISOTHIO CYANATO-5-PHENOXYBENZENEMW.= 311.44
+
CH3
CH3CH3
NH2
TERT BUTYLAMINEMW.= 73.14
O
CH3CH3
CH3
CH3
N
C
S
HN H
DIFENTHIURON
MW.= 384.58
+ NH3
AmmoniaMW.=17
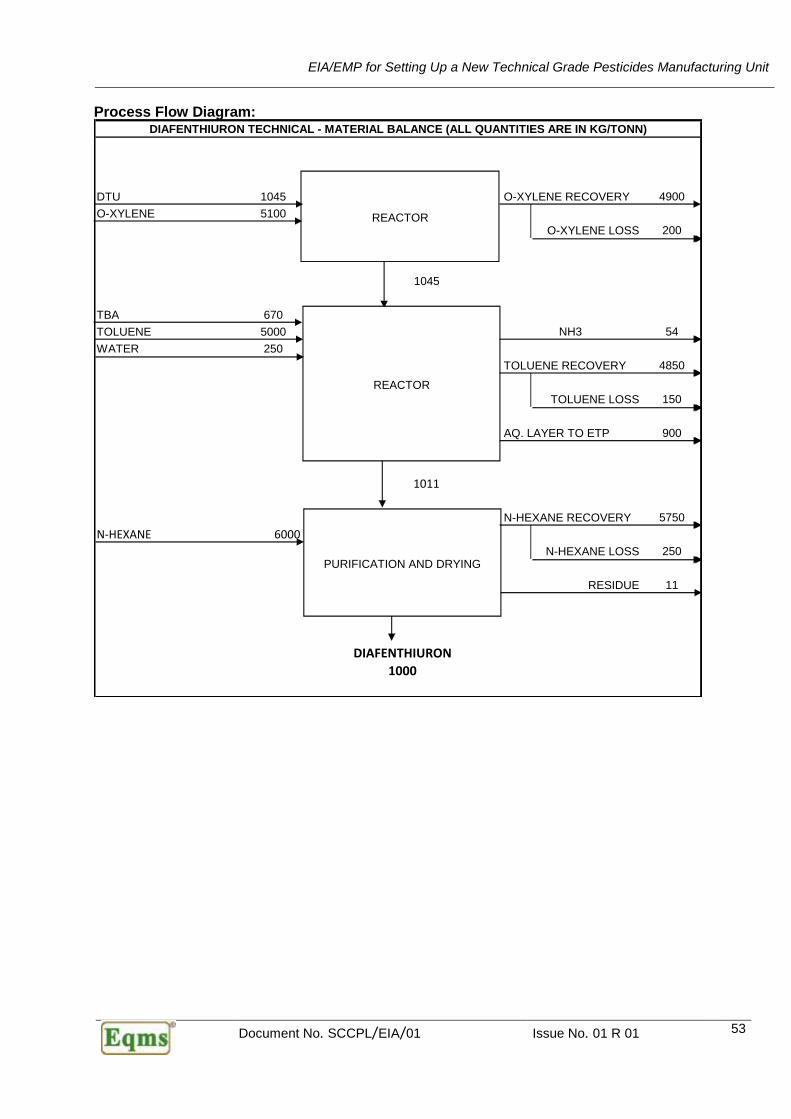
EIA/EMP for Setting Up a New Technical Grade Pesticides Manufacturing Unit
Document No. SCCPL/EIA/01 Issue No. 01 R 01 53
Process Flow Diagram:
DTU 1045 O-XYLENE RECOVERY 4900
O-XYLENE 5100
O-XYLENE LOSS 200
1045
TBA 670
TOLUENE 5000 NH3 54
WATER 250
TOLUENE RECOVERY 4850
TOLUENE LOSS 150
AQ. LAYER TO ETP 900
1011
N-HEXANE RECOVERY 5750
N-HEXANE 6000
N-HEXANE LOSS 250
RESIDUE 11
DIAFENTHIURON
1000
DIAFENTHIURON TECHNICAL - MATERIAL BALANCE (ALL QUANTITIES ARE IN KG/TONN)
REACTOR
REACTOR
PURIFICATION AND DRYING
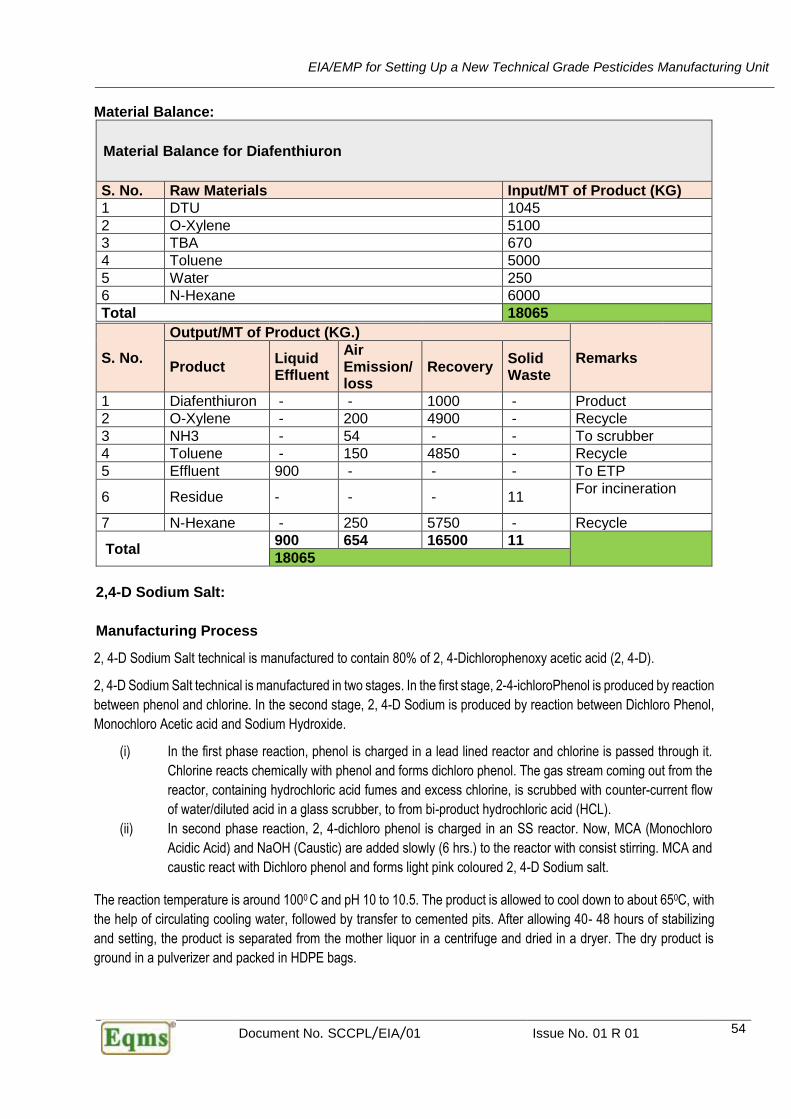
EIA/EMP for Setting Up a New Technical Grade Pesticides Manufacturing Unit
Document No. SCCPL/EIA/01 Issue No. 01 R 01 54
Material Balance:
Material Balance for Diafenthiuron
S. No. Raw Materials Input/MT of Product (KG)
1 DTU 1045
2 O-Xylene 5100
3 TBA 670
4 Toluene 5000
5 Water 250
6 N-Hexane 6000
Total 18065
S. No.
Output/MT of Product (KG.)
Remarks Product
Liquid Effluent
Air Emission/ loss
Recovery Solid Waste
1 Diafenthiuron - - 1000 - Product
2 O-Xylene - 200 4900 - Recycle
3 NH3 - 54 - - To scrubber
4 Toluene - 150 4850 - Recycle
5 Effluent 900 - - - To ETP
6 Residue - - - 11 For incineration
7 N-Hexane - 250 5750 - Recycle
Total 900 654 16500 11
18065
2,4-D Sodium Salt:
Manufacturing Process
2, 4-D Sodium Salt technical is manufactured to contain 80% of 2, 4-Dichlorophenoxy acetic acid (2, 4-D).
2, 4-D Sodium Salt technical is manufactured in two stages. In the first stage, 2-4-ichloroPhenol is produced by reaction
between phenol and chlorine. In the second stage, 2, 4-D Sodium is produced by reaction between Dichloro Phenol,
Monochloro Acetic acid and Sodium Hydroxide.
(i) In the first phase reaction, phenol is charged in a lead lined reactor and chlorine is passed through it.
Chlorine reacts chemically with phenol and forms dichloro phenol. The gas stream coming out from the
reactor, containing hydrochloric acid fumes and excess chlorine, is scrubbed with counter-current flow
of water/diluted acid in a glass scrubber, to from bi-product hydrochloric acid (HCL).
(ii) In second phase reaction, 2, 4-dichloro phenol is charged in an SS reactor. Now, MCA (Monochloro
Acidic Acid) and NaOH (Caustic) are added slowly (6 hrs.) to the reactor with consist stirring. MCA and
caustic react with Dichloro phenol and forms light pink coloured 2, 4-D Sodium salt.
The reaction temperature is around 1000 C and pH 10 to 10.5. The product is allowed to cool down to about 650C, with
the help of circulating cooling water, followed by transfer to cemented pits. After allowing 40- 48 hours of stabilizing
and setting, the product is separated from the mother liquor in a centrifuge and dried in a dryer. The dry product is
ground in a pulverizer and packed in HDPE bags.

EIA/EMP for Setting Up a New Technical Grade Pesticides Manufacturing Unit
Document No. SCCPL/EIA/01 Issue No. 01 R 01 55
The mother liquor obtained from setting and centrifuge contains wastewater and different derivatives of phenol and
raw materials. It is neutralized with HCl to separate the organic components, which settle down. The aqueous liquor is
separated from the organic layer and sent to the ETP for treatment. The organic fraction is packed quantitatively in
drums and disposed through sale to sister concern.
Raw materials and sources of supply of 2, 4-D Sodium Salt Tech
S. No. Raw Material Source of Supply
1 Phenol India Glycols Limited
2 Chlorine Reliance life science ltd
3 Mono Chloro Acetic Acid Indian Polychem
4 Caustic Lye JK Chemicals Ahmedabad
2, 4-D Acid (Technical):
Manufacturing Process: In the manufacturing process, 2,4-D Sodium Salt and water are charged
in a rubber lined reactor. Now Hydrochloric acid (HCl) is added slowly with constant stirring for
proper reaction. The addition of HCl is continued till the pH of the materials reaches to 2. In the
reactor, HCl reacts with 2,4-D Sodium salt to form 2,4-D Acid (Tech.). Neither excess
temperature nor catalyst is necessary in this reaction. The product is separated from the mother
liquor in a rubber lined centrifuge and subsequently dried in a dryer. The dried product is ground
with a pulverizer and packed in HDPE bags. Although the mother liquor (wastewater) is rich in
HCl, its recycle to the reactor is prohibited by high concentration of NaCl. The mother liquor is,
therefore, sent to the ETP for treatment and disposal.

EIA/EMP for Setting Up a New Technical Grade Pesticides Manufacturing Unit
Document No. SCCPL/EIA/01 Issue No. 01 R 01 56
2,4-D Ethyl Ester (Technical): Manufacturing Process: In the manufacturing process, ethyl alcohol is charged in a glass-lined reactor. Powdered 2,4-D
acid and Sulphuric acid are added to the reactor with constant stirring, so as to dissolve the
powder in the mixture. When all the materials have been added and thoroughly mixed, the
manhole of the reactor is closed and so as to render air tight. After this, the reactor is heated by
passing steam. The heating is continued till the temperature raises up to 900C. Under the reactor
conditions, ethyl alcohol reacts with 2,4-D acid to form 2,4-D ethyl ester. The product is heated
vigorously under reflux for 4 hrs. for completion of the reaction. After this, the material in
the reactor is allowed to cool down to 300C. One or two water washings and TEA washing are
employed to reduce the pH of the materials 2 to 5. After 2-3 hrs.of settling, the material is
transferred to SS of HDPE storage tank. After further settling for 40-45 hrs., the material is filtered
and stored in dry HDPE drums.

EIA/EMP for Setting Up a New Technical Grade Pesticides Manufacturing Unit
Document No. SCCPL/EIA/01 Issue No. 01 R 01 57
2.5. Raw Materials Each product is unique in nature and application/ use, process of manufacture and raw material requirement. As such SCCPL has a long list of raw materials. Raw materials required along with
EIA/EMP for Setting Up a New Technical Grade Pesticides Manufacturing Unit
Document No. SCCPL/EIA/01 Issue No. 01 R 01 58
estimated quantity, likely source of material and mode of transport of raw material is mentioned in Table 2.4.
The transportation of raw materials will be done by road complying with all safety requirements as per MSIHC rule.
The raw materials will be procured and stored / inventory will be maintained as per market requirement of the products and production schedule. Some of the key raw materials are:
Table 2.4 : List of Raw Material
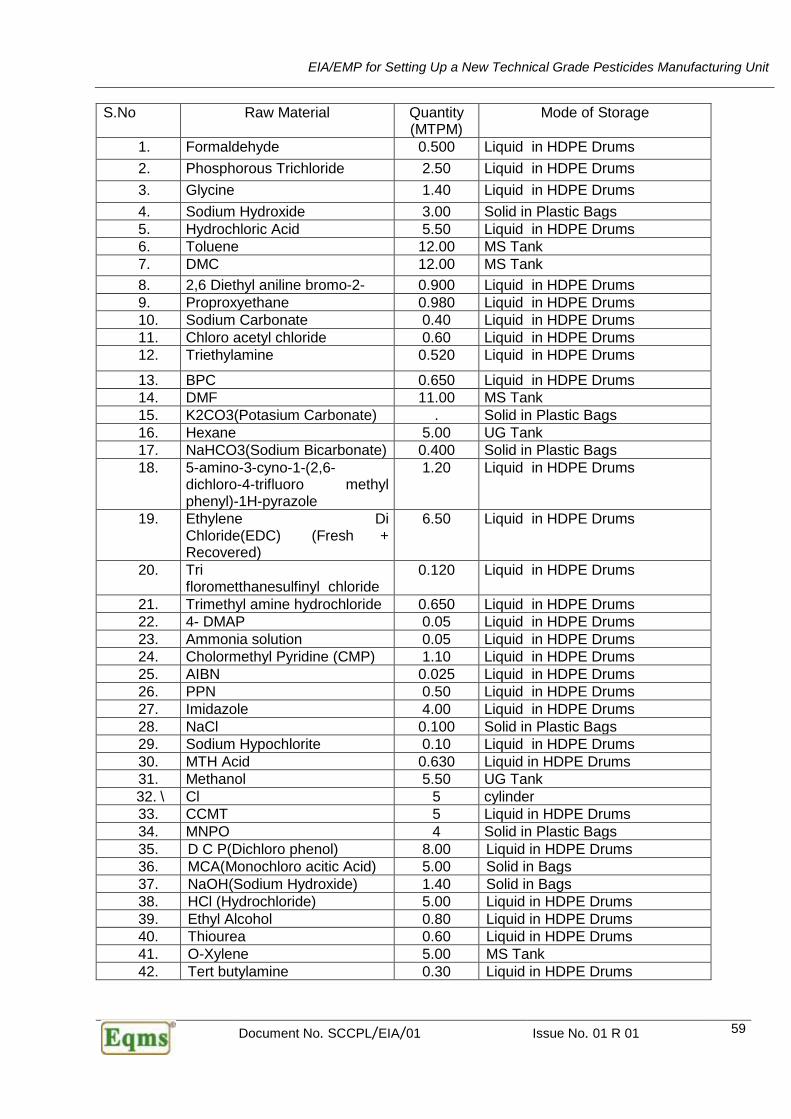
EIA/EMP for Setting Up a New Technical Grade Pesticides Manufacturing Unit
Document No. SCCPL/EIA/01 Issue No. 01 R 01 59
S.No Raw Material Quantity (MTPM)
Mode of Storage
1. Formaldehyde 0.500 Liquid in HDPE Drums
2. Phosphorous Trichloride 2.50 Liquid in HDPE Drums
3. Glycine 1.40 Liquid in HDPE Drums
4. Sodium Hydroxide 3.00 Solid in Plastic Bags
5. Hydrochloric Acid 5.50 Liquid in HDPE Drums
6. Toluene 12.00 MS Tank
7. DMC 12.00 MS Tank
8. 2,6 Diethyl aniline bromo-2- 0.900 Liquid in HDPE Drums
9. Proproxyethane 0.980 Liquid in HDPE Drums
10. Sodium Carbonate 0.40 Liquid in HDPE Drums
11. Chloro acetyl chloride 0.60 Liquid in HDPE Drums
12. Triethylamine 0.520 Liquid in HDPE Drums
13. BPC 0.650 Liquid in HDPE Drums
14. DMF 11.00 MS Tank
15. K2CO3(Potasium Carbonate) . Solid in Plastic Bags
16. Hexane 5.00 UG Tank
17. NaHCO3(Sodium Bicarbonate) 0.400 Solid in Plastic Bags
18. 5-amino-3-cyno-1-(2,6-dichloro-4-trifluoro methyl phenyl)-1H-pyrazole
1.20 Liquid in HDPE Drums
19. Ethylene Di Chloride(EDC) (Fresh + Recovered)
6.50 Liquid in HDPE Drums
20. Tri florometthanesulfinyl chloride
0.120 Liquid in HDPE Drums
21. Trimethyl amine hydrochloride 0.650 Liquid in HDPE Drums
22. 4- DMAP 0.05 Liquid in HDPE Drums
23. Ammonia solution 0.05 Liquid in HDPE Drums
24. Cholormethyl Pyridine (CMP) 1.10 Liquid in HDPE Drums
25. AIBN 0.025 Liquid in HDPE Drums
26. PPN 0.50 Liquid in HDPE Drums
27. Imidazole 4.00 Liquid in HDPE Drums
28. NaCl 0.100 Solid in Plastic Bags
29. Sodium Hypochlorite 0.10 Liquid in HDPE Drums
30. MTH Acid 0.630 Liquid in HDPE Drums
31. Methanol 5.50 UG Tank
32. \ Cl 5 cylinder
33. CCMT 5 Liquid in HDPE Drums
34. MNPO 4 Solid in Plastic Bags
35. D C P(Dichloro phenol) 8.00 Liquid in HDPE Drums
36. MCA(Monochloro acitic Acid) 5.00 Solid in Bags
37. NaOH(Sodium Hydroxide) 1.40 Solid in Bags
38. HCl (Hydrochloride) 5.00 Liquid in HDPE Drums
39. Ethyl Alcohol 0.80 Liquid in HDPE Drums
40. Thiourea 0.60 Liquid in HDPE Drums
41. O-Xylene 5.00 MS Tank
42. Tert butylamine 0.30 Liquid in HDPE Drums
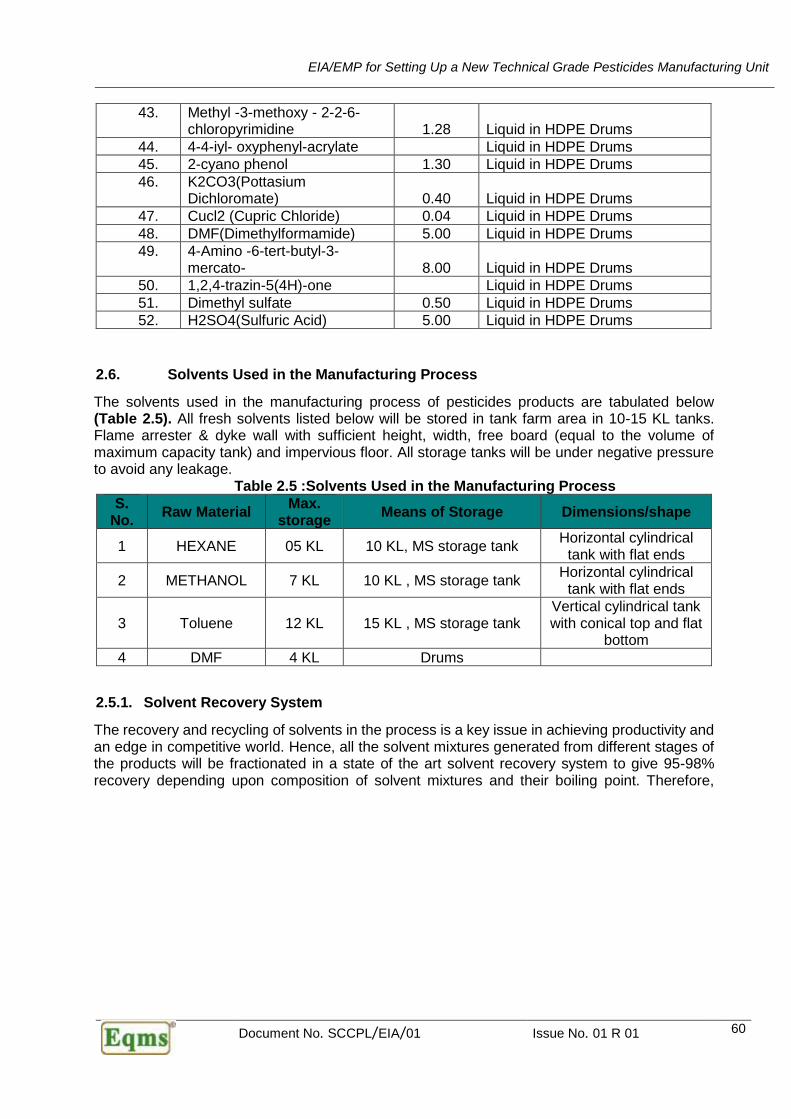
EIA/EMP for Setting Up a New Technical Grade Pesticides Manufacturing Unit
Document No. SCCPL/EIA/01 Issue No. 01 R 01 60
43. Methyl -3-methoxy - 2-2-6-chloropyrimidine 1.28 Liquid in HDPE Drums
44. 4-4-iyl- oxyphenyl-acrylate Liquid in HDPE Drums
45. 2-cyano phenol 1.30 Liquid in HDPE Drums
46. K2CO3(Pottasium Dichloromate) 0.40 Liquid in HDPE Drums
47. Cucl2 (Cupric Chloride) 0.04 Liquid in HDPE Drums
48. DMF(Dimethylformamide) 5.00 Liquid in HDPE Drums
49. 4-Amino -6-tert-butyl-3-mercato- 8.00 Liquid in HDPE Drums
50. 1,2,4-trazin-5(4H)-one Liquid in HDPE Drums
51. Dimethyl sulfate 0.50 Liquid in HDPE Drums
52. H2SO4(Sulfuric Acid) 5.00 Liquid in HDPE Drums
2.6. Solvents Used in the Manufacturing Process
The solvents used in the manufacturing process of pesticides products are tabulated below (Table 2.5). All fresh solvents listed below will be stored in tank farm area in 10-15 KL tanks. Flame arrester & dyke wall with sufficient height, width, free board (equal to the volume of maximum capacity tank) and impervious floor. All storage tanks will be under negative pressure to avoid any leakage.
Table 2.5 :Solvents Used in the Manufacturing Process
S. No.
Raw Material Max.
storage Means of Storage Dimensions/shape
1 HEXANE 05 KL 10 KL, MS storage tank Horizontal cylindrical
tank with flat ends
2 METHANOL 7 KL 10 KL , MS storage tank Horizontal cylindrical
tank with flat ends
3 Toluene 12 KL 15 KL , MS storage tank Vertical cylindrical tank with conical top and flat
bottom
4 DMF 4 KL Drums
2.5.1. Solvent Recovery System
The recovery and recycling of solvents in the process is a key issue in achieving productivity and an edge in competitive world. Hence, all the solvent mixtures generated from different stages of the products will be fractionated in a state of the art solvent recovery system to give 95-98% recovery depending upon composition of solvent mixtures and their boiling point. Therefore,
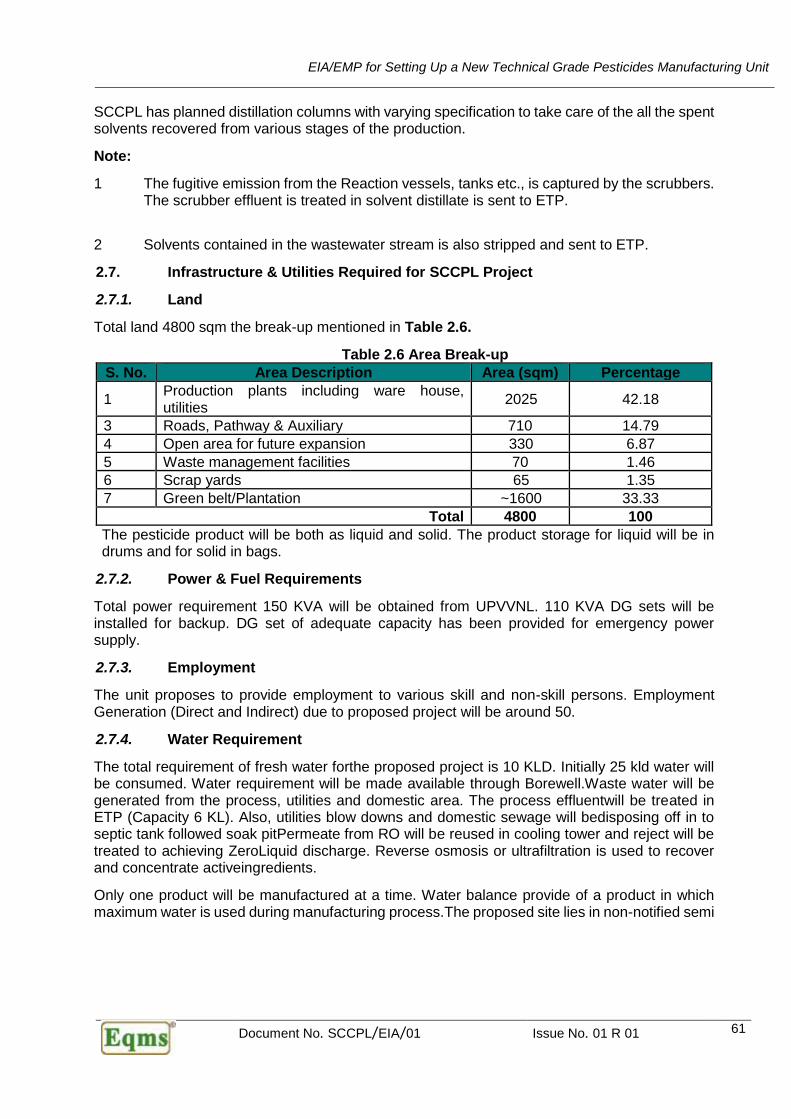
EIA/EMP for Setting Up a New Technical Grade Pesticides Manufacturing Unit
Document No. SCCPL/EIA/01 Issue No. 01 R 01 61
SCCPL has planned distillation columns with varying specification to take care of the all the spent solvents recovered from various stages of the production.
Note:
1 The fugitive emission from the Reaction vessels, tanks etc., is captured by the scrubbers. The scrubber effluent is treated in solvent distillate is sent to ETP.
2 Solvents contained in the wastewater stream is also stripped and sent to ETP.
2.7. Infrastructure & Utilities Required for SCCPL Project
2.7.1. Land
Total land 4800 sqm the break-up mentioned in Table 2.6.
Table 2.6 Area Break-up
S. No. Area Description Area (sqm) Percentage
1 Production plants including ware house, utilities
2025 42.18
3 Roads, Pathway & Auxiliary 710 14.79
4 Open area for future expansion 330 6.87
5 Waste management facilities 70 1.46
6 Scrap yards 65 1.35
7 Green belt/Plantation ~1600 33.33
Total 4800 100
The pesticide product will be both as liquid and solid. The product storage for liquid will be in drums and for solid in bags.
2.7.2. Power & Fuel Requirements
Total power requirement 150 KVA will be obtained from UPVVNL. 110 KVA DG sets will be installed for backup. DG set of adequate capacity has been provided for emergency power supply.
2.7.3. Employment
The unit proposes to provide employment to various skill and non-skill persons. Employment Generation (Direct and Indirect) due to proposed project will be around 50.
2.7.4. Water Requirement
The total requirement of fresh water forthe proposed project is 10 KLD. Initially 25 kld water will be consumed. Water requirement will be made available through Borewell.Waste water will be generated from the process, utilities and domestic area. The process effluentwill be treated in ETP (Capacity 6 KL). Also, utilities blow downs and domestic sewage will bedisposing off in to septic tank followed soak pitPermeate from RO will be reused in cooling tower and reject will be treated to achieving ZeroLiquid discharge. Reverse osmosis or ultrafiltration is used to recover and concentrate activeingredients.
Only one product will be manufactured at a time. Water balance provide of a product in which maximum water is used during manufacturing process.The proposed site lies in non-notified semi

EIA/EMP for Setting Up a New Technical Grade Pesticides Manufacturing Unit
Document No. SCCPL/EIA/01 Issue No. 01 R 01 62
critical area. The source of water for the proposed project will be meeting through Bore-well. The water balance given in Figure 2.3.
Total Water requirement – 10 KLD
Recycled water- 04 KLD
Figure 2.12 : Water Balance
2.7.5. Cooling Water System
Induced type Cooling Tower of adequate capacity for the process cooling shall be provided. Make up water to CT (2kld fresh + 2 kld recycle water).
2.7.6. Boiler
One MT Boiler is installed for process steam generation. Renewable source of energy is used as fuel (briquettes or LDO in its absence) in Boiler.
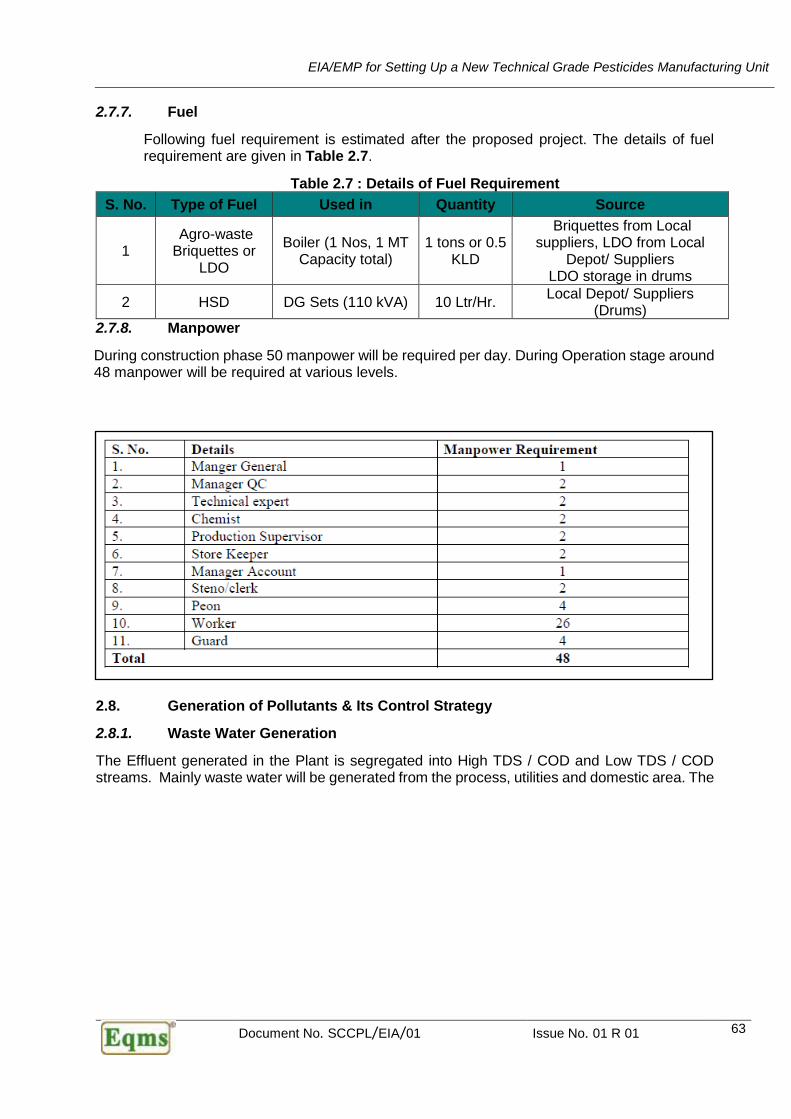
EIA/EMP for Setting Up a New Technical Grade Pesticides Manufacturing Unit
Document No. SCCPL/EIA/01 Issue No. 01 R 01 63
2.7.7. Fuel
Following fuel requirement is estimated after the proposed project. The details of fuel requirement are given in Table 2.7.
Table 2.7 : Details of Fuel Requirement
S. No. Type of Fuel Used in Quantity Source
1 Agro-waste Briquettes or
LDO
Boiler (1 Nos, 1 MT Capacity total)
1 tons or 0.5 KLD
Briquettes from Local suppliers, LDO from Local
Depot/ Suppliers LDO storage in drums
2 HSD DG Sets (110 kVA) 10 Ltr/Hr. Local Depot/ Suppliers
(Drums)
2.7.8. Manpower
During construction phase 50 manpower will be required per day. During Operation stage around 48 manpower will be required at various levels.
2.8. Generation of Pollutants & Its Control Strategy
2.8.1. Waste Water Generation
The Effluent generated in the Plant is segregated into High TDS / COD and Low TDS / COD streams. Mainly waste water will be generated from the process, utilities and domestic area. The

EIA/EMP for Setting Up a New Technical Grade Pesticides Manufacturing Unit
Document No. SCCPL/EIA/01 Issue No. 01 R 01 64
process effluent will be treated in ETP (Capacity 6 KL) and domestic sewage will be disposing off in to septic tank followed soak pit.
Table 2.8 : Details of Water Usage and Waste Water Generation
S. No. Area of Consumption Fresh Water
Quantity, KLD
Water Recycled,
KLD
Waste Water Generation,
KLD
Remarks
1 PROCESS 4.25 ---- 2.5 To ETP
2 Domestic 0.75 -- 0.25 To soak pit via septic tank
3 Green belt 2.0 2.0 -- --
4 Boiler 2
0.75 Blow down ETP
5 Cooling Tower --- 2.0 0.75 To ETP
7 Floor Washing 1.0 0.8 To ETP
TOTAL 10 4.0 4.8 Total 4.8 KLD to be treated in ETP
in which 4 KLD waterwill be recycled in process.
Liquid Effluent Management
2.8.2. Effluent Treatment Facility
ETP consisting of primary, secondary and tertiary treatment facility to effluent to be generated. Detail of the ETP plant is as below:
First all biodegradable streams (Stream II) of wastewater (low TDS) shall passed through Screen
Chamber where Then effluent shall be collected in Collection tank. Pipe grid is provided at bottom
of the tank to keep all suspended solids in suspension and to provide proper mixing. 2 nos. of Air
Blowers (1 stand‐by) shall supply air through diffusers to pipe grid.
All biodegradable streams (Stream I) with high TDS shall be collected in Collection Tank. Pipe
grid is provided at bottom of the tank to keep all suspended solids in suspension and to provide
proper mixing. 2 nos. of Air Blowers (1 standby) shall supply air through diffusers to pipe grid.
Then effluent will be sent for further treatment. Then after, equalized wastewater shall be pumped
to Neutralization Tank where the continuous addition and stirring of lime solution is done to
maintain the pH of wastewater from Lime Dosing Tanks as per requirement by gravity. Then after,
neutralized wastewater shall go to Flash Mixer by gravity. Alum and Polyelectrolyte shall be dosed
to carry out coagulation by using a Flash Mixer.
Then after, coagulated wastewater shall be settled in Primary Clarifier. Clear supernatant from
Primary Clarifier shall be passed in Aeration Tank‐1. Here, biodegradation of organic matter of
the wastewater shall be carried out by bacteria (suspended growth) in the AT‐1 and for that
oxygen shall be supplied by 2 nos. of air blowers through diffusers. Air blowers also keep MLSS
in suspension.
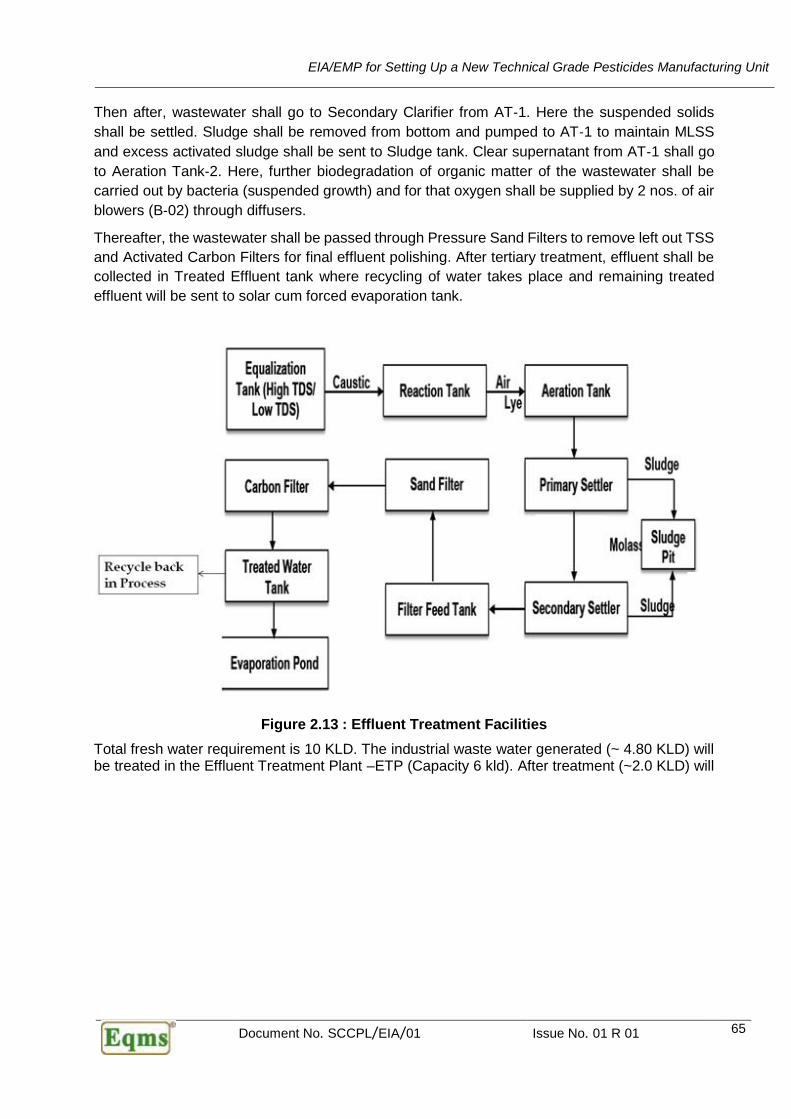
EIA/EMP for Setting Up a New Technical Grade Pesticides Manufacturing Unit
Document No. SCCPL/EIA/01 Issue No. 01 R 01 65
Then after, wastewater shall go to Secondary Clarifier from AT‐1. Here the suspended solids
shall be settled. Sludge shall be removed from bottom and pumped to AT‐1 to maintain MLSS
and excess activated sludge shall be sent to Sludge tank. Clear supernatant from AT‐1 shall go
to Aeration Tank‐2. Here, further biodegradation of organic matter of the wastewater shall be
carried out by bacteria (suspended growth) and for that oxygen shall be supplied by 2 nos. of air
blowers (B‐02) through diffusers.
Thereafter, the wastewater shall be passed through Pressure Sand Filters to remove left out TSS
and Activated Carbon Filters for final effluent polishing. After tertiary treatment, effluent shall be
collected in Treated Effluent tank where recycling of water takes place and remaining treated
effluent will be sent to solar cum forced evaporation tank.
Figure 2.13 : Effluent Treatment Facilities
Total fresh water requirement is 10 KLD. The industrial waste water generated (~ 4.80 KLD) will be treated in the Effluent Treatment Plant –ETP (Capacity 6 kld). After treatment (~2.0 KLD) will
EIA/EMP for Setting Up a New Technical Grade Pesticides Manufacturing Unit
Document No. SCCPL/EIA/01 Issue No. 01 R 01 66
be recycled back in the cooling tower and 2 kld will be used in Green Belt development. The domesticwaste water will be sent to soak pit via septic tank.
2.8.3. Air Pollution Control System
Air Pollution Control Systems with Stack Details
• Gaseous emission from fuel burning, consist of common pollutants like SO2, NO2, and PM would be discharged into atmosphere through Stack of suitable height.
• Green belt will be developed covering >33% of the total project area, around the plant boundary as dust preventive barrier.
• Odour Control System: All the vents of the batch tanks and solvents are connected to scrubber to absorb any pollutant / odour producing gases and chemicals. Green belt around the plant boundary will absorb the odour to some extent.
• The operation of centrifuging/ filter will be done in closed equipment to avoid any vapours coming out in the local atmosphere. The vents of centrifuges / filters will be connected to scrubbers.
• The drying of the product is done in a closed type continuous Fluidized Bed dryer/ Nudge filter to avoid the exposure of any chemicals to human being.
• Volatile organic solvents are carefully handled in a closed system, thereby preventing any discharge of these chemicals into the air.
Odour Control Measures
Adequate systems shall be provided to capture the odour /emissions from process plants & maintain the emission quality as per recommended guidelines with central scrubber having caustic solution, before venting it in to the atmosphere.
All liquid raw materials and intermediates are charged into Reactors with pumps or under gravity through closed pipes to prevent emission.
• All vents of holding tanks and dosing vessels are connected to a Vent Scrubber system comprising of a suction Blower, Scrubbing system.
• Suction Hoods are placed near the Man-holes & Charging funnels of Reactors & Filters so that chemical vapours and dust do not escape into the Plant & surroundings, when the man-hole covers are opened for inspection or charging of RM.
• All storage tanks of low boiling solvents / chemical are provided with Conservation Vents.
• Vents of HCl storage tanks are provided with a Water filled trap to prevent Acid fumes from escaping out.
• All pumps handling hazardous chemicals are provided with mechanical seals to prevent fugitive emission. Wherever possible magnetic coupled pumps will be used.
• Any spillage from drums etc. will be absorbed with saw dust / soda ash and moped clean. The contaminated absorbent will be safely disposed off along with hazardous waste.
Fuel combustion: The fuel combustion is from DG sets, boiler (Briquettes/ LDO/HSD fired). By controlling optimum conditions and in built internal cyclones and bag filters and
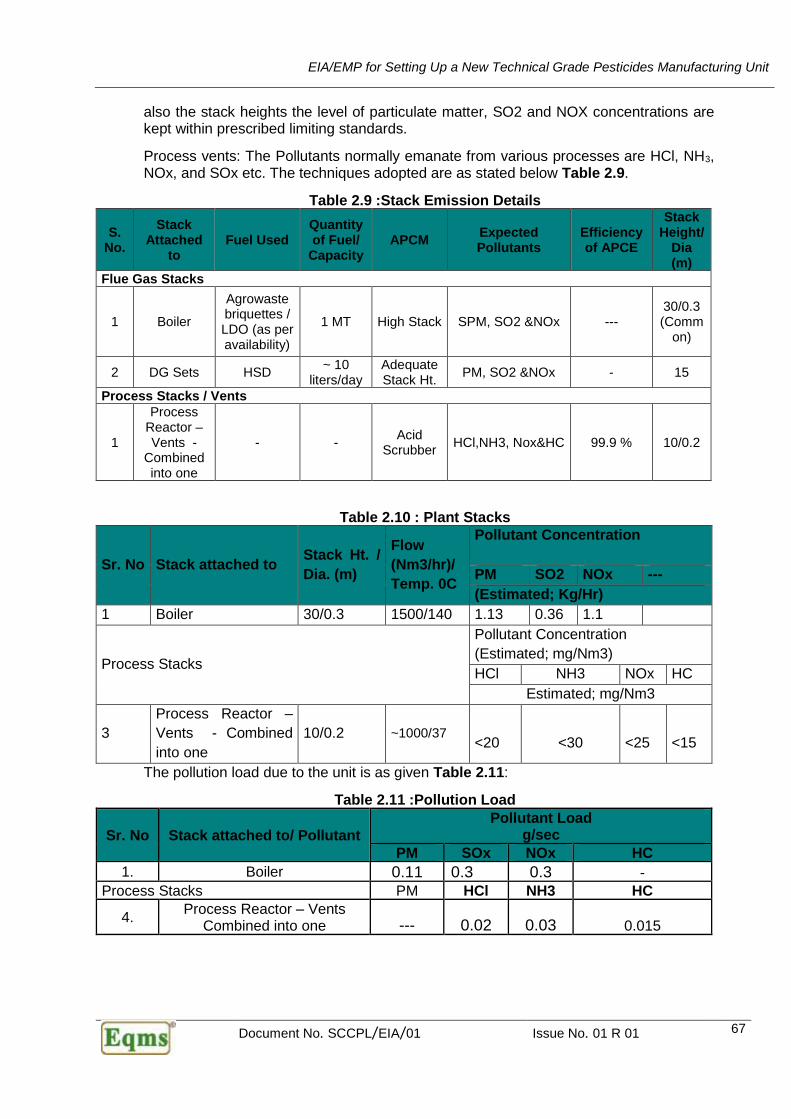
EIA/EMP for Setting Up a New Technical Grade Pesticides Manufacturing Unit
Document No. SCCPL/EIA/01 Issue No. 01 R 01 67
also the stack heights the level of particulate matter, SO2 and NOX concentrations are kept within prescribed limiting standards.
Process vents: The Pollutants normally emanate from various processes are HCl, NH3, NOx, and SOx etc. The techniques adopted are as stated below Table 2.9.
Table 2.9 :Stack Emission Details
S. No.
Stack Attached
to Fuel Used
Quantity of Fuel/
Capacity APCM
Expected Pollutants
Efficiency of APCE
Stack Height/
Dia (m)
Flue Gas Stacks
1 Boiler
Agrowaste briquettes / LDO (as per availability)
1 MT High Stack SPM, SO2 &NOx --- 30/0.3 (Comm
on)
2 DG Sets HSD ~ 10
liters/day Adequate Stack Ht.
PM, SO2 &NOx - 15
Process Stacks / Vents
1
Process Reactor – Vents -
Combined into one
- - Acid
Scrubber HCl,NH3, Nox&HC 99.9 % 10/0.2
Table 2.10 : Plant Stacks
Sr. No Stack attached to Stack Ht. /
Dia. (m)
Flow
(Nm3/hr)/
Temp. 0C
Pollutant Concentration
PM SO2 NOx ---
(Estimated; Kg/Hr)
1 Boiler 30/0.3 1500/140 1.13 0.36 1.1
Process Stacks
Pollutant Concentration
(Estimated; mg/Nm3)
HCl NH3 NOx HC
Estimated; mg/Nm3
3
Process Reactor –
Vents - Combined
into one
10/0.2 ~1000/37
<20
<30
<25
<15
The pollution load due to the unit is as given Table 2.11:
Table 2.11 :Pollution Load
Sr. No Stack attached to/ Pollutant
Pollutant Load g/sec
PM SOx NOx HC
1. Boiler 0.11 0.3 0.3 -
Process Stacks PM HCl NH3 HC
4. Process Reactor – Vents
Combined into one --- 0.02 0.03
0.015
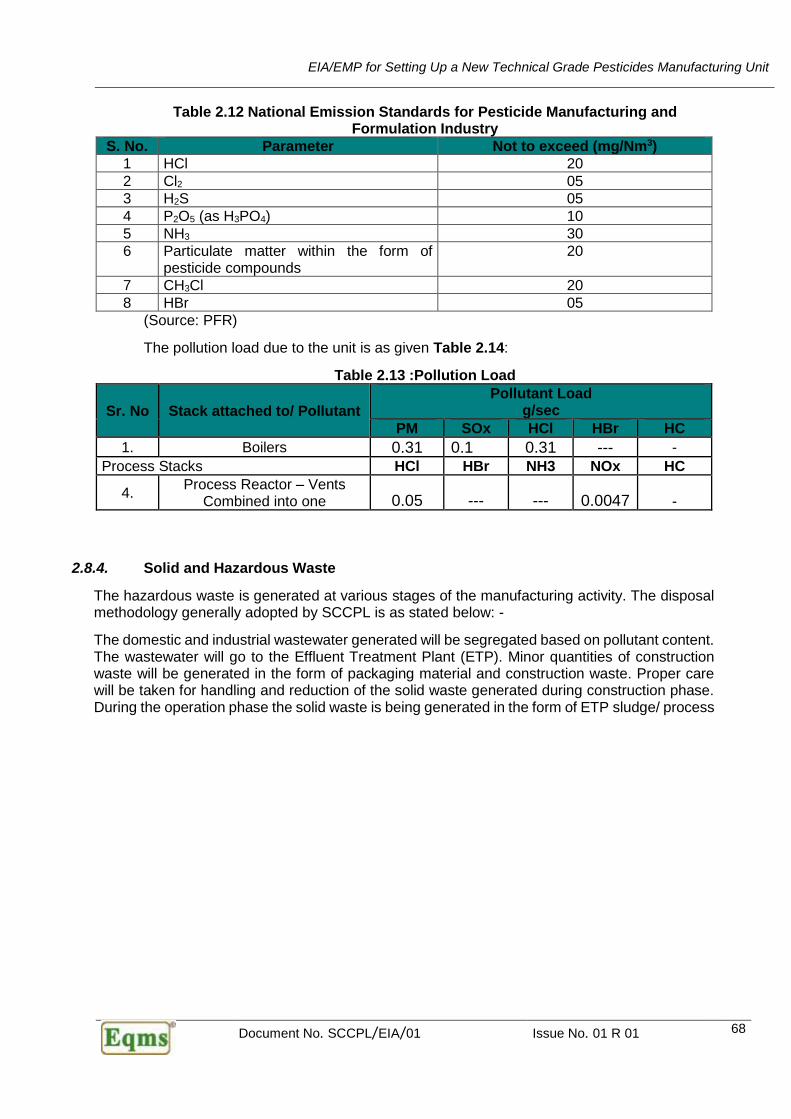
EIA/EMP for Setting Up a New Technical Grade Pesticides Manufacturing Unit
Document No. SCCPL/EIA/01 Issue No. 01 R 01 68
Table 2.12 National Emission Standards for Pesticide Manufacturing and Formulation Industry
S. No. Parameter Not to exceed (mg/Nm3)
1 HCl 20
2 Cl2 05
3 H2S 05
4 P2O5 (as H3PO4) 10
5 NH3 30
6 Particulate matter within the form of pesticide compounds
20
7 CH3Cl 20
8 HBr 05
(Source: PFR)
The pollution load due to the unit is as given Table 2.14:
Table 2.13 :Pollution Load
Sr. No Stack attached to/ Pollutant
Pollutant Load g/sec
PM SOx HCl HBr HC
1. Boilers 0.31 0.1 0.31 --- -
Process Stacks HCl HBr NH3 NOx HC
4. Process Reactor – Vents
Combined into one 0.05 --- --- 0.0047 -
2.8.4. Solid and Hazardous Waste
The hazardous waste is generated at various stages of the manufacturing activity. The disposal methodology generally adopted by SCCPL is as stated below: -
The domestic and industrial wastewater generated will be segregated based on pollutant content. The wastewater will go to the Effluent Treatment Plant (ETP). Minor quantities of construction waste will be generated in the form of packaging material and construction waste. Proper care will be taken for handling and reduction of the solid waste generated during construction phase. During the operation phase the solid waste is being generated in the form of ETP sludge/ process
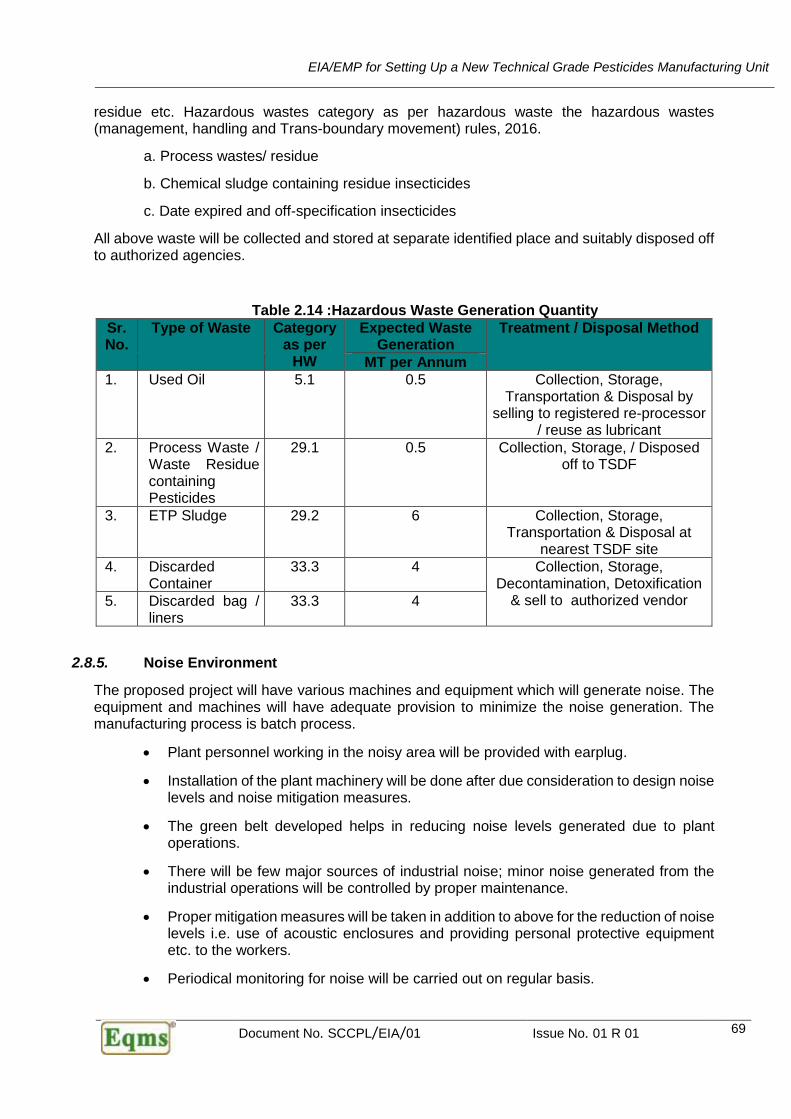
EIA/EMP for Setting Up a New Technical Grade Pesticides Manufacturing Unit
Document No. SCCPL/EIA/01 Issue No. 01 R 01 69
residue etc. Hazardous wastes category as per hazardous waste the hazardous wastes (management, handling and Trans-boundary movement) rules, 2016.
a. Process wastes/ residue
b. Chemical sludge containing residue insecticides
c. Date expired and off-specification insecticides
All above waste will be collected and stored at separate identified place and suitably disposed off to authorized agencies.
Table 2.14 :Hazardous Waste Generation Quantity
Sr. No.
Type of Waste Category as per
HW
Expected Waste Generation
Treatment / Disposal Method
MT per Annum
1. Used Oil 5.1 0.5 Collection, Storage, Transportation & Disposal by
selling to registered re-processor / reuse as lubricant
2. Process Waste / Waste Residue containing Pesticides
29.1 0.5 Collection, Storage, / Disposed off to TSDF
3. ETP Sludge 29.2 6 Collection, Storage, Transportation & Disposal at
nearest TSDF site
4. Discarded Container
33.3 4 Collection, Storage, Decontamination, Detoxification
& sell to authorized vendor 5. Discarded bag / liners
33.3 4
2.8.5. Noise Environment
The proposed project will have various machines and equipment which will generate noise. The equipment and machines will have adequate provision to minimize the noise generation. The manufacturing process is batch process.
• Plant personnel working in the noisy area will be provided with earplug.
• Installation of the plant machinery will be done after due consideration to design noise levels and noise mitigation measures.
• The green belt developed helps in reducing noise levels generated due to plant operations.
• There will be few major sources of industrial noise; minor noise generated from the industrial operations will be controlled by proper maintenance.
• Proper mitigation measures will be taken in addition to above for the reduction of noise levels i.e. use of acoustic enclosures and providing personal protective equipment etc. to the workers.
• Periodical monitoring for noise will be carried out on regular basis.

EIA/EMP for Setting Up a New Technical Grade Pesticides Manufacturing Unit
Document No. SCCPL/EIA/01 Issue No. 01 R 01 70
• Proper maintenance, oiling and greasing of machines at regular intervals is done to minimize generation of noise at source.
• The D.G. sets will be provided with acoustic enclosures.
2.8.6. Green Belt Development
The site has existing tree plantation on periphery of the plant and along the roads. It will ensure the greenbelt to the extent of 33% of the plot area
2.9. Project Cost:
Total Project cost including Environmental controlling equipment is Rs. 5 crores
2.10. Proposed CSR activities and budget
CSR Plan :SCCPL has allocated Rs 5 Lacs per year towards CSR plan. The above amount will be spend in next 5 years for infrastructure development of surrounding area. Need based survey have been conducted in surrounding villages of the study area. Based on the analysis, the fund has been proportioned given in Table 2.15.
Table 2.15 :Proposed CSR Activities & Annual Allocation of Fund
S. No.
Description of Items Cost (Rs. Lakhs)
1 Development of drainage system in surrounding villages, making new hand pumps (deep tube wells) creating awareness about clean water, clean habits and health
1
2 Social Forestry program & tree plantation outside the plant premises. 0.50
3 Infrastructure Development in surrounding villages (Parks and Gardens, Community Hall, Village Roads, PanchayatBlawan, Anganwadi, Old age home)
1
4 Cleaning of ponds, maintaining village roads, providing street lighting etc.
0.50
5 Periodic Medical Assistance to people of surrounding villages (Free health check-up (routine) and distribution of free medicines (to poor people)
0.50
6 Contribution to village schools (Primary to Higher Secondary level) in each cluster of villages, providing school bags, uniform, tiffin, shoes and socks, books and study materials, teaching aids, furniture and blackboard, toilets and playground.
0.50
7 Rain water harvesting structure in and around plant area 1.0
Total 5
The CSR Cell shall implement the CSR Plan by making a Consultative Committee comprising
the Village Elders, Tribal Leaders, Panchayat Members and Block Development. Annual Audit of
the CSR spending shall be done.

EIA/EMP for Setting Up a New Technical Grade Pesticides Manufacturing Unit
Document No. SCCPL/EIA/01 Issue No. 01 R 01 71
CHAPTER 3. : DESCRIPTION OF THE ENVIRONMENT
3.1 Background and Salient Environmental Features of the Study Area
Generation of environmental baseline of a project area is an important phase of any
Environmental Assessment process. Baseline data provide vital information on the existing
environmental quality in which a development is planned. It is also useful for delineating
environmental sensitive areas and for preparing an Environmental Sensitivity Map for
contingency planning. In this study, the environmental characteristics of the project area (10 km
study area) were established through extensive literature search, field sampling/measurements,
laboratory analysis, consultation and data interpretation.
Secondary data from literature search were also obtained from the Govt. sources i.e.
Meteorological Department, CPCB publications; Forest Department and other Govt. Sources.
The baseline environmental data generation has been done for the period of 15th March 2017 to
15th Jun 2017. M/s JP Test & Research Centre, Sahibabad, Uttar Pradesh with EQMS Team,
carried out sampling and testing. The study area within a 10 km radius around the proposed plant
site has been considered as impact zone for EIA study. Primary and secondary data has been
collected for 10 Km radius of the project site.
3.1.1 Environmental Setting and Salient Environmental Features of the Project Area
The proposed project is a Greenfield project consisting of manufacturing Unit of technical grade
pesticides at HD- 20, 21, 22 and HE 27,28,29 & 30 UPSIDC Industrial Area, Sikandrabad,
District Bulandshhar, Uttar Pradesh-203205. As per the EIA notification dated 14th September,
2006, as amended till date, the proposed project falls under category 5(b), Pesticides Industry
and Pesticide Specific Intermediates of Activity: Manufacturing Process, which shall be treated
as Category “A”. The registered office of which is situated in Sikandrabad, District Bulandshahr –
203205. The proposed project is for development of project area of 4800 m2. The coordinates of
the project site are 28°29'0.15"N and 77°39'12.02"E. map showing corner coordinates of the
Project site is provided in Figure 3.1.
This Chapter describes the baseline environmental conditions around the Samridhhi Crop
Chemicals Pvt Ltd (SCCPL), HD- 20,21 & 22 and HE 27,28,29 & 30 UPSIDC Industrial Area,
Sikandrabad, District. Bulandshhar, Uttar Pradesh-203205, Project site for various
environmental attributes, i.e. physical, biological and socio-economic conditions, within the
10 km radial zone of the proposed project site, which is termed as the study area.
Topography, drainage, meteorology, air, noise, water, soil and land constitute the physical
environment, where as flora and fauna constitute the biological environment. Demographic
details and occupational pattern in the study area constitute socio-economic environment.

EIA/EMP for Setting Up a New Technical Grade Pesticides Manufacturing Unit
Document No. SCCPL/EIA/01 Issue No. 01 R 01 72
Proposed site is well connected to National Highway-91 (Ghaziabad to Kanpur Highway) which
is passing about 300 m south of the project site. Nearest railway station is Ajayabpur railway
station located about 5.8 km from site in south east direction. Nearest airport is IGI airport Delhi
located about 87 km away. The site is located in an industrial area connected with NH-91 with
internal roads of the industrial area. the rail and road connectivity map of the site is provided in
Figure 3.2.
Nearest settlement to the site are Gopalpur 0.7 km N, Rajarampur 1.0 km E, Jokhabad 1.4 km
S, Vishanpur 1.5 km NE and Nagla Chamroo 2.0 km NW. nearest town is Sikandrabad town
which is located about 5.0 km from site in SE direction.
Upper Ganga canal and its distributaries are the main surface water bodies located within the
study area. Upper Ganga canal is flowing about 8.1 km northeast of the site. the other distribatries
present in the study area are Sikandrabad distributary, Barauda distributary, main Kalda
distributary and other branch distributaries. There is no river present within the study area.
Figure 3.1 Road Connectivity Map
There are no areas protected under international conventions, national or local legislation for
their ecological, landscape, cultural or other related value. There is no national park, wildlife
sanctuary, biosphere reserve and wetland is present within the study area. There is no Reserve
and protected forests are present within 10 km area of the site.
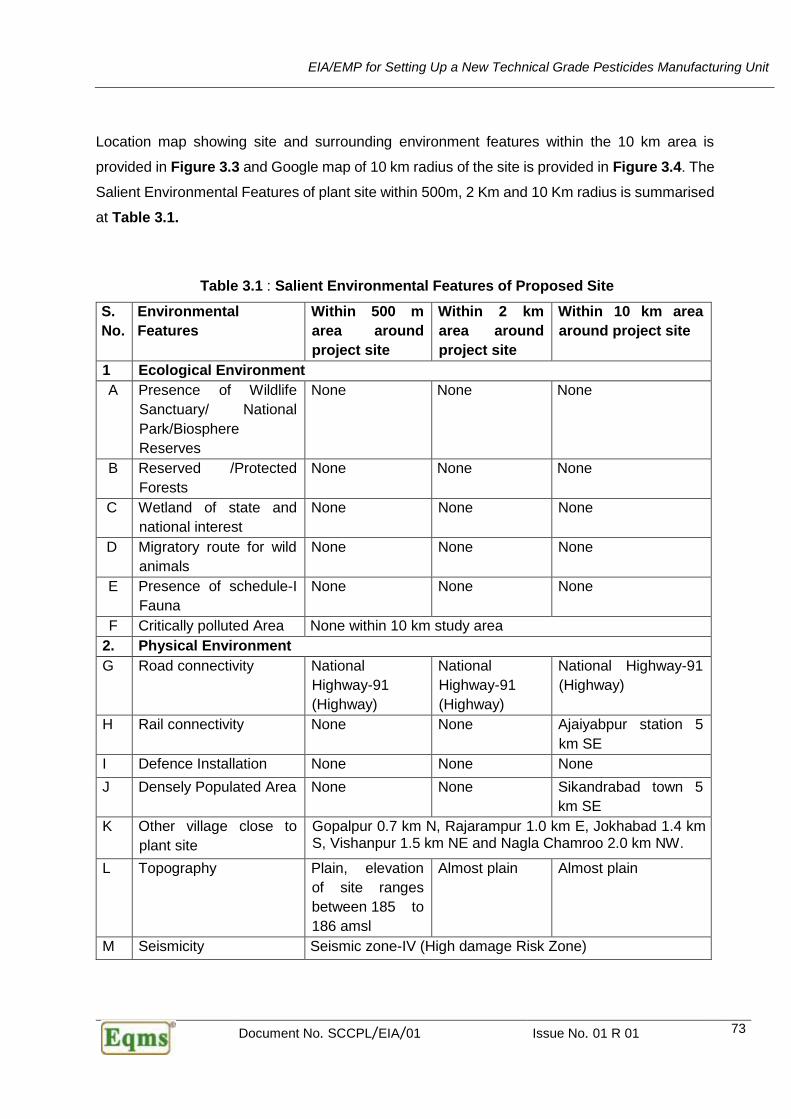
EIA/EMP for Setting Up a New Technical Grade Pesticides Manufacturing Unit
Document No. SCCPL/EIA/01 Issue No. 01 R 01 73
Location map showing site and surrounding environment features within the 10 km area is
provided in Figure 3.3 and Google map of 10 km radius of the site is provided in Figure 3.4. The
Salient Environmental Features of plant site within 500m, 2 Km and 10 Km radius is summarised
at Table 3.1.
Table 3.1 : Salient Environmental Features of Proposed Site
S.
No.
Environmental
Features
Within 500 m
area around
project site
Within 2 km
area around
project site
Within 10 km area
around project site
1 Ecological Environment
A Presence of Wildlife
Sanctuary/ National
Park/Biosphere
Reserves
None None None
B Reserved /Protected
Forests
None None None
C Wetland of state and
national interest
None None None
D Migratory route for wild
animals
None None None
E Presence of schedule-I
Fauna
None None None
F Critically polluted Area None within 10 km study area
2. Physical Environment
G Road connectivity National
Highway-91
(Highway)
National
Highway-91
(Highway)
National Highway-91
(Highway)
H Rail connectivity None None Ajaiyabpur station 5
km SE
I Defence Installation None None None
J Densely Populated Area None None Sikandrabad town 5
km SE
K Other village close to
plant site
Gopalpur 0.7 km N, Rajarampur 1.0 km E, Jokhabad 1.4 km S, Vishanpur 1.5 km NE and Nagla Chamroo 2.0 km NW.
L Topography Plain, elevation
of site ranges
between 185 to
186 amsl
Almost plain Almost plain
M Seismicity Seismic zone-IV (High damage Risk Zone)
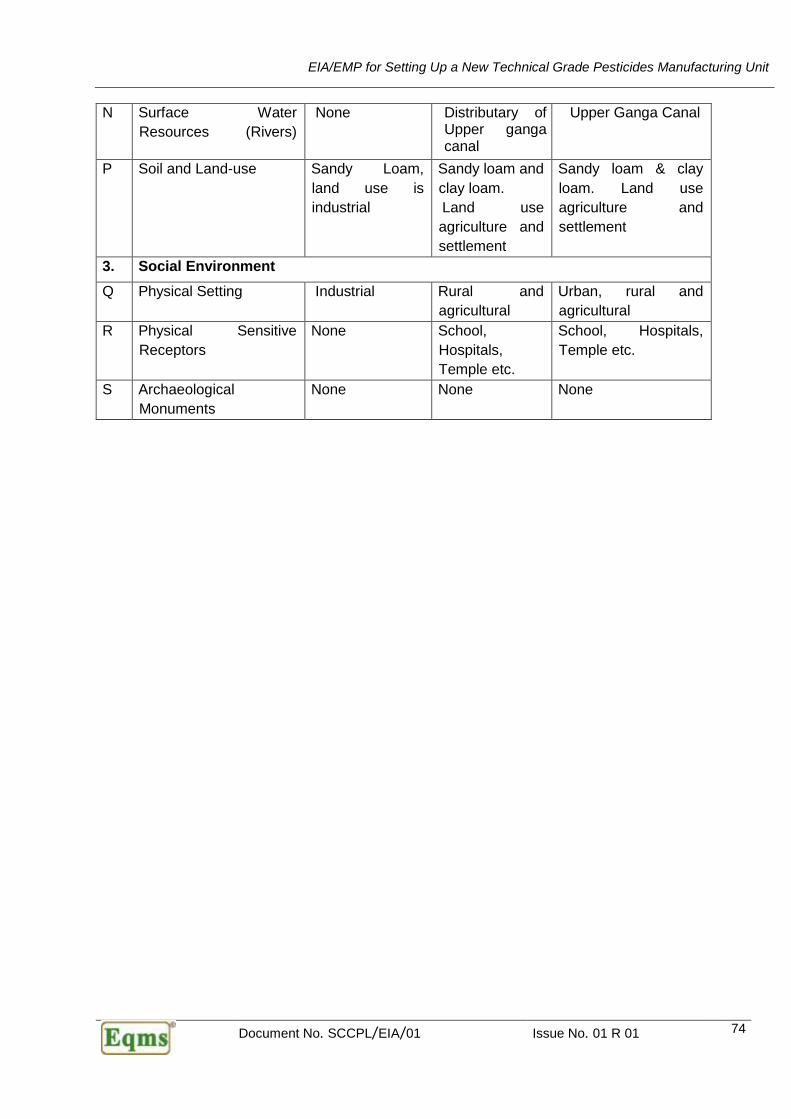
EIA/EMP for Setting Up a New Technical Grade Pesticides Manufacturing Unit
Document No. SCCPL/EIA/01 Issue No. 01 R 01 74
N Surface Water
Resources (Rivers)
None Distributary of Upper ganga canal
Upper Ganga Canal
P Soil and Land-use Sandy Loam,
land use is
industrial
Sandy loam and
clay loam.
Land use
agriculture and
settlement
Sandy loam & clay
loam. Land use
agriculture and
settlement
3. Social Environment
Q Physical Setting Industrial Rural and
agricultural
Urban, rural and
agricultural
R Physical Sensitive
Receptors
None School,
Hospitals,
Temple etc.
School, Hospitals,
Temple etc.
S Archaeological
Monuments
None None None

EIA/EMP for Setting Up a New Technical Grade Pesticides Manufacturing Unit
Document No. SCCPL/EIA/01 Issue No. 01 R 01 75
Figure 3.2 Location Map of Study area
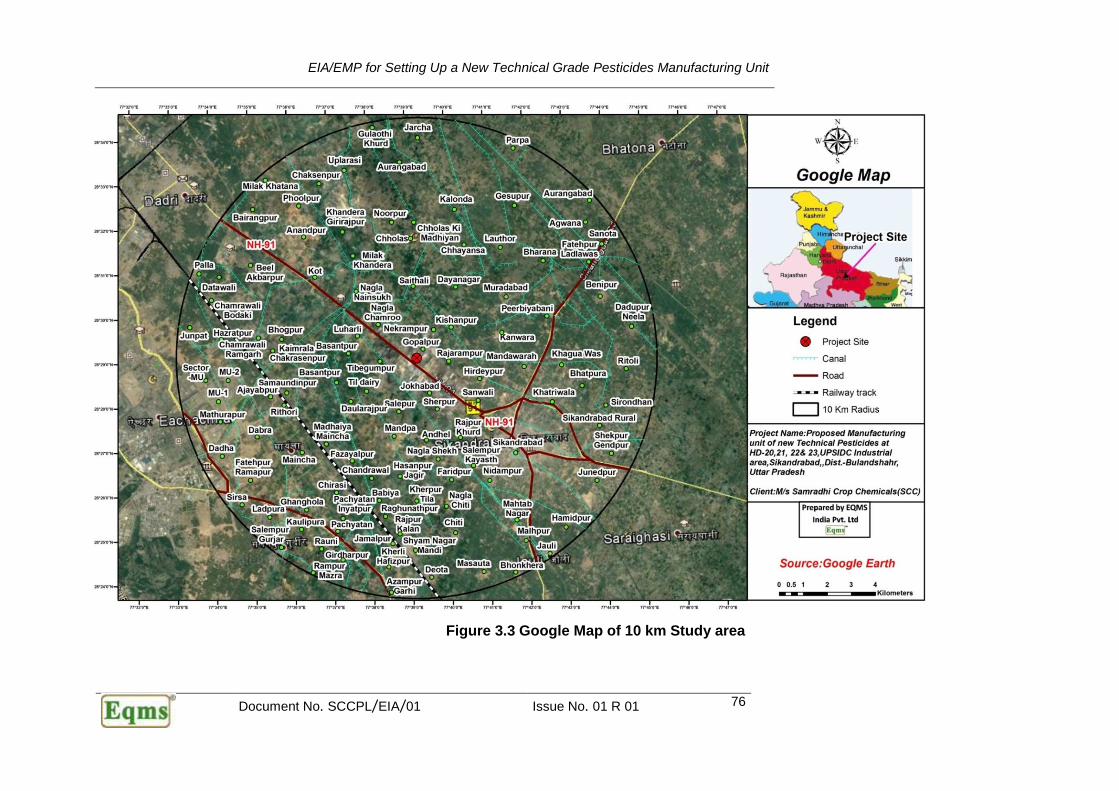
EIA/EMP for Setting Up a New Technical Grade Pesticides Manufacturing Unit
Document No. SCCPL/EIA/01 Issue No. 01 R 01 76
Figure 3.3 Google Map of 10 km Study area
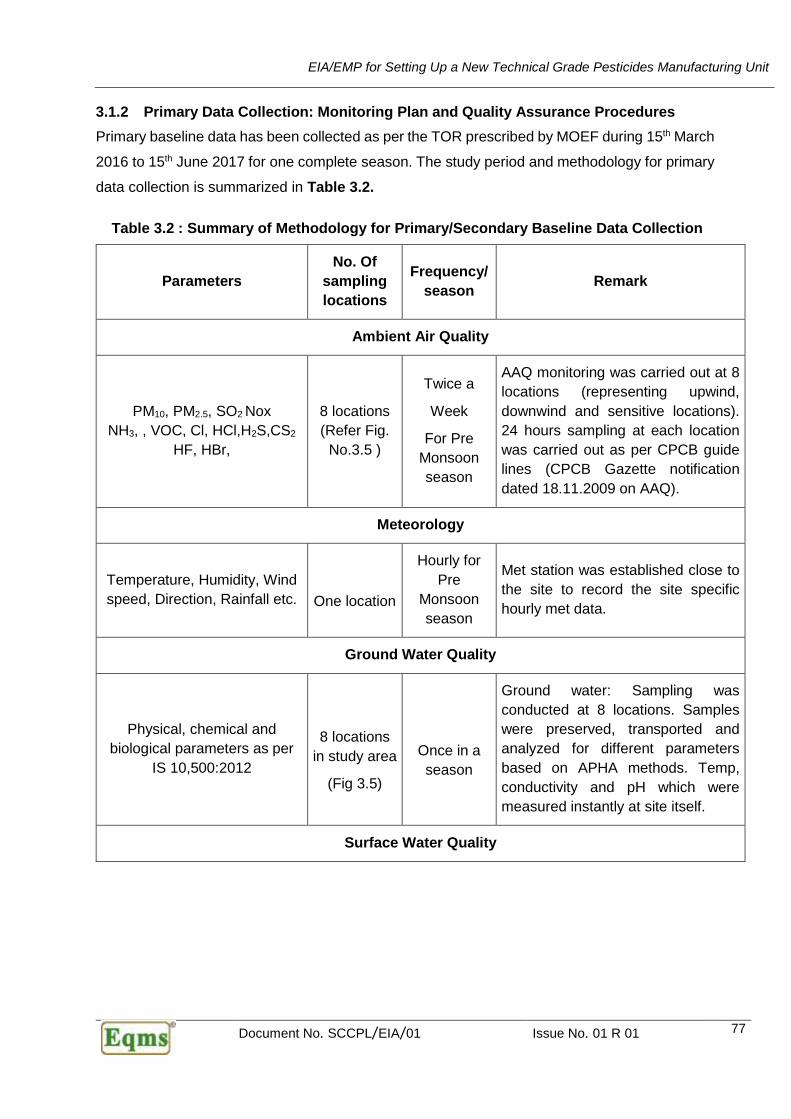
EIA/EMP for Setting Up a New Technical Grade Pesticides Manufacturing Unit
Document No. SCCPL/EIA/01 Issue No. 01 R 01 77
3.1.2 Primary Data Collection: Monitoring Plan and Quality Assurance Procedures
Primary baseline data has been collected as per the TOR prescribed by MOEF during 15th March
2016 to 15th June 2017 for one complete season. The study period and methodology for primary
data collection is summarized in Table 3.2.
Table 3.2 : Summary of Methodology for Primary/Secondary Baseline Data Collection
Parameters
No. Of
sampling
locations
Frequency/
season Remark
Ambient Air Quality
PM10, PM2.5, SO2 Nox
NH3, , VOC, Cl, HCl,H2S,CS2
HF, HBr,
8 locations
(Refer Fig.
No.3.5 )
Twice a
Week
For Pre
Monsoon
season
AAQ monitoring was carried out at 8
locations (representing upwind,
downwind and sensitive locations).
24 hours sampling at each location
was carried out as per CPCB guide
lines (CPCB Gazette notification
dated 18.11.2009 on AAQ).
Meteorology
Temperature, Humidity, Wind
speed, Direction, Rainfall etc.
One location
Hourly for
Pre
Monsoon
season
Met station was established close to
the site to record the site specific
hourly met data.
Ground Water Quality
Physical, chemical and
biological parameters as per
IS 10,500:2012
8 locations
in study area
(Fig 3.5)
Once in a
season
Ground water: Sampling was
conducted at 8 locations. Samples
were preserved, transported and
analyzed for different parameters
based on APHA methods. Temp,
conductivity and pH which were
measured instantly at site itself.
Surface Water Quality

EIA/EMP for Setting Up a New Technical Grade Pesticides Manufacturing Unit
Document No. SCCPL/EIA/01 Issue No. 01 R 01 78
Parameters
No. Of
sampling
locations
Frequency/
season Remark
Physical, chemical and
biological parameters as per
IS: 2296
two locations
in study area
(Fig 3.6)
Once in a
season
Surface Water: Sampling was
conducted at two locations. Samples
were preserved and transported for
analysis for different parameters
based on APHA methods. Temp,
conductivity, DO and pH which were
measured intantly at site itself.
Soil
Texture, bulk density, pH,
conductivity, cation exchange
capacity, organic matter, Total
N,P,K, and Heavy metals etc
6 locations
in study area
(Fig 3.5)
Once in a
season
Soil samples were collected at six
locations within the study area and
analyzed as per IARI method
Noise
Noise profiling for 24 hrs
8 locations
in study area
(Fig 3.6)
Once in
season
Noise monitoring was conducted
within the 10 km area of project site
for noise profiling for 24 hrs using
integrated sound level meter, as per
CPCB guidelines.
Ecology (Flora & Fauna)
Flora & Fauna Once Primary survey and Secondary
sources
Demography & Socio-economics
Demography & Socioeconomic - Once Primary survey/ Secondary sources
Standard methods and procedures have been strictly adhered to in the course of this study.
QA/QC procedures were strictly followed which covers all aspects of the study, and includes
sample collection, handling, laboratory analyses, data coding, statistical analyses, presentation
and communication of results. All analysis was carried out in NABL/MoEF accredited/recognized
laboratory. Environment sampling Map is provided in Figure 3.5.

EIA/EMP for Setting Up a New Technical Grade Pesticides Manufacturing Unit
Document No. SCCPL/EIA/01 Issue No. 01 R 01 79
Figure 3.4 Environment Sampling Location Map

EIA/EMP for Setting Up a New Technical Grade Pesticides Manufacturing Unit
Document No. SCCPL/EIA/01 Issue No. 01 R 01 80
3.2 Physical Environment
3.2.1 Topography
The topography of proposed site is almost plain. The site elevation ranges between 185 to 186
amsl. Topography around 10 km area of the proposed site is also flat.
3.2.2 Drainage
The Bulandshahar district falls in the doab of Ganga and Yamuna rivers (Ganga basin and
Yamuna basin). The district is drained by river Ganga, Kali nadi, Karwan nadi and Nim nadi. All
these drainages flow in SE course in their regional pattern. Ganga River – forms the eastern
boundary of the district.
There is no river or any natural stream is present within the study area. Upper Ganga Canal and
its distributaries like Sikandrabad and Barauda distributaries and other minors are the man made
stream present in the study area. The slope of the study area is towards south and south east
direction. The drainage of the study area is controlled by upper Gangs canal and its distributaries.
3.2.3 Geology & Hydrogeology
The entire study area is covered by Quaternary Alluvium. The study area part of central Ganga
Alluvium Plain and Younger Flood Plain and is Older Alluvium occupies the entire upland area
Sandy soil/sandy ridges Central upland. Alluvium deposits of Quaternary age brought by river
system of Ganga and its tributaries. The thickness of unconsolidated sediments (including
Quaternary alluvium) may range between 400 and 600 m as revealed by the study of ONGC data
and CGWB drilling records Alluvium consists of clay, silt and various grades of sand with
occasional pebbles at depths. The beds of kankar are also common. The sand is fine to medium
grained being coarser towards Ganga river. The geological succession of the district is provided
in Table3.3
Table 3.3 : Geological Succession of the District
Time Unit Rock Thickness
Recent to 0.01 my. Sand, Clay Sequence Alluvium 150
Holocene (<1 my) Sand, Clay, Pebblesetc. Lower portion of Fans -
------------------------------------DISCONFORMITY------------------------------------------
Pleistocene (1 my) Conglomerate,Sand,Sandstone Upper Siwalik Missing
Pleistocene to
Lower Miocene
Argillaceous sediments Middle to
lower Siwalik
Very thin
-------------------------------------UNCONFORMITY-------------------------------------------
Precambrian Sand, Sandstone, Shale Vindhyan
Archaean Granite
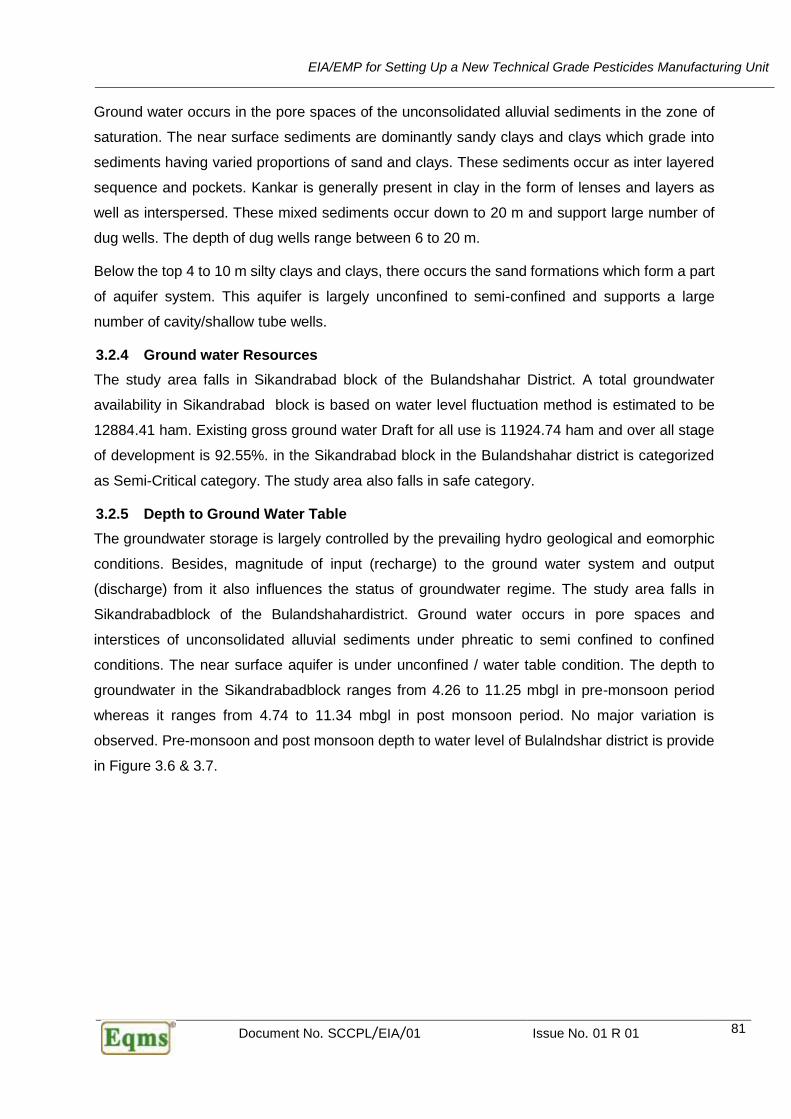
EIA/EMP for Setting Up a New Technical Grade Pesticides Manufacturing Unit
Document No. SCCPL/EIA/01 Issue No. 01 R 01 81
Ground water occurs in the pore spaces of the unconsolidated alluvial sediments in the zone of
saturation. The near surface sediments are dominantly sandy clays and clays which grade into
sediments having varied proportions of sand and clays. These sediments occur as inter layered
sequence and pockets. Kankar is generally present in clay in the form of lenses and layers as
well as interspersed. These mixed sediments occur down to 20 m and support large number of
dug wells. The depth of dug wells range between 6 to 20 m.
Below the top 4 to 10 m silty clays and clays, there occurs the sand formations which form a part
of aquifer system. This aquifer is largely unconfined to semi-confined and supports a large
number of cavity/shallow tube wells.
3.2.4 Ground water Resources
The study area falls in Sikandrabad block of the Bulandshahar District. A total groundwater
availability in Sikandrabad block is based on water level fluctuation method is estimated to be
12884.41 ham. Existing gross ground water Draft for all use is 11924.74 ham and over all stage
of development is 92.55%. in the Sikandrabad block in the Bulandshahar district is categorized
as Semi-Critical category. The study area also falls in safe category.
3.2.5 Depth to Ground Water Table
The groundwater storage is largely controlled by the prevailing hydro geological and eomorphic
conditions. Besides, magnitude of input (recharge) to the ground water system and output
(discharge) from it also influences the status of groundwater regime. The study area falls in
Sikandrabadblock of the Bulandshahardistrict. Ground water occurs in pore spaces and
interstices of unconsolidated alluvial sediments under phreatic to semi confined to confined
conditions. The near surface aquifer is under unconfined / water table condition. The depth to
groundwater in the Sikandrabadblock ranges from 4.26 to 11.25 mbgl in pre-monsoon period
whereas it ranges from 4.74 to 11.34 mbgl in post monsoon period. No major variation is
observed. Pre-monsoon and post monsoon depth to water level of Bulalndshar district is provide
in Figure 3.6 & 3.7.
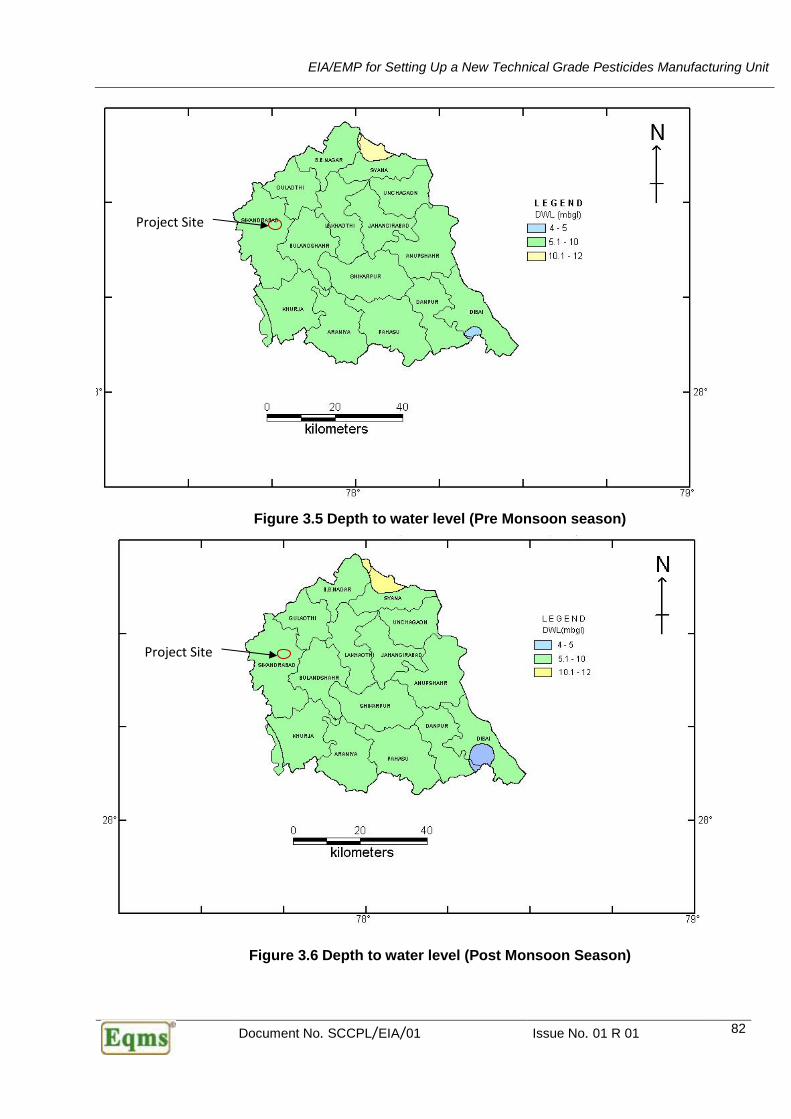
EIA/EMP for Setting Up a New Technical Grade Pesticides Manufacturing Unit
Document No. SCCPL/EIA/01 Issue No. 01 R 01 82
Figure 3.5 Depth to water level (Pre Monsoon season)
Figure 3.6 Depth to water level (Post Monsoon Season)
Project Site
Project Site
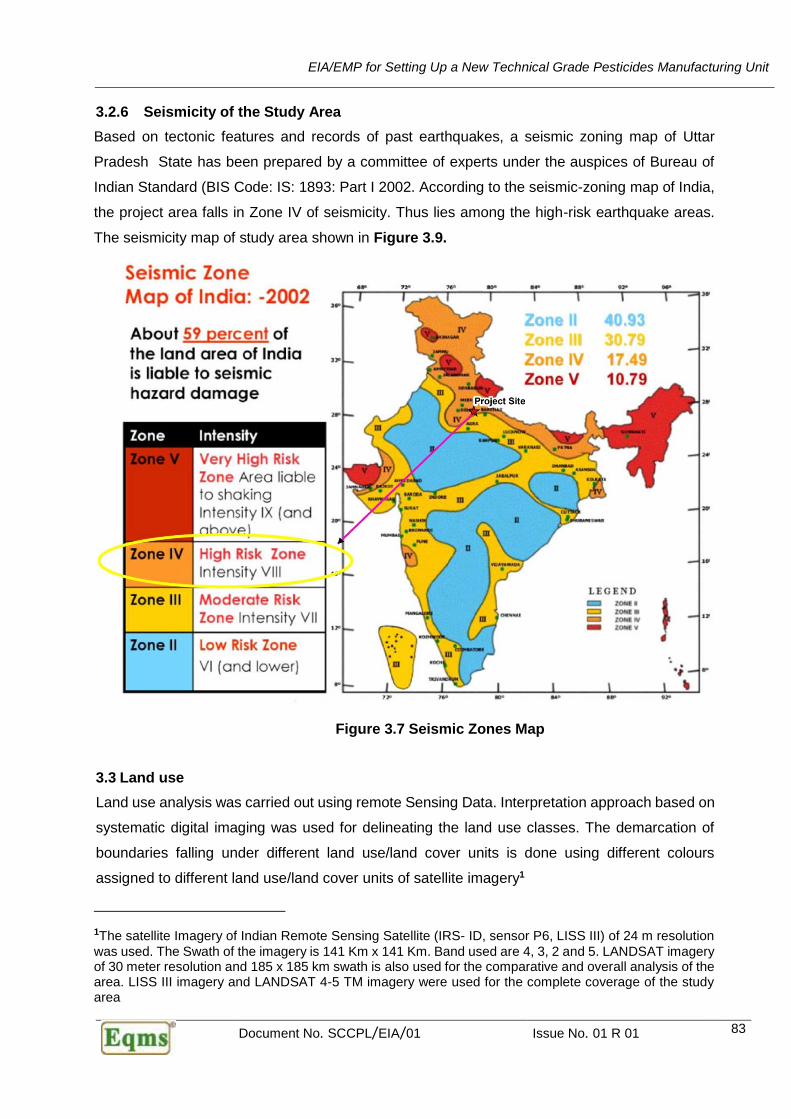
EIA/EMP for Setting Up a New Technical Grade Pesticides Manufacturing Unit
Document No. SCCPL/EIA/01 Issue No. 01 R 01 83
3.2.6 Seismicity of the Study Area
Based on tectonic features and records of past earthquakes, a seismic zoning map of Uttar
Pradesh State has been prepared by a committee of experts under the auspices of Bureau of
Indian Standard (BIS Code: IS: 1893: Part I 2002. According to the seismic-zoning map of India,
the project area falls in Zone IV of seismicity. Thus lies among the high-risk earthquake areas.
The seismicity map of study area shown in Figure 3.9.
Figure 3.7 Seismic Zones Map
3.3 Land use
Land use analysis was carried out using remote Sensing Data. Interpretation approach based on
systematic digital imaging was used for delineating the land use classes. The demarcation of
boundaries falling under different land use/land cover units is done using different colours
assigned to different land use/land cover units of satellite imagery1
1The satellite Imagery of Indian Remote Sensing Satellite (IRS- ID, sensor P6, LISS III) of 24 m resolution
was used. The Swath of the imagery is 141 Km x 141 Km. Band used are 4, 3, 2 and 5. LANDSAT imagery of 30 meter resolution and 185 x 185 km swath is also used for the comparative and overall analysis of the area. LISS III imagery and LANDSAT 4-5 TM imagery were used for the complete coverage of the study area

EIA/EMP for Setting Up a New Technical Grade Pesticides Manufacturing Unit
Document No. SCCPL/EIA/01 Issue No. 01 R 01 84
Land use of project site is Open Shrub land. Most of the land within the 10 km area of the project
site is agricultural land. As per the land use based on satellite image, about 84 % of the land is
agriculture land, 11% of the land is under settlement, 1 % of the land is under Vegetation1 % is
under water body, 3% is under open shrub Land(Refer Figure 3.9 and Table 3.3).
Table 3.4 : Land use of the Study Area
Sl. No. Class Area(Sq km) Percentage
1 Agricultural Land 264.36 84
2 Settlement 35.11 11
3 Water body 3.10 1.0
4 Open Shrub Land 10.02 3.0
5 Vegetation 1.86 1.0
6 Total 314.45 100.0
Source: Satellite Image analysis
0.
Figure 3.8 Area statistics for Land Use / Land Cover Categories in the Study Area
Agricultural Land84%
Settlement11%
Water body1%
Open Shrub Land3%
Vegetation1%
Land use Pattern in Study Area

EIA/EMP for Setting Up a New Technical Grade Pesticides Manufacturing Unit
Document No. SCCPL/EIA/01 Issue No. 01 R 01 85
Source: Interpretation of Satellite image
Figure 3.9 Land Use Map of the Study Area (10 km Radial Zone)

EIA/EMP for Setting Up a New Technical Grade Pesticides Manufacturing Unit
Document No. SCCPL/EIA/01 Issue No. 01 R 01 86
3.4 Meteorology
Historical meteorological data was obtained from nearest IMD station located at Meerut. The
predominant wind direction is from west and northwest direction during winter season. Details
provided in Table 3.5.
Table 3.5 Long Term Meteorological Data of Meerut (30 years average)
Month
Temperatur
e
(oC) daily
Relative
Humidit
y (%) Rainfal
l (mm)
461. Predominant Wind Direction
(From)
462. Calm Period
Cloud
Amount
s Oktas
Wind
Spee
d
Km/h
r Max Min
January 22.1 6.4 78 16.5 W, NW 43 0.2 5.9
February 24.1 8.9 72 14.7 W, NW 32 0.2 8.0
March 29.7 13.6 62 18.9 W, NW 32 0.2 8.2
April 36.2 19.7 45 6.5 W, NW 34 0.2 8.0
May 39.2 23.7 43 19.0 W, E 29 0.1 7.9
June 39.0 26.0 60 61.2 E, W 29 0.4 9.3
July 34.1 25.4 80 259.6 E, W 41 1.2 7.1
August 32.8 24.7 84 322.6 E, W 45 1.5 6.6
Septemb
er 33.8 23.0
77 139.9 W, E 40 0.7 5.9
October 33.3 17.8 66 15.2 W, E 57 0.1 4.4
Novembe
r 28.9 11.6
70 4.3 W, NW 58 0.1 4.4
Decembe
r 23.8 6.8
75 14.6 W, NW 49 0.2 5.0
Annual
Total or
Mean
31.4 17.3
68
893.0 W, NW 41 0.4 6.7
Source: IMD

EIA/EMP for Setting Up a New Technical Grade Pesticides Manufacturing Unit
Document No. SCCPL/EIA/01 Issue No. 01 R 01 87
Temperature– December, January and February constitutes winter months with daily mean
minimum temperature around 6.40C and daily mean maximum temperature around 28.9 0C. May
and June is the hottest month with daily mean maximum temperature at 39.2 0C and daily mean
minimum temperature at 23.7 0C.
Relative Humidity–April, May and June are driest with average relative humidity ranges between
43-60%. The maximum humidity during monsoon season is 84%.
Rainfall– The annual total rainfall is 893 mm. Over 76% of the total annual rainfall is received
during the monsoon period between July to September.
Cloud Cover – In the study area, clear weather prevails in most of the time during post monsoon,
winter and summer seasons. Only during monsoon months of July, August and September,
moderate to heavy clouds are observed. Relevant details about the number of days with zero
oktas of cloud cover (all clouds) for all months are presented in Table 3.6.
Table 3.6 No. of days with zero oktas of cloud cover (Meerut IMD)
Month Jan Feb Mar Apr May Jun Jul Aug Sep Oct Nov Dec Total
Days
Clouds 30 27 31 29 31 29 26 24 26 31 30 31 345
Wind Speed– The mean wind speed ranges from 4.4 to 5.0 kmph during post-monsoon, 6.6 to
9.3 kmph during monsoon and 7.9 to 8.2 kmph in pre-monsoon season.
Wind Direction– The predominant wind direction is from west and northwest direction in most of
the year except monsoon season where wind blows from east and west direction.
3.4.1 Met Data Generated at Site
Met data for 15th March 2017 to 15th June 2017 was generated at site. An automatic weather
monitoring station was installed at near Project site, keeping the sensors free exposed to the
atmosphere and with minimum interference with the nearby structures. The micro-meteorological
data like wind speed, wind direction, temperature, relative humidity and atmospheric pressure
were collected using the weather stationed cloud cover was recorded manually for the study
period.
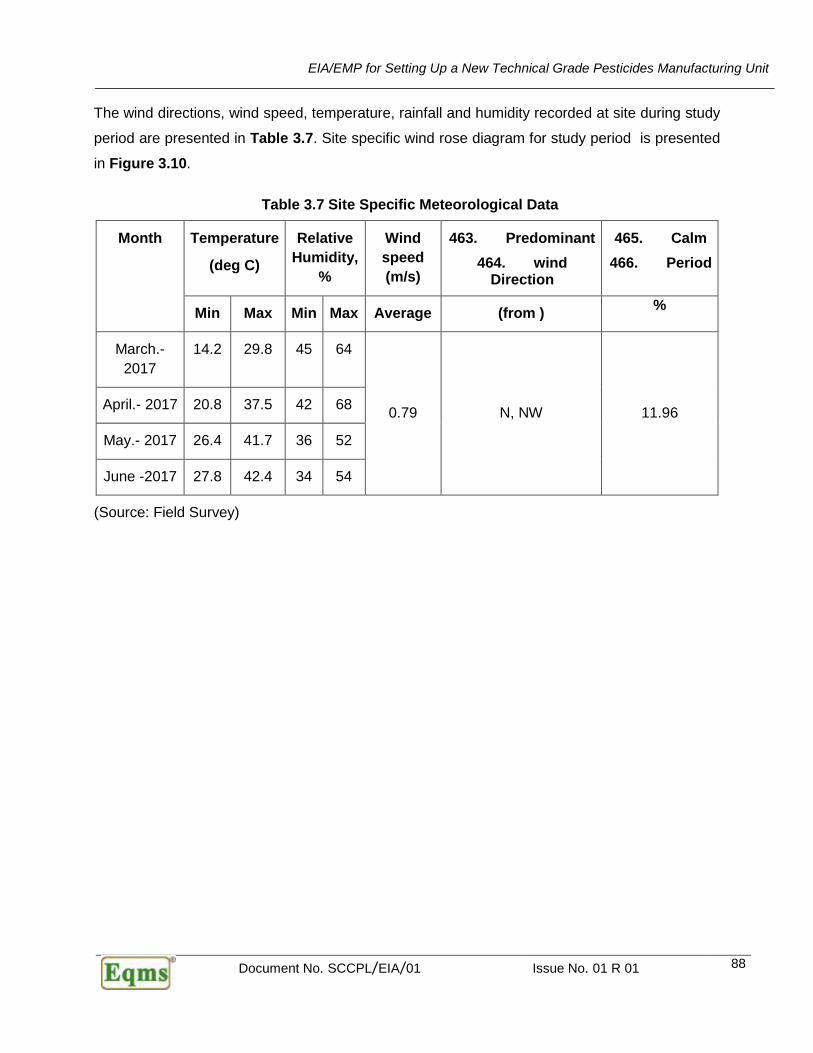
EIA/EMP for Setting Up a New Technical Grade Pesticides Manufacturing Unit
Document No. SCCPL/EIA/01 Issue No. 01 R 01 88
The wind directions, wind speed, temperature, rainfall and humidity recorded at site during study
period are presented in Table 3.7. Site specific wind rose diagram for study period is presented
in Figure 3.10.
Table 3.7 Site Specific Meteorological Data
Month Temperature
(deg C)
Relative
Humidity,
%
Wind
speed
(m/s)
463. Predominant
464. wind Direction
465. Calm
466. Period
Min Max Min Max Average (from ) %
March.-
2017
14.2 29.8 45 64
0.79 N, NW 11.96 April.- 2017 20.8 37.5 42 68
May.- 2017 26.4 41.7 36 52
June -2017 27.8 42.4 34 54
(Source: Field Survey)

EIA/EMP for Setting Up a New Technical Grade Pesticides Manufacturing Unit
Document No. SCCPL/EIA/01 Issue No. 01 R 01 89
Figure 3.10 Wind Rose Diagram of Study Area (Pre Monsoon Season)
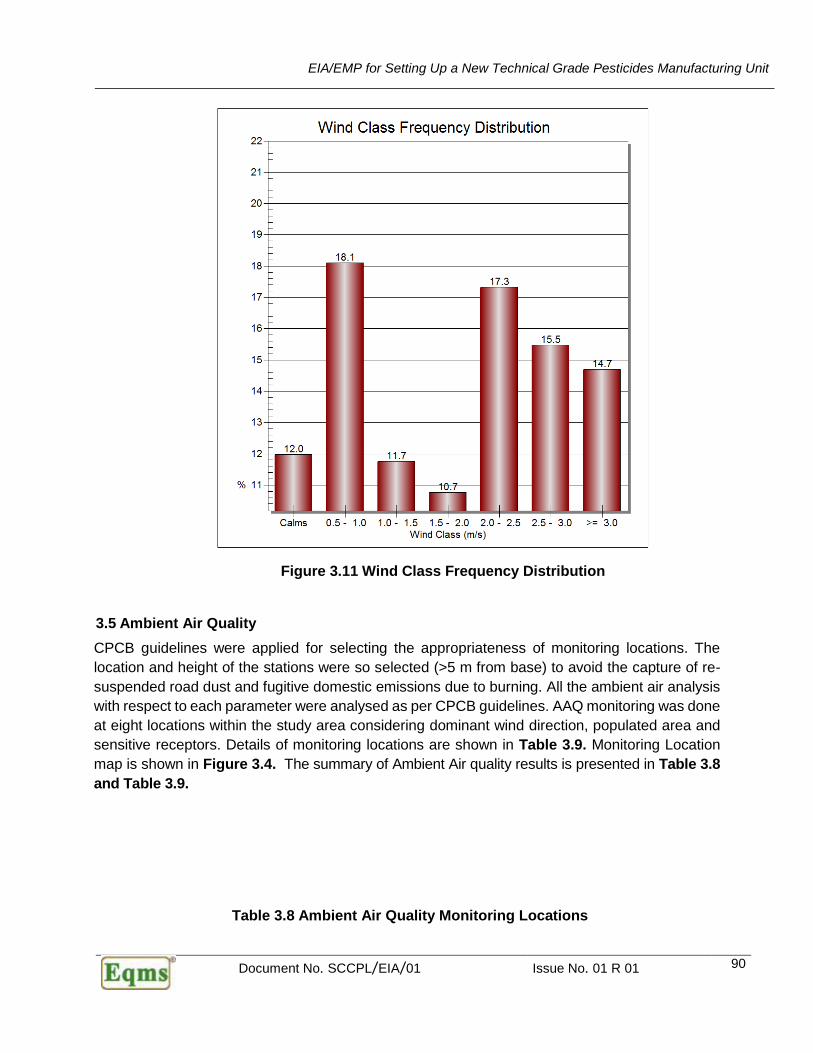
EIA/EMP for Setting Up a New Technical Grade Pesticides Manufacturing Unit
Document No. SCCPL/EIA/01 Issue No. 01 R 01 90
Figure 3.11 Wind Class Frequency Distribution
3.5 Ambient Air Quality
CPCB guidelines were applied for selecting the appropriateness of monitoring locations. The
location and height of the stations were so selected (>5 m from base) to avoid the capture of re-
suspended road dust and fugitive domestic emissions due to burning. All the ambient air analysis
with respect to each parameter were analysed as per CPCB guidelines. AAQ monitoring was done
at eight locations within the study area considering dominant wind direction, populated area and
sensitive receptors. Details of monitoring locations are shown in Table 3.9. Monitoring Location
map is shown in Figure 3.4. The summary of Ambient Air quality results is presented in Table 3.8
and Table 3.9.
Table 3.8 Ambient Air Quality Monitoring Locations
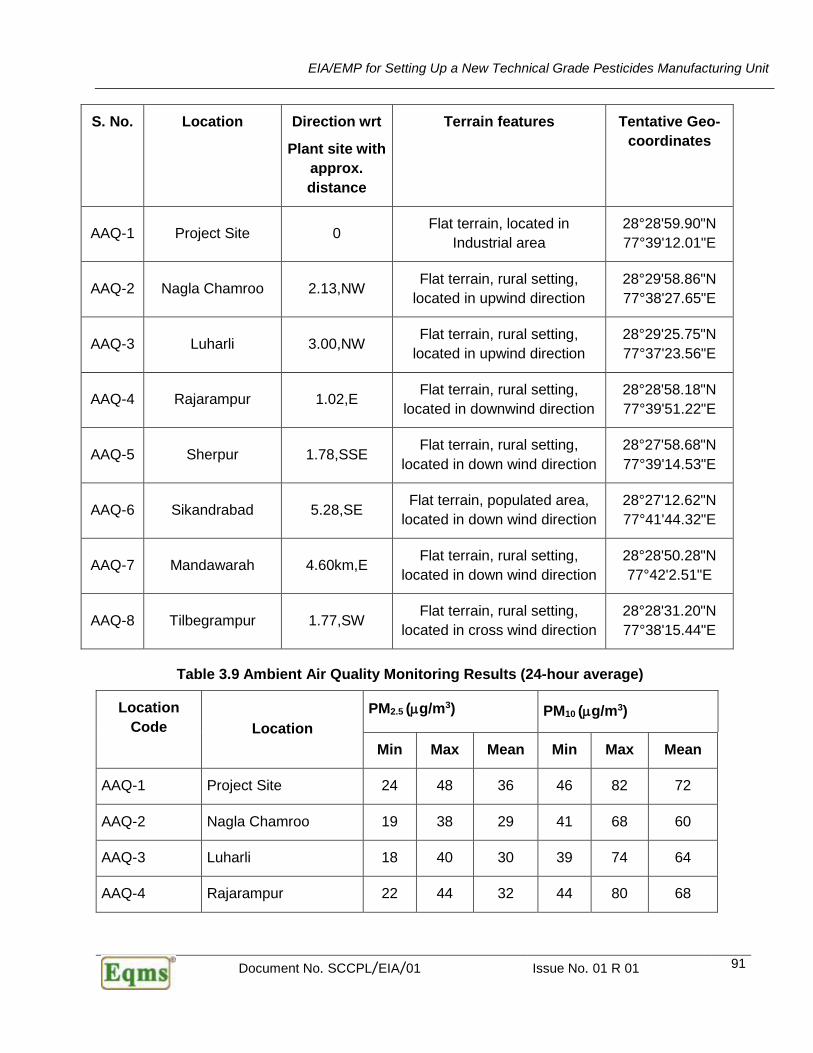
EIA/EMP for Setting Up a New Technical Grade Pesticides Manufacturing Unit
Document No. SCCPL/EIA/01 Issue No. 01 R 01 91
S. No. Location Direction wrt
Plant site with
approx.
distance
Terrain features Tentative Geo-
coordinates
AAQ-1 Project Site 0 Flat terrain, located in
Industrial area
28°28'59.90"N
77°39'12.01"E
AAQ-2 Nagla Chamroo 2.13,NW Flat terrain, rural setting,
located in upwind direction
28°29'58.86"N
77°38'27.65"E
AAQ-3 Luharli 3.00,NW Flat terrain, rural setting,
located in upwind direction
28°29'25.75"N
77°37'23.56"E
AAQ-4 Rajarampur 1.02,E Flat terrain, rural setting,
located in downwind direction
28°28'58.18"N
77°39'51.22"E
AAQ-5 Sherpur 1.78,SSE Flat terrain, rural setting,
located in down wind direction
28°27'58.68"N
77°39'14.53"E
AAQ-6 Sikandrabad 5.28,SE Flat terrain, populated area,
located in down wind direction
28°27'12.62"N
77°41'44.32"E
AAQ-7 Mandawarah 4.60km,E Flat terrain, rural setting,
located in down wind direction
28°28'50.28"N
77°42'2.51"E
AAQ-8 Tilbegrampur 1.77,SW Flat terrain, rural setting,
located in cross wind direction
28°28'31.20"N
77°38'15.44"E
Table 3.9 Ambient Air Quality Monitoring Results (24-hour average)
Location
Code Location
PM2.5 (g/m3) PM10 (g/m3)
Min Max Mean Min Max Mean
AAQ-1 Project Site 24 48 36 46 82 72
AAQ-2 Nagla Chamroo 19 38 29 41 68 60
AAQ-3 Luharli 18 40 30 39 74 64
AAQ-4 Rajarampur 22 44 32 44 80 68

EIA/EMP for Setting Up a New Technical Grade Pesticides Manufacturing Unit
Document No. SCCPL/EIA/01 Issue No. 01 R 01 92
AAQ-5 Sherpur 21 46 33 42 82 70
AAQ-6 Sikandrabad 25 52 40 48 88 74
AAQ-7 Mandawarah 18 42 28 41 70 62
AAQ-8 Tilbegrampur 20 43 32 43 69 63
Source: Primary Data Collection and analysis during study period by Laboratory
Table 3.10 Ambient Air Quality Monitoring Results (24-hour average)
Location
Code Location
SO2 (g/m3) NOx(g/m3) CO, mg/m³
Min Max Mean Min Max Mean
(8 hrs. Avg.
Conc.)
AAQ-1 Project Site 6.2 12.4 9.3 9.0 16.3. 12.2 0.62
AAQ-2 Nagla Chamroo 5.2 8.2 6.6 8.6 14.6 11.8 0.25
AAQ-3 Luharli 4.9 7.8 6.2 8.5 15.0 12.0 0.34
AAQ-4 Rajarampur 5.0 9.0 7.0 9.0 15.2 12.2 0.22
AAQ-5 Sherpur 4.8 8.4 6.8 8.8 14.8 11.8 0.42
AAQ-6 Sikandrabad 6.8 12.8 9.5 9.2 18.6 13.5 0.58
AAQ-7 Mandawarah 4.6 7.6 5.9 8.2 13.4 10.8 <0.10
AAQ-8 Tilbegrampur 4.8 8.5 6.2 8.6 13.8 11.1 0.18
Source: Primary Data Collection and analysis during study period by Laboratory
Table 3.11 Ambient Air Quality Monitoring Results (24-hour average)
Location
Code Location
NH3
(g/m3)
CO, mg/m3
(8 hrs
Conc.)
VOC
(µg/m³)
HF
(µg/m³) HBr
(µg/m³)
H2S
(ppb)
AAQ-1 Project Site 29 0.62 <0.01 <0.1 <0.1 <1
AAQ-2 Nagla Chamroo 21 0.25 <0.01 <0.1 <0.1 <1
AAQ-3 Luharli 24 0.34 <0.01 <0.1 <0.1 <1
AAQ-4 Rajarampur 25 0.22 <0.01 <0.1 <0.1 <1
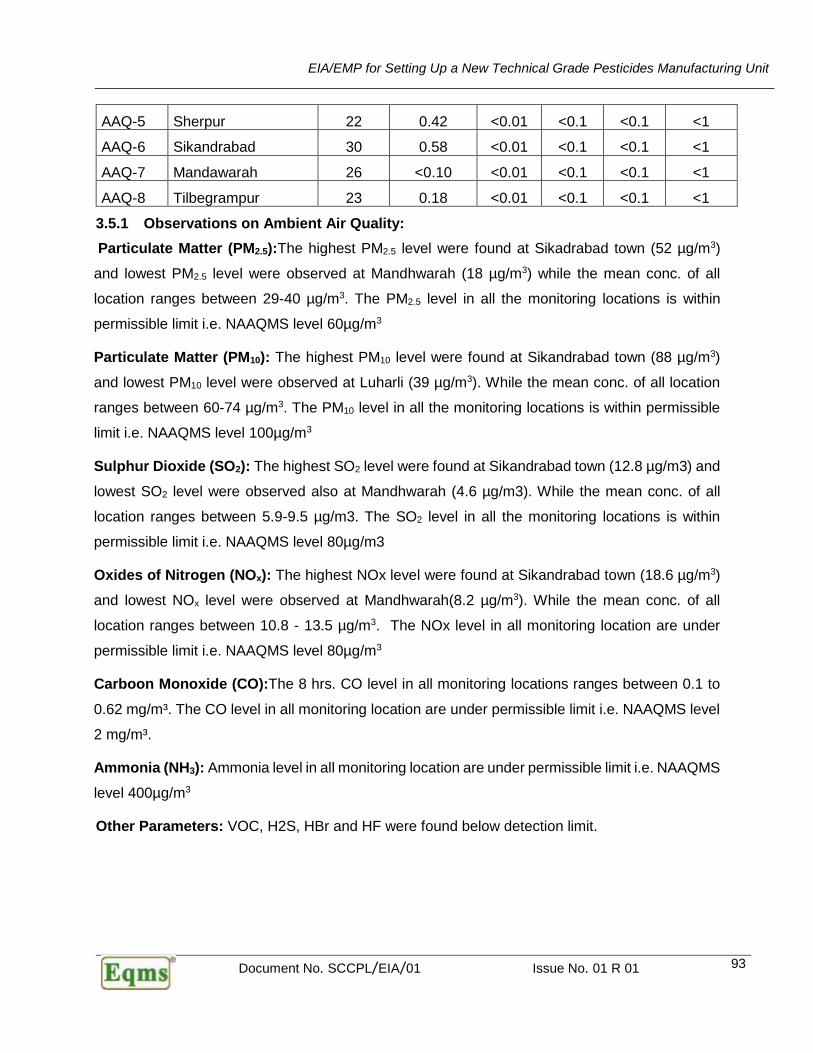
EIA/EMP for Setting Up a New Technical Grade Pesticides Manufacturing Unit
Document No. SCCPL/EIA/01 Issue No. 01 R 01 93
AAQ-5 Sherpur 22 0.42 <0.01 <0.1 <0.1 <1
AAQ-6 Sikandrabad 30 0.58 <0.01 <0.1 <0.1 <1
AAQ-7 Mandawarah 26 <0.10 <0.01 <0.1 <0.1 <1
AAQ-8 Tilbegrampur 23 0.18 <0.01 <0.1 <0.1 <1
3.5.1 Observations on Ambient Air Quality:
Particulate Matter (PM2.5):The highest PM2.5 level were found at Sikadrabad town (52 µg/m3)
and lowest PM2.5 level were observed at Mandhwarah (18 µg/m3) while the mean conc. of all
location ranges between 29-40 µg/m3. The PM2.5 level in all the monitoring locations is within
permissible limit i.e. NAAQMS level 60µg/m3
Particulate Matter (PM10): The highest PM10 level were found at Sikandrabad town (88 µg/m3)
and lowest PM10 level were observed at Luharli (39 µg/m3). While the mean conc. of all location
ranges between 60-74 µg/m3. The PM10 level in all the monitoring locations is within permissible
limit i.e. NAAQMS level 100µg/m3
Sulphur Dioxide (SO2): The highest SO2 level were found at Sikandrabad town (12.8 µg/m3) and
lowest SO2 level were observed also at Mandhwarah (4.6 µg/m3). While the mean conc. of all
location ranges between 5.9-9.5 µg/m3. The SO2 level in all the monitoring locations is within
permissible limit i.e. NAAQMS level 80µg/m3
Oxides of Nitrogen (NOx): The highest NOx level were found at Sikandrabad town (18.6 µg/m3)
and lowest NOx level were observed at Mandhwarah(8.2 µg/m3). While the mean conc. of all
location ranges between 10.8 - 13.5 µg/m3. The NOx level in all monitoring location are under
permissible limit i.e. NAAQMS level 80µg/m3
Carboon Monoxide (CO):The 8 hrs. CO level in all monitoring locations ranges between 0.1 to
0.62 mg/m³. The CO level in all monitoring location are under permissible limit i.e. NAAQMS level
2 mg/m³.
Ammonia (NH3): Ammonia level in all monitoring location are under permissible limit i.e. NAAQMS
level 400µg/m3
Other Parameters: VOC, H2S, HBr and HF were found below detection limit.

EIA/EMP for Setting Up a New Technical Grade Pesticides Manufacturing Unit
Document No. SCCPL/EIA/01 Issue No. 01 R 01 94
3.6 Noise Environment
Noise after a certain level can have a very disturbing effect on the people and animals exposed
to it. Hence, it is important to assess the present noise quality of the area in order to predict the
potential impact of future noise levels due to the proposed project. Ambient noise measurements
were taken at 8 locations, represented in Table 3.12. Location wise result for day time and night
time is presented in Table 3.13.
The monitored levels were compared against the Noise Pollution (Regulation and Control) Rules
2000, as amended through the Noise Pollution (Regulation and Control) Amendment Rules 2010
dated 11th January 2010. The project site falls in designated industrial area and the noise levels
at all the locations were found within the ambient noise standards.
Table 3.12 Ambient Noise Quality Monitoring Locations
S. No. Location Direction wrt Plant site with approx. distance
Category Tentative Geo-coordinates
N-1 Project Site 0 Industrial 28°28'59.90"N 77°39'12.01"E
N-2 Nagla Chamroo
2.11,NW Residential 28°29'58.80"N 77°38'27.62"E
N-3 Luharli 3.07,NW Residential 28°29'25.72"N 77°37'23.52"E
N-4 Rajarampur 1.00,E Residential 28°28'58.16"N 77°39'51.20"E
N-5 Sherpur 1.72,S Residential 28°27'58.64"N 77°39'14.50"E
N-6 Sikandrabad 5.22,SE Commercial 28°27'12.60"N 77°41'44.36"E
N-7 Mandawarah 4.58km,E Residential 28°28'50.26"N 77°42'2.49"E
N-8 Tilbegrampur 1.72,SW Residential 28°28'31.18"N 77°38'15.42"E
Table 3.13 Ambient Noise Quality in the Study Area
Location
Code
Location Name Present
Category
Day Time
Leq dB(A)
National
Standard
Day Time
Leq dB(A)
Night
Time Leq
dB(A)
National
Standard
Night Time
Leq dB(A)
N-1 Project Site Industrial 72.6 75 66.5 70
N-2 Nagla Chamar Residential 51.6 55 41.8 45

EIA/EMP for Setting Up a New Technical Grade Pesticides Manufacturing Unit
Document No. SCCPL/EIA/01 Issue No. 01 R 01 95
N-3 Lunari Residential 52.1 55 42.2 45
N-4 Rajarampur Residential 53.3 55 43.1 45
N-5 Sherpur Residential 53.8 55 42.6 45
N-6 Sikandrabad Commercial 62.6 65 50.2 55
N-7 Mandora Residential 52.3 55 42.3 45
N-8 Tilbegrampur Residential 51.6 55 41.3 45
Source: Analysis during study period, EQMS
3.6.1 Observation on Ambient Noise Quality:
The ambient noise quality of the study area is within the prescribed National Ambient Noise Quality
Standards prescribed for residential area (Standards - 55 dBA during day time and 45 dBA during
night time) commercial area (Standards - 65 dBA during day time and 55 dBA during night time)
and Industrial area (Standards - 75 dBA during day time and 65 dBA during night time) in all
monitoring locations.
3.7 Traffic Study
The site is located in planned notified industrial area having a good network of internal roads.
Further the site is located close to National Highway-91 (Ghaziabad to Kanpur Highway) which is
passing about 300 m south of the project site.
As the site is located close to NH-91 and all the material movement shall be done through this
highway. The NH-91 is multilane (4-lane) of very good design (1.5 m hard shoulders and 3 m
central verge) and its capacity is 40000 PCU per day as per IRC specification (IRC64-1990).
Considering total material transport from Samridhii crop chemicals i.e. ~ 15 trucks/month (~ 10
tonners), the existing highway is adequate to bear the additional load without any issue.
3.8 Water Quality
3.8.1 Ground Water Quality
Eight ground water samples were collected from different locations around the site during study
period. The water samples were examined for physico-chemical parameters and bacteriological
parameters. The samples were collected and analysed as per the procedures specified in
Standard Methods. Samples for chemical analyses were collected in polyethylene carboys.

EIA/EMP for Setting Up a New Technical Grade Pesticides Manufacturing Unit
Document No. SCCPL/EIA/01 Issue No. 01 R 01 96
Samples for bacteriological analyses were collected in sterilized bottles. Temperature, pH, and
conductivity were measured at site itself. The name of ground water sampling locations is
presented in Table 3.14. The analysis results of groundwater are presented in Table 3.15 and
Table 3.16.
Table 3.14 Ground Water Sampling Locations
S. No. Location Source Distance &
Direction from site Coordinates
GW1 Project Site Bore well 00 28°28'59.90"N
77°39'12.01"E
GW2 Nagla Chamroo Hand pump 2.15,NW 28°29'58.88"N
77°38'27.69"E
GW3 Luharli Bore well 3.03,NW 28°29'25.78"N
77°37'23.59"E
GW4 Rajarampur
Hand pump
1.05,E 28°28'58.20"N
77°39'51.25"E
GW5 Sherpur
Hand pump
1.80,S 28°27'58.70"N
77°39'14.57"E
GW6 Sikandrabad
Hand pump
5.30,SE 28°27'12.64"N
77°41'44.34"E
GW7 Mandawarah
Hand pump
4.62km,E 28°28'50.30"N
77°42'2.53"E
GW8 Tilbegrampur
Hand pump
1.79,SW 28°28'31.22"N
77°38'15.46"E
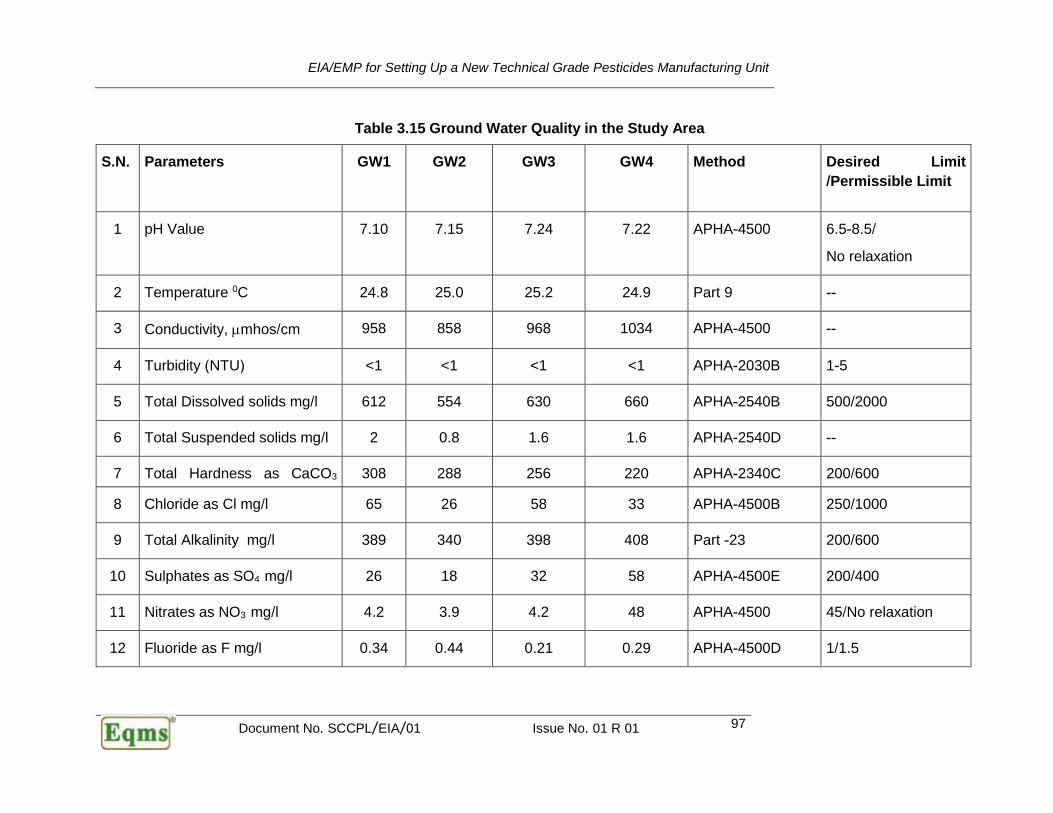
EIA/EMP for Setting Up a New Technical Grade Pesticides Manufacturing Unit
Document No. SCCPL/EIA/01 Issue No. 01 R 01 97
Table 3.15 Ground Water Quality in the Study Area
S.N. Parameters GW1
GW2
GW3
GW4
Method Desired Limit
/Permissible Limit
1 pH Value 7.10 7.15 7.24 7.22 APHA-4500 6.5-8.5/
No relaxation
2 Temperature 0C 24.8 25.0 25.2 24.9 Part 9 --
3 Conductivity, mhos/cm 958 858 968 1034 APHA-4500 --
4 Turbidity (NTU) <1 <1 <1 <1 APHA-2030B 1-5
5 Total Dissolved solids mg/l 612 554 630 660 APHA-2540B 500/2000
6 Total Suspended solids mg/l 2 0.8 1.6 1.6 APHA-2540D --
7 Total Hardness as CaCO3
mg/l
308 288 256 220 APHA-2340C 200/600
8 Chloride as Cl mg/l 65 26 58 33 APHA-4500B 250/1000
9 Total Alkalinity mg/l 389 340 398 408 Part -23 200/600
10 Sulphates as SO4 mg/l 26 18 32 58 APHA-4500E 200/400
11 Nitrates as NO3 mg/l 4.2 3.9 4.2 48 APHA-4500 45/No relaxation
12 Fluoride as F mg/l 0.34 0.44 0.21 0.29 APHA-4500D 1/1.5

EIA/EMP for Setting Up a New Technical Grade Pesticides Manufacturing Unit
Document No. SCCPL/EIA/01 Issue No. 01 R 01 98
13 Iron as Fe mg/l 0.22 0.20 0.26 0.28 APHA-3111B 0.3/No relaxation
14 Zinc as Zn mg/l <0.01 <0.01 <0.01 <0.01 APHA-3111B 5/15
15 Calcium as Ca mg/l 82 64 61 56 APHA-3500B 75/200
16 Magnesium as Mg mg/l 25 31 25 19 APHA-3500B 30/100
17 Sodium as Na mg/l 38 17 56 98 APHA-3500 --
18 Potassium as K mg/l 6.7 3.6 14 25 APHA-3500 KB --
19 Cadmium as Cd mg/l <0.01 <0.01 <0.01 <0.01 APHA-3111B 0.003/No relaxation
20 Copper as Cu mg/l <0.01 <0.01 <0.01 <0.01 APHA-3111B 0.05/1.5
21 Nickel as Ni mg/l <0.01 <0.01 <0.01 <0.01 APHA-3111B 0.02/No relaxation
22 Lead as Pb mg/l <0.01 <0.01 <0.01 <0.01 APHA-3111B 0.01/No relaxation
23 Mercury as Hg mg/l <0.001 <0.001 <0.001 <0.001 APHA-3112 0.001/0.001
24 Chromium (Total as Cr) mg/l <0.05 <0.05 <0.05 <0.05 APHA-3111B 0.5/No relaxation
25 Arsenic as As mg/l <0.025 <0.025 <0.025 <0.025 APHA-3114 0.01/0.05
26 Total coliform MPN/100ml Nil Nil
Nil APHA-9230B Nil
Source: Water Analysis during study period

EIA/EMP for Setting Up a New Technical Grade Pesticides Manufacturing Unit
Document No. SCCPL/EIA/01 Issue No. 01 R 01 99
Table 3.16 Ground Water Quality in the Study Area
S.N. Parameters GW5
GW6
GW7
GW8
Method Desired Limit
/Permissible Limit
1 pH Value 7.32 7.80 7.36 7.12 APHA-4500 6.5-8.5/
No relaxation
2 Temperature 0C 24.9 24.8 25.0 25.1 Part 9 --
3 Conductivity, mhos/cm 768 1280 688 835 APHA-4500 --
4 Turbidity (NTU) <1 <1 <1 <1 APHA-2030B 1-5
5 Total Dissolved solids mg/l 478 856 450 540 APHA-2540B 500/2000
6 Total Suspended solids mg/l 1 1.6 0.8 0.9 APHA-2540D --
7 Total Hardness as CaCO3
mg/l
240 280 260 278 APHA-2340C 200/600
8 Chloride as Cl mg/l 46 210 42 56 APHA-4500B 250/1000
9 Total Alkalinity mg/l 280 366 250 258 Part -23 200/600
10 Sulphates as SO4 mg/l 24 47 32 56 APHA-4500E 200/400
11 Nitrates as NO3 mg/l 5.4 22 4.4 16 APHA-4500 45/No relaxation
12 Fluoride as F mg/l 0.26 0.30 0.22 0.18 APHA-4500D 1/1.5
13 Iron as Fe mg/l 0.22 0.28 0.21 0.20 APHA-3111B 0.3/No relaxation

EIA/EMP for Setting Up a New Technical Grade Pesticides Manufacturing Unit
Document No. SCCPL/EIA/01 Issue No. 01 R 01 100
14 Zinc as Zn mg/l <0.01 <0.01 <0.01 <0.01 APHA-3111B 5/15
15 Calcium as Ca mg/l 52 78 58 70 APHA-3500B 75/200
16 Magnesium as Mg mg/l 26.6 20.6 27.3 25 APHA-3500B 30/100
17 Sodium as Na mg/l 20 212 26 75 APHA-3500 --
18 Potassium as K mg/l 4.34 7.34 3.6 8.1 APHA-3500 KB --
19 Cadmium as Cd mg/l <0.01 <0.01 <0.01 <0.01 APHA-3111B 0.003/No relaxation
20 Copper as Cu mg/l <0.01 <0.01 <0.01 <0.01 APHA-3111B 0.05/1.5
21 Nickel as Ni mg/l <0.01 <0.01 <0.01 <0.01 APHA-3111B 0.02/No relaxation
22 Lead as Pb mg/l <0.01 <0.01 <0.01 <0.01 APHA-3111B 0.01/No relaxation
23 Mercury as Hg mg/l <0.001 <0.001 <0.001 <0.001 APHA-3112 0.001/0.001
24 Chromium (Total as Cr) mg/l <0.05 <0.05 <0.05 <0.05 APHA-3111B 0.5/No relaxation
25 Arsenic as As mg/l <0.025 <0.025 <0.025 <0.025 APHA-3114 0.01/0.05
26 Total coliform MPN/100ml Nil Nil Nil Nil APHA-9230B Nil
Source: Water Analysis during study period
Document No. SCCPL/EIA/01 Issue No. 01 R 01 101
3.8.2 Observation on Ground water Quality
The pH value of drinking water is an important index of acidity or alkalinity. pH value of the
sample vary from 7.10 to 7.80 in all locations, which is well within the specified standard
of 6.5 to 8.5. The pH of the ground water in the study area is neutral to slightly alkaline in
nature. Electric Conductivity levels vary from 688 to 1280 µmho/cm. Total dissolved solids
ranges from 450 to 856 µg/l which is found within the permissible limit.
The total hardness is an important parameter of water quality. The hardness values in
ground water of the study area ranges between 220 to 308 mg/l which is well within the
permissible limit. The calcium values in ground water of the study area are well within the
specified desirable limit. Magnesium values in ground water of the study area are well
within the specified permissible limit of Indian drinking water standard. The chloride values
in ground water of the study area ranges between 33 to 210 mg/l which is well within the
permissible limit
No biological and metallic contamination has been found in any of the ground water sample
of the study area. Overall the parameters in ground water sample were well within the
permissible limit of Indian Standard IS: 10500-2012. No metallic and bacterial
contamination was found in the ground water samples.
3.8.3 Surface Water Quality
As there is no river present in the study area. However Upper Ganga canal and its
distributaries are the source of surface water in study area. There was no water in canals
during study season hence no surface water collected from the study season.
3.9 Soil Quality
Soils may be defined as a thin layer of earth's crust that serves as a natural medium for
the growth of plants. It is the unconsolidated mineral matter that has been subjected to
and influenced by genetic and environmental factors. Soils serve as a reservoir of nutrients
for plants and crops and also provide mechanical anchorage and favorable tilts. Soil is our
most important natural resource and a natural resource is anything that comes from the
earth and is used by us. We depend on the soil for food, clothing, shelter, minerals, clay &
water. Soil is the seat of many macro & micro flora like algae, fungi, earthworms, bacteria
etc. These are very beneficial in promoting soil reactions and decomposing the organic
matter by which essential nutrients for plants are liberated. Most of the soils are made-up
of two main parts:
➢ Tiny bits of mineral particles which come from larger rocks, and humus, which is dark
brown in color and consists of decaying remains of plants and animals.
➢ Soil also contains water, air and living organisms, such as fungi, bacteria, earthworms,
roundworms, insects, etc. Actually more living organisms live in the soil than above it.

Document No. SCCPL/EIA/01 Issue No. 01 R 01 102
For general characterization of soil a few random samples from the study area to the depth of
about 15-cm may be sufficient. Deeper soil samples may be needed only for the study of soil
profile.
3.9.1 General Characteristics of the Soil in the District2
As per the district census handbook 2011, in general, the soil of the district level is plain but in
Khadar area of Ganga-Yamuna and Kali Nadi the Soil level is uneven. The soil is entirely alluvium
with the Kankar embedded in abundance and surface occasionally bears saline efflorescence.
Domat or loam, sandy loam, matiar or clay, blur or sand are the different varieties of soil in the
district. Domat is fertile loam which is soft; matiar is stiff clay in which rice is grown. In the Tarai
soil is alluvial, where the mixing of sand is large and is classified as Bhur. There are three crop
seasons are observed as Kharif, Rabi and Zaid. The last is of little significance in the point of
area.shown below –Table 3.17 -Table 3.18 , Soil Map of Bulandshahar District is shown in Figure-
3.12 as follows;
Table 3.17 Major Soil Classification of the District
Major Soils Area (‘000-ha) Percent (%)
Loamy Sand 232.3 78%
Sandy Loam 50.58 17%
Sandy Silt Loam 14.88 5%
Total 886.71 100
2(Source-http://www.nicra-icar.in/nicrarevised/images/statewiseplans/Uttar%20Pradesh/UP6-Bulandshahar-26.7.2012.pdf)
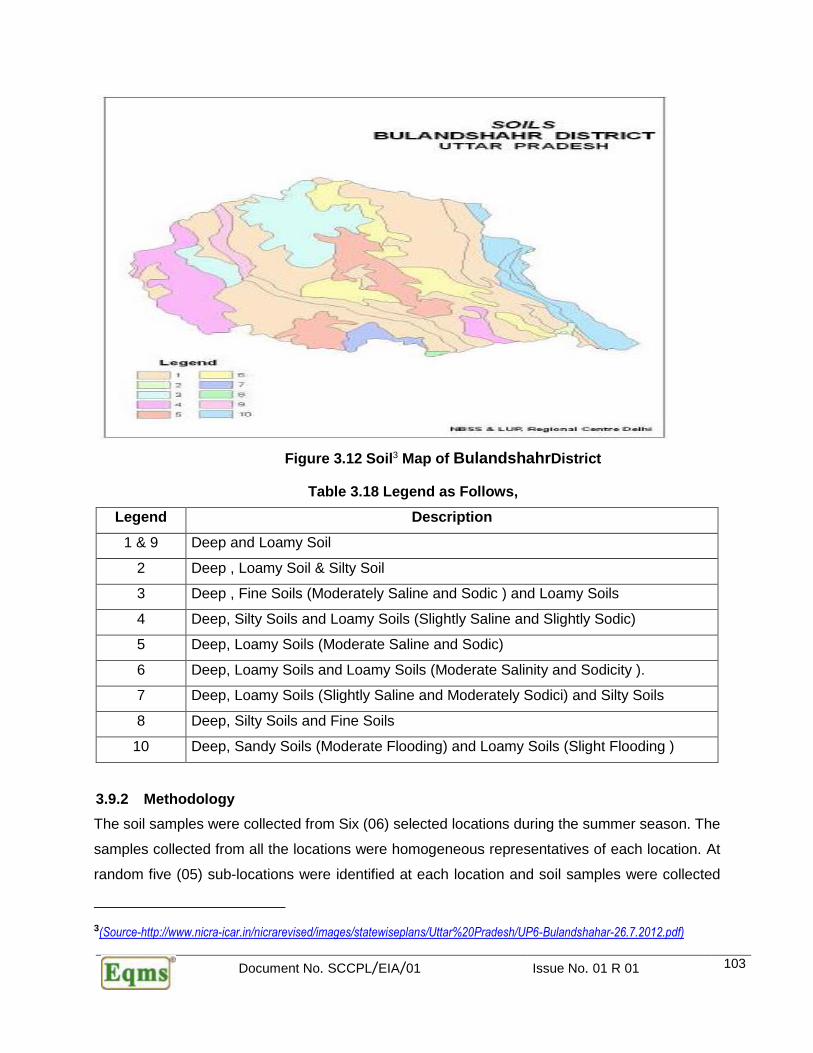
Document No. SCCPL/EIA/01 Issue No. 01 R 01 103
Figure 3.12 Soil3 Map of BulandshahrDistrict
Table 3.18 Legend as Follows,
Legend Description
1 & 9 Deep and Loamy Soil
2 Deep , Loamy Soil & Silty Soil
3 Deep , Fine Soils (Moderately Saline and Sodic ) and Loamy Soils
4 Deep, Silty Soils and Loamy Soils (Slightly Saline and Slightly Sodic)
5 Deep, Loamy Soils (Moderate Saline and Sodic)
6 Deep, Loamy Soils and Loamy Soils (Moderate Salinity and Sodicity ).
7 Deep, Loamy Soils (Slightly Saline and Moderately Sodici) and Silty Soils
8 Deep, Silty Soils and Fine Soils
10 Deep, Sandy Soils (Moderate Flooding) and Loamy Soils (Slight Flooding )
3.9.2 Methodology
The soil samples were collected from Six (06) selected locations during the summer season. The
samples collected from all the locations were homogeneous representatives of each location. At
random five (05) sub-locations were identified at each location and soil samples were collected
3(Source-http://www.nicra-icar.in/nicrarevised/images/statewiseplans/Uttar%20Pradesh/UP6-Bulandshahar-26.7.2012.pdf)

Document No. SCCPL/EIA/01 Issue No. 01 R 01 104
from 5 to15-cm below the surface. It was uniformly mixed before homogenizing the soil sample.
The samples about 500-gms were packed in polythene bags labelled in the field with the name &
number of sampling location and sent to the laboratory for analysis of important physicochemical
parameters.
3.9.3 Soil Sampling Locations
Soil sampling was conducted once during the study period of pre-monsoon season. Six (06) soil
samples were collected from selected locations in the vicinity of the proposed project For studying
Soil quality of the region, Six (06) soil sampling locations were selected to assess the existing soil
conditions in and around the project area representing various land use conditions and the
agricultural practices
The present study of the soil quality establishes the baseline characteristics. The sampling
locations have been identified to determine the Baseline Soil characteristics, impact of
Industrialization from agricultural production & productivity point of view.
Soil sampling locations with their distance & directions w. r. t., the proposed project site are
presented in project in Table 3.19.
Table 3.19 Soil Sampling Locations
Sampling
Code
Sampling Locations Distance, km Direction GPS Coordinates
S-1 Project Site 00 00 28°28'59.90"N
77°39'12.01"E
S-2 Gopalpur 0.82 N 28°29'24.95"N
77°39'13.86"E
S-3 Rajarampur 1.06 E 28°28'58.19"N
77°39'51.27"E
S-4 Sherpur 1.86 S 28°27'58.72"N
77°39'14.59"E
S-5 Sonwali 2.84 SE 28°28'6.81"N
77°40'36.79"E
S-6 Nagla Chamroo 2.16 NW 28°29'58.88"N
77°38'27.69"E
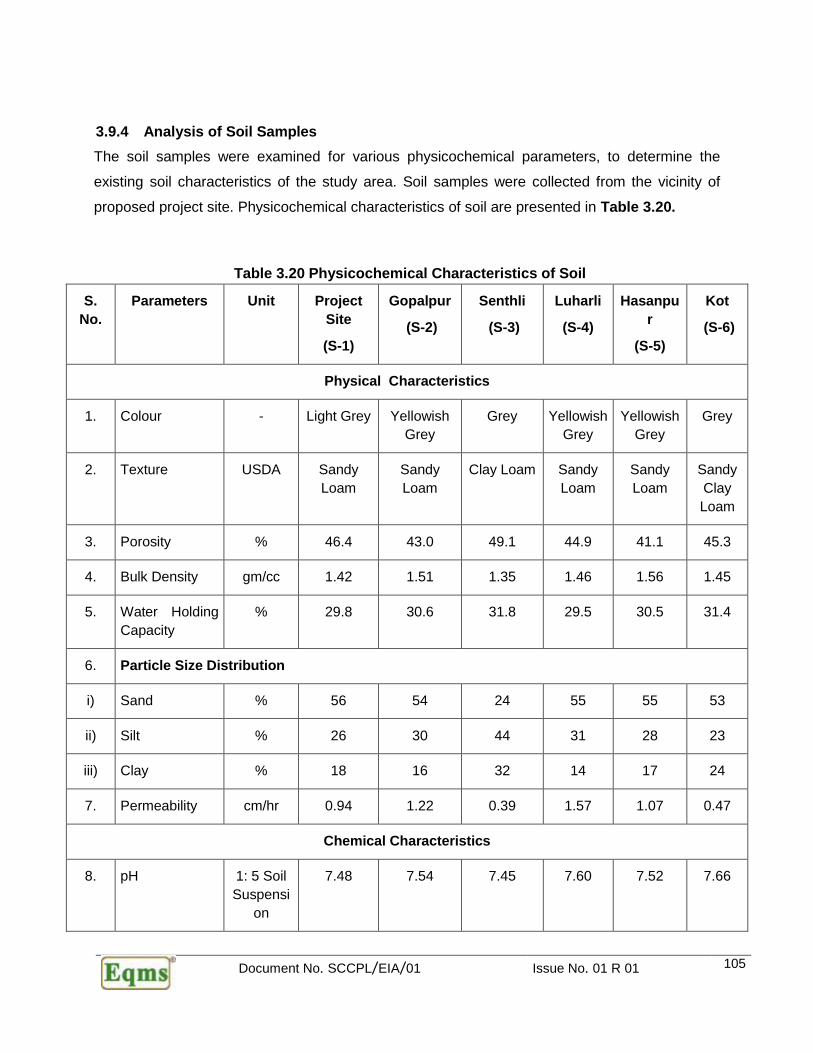
Document No. SCCPL/EIA/01 Issue No. 01 R 01 105
3.9.4 Analysis of Soil Samples
The soil samples were examined for various physicochemical parameters, to determine the
existing soil characteristics of the study area. Soil samples were collected from the vicinity of
proposed project site. Physicochemical characteristics of soil are presented in Table 3.20.
Table 3.20 Physicochemical Characteristics of Soil
S.
No.
Parameters Unit Project
Site
(S-1)
Gopalpur
(S-2)
Senthli
(S-3)
Luharli
(S-4)
Hasanpu
r
(S-5)
Kot
(S-6)
Physical Characteristics
1. Colour - Light Grey Yellowish
Grey
Grey Yellowish
Grey
Yellowish
Grey
Grey
2. Texture USDA Sandy
Loam
Sandy
Loam
Clay Loam Sandy
Loam
Sandy
Loam
Sandy
Clay
Loam
3. Porosity % 46.4 43.0 49.1 44.9 41.1 45.3
4. Bulk Density gm/cc 1.42 1.51 1.35 1.46 1.56 1.45
5. Water Holding
Capacity
% 29.8 30.6 31.8 29.5 30.5 31.4
6. Particle Size Distribution
i) Sand % 56 54 24 55 55 53
ii) Silt % 26 30 44 31 28 23
iii) Clay % 18 16 32 14 17 24
7. Permeability cm/hr 0.94 1.22 0.39 1.57 1.07 0.47
Chemical Characteristics
8. pH 1: 5 Soil
Suspensi
on
7.48 7.54 7.45 7.60 7.52 7.66

Document No. SCCPL/EIA/01 Issue No. 01 R 01 106
9. Conductivity
(EC)
µmhos/c
m 345.5
436.2 439.6 433.4 366.4 328.7
10. CEC Meq/100g
m 10.9
11.5 22.5 12.4 11.8 18.5
11. Organic Carbon % 0.44 0.38 0.48 0.42 0.55 0.36
12. Organic Matter % 0.76 0.66 0.83 0.72 0.95 0.62
13. Chlorides as Cl mg/kg 146.8 134.2 145.6 155.8 135.3 126.5
14. Iron as Fe mg/kg 4.15 5.75 8.34 3.25 5.38 6.78
15. Copper as Cu mg/kg 0.52 0.64 0.45 0.57 0.32 0.66
16. Zinc as Zn mg/kg 0.45 0.36 0.32 0.29 0.48 0.38
17. Manganese as
Mn
mg/kg 2.25 3.44 1.62 2.29 2.55 3.36
18. Boron as B mg/kg 0.56 0.65 0.68 0.54 0.49 0.45
19. Available Nutrients
i) Nitrogen as N kg/ha 295.6 308.2 314.8 325.4 315.8 286.5
ii) Phosphorus as
P
kg/ha 18.5 16.8 15.9 15.7 17.6 16.5
iii) Potassium as K kg/ha 138.4 106.6 133.5 116.2 165.7 161.4
20. SAR - 1.36 1.44 1.38 1.28 1.34 1.46
(Source: JP Lab)
3.9.5 Observation on Soil Quality
Physical property
Soil Texture: The mineral components of soil are sand, silt and clay, and their relative proportions
determine a soil's texture. Properties that are influenced by soil texture, include
porosity, permeability, infiltration, shrink-swell, water-holding capacity, and susceptibility to
erosion. The Soil in which neither sand & silt nor clay predominates is called "loam". The mineral
constituents of a loam soil might be 40% Sand, 40% Silt and the balance 20% Clay by weight. Soil
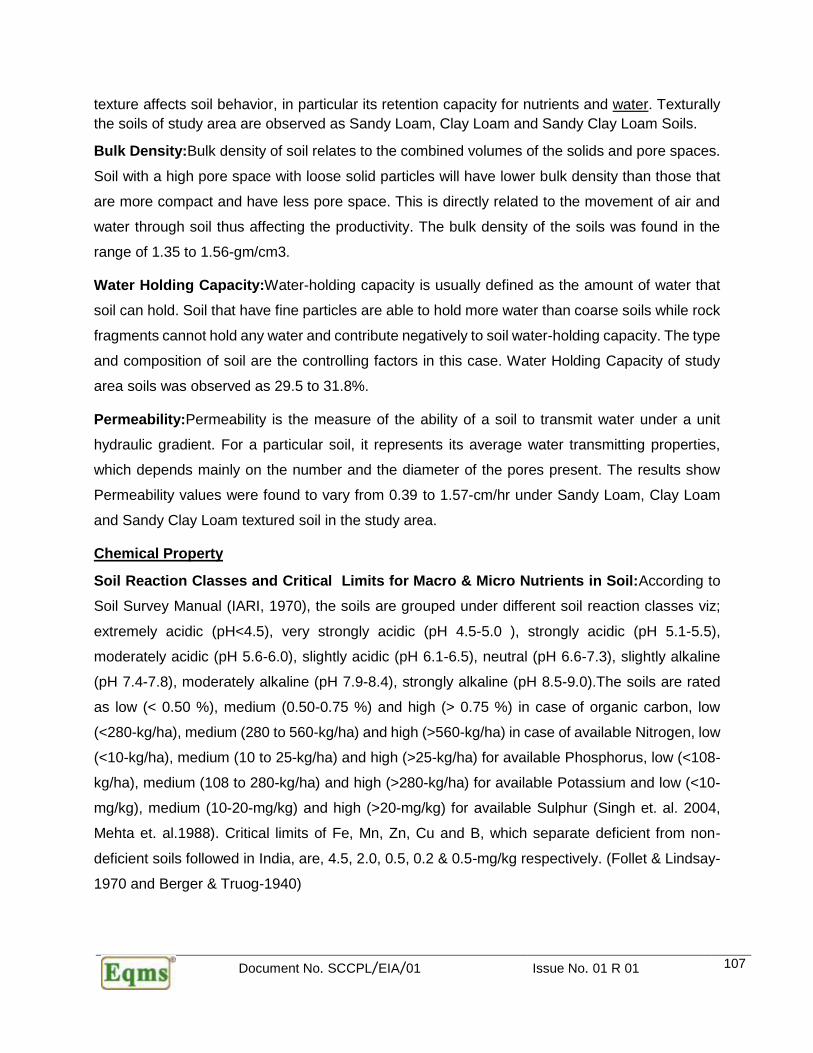
Document No. SCCPL/EIA/01 Issue No. 01 R 01 107
texture affects soil behavior, in particular its retention capacity for nutrients and water. Texturally
the soils of study area are observed as Sandy Loam, Clay Loam and Sandy Clay Loam Soils.
Bulk Density:Bulk density of soil relates to the combined volumes of the solids and pore spaces.
Soil with a high pore space with loose solid particles will have lower bulk density than those that
are more compact and have less pore space. This is directly related to the movement of air and
water through soil thus affecting the productivity. The bulk density of the soils was found in the
range of 1.35 to 1.56-gm/cm3.
Water Holding Capacity:Water-holding capacity is usually defined as the amount of water that
soil can hold. Soil that have fine particles are able to hold more water than coarse soils while rock
fragments cannot hold any water and contribute negatively to soil water-holding capacity. The type
and composition of soil are the controlling factors in this case. Water Holding Capacity of study
area soils was observed as 29.5 to 31.8%.
Permeability:Permeability is the measure of the ability of a soil to transmit water under a unit
hydraulic gradient. For a particular soil, it represents its average water transmitting properties,
which depends mainly on the number and the diameter of the pores present. The results show
Permeability values were found to vary from 0.39 to 1.57-cm/hr under Sandy Loam, Clay Loam
and Sandy Clay Loam textured soil in the study area.
Chemical Property
Soil Reaction Classes and Critical Limits for Macro & Micro Nutrients in Soil:According to
Soil Survey Manual (IARI, 1970), the soils are grouped under different soil reaction classes viz;
extremely acidic (pH<4.5), very strongly acidic (pH 4.5-5.0 ), strongly acidic (pH 5.1-5.5),
moderately acidic (pH 5.6-6.0), slightly acidic (pH 6.1-6.5), neutral (pH 6.6-7.3), slightly alkaline
(pH 7.4-7.8), moderately alkaline (pH 7.9-8.4), strongly alkaline (pH 8.5-9.0).The soils are rated
as low (< 0.50 %), medium (0.50-0.75 %) and high (> 0.75 %) in case of organic carbon, low
(<280-kg/ha), medium (280 to 560-kg/ha) and high (>560-kg/ha) in case of available Nitrogen, low
(<10-kg/ha), medium (10 to 25-kg/ha) and high (>25-kg/ha) for available Phosphorus, low (<108-
kg/ha), medium (108 to 280-kg/ha) and high (>280-kg/ha) for available Potassium and low (<10-
mg/kg), medium (10-20-mg/kg) and high (>20-mg/kg) for available Sulphur (Singh et. al. 2004,
Mehta et. al.1988). Critical limits of Fe, Mn, Zn, Cu and B, which separate deficient from non-
deficient soils followed in India, are, 4.5, 2.0, 0.5, 0.2 & 0.5-mg/kg respectively. (Follet & Lindsay-
1970 and Berger & Truog-1940)
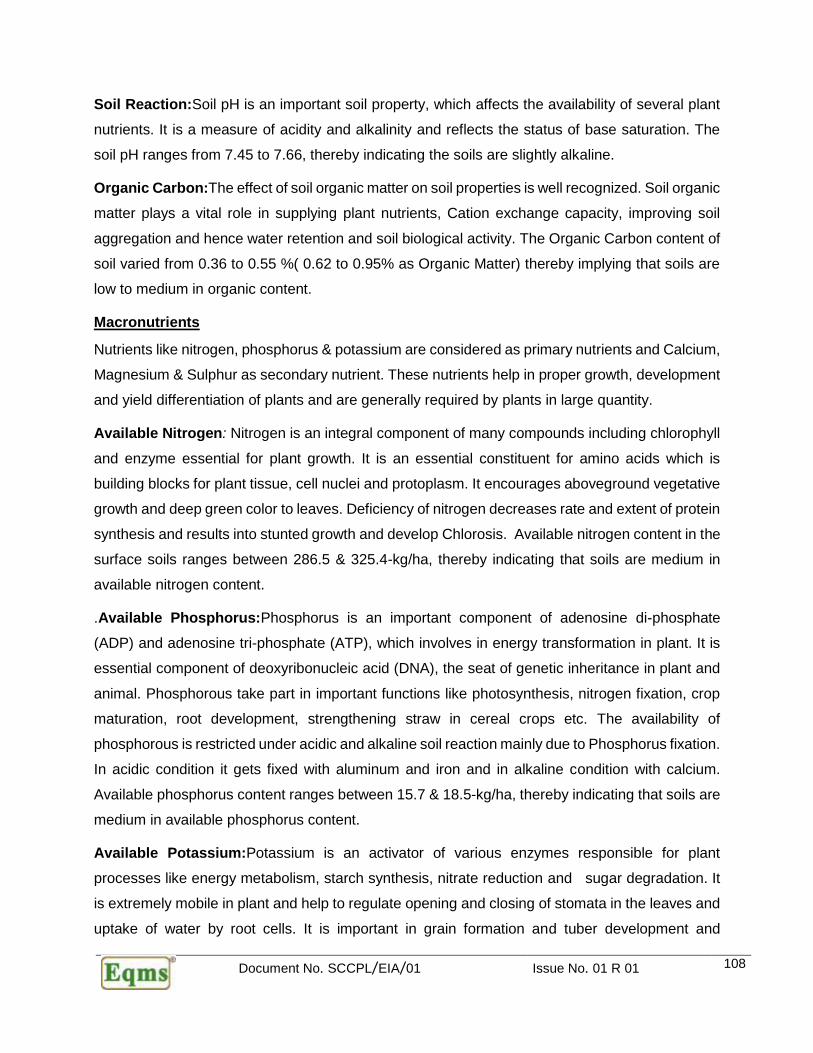
Document No. SCCPL/EIA/01 Issue No. 01 R 01 108
Soil Reaction:Soil pH is an important soil property, which affects the availability of several plant
nutrients. It is a measure of acidity and alkalinity and reflects the status of base saturation. The
soil pH ranges from 7.45 to 7.66, thereby indicating the soils are slightly alkaline.
Organic Carbon:The effect of soil organic matter on soil properties is well recognized. Soil organic
matter plays a vital role in supplying plant nutrients, Cation exchange capacity, improving soil
aggregation and hence water retention and soil biological activity. The Organic Carbon content of
soil varied from 0.36 to 0.55 %( 0.62 to 0.95% as Organic Matter) thereby implying that soils are
low to medium in organic content.
Macronutrients
Nutrients like nitrogen, phosphorus & potassium are considered as primary nutrients and Calcium,
Magnesium & Sulphur as secondary nutrient. These nutrients help in proper growth, development
and yield differentiation of plants and are generally required by plants in large quantity.
Available Nitrogen: Nitrogen is an integral component of many compounds including chlorophyll
and enzyme essential for plant growth. It is an essential constituent for amino acids which is
building blocks for plant tissue, cell nuclei and protoplasm. It encourages aboveground vegetative
growth and deep green color to leaves. Deficiency of nitrogen decreases rate and extent of protein
synthesis and results into stunted growth and develop Chlorosis. Available nitrogen content in the
surface soils ranges between 286.5 & 325.4-kg/ha, thereby indicating that soils are medium in
available nitrogen content.
.Available Phosphorus:Phosphorus is an important component of adenosine di-phosphate
(ADP) and adenosine tri-phosphate (ATP), which involves in energy transformation in plant. It is
essential component of deoxyribonucleic acid (DNA), the seat of genetic inheritance in plant and
animal. Phosphorous take part in important functions like photosynthesis, nitrogen fixation, crop
maturation, root development, strengthening straw in cereal crops etc. The availability of
phosphorous is restricted under acidic and alkaline soil reaction mainly due to Phosphorus fixation.
In acidic condition it gets fixed with aluminum and iron and in alkaline condition with calcium.
Available phosphorus content ranges between 15.7 & 18.5-kg/ha, thereby indicating that soils are
medium in available phosphorus content.
Available Potassium:Potassium is an activator of various enzymes responsible for plant
processes like energy metabolism, starch synthesis, nitrate reduction and sugar degradation. It
is extremely mobile in plant and help to regulate opening and closing of stomata in the leaves and
uptake of water by root cells. It is important in grain formation and tuber development and
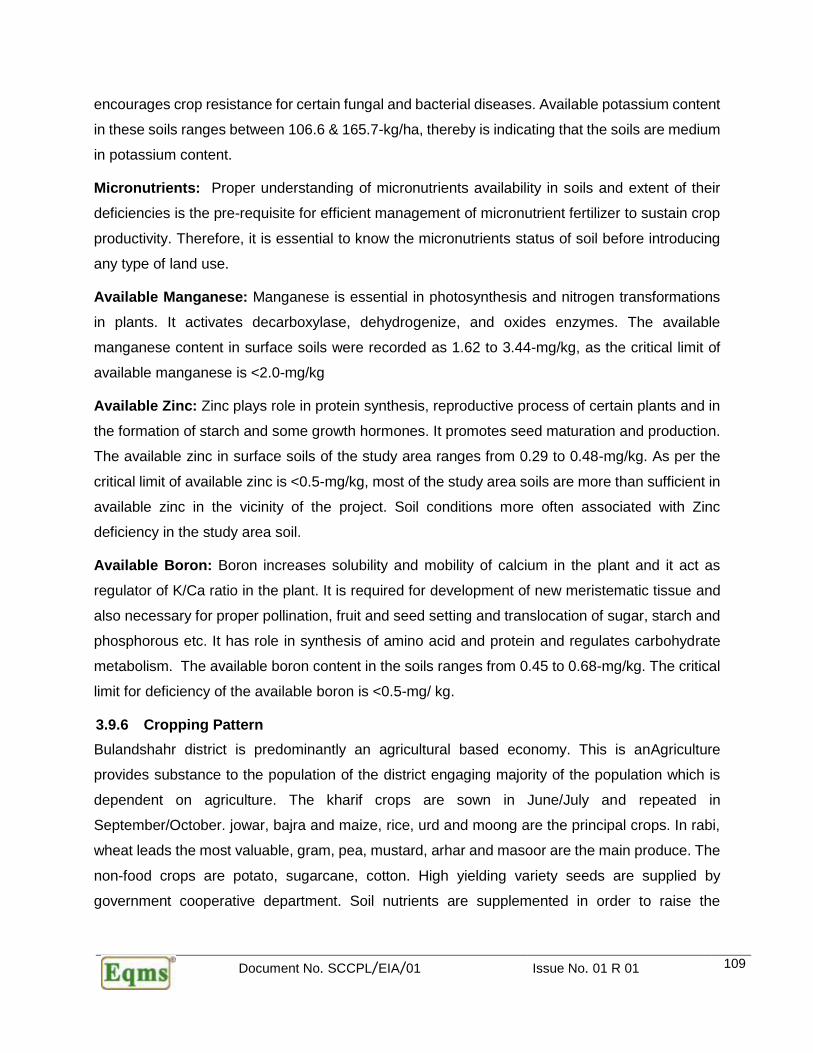
Document No. SCCPL/EIA/01 Issue No. 01 R 01 109
encourages crop resistance for certain fungal and bacterial diseases. Available potassium content
in these soils ranges between 106.6 & 165.7-kg/ha, thereby is indicating that the soils are medium
in potassium content.
Micronutrients: Proper understanding of micronutrients availability in soils and extent of their
deficiencies is the pre-requisite for efficient management of micronutrient fertilizer to sustain crop
productivity. Therefore, it is essential to know the micronutrients status of soil before introducing
any type of land use.
Available Manganese: Manganese is essential in photosynthesis and nitrogen transformations
in plants. It activates decarboxylase, dehydrogenize, and oxides enzymes. The available
manganese content in surface soils were recorded as 1.62 to 3.44-mg/kg, as the critical limit of
available manganese is <2.0-mg/kg
Available Zinc: Zinc plays role in protein synthesis, reproductive process of certain plants and in
the formation of starch and some growth hormones. It promotes seed maturation and production.
The available zinc in surface soils of the study area ranges from 0.29 to 0.48-mg/kg. As per the
critical limit of available zinc is <0.5-mg/kg, most of the study area soils are more than sufficient in
available zinc in the vicinity of the project. Soil conditions more often associated with Zinc
deficiency in the study area soil.
Available Boron: Boron increases solubility and mobility of calcium in the plant and it act as
regulator of K/Ca ratio in the plant. It is required for development of new meristematic tissue and
also necessary for proper pollination, fruit and seed setting and translocation of sugar, starch and
phosphorous etc. It has role in synthesis of amino acid and protein and regulates carbohydrate
metabolism. The available boron content in the soils ranges from 0.45 to 0.68-mg/kg. The critical
limit for deficiency of the available boron is <0.5-mg/ kg.
3.9.6 Cropping Pattern
Bulandshahr district is predominantly an agricultural based economy. This is anAgriculture
provides substance to the population of the district engaging majority of the population which is
dependent on agriculture. The kharif crops are sown in June/July and repeated in
September/October. jowar, bajra and maize, rice, urd and moong are the principal crops. In rabi,
wheat leads the most valuable, gram, pea, mustard, arhar and masoor are the main produce. The
non-food crops are potato, sugarcane, cotton. High yielding variety seeds are supplied by
government cooperative department. Soil nutrients are supplemented in order to raise the
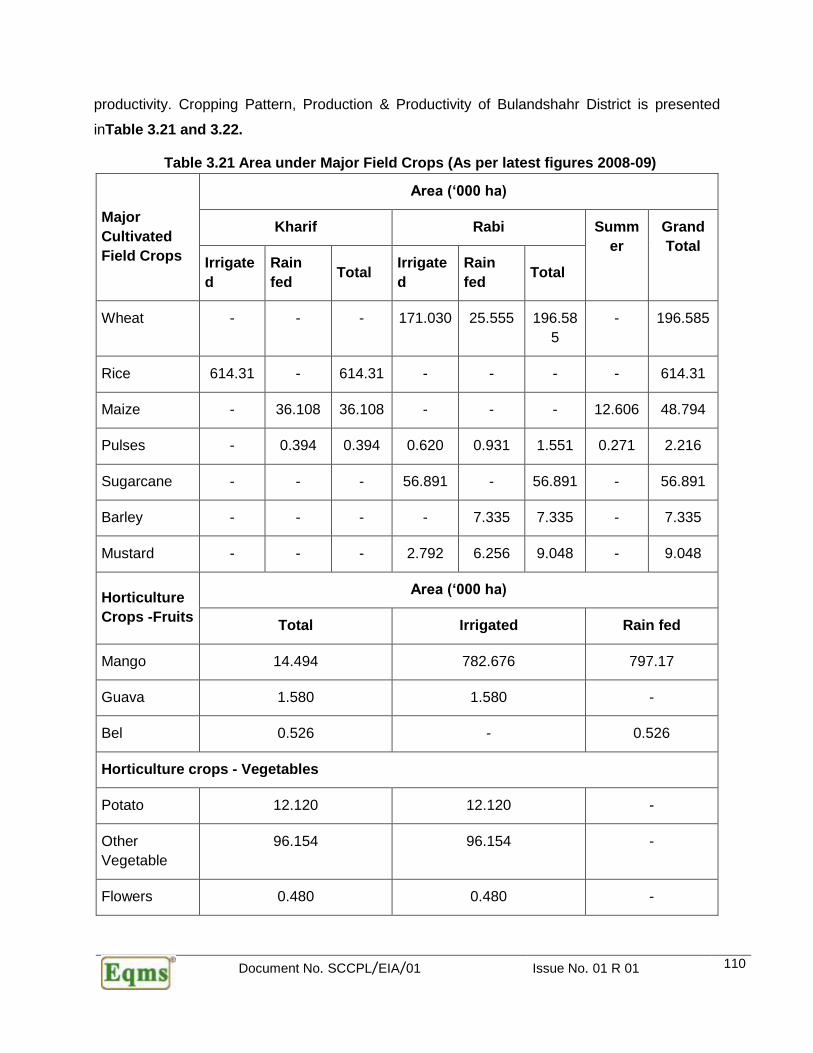
Document No. SCCPL/EIA/01 Issue No. 01 R 01 110
productivity. Cropping Pattern, Production & Productivity of Bulandshahr District is presented
inTable 3.21 and 3.22.
Table 3.21 Area under Major Field Crops (As per latest figures 2008-09)
Major
Cultivated
Field Crops
Area (‘000 ha)
Kharif Rabi Summ
er
Grand
Total Irrigate
d
Rain
fed Total
Irrigate
d
Rain
fed Total
Wheat - - - 171.030 25.555 196.58
5
- 196.585
Rice 614.31 - 614.31 - - - - 614.31
Maize - 36.108 36.108 - - - 12.606 48.794
Pulses - 0.394 0.394 0.620 0.931 1.551 0.271 2.216
Sugarcane - - - 56.891 - 56.891 - 56.891
Barley - - - - 7.335 7.335 - 7.335
Mustard - - - 2.792 6.256 9.048 - 9.048
Horticulture
Crops -Fruits
Area (‘000 ha)
Total Irrigated Rain fed
Mango 14.494 782.676 797.17
Guava 1.580 1.580 -
Bel 0.526 - 0.526
Horticulture crops - Vegetables
Potato 12.120 12.120 -
Other
Vegetable
96.154 96.154 -
Flowers 0.480 0.480 -
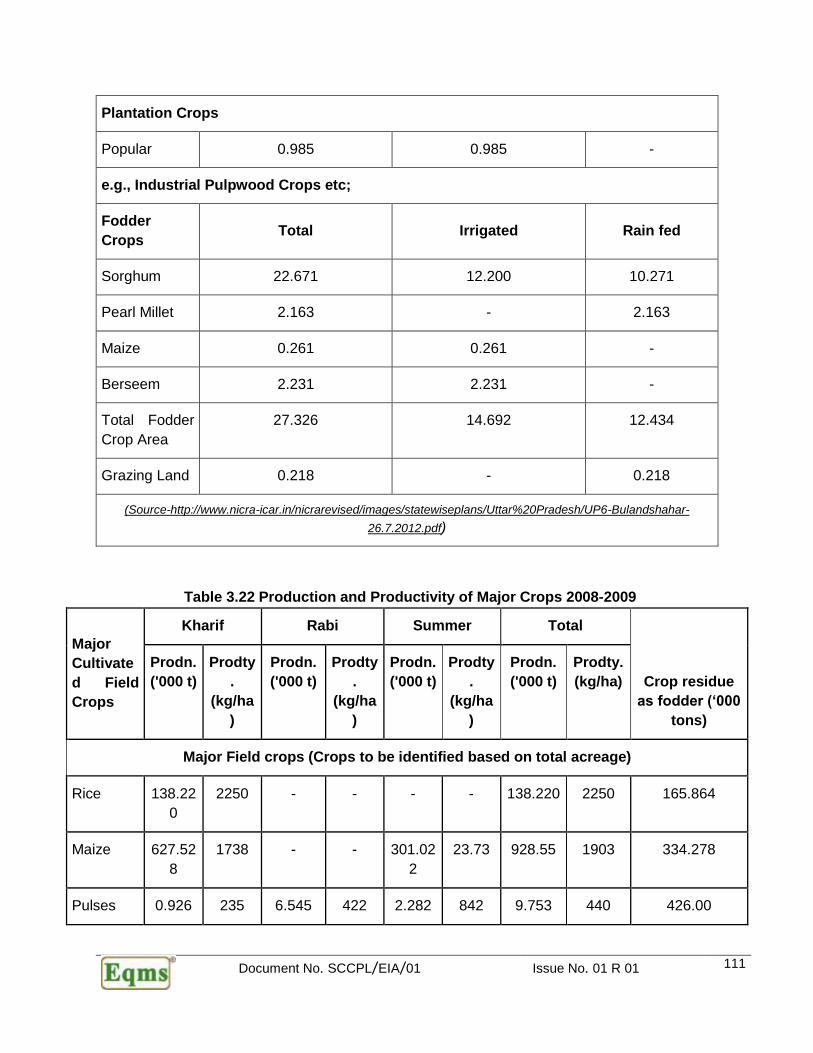
Document No. SCCPL/EIA/01 Issue No. 01 R 01 111
Plantation Crops
Popular 0.985 0.985 -
e.g., Industrial Pulpwood Crops etc;
Fodder
Crops Total Irrigated Rain fed
Sorghum 22.671 12.200 10.271
Pearl Millet 2.163 - 2.163
Maize 0.261 0.261 -
Berseem 2.231 2.231 -
Total Fodder
Crop Area
27.326 14.692 12.434
Grazing Land 0.218 - 0.218
(Source-http://www.nicra-icar.in/nicrarevised/images/statewiseplans/Uttar%20Pradesh/UP6-Bulandshahar-
26.7.2012.pdf)
Table 3.22 Production and Productivity of Major Crops 2008-2009
Major
Cultivate
d Field
Crops
Kharif Rabi Summer Total
Crop residue
as fodder (‘000
tons)
Prodn.
('000 t)
Prodty
.
(kg/ha
)
Prodn.
('000 t)
Prodty
.
(kg/ha
)
Prodn.
('000 t)
Prodty
.
(kg/ha
)
Prodn.
('000 t)
Prodty.
(kg/ha)
Major Field crops (Crops to be identified based on total acreage)
Rice 138.22
0
2250 - - - - 138.220 2250 165.864
Maize 627.52
8
1738 - - 301.02
2
23.73 928.55 1903 334.278
Pulses 0.926 235 6.545 422 2.282 842 9.753 440 426.00
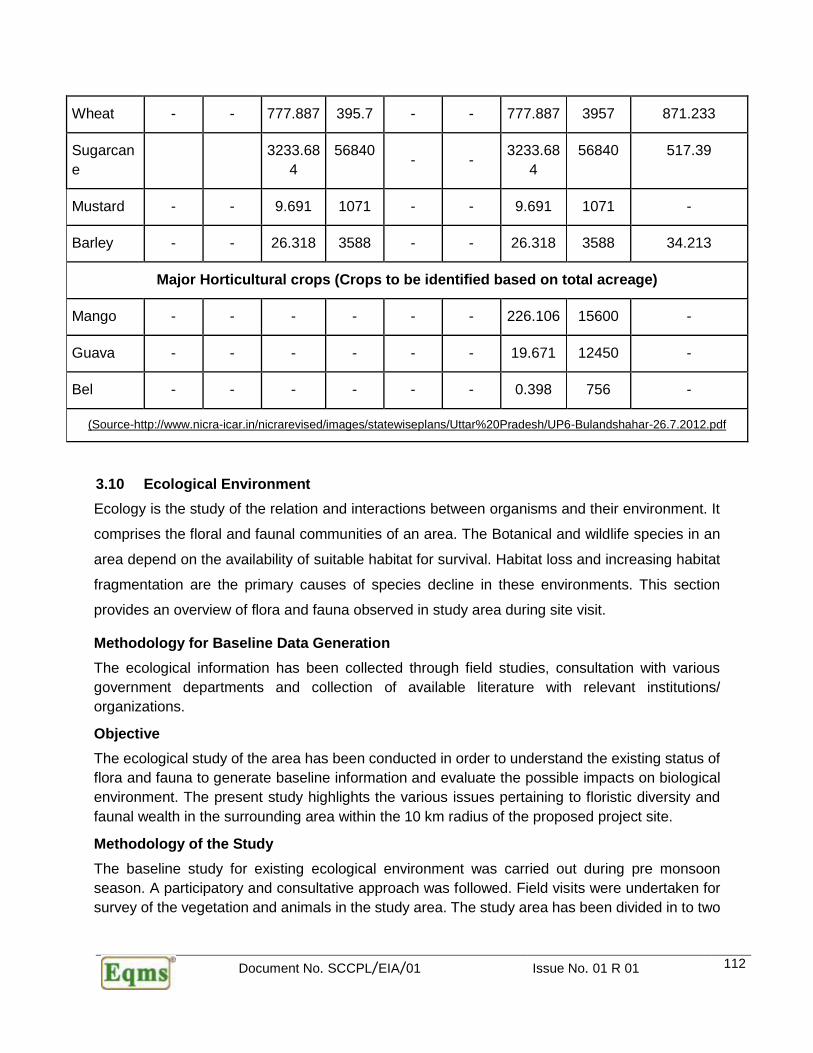
Document No. SCCPL/EIA/01 Issue No. 01 R 01 112
Wheat - - 777.887 395.7 - - 777.887 3957 871.233
Sugarcan
e
3233.68
4
56840 - -
3233.68
4
56840 517.39
Mustard - - 9.691 1071 - - 9.691 1071 -
Barley - - 26.318 3588 - - 26.318 3588 34.213
Major Horticultural crops (Crops to be identified based on total acreage)
Mango - - - - - - 226.106 15600 -
Guava - - - - - - 19.671 12450 -
Bel - - - - - - 0.398 756 -
(Source-http://www.nicra-icar.in/nicrarevised/images/statewiseplans/Uttar%20Pradesh/UP6-Bulandshahar-26.7.2012.pdf
3.10 Ecological Environment
Ecology is the study of the relation and interactions between organisms and their environment. It
comprises the floral and faunal communities of an area. The Botanical and wildlife species in an
area depend on the availability of suitable habitat for survival. Habitat loss and increasing habitat
fragmentation are the primary causes of species decline in these environments. This section
provides an overview of flora and fauna observed in study area during site visit.
Methodology for Baseline Data Generation
The ecological information has been collected through field studies, consultation with various
government departments and collection of available literature with relevant institutions/
organizations.
Objective
The ecological study of the area has been conducted in order to understand the existing status of
flora and fauna to generate baseline information and evaluate the possible impacts on biological
environment. The present study highlights the various issues pertaining to floristic diversity and
faunal wealth in the surrounding area within the 10 km radius of the proposed project site.
Methodology of the Study
The baseline study for existing ecological environment was carried out during pre monsoon
season. A participatory and consultative approach was followed. Field visits were undertaken for
survey of the vegetation and animals in the study area. The study area has been divided in to two

Document No. SCCPL/EIA/01 Issue No. 01 R 01 113
parts as core area consisting of project site and the buffer area as the 10 km radius of the project
site.
Flora
The proposed project lies in the upper-Gangetic plain of Uttar Pradesh in district Bulandshahr. The
area enjoys tropical monsoonal condition; elevation from sea level varies from 185-205 m and
thus supports dry deciduous vegetation. The study area comprises many water channels
distributed from Upper Ganga canal.
Proposed plant unit is located in Industrial area. No tree cutting is required. No vegetation is
present within the proposed plant site (core zone) and no wildlife exists within the core zone.
Most of the land around the study area (10 km radius around the project site) is under agriculture
and residential uses. No national parks, wild life sanctuary, biosphere reserve is present within 10
km area of the project site. No Reserve Forest and protected forests are present within the study
area. Because there is no forest in the study area and the vegetation is restricted along the
agriculture fields, road side and other open areas. The vegetation is meager in spite of the
favorable environmental conditions. During the ecological survey only shrubby vegetation like
Zyziphus sp., Acacia Sp., Lantana camara, Sacchrum munjaCalotropis procera etc. was found
indominance. Tree species like Azadirachta indica, Acacia catechu, Acacia nilotica, Mangifera
indica etc. were also seen growing in the area. Other tree species observed in the study area are
Mangifera indica, Azadirachta indica, Acacia nilotica, Ficus benghalensis, Ficusreligiosa,
Delbergia sissoo, etc. Most of the land is under cultivation by the villagers. Wheat, maize,rice,
sugar cane, pulses and vegetable etc. are cultivated in these fields. Ground vegetation covered
by dominant by the herbs and shrub species like Zyziphus mauritiana, Argemone mexicana,
Solanum surattense, Xanthium strumarium, Ipomea cornia, Ipomea fistulosa, Dhatura metal,
Calotropis procera, Sida cordifolia, Polygonum glabrum, Cassia tora, Canabis sativa,
Chenopodium album, Cyanodon dactylon, Parthenium hysterophorus and Achyranthus aspera.
The list of the plant species observed in the study area is given Table 3.23 & 3.24.
Table 3.23 List of Common Tree Species Present in Study Area
Sl.
No. Botanical Name Family Common Name Habit
1. Acacia catechu Mimosaceae Khair Tree
2. Acacia nilotica Mimosaceae Babool Tree
3. Azadirachta indica Meliaceae Neem Tree
4. Cassia fistula Caesalpinaceae Amaltas Herb
5. Dalbergia sissoo Dipterocarpaceae Shisham Tree
6. Delonix regia Caesalpinaceae Gulmohar Tree

Document No. SCCPL/EIA/01 Issue No. 01 R 01 114
7. Eucalyptus sp. Myrtaceae Safeda Tree
8. Ficus benghalensis L. Moraceae Bargad Tree
9. Ficus religiosa Moraceae Pepal Tree
10. Mangifera indica Anacardiaceae Aam Tree
11. Prosopis juliflora Mimocaseae Babool Tree
12. Psidium guayava Myrtaceae Amrud Tree
13. Syzygium cumini Myrtaceae Jamun Tree
14. Syzygium heyneanum Myrtaceae Kat Jamun Tree
15. Tamarindus indica Fabaceae Imli Tree
16. Terminalia arjuna Combretaceae Arjun Tree
Table 3.24 List of Shrub, Herbs and Grasses
1. Arbus prectatotrius Papilionaceae Gunj Shrub
2. Achyranthes aspera Amarantaceae Apamarg Shrub
3. Agave americana Agavaceae Agave Shrub
4. Adhatoda vasica Acanthaceae Adusa Shrub
5. Azanza lampus Malvaceae Bankapas Shrub
6. Barleria cristata Acahthaceae Koranta Shrub
7. Calotropis procera Asclepediaceae Ak Shrub
8. Murraya Koenigii Rutaceae Mithaneem Shrub
9. Salvadora oleoides Salvadoraceae Pilu Shrub
10. Indigofera pulchella Papilionaceae Neel Shrub
11. Ipomea spp. Convolvulaceae Besharm Shrub
12. Lantana camara Verbenaceae Raimunia Shrub
13. Nyctanthes arbortristis Oleaceae Harsingar Shrub
14. Sida cardifolia Malvaceae Mamas Shrub
15. Vitex negundo Verbenaceae Nirgudi Shrub
16. Argemone Mexicana Papaveraceae Pilikateri Herb
17. Cassia tora Caesalpiniaceae Puar Herb
18. Chenopodium album Amaranthaceae Bathua Herb
19. Datura stramonium Solanaceae Datura Herb
20. Euphorbia hirta Euphorbiaceae Dudhi Herb
21. Indigofera caerulea Fabaceae - Herb
22. Parthenium hysterophorus Asteraceae Gajarghas Herb
23. Sida acuta Malvaceae Mahabala Herb
24. Sida cordifolia Malvaceae Bala Herb
25. Solanum surattense Solanaceae Bhatkataiya Herb
26. Tridax procumbens Asteraceae Ghamra Herb
27. Triumfetta pentandra Tiliaceae - Herb
28. Vernonia cinerea Asteraceae Sahdevi Herb
29. Xanthium strumarium Solanaceae Gokharu Herb
30. Cocculus hirsutus Menispermaceae Chirenta Grass
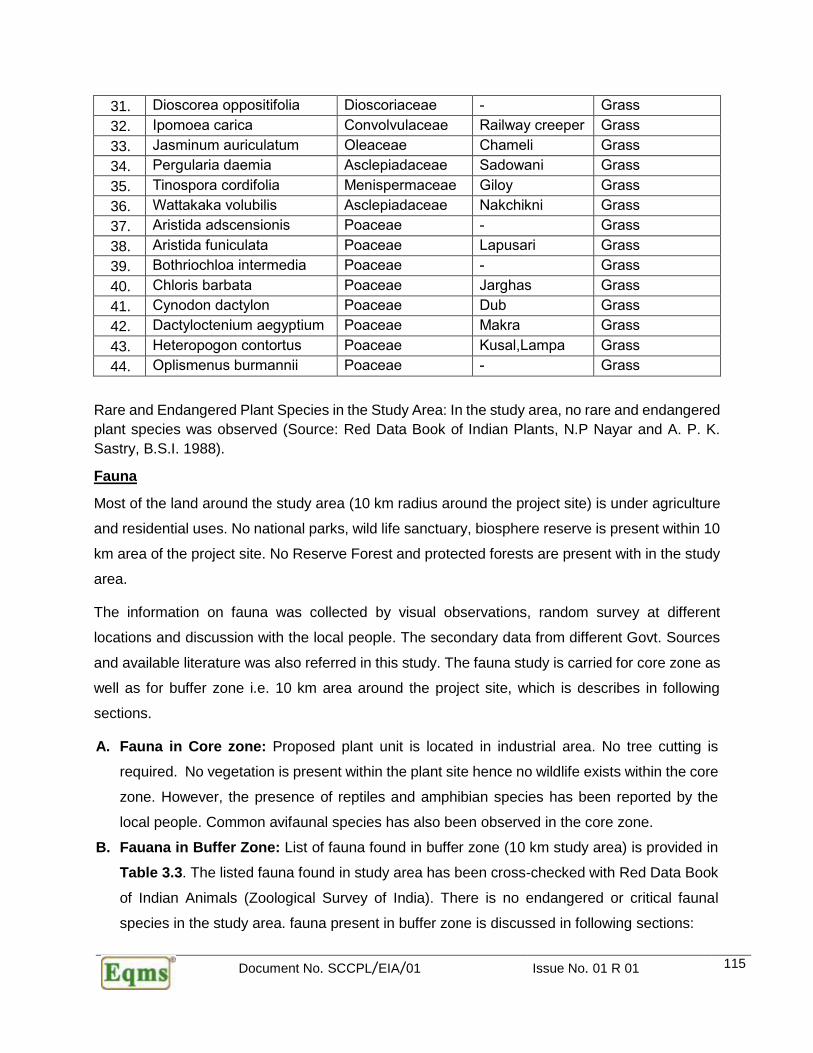
Document No. SCCPL/EIA/01 Issue No. 01 R 01 115
31. Dioscorea oppositifolia Dioscoriaceae - Grass
32. Ipomoea carica Convolvulaceae Railway creeper Grass
33. Jasminum auriculatum Oleaceae Chameli Grass
34. Pergularia daemia Asclepiadaceae Sadowani Grass
35. Tinospora cordifolia Menispermaceae Giloy Grass
36. Wattakaka volubilis Asclepiadaceae Nakchikni Grass
37. Aristida adscensionis Poaceae - Grass
38. Aristida funiculata Poaceae Lapusari Grass
39. Bothriochloa intermedia Poaceae - Grass
40. Chloris barbata Poaceae Jarghas Grass
41. Cynodon dactylon Poaceae Dub Grass
42. Dactyloctenium aegyptium Poaceae Makra Grass
43. Heteropogon contortus Poaceae Kusal,Lampa Grass
44. Oplismenus burmannii Poaceae - Grass
Rare and Endangered Plant Species in the Study Area: In the study area, no rare and endangered
plant species was observed (Source: Red Data Book of Indian Plants, N.P Nayar and A. P. K.
Sastry, B.S.I. 1988).
Fauna
Most of the land around the study area (10 km radius around the project site) is under agriculture
and residential uses. No national parks, wild life sanctuary, biosphere reserve is present within 10
km area of the project site. No Reserve Forest and protected forests are present with in the study
area.
The information on fauna was collected by visual observations, random survey at different
locations and discussion with the local people. The secondary data from different Govt. Sources
and available literature was also referred in this study. The fauna study is carried for core zone as
well as for buffer zone i.e. 10 km area around the project site, which is describes in following
sections.
A. Fauna in Core zone: Proposed plant unit is located in industrial area. No tree cutting is
required. No vegetation is present within the plant site hence no wildlife exists within the core
zone. However, the presence of reptiles and amphibian species has been reported by the
local people. Common avifaunal species has also been observed in the core zone.
B. Fauana in Buffer Zone: List of fauna found in buffer zone (10 km study area) is provided in
Table 3.3. The listed fauna found in study area has been cross-checked with Red Data Book
of Indian Animals (Zoological Survey of India). There is no endangered or critical faunal
species in the study area. fauna present in buffer zone is discussed in following sections:
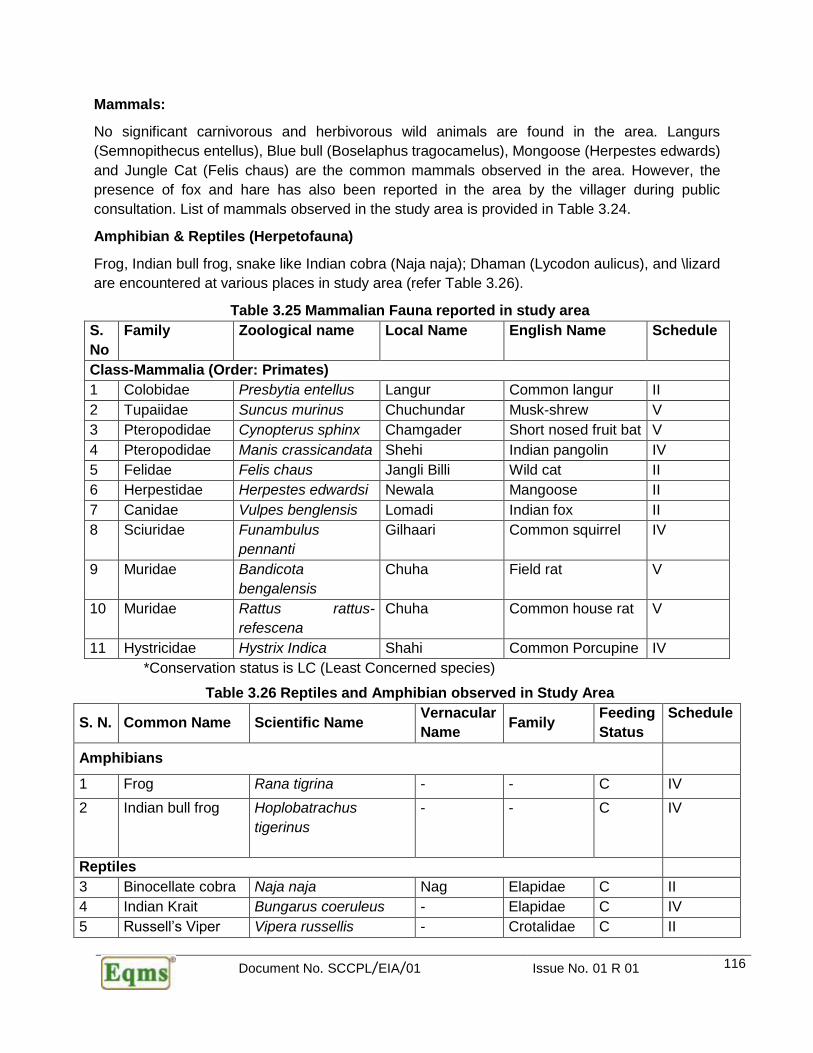
Document No. SCCPL/EIA/01 Issue No. 01 R 01 116
Mammals:
No significant carnivorous and herbivorous wild animals are found in the area. Langurs
(Semnopithecus entellus), Blue bull (Boselaphus tragocamelus), Mongoose (Herpestes edwards)
and Jungle Cat (Felis chaus) are the common mammals observed in the area. However, the
presence of fox and hare has also been reported in the area by the villager during public
consultation. List of mammals observed in the study area is provided in Table 3.24.
Amphibian & Reptiles (Herpetofauna)
Frog, Indian bull frog, snake like Indian cobra (Naja naja); Dhaman (Lycodon aulicus), and \lizard
are encountered at various places in study area (refer Table 3.26).
Table 3.25 Mammalian Fauna reported in study area
S.
No
Family Zoological name Local Name English Name Schedule
Class-Mammalia (Order: Primates)
1 Colobidae Presbytia entellus Langur Common langur II
2 Tupaiidae Suncus murinus Chuchundar Musk-shrew V
3 Pteropodidae Cynopterus sphinx Chamgader Short nosed fruit bat V
4 Pteropodidae Manis crassicandata Shehi Indian pangolin IV
5 Felidae Felis chaus Jangli Billi Wild cat II
6 Herpestidae Herpestes edwardsi Newala Mangoose II
7 Canidae Vulpes benglensis Lomadi Indian fox II
8 Sciuridae Funambulus
pennanti
Gilhaari Common squirrel IV
9 Muridae Bandicota
bengalensis
Chuha Field rat V
10 Muridae Rattus rattus-
refescena
Chuha Common house rat V
11 Hystricidae Hystrix Indica Shahi Common Porcupine IV
*Conservation status is LC (Least Concerned species)
Table 3.26 Reptiles and Amphibian observed in Study Area
S. N. Common Name Scientific Name Vernacular
Name Family
Feeding
Status
Schedule
Amphibians
1 Frog Rana tigrina - - C IV
2 Indian bull frog Hoplobatrachus
tigerinus
- - C IV
Reptiles
3 Binocellate cobra Naja naja Nag Elapidae C II
4 Indian Krait Bungarus coeruleus - Elapidae C IV
5 Russell’s Viper Vipera russellis - Crotalidae C II
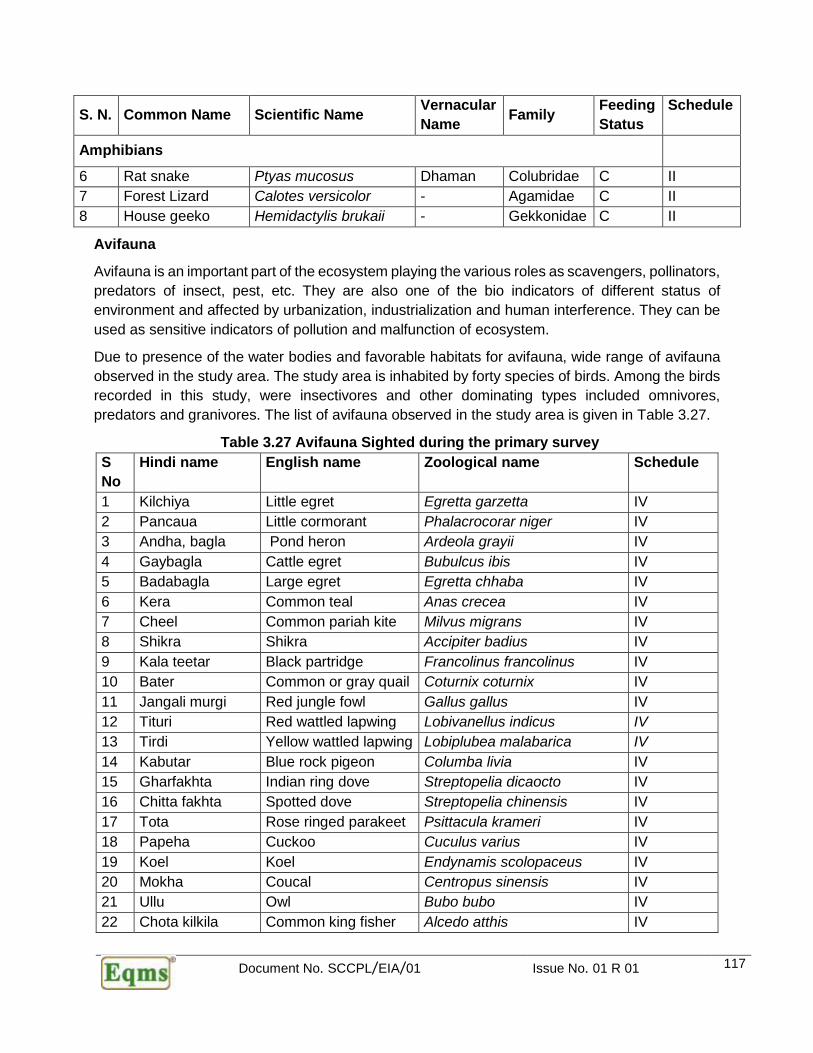
Document No. SCCPL/EIA/01 Issue No. 01 R 01 117
S. N. Common Name Scientific Name Vernacular
Name Family
Feeding
Status
Schedule
Amphibians
6 Rat snake Ptyas mucosus Dhaman Colubridae C II
7 Forest Lizard Calotes versicolor - Agamidae C II
8 House geeko Hemidactylis brukaii - Gekkonidae C II
Avifauna
Avifauna is an important part of the ecosystem playing the various roles as scavengers, pollinators,
predators of insect, pest, etc. They are also one of the bio indicators of different status of
environment and affected by urbanization, industrialization and human interference. They can be
used as sensitive indicators of pollution and malfunction of ecosystem.
Due to presence of the water bodies and favorable habitats for avifauna, wide range of avifauna
observed in the study area. The study area is inhabited by forty species of birds. Among the birds
recorded in this study, were insectivores and other dominating types included omnivores,
predators and granivores. The list of avifauna observed in the study area is given in Table 3.27.
Table 3.27 Avifauna Sighted during the primary survey
S
No
Hindi name English name Zoological name Schedule
1 Kilchiya Little egret Egretta garzetta IV
2 Pancaua Little cormorant Phalacrocorar niger IV
3 Andha, bagla Pond heron Ardeola grayii IV
4 Gaybagla Cattle egret Bubulcus ibis IV
5 Badabagla Large egret Egretta chhaba IV
6 Kera Common teal Anas crecea IV
7 Cheel Common pariah kite Milvus migrans IV
8 Shikra Shikra Accipiter badius IV
9 Kala teetar Black partridge Francolinus francolinus IV
10 Bater Common or gray quail Coturnix coturnix IV
11 Jangali murgi Red jungle fowl Gallus gallus IV
12 Tituri Red wattled lapwing Lobivanellus indicus IV
13 Tirdi Yellow wattled lapwing Lobiplubea malabarica IV
14 Kabutar Blue rock pigeon Columba livia IV
15 Gharfakhta Indian ring dove Streptopelia dicaocto IV
16 Chitta fakhta Spotted dove Streptopelia chinensis IV
17 Tota Rose ringed parakeet Psittacula krameri IV
18 Papeha Cuckoo Cuculus varius IV
19 Koel Koel Endynamis scolopaceus IV
20 Mokha Coucal Centropus sinensis IV
21 Ullu Owl Bubo bubo IV
22 Chota kilkila Common king fisher Alcedo atthis IV
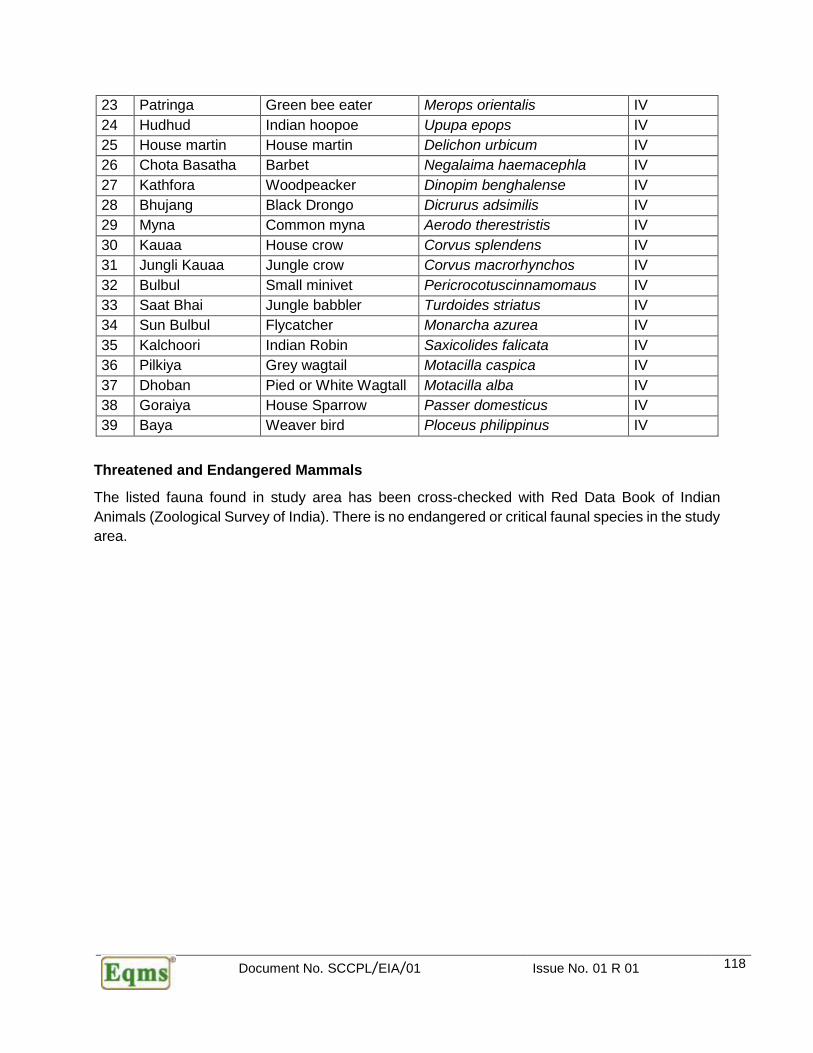
Document No. SCCPL/EIA/01 Issue No. 01 R 01 118
23 Patringa Green bee eater Merops orientalis IV
24 Hudhud Indian hoopoe Upupa epops IV
25 House martin House martin Delichon urbicum IV
26 Chota Basatha Barbet Negalaima haemacephla IV
27 Kathfora Woodpeacker Dinopim benghalense IV
28 Bhujang Black Drongo Dicrurus adsimilis IV
29 Myna Common myna Aerodo therestristis IV
30 Kauaa House crow Corvus splendens IV
31 Jungli Kauaa Jungle crow Corvus macrorhynchos IV
32 Bulbul Small minivet Pericrocotuscinnamomaus IV
33 Saat Bhai Jungle babbler Turdoides striatus IV
34 Sun Bulbul Flycatcher Monarcha azurea IV
35 Kalchoori Indian Robin Saxicolides falicata IV
36 Pilkiya Grey wagtail Motacilla caspica IV
37 Dhoban Pied or White Wagtall Motacilla alba IV
38 Goraiya House Sparrow Passer domesticus IV
39 Baya Weaver bird Ploceus philippinus IV
Threatened and Endangered Mammals
The listed fauna found in study area has been cross-checked with Red Data Book of Indian
Animals (Zoological Survey of India). There is no endangered or critical faunal species in the study
area.

Document No. SCCPL/EIA/01 Issue No. 01 R 01 119
3.11 Socio-Economic Environment
3.11.1 Demographic & Socio-Economic Features
Demography is one of the important indicators of environmental health of an area. It includes
population, number of households, literacy, population density, etc. In order to assess the
demographic features of the area, census data of Bulandshahr and Gautam Buddha Nagar district,
in Uttar Pradesh State for the year 2011 was compiled and placed in the form of tabulation and
graphical presentation.
The Bulandshahr district is located in the north western part of Uttar Pradesh. With a population
of 19.95-crore in 2011, Uttar Pradesh is the most populous state in the country accounting for
16.9% of the country’s population.
The study area is falling mainly in two districts i.e.; Bulandshahr and Gautam Buddha Nagar of
Uttar Pradesh. As per the Census Record of 2011, Bulandshahr and Gautam Buddha Nagar
district has a population of 3,498,507 & 1,674,714 persons respectively. Both the districts have a
population density of 788 & 1161 inhabitants per square kilometre respectively. Their population
growth rate over the decade 2001-11, was recorded as 20.09 & 39.3% respectively. Sex ratio in
both districts was also recorded as 892 & 852 females for every 1000 males, and a literacy rate of
76.2 & 82.2%. Total population in age-group 0-6 is 549,796 persons comprising 296,558 males
and 253,238 females in Bulandshahr district. The total sex-ratio in this age-group works out to be
854 females for every thousand males in the district.
Due to its close proximity to Delhi, the population is highly literate in Gautam Buddha nagar district
with 82.2% of population in the district are literate compared to 74.0% national average. The
female literacy rate in Gautam Buddha Nagar stands at 72.8% much higher than national average
of 65.5%.
3.11.2 Population Distribution in the Study Area
As per the census records 2011, the total population of the 2.0-km radial zone of study area was
recorded as 18506 persons of Seven (07) revenue villages/towns of Bulandshahr and Gautam
Buddha Nagar District of Uttar Pradesh. All the revenue villages/towns are mainly under two (02)
tehsils namely Sikandrabad, and Dadri, of Bulandshahr and Gautam Buddha Nagar District
respectively in Uttar Pradesh. Total number of ‘Households’ was observed as 3295 in the 2.0-km
radius study zone. Male-female wise total population was recorded as 10119 males and 8387
females respectively. Caste-wise population distribution of the 2.0-km radial study zone is shown
in shown in Table 3.28
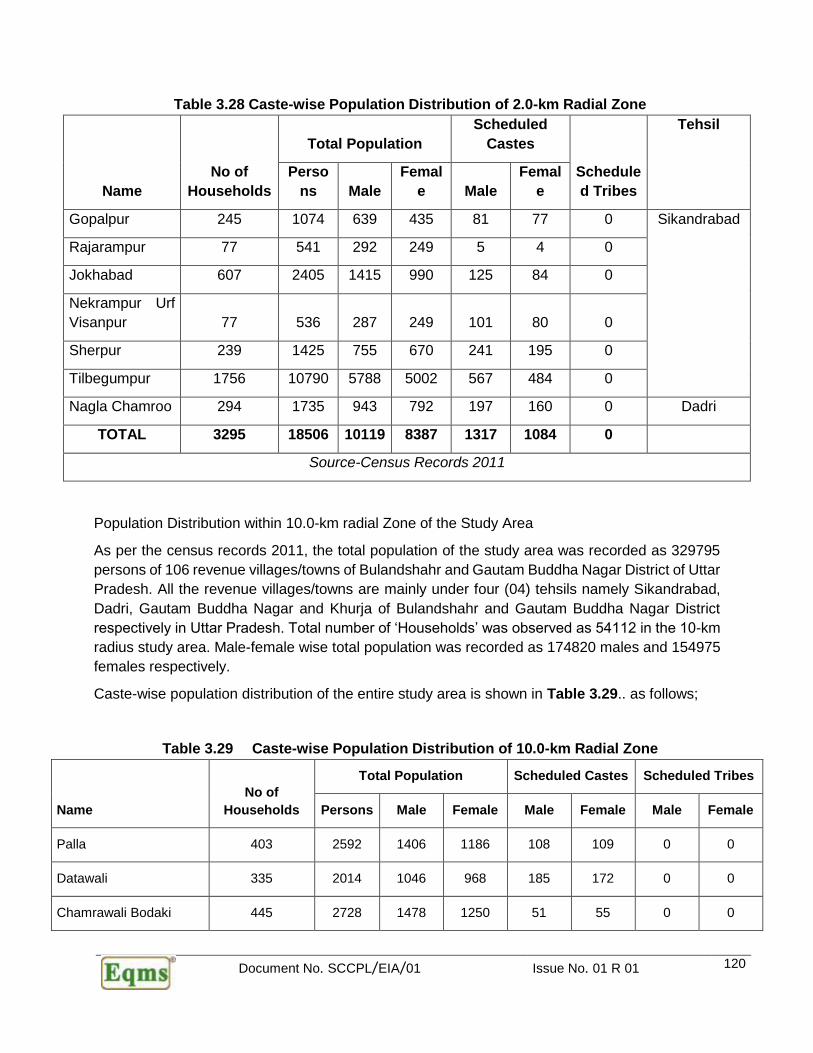
Document No. SCCPL/EIA/01 Issue No. 01 R 01 120
Table 3.28 Caste-wise Population Distribution of 2.0-km Radial Zone
Name
No of
Households
Total Population
Scheduled
Castes
Schedule
d Tribes
Tehsil
Perso
ns Male
Femal
e Male
Femal
e
Gopalpur 245 1074 639 435 81 77 0 Sikandrabad
Rajarampur 77 541 292 249 5 4 0
Jokhabad 607 2405 1415 990 125 84 0
Nekrampur Urf
Visanpur 77 536 287 249 101 80 0
Sherpur 239 1425 755 670 241 195 0
Tilbegumpur 1756 10790 5788 5002 567 484 0
Nagla Chamroo 294 1735 943 792 197 160 0 Dadri
TOTAL 3295 18506 10119 8387 1317 1084 0
Source-Census Records 2011
Population Distribution within 10.0-km radial Zone of the Study Area
As per the census records 2011, the total population of the study area was recorded as 329795
persons of 106 revenue villages/towns of Bulandshahr and Gautam Buddha Nagar District of Uttar
Pradesh. All the revenue villages/towns are mainly under four (04) tehsils namely Sikandrabad,
Dadri, Gautam Buddha Nagar and Khurja of Bulandshahr and Gautam Buddha Nagar District
respectively in Uttar Pradesh. Total number of ‘Households’ was observed as 54112 in the 10-km
radius study area. Male-female wise total population was recorded as 174820 males and 154975
females respectively.
Caste-wise population distribution of the entire study area is shown in Table 3.29.. as follows;
Table 3.29 Caste-wise Population Distribution of 10.0-km Radial Zone
Name
No of
Households
Total Population Scheduled Castes Scheduled Tribes
Persons Male Female Male Female Male Female
Palla 403 2592 1406 1186 108 109 0 0
Datawali 335 2014 1046 968 185 172 0 0
Chamrawali Bodaki 445 2728 1478 1250 51 55 0 0

Document No. SCCPL/EIA/01 Issue No. 01 R 01 121
Junpat 302 1967 1030 937 181 172 0 0
Khatana Dhirkhera 783 4490 2335 2155 331 315 0 0
Gulaothi Khurd 257 1469 775 694 41 46 0 0
Chak Senpur Urf
Dhanibas 235 1359 708 651 360 335 0 0
Uplarasi 225 1388 744 644 241 205 0 0
Jarcha 1583 9548 5067 4481 1356 1187 3 3
Kalonda 1371 9910 5143 4767 247 205 43 37
Chholas 993 6192 3255 2937 540 476 0 0
Chhayansa 421 2641 1437 1204 209 192 0 0
Daya Nagar 94 537 292 245 10 9 0 0
Bairangpur Urf Nai Basti 424 3071 1627 1444 285 270 0 0
Phoolpur 208 1344 753 591 34 27 0 0
Anandpur 191 1272 679 593 83 55 0 0
Khandera Girirajpur 363 2359 1262 1097 468 399 0 0
Noorpur 513 3404 1813 1591 111 118 0 0
Milak Khandera 61 503 282 221 0 0 0 0
Nagla Nainsukh 256 1544 827 717 108 105 0 0
Saithali 620 3799 1986 1813 677 631 0 0
Beel Akbarpur 355 2194 1121 1073 335 340 0 0
Kot 672 4244 2251 1993 179 173 0 0
Bhogpur 194 1375 757 618 382 293 0 0
Luharli 139
Basantpur Bangar 739 4389 2353 2036 369 369 0 0
Basantpur Bangar 97 581 305 276 76 67 0 0
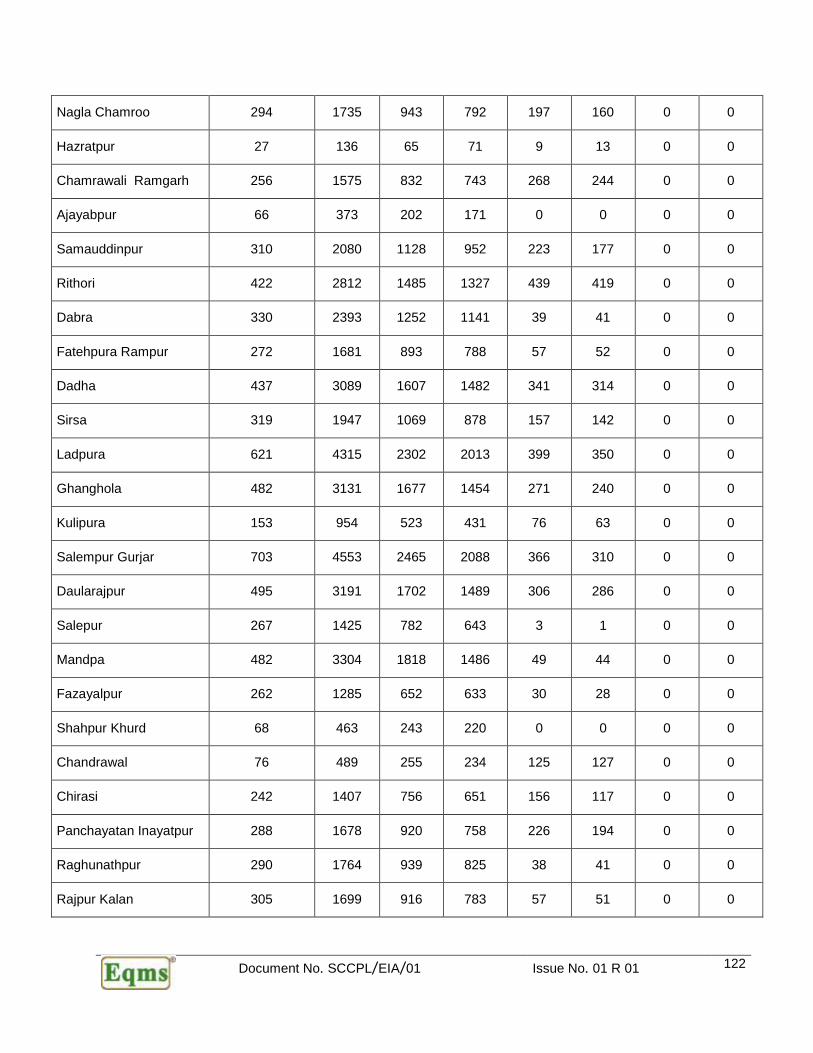
Document No. SCCPL/EIA/01 Issue No. 01 R 01 122
Nagla Chamroo 294 1735 943 792 197 160 0 0
Hazratpur 27 136 65 71 9 13 0 0
Chamrawali Ramgarh 256 1575 832 743 268 244 0 0
Ajayabpur 66 373 202 171 0 0 0 0
Samauddinpur 310 2080 1128 952 223 177 0 0
Rithori 422 2812 1485 1327 439 419 0 0
Dabra 330 2393 1252 1141 39 41 0 0
Fatehpura Rampur 272 1681 893 788 57 52 0 0
Dadha 437 3089 1607 1482 341 314 0 0
Sirsa 319 1947 1069 878 157 142 0 0
Ladpura 621 4315 2302 2013 399 350 0 0
Ghanghola 482 3131 1677 1454 271 240 0 0
Kulipura 153 954 523 431 76 63 0 0
Salempur Gurjar 703 4553 2465 2088 366 310 0 0
Daularajpur 495 3191 1702 1489 306 286 0 0
Salepur 267 1425 782 643 3 1 0 0
Mandpa 482 3304 1818 1486 49 44 0 0
Fazayalpur 262 1285 652 633 30 28 0 0
Shahpur Khurd 68 463 243 220 0 0 0 0
Chandrawal 76 489 255 234 125 127 0 0
Chirasi 242 1407 756 651 156 117 0 0
Panchayatan Inayatpur 288 1678 920 758 226 194 0 0
Raghunathpur 290 1764 939 825 38 41 0 0
Rajpur Kalan 305 1699 916 783 57 51 0 0
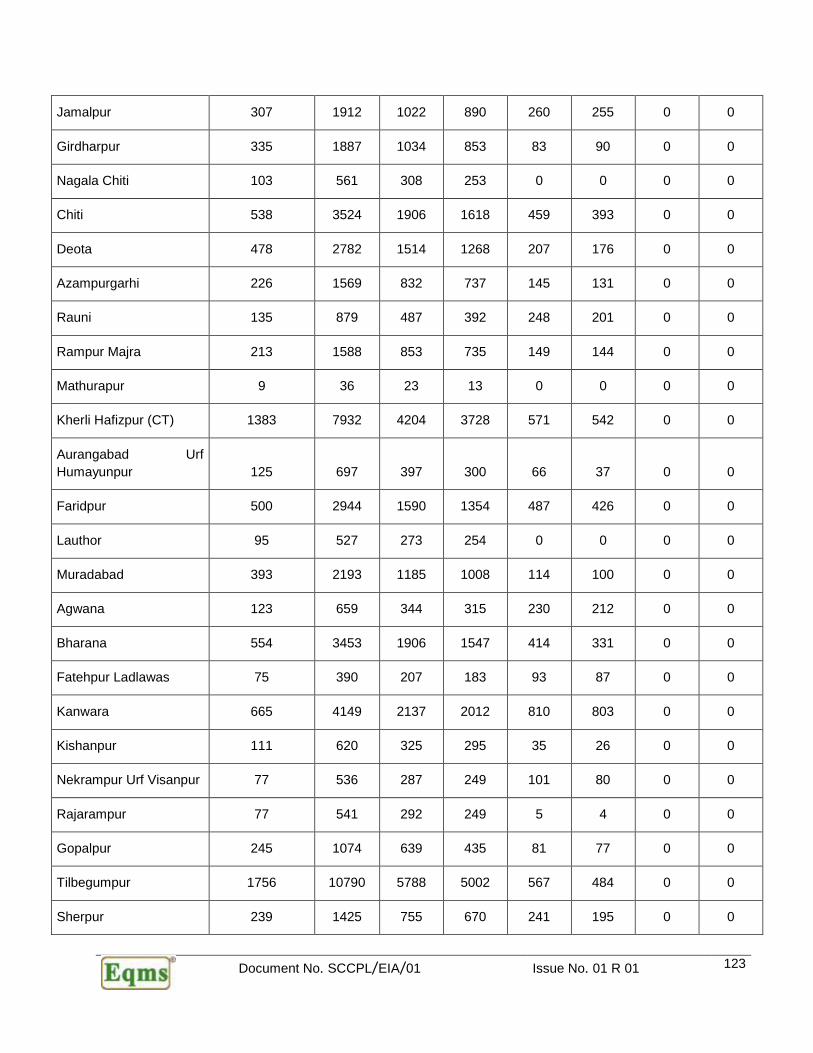
Document No. SCCPL/EIA/01 Issue No. 01 R 01 123
Jamalpur 307 1912 1022 890 260 255 0 0
Girdharpur 335 1887 1034 853 83 90 0 0
Nagala Chiti 103 561 308 253 0 0 0 0
Chiti 538 3524 1906 1618 459 393 0 0
Deota 478 2782 1514 1268 207 176 0 0
Azampurgarhi 226 1569 832 737 145 131 0 0
Rauni 135 879 487 392 248 201 0 0
Rampur Majra 213 1588 853 735 149 144 0 0
Mathurapur 9 36 23 13 0 0 0 0
Kherli Hafizpur (CT) 1383 7932 4204 3728 571 542 0 0
Aurangabad Urf
Humayunpur 125 697 397 300 66 37 0 0
Faridpur 500 2944 1590 1354 487 426 0 0
Lauthor 95 527 273 254 0 0 0 0
Muradabad 393 2193 1185 1008 114 100 0 0
Agwana 123 659 344 315 230 212 0 0
Bharana 554 3453 1906 1547 414 331 0 0
Fatehpur Ladlawas 75 390 207 183 93 87 0 0
Kanwara 665 4149 2137 2012 810 803 0 0
Kishanpur 111 620 325 295 35 26 0 0
Nekrampur Urf Visanpur 77 536 287 249 101 80 0 0
Rajarampur 77 541 292 249 5 4 0 0
Gopalpur 245 1074 639 435 81 77 0 0
Tilbegumpur 1756 10790 5788 5002 567 484 0 0
Sherpur 239 1425 755 670 241 195 0 0

Document No. SCCPL/EIA/01 Issue No. 01 R 01 124
Jokhabad 607 2405 1415 990 125 84 0 0
Hirdeypur 218 1383 728 655 83 71 0 0
Sanwali 496 2608 1419 1189 30 29 0 0
Rajpur Khurd 91 569 308 261 4 4 0 0
Andhel 318 1994 1066 928 365 315 0 0
Nagla Shekh 44 262 129 133 30 31 0 0
Piriyabani 317 2002 1062 940 135 127 0 0
Benipur 257 1414 751 663 154 136 0 0
Khaguwa Was 233 1316 695 621 201 176 0 0
Mandawarah 592 3382 1808 1574 1399 1230 0 0
Bhatpura 318 1828 982 846 559 466 0 0
Ritoli 264 1470 767 703 41 43 0 0
Dadupur Neela 310 1804 943 861 106 79 0 0
Manjupur 33 220 110 110 0 0 0 0
Srodhan 649 3651 1888 1763 294 252 0 0
Sikandrabad Rural 4144 22794 12053 10741 2723 2359 1 0
Hasanpur Jagir 415 2384 1276 1108 408 341 0 0
Biswanah 84 650 329 321 19 16 0 0
Babiya 143 846 450 396 2 1 0 0
Kherpur Tila 158 1146 600 546 197 187 0 0
Mahtab Nagar 186 1148 622 526 190 143 0 0
Masauta 273 1855 967 888 336 303 0 0
Malhpur 103 633 320 313 93 102 0 0
Bhonkhera 164 955 495 460 97 97 0 0
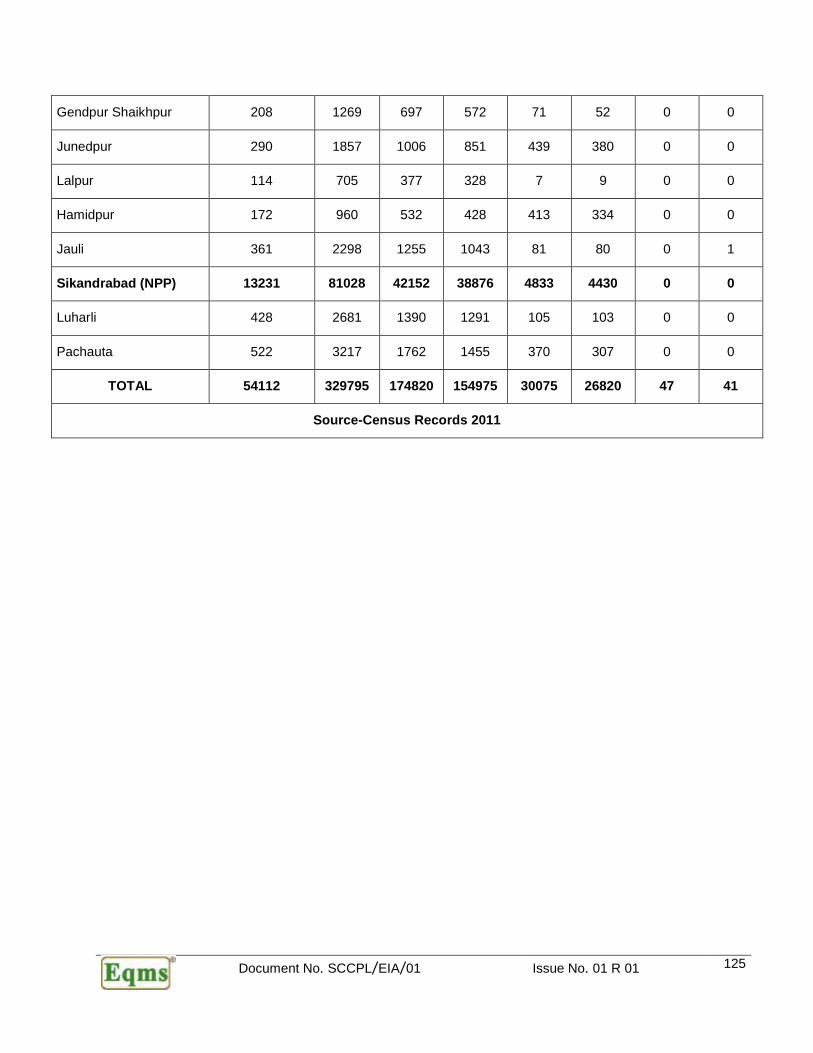
Document No. SCCPL/EIA/01 Issue No. 01 R 01 125
Gendpur Shaikhpur 208 1269 697 572 71 52 0 0
Junedpur 290 1857 1006 851 439 380 0 0
Lalpur 114 705 377 328 7 9 0 0
Hamidpur 172 960 532 428 413 334 0 0
Jauli 361 2298 1255 1043 81 80 0 1
Sikandrabad (NPP) 13231 81028 42152 38876 4833 4430 0 0
Luharli 428 2681 1390 1291 105 103 0 0
Pachauta 522 3217 1762 1455 370 307 0 0
TOTAL 54112 329795 174820 154975 30075 26820 47 41
Source-Census Records 2011
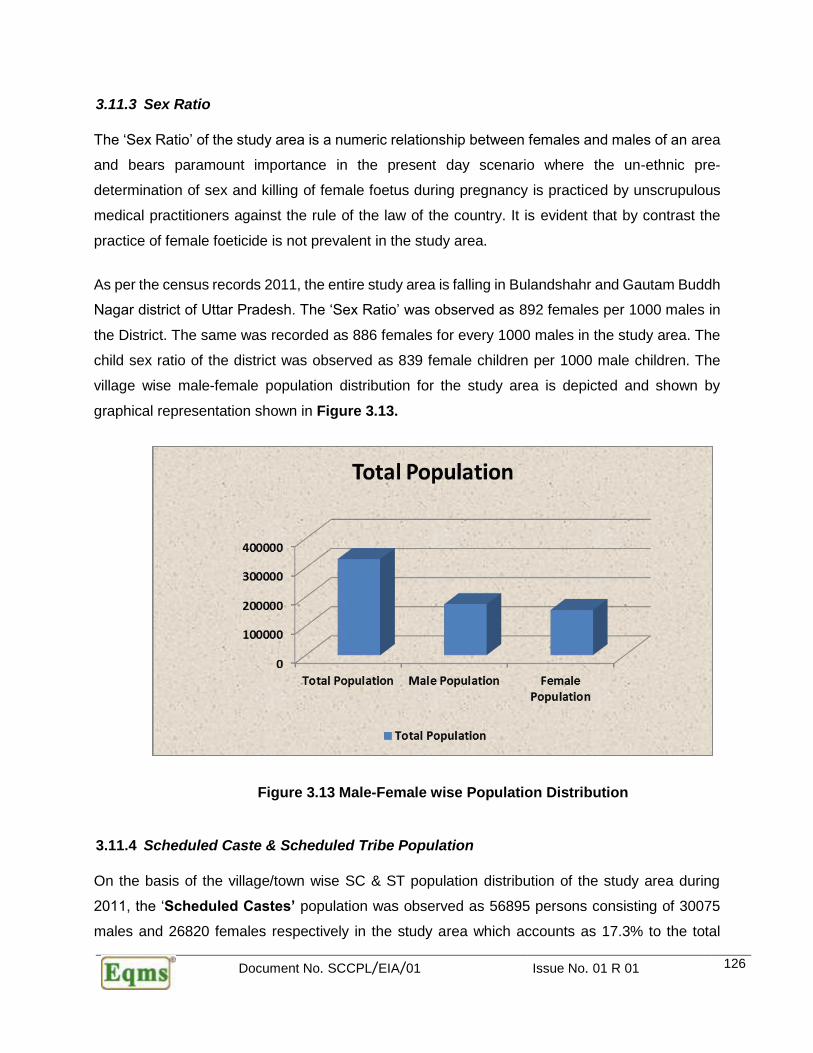
Document No. SCCPL/EIA/01 Issue No. 01 R 01 126
3.11.3 Sex Ratio
The ‘Sex Ratio’ of the study area is a numeric relationship between females and males of an area
and bears paramount importance in the present day scenario where the un-ethnic pre-
determination of sex and killing of female foetus during pregnancy is practiced by unscrupulous
medical practitioners against the rule of the law of the country. It is evident that by contrast the
practice of female foeticide is not prevalent in the study area.
As per the census records 2011, the entire study area is falling in Bulandshahr and Gautam Buddh
Nagar district of Uttar Pradesh. The ‘Sex Ratio’ was observed as 892 females per 1000 males in
the District. The same was recorded as 886 females for every 1000 males in the study area. The
child sex ratio of the district was observed as 839 female children per 1000 male children. The
village wise male-female population distribution for the study area is depicted and shown by
graphical representation shown in Figure 3.13.
Figure 3.13 Male-Female wise Population Distribution
3.11.4 Scheduled Caste & Scheduled Tribe Population
On the basis of the village/town wise SC & ST population distribution of the study area during
2011, the ‘Scheduled Castes’ population was observed as 56895 persons consisting of 30075
males and 26820 females respectively in the study area which accounts as 17.3% to the total
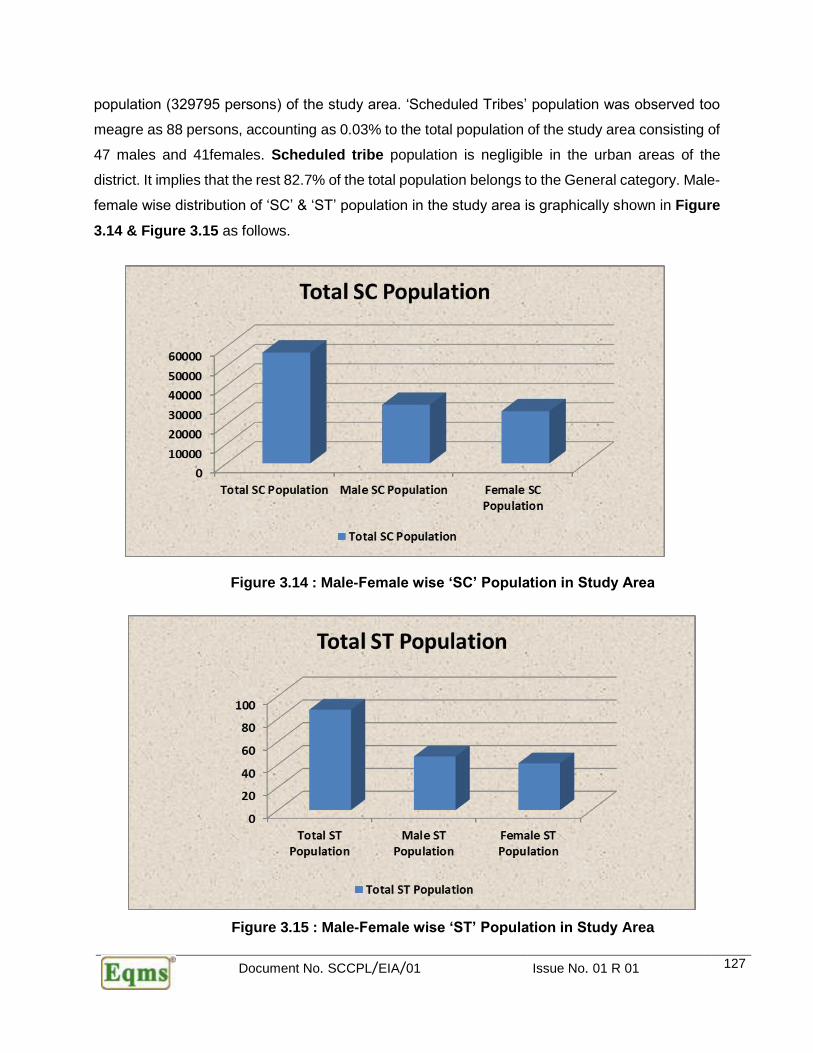
Document No. SCCPL/EIA/01 Issue No. 01 R 01 127
population (329795 persons) of the study area. ‘Scheduled Tribes’ population was observed too
meagre as 88 persons, accounting as 0.03% to the total population of the study area consisting of
47 males and 41females. Scheduled tribe population is negligible in the urban areas of the
district. It implies that the rest 82.7% of the total population belongs to the General category. Male-
female wise distribution of ‘SC’ & ‘ST’ population in the study area is graphically shown in Figure
3.14 & Figure 3.15 as follows.
Figure 3.14 : Male-Female wise ‘SC’ Population in Study Area
Figure 3.15 : Male-Female wise ‘ST’ Population in Study Area

Document No. SCCPL/EIA/01 Issue No. 01 R 01 128
3.11.5 Literacy Rate
Literacy level is quantifiable indicator to assess the development status of an area or region. Male-
Female wise literates and illiterates population is represented in Table 3.30.
Total literates population was recorded as 198499 persons (60.2%) in the study area. Table 3.23
reveals that Male-Female wise literates are observed as 120231 & 78268 persons respectively,
implies that the ‘Literacy Rate’ is recorded as 60.2% with male-female wise percentages being
36.5% & 23.7% respectively. The total illiterate’s population was recorded as 131296 persons
(39.8%) in the study area. Male-Female wise illiterates were 54589 (16.6%) and 76707 (23.3%)
respectively. The Male-Female wise graphical representation of literates & illiterates population in
study area villages/town is shown in Figure 3.16.
Figure 3.16 : Male-Female wise Distribution of Literates & Illiterates
Table 3.30 Male-Female wise Literates & Illiterates Population
Name
Total
Population
Literates Illiterates
Persons Males Females Persons Males Females
Palla 2592 1852 1110 742 740 296 444
Datawali 2014 1359 800 559 655 246 409
Chamrawali Bodaki 2728 1898 1160 738 830 318 512
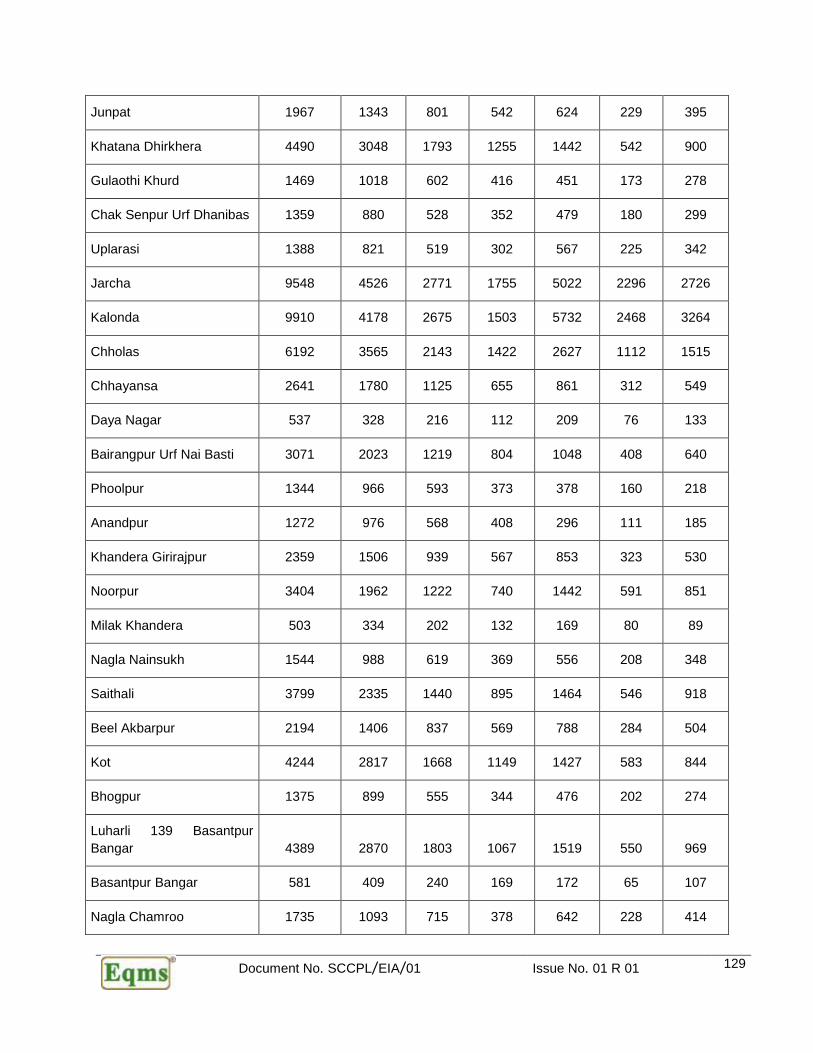
Document No. SCCPL/EIA/01 Issue No. 01 R 01 129
Junpat 1967 1343 801 542 624 229 395
Khatana Dhirkhera 4490 3048 1793 1255 1442 542 900
Gulaothi Khurd 1469 1018 602 416 451 173 278
Chak Senpur Urf Dhanibas 1359 880 528 352 479 180 299
Uplarasi 1388 821 519 302 567 225 342
Jarcha 9548 4526 2771 1755 5022 2296 2726
Kalonda 9910 4178 2675 1503 5732 2468 3264
Chholas 6192 3565 2143 1422 2627 1112 1515
Chhayansa 2641 1780 1125 655 861 312 549
Daya Nagar 537 328 216 112 209 76 133
Bairangpur Urf Nai Basti 3071 2023 1219 804 1048 408 640
Phoolpur 1344 966 593 373 378 160 218
Anandpur 1272 976 568 408 296 111 185
Khandera Girirajpur 2359 1506 939 567 853 323 530
Noorpur 3404 1962 1222 740 1442 591 851
Milak Khandera 503 334 202 132 169 80 89
Nagla Nainsukh 1544 988 619 369 556 208 348
Saithali 3799 2335 1440 895 1464 546 918
Beel Akbarpur 2194 1406 837 569 788 284 504
Kot 4244 2817 1668 1149 1427 583 844
Bhogpur 1375 899 555 344 476 202 274
Luharli 139 Basantpur
Bangar 4389 2870 1803 1067 1519 550 969
Basantpur Bangar 581 409 240 169 172 65 107
Nagla Chamroo 1735 1093 715 378 642 228 414
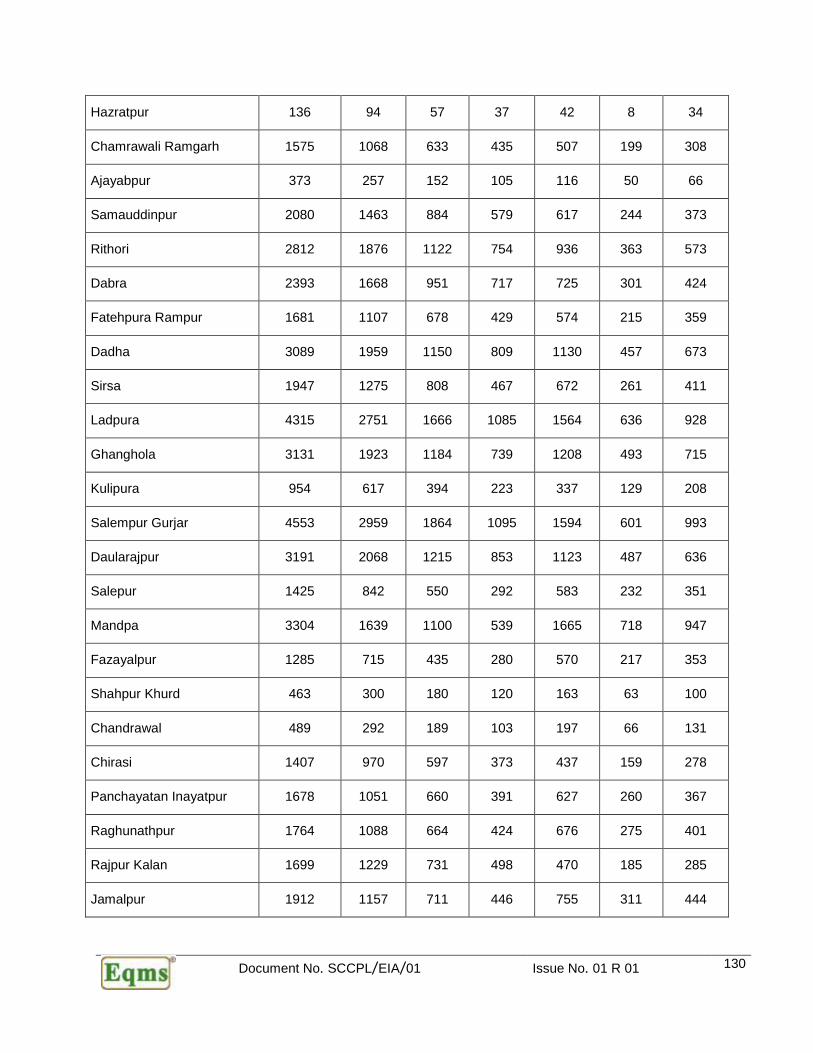
Document No. SCCPL/EIA/01 Issue No. 01 R 01 130
Hazratpur 136 94 57 37 42 8 34
Chamrawali Ramgarh 1575 1068 633 435 507 199 308
Ajayabpur 373 257 152 105 116 50 66
Samauddinpur 2080 1463 884 579 617 244 373
Rithori 2812 1876 1122 754 936 363 573
Dabra 2393 1668 951 717 725 301 424
Fatehpura Rampur 1681 1107 678 429 574 215 359
Dadha 3089 1959 1150 809 1130 457 673
Sirsa 1947 1275 808 467 672 261 411
Ladpura 4315 2751 1666 1085 1564 636 928
Ghanghola 3131 1923 1184 739 1208 493 715
Kulipura 954 617 394 223 337 129 208
Salempur Gurjar 4553 2959 1864 1095 1594 601 993
Daularajpur 3191 2068 1215 853 1123 487 636
Salepur 1425 842 550 292 583 232 351
Mandpa 3304 1639 1100 539 1665 718 947
Fazayalpur 1285 715 435 280 570 217 353
Shahpur Khurd 463 300 180 120 163 63 100
Chandrawal 489 292 189 103 197 66 131
Chirasi 1407 970 597 373 437 159 278
Panchayatan Inayatpur 1678 1051 660 391 627 260 367
Raghunathpur 1764 1088 664 424 676 275 401
Rajpur Kalan 1699 1229 731 498 470 185 285
Jamalpur 1912 1157 711 446 755 311 444
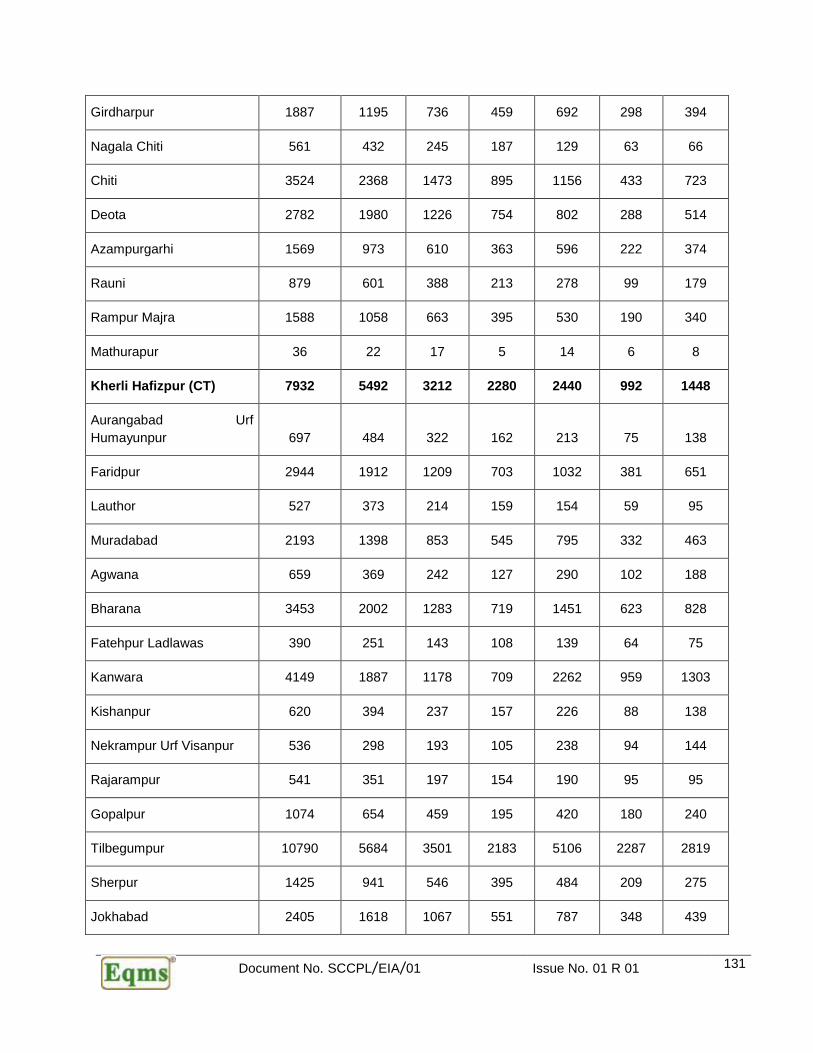
Document No. SCCPL/EIA/01 Issue No. 01 R 01 131
Girdharpur 1887 1195 736 459 692 298 394
Nagala Chiti 561 432 245 187 129 63 66
Chiti 3524 2368 1473 895 1156 433 723
Deota 2782 1980 1226 754 802 288 514
Azampurgarhi 1569 973 610 363 596 222 374
Rauni 879 601 388 213 278 99 179
Rampur Majra 1588 1058 663 395 530 190 340
Mathurapur 36 22 17 5 14 6 8
Kherli Hafizpur (CT) 7932 5492 3212 2280 2440 992 1448
Aurangabad Urf
Humayunpur 697 484 322 162 213 75 138
Faridpur 2944 1912 1209 703 1032 381 651
Lauthor 527 373 214 159 154 59 95
Muradabad 2193 1398 853 545 795 332 463
Agwana 659 369 242 127 290 102 188
Bharana 3453 2002 1283 719 1451 623 828
Fatehpur Ladlawas 390 251 143 108 139 64 75
Kanwara 4149 1887 1178 709 2262 959 1303
Kishanpur 620 394 237 157 226 88 138
Nekrampur Urf Visanpur 536 298 193 105 238 94 144
Rajarampur 541 351 197 154 190 95 95
Gopalpur 1074 654 459 195 420 180 240
Tilbegumpur 10790 5684 3501 2183 5106 2287 2819
Sherpur 1425 941 546 395 484 209 275
Jokhabad 2405 1618 1067 551 787 348 439

Document No. SCCPL/EIA/01 Issue No. 01 R 01 132
Hirdeypur 1383 868 535 333 515 193 322
Sanwali 2608 1793 1124 669 815 295 520
Rajpur Khurd 569 357 212 145 212 96 116
Andhel 1994 1128 701 427 866 365 501
Nagla Shekh 262 50 36 14 212 93 119
Piriyabani 2002 851 532 319 1151 530 621
Benipur 1414 957 598 359 457 153 304
Khaguwa Was 1316 882 541 341 434 154 280
Mandawarah 3382 2065 1282 783 1317 526 791
Bhatpura 1828 1125 706 419 703 276 427
Ritoli 1470 1003 604 399 467 163 304
Dadupur Neela 1804 1087 684 403 717 259 458
Manjupur 220 149 85 64 71 25 46
Srodhan 3651 2263 1355 908 1388 533 855
Sikandrabad Rural 22794 14132 8377 5755 8662 3676 4986
Hasanpur Jagir 2384 1503 943 560 881 333 548
Biswanah 650 334 207 127 316 122 194
Babiya 846 554 335 219 292 115 177
Kherpur Tila 1146 786 477 309 360 123 237
Mahtab Nagar 1148 652 429 223 496 193 303
Masauta 1855 1193 749 444 662 218 444
Malhpur 633 394 241 153 239 79 160
Bhonkhera 955 670 393 277 285 102 183
Gendpur Shaikhpur 1269 895 561 334 374 136 238

Document No. SCCPL/EIA/01 Issue No. 01 R 01 133
Junedpur 1857 1175 755 420 682 251 431
Lalpur 705 454 296 158 251 81 170
Hamidpur 960 606 393 213 354 139 215
Jauli 2298 1437 924 513 861 331 530
Sikandrabad (NPP) 81028 45198 26146 19052 35830 16006 19824
Luharli 2681 1696 1064 632 985 326 659
Pachauta 3217 1957 1294 663 1260 468 792
TOTAL 329795 198499 120231 78268 131296 54589 76707
Source-Census Records 2011
3.11.6 Workers Scenario
Occupational pattern was studied to assess the skills of people in the study area. Occupational
pattern helps in identifying major economic activities of the area. The main and marginal workers
population with further classification as casual, agricultural, households and other workers is
shown in Table 3.31. In the study area the Main and Marginal Workers population was observed
as 81427 (24.7%) and 21151 (6.4%) respectively of the total population (329795) while the
remaining 227217 (68.9%) persons were recorded as non-workers. Thus it implies that the semi-
skilled and non-skilled work-force required in study area for the project is available in aplenty.
Occupation Pattern wise distribution of Population and Graphical representation of Workers
Scenario is given below as Figure 3.17. Distribution of work participation rate of the study area
population is shown in Table 3.31.
Table 3.31 Distribution of Work Participation Rate
Occupation Class 2011
Main Workers 81427 (24.7 %)
Male 70425 (86.5 %)
Female 11002 (13.5 %)
Marginal Workers 21151 (6.4 %)
Male 11773 (55.7 %)
Female 9378 (44.3 %)
Non-Workers 227217 (68.9 %)
Male 92622 (40.8 %)
Female 134595 (59.2 %)
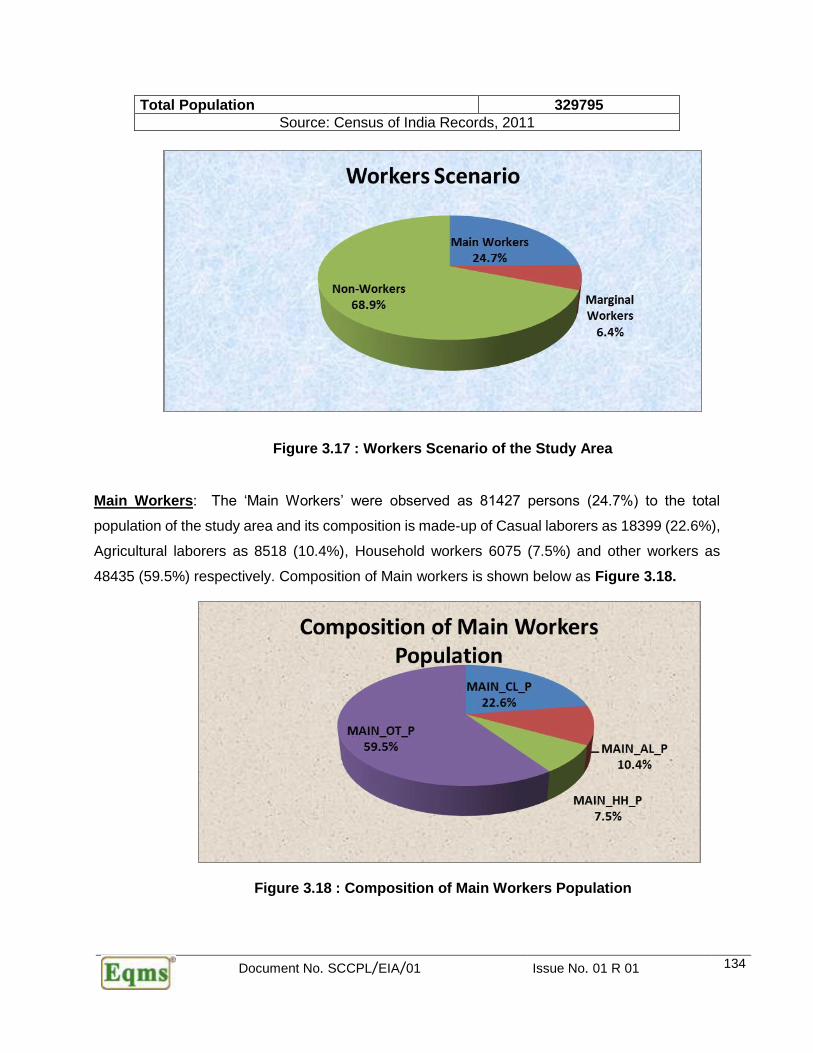
Document No. SCCPL/EIA/01 Issue No. 01 R 01 134
Total Population 329795
Source: Census of India Records, 2011
Figure 3.17 : Workers Scenario of the Study Area
Main Workers: The ‘Main Workers’ were observed as 81427 persons (24.7%) to the total
population of the study area and its composition is made-up of Casual laborers as 18399 (22.6%),
Agricultural laborers as 8518 (10.4%), Household workers 6075 (7.5%) and other workers as
48435 (59.5%) respectively. Composition of Main workers is shown below as Figure 3.18.
Figure 3.18 : Composition of Main Workers Population

Document No. SCCPL/EIA/01 Issue No. 01 R 01 135
Marginal Workers: The total marginal workers are observed as 21151 which constitute 6.4% of
the total population (329795) comprise of Marginal Casual Laborers as 2738 (12.9%), Marginal
Agricultural Laborers as 6237 (29.5%), Marginal Household laborers as 2280 (10.8%) and
marginal other workers were also observed as 9896 (46.8%) of the total marginal workers
respectively. Details about marginal workers in the study area are tabulated in Table 3.25
Composition of Marginal workers is shown in Figure 3.19.
Figure 3.19 : Composition of Marginal Workers
Non-Workers: The total Non-workers population was observed as 227217 which constitute 68.9%
to the total population (329795) of the study area. Male-female wise Non-workers population was
recorded as 92622 Males (40.8%) and 134595 Females (59.2%) respectively. Details about total
Non-workers of the study area with Graphical representation are compiled in Table 3.32 and
shown in Figure 3.20.
Table 3.32 : Composition of Non-Workers
Total Population Non-Workers Population
Persons Males Females
220570 227217 92622 (40.8%) 134595 (59.2%)
MARG_CL_P12.9%
MARG_AL_P29.5%
MARG_HH_P10.8%
MARG_OT_P46.8%
Composition of Marginal Workers Population

Document No. SCCPL/EIA/01 Issue No. 01 R 01 136
Figure 3.20 : Composition of Non-workers Population

Document No. SCCPL/EIA/01 Issue No. 01 R 01 137
Table 3.33 Village-wise Occupational Pattern
Name
MAIN
WORK_P
MAIN_C
L_P
MAIN_A
L_P
MAIN_H
H_P
MAIN_O
T_P
MARG
WORK_P
MARG_
CL_P
MARG_
AL_P
MARG_
HH_P
MARG_
OT_P
Palla 620 285 56 135 144 755 60 46 6 643
Datawali 635 123 83 47 382 202 31 11 5 155
Chamrawali
Bodaki 635 177 13 41 404 28 5 2 0 21
Junpat 301 35 20 11 235 212 9 35 15 153
Khatana Dhirkhera 1268 614 80 37 537 306 30 41 18 217
Gulaothi Khurd 288 84 67 10 127 119 21 28 20 50
Chak Senpur Urf
Dhanibas 155 0 8 31 116 191 5 112 27 47
Uplarasi 262 79 17 10 156 164 33 117 1 13
Jarcha 2033 610 382 159 882 480 37 166 16 261
Kalonda 1938 555 362 74 947 203 9 23 27 144
Chholas 1799 455 78 26 1240 361 17 24 10 310
Chhayansa 649 341 8 17 283 28 4 0 0 24
Daya Nagar 142 71 0 0 71 2 0 2 0 0
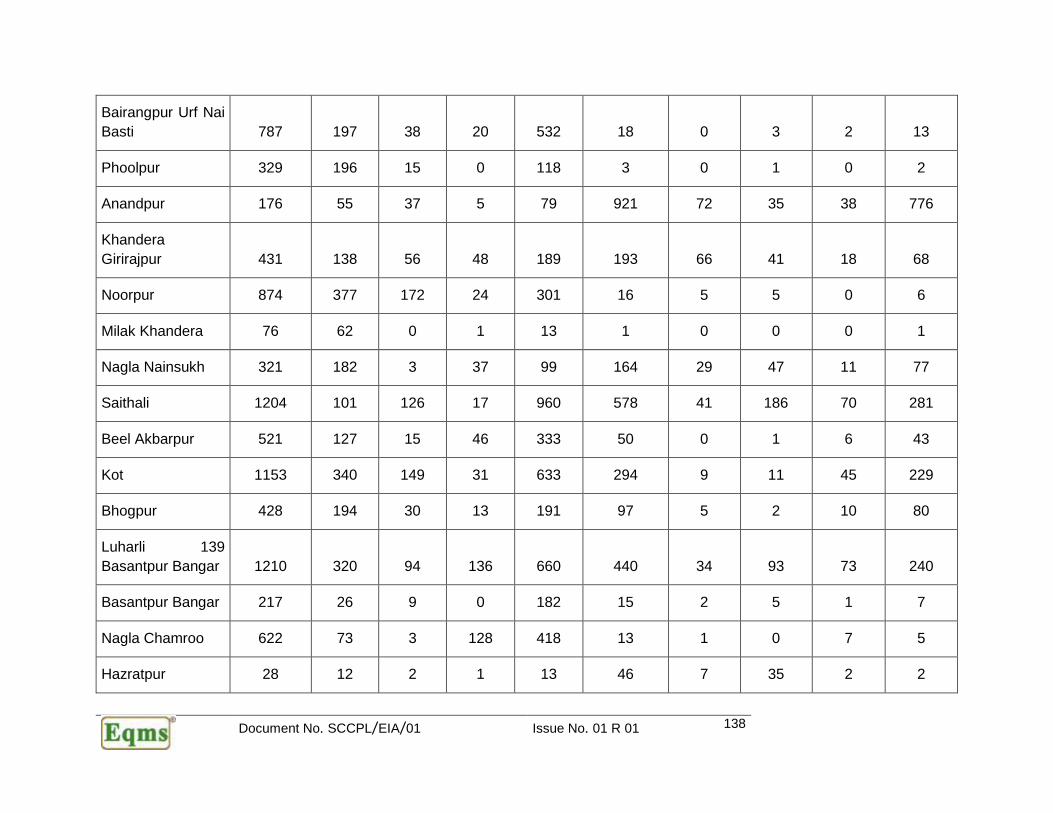
Document No. SCCPL/EIA/01 Issue No. 01 R 01 138
Bairangpur Urf Nai
Basti 787 197 38 20 532 18 0 3 2 13
Phoolpur 329 196 15 0 118 3 0 1 0 2
Anandpur 176 55 37 5 79 921 72 35 38 776
Khandera
Girirajpur 431 138 56 48 189 193 66 41 18 68
Noorpur 874 377 172 24 301 16 5 5 0 6
Milak Khandera 76 62 0 1 13 1 0 0 0 1
Nagla Nainsukh 321 182 3 37 99 164 29 47 11 77
Saithali 1204 101 126 17 960 578 41 186 70 281
Beel Akbarpur 521 127 15 46 333 50 0 1 6 43
Kot 1153 340 149 31 633 294 9 11 45 229
Bhogpur 428 194 30 13 191 97 5 2 10 80
Luharli 139
Basantpur Bangar 1210 320 94 136 660 440 34 93 73 240
Basantpur Bangar 217 26 9 0 182 15 2 5 1 7
Nagla Chamroo 622 73 3 128 418 13 1 0 7 5
Hazratpur 28 12 2 1 13 46 7 35 2 2
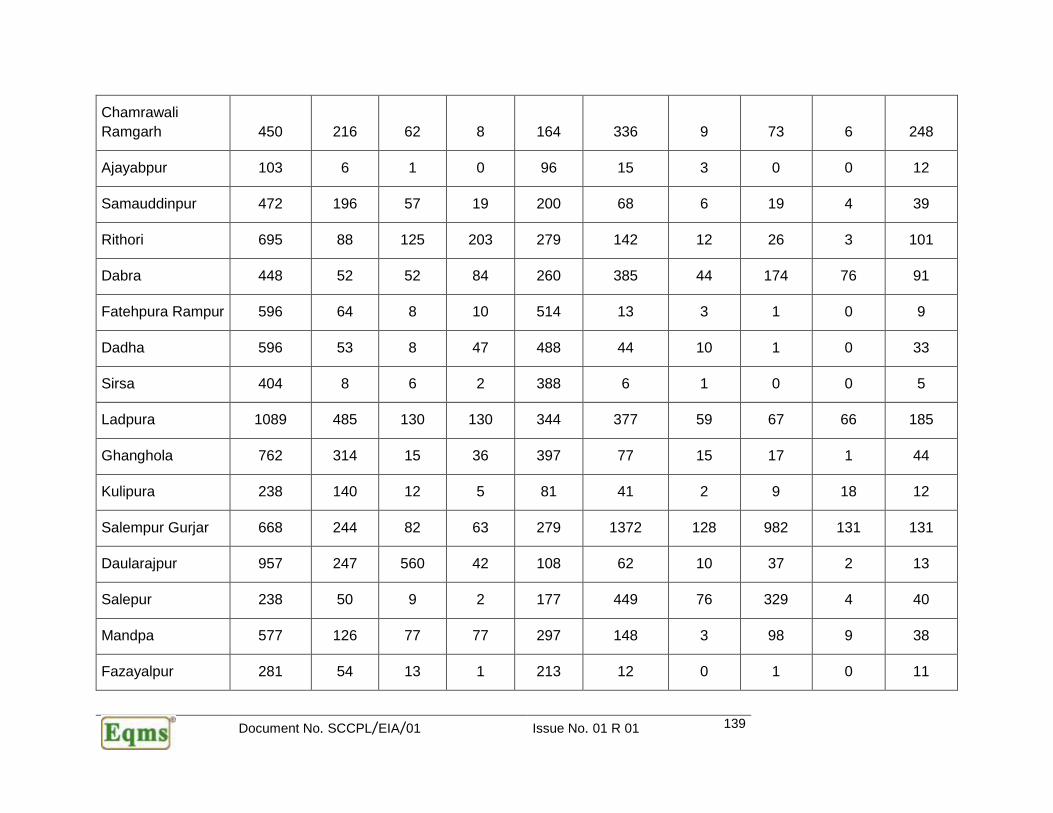
Document No. SCCPL/EIA/01 Issue No. 01 R 01 139
Chamrawali
Ramgarh 450 216 62 8 164 336 9 73 6 248
Ajayabpur 103 6 1 0 96 15 3 0 0 12
Samauddinpur 472 196 57 19 200 68 6 19 4 39
Rithori 695 88 125 203 279 142 12 26 3 101
Dabra 448 52 52 84 260 385 44 174 76 91
Fatehpura Rampur 596 64 8 10 514 13 3 1 0 9
Dadha 596 53 8 47 488 44 10 1 0 33
Sirsa 404 8 6 2 388 6 1 0 0 5
Ladpura 1089 485 130 130 344 377 59 67 66 185
Ghanghola 762 314 15 36 397 77 15 17 1 44
Kulipura 238 140 12 5 81 41 2 9 18 12
Salempur Gurjar 668 244 82 63 279 1372 128 982 131 131
Daularajpur 957 247 560 42 108 62 10 37 2 13
Salepur 238 50 9 2 177 449 76 329 4 40
Mandpa 577 126 77 77 297 148 3 98 9 38
Fazayalpur 281 54 13 1 213 12 0 1 0 11

Document No. SCCPL/EIA/01 Issue No. 01 R 01 140
Shahpur Khurd 83 8 41 0 34 91 2 17 0 72
Chandrawal 124 35 8 6 75 39 5 5 7 22
Chirasi 296 154 12 6 124 79 11 34 1 33
Panchayatan
Inayatpur 448 137 5 3 303 179 100 34 6 39
Raghunathpur 332 250 28 0 54 256 47 72 11 126
Rajpur Kalan 258 19 83 12 144 137 11 73 3 50
Jamalpur 583 203 32 86 262 26 6 11 3 6
Girdharpur 307 140 5 1 161 353 223 32 12 86
Nagala Chiti 127 38 0 7 82 8 1 1 0 6
Chiti 782 250 83 25 424 116 12 15 12 77
Deota 658 208 18 31 401 87 13 12 3 59
Azampurgarhi 306 88 8 1 209 292 9 15 16 252
Rauni 236 73 7 0 156 7 3 0 0 4
Rampur Majra 421 141 1 18 261 2 2 0 0 0
Mathurapur 7 5 0 2 0 4 1 1 0 2

Document No. SCCPL/EIA/01 Issue No. 01 R 01 141
Kherli Hafizpur
(CT) 1822 141 156 122 1403 791 25 226 201 339
Aurangabad Urf
Humayunpur 276 92 114 7 63 33 2 19 5 7
Faridpur 791 292 168 19 312 127 12 37 5 73
Lauthor 137 81 22 2 32 2 0 2 0 0
Muradabad 545 151 357 1 36 18 5 10 0 3
Agwana 180 55 9 0 116 75 6 65 0 4
Bharana 829 474 85 16 254 280 45 53 5 177
Fatehpur Ladlawas 91 50 10 0 31 1 0 0 0 1
Kanwara 1037 266 76 44 651 459 20 56 23 360
Kishanpur 168 54 40 1 73 8 3 4 0 1
Nekrampur Urf
Visanpur 117 83 1 2 31 24 0 20 0 4
Rajarampur 151 82 0 1 68 3 1 0 0 2
Gopalpur 351 7 1 3 340 17 0 0 1 16
Tilbegumpur 2513 380 79 151 1903 319 14 45 59 201
Sherpur 357 186 12 2 157 130 118 6 0 6

Document No. SCCPL/EIA/01 Issue No. 01 R 01 142
Jokhabad 853 18 7 11 817 50 1 4 2 43
Hirdeypur 339 159 12 3 165 98 34 50 0 14
Sanwali 660 108 8 55 489 733 653 11 35 34
Rajpur Khurd 136 29 23 4 80 2 0 0 1 1
Andhel 424 111 22 15 276 96 8 9 50 29
Nagla Shekh 128 0 0 0 128 0 0 0 0 0
Piriyabani 505 169 186 2 148 28 4 10 2 12
Benipur 313 137 43 7 126 179 96 80 0 3
Khaguwa Was 283 111 44 9 119 199 10 157 5 27
Mandawarah 691 205 105 14 367 536 8 445 6 77
Bhatpura 341 73 23 10 235 193 4 101 0 88
Ritoli 448 191 6 0 251 25 5 10 0 10
Dadupur Neela 437 235 2 13 187 90 6 51 5 28
Manjupur 96 43 0 0 53 0 0 0 0 0
Srodhan 801 318 32 12 439 395 110 110 17 158
Sikandrabad Rural 5891 795 642 415 4039 1061 41 455 114 451

Document No. SCCPL/EIA/01 Issue No. 01 R 01 143
Hasanpur Jagir 567 103 24 5 435 85 7 13 1 64
Biswanah 190 52 1 2 135 15 1 3 10 1
Babiya 229 72 5 3 149 92 12 13 0 67
Kherpur Tila 198 91 1 2 104 102 1 1 6 94
Mahtab Nagar 231 98 8 15 110 136 0 14 1 121
Masauta 485 268 12 57 148 208 20 119 12 57
Malhpur 134 67 7 1 59 1 0 0 0 1
Bhonkhera 232 133 1 6 92 15 5 1 0 9
Gendpur
Shaikhpur 309 134 65 9 101 35 8 11 1 15
Junedpur 600 120 317 12 151 10 1 5 0 4
Lalpur 168 151 0 0 17 6 1 5 0 0
Hamidpur 387 151 59 0 177 37 0 8 0 29
Jauli 561 376 4 1 180 95 6 64 1 24
Sikandrabad
(NPP) 21394 775 2112 2911 15596 2713 68 625 674 1346
Luharli 612 411 64 1 136 162 5 21 0 136
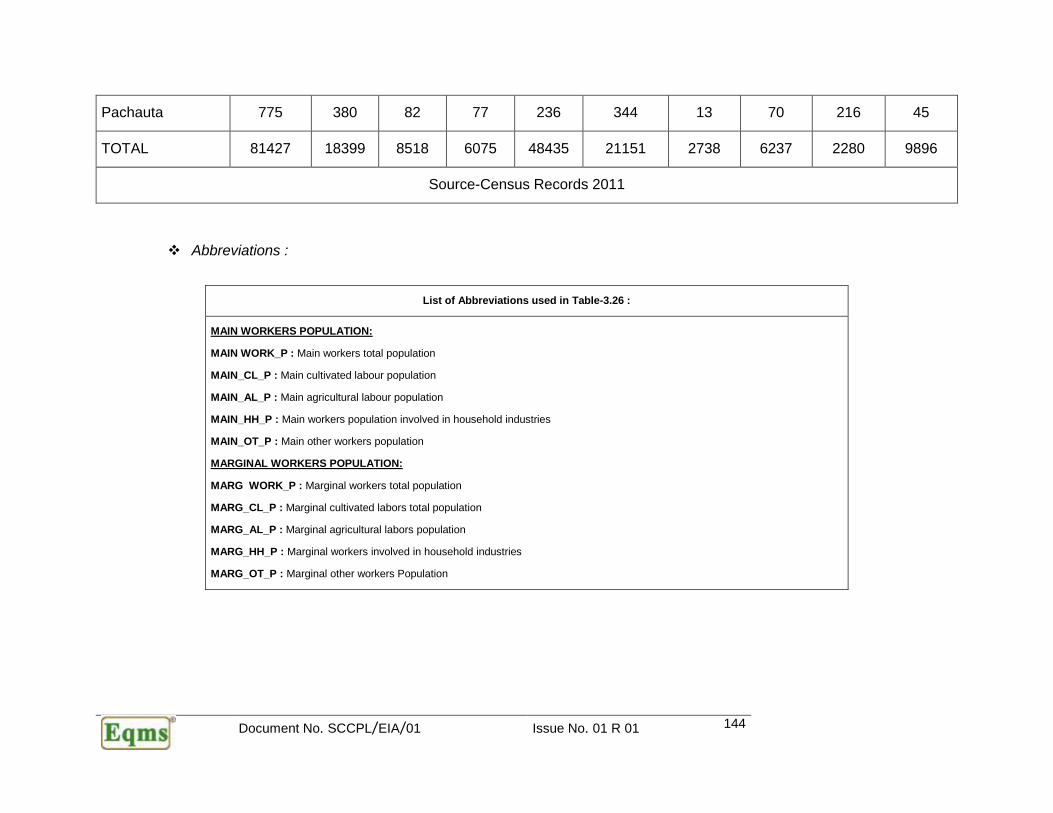
Document No. SCCPL/EIA/01 Issue No. 01 R 01 144
Pachauta 775 380 82 77 236 344 13 70 216 45
TOTAL 81427 18399 8518 6075 48435 21151 2738 6237 2280 9896
Source-Census Records 2011
❖ Abbreviations :
List of Abbreviations used in Table-3.26 :
MAIN WORKERS POPULATION:
MAIN WORK_P : Main workers total population
MAIN_CL_P : Main cultivated labour population
MAIN_AL_P : Main agricultural labour population
MAIN_HH_P : Main workers population involved in household industries
MAIN_OT_P : Main other workers population
MARGINAL WORKERS POPULATION:
MARG WORK_P : Marginal workers total population
MARG_CL_P : Marginal cultivated labors total population
MARG_AL_P : Marginal agricultural labors population
MARG_HH_P : Marginal workers involved in household industries
MARG_OT_P : Marginal other workers Population

Document No. SCCPL/EIA/01 Issue No. 01 R 01 145
3.11.7 Economic Structure
The majority of people in rural sector are cultivators & agricultural labors which indicates dominant
agricultural economy. A small section of people are engaged as workers in household industries.
But in urban sector the existing scenario is completely reversed as most of the people there are
engaged in non-agricultural activity especially in local hotels/restaurants and as drivers some
people also operates their vans/jeeps/cars as tourist vehicle.
Annual income helps in identifying families below poverty line. During the field survey, income of
a household through all possible sources was recorded. Agriculture and allied activities was
reported to be the major source of income followed by non-farm wage labor, business,
Government and Private Service etc. The other important sources of income include government
pension and income from selling of fodder.
Bulandshahr is called the agricultural based district of India. The economy of Bulandshahr is
mainly based upon wheat rice, sugarcane and sugar industry and small industries. Mainly agro-
based industries are found in this district. Sugar mills, oil milling, dairy and leather industries are
the main industries in Bulandshahr district. Handloom, cart marking and agricultural implements
are other industries found in this region.
3.11.8 Basic Infrastructure Facilities Availability (Census 2001)
A review of Basic infrastructure facilities (Amenities) available in the study area villages has been
done on the basis of the Field survey and Census records, 2011 for the study area inhabited
revenue villages of mainly Four (04) tehsils namely namely Sikandrabad, Dadri, Gautam Buddha
Nagar and Khurja of Bulandshahr and Gautam Buddha Nagar District respectively in Uttar
Pradesh. The study area has good level of basic infrastructure facilities like educational, medical,
potable water, power supply, and transport & communication network. Entire study area is
predominantly rural except two main towns namely Sikandrabad (NPP) and Kherli Hafizpur (CT).
(As per the census records of 2011)
3.11.9 Education Facilities
As per the Census Records of India 2011, there are a total 106 revenue villages/towns of
Bulandshahr and Gautam Buddha Nagar District in Uttar Pradesh. All the revenue villages/towns
are mainly under four (04) tehsils namely Sikandrabad, Dadri, Gautam Buddha Nagar and Khurja
of Bulandshahr and Gautam Buddha Nagar District respectively in Uttar Pradesh. There are about
Document No. SCCPL/EIA/01 Issue No. 01 R 01 146
eighty nine (89) Primary Schools existing in the rural part/revenue villages of the study area.
Middle schools are fifty three (53 no’s) in the rural part of the study area. Only forteen (14 no’s)
Higher Secondary Schools are available in the rural part of the study area. Senior Secondary
School facility is available in six villages of the rural part in the study area. The educational facilities
have been further strengthening now and a number of private public schools and colleges are also
functioning in the surroundings of the study area. Besides, there are Engineering and Medical
colleges available in Towns and District headquarters only. Higher education facilities are available
in Towns of the area. There is considerable improvement in educational facility. The villages/towns
of the study area have no such facilities can reach within 5.0 to 10.0-km range. Majority of the
villages are little far from their nearest town. More than 99% of villages of the district have
education facility, transport and communication.
Out of total 106 revenue villages/towns of the study area about twelve (12) revenue villages do
not have primary school facility and children of these villages have to travel less than 5.0-km for
their primary schooling.
3.11.10 Medical Facilities
The medical facilities are provided by different agencies like Govt. & Private individuals and
voluntary organizations in the study area. As per the district census handbook information of 2011,
four (04) community health centre (CHC) and five (05) primary health center (PHC) also exists in
the study area; most of the study area villages depend upon the towns / district HQ of the study
area having such facility. Eight (08) Primary Health Sub-centers (PHSC) are exists in the rural part
of the study area. Mother & Child Welfare Centre / MCWC are available in nine (09) revenue
villages of the study area. Family welfare centre (FWC) exists in fourteen (03) villages of the study
area. Overall study area villages are served by average medical facilities. Specialized medical
facilities are available in towns and District Headquarter (HQ) only.
3.11.11 Potable Water Facilities
Potable water facility is available in most of the villages/towns of the study area. The entire study
area has plenty of good potable water facilities. Most of the villages (about 100%) except only one
village named Mathurapur of Gautam Buddha Nagar tehsil/district having Hand Pumps (HP) as
potable water facility. Out of total 106 revenue villages/towns only four (04) villages (3.8%) named
Khatana Dhirkhera & Nagala Chiti of Gautam Buddha Nagar district and Jokhabad & Biswanah of

Document No. SCCPL/EIA/01 Issue No. 01 R 01 147
Bulandshahr district respectively are served with River/Ferry Services in the study area. Out of
total 106 revenue villages/towns only 13 villages are served with River/Canal water as drinking
water in the study area. As per the census records of 2011, about Twenty (20) villages (18.9%)
are being served with Tank/Pond/Lake in the study area. In the majority of the villages, hand
pumps are commonly observed in the study area. Good potable water facilities are available in
the study area.
3.11.12 Communication Facilities
Apart from Post &Telegraph (P & T) services, transport is the main communication linkage in the
study area. Out of 106 villages /towns of the study area, only three (03) villages are served with
Post Office facilities in the study area, remaining villages are depending upon these three (03)
villages and towns of the study area. The study area has average rail and road network, passes
from the area. Six (06) villages named Ajayabpur, Rithori, Jamalpur, Chiti, Fatehpur Ladlawas and
Sikandrabad Rural itself are served with railway station facility in the study area and remaining
villages depend upon these villages/towns with this facility. Nearest town/city is Sikandrabad
(NPP) at about 5.41-km away from the project site. Indra Gandhi Airport, New Delhi, is about 75-
kms away from the proposed site. Most of the villages are served with Pucca road facility in the
study area. The villages in the study area which do not have such facility can reach within 5 to 10-
km range.
Mainly five (05) towns named Bulandshahr (MC), Sikandrabad (NPP), Dadri, Vilashpur and
Gulaothi are available within the distance range of up to 20-kms from the villages of the study
area. Approach by pucca road facility is available for 91.5% villages of the study area. The study
area has almost all the schedule commercial banks with ATM facility in urban areas and the district
HQ. Majority of the villages have banking facility at a distance of 5-10 km.
3.11.13 Banking Facility
The study area has almost all the schedule commercial banks with ATM facility in urban areas
(towns) and the district HQ
3.11.14 Power Supply
It is revealed from the compiled information on amenities availability as per the census record of
2011; most of the villages and towns (about 100%) are electrified for all purpose in the study area.
Village/town wise ‘Basic Amenities’ availability data for the entire study area is compiled and
presented in Table 3.34
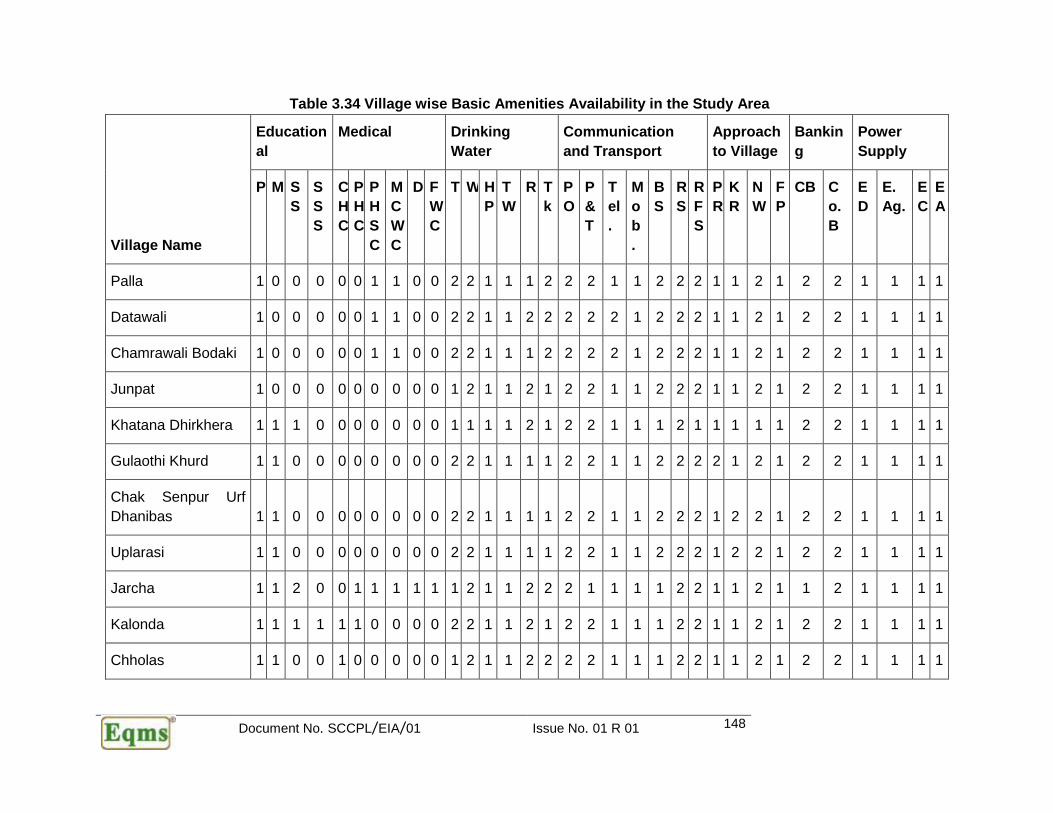
Document No. SCCPL/EIA/01 Issue No. 01 R 01 148
Table 3.34 Village wise Basic Amenities Availability in the Study Area
Village Name
Education
al
Medical Drinking
Water
Communication
and Transport
Approach
to Village
Bankin
g
Power
Supply
P M S
S
S
S
S
C
H
C
P
H
C
P
H
S
C
M
C
W
C
D F
W
C
T W H
P
T
W
R T
k
P
O
P
&
T
T
el
.
M
o
b
.
B
S
R
S
R
F
S
P
R
K
R
N
W
F
P
CB C
o.
B
E
D
E.
Ag.
E
C
E
A
Palla 1 0 0 0 0 0 1 1 0 0 2 2 1 1 1 2 2 2 1 1 2 2 2 1 1 2 1 2 2 1 1 1 1
Datawali 1 0 0 0 0 0 1 1 0 0 2 2 1 1 2 2 2 2 2 1 2 2 2 1 1 2 1 2 2 1 1 1 1
Chamrawali Bodaki 1 0 0 0 0 0 1 1 0 0 2 2 1 1 1 2 2 2 2 1 2 2 2 1 1 2 1 2 2 1 1 1 1
Junpat 1 0 0 0 0 0 0 0 0 0 1 2 1 1 2 1 2 2 1 1 2 2 2 1 1 2 1 2 2 1 1 1 1
Khatana Dhirkhera 1 1 1 0 0 0 0 0 0 0 1 1 1 1 2 1 2 2 1 1 1 2 1 1 1 1 1 2 2 1 1 1 1
Gulaothi Khurd 1 1 0 0 0 0 0 0 0 0 2 2 1 1 1 1 2 2 1 1 2 2 2 2 1 2 1 2 2 1 1 1 1
Chak Senpur Urf
Dhanibas 1 1 0 0 0 0 0 0 0 0 2 2 1 1 1 1 2 2 1 1 2 2 2 1 2 2 1 2 2 1 1 1 1
Uplarasi 1 1 0 0 0 0 0 0 0 0 2 2 1 1 1 1 2 2 1 1 2 2 2 1 2 2 1 2 2 1 1 1 1
Jarcha 1 1 2 0 0 1 1 1 1 1 1 2 1 1 2 2 2 1 1 1 1 2 2 1 1 2 1 1 2 1 1 1 1
Kalonda 1 1 1 1 1 1 0 0 0 0 2 2 1 1 2 1 2 2 1 1 1 2 2 1 1 2 1 2 2 1 1 1 1
Chholas 1 1 0 0 1 0 0 0 0 0 1 2 1 1 2 2 2 2 1 1 1 2 2 1 1 2 1 2 2 1 1 1 1

Document No. SCCPL/EIA/01 Issue No. 01 R 01 149
Chhayansa 1 0 0 0 0 0 0 0 0 0 2 2 1 1 2 1 2 2 1 1 2 2 2 1 1 2 1 2 2 1 1 1 1
Daya Nagar 0 0 0 0 0 0 0 0 0 0 2 2 1 1 2 2 2 2 1 1 2 2 2 1 1 2 1 2 2 1 1 1 1
Bairangpur Urf Nai
Basti 1 1 1 0 0 0 0 0 0 0 2 2 1 1 2 2 2 2 1 1 2 2 2 1 1 2 1 2 2 1 1 1 1
Phoolpur 1 1 1 1 0 0 0 0 0 0 2 2 1 1 2 2 2 2 1 1 2 2 2 1 1 2 1 2 2 1 1 1 1
Anandpur 1 1 0 0 0 0 0 0 0 0 2 2 1 1 2 2 2 2 1 1 2 2 2 1 1 2 1 2 2 1 1 1 1
Khandera Girirajpur 1 1 0 0 0 1 0 1 0 1 2 2 1 1 1 2 2 2 1 1 2 2 2 1 1 1 1 2 2 1 1 1 1
Noorpur 1 1 1 1 0 0 0 0 0 0 2 2 1 1 2 2 2 2 1 1 2 2 2 1 1 2 1 2 2 1 1 1 1
Milak Khandera 1 0 0 0 0 0 0 0 0 0 2 2 1 1 2 2 2 2 1 1 2 2 2 1 1 2 1 2 2 1 1 1 1
Nagla Nainsukh 1 0 0 0 0 0 1 0 0 0 2 2 1 1 2 2 2 2 1 1 2 2 2 1 1 2 1 2 2 1 1 1 1
Saithali 1 1 1 0 0 0 0 0 0 0 1 2 1 2 1 2 2 2 1 1 2 2 2 1 1 2 1 2 2 1 1 1 1
Beel Akbarpur 1 1 0 0 0 0 0 0 0 0 2 2 1 1 2 2 2 2 1 1 2 2 2 1 1 2 1 1 2 1 1 1 1
Kot 1 1 1 0 0 0 1 0 0 0 2 2 1 1 2 2 2 2 1 1 2 2 2 1 1 2 1 2 2 1 1 1 1
Bhogpur 1 0 0 0 0 0 0 0 0 0 2 2 1 1 2 2 2 2 1 1 2 2 2 1 1 2 1 2 2 1 1 1 1
Luharli 139
Basantpur Bangar 1 1 1 1 0 0 0 0 0 0 1 2 1 1 2 1 2 2 1 1 2 2 2 1 1 2 1 2 2 1 1 1 1
Nagla Chamroo 1 1 0 0 0 0 0 0 0 0 2 2 1 2 2 2 2 2 2 1 2 2 2 1 2 2 1 2 2 1 1 1 1
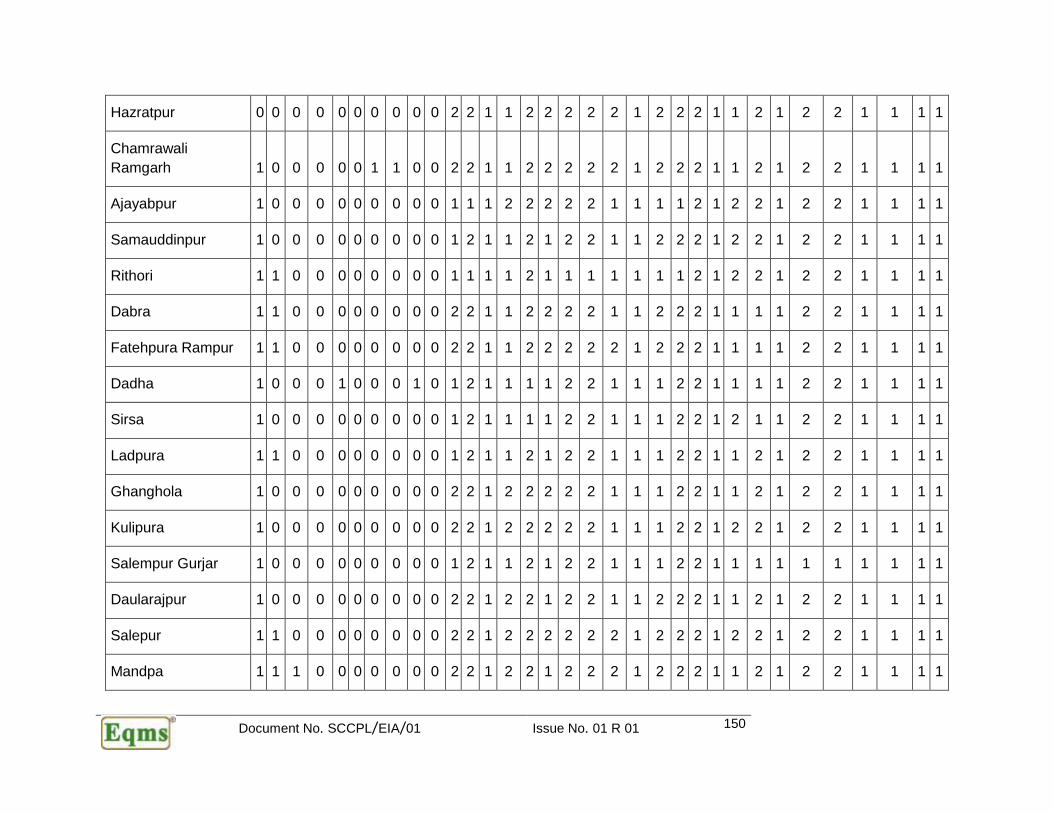
Document No. SCCPL/EIA/01 Issue No. 01 R 01 150
Hazratpur 0 0 0 0 0 0 0 0 0 0 2 2 1 1 2 2 2 2 2 1 2 2 2 1 1 2 1 2 2 1 1 1 1
Chamrawali
Ramgarh 1 0 0 0 0 0 1 1 0 0 2 2 1 1 2 2 2 2 2 1 2 2 2 1 1 2 1 2 2 1 1 1 1
Ajayabpur 1 0 0 0 0 0 0 0 0 0 1 1 1 2 2 2 2 2 1 1 1 1 2 1 2 2 1 2 2 1 1 1 1
Samauddinpur 1 0 0 0 0 0 0 0 0 0 1 2 1 1 2 1 2 2 1 1 2 2 2 1 2 2 1 2 2 1 1 1 1
Rithori 1 1 0 0 0 0 0 0 0 0 1 1 1 1 2 1 1 1 1 1 1 1 2 1 2 2 1 2 2 1 1 1 1
Dabra 1 1 0 0 0 0 0 0 0 0 2 2 1 1 2 2 2 2 1 1 2 2 2 1 1 1 1 2 2 1 1 1 1
Fatehpura Rampur 1 1 0 0 0 0 0 0 0 0 2 2 1 1 2 2 2 2 2 1 2 2 2 1 1 1 1 2 2 1 1 1 1
Dadha 1 0 0 0 1 0 0 0 1 0 1 2 1 1 1 1 2 2 1 1 1 2 2 1 1 1 1 2 2 1 1 1 1
Sirsa 1 0 0 0 0 0 0 0 0 0 1 2 1 1 1 1 2 2 1 1 1 2 2 1 2 1 1 2 2 1 1 1 1
Ladpura 1 1 0 0 0 0 0 0 0 0 1 2 1 1 2 1 2 2 1 1 1 2 2 1 1 2 1 2 2 1 1 1 1
Ghanghola 1 0 0 0 0 0 0 0 0 0 2 2 1 2 2 2 2 2 1 1 1 2 2 1 1 2 1 2 2 1 1 1 1
Kulipura 1 0 0 0 0 0 0 0 0 0 2 2 1 2 2 2 2 2 1 1 1 2 2 1 2 2 1 2 2 1 1 1 1
Salempur Gurjar 1 0 0 0 0 0 0 0 0 0 1 2 1 1 2 1 2 2 1 1 1 2 2 1 1 1 1 1 1 1 1 1 1
Daularajpur 1 0 0 0 0 0 0 0 0 0 2 2 1 2 2 1 2 2 1 1 2 2 2 1 1 2 1 2 2 1 1 1 1
Salepur 1 1 0 0 0 0 0 0 0 0 2 2 1 2 2 2 2 2 2 1 2 2 2 1 2 2 1 2 2 1 1 1 1
Mandpa 1 1 1 0 0 0 0 0 0 0 2 2 1 2 2 1 2 2 2 1 2 2 2 1 1 2 1 2 2 1 1 1 1

Document No. SCCPL/EIA/01 Issue No. 01 R 01 151
Fazayalpur 1 1 0 0 0 0 0 0 0 0 1 2 2 1 2 2 2 2 2 1 2 2 2 1 1 2 1 2 2 1 1 1 1
Shahpur Khurd 0 0 0 0 0 0 0 0 0 0 2 2 1 2 2 2 2 2 2 1 2 2 2 1 1 2 1 2 2 1 1 1 1
Chandrawal 0 0 0 0 0 0 0 0 0 0 2 2 1 2 2 2 2 2 2 1 2 2 2 1 1 2 1 2 2 1 1 1 1
Chirasi 0 1 0 0 0 0 0 0 0 0 2 2 1 2 1 2 2 2 2 1 2 2 2 1 2 2 1 2 2 1 1 1 1
Panchayatan
Inayatpur 1 0 0 0 0 0 0 0 0 0 2 2 1 2 2 2 2 2 1 1 1 2 2 1 1 2 1 2 2 1 1 1 1
Raghunathpur
……………………………………………………………Data not
available……………………………………………………………….
Rajpur Kalan 1 0 0 0 0 0 0 0 0 0 2 2 1 2 2 2 2 2 1 1 1 2 2 1 2 2 1 2 2 1 1 1 1
Jamalpur 0 0 0 0 0 0 0 0 0 0 2 2 1 2 1 2 2 2 1 1 1 1 2 1 2 2 1 2 2 1 1 1 1
Girdharpur 1 1 0 0 0 0 0 0 0 0 2 2 1 2 1 1 2 2 1 1 1 2 2 1 2 1 1 2 2 1 1 1 1
Nagala Chiti 1 0 0 0 0 0 0 0 0 0 2 2 1 1 2 1 2 2 2 1 1 2 1 1 1 2 1 2 2 1 1 1 1
Chiti 1 1 0 0 0 1 1 1 0 0 2 1 1 1 2 1 1 2 1 1 1 1 2 1 1 2 1 2 2 1 1 1 1
Deota 1 1 0 0 0 0 0 1 0 0 2 2 1 2 2 1 1 2 1 1 2 2 2 1 1 2 1 2 2 1 1 1 1
Azampurgarhi 1 0 0 0 0 0 0 0 0 0 2 2 1 1 1 2 2 2 1 1 2 2 2 1 1 1 1 2 2 1 1 1 1
Rauni 1 0 0 0 0 0 0 0 0 0 2 2 1 2 2 2 2 2 2 1 2 2 2 1 2 2 1 2 2 1 1 1 1
Rampur Majra 1 0 0 0 0 0 0 0 0 0 2 2 1 2 2 2 2 2 1 1 2 2 2 1 2 2 1 2 2 1 1 1 1
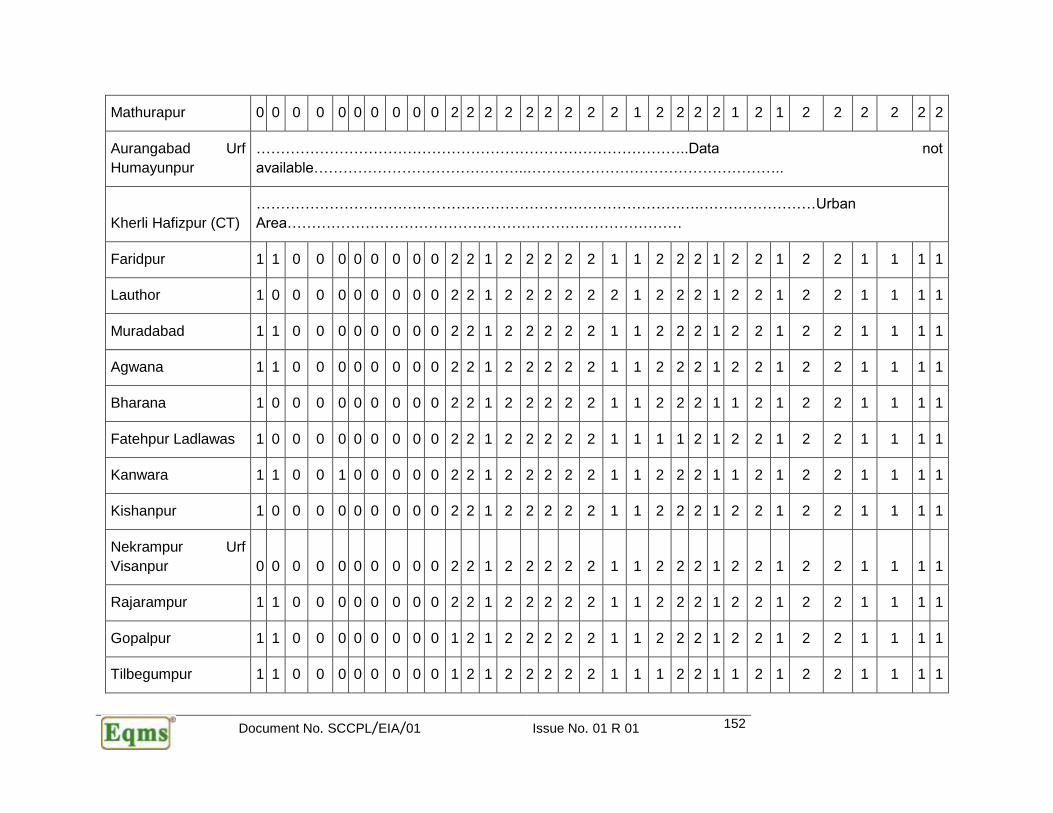
Document No. SCCPL/EIA/01 Issue No. 01 R 01 152
Mathurapur 0 0 0 0 0 0 0 0 0 0 2 2 2 2 2 2 2 2 2 1 2 2 2 2 1 2 1 2 2 2 2 2 2
Aurangabad Urf
Humayunpur
……………………………………………………………………………..Data not
available……………………………………..……………………………………………..
Kherli Hafizpur (CT)
……………………………………………………………………………….……………………Urban
Area………………………………………………………………………
Faridpur 1 1 0 0 0 0 0 0 0 0 2 2 1 2 2 2 2 2 1 1 2 2 2 1 2 2 1 2 2 1 1 1 1
Lauthor 1 0 0 0 0 0 0 0 0 0 2 2 1 2 2 2 2 2 2 1 2 2 2 1 2 2 1 2 2 1 1 1 1
Muradabad 1 1 0 0 0 0 0 0 0 0 2 2 1 2 2 2 2 2 1 1 2 2 2 1 2 2 1 2 2 1 1 1 1
Agwana 1 1 0 0 0 0 0 0 0 0 2 2 1 2 2 2 2 2 1 1 2 2 2 1 2 2 1 2 2 1 1 1 1
Bharana 1 0 0 0 0 0 0 0 0 0 2 2 1 2 2 2 2 2 1 1 2 2 2 1 1 2 1 2 2 1 1 1 1
Fatehpur Ladlawas 1 0 0 0 0 0 0 0 0 0 2 2 1 2 2 2 2 2 1 1 1 1 2 1 2 2 1 2 2 1 1 1 1
Kanwara 1 1 0 0 1 0 0 0 0 0 2 2 1 2 2 2 2 2 1 1 2 2 2 1 1 2 1 2 2 1 1 1 1
Kishanpur 1 0 0 0 0 0 0 0 0 0 2 2 1 2 2 2 2 2 1 1 2 2 2 1 2 2 1 2 2 1 1 1 1
Nekrampur Urf
Visanpur 0 0 0 0 0 0 0 0 0 0 2 2 1 2 2 2 2 2 1 1 2 2 2 1 2 2 1 2 2 1 1 1 1
Rajarampur 1 1 0 0 0 0 0 0 0 0 2 2 1 2 2 2 2 2 1 1 2 2 2 1 2 2 1 2 2 1 1 1 1
Gopalpur 1 1 0 0 0 0 0 0 0 0 1 2 1 2 2 2 2 2 1 1 2 2 2 1 2 2 1 2 2 1 1 1 1
Tilbegumpur 1 1 0 0 0 0 0 0 0 0 1 2 1 2 2 2 2 2 1 1 1 2 2 1 1 2 1 2 2 1 1 1 1
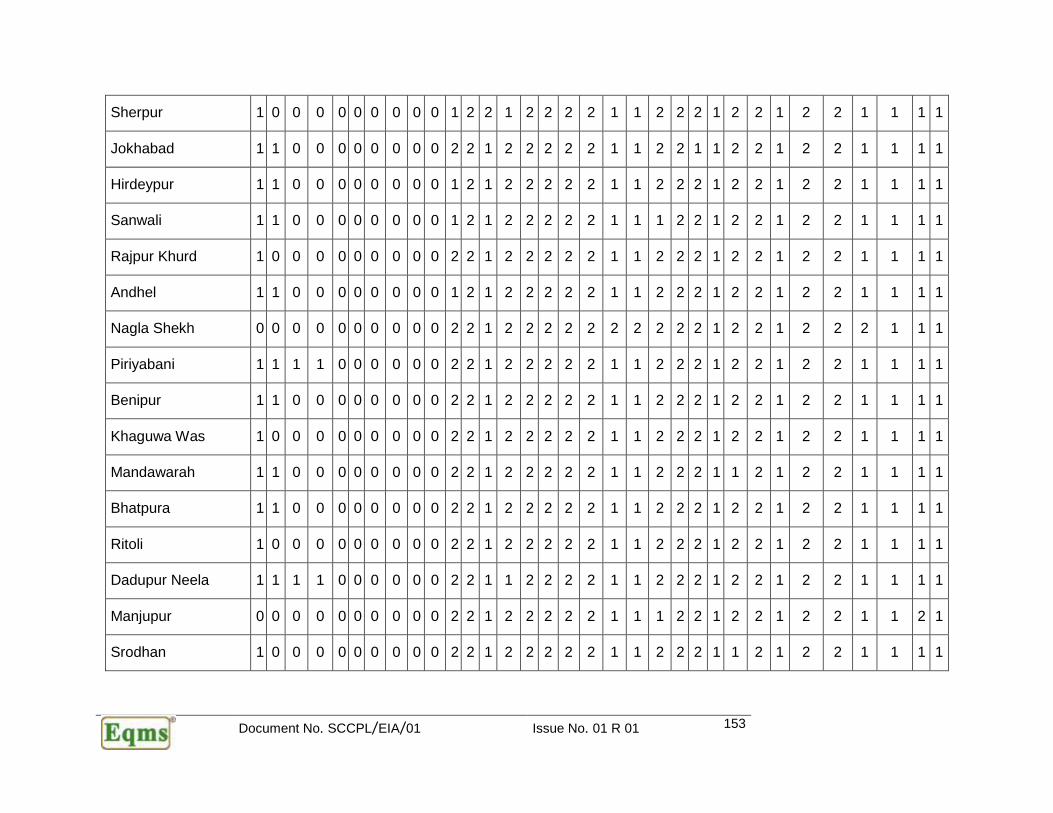
Document No. SCCPL/EIA/01 Issue No. 01 R 01 153
Sherpur 1 0 0 0 0 0 0 0 0 0 1 2 2 1 2 2 2 2 1 1 2 2 2 1 2 2 1 2 2 1 1 1 1
Jokhabad 1 1 0 0 0 0 0 0 0 0 2 2 1 2 2 2 2 2 1 1 2 2 1 1 2 2 1 2 2 1 1 1 1
Hirdeypur 1 1 0 0 0 0 0 0 0 0 1 2 1 2 2 2 2 2 1 1 2 2 2 1 2 2 1 2 2 1 1 1 1
Sanwali 1 1 0 0 0 0 0 0 0 0 1 2 1 2 2 2 2 2 1 1 1 2 2 1 2 2 1 2 2 1 1 1 1
Rajpur Khurd 1 0 0 0 0 0 0 0 0 0 2 2 1 2 2 2 2 2 1 1 2 2 2 1 2 2 1 2 2 1 1 1 1
Andhel 1 1 0 0 0 0 0 0 0 0 1 2 1 2 2 2 2 2 1 1 2 2 2 1 2 2 1 2 2 1 1 1 1
Nagla Shekh 0 0 0 0 0 0 0 0 0 0 2 2 1 2 2 2 2 2 2 2 2 2 2 1 2 2 1 2 2 2 1 1 1
Piriyabani 1 1 1 1 0 0 0 0 0 0 2 2 1 2 2 2 2 2 1 1 2 2 2 1 2 2 1 2 2 1 1 1 1
Benipur 1 1 0 0 0 0 0 0 0 0 2 2 1 2 2 2 2 2 1 1 2 2 2 1 2 2 1 2 2 1 1 1 1
Khaguwa Was 1 0 0 0 0 0 0 0 0 0 2 2 1 2 2 2 2 2 1 1 2 2 2 1 2 2 1 2 2 1 1 1 1
Mandawarah 1 1 0 0 0 0 0 0 0 0 2 2 1 2 2 2 2 2 1 1 2 2 2 1 1 2 1 2 2 1 1 1 1
Bhatpura 1 1 0 0 0 0 0 0 0 0 2 2 1 2 2 2 2 2 1 1 2 2 2 1 2 2 1 2 2 1 1 1 1
Ritoli 1 0 0 0 0 0 0 0 0 0 2 2 1 2 2 2 2 2 1 1 2 2 2 1 2 2 1 2 2 1 1 1 1
Dadupur Neela 1 1 1 1 0 0 0 0 0 0 2 2 1 1 2 2 2 2 1 1 2 2 2 1 2 2 1 2 2 1 1 1 1
Manjupur 0 0 0 0 0 0 0 0 0 0 2 2 1 2 2 2 2 2 1 1 1 2 2 1 2 2 1 2 2 1 1 2 1
Srodhan 1 0 0 0 0 0 0 0 0 0 2 2 1 2 2 2 2 2 1 1 2 2 2 1 1 2 1 2 2 1 1 1 1
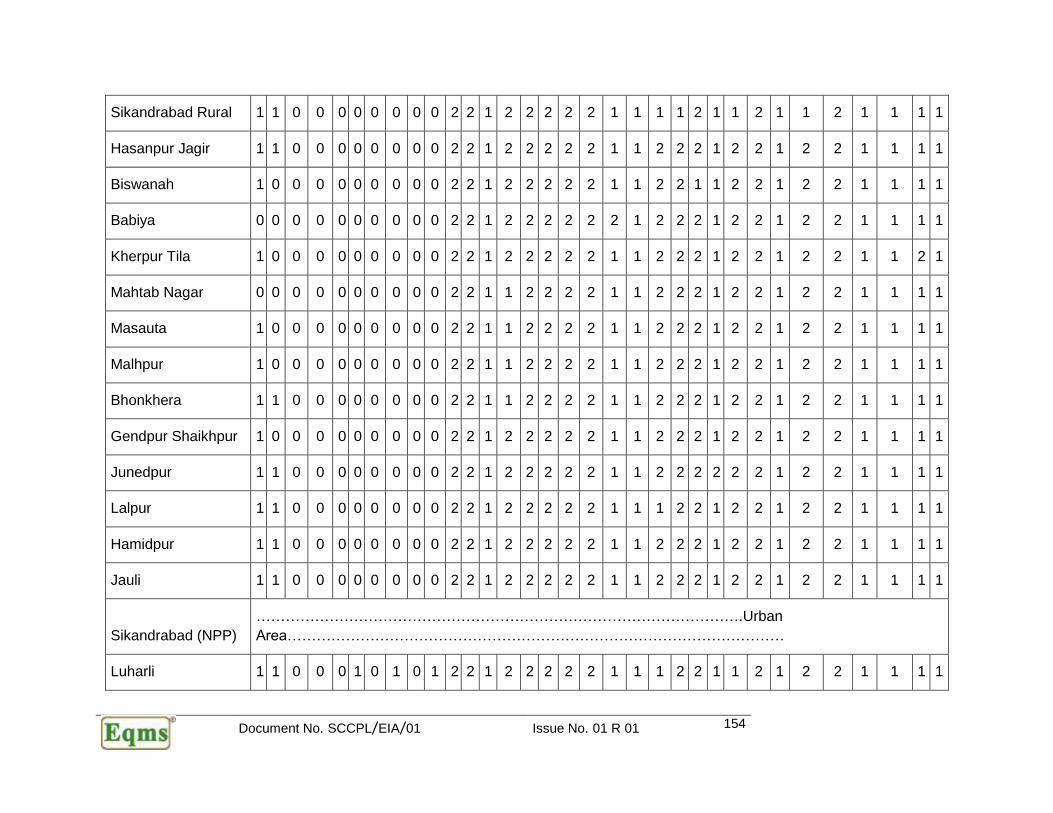
Document No. SCCPL/EIA/01 Issue No. 01 R 01 154
Sikandrabad Rural 1 1 0 0 0 0 0 0 0 0 2 2 1 2 2 2 2 2 1 1 1 1 2 1 1 2 1 1 2 1 1 1 1
Hasanpur Jagir 1 1 0 0 0 0 0 0 0 0 2 2 1 2 2 2 2 2 1 1 2 2 2 1 2 2 1 2 2 1 1 1 1
Biswanah 1 0 0 0 0 0 0 0 0 0 2 2 1 2 2 2 2 2 1 1 2 2 1 1 2 2 1 2 2 1 1 1 1
Babiya 0 0 0 0 0 0 0 0 0 0 2 2 1 2 2 2 2 2 2 1 2 2 2 1 2 2 1 2 2 1 1 1 1
Kherpur Tila 1 0 0 0 0 0 0 0 0 0 2 2 1 2 2 2 2 2 1 1 2 2 2 1 2 2 1 2 2 1 1 2 1
Mahtab Nagar 0 0 0 0 0 0 0 0 0 0 2 2 1 1 2 2 2 2 1 1 2 2 2 1 2 2 1 2 2 1 1 1 1
Masauta 1 0 0 0 0 0 0 0 0 0 2 2 1 1 2 2 2 2 1 1 2 2 2 1 2 2 1 2 2 1 1 1 1
Malhpur 1 0 0 0 0 0 0 0 0 0 2 2 1 1 2 2 2 2 1 1 2 2 2 1 2 2 1 2 2 1 1 1 1
Bhonkhera 1 1 0 0 0 0 0 0 0 0 2 2 1 1 2 2 2 2 1 1 2 2 2 1 2 2 1 2 2 1 1 1 1
Gendpur Shaikhpur 1 0 0 0 0 0 0 0 0 0 2 2 1 2 2 2 2 2 1 1 2 2 2 1 2 2 1 2 2 1 1 1 1
Junedpur 1 1 0 0 0 0 0 0 0 0 2 2 1 2 2 2 2 2 1 1 2 2 2 2 2 2 1 2 2 1 1 1 1
Lalpur 1 1 0 0 0 0 0 0 0 0 2 2 1 2 2 2 2 2 1 1 1 2 2 1 2 2 1 2 2 1 1 1 1
Hamidpur 1 1 0 0 0 0 0 0 0 0 2 2 1 2 2 2 2 2 1 1 2 2 2 1 2 2 1 2 2 1 1 1 1
Jauli 1 1 0 0 0 0 0 0 0 0 2 2 1 2 2 2 2 2 1 1 2 2 2 1 2 2 1 2 2 1 1 1 1
Sikandrabad (NPP)
……………………………………………………………………………………….Urban
Area…………………………………………………………………………………………
Luharli 1 1 0 0 0 1 0 1 0 1 2 2 1 2 2 2 2 2 1 1 1 2 2 1 1 2 1 2 2 1 1 1 1

Document No. SCCPL/EIA/01 Issue No. 01 R 01 155
Pachauta 1 1 1 1 0 0 0 0 0 0 2 2 1 2 2 2 2 2 1 1 1 2 2 2 1 2 1 2 2 1 1 1 1
TOTAL
8
9
5
3
1
4 6 4 5 8 9 2 3
Status for Availability and Non-Availability is shown as A (1) & NA (2)
respectively
Source-http://www.censusindia.gov.in/2011census/dchb/DCHB.html
❖ Abbreviations used in the Table 3.27 are as follows;

Document No. SCCPL/EIA/01 Issue No. 01 R 01 156
List of Abbreviations used in Table-3.27 :
Educational Facilities P-Primary School M-MiddleSchool HSS-Higher Secondary Schools SSS-Senior Secondary School C-Colleges Adl. L.C.-Adult Literacy Class/Centers Indl. S.-Industrial School O-Other Educational Schools Medical Facilities Al. H. - Allopathic Hospitals Ayu. H.-Ayurvedic Hospitals Ayu. D. - Ayurvedic Dispensary Un. H. - Unani Hospital Hom. D.-Homeopathic Dispensary MCWC-Maternity and Child Welfare Centre CWC-Child Welfare Centre MH-Maternity Home CWC-Child Welfare Centre HC-Health Centre PHC-Primary Health Centre PHSC-Primary Health Sub-Centre FWC-Family Welfare Centre NH-Nursing Home RMP-Registered Private Medical Practitioners SMP-Subsidized Medical Practitioners CHW-Community Health Workers O-Other Medical Facilities
Drinking Water Facilities T-Tap Water W-Well Water Tk-Tank Water TW- Tube Well Water HP-Hand Pump R-River Water C-Canals O-Other Drinking Water Sources Post, Telegraph and Telephone Facilities PO- Post Office Tel. - Telephone Connection Communication Facilities BS- Bus Services RS- Railways Services NW- Navigable Waterway Available Approach to Village PR- Paved Roads KR-Kuchha Road FP- Foot Path Power Supply ED-Electricity for Domestic Use E Ag. - Electricity of Agricultural Use EC-Electricity for Commercial Purpose EO- Electricity for Other Purposes EA- Electricity for All Purposes

Document No. SCCPL/EIA/01 Issue No. 01 R 01 157
CHAPTER 4. IMPACTS ASSESSMENT AND PREDICTION
4.1. General
Impacting activities are defined as elements of organization's activities that can interact with
the environment. These include activities during normal and abnormal actions of
Residential, commercial and education units. Environmental impacts are defined as any
change in environment, whether adverse or beneficial, wholly or partially, resulting from
impacting activities.The environmental indices (or parts of the receiving environment on
which impacts are being predicted) are ambient air, water, noise, land, flora and fauna,
infrastructure, and socio-economic environment. Thus, we predict the environmental
impacts of the impacting activities on the environmental indices. In this chapter we covered
the cummulative impact considering approved TOR prescribed by MOEF&CC.
The possible impact on various components of environment due to the proposed project
can be assessed in terms of:
• Beneficial or detrimental
• Naturally reversible or irreversible
• Repairable via management practices or irreparable
• Short term or long term
• Temporary or continuous
• Occurring during construction phase or operational phase
• Local, regional, national or global
• Accidental or planned (recognized beforehand)
• Direct (primary) or Indirect (secondary)
• Cumulative or single
• Significant
And on:
• Physical
• Biological Environment and
• Demographic and Socio-economic Environment.
For proper assessment of significance and magnitude of environmental changes due to
construction and operational phases of the plant, the impacts are analyzed on the 10 km
radius study area around the proposed plant site for each environmental parameter. Impact
assessment study for the proposed unit is carried out by predicting net contribution of
pollutants (qualitative as well as quantitative) on overall qualitative assessment of various
environmental indicators. Prediction of impacts is an important component in environmental
This chapter details the inferences drawn from the Environmental Impact Assessment of the
proposed project. It describes the overall impacts of the project activities and underscores
the areas of concern, which need mitigation measures.
Document No. SCCPL/EIA/01 Issue No. 01 R 01 158
impact assessment process. Several techniques and methodologies are in vogue for
predicting the impacts due to existing and proposed industrial development on physico-
ecological and socio-economic components of environment. Such predictions delineate
contribution in existing baseline data for the operational project and superimpose over the
baseline (pre-project) status of environmental quality to derive the ultimate (post-project)
scenario of the environmental conditions due to the proposed project. The quantitative
prediction of impacts lead to delineation of suitable environmental management plan
needed for implementation during the construction, commissioning and operational phases
of the proposed project in order to mitigate the adverse impacts on environmental quality.
4.2. Construction Phase
The activities of proposed project program will be confined to the project site within the
boundary of Plant complex. The present project activities will not cause any significant loss
of any important flora.
Emission /Gaseous pollution
Due to different vehicular movement, construction machineries and project construction
activities (Bulk solids handling), the concentration of air pollutants can increase. These
pollutants can affect the surrounding vegetation and nearby agricultural crops. There will
be limited construction activities at SCCPL.
Dust / Fumes (from machineries) Generation
Terrestrial flora can be affected by the dusty/ fumes environment to be created due to
vehicular movement/ machineries during construction phase. Increment in the density of
the dust particles (SPM)/ fumes having SOx/NOx/HC in the atmosphere can affect the
surrounding plant/ vegetation in following ways:
a) Blockage and damage to stomata
b) Reduction in chlorophyll content
c) Abrasion of leaf surface or cuticle
All these disturbances ultimately affect photosynthesis process and plant metabolism that
leads to reduction in plant growth up to some extent.
Noise Pollution
Noise level of the project area will increase during construction phase. Although there is no
specific noise-sensitive fauna has been recorded near to project site (and project site is in
Industrial area) but limited avifauna and small animals in the industrial area can be affected
by increased noise level. In such cases they can change their habitat.
Congregation of Labour
Construction activities often require a considerable workforce and associated support
services. The livelihood activities of this increased human population may contribute to local
environmental impacts in terms of collecting firewood and food as well as enhancing
recreational activities.

Document No. SCCPL/EIA/01 Issue No. 01 R 01 159
The impacts during construction phase normally are:
• Detrimental
• Naturally reversible
• Short term
• Temporary
• Local
• Direct
Mitigation Measures:
Gaseous pollution
The pollutants (SPM, SOX,NOX, HC and others) in ambient air of the study area are low.
Development of multi-layer plantation (green belt) around the proposed project area will
further help to mitigate gaseous pollution within and around the project area.
Dust Generation
Dust generation during construction period will be managed through:
Water spraying on rough roads, on powdery construction materials etc.
Land / Soil
As this is new project, there will be construction activities to be carried out. There will also
be installation of new machineries and equipment. But all this would not make a huge
damage to the present condition of land. Further the area of the plant is flat. Much leveling
would not be required. Thus, topography will also remain unchanged after execution of the
proposal.
Thus, the impact on the land/soil during the construction will for short terms and
insignificant.
Effluent discharge
There will be a negligible discharge of effluent from the proposed plant due to construction
activities, which will be directly sent to Soak pit through septic tank. Safe guard for rainy
season runoff will be taken to prevent any direct discharge from the plant to nearby water
body. As such the water ecology will not be affected, the domestic effluent will be
discharged through septic tank into soak pit.
Congregation of Labour
The impacts will be managed through:
• No permanent camping in vegetation rich area and riverside
• A provision of fuel for labourers engaged in construction activities
• Restriction on poaching/hunting and removal of any vegetation

Document No. SCCPL/EIA/01 Issue No. 01 R 01 160
Based on the field observations and interaction with local people and forest officials, it was
noticed that the project area is not associated with any National Park/Wildlife
Sanctuary/Conservation Reserve and there is no wildlife migratory routes present in the
project area. Improvement in the green cover under a regular plantation program (Greenbelt
Development Program) will not only increase the plant diversity in the area but also
enhance the habitat for wildlife especially for avifauna.
4.3. Operation Phase
4.3.1. Air Environment
The pre-project (baseline) ambient air quality status in the study area indicates that all the
general as well as specific to project pollutants are well within the prescribed National
Ambient Air Quality Standards (NAAQS) for industrial, residential, rural and other areas.
The principal impacts on air environment shall be due to operation of flue gas stacks and
process stacks – Briquettes /LDO shall be used as fuel in the boilers & DG sets. To minimize
the impacts due to emission from small boiler high stack (as per norms) shall be provided
as air pollution control equipment. The process vents shall be attached to efficient adequate
water scrubbers followed by alkali / acid scrubbers to remove pollutant from process
emission.
To assess the impact of air emissions from various continuous point sources, air dispersion
modeling study has been conducted with the help of ISCST3 (USEPA dispersion model).
Detailed description has been given in the following sub-sections:
4.3.2. Model Details
Air dispersion modeling can be used to predict atmospheric concentrations of pollutants at
specific locations (receptors) over specific averaging times (i.e. annual, daily, and hourly).
An atmospheric dispersion model accounts for the emissions from a source; estimates how
high into the atmosphere they will go, how widely they will spread and how far they will
travel based on temporal meteorological data; and outputs the pattern of concentrations
that will occur for various exposure periods, thereby providing the exposure risks for
different receptors.
In the proposed project, prediction of impacts on air environment has been carried out
employing mathematical model based on a Steady State Gaussian Plume Dispersion
Model designed for multiple point sources for short term. In the present case, Industrial
Source Complex Short-term [ ISCST3] dispersion model based on steady state Gaussian
Plume Dispersion, designed for multiple points sources for short term and developed by
United States Environmental Protection Agency (USEPA) has been used for simulations
from point sources.
The predictions for air quality during operation phase were carried out for particulate matter
(PM) SOx, NOx, HCl, NH3 andHC using ISCST3.
A uniform polar grid was used for the computation and extended to 10 km from the centre
of the proposed project. In addition to that, receptors were also placed at the sampling
locations

Document No. SCCPL/EIA/01 Issue No. 01 R 01 161
4.3.3. Predicted GLC due to proposed project
The main sources of air pollution due to the operation of the plant are the Boiler, Process
vent and other stacks. The contribution to GLCs for the pollutants i.e. particulate matter,
SOx, NOx, and HC were predicted over the study area proposed project considering the
worst scenario. The emission load from proposed project is given in Table below. The
prediction (maximum) is based on the expected total emission rate from each stack and are
given in isopleths Figure 4.1 (A, B, C and D) for proposed project. The additional
contribution to GLC is also given below in Table 4.1.
Table 4.1 :Stack Emission Details
S. No.
Stack Attached
to Fuel Used
Quantity of Fuel/
Capacity APCM
Expected Pollutants
Efficiency of APCE
Stack Height/
Dia (m)
Flue Gas Stacks
1 Boilers
Agrowaste briquettes / FO (as per availability)
1 MT High Stack SPM, SO2 &NOx --- 30
---
3 DG Sets HSD ~ 25
liters/day Adequate Stack Ht.
PM, SO2 &NOx - 15
Process Stacks / Vents
1
Process Reactor – Vents -
Combined into one
- - Acid
Scrubber HCl,NH3, Nox&HC 99.9 % 10/0.2
Table 4.2 : Plant Stacks
Sr. No Stack attached to Stack Ht. /
Dia. (m)
Flow
(Nm3/hr)/
Temp. 0C
Pollutant Concentration
PM SO2 NOx ---
(Estimated; Kg/Hr)
1 Boiler Heater 30 1500 1.13 0.36 1.1
Process Stacks
Pollutant Concentration
(Estimated; mg/Nm3)
HCl NH3 NOx HC
Estimated; mg/Nm3
3
Process Reactor –
Vents - Combined
into one
10/0.2 ~1000/37
<20
<30
<25
<15

Document No. SCCPL/EIA/01 Issue No. 01 R 01 162
The pollution load due to the unit is as given Table 4.3:
Table 4.3 :Pollution Load
Sr. No Stack attached toPollutant
Pollutant Load g/sec
PM SOx NOx HC
1. Boiler 0.11 0.3 0.3 -
Process Stacks PM HCl NH3 HC
4. Process Reactor – Vents
Combined into one --- 0.02 0.03
0.015
4.3.4. Meteorological Data
The meteorological data consists of wind speed, direction, temperature, humidity, solar
radiation, cloud cover and rainfall recorded during the months of 15st March, 2017 through
15th June 2017, on an hourly basis. Wind speed, wind direction and temperature have been
processed to extract the 24–hour mean meteorological data for application in ISCST3.
4.3.5. Receptor Locations
A total of about 186 receptors – 180 receptors of which were generated with a polar grid
from the centre of the proposed project and extended to 10 km. Apart from these receptors,
the sampling locations were also taken into account to assess the incremental load on the
baseline environmental scenario.
4.3.6. Summary of Predicted GLC’s
The summary of maximum ground level concentrations (GLC) for the proposed project is
listed in Table 4.4.
Table 4.4 Summary of Maximum 24-hour Incremental GLC due to the Proposed Project
Stacks
Parameters Maximum incremental GLC
(µg/m³) Distance (Km) Direction
PM 0.152 1.5 EES
SO2 0.408 1.5 E & EES
NOx 0.408 1.5 E & EES
NH3 0.201 1.2 SE
HCL 0.151 1.2 SE
HC 1.005E-0.1 1.2 SE
(Source: Modelling output results)
Maximum 24 hourly averages incremental in GLCs of particulate matter, SOx, NOx& HBr
due to proposed project during operation phase are predicted and given in Table 4.4. The
Document No. SCCPL/EIA/01 Issue No. 01 R 01 163
isopleths of the pollutant concentration due to the impacts associated with the operation of
the proposed project are shown in Figures 4.1 (A,B,C and D) for, Particulate matter, SOx,
NOx and NH3respectively. Contours of the incremental GLCs depict that the travel of
emissions from the proposed project would be mainly in E& EES direction.
Besides the worst GLC (maximum) predictions the GLC incremental at the sensitive
receptors (where the ambient air monitoring was carried out) was also predicted.
4.3.7. Discussion of the Cumulative Impacts at monitoring locations:
The nearest settlement in downwind direction is Village Rajampur (1.15 km E). As per
baseline data of AAQ maximum GLC for PM at Rajampur is 33.15µg/m³ with this proposed
project, 0.152 µg/m³ rise in GLCs so PM level will be 33.15 µg/m³. The Particulate Matter
in the study area is contributed mainly by commercial activities and traffic movement
(vehicular emissions), re-suspended dust from paved and unpaved roads and open
uncovered areas as well as from industrial activities.
Maximum baseline GLC for SO2 (Process) at downwind direction Rajampur (1.15 km E)
was as 7.0µg/m³ are observed. With the Proposed project Sox level may increase by 0.408
µg/m³ so post project level of Sox is 7.408 µg/m³. Maximum baseline GLC for NOx in
downwind direction at VillageRajanpur (1.15 km E).as 12.2 µg/m³. With the expansion
project NOx concentration is 0.408 µg/m³ so rise in GLC of NOx concentration is 12.62
µg/m³. It can be concluded that with the proposed project all the AAQ parameters will
remain within the NAAQ norms.
As is evident from the table and discussion above, there will be no adverse impacts on the
surrounding area. All pollutants post project GLC will be well within NAAQ norms. Highly
efficient air pollution control systems have been adopted to mitigate particulate matter as
well as gaseous emissions in the ambient environment.

Document No. SCCPL/EIA/01 Issue No. 01 R 01 164
(A) Isopleth for PM incremental GLC due to Proposed Project

Document No. SCCPL/EIA/01 Issue No. 01 R 01 165
(B) Isopleth for SOx incremental GLC due to Proposed Project

Document No. SCCPL/EIA/01 Issue No. 01 R 01 166
(C) Isopleth for NOx incremental GLC due to Proposed Project
(D) Isopleth for NH3 incremental GLC due to Proposed Project
Mitigation Measures:
The ambient air quality with respect to air pollutants will change during the operation phase
of the proposed project. However, adequate stack height has been provided for better
dispersion of flue gas as per the guidelines of CPCB. In addition all process stacks has
been provided with high efficiency common scrubbing system to control the emission
within norms. In addition to that, adequate greenbelt will be developed for further control
of air pollution.
Compliance with the existing ambient air quality standards will be achieved by process
system selection as outlined above, proper system operation and implementation of the
measures as outlined in EMP. This needs to be coupled with the continuous monitoring of
air pollutants within and around the project site as well as in adjoining areas.
Environmental impacts (AAQ) resulting from proposed project can be grouped into
following
Categories:
• Beneficial or detrimental--detrimental

Document No. SCCPL/EIA/01 Issue No. 01 R 01 167
• Naturally reversible or irreversible---Reversible
• Repairable via management practices or irreparable—Repairable to some extent
through Green Belt development
• Short term or long term Short term
• Temporary or continuous-- Continuous
• Occurring during construction phase or operational phase—Operation Phase
• Local, regional, national or global--Local
• Accidental or planned (recognized before hand)-- Planned
• Direct (primary) or Indirect (secondary)-- Direct
• Cumulative or single-- Single
4.4. Noise Environment
The sources of noise during the operational phase of the plant are mainly from Boiler,
Thermic Fluid Heater, blowers, pumps, vacuum pumps, ejectors and furnaces and other
process equipment. The other sources of noise are the movement of vehicles along the
road. Moving machineries will be selected with caution as regard to low noise generation
as well as low energy consumption.
4.4.1. Impacts due to Transportation
Noise level contributed from increased movement of light medium and heavy vehicles on
the roads both within and outside the plant can be considerable depending upon the traffic
density. The heavy commercial vehicles traffic is limited depending upon the material
receipt and dispatch of products through road transport. The major quantity of pesticides
will be dispatched through roads.
4.4.2. Impact of noise on community
Equivalent sound levels are often used to describe community exposures to noise. Noise
survey was also carried out at eight locations outside the plant area but within the study
area. Ambient noise level of the study area is within the prescribed National Ambient Noise
Quality Standard for respective residential, commercial and industrial category at all the
monitored locations which is well within the day and night time standard (commercial).
The operation of proposed project will have the noise level not much exceeding the present
noise level and as such will not have any adverse impact on the human settlement around
it. The noise will not be audible beyond its boundary limit, particularly due to natural green
belt and other attenuators.
Mitigation Measures:
Noise from the plant is to be limited through:
a. High noise machineries (DG sets etc.) should have acoustic enclosures.
b. Proper / regular maintenance of machineries.
Regular noise monitoring shall be taken in work zone. Any abnormal noise level to be
investigated and noise source attended.
Green belt development helps to arrest noise from going outside the plant.
Environmental impacts (Noise) resulting from proposed project can be grouped into
following
Document No. SCCPL/EIA/01 Issue No. 01 R 01 168
Categories:
• Beneficial or detrimental--detrimental
• Naturally reversible or irreversible---Reversible
• Repairable via management practices or irreparable—Repairable to some extent
through Green Belt development
• Short term or long term Short term
• Temporary or continuous-- Continuous
• Occurring during construction phase or operational phase—Operation Phase
• Local, regional, national or global--Local
• Accidental or planned (recognized before hand)-- Planned
• Direct (primary) or Indirect (secondary)-- Direct
• Cumulative or single-- Single
4.5. Water Environment
Impact on water environment due to proposed project scheme will be in terms of additional
water consumption {water demand} and waste water generation after treatment will be
recycled and reused.
4.5.1. Water Demand
Since the proposed project will have water requirement both during construction period as
well as during operation. The requirement during construction period will be much less. as
compared to that during operation and will be met from Surface water and ground water
or both.
Water during operational phase is normally required for:
• Process and washing
• Cooling Water
• Boiler Feed Water
• Domestic and Green Belt
Total fresh water requirement will be around limited (10 KLD) and will be obtained from
Bore well. The area lies in non notified overexploited area as per CGWA.. The total fresh
water requirement after the proposed project will be 10 KLD and ~4 KLD water will recycled
and used. The water balance for the proposed project is given in the Figure 2.4.
The domestic wastewater generated from the toilets, washrooms and canteen of the plant
shall be sent to Septic tank through soakpit. No wastewater will be discharged outside the
plant premises during non-monsoon and under normal operating condition, unit followed
the zero discharge concepts.
4.5.2. Effluent Generation and Discharge
.The process effluent will be treated in ETP (Capacity 6 KL). Domestic sewage will be
disposing off in to septic tank followed soak pit.
Effluent treatment normally includes flocculation, coagulation, settling, carbon adsorption,
detoxification of pesticides by oxidation (using ultraviolet systems or peroxide solutions),
and

Document No. SCCPL/EIA/01 Issue No. 01 R 01 169
biological treatment (details in Chapter 2). The wastewater shall be passed through
Pressure Sand Filters to remove left out TSS and Activated Carbon Filters for final effluent
polishing. After tertiary treatment, effluent shall be collected in Treated Effluent tank. The
treated effluent will go to RO System before recycling in the process. RO reject and other
wet sludge will go to solar cum forced evaporation tank. Permeate from RO will be reused
in cooling tower and green belt development and reject will be treated to achieving Zero
Liquid discharge. Reverse osmosis or ultrafiltration is used to recover and concentrate
active ingredients. The inorganic hazardous residues will be sent to TSDF.
Hazardous wastes will be stored, managed and handles as per hazardous wastes rules.
All bulk chemicals and fuel storage areas will be provided with dyke wall / bunds to
eliminate chances of any spillages/ leakages entering into the storm water drain.
No significant adverse impact on the surface and ground water or soil quality is envisaged
in view of the proposed mitigate measures.
Mitigation Measures:
Water consumption to be controlled though eliminating / reducing any water wastage –
leakages/ spillage.
a. Process control
Regular monitoring of effluent sources to ETP will show process conditions and deviation
from optimum water consumption.
ETP – performance for maximum recycle of treated water.
Environmental impacts (Water) resulting from proposed project can be grouped into
following
Categories:
• Beneficial or detrimental--detrimental
• Naturally reversible or irreversible---Reversible
• Repairable via management practices or irreparable—Repairable to some extent
• Short term or long term Short term
• Temporary or continuous--continuous
• Occurring during construction phase or operational phase—Operation Phase
• Local, regional, national or global--Local
• Accidental or planned (recognized before hand)-- Planned
• Direct (primary) or Indirect (secondary)—Direct
• Cumulative or single-- cumulative
4.6. Land/Soil Environment
Essentially, the two major impacts normally faced in impact on land environment due to
any development project are:
• Diversion of land from designated use to the Project Use.
• Deterioration of land / soil in terms of soil fertility and toxicity due to hazardous wastes
or liquid efluents.
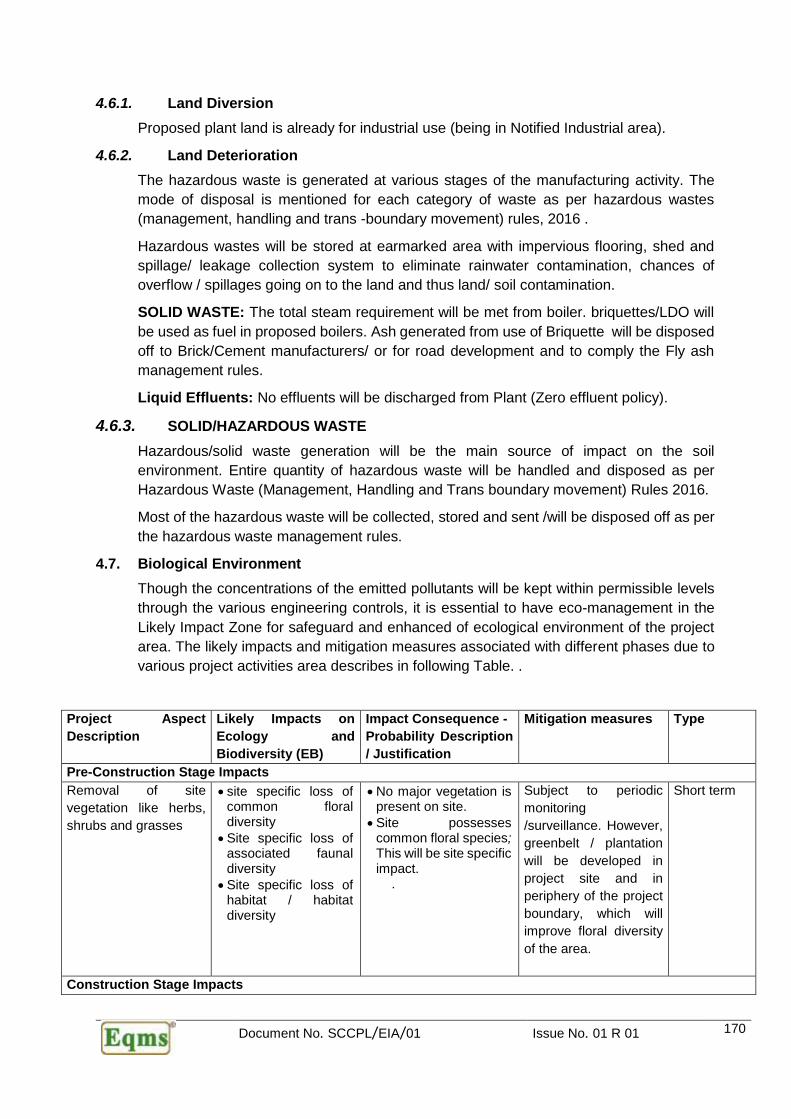
Document No. SCCPL/EIA/01 Issue No. 01 R 01 170
4.6.1. Land Diversion
Proposed plant land is already for industrial use (being in Notified Industrial area).
4.6.2. Land Deterioration
The hazardous waste is generated at various stages of the manufacturing activity. The
mode of disposal is mentioned for each category of waste as per hazardous wastes
(management, handling and trans -boundary movement) rules, 2016 .
Hazardous wastes will be stored at earmarked area with impervious flooring, shed and
spillage/ leakage collection system to eliminate rainwater contamination, chances of
overflow / spillages going on to the land and thus land/ soil contamination.
SOLID WASTE: The total steam requirement will be met from boiler. briquettes/LDO will
be used as fuel in proposed boilers. Ash generated from use of Briquette will be disposed
off to Brick/Cement manufacturers/ or for road development and to comply the Fly ash
management rules.
Liquid Effluents: No effluents will be discharged from Plant (Zero effluent policy).
4.6.3. SOLID/HAZARDOUS WASTE
Hazardous/solid waste generation will be the main source of impact on the soil
environment. Entire quantity of hazardous waste will be handled and disposed as per
Hazardous Waste (Management, Handling and Trans boundary movement) Rules 2016.
Most of the hazardous waste will be collected, stored and sent /will be disposed off as per
the hazardous waste management rules.
4.7. Biological Environment
Though the concentrations of the emitted pollutants will be kept within permissible levels
through the various engineering controls, it is essential to have eco-management in the
Likely Impact Zone for safeguard and enhanced of ecological environment of the project
area. The likely impacts and mitigation measures associated with different phases due to
various project activities area describes in following Table. .
Project Aspect
Description
Likely Impacts on
Ecology and
Biodiversity (EB)
Impact Consequence -
Probability Description
/ Justification
Mitigation measures Type
Pre-Construction Stage Impacts
Removal of site
vegetation like herbs,
shrubs and grasses
• site specific loss of common floral diversity
• Site specific loss of associated faunal diversity
• Site specific loss of habitat / habitat diversity
• No major vegetation is present on site.
• Site possesses common floral species; This will be site specific impact.
.
Subject to periodic
monitoring
/surveillance. However,
greenbelt / plantation
will be developed in
project site and in
periphery of the project
boundary, which will
improve floral diversity
of the area.
Short term
Construction Stage Impacts

Document No. SCCPL/EIA/01 Issue No. 01 R 01 171
Dust and Noise
Generation due to
movement
of JCBs, other
machinery, and other
construction activities
Site specific
disturbance to faunal
species
Dust settlement on
vegetation
No endangered fauna
reported from the site as
well as in study area. The
species reported from
project site and buffer
zone are common /
generalist species and
not very sensitive to the
routine activities, so
there will be no threat of
facing disturbance.
However, its site specific
and temporary impact.
Subject to periodic
monitoring and
surveillance.
Water sprinkling for
Dust suppression.
Construction activities
shall be restricted in
night time.
Short term
Operation Stage Impact
Emission of PM, NOx,
Sox, HCl etc. due to
operation (Indirect
impact on crops, trees
and shrubs of vicinity
due to contamination
of ambient air, dust
emission, vehicular
exhaust)
Impact on surrounding
vegetation and
associated biodiversity.
Though the emission
levels of all pollutants will
be kept within
permissible limits. APCD
shall be used to control
dust emissions from
various sections of plant.
The incremental air
pollution will not violate
the air quality standards .
Proposed plant is zero
liquid discharge basis so
no waste water will be
discharged.
Greenery development
will be done in and
around the plant site .
Such measures will be
adequate to protect the
noise and air pollution
impacts.
Operation subject to
management of
operational controls.
Emission levels of all
pollutants will be kept
Within permissible
levels through various
engineering control
measures. However,
green belt development
with suitable species
will help to mitigate
likely cumulative
impacts.
Long term
(insignificant
)
Noise Generation
(Disturbance to
sensitive terrestrial
fauna due to
noise pollution)
Construction Stage Impacts
Excavation and filling up operation may results in fugitive dust emission. The dust
deposition on pubescent leaves of the surrounding vegetation may leads to temporary
reduction of photosynthesis. Such impacts would however be confined mostly to the initial
period of the construction phase and would minimized through paving of roads, surface
treatment, regular water sprinkling in dust generating areas and greenbelt development.
The impact on the ecology of the surrounding area during the construction stage will be
insignificant in nature. Greenbelt development along the plant boundary, development of
gardens and lawns will mitigate the residual impact on natural resources.
Operation stage Impacts

Document No. SCCPL/EIA/01 Issue No. 01 R 01 172
No national park, wildlife sanctuary, biosphere reserve exists within 10 km area of the
project. No endangered or rare or threatened plant or animal species was observed within
10 km area of the project site (Except Peafowl). However, one small patches of forest
ispresent within the study area which is located more than 5 km away from the site. The
impact on the surrounding ecology during the operation of the project will mainly occur
from the deposition of air pollutants. Air pollution affects the biotic and abiotic components
of the ecosystem individually and synergistically with other pollutants. Chronic and acute
effects on plants and animals may be induced when the concentration of air pollutants
exceeds threshold limits. Particulate emission and other gaseous emissions from the
proposed plant are the major pollutant that may affect the ecology of the area. The
incremental emission of air pollutants is not likely to induce any significant changes in the
ecology because the national ambient air quality standards will remain within the limits.
The incremental MGLC of PM, Sox, NOx, HCl etc. generated from the proposed plant will
be very less and overall incremental GLC will remains within the NAAQS. Therefore impact
of PM, NOx, HCl etc. emission on the surrounding vegetation will be insignificant.
CREP Guidelines: SCCPL as good corporate company committed to abide by CREP
guide lines for pesticide industry as give below:
The guidelines enunciated by CPCB are very helpful to mitigate environment pollution,
improve human health and benefit of cost savings by cutting cost of valuable solvent by
efficient recovery system. We (SCCPL) will adopt all the guidelines as stated here under.
Table 4.5 CREP Guidelines Compliance
Sr. No CREP Point Compliance
1
Segregation waste streams: Waste streams
should be segregated into COD waste, toxic waste,
low COD waste, inorganic waste etc, for the
purpose of providing appropriate treatment.
Waste streams will be segregated and treated in well-designed ETP
2
Detoxification and treatment of high COD waste
streams: Streams should be detoxified and treated
in CTP or thermally destroyed in incinerator, as per
CPCB guidelines. The waste streams should be
treated suitably before taking to evaporationponds.
SCCPL will have ETP followed by RO system. All the treated effluents will be recycled in the process.
3
Improvement in solvent recovery:
– Solvent recovery should be improved and
attempts should be made to achieve at least 90%
recovery wherever possible.
– Rest of the solvents which cannot be recovered
shall be incinerated.
SCCPL will follow norms
Hazardous air pollutant control: High efficiency scrubber and
stacks for reducing the Air pollution will be provided.
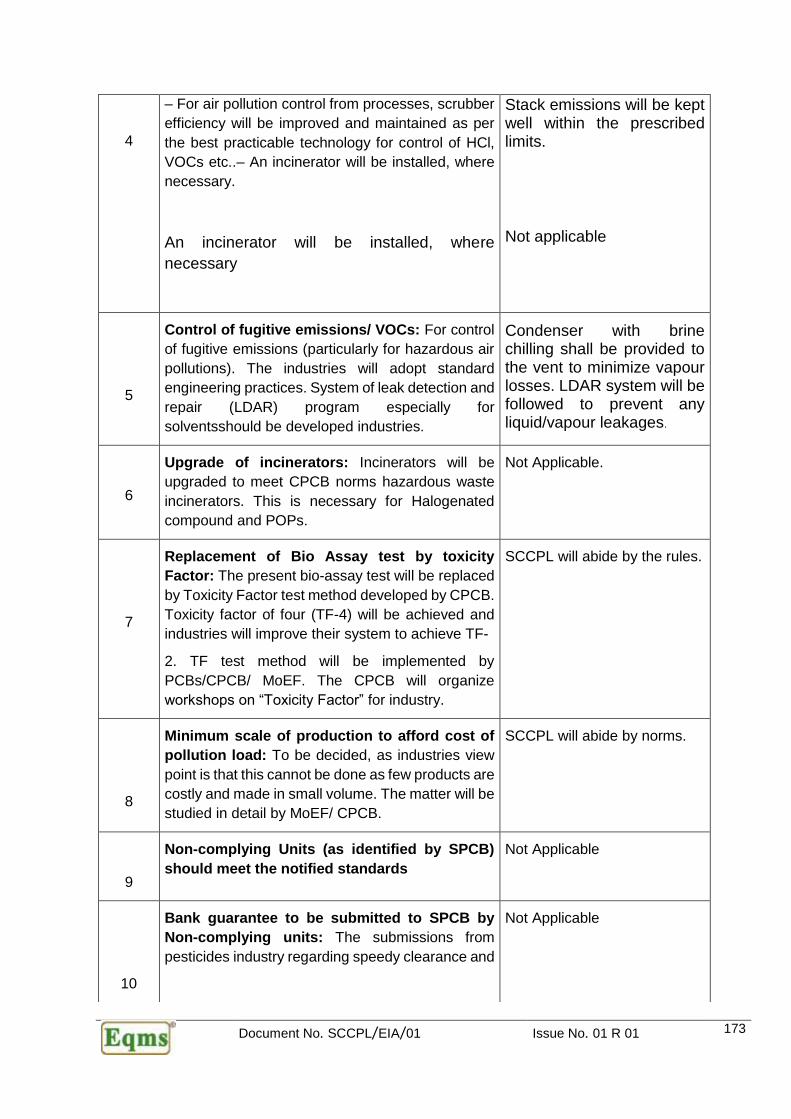
Document No. SCCPL/EIA/01 Issue No. 01 R 01 173
4
– For air pollution control from processes, scrubber
efficiency will be improved and maintained as per
the best practicable technology for control of HCl,
VOCs etc..– An incinerator will be installed, where
necessary.
An incinerator will be installed, where
necessary
Stack emissions will be kept well within the prescribed limits.
Not applicable
5
Control of fugitive emissions/ VOCs: For control
of fugitive emissions (particularly for hazardous air
pollutions). The industries will adopt standard
engineering practices. System of leak detection and
repair (LDAR) program especially for
solventsshould be developed industries.
Condenser with brine chilling shall be provided to the vent to minimize vapour losses. LDAR system will be followed to prevent any liquid/vapour leakages.
6
Upgrade of incinerators: Incinerators will be
upgraded to meet CPCB norms hazardous waste
incinerators. This is necessary for Halogenated
compound and POPs.
Not Applicable.
7
Replacement of Bio Assay test by toxicity
Factor: The present bio-assay test will be replaced
by Toxicity Factor test method developed by CPCB.
Toxicity factor of four (TF-4) will be achieved and
industries will improve their system to achieve TF-
2. TF test method will be implemented by
PCBs/CPCB/ MoEF. The CPCB will organize
workshops on “Toxicity Factor” for industry.
SCCPL will abide by the rules.
8
Minimum scale of production to afford cost of
pollution load: To be decided, as industries view
point is that this cannot be done as few products are
costly and made in small volume. The matter will be
studied in detail by MoEF/ CPCB.
SCCPL will abide by norms.
9
Non-complying Units (as identified by SPCB)
should meet the notified standards
Not Applicable
10
Bank guarantee to be submitted to SPCB by
Non-complying units: The submissions from
pesticides industry regarding speedy clearance and
Not Applicable
Document No. SCCPL/EIA/01 Issue No. 01 R 01 174
4.8. Socio – Economic Environment
Proposed project will generate employment opportunities some through direct employment
and more so indirectly through services for the plant. Pesticides manufactured by
proposed plant are indirectly going to contribute food grain availability by preventing loss
due to insects (to crop) and rodents (during storage) etc.
• Proposed project will have some impacts also on socio – economic environment of the
study area- some are as given below:
• Proposed project will result in handling of product and raw material, which will increase
manpower requirement at various stages directly, or indirectly resulting in more income
of people.
• Proposed project would increase requirement from ancillary and auxiliary industries in
the vicinity.
• More income to Government through more taxes on higher amount of production.
4.9. INFRASTRUCTURE
The site is located in planned notified industrial area having a good network of internal
roads. Further the site is located close to National Highway-91 (Ghaziabad to Kanpur
Highway) which is passing about 300 m south of the project site.
As the site is located close to NH-91 and all the material movement shall be done through
this highway. The NH-91 is multilane (4-lane) of very good design (1.5 m hard shoulders
and 3 m central verge) and its capacity is 40000 PCU per day as per IRC specification
(IRC64-1990). Considering total material transport from Samridhii crop chemicals i.e. on
fifteen trucks (10 tonners) /month, the existing highway is adequate to bear the additional
load without any issue.
other will be considered by MoEF/CPCB for
examination.
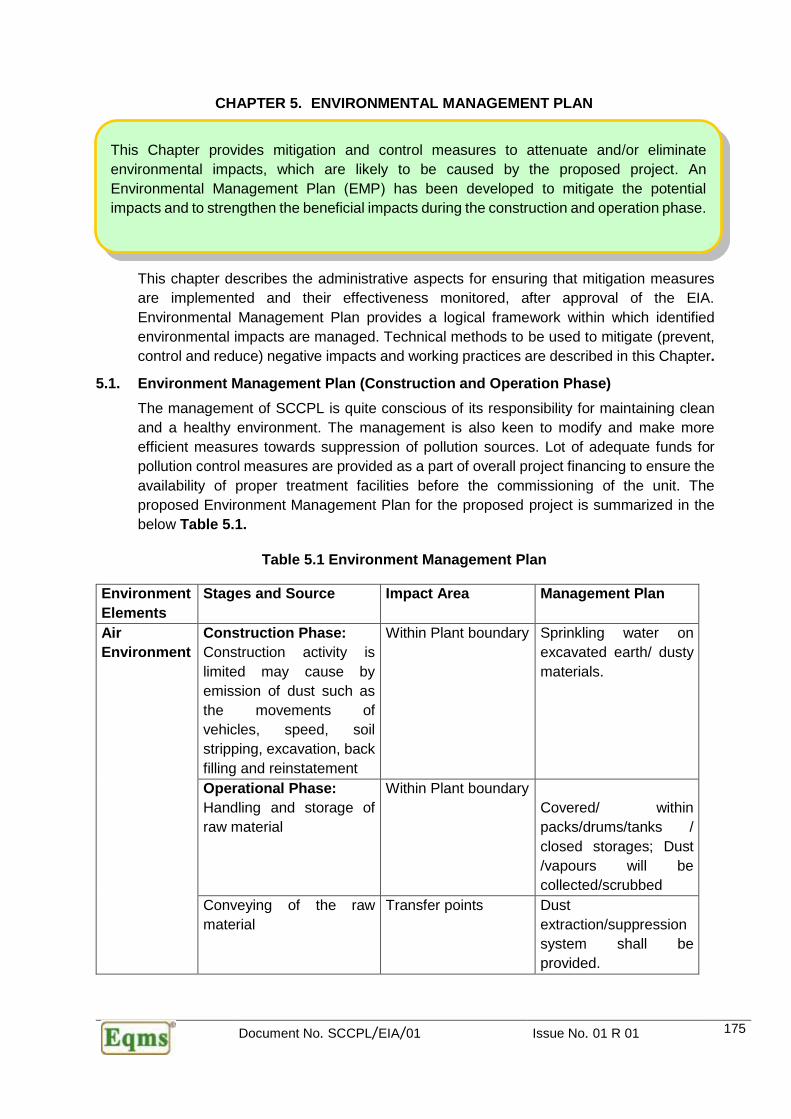
Document No. SCCPL/EIA/01 Issue No. 01 R 01 175
CHAPTER 5. ENVIRONMENTAL MANAGEMENT PLAN
This chapter describes the administrative aspects for ensuring that mitigation measures
are implemented and their effectiveness monitored, after approval of the EIA.
Environmental Management Plan provides a logical framework within which identified
environmental impacts are managed. Technical methods to be used to mitigate (prevent,
control and reduce) negative impacts and working practices are described in this Chapter.
5.1. Environment Management Plan (Construction and Operation Phase)
The management of SCCPL is quite conscious of its responsibility for maintaining clean
and a healthy environment. The management is also keen to modify and make more
efficient measures towards suppression of pollution sources. Lot of adequate funds for
pollution control measures are provided as a part of overall project financing to ensure the
availability of proper treatment facilities before the commissioning of the unit. The
proposed Environment Management Plan for the proposed project is summarized in the
below Table 5.1.
Table 5.1 Environment Management Plan
Environment
Elements
Stages and Source Impact Area Management Plan
Air
Environment
Construction Phase:
Construction activity is
limited may cause by
emission of dust such as
the movements of
vehicles, speed, soil
stripping, excavation, back
filling and reinstatement
Within Plant boundary Sprinkling water on
excavated earth/ dusty
materials.
Operational Phase:
Handling and storage of
raw material
Within Plant boundary
Covered/ within
packs/drums/tanks /
closed storages; Dust
/vapours will be
collected/scrubbed
Conveying of the raw
material
Transfer points Dust
extraction/suppression
system shall be
provided.
This Chapter provides mitigation and control measures to attenuate and/or eliminate
environmental impacts, which are likely to be caused by the proposed project. An
Environmental Management Plan (EMP) has been developed to mitigate the potential
impacts and to strengthen the beneficial impacts during the construction and operation phase.

Document No. SCCPL/EIA/01 Issue No. 01 R 01 176
Truck/ vehicles
Movements
Within Plant boundary Pucca roads/ water
spray
Process emission
Boiler; Thermo Fluid
Heater& DG Stack
within study area Adequate stack height
and green belt
development
Process stack Within study area Adequate stack
attached with scrubbers
and green belt
development
Noise
Environment
During Construction
Phase:
Movement of heavy
equipment’s
Within Project
Boundary
Regular maintenance
of the construction
equipment’s.
Provision of protective
devices like ear
muff/plugs to the
workers.
During Operation Phase:
Increase in ambient Noise
level from equipment’s,
pump, DG sets and
compressors. However
incremental level is
insignificant due to
provision of acoustic
enclosures for noise
generation sources.
Within Plant Boundary Provision of rubber
padding/ noise
isolators.
Provision of silencers to
modulate the noise
generated by machines
Provision of protective
devices like ear
muff/plugs to the
employee &workers.
Greenbelt development
in and around the plant
periphery
Water
Environment
During Construction
Phase:
Water will be needed
mainly for construction and
domestic purpose i.e. for
drinking and sanitation
Within Project
Boundary
Domestic waste water
will be disposed off
through septic tank or
soak pits.
During Operation Phase:
Generation of high TDS
and High COD effluent.
Zero Discharge
Within Plant Boundary
Proposed ETP &
recycled back system to
the process --- will
achieve ZLD.
Domestic waste water
will treated in proposed
STP.

Document No. SCCPL/EIA/01 Issue No. 01 R 01 177
Land
Environment
During Construction
Phase:
Soil Excavation
Within project
boundary
Top soil generated from
various activities like
excavation etc. will be
stored and preserved to
use in greenbelt
development.
During Operation Phase:
Solid waste disposal and
Hazardous waste
generation storage.
Within plant boundary Hazardous waste shall
be disposed off as per
HWM rules 2016.
Periodic monitoring
shall be carried out.
Zero liquid discharge
will be maintained.
In order to effectively manage the environmental management (including social
management) of the project, following management plans are required.
1. Creation of Environmental Management Department
2. Institutionalized Management Structure
3. Green Belt Development
4. CSR Management
5. Budget for Environmental Management Plan
5.2. Fly ash Management plan
Project is having small boiler using Briquette which will generate very small quqntity of
ash.Utilization of ash produced by Boiler as a thrust area of its activities and all possible
actions will be taken to enhance level of ash utilization. In the proposed boilers, various
avenues for ash utilization will be explored as delineated in the above sections. In
particular, supply of road building or low area dumping.
The ash will be utilized in various construction materials to the maximum extent and 100%
utilization will be achieved. All efforts will be made for maximum utilization of ash. Samridhi
is committed to explore possibilities for ash utilization considering new technologies and
avenues and try to achieve the target fixed by MoEF in this regard. Samridhi is committed
to comply with the Fly Ash Utilization Notification, 1999 and as amended thereof.
5.3. Rain Water Harvesting Plan
Samridhi realizes the importance of rainwater harvesting however it will be prudent that
rain water harvesting is not taken up in the plant area. This is because if some hazardous
dust (in spite of all possible precautions) gets mixed with rainwater and enter the ground
water and the ground water will get contaminated. If required SCCPL may do rain water
harvesting at alternate place with due approval from authorities.
5.4. Environment Management Cell (EMC)
The organizational structure of Environment Management Cell (EMC) responsible for
routine environmental management and monitoring measures, implementing the EMP and
complying with the conditions stipulated by SPCB and MOEF is shown in Figure 5.1.
The Head of EMC shall directly report to the top management of the Plant. The Head of
Safety and Health shall also directly report to the top management of the Plant. In case

Document No. SCCPL/EIA/01 Issue No. 01 R 01 178
the HOD notes any non-compliance or violation of environmental, safety or health law/
regulations, the same shall be brought to the notice of the Production In Charge (during
the weekly review meeting). In case the non-compliance or violation is of manageable
nature, Production In Charge will issue instruction and sanction budget and resources to
rectify the same. Otherwise Production In Charge will obtain financial approval from the
Board of Directors (Top Management) and then address the problem. In any case all
matters of non-compliance and violations shall be brought to the notice of the Top
Management / Board of Directors, action taken report shall be submitted on regular basis,
till the problem is rectified.
Figure 5.1 Structure of Environmental Management Department
Functions of EMC: Head of the EMC shall form a Consultative Working Group by
involving responsible citizens from the surrounding community and develop action plans
to address any grievances of the public related to environmental performance of the project
and develop targets for addressing the grievances. The Cell shall thoroughly study each
activities and suggest additional mitigation measures (if required) for improvement of
environmental performance and discuss them in monthly meetings with the departmental
HOD for implementation. The EMC shall co-ordinate all related activities such as safety,
workers health, and health of surrounding community and prepare statistical records.
• Regular monitoring of fugitive emissions and report any abnormalities for immediate corrective measures.
• Regular monitoring of ambient air quality within the plant and around the plant.
• Regular monitoring of wastewater quality, water quality of the storage ponds, ground water quality and surface water quality.
• Regular noise monitoring of the work zone and surrounding area.
• Green belt plantation, maintenance, development of other forms of greenery like lawns, nursery, gardens, etc. in the plant premises.
• Regular monitoring of the used oil and sell it out to the authorized recycler approved by the Central Pollution Control Board / SPCB.
FACTORY MANAGER
MANAGER (EHS)
Asst. Manager
(Housekeeping, Horticulture and
landscaping)
Asst. Manager
(Health)
Asst. Manager
(Safety)
Lab Assistants
(Environ. Sampling and Monitoring work)

Document No. SCCPL/EIA/01 Issue No. 01 R 01 179
In addition to above the environment management Cell shall conduct environmental audit
every year.
5.5. Institutional Arrangement
SCCPL shall ensure following action items to be complied with throughout the life cycle of
the project:
• Formulate Environmental Health & Safety Policy
• Document the organization structure, roles and responsibilities for implementation and for functioning of Environmental Management System (EMS) and Safety Management System (SMS) Procedures.
• Develop standard operating process and procedures to bring into focus any infringement / deviation / violation of the environment or forest norms/conditions.
• Carry out regular inspections, monitoring and auditing;
• Carry out periodical review and issuing amendments;
• Reporting and communication (including internal and external reporting);
• Documentation and record keeping;
An effective system of management is a key technique for ensuring that all pollution
prevention and control techniques, monitoring plan & mitigation measures are delivered
reliably and on an integrated basis. SCCPL shall operate a formal Environmental
Management System for the proposed project. SCCPL shall document the Standard
Operating Procedures to bring in any deviation / violation of the environmental norms as
prescribed. The SOP shall address the system of reporting of non-compliances / violations
of environmental norms to the Board of Directors of the Company including all
shareholders and stakeholders. The salient features of Environmental Management
System (EMS) are listed below:
• Effective operational and maintenance systems shall be employed on all aspects of
the process whose failure could impact on the environment:
• Documented procedures to control operations that may have an adverse impact on the
environment
• Define procedure for identifying, reviewing and prioritizing items of plant for which a
preventative maintenance regime is appropriate
• Documented procedure for monitoring impacts
• Preventative maintenance program, whose failure could lead to impact on the
environment
• The maintenance system includes auditing of performance against requirements
arising from the above and reporting the result of audits to top management.
• The skills and competencies necessary for key posts shall be documented and records
of training needs and training received for these post maintained.
• The potential environmental risks posed by the work of contractors shall be assessed
and instructions provided to contractors about protecting the environment while
working on site.
• Written procedures for handling, investigating, communicating and reporting actual or
potential non-compliance with operating procedures.

Document No. SCCPL/EIA/01 Issue No. 01 R 01 180
• Written procedures for handling, investigating, communicating and reporting
environmental complaints and implementation of appropriate actions.
• Written procedures for investigating incidents, (and near misses) including identifying
suitable corrective action and following up
• The company shall conduct audits, annually, to check that all activities are carried out
in conformity with the above requirements.
• The company shall report and publish annual report on environmental performance,
objectives and targets, and future planned improvements.
• The company shall have demonstrable procedures (eg. written instructions) which
incorporate environmental considerations into the following areas:
o The control of process and engineering change on the installation;
o Design, construction and review of new facilities and other capital projects
o Capital approval; and
o Purchasing policy
The company shall have a clear and logical system for keeping records of policies, roles
and responsibilities, targets, procedures
Training Requirement of Staff: Training systems, covering the following items, shall be
in place for all staff of EC and other staff of various departments, which cover the following:
• Awareness of the regulatory implications of the Environmental Permits for the activity
and their work activities;
• Awareness of all potential environmental effects from operation under normal and
abnormal circumstances.
• Awareness of the need to report deviation from the Permit.
• Prevention of accidental emissions and action to be taken when accidental emissions
occur.
The staff of the EMC will be trained every year by arranging in house training programs by
inviting experts or faculty members from reputed institutes.
Periodical Review: SCCPL will annually review the EMP and identified management
action plans to address any changes in the organization, process or regulatory
requirements.
Documentation and Record Keeping: The EMC will maintain following documents for
effective implementation of the EMP:
• Master management system document;
• Legal Register;
• Operation control procedures;
• Work instructions;
• Incident reports;
• Emergency preparedness and response procedures;
• Training records;
• Monitoring reports;
• Auditing reports; and
• Complaints register and issues attended/closed.

Document No. SCCPL/EIA/01 Issue No. 01 R 01 181
5.6. Resource Conservation/ Waste Minimization
Additional key measures taken for natural resource and energy conservation are as given
below:-
• Used oil will be stored in covered storages / hard flooring to preventanycontamination
in soil / ground water.
• Proper scheduling of preventive maintenance of critical machines will minimize used
oil generation .
• Energy efficient drives / LED lights to be used.
• Reduction of lighting power consumption by optimum use of electrical lights in plants.
• Use of variable frequency drive in plant.
• Enough care will be taken to prevent/minimize energy losses at each stage.
• Zero liquid discharge will be maintained for reduction in fresh water consumption.
Also use of Energy Efficient Lighting, Transformers, HVAC system, Use of Energy Efficient
Motors, electrical appliances to minimize the energy consumption in addition to Process
Planning.
5.7. Facilities for Employees
Company will give preference to local people (Skilled People) for employment. The
Company is more concern for the safety and health of its people, including the larger
community outside of the company and the environment as a whole. All employees will be
trained to work on sites in the safest possible manner and shall be made aware of the
consequences of unsafe act. Company will also provide the shelter, safe drinking water,
sanitation facility. The company will allocate adequate budget for safety and Occupational
health management of the employees.
5.8. Environment Policy
An effective system of management is a key technique for ensuring that all pollution
prevention and control techniques, monitoring plan and mitigation measures are delivered
reliably and on an integrated basis. SCCPL will have a well laid down Corporate
Occupational Health, Safety and Environment Policy approved by its Board of Directors.
✓ To take account of environment concerns in planning and decision making.
✓ Compliance of conditions imposed in Environmental Clearance and all other statutory
clearances issued by the Regulatory Authorities.
✓ To prevent pollution of surrounding habitation by monitoring & measurement of
environmental parameters.
✓ Identification of significant impacts and preparation of environment management system
for implementation.
✓ To reduce waste generation and promote recycling of materials, wherever possible.
✓ Optimum utilization of resources i.e. Electricity, Oil and Water.
✓ To take up development works in surrounding villages as a part of corporate social
responsibility.
✓ To provide appropriate training and disseminate information to enable all employees to
implement best practices and work in partnership to create a culture of continuous
improvement.

Document No. SCCPL/EIA/01 Issue No. 01 R 01 182
✓ The company shall document the Standard Operating Procedures to bring in any
deviation / violation of the environment norms as prescribed.
5.9. EMP for Biological Environment Quality
Ecological base line surveys in the core and buffer zones, reveals no exceptional features
of wildlife interest. The survey based on following criteria.
Table 5.2 : Ecological criteria & Observations
Land use The site is located in notified industrial area develop by UPSIDC. No tree cutting is required. No major vegetation is present within the core zone hence no wildlife Zone exists within the core zone.
No sensitive ecosystem is present within 10 km area of the project site. However, one small Forest patches is present but located more than 5 km away from the project site.
Diversity Species diversity of flora as well as fauna species is restricted to agro ecosystem.
Rarity There is no endemic, rare or threatened species in site as well as in study area. There is no endangered or schedule-I faunal species in the study area except Peafowl (Pavo Cristatus) which is schedule –I species but is of least concern category
Proximity There are no Biosphere Reserve, National Park, Wildlife Sanctuary, present within 10 km area of the site
Potential value After developing a wide and dense greenbelt in plant area will increase habitat condition especially for avifauna.
Based on the ecological baseline study following mitigation measures have been
suggested:
Regeneration / restoration of rare plants and animals: No rare plants and wildlife
species exists in the core and buffer zone, There is no endangered species found in the
study area
Improvement of biodiversity: Environment management cell of the project proponent will
look after the day to day environment monitoring requirement and Greenbelt development
in and around the project site.
5.10. Greenery Development Plan
Greenbelt is a set of rows of trees planted in such a way that they form an effective barrier
between the working zone and the surroundings. Out of the total land area available about
4800 m2 of the area will be kept as a green belt. About 33% of the total land area (~1600
M2) has been earmarked under greenbelt and other forms of greenery. Adequate nos. of
trees like Cassia fistula, Dalbergia sissoo, Syzygium cumini, Mangifera indica, Delonix
regia, and Bauhinia variegata to be planted inside the plant. 3-5 m wide greenbelt (as
space available) shall be developed inside the plant premises.
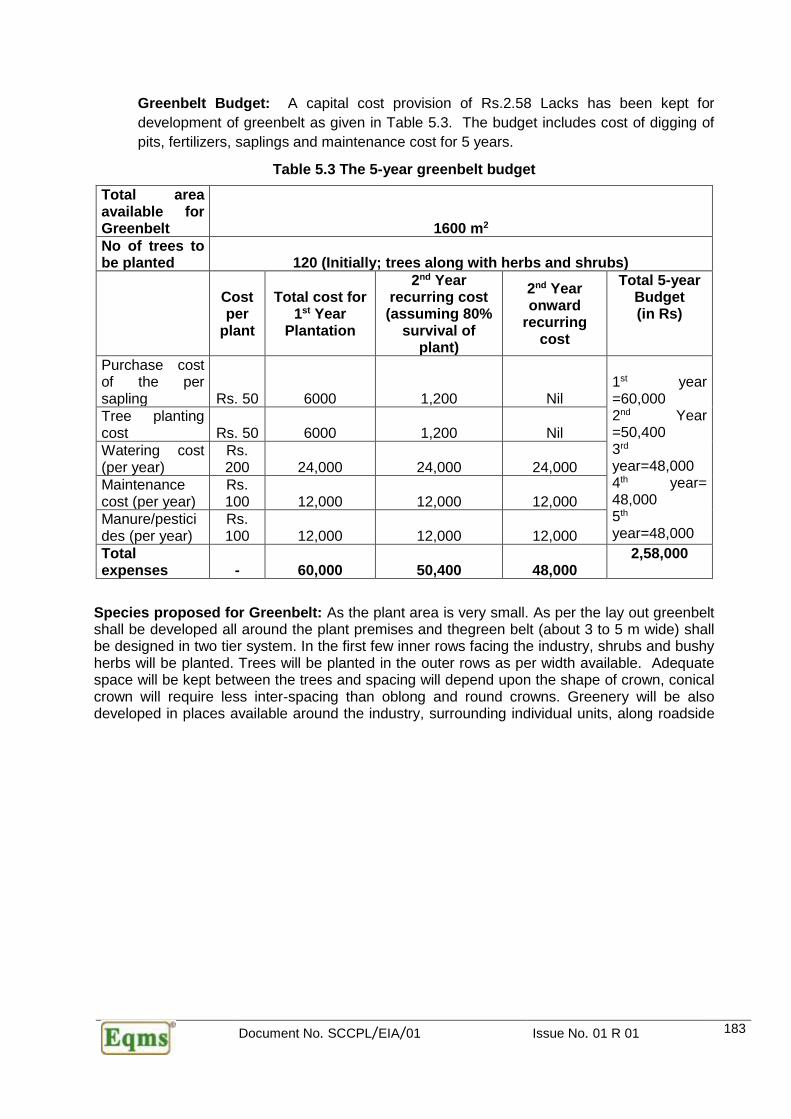
Document No. SCCPL/EIA/01 Issue No. 01 R 01 183
Greenbelt Budget: A capital cost provision of Rs.2.58 Lacks has been kept for
development of greenbelt as given in Table 5.3. The budget includes cost of digging of
pits, fertilizers, saplings and maintenance cost for 5 years.
Table 5.3 The 5-year greenbelt budget
Total area available for Greenbelt 1600 m2 No of trees to be planted 120 (Initially; trees along with herbs and shrubs)
Cost per
plant
Total cost for 1st Year
Plantation
2nd Year recurring cost (assuming 80%
survival of plant)
2nd Year onward
recurring cost
Total 5-year Budget (in Rs)
Purchase cost of the per sapling Rs. 50 6000 1,200 Nil
1st year =60,000 2nd Year =50,400 3rd year=48,000 4th year= 48,000 5th year=48,000
Tree planting cost Rs. 50 6000 1,200 Nil
Watering cost (per year)
Rs. 200 24,000 24,000 24,000
Maintenance cost (per year)
Rs. 100 12,000 12,000 12,000
Manure/pesticides (per year)
Rs. 100 12,000 12,000 12,000
Total expenses - 60,000 50,400 48,000
2,58,000
Species proposed for Greenbelt: As the plant area is very small. As per the lay out greenbelt shall be developed all around the plant premises and thegreen belt (about 3 to 5 m wide) shall be designed in two tier system. In the first few inner rows facing the industry, shrubs and bushy herbs will be planted. Trees will be planted in the outer rows as per width available. Adequate space will be kept between the trees and spacing will depend upon the shape of crown, conical crown will require less inter-spacing than oblong and round crowns. Greenery will be also developed in places available around the industry, surrounding individual units, along roadside
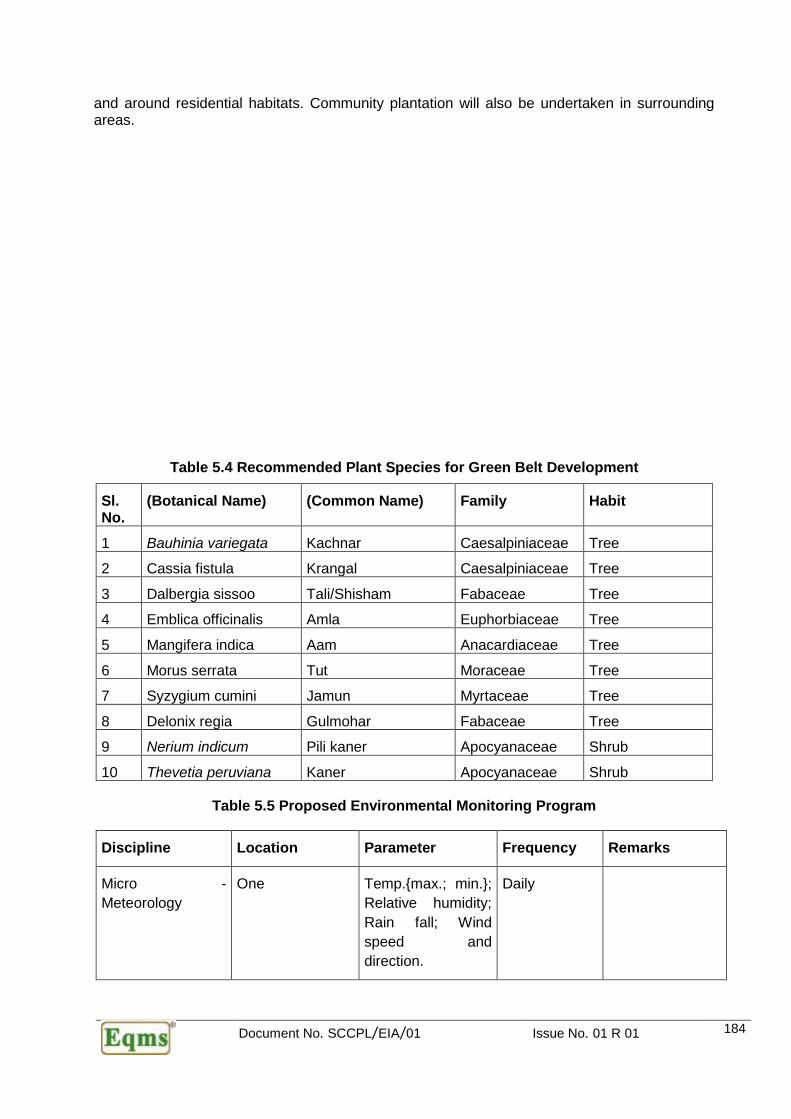
Document No. SCCPL/EIA/01 Issue No. 01 R 01 184
and around residential habitats. Community plantation will also be undertaken in surrounding areas.
Table 5.4 Recommended Plant Species for Green Belt Development
Sl. No.
(Botanical Name) (Common Name) Family Habit
1 Bauhinia variegata Kachnar Caesalpiniaceae Tree
2 Cassia fistula Krangal Caesalpiniaceae Tree
3 Dalbergia sissoo Tali/Shisham Fabaceae Tree
4 Emblica officinalis Amla Euphorbiaceae Tree
5 Mangifera indica Aam Anacardiaceae Tree
6 Morus serrata Tut Moraceae Tree
7 Syzygium cumini Jamun Myrtaceae Tree
8 Delonix regia Gulmohar Fabaceae Tree
9 Nerium indicum Pili kaner Apocyanaceae Shrub
10 Thevetia peruviana Kaner Apocyanaceae Shrub
Table 5.5 Proposed Environmental Monitoring Program
Discipline Location Parameter Frequency Remarks
Micro -
Meteorology
One Temp.{max.; min.};
Relative humidity;
Rain fall; Wind
speed and
direction.
Daily

Document No. SCCPL/EIA/01 Issue No. 01 R 01 185
Ambient Air Quality Five HCl, Cl2, SOx;
NOx, CO, HC
Particulate matter
(with pesticide
compounds)
Once in a
month
Parameters as
applicable /as per
products being
manufactured
Boiler Stacks One PM, SOx; NOx, CO Once in a
month
Scrubber Stack All continuous
stacks
HCl SOx; NOx;
Particulate matter
(with pesticide
compounds; As per
stack design)
Once in a
month
Parameters as
applicable /as per
products being
manufactured
Effluents Final Treated
effluents
As per process /
plant requirement
Once in a
month
Parameters as
applicable /as per
products being
manufactured
Sewage Sanitary TSS; BOD Once in a
month
Ground Water
Quality (One
peizometric wells)
One peizometric
wells
Pesticides- etc. [in
association with
SPCB]
Pre-monsoon
& Post-
monsoon
Parameters as
applicable /as per
products being
manufactured
Soil Plant premises As per CPCB
norms
Once in year
Noise Plant area
&periphery
Day & Night time
noise level
Quarterly
Health Check Up All Plant
Personnel
Diseases related to
pesticides
Annually
5.11. Budget for EMP
The overall investment in the project is 500 lacs About Rs. 70 Lacs is proposed for the
environment protection program. Details are as given below:
Table 5.6 : EMP Budget
Capital cost and recurring cost/annum for environmental pollution control measures
S. No. Description of Item Capital Cost Recurring Cost
(In Lacs) (In Lacs)
1 Air Pollution Control/ Noise 50 10
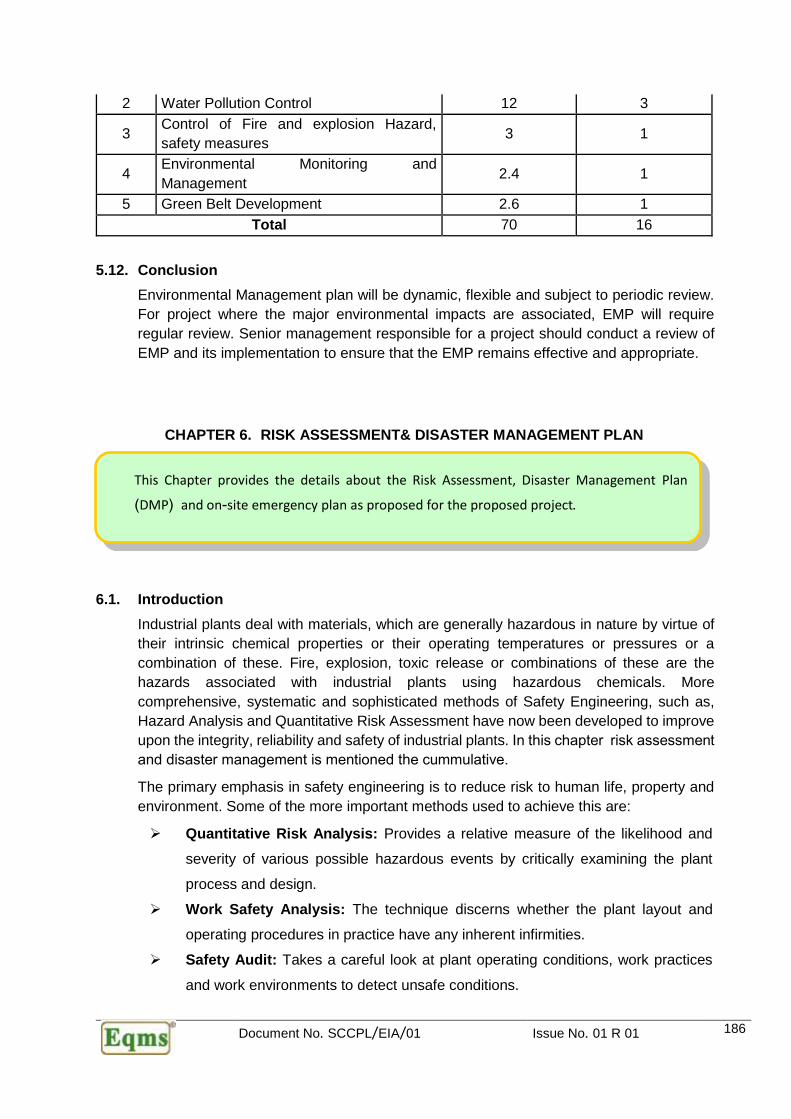
Document No. SCCPL/EIA/01 Issue No. 01 R 01 186
2 Water Pollution Control 12 3
3 Control of Fire and explosion Hazard,
safety measures 3 1
4 Environmental Monitoring and
Management 2.4 1
5 Green Belt Development 2.6 1
Total 70 16
5.12. Conclusion
Environmental Management plan will be dynamic, flexible and subject to periodic review.
For project where the major environmental impacts are associated, EMP will require
regular review. Senior management responsible for a project should conduct a review of
EMP and its implementation to ensure that the EMP remains effective and appropriate.
CHAPTER 6. RISK ASSESSMENT& DISASTER MANAGEMENT PLAN
6.1. Introduction
Industrial plants deal with materials, which are generally hazardous in nature by virtue of
their intrinsic chemical properties or their operating temperatures or pressures or a
combination of these. Fire, explosion, toxic release or combinations of these are the
hazards associated with industrial plants using hazardous chemicals. More
comprehensive, systematic and sophisticated methods of Safety Engineering, such as,
Hazard Analysis and Quantitative Risk Assessment have now been developed to improve
upon the integrity, reliability and safety of industrial plants. In this chapter risk assessment
and disaster management is mentioned the cummulative.
The primary emphasis in safety engineering is to reduce risk to human life, property and
environment. Some of the more important methods used to achieve this are:
➢ Quantitative Risk Analysis: Provides a relative measure of the likelihood and
severity of various possible hazardous events by critically examining the plant
process and design.
➢ Work Safety Analysis: The technique discerns whether the plant layout and
operating procedures in practice have any inherent infirmities.
➢ Safety Audit: Takes a careful look at plant operating conditions, work practices
and work environments to detect unsafe conditions.
This Chapter provides the details about the Risk Assessment, Disaster Management Plan
(DMP) and on-site emergency plan as proposed for the proposed project.

Document No. SCCPL/EIA/01 Issue No. 01 R 01 187
Together, these three broad tools attempt to minimize the chances of accidents occurring.
Yet, there always exists, no matter how remote, probability of occurrence of a major
accident. If the accident involves highly hazardous chemicals in sufficiently large
quantities, the consequences may be serious to the plant, to surrounding areas and the
populations residing therein.
6.2. Risk Assessment
A three ‘levels’ risk assessment approach has been adopted for the Samridhi Crop
Chemicals (henceforth SCCPL) for proposed project considering approved TOR. The risk
assessment levels are generally consistent with the practices encountered through various
assignments for medium and large chemical complexes. The brief outline of the three-tier
approach is given below:
➢ Level 1 – Risk Screening
This is top-down review of worst- case potential hazards/risks, aimed primarily at
identifying plant sites or areas within plant, which pose the highest risk. Various screening
factors considered include:
• Inventory of hazardous materials;
• Hazardous Materials properties;
• Storage conditions (e.g. temperature and pressure);
• Location sensitivity (distance to residential areas / populace).
The data / information are obtained from plant. The results provide a relative indication of
the extent of hazards and potential for risk exposure.
➢ Level 2 – Major Risk Survey (Semi - Quantitative)
The survey approach combines the site inspection with established risk assessment
techniques applied both qualitative as well quantitative mode. The primary objective is to
identify and select major risks at a specific location in the plant considering possible soft
spots / weak links during operation / maintenance. Aspects covered in the risk usually
include:
• Process Hazards;
• Process Safety Management Systems;
• Fire Protection and Emergency response equipment and programs.
• Security Vulnerability;
• Impact of hazards consequences (equipment damage, business
interruption, injury, fatalities);
• Qualitative risk identification of scenarios involving hazardous
materials;
• Risk reduction measures.
Document No. SCCPL/EIA/01 Issue No. 01 R 01 188
Selection of critical scenarios and their potential of damage provide means of prioritising
mitigative measures and allocate the resources to the areas with highest risks.
➢ Level 3 – Quantitative Risk Assessment (Deterministic)
This is the stage of assessment of risks associated with all credible hazards (scenarios)
with potential to cause an undesirable outcome such as human injury, fatality or
destruction of property. The four basic elements include:
i. Hazards identification utilizing formal approach (Level 2, HAZOP etc.);
ii. Frequency Analysis. Based on past safety data (incidents / accidents);
Identifying likely pathway of failures and quantifying the toxic / inflammable
material release;
iii. Hazards analysis to quantify the consequences of various hazards scenarios
(fire, explosion, BLEVE, toxic vapour release etc.).Establish minimum value
for damage (e.g. IDLH, over pressure, radiation flux) to assess the impact
on environment.
iv. Risk Quantification: Quantitative techniques are used considering effect /
impact due to weather data, population data, and frequency of occurrences
and likely hood of ignition / toxic release. Data are analysed considering likely
damage (in terms of injury / fatality, property damage) each scenarios is likely
to cause.
QRA provides a means to determine the relative significance of a number of undesired
events, allowing analyst and the team to focus their risk reduction efforts where they will
be beneficial most.
SCCPL shall manufacture some new technical grade pesticides chemicals. Table2.6
inChapter 2 gives the list of raw materials. Solid raw materials are stored in ware house
while liquid and gaseous raw materials are stored in tank farms and covered area. The list
of bulk liquid storages of raw materials are as given below:
Table 6.1 Liquid/GaseousBulk Storages
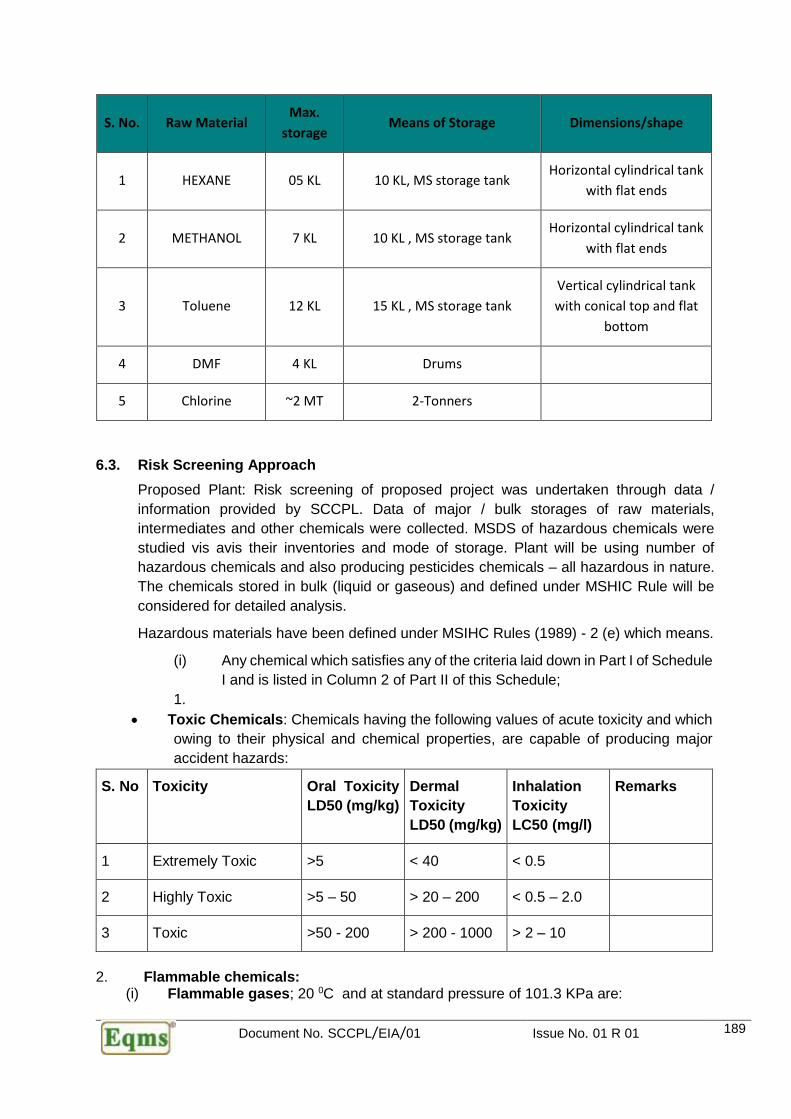
Document No. SCCPL/EIA/01 Issue No. 01 R 01 189
S. No. Raw Material Max.
storage Means of Storage Dimensions/shape
1 HEXANE 05 KL 10 KL, MS storage tank Horizontal cylindrical tank
with flat ends
2 METHANOL 7 KL 10 KL , MS storage tank Horizontal cylindrical tank
with flat ends
3 Toluene 12 KL 15 KL , MS storage tank
Vertical cylindrical tank
with conical top and flat
bottom
4 DMF 4 KL Drums
5 Chlorine ~2 MT 2-Tonners
6.3. Risk Screening Approach
Proposed Plant: Risk screening of proposed project was undertaken through data /
information provided by SCCPL. Data of major / bulk storages of raw materials,
intermediates and other chemicals were collected. MSDS of hazardous chemicals were
studied vis avis their inventories and mode of storage. Plant will be using number of
hazardous chemicals and also producing pesticides chemicals – all hazardous in nature.
The chemicals stored in bulk (liquid or gaseous) and defined under MSHIC Rule will be
considered for detailed analysis.
Hazardous materials have been defined under MSIHC Rules (1989) - 2 (e) which means.
(i) Any chemical which satisfies any of the criteria laid down in Part I of Schedule
I and is listed in Column 2 of Part II of this Schedule;
1.
• Toxic Chemicals: Chemicals having the following values of acute toxicity and which
owing to their physical and chemical properties, are capable of producing major
accident hazards:
S. No Toxicity Oral Toxicity
LD50 (mg/kg)
Dermal
Toxicity
LD50 (mg/kg)
Inhalation
Toxicity
LC50 (mg/l)
Remarks
1 Extremely Toxic >5 < 40 < 0.5
2 Highly Toxic >5 – 50 > 20 – 200 < 0.5 – 2.0
3 Toxic >50 - 200 > 200 - 1000 > 2 – 10
2. Flammable chemicals: (i) Flammable gases; 20 0C and at standard pressure of 101.3 KPa are:
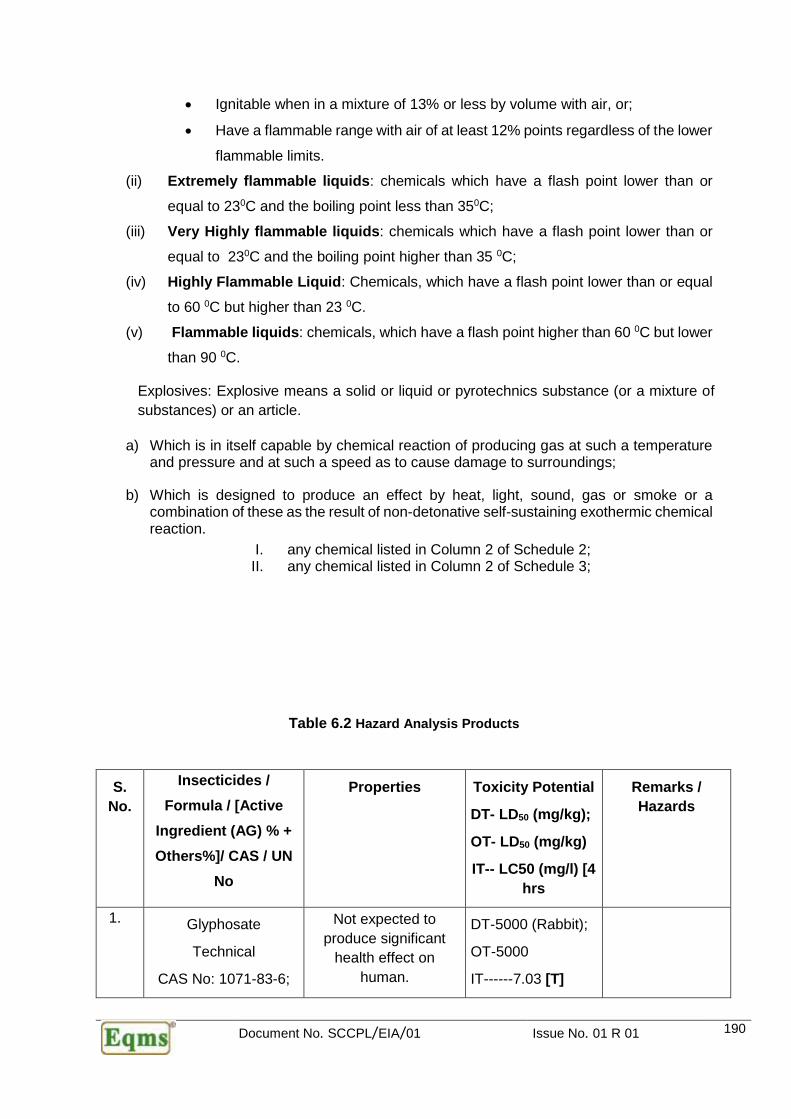
Document No. SCCPL/EIA/01 Issue No. 01 R 01 190
• Ignitable when in a mixture of 13% or less by volume with air, or;
• Have a flammable range with air of at least 12% points regardless of the lower
flammable limits.
(ii) Extremely flammable liquids: chemicals which have a flash point lower than or
equal to 230C and the boiling point less than 350C;
(iii) Very Highly flammable liquids: chemicals which have a flash point lower than or
equal to 230C and the boiling point higher than 35 0C;
(iv) Highly Flammable Liquid: Chemicals, which have a flash point lower than or equal
to 60 0C but higher than 23 0C.
(v) Flammable liquids: chemicals, which have a flash point higher than 60 0C but lower
than 90 0C.
Explosives: Explosive means a solid or liquid or pyrotechnics substance (or a mixture of
substances) or an article.
a) Which is in itself capable by chemical reaction of producing gas at such a temperature and pressure and at such a speed as to cause damage to surroundings;
b) Which is designed to produce an effect by heat, light, sound, gas or smoke or a combination of these as the result of non-detonative self-sustaining exothermic chemical reaction.
I. any chemical listed in Column 2 of Schedule 2; II. any chemical listed in Column 2 of Schedule 3;
Table 6.2 Hazard Analysis Products
S.
No.
Insecticides /
Formula / [Active
Ingredient (AG) % +
Others%]/ CAS / UN
No
Properties Toxicity Potential
DT- LD50 (mg/kg);
OT- LD50 (mg/kg)
IT-- LC50 (mg/l) [4
hrs
Remarks /
Hazards
1. Glyphosate
Technical
CAS No: 1071-83-6;
Not expected to
produce significant
health effect on
human.
DT-5000 (Rabbit);
OT-5000
IT------7.03 [T]
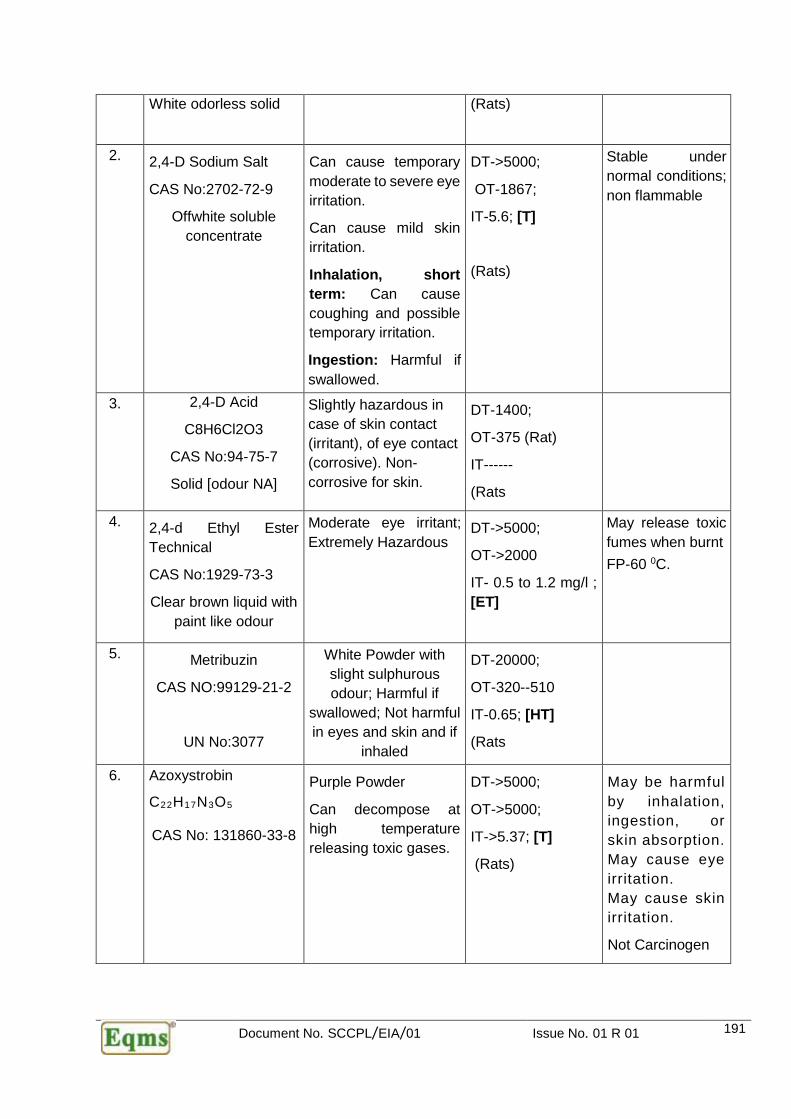
Document No. SCCPL/EIA/01 Issue No. 01 R 01 191
White odorless solid (Rats)
2. 2,4-D Sodium Salt
CAS No:2702-72-9
Offwhite soluble
concentrate
Can cause temporary
moderate to severe eye
irritation.
Can cause mild skin
irritation.
Inhalation, short
term: Can cause
coughing and possible
temporary irritation.
Ingestion: Harmful if
swallowed.
DT->5000;
OT-1867;
IT-5.6; [T]
(Rats)
Stable under
normal conditions;
non flammable
3. 2,4-D Acid
C8H6Cl2O3
CAS No:94-75-7
Solid [odour NA]
Slightly hazardous in
case of skin contact
(irritant), of eye contact
(corrosive). Non-
corrosive for skin.
DT-1400;
OT-375 (Rat)
IT------
(Rats
4. 2,4-d Ethyl Ester
Technical
CAS No:1929-73-3
Clear brown liquid with
paint like odour
Moderate eye irritant;
Extremely Hazardous DT->5000;
OT->2000
IT- 0.5 to 1.2 mg/l ;
[ET]
May release toxic
fumes when burnt
FP-60 0C.
5. Metribuzin
CAS NO:99129-21-2
UN No:3077
White Powder with
slight sulphurous
odour; Harmful if
swallowed; Not harmful
in eyes and skin and if
inhaled
DT-20000;
OT-320--510
IT-0.65; [HT]
(Rats
6. Azoxystrobin
C22H17N3O5
CAS No: 131860-33-8
Purple Powder
Can decompose at
high temperature
releasing toxic gases.
DT->5000;
OT->5000;
IT->5.37; [T]
(Rats)
May be harmful
by inhalation,
ingestion, or
skin absorption.
May cause eye
irritation.
May cause skin
irritation.
Not Carcinogen

Document No. SCCPL/EIA/01 Issue No. 01 R 01 192
7. Pretilachlor
C17H26ClNO2
AG-96 %
CAS No.: 51218-49-6
UN No: 3082
Colourless – Odourless
liquid
DT->3100;
OT-6099
IT- 2.8; [T]
(Rats)
Harmful: may
cause lung
damage if
swallowed.
Irritating to
skin and eyes.
May cause
sensitization by
skin contact.
8. Thiamethoxam
C8H10ClN5O3S
AG-98%
CAS No:153719-23-4
White powder ;
Aromatic Odour and
can explode also
DT-2000;
OT-5000
IT>2.67; [T]
(Rats)
NFPA- H-1;F-1;I-0
Causes mild eye
and skin irritation.
Can decompose
at high
temperatures
forming toxic
gases.
9. Bifenthin
C23H22ClF3O2
AG> 90%
CAS NO:82657-04-3
.
Viscous liquid,
crystalline solid or waxy
solid with a very faint,
slightly sweet odor.
• Slightly combustible.
(FP-1650C) May
support combustion at
elevated temperatures.
Finely dispersed
particles can
form explosive
mixtures in air.
• Thermal
decomposition and
burning may form toxic
by-products.
DT->2000;
OT-53.4
IT- 1.01; [HT]
(Rats)
Effects from
overexposure
result from either
swallowing or
coming into
contact with the
skin. Symptoms of
overexposure
include bleeding
from the nose,
tremors and
convulsions.
Contact with this
product may
occasionally
produce skin
sensations such
as
rashes, numbing,
burning and
tingling..
10. Fipronil Technical
C12H4Cl2F6N4OS
CAS No: 1200068-37-3
6Appearance: white
Eye: May causes
redness, irritation,
tearing.
Skin: Harmful if
DT----- (Rabbit);
OT- > 5000 mg/Kg
(Rat)
IT- 5.16; mg/L (4

Document No. SCCPL/EIA/01 Issue No. 01 R 01 193
light to yellow powder
Not inflammable
absorbed through skin.
May produce
symptoms similar to
those from
ingestion. May cause
irritation, redness,
swelling.
Ingestion: Harmful if
ingested. May cause
drowsiness, involuntary
shaking, shortness of
breath,
convulsions,
excitement.
hrs.)(Rats) [T]
NFPA- H-1;F-1;R-0
11. Imidacloprid
Technical
C9H10N5O2Cl
AG: 95%
CAS No: 138261-41-3
UN No: 2588
Light brown solid
No specific symptom on
human is shown;
Impact on animals
shows impact through
dermal and oral routes.
Non inflammable
DT->2000 (Rat);
OT- > 2591 (Rat)
IT- 2.65 [T] rat 4h;
Contact with the
skin: Not irritant to
skin
Contact with the
eyes: Not irritant
to eye.
Signs and
Symptoms of
Poisoning:No
account of human
poisoning
was found in the
literature
12. Diafenthiuron
C23H32N2OS
Form: Solid
Color: White powder.
Odor: Odorless
CAS No.: 80060-09-9
May cause
sensitization by skin
contact. Harmful:
Danger of serious
damage to health by
prolonged exposure in
contact with skin and if
swallowed.
DT- >4000;
OT-1950;
IT----- NA
(Rats)

Document No. SCCPL/EIA/01 Issue No. 01 R 01 194
Table 6.3 Hazard Analysis – Raw Materials

Document No. SCCPL/EIA/01 Issue No. 01 R 01 195

Document No. SCCPL/EIA/01 Issue No. 01 R 01 196
S. No Material S. No & Threshold
Quantity (TQ in Kg) as
per MSHIC Rules
Chemicals Hazards Potential Remarks
Sched
ule-1,
Part-II
Sched
ule-2,
Part-I
Sched
ule-3,
Part-I
Hazards Toxic
1. n-Hexane
CAS No:110-54-3
Clear colorless liquids with a petroleum-like
odor. Flash points -9°F
306 --- --- Health
Hazards: Inhalation
causes irritation of
respiratory tract,
cough, mild
depression, cardiac
arrhythmias.
Aspiration causes
severe lung irritation,
coughing, pulmonary
edema; excitement
followed by
depression.
Ingestion causes
nausea, vomiting,.
TEEL-1: 400
ppm
TEEL-2: 3300
ppm
TEEL-3: 8600
ppm
IDLH 1100
ppm
Highly
flammable;
Vapours
may
explode;
2. Methanol
CAS No:67-56-1
UN No:1230
A colorless fairly
volatile liquid with a
faintly sweet
pungent odor like
that of ethyl
alcohol.
377 ---- ---- Health Hazards:
Exposure to
excessive vapor
causes eye irritation,
head- ache, fatigue
and drowsiness.
50,000 ppm will
probably cause
death in 1 to 2 hrs.
Swallowing may
cause death or eye
damage.
ERPG-1: 200
ppm
ERPG-2:
1000 ppm
ERPG-3:
5000 ppm
IDLH: 6000
ppm
Highly
Flammable;
Behavior in
Fire:
Containers
may
explode
3. Toluene
CAS No: 108-88-3
UN No: 1294
A clear colorless
liquid with a
628 ---- ---- Flammability: Ignites
at normal
temperatures; Vapor
is heavier than air
and may travel a
considerable
ERPG-1: 50
ppm
ERPG-2: 300
ppm
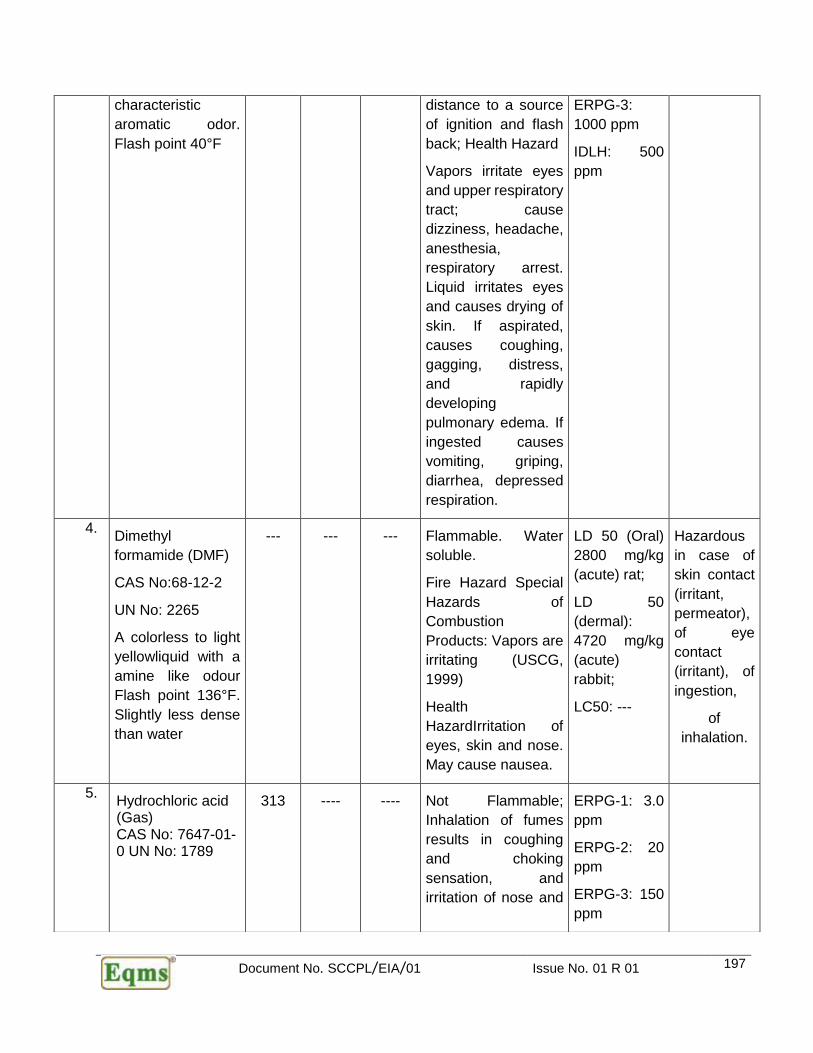
Document No. SCCPL/EIA/01 Issue No. 01 R 01 197
characteristic
aromatic odor.
Flash point 40°F
distance to a source
of ignition and flash
back; Health Hazard
Vapors irritate eyes
and upper respiratory
tract; cause
dizziness, headache,
anesthesia,
respiratory arrest.
Liquid irritates eyes
and causes drying of
skin. If aspirated,
causes coughing,
gagging, distress,
and rapidly
developing
pulmonary edema. If
ingested causes
vomiting, griping,
diarrhea, depressed
respiration.
ERPG-3:
1000 ppm
IDLH: 500
ppm
4. Dimethyl
formamide (DMF)
CAS No:68-12-2
UN No: 2265
A colorless to light
yellowliquid with a
amine like odour
Flash point 136°F.
Slightly less dense
than water
--- --- --- Flammable. Water
soluble.
Fire Hazard Special
Hazards of
Combustion
Products: Vapors are
irritating (USCG,
1999)
Health
HazardIrritation of
eyes, skin and nose.
May cause nausea.
LD 50 (Oral)
2800 mg/kg
(acute) rat;
LD 50
(dermal):
4720 mg/kg
(acute)
rabbit;
LC50: ---
Hazardous
in case of
skin contact
(irritant,
permeator),
of eye
contact
(irritant), of
ingestion,
of
inhalation.
5. Hydrochloric acid (Gas) CAS No: 7647-01-0 UN No: 1789
313 ---- ---- Not Flammable;
Inhalation of fumes
results in coughing
and choking
sensation, and
irritation of nose and
ERPG-1: 3.0
ppm
ERPG-2: 20
ppm
ERPG-3: 150
ppm

Document No. SCCPL/EIA/01 Issue No. 01 R 01 198
lungs. Liquid causes
burns
IDLH: ----
ppm
6. Ethylene
Dichloride
CAS No: 107-06-2
UN No: 2265
Colourless liquid with chloroform
odour. Flash point 13°C.
271 --- --- Harmful if swallowed.
Irritating to eyes,
respiratory system
and skin. Irritating to
eyes, respiratory
system and skin.
(LD50/ Oral):
Acute: 200-
2000 mg/kg
[Rat].
Dermal:
LD55:
2000 (Rabbit)
VAPOR
(LC50): 5
mg/l 10
hours [Rat].
7. DMC
Dimethyl carbonate [C3H6O3]
CAS No:616-38-6
Flammable Liquid with pleasant odour BP: 91 0C
Hazardous in case of
skin contact (irritant),
of eye contact
(irritant). Slightly
hazardous in case of
skin contact
(permeator), of
ingestion, of
inhalation.
LD50/ Oral):
Acute: 6000
mg/kg
[mouse].
Dermal:
LD55:
5000 (Rabbit)
VAPOR
(LC50): 5
mg/l 10
hours [Rat].
8. Chlorine
CAS No:7782-50-5
UN No:1017
A greenish yellow gas with a pungent suffocating odor. Toxic by inhalation.
119 5
TQ-1:
10MT
TQ-2: 25
MT
108
TQ-1:
10MT
TQ-2: 25
MT
Non Combustible;May
ignite other combustible
materials (wood, paper,
oil, etc.). Mixture with
fuels may cause
explosion. Container may
explode in heat of fire.
Chlorine reacts
explosively with or
supports the burning of
numerous common
materials. Ignites steel at
100°C in the presence of
soot, rust, carbon, or other
ERPG-1: 1.0
ppm
ERPG-2: 3.0
ppm
ERPG-3: 20 ppm
IDLH: 10 ppm
Document No. SCCPL/EIA/01 Issue No. 01 R 01 199
catalysts. Ignites dry steel
wool at 50°C. Hydrogen
and chlorine mixtures (5-
95%) are exploded by
almost any form of energy
(heat, sunlight, sparks,
etc.). Health Hazards:
Poisonous; may be fatal if
inhaled. Contact may
cause burns to skin and
eyes. Bronchitis or
chronic lung conditions
9. Hydrogen Peroxide (50%)
(H2 O2)
CAS No: 7732-18-5
Colourless / odourless liquid;
BP-108 0C
-- Very hazardous in
case of skin contact
(irritant), of eye
contact (irritant).
Hazardous in case of
skin contact
(corrosive,
permeator), of eye
contact (corrosive),
of ingestion, . Slightly
hazardous in case of
inhalation (lung
sensitizer). Liquid or
spray
mist may produce
tissue damage
particularly on
mucous membranes
of eyes, mouth and
respiratory tract. Skin
contact may
produce burns
ORAL
(LD50):
Acute: 2000
mg/kg
[Mouse].
DERMAL
(LD50):
Acute:
4060 mg/kg
[Rat]. VAPOR
(LC50):
Acute: 2000
mg/m 4 hours
[Rat].
Non
flammable
but fire
hazards in
presence of
combustible
materials;
Explosive in
presence of
open flames
and sparks
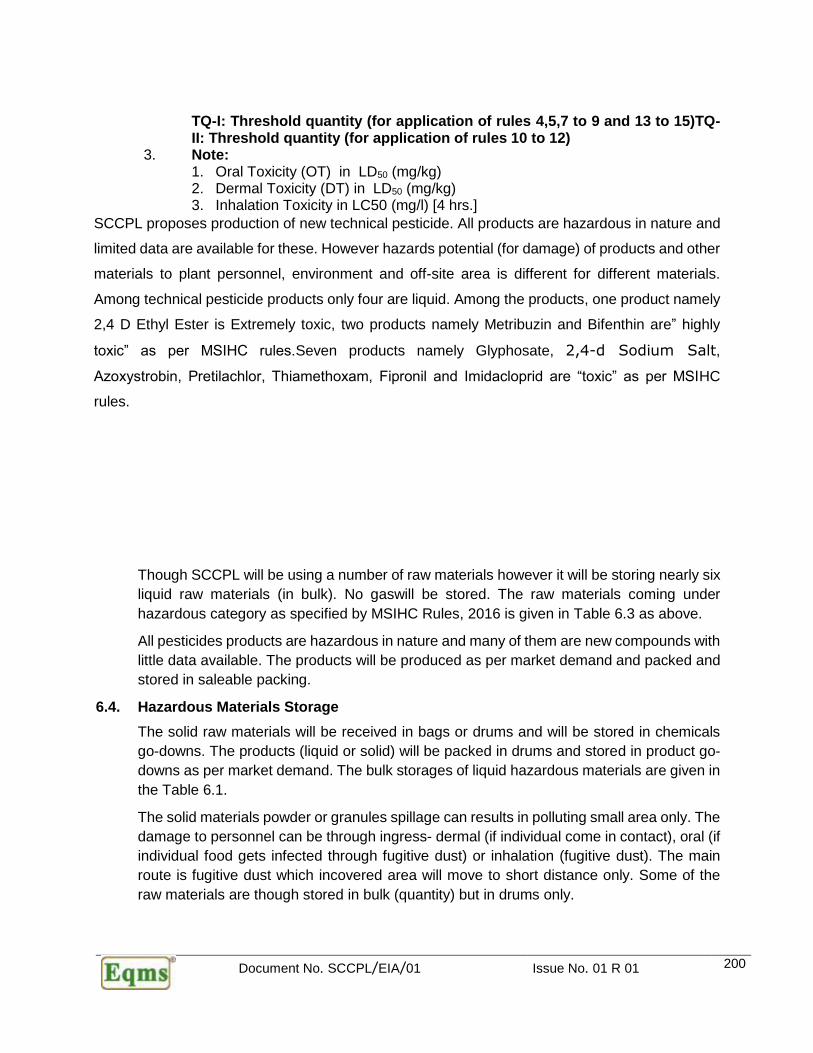
Document No. SCCPL/EIA/01 Issue No. 01 R 01 200
TQ-I: Threshold quantity (for application of rules 4,5,7 to 9 and 13 to 15)TQ-II: Threshold quantity (for application of rules 10 to 12)
3. Note: 1. Oral Toxicity (OT) in LD50 (mg/kg) 2. Dermal Toxicity (DT) in LD50 (mg/kg) 3. Inhalation Toxicity in LC50 (mg/l) [4 hrs.]
SCCPL proposes production of new technical pesticide. All products are hazardous in nature and
limited data are available for these. However hazards potential (for damage) of products and other
materials to plant personnel, environment and off-site area is different for different materials.
Among technical pesticide products only four are liquid. Among the products, one product namely
2,4 D Ethyl Ester is Extremely toxic, two products namely Metribuzin and Bifenthin are” highly
toxic” as per MSIHC rules.Seven products namely Glyphosate, 2,4-d Sodium Salt,
Azoxystrobin, Pretilachlor, Thiamethoxam, Fipronil and Imidacloprid are “toxic” as per MSIHC
rules.
Though SCCPL will be using a number of raw materials however it will be storing nearly six
liquid raw materials (in bulk). No gaswill be stored. The raw materials coming under
hazardous category as specified by MSIHC Rules, 2016 is given in Table 6.3 as above.
All pesticides products are hazardous in nature and many of them are new compounds with
little data available. The products will be produced as per market demand and packed and
stored in saleable packing.
6.4. Hazardous Materials Storage
The solid raw materials will be received in bags or drums and will be stored in chemicals
go-downs. The products (liquid or solid) will be packed in drums and stored in product go-
downs as per market demand. The bulk storages of liquid hazardous materials are given in
the Table 6.1.
The solid materials powder or granules spillage can results in polluting small area only. The
damage to personnel can be through ingress- dermal (if individual come in contact), oral (if
individual food gets infected through fugitive dust) or inhalation (fugitive dust). The main
route is fugitive dust which incovered area will move to short distance only. Some of the
raw materials are though stored in bulk (quantity) but in drums only.

Document No. SCCPL/EIA/01 Issue No. 01 R 01 201
The pesticide product will be both as liquid and solid. The product storage for liquid will be
in drums and ISO containers and for solid in bags depending upon client requirement
The risk is through liquid and gaseousmaterialswhich are volatile/gaseous material (toxic)
and inflammable/explosive materials. The toxic vapours due to spillage of such material
can travel to some distance (as they are stored in covered go-downs) and cause damage.
The liquid products will be packed in drums (Approx 200 litres drums).
6.5. QRA Approach
Identification of hazards and likely scenarios (based on Level-1 and Level-2 activities) calls
for detailed analysis of each scenario for potential of damage, impact area (may vary with
weather conditions / wind direction) and safety system in place. Subsequently each incident
is classified according to relative risk classifications provided in Table below asTable 6.4:
Table 6.4 Risk Classification
Stage Description
High
(> 10-2/yr.)
A failure which could reasonably be expected to occur within the expected life time of the plant.
Examples of high failure likelihood are process leaks or single instrument or valve failures or a human error which could result in releases of hazardous materials.
Moderate
(10-2 --10-
4/yr.)
A failure or sequence of failures which has a low probability of occurrence within the expected lifetime of the plant.
Examples of moderate likelihood are dual instrument or valve failures, combination of instrument failures and human errors, or single failures of small process lines or fittings.
Low
(<10-4)
A failure or series of failures which have a very low probability of occurrence within the expected lifetime of plant.
Examples of ‘low’ likelihood are multiple instruments or valve failures or multiple human errors, or single spontaneous failures of tanks or process vessels.
Minor Incidents
Impact limited to the local area of the event with potent for ‘knock – on- events’
Serious Incident
One that could cause: ❖ Any serious injury or fatality on/off site; ❖ Property damage of $ 1 million offsite or $ 5 million onsite.
Extensive Incident
One that is five or more times worse than a serious incident.
Assigning a relative risk to each scenario provides a means of prioritising associated risk
mitigation measures and planned actions.
6.6. Thermal Hazards
In order to understand the damages produced by various scenarios, it is appropriate to
understand the physiological/physical effects of thermal radiation intensities. The thermal

Document No. SCCPL/EIA/01 Issue No. 01 R 01 202
radiation due to tank fire usually results in burn on the human body. Furthermore, inanimate
objects like equipment, piping, cables, etc. may also be affected and also need to be
evaluated for damages. Table 6.5, Table 6.6and Table 6.7(below), respectively give
tolerable intensities of various objects and desirable escape time for thermal radiation.
Thermal hazards could be from fires or explosion. Fire releases energy slowly while
explosion release energy very rapidly (typically in micro seconds). Explosion is rapid
expansion of gases resulting in rapidly moving shock wave. Explosion can be confined
(within a vessel or building) or unconfined (due to release of flammable gases).
BLEVE (boiling liquid expanding vapour explosion) occurs if a vessel containing a liquid at
a temperature above its atmospheric boiling point ruptures. The subsequent BLEVE is the
explosive vaporisation of large fraction of its vapour contents; possibly followed by
combustion or explosion of the vaporised cloud if it is combustible range.
Thermal hazards have been considered for various scenarios including:
• Fire in inflammable chemicals storage tanks.
Table 6.5 Effects due to Incident Radiation Intensity
Incident Radiation
kW/m2 Damage Type
0.7 Equivalent to Solar Radiation
1.6 No discomfort on long duration
4.0 Sufficient to cause pain within 20 sec. Blistering of skin (first degree burn are likely).
9.5 Pain threshold reached after 8 sec. Second degree burn after 20 sec.
12.5 Minimum energy required for piloted ignition of wood, melting of plastic tubing etc.
25
Minimum Energy required for piloted ignition of wood, melting, plastic tubing etc.
37.5 Sufficient to cause damage to process equipment.
62.0 Spontaneous ignition of wood.
Table 6.6 Thermal Radiation Impact to Human
Exposure
Duration
Radiation Energy {1%
lethality; kW/m2}
Radiation Energy
for 2nd degree
burns; kW/m2
Radiation Energy
for 1st degree
burns; kW/m2

Document No. SCCPL/EIA/01 Issue No. 01 R 01 203
10 sec 21.2 16 12.5
30 Sec. 9.3 7.0 4.0
Table 6.7 Tolerable Intensities for Various Objects
Sl. No Objects Tolerable Intensities (kw/m2)
1 Drenched Tank 38
2 Special Buildings (No window, fire proof doors)
25
3 Normal Buildings 14
4 Vegetation 10-12
5 Escape Route 6 (up to 30 sec.)
6 Personnel in Emergencies 3 (up to 30 sec.)
7 Plastic Cables 2
8 Stationary Personnel 1.5
6.7. Damage due to Explosion
The explosion of a dust or gas (either as a deflagration or detonation) results in a reaction
front moving outwards from the ignition source preceded by a shock wave or pressure front.
After the combustible material is consumed the reaction front terminates but the pressure
wave continues its outward movement. Blast damage is based on the determination of the
peak overpressure resulting from the pressure wave impacting on the object or structure.
As a safety measure SCCPL is storing highly hazardous raw materials in isolated places
with full safety measures. Damage estimates based on overpressure are given in Table
6.8below:
Table 6.8 Damage due to Overpressure
Sl. No Overpressure (psig / bar)
Damage
1. 0.04 Loud Noise / sonic boom glass failure
2. 0.15 Typical pressure for glass failure
3. 0.5 - 1 Large and small windows usually shattered
4. 0.7 Minor damage to house structure
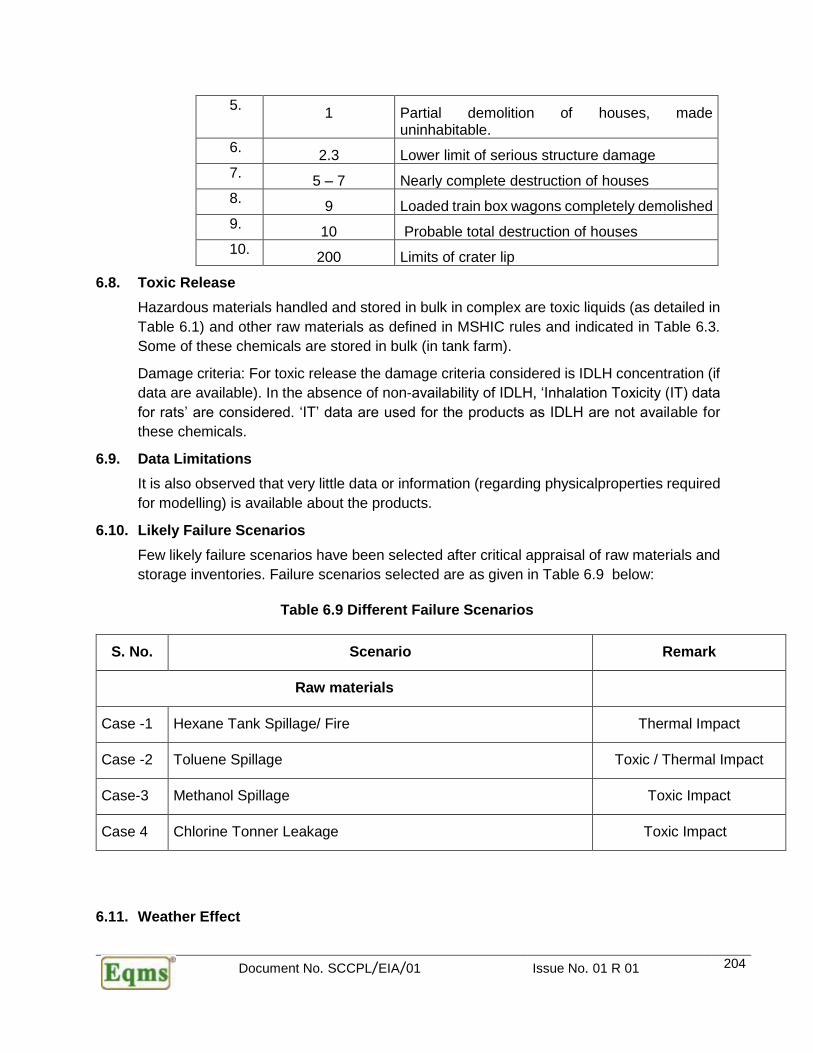
Document No. SCCPL/EIA/01 Issue No. 01 R 01 204
5. 1 Partial demolition of houses, made
uninhabitable.
6. 2.3 Lower limit of serious structure damage
7. 5 – 7 Nearly complete destruction of houses
8. 9 Loaded train box wagons completely demolished
9. 10 Probable total destruction of houses
10. 200 Limits of crater lip
6.8. Toxic Release
Hazardous materials handled and stored in bulk in complex are toxic liquids (as detailed in
Table 6.1) and other raw materials as defined in MSHIC rules and indicated in Table 6.3.
Some of these chemicals are stored in bulk (in tank farm).
Damage criteria: For toxic release the damage criteria considered is IDLH concentration (if
data are available). In the absence of non-availability of IDLH, ‘Inhalation Toxicity (IT) data
for rats’ are considered. ‘IT’ data are used for the products as IDLH are not available for
these chemicals.
6.9. Data Limitations
It is also observed that very little data or information (regarding physicalproperties required
for modelling) is available about the products.
6.10. Likely Failure Scenarios
Few likely failure scenarios have been selected after critical appraisal of raw materials and
storage inventories. Failure scenarios selected are as given in Table 6.9 below:
Table 6.9 Different Failure Scenarios
S. No. Scenario Remark
Raw materials
Case -1 Hexane Tank Spillage/ Fire Thermal Impact
Case -2 Toluene Spillage Toxic / Thermal Impact
Case-3 Methanol Spillage Toxic Impact
Case 4 Chlorine Tonner Leakage Toxic Impact
6.11. Weather Effect

Document No. SCCPL/EIA/01 Issue No. 01 R 01 205
The effect of ambient conditions on the impact of fire / heat radiation and GLC of hazardous
/ toxic material can be beneficial as well as harmful. A high wind (turbulence) can dilute the
toxic material while stable environment can extend the reach of IDLH or IT (inhalation LC50
rats for products) concentration to long distance. Any inflammable gas / vapour release in
turbulent weather will soon dilute the hazardous gases below LEL and thus save the
disaster.
6.12. Incidents Impacts
The identified failure scenarios (Table 6.9) have been analysed (Using ALOHA and
EFFECT Modules) for the impact zones considering damage due to thermal and toxic
impacts. Similar impacts are considered for proposed units. Each incident will have Impact
on the surrounding environment which in extreme case may cross plant boundary. The
impact zones for various scenarios are given in Table 6.10.
Table 6.10 : HazardsScenario Impact
Scenario
No.
Scenario Impact Zone (m) Remarks
Scenario Raw Material
Case -1 Hexane Tank Spillage/ Fire ❖ 26 1st Degree Burn
Template-1
Case -2 Toluene Spillage ❖ ~29
❖ 14
1st Degree Burn
Template-2
IDLH; Stability Class D; Template-
3
Case -3 Methanol Spillage ❖ <10 IDLH; Stability Class D;
Case -4 Chlorine Tonner pipe line
heavy leak
❖ ~ 910
❖ 419
IDLH; Stability Class F
Template 4
IDLH; Stability Class D
Template 5
Templates of Scenario
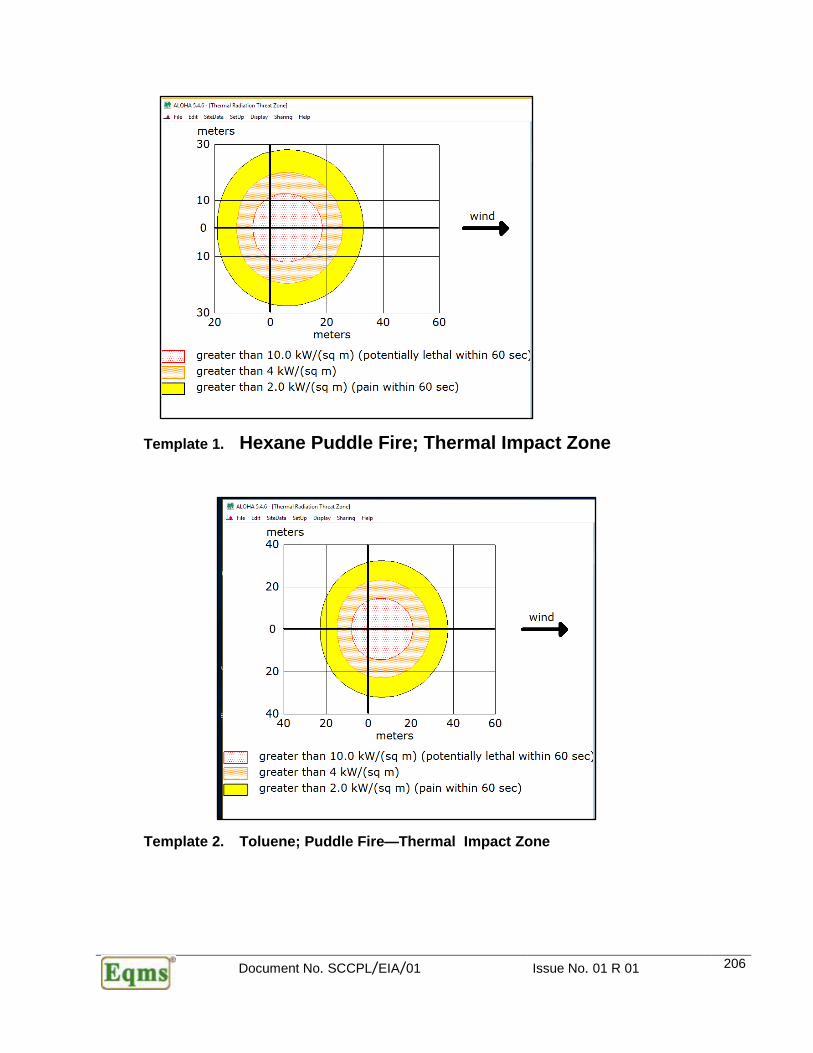
Document No. SCCPL/EIA/01 Issue No. 01 R 01 206
Template 1. Hexane Puddle Fire; Thermal Impact Zone
Template 2. Toluene; Puddle Fire—Thermal Impact Zone
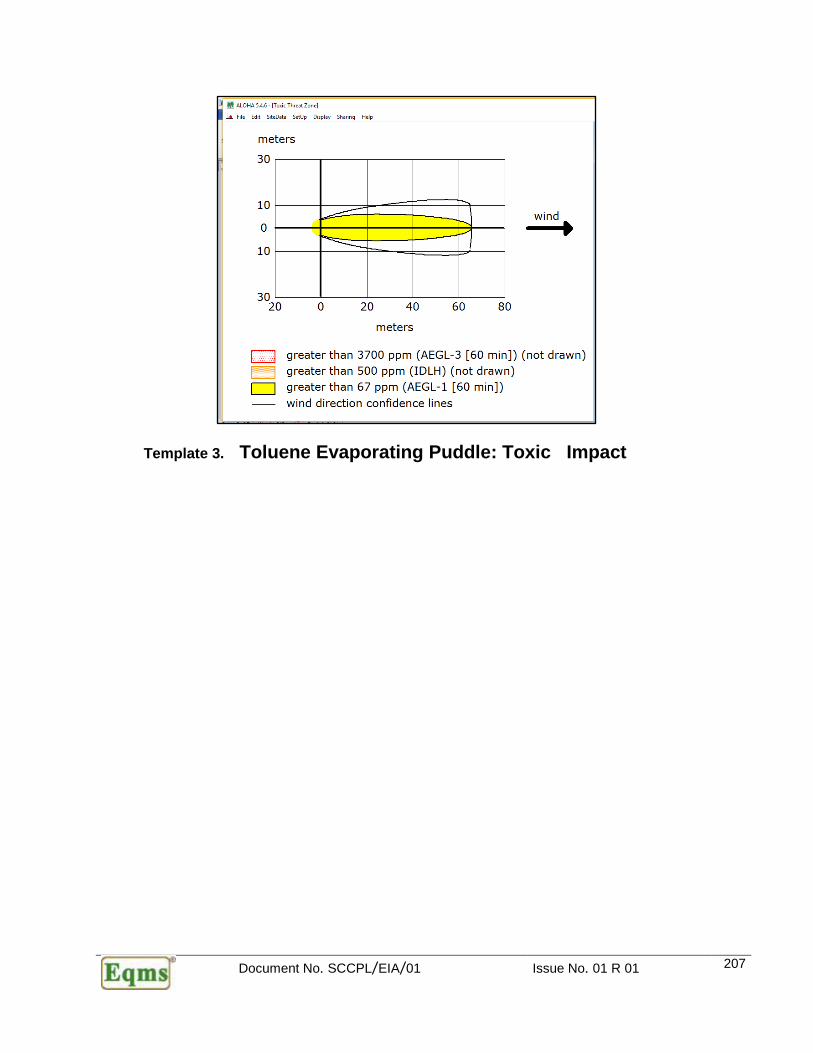
Document No. SCCPL/EIA/01 Issue No. 01 R 01 207
Template 3. Toluene Evaporating Puddle: Toxic Impact
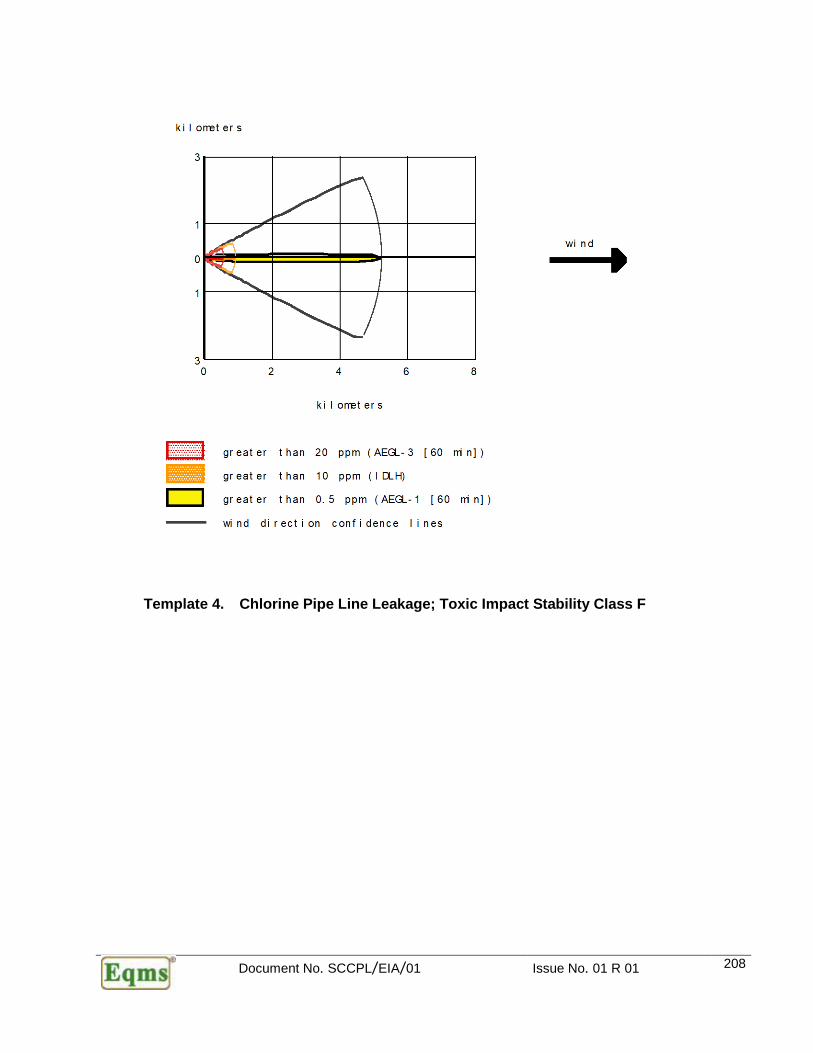
Document No. SCCPL/EIA/01 Issue No. 01 R 01 208
Template 4. Chlorine Pipe Line Leakage; Toxic Impact Stability Class F

Document No. SCCPL/EIA/01 Issue No. 01 R 01 209
Template 5. : Chlorine Pipe Line Leakage; Toxic Impact Stability Class D

Document No. SCCPL/EIA/01 Issue No. 01 R 01 210
6.13. Consequential Impacts
The consequential impacts from each incident scenario can be though thermal, over
pressure wave and toxic route. The damage can be on plant personnel (and neighbouring
residents in case incident crosses boundary), property and also loss in production.
6.14. Thermal and Explosion Hazards
Incidents involving thermal hazards are mainly due to fuel; Hexane/Toluene fire (due to
spillage).However the fuel stored is in drums and in small quantity. The impact due to
Hexane and Toluene spillage and fire(1st degree burn) is limited to ~26/29 m (2nd case)
only (i.e. within plant boundary). However the consequences can go to worse if the incidents
lead to domino effect to other tanks.
6.15. Toxic Hazards
Toxic hazards are mainly due to Chlorine gas leakage and Toluene / Methanol and other
toxic chemicals leakages. The impact due to Chlorine Pipeline leakage can go up to 910
meters (will cross plant boundary limit). The impacts due to liquid solvents leakages will
be within the plant boundary (< 14 m).
Other hazardous chemicals including products their impact will be limited to spillage area.
The acid spillage if comes in contact with metal parts will produce hydrogen which is highly
flammable gas. Any person moving in area and getting splash will get the injury. In addition
the spillage will cause pollution problem. The spillage is to be collected and neutralized for
toxic contents before disposal.
6.16. General Control Measures
Since some of the substances in use at SCCPL are hazardous with fire potential and also
toxic in nature, it is necessary to use appropriate control measures recommended for such
substances:
6.17. Flammable Gas Fires
Fire control generally consists of directing, diluting and dispersing the inflammable
gas/vapor to prevent contact with persons, to prevent it from infiltrating structures if the leak
is out door, and to avoid its contact with ignition sources while, if possible, simultaneously
stopping the flow of gas. Water in the form of spray, applied from hoses or monitor nozzles
or by fixed water spray system cools the burning vapours / gas.
6.18. Process Safety System
Process & Plant Safety:
Conducting Preliminary Safety Analysis (A1), Basic Safety Review (A2), Detailed Safety
Review (A3), Pre Start-Up Safety Review (A4) & Pre Start-Up Safety audit according to
PPS directive (details mentioned in following flow diagram)
• Every change in the process, procedure, equipment, etc. will be done through robust
management of change (MOC) procedure
• Pre-Start up Safety Reviews for all modification
Document No. SCCPL/EIA/01 Issue No. 01 R 01 211
• Pressure testing of pipelines and replacement of fragile pipelines and tanks by
prevention project
• Hazardous area classification
• Internal safety rounds for P&PS
• Control P&IDs, and Lock opened (LO)/ Lock closed (LC) procedures are in place
• TOPPS (Top Performance in Process & Plant Safety) training to all employees
• Root Cause Analysis of all incidents
• Pre-Start up Safety Reviews for all modification
Occupational Safety:
• Permit to Work procedure and Monthly monitoring of all filled permit for continual
improvement
• Mobilized Near- Miss Reporting and award scheme
• HSE rounds: PMT (Plant Management Team) of one plant takes HSE round of
another plant. Exchange of best practices among plants
• MSDS Management
• Tool Box talk with contractors
• Central Safety Committee
• Departmental Safety Committees
• HSE Coordinator and Monitor program: Shop floor employees’ participation in Safety
activities
• Celebration of theme based Safety days/ weeks at site
• Safety Induction program for new joiners (both company & contract employees)
Emergency Preparedness:
• On-Site Emergency Plan for the site
• Training on On-Site Emergency Action Plan
• Regular Site level Mock drills and Plant specific Fire Drills and Leak, spill drills
• Availability of First aiders, Fire Fighters and Rescue members in each shift
• Maintenance of Fire hydrant system, sprinkler system and portable fire extinguishers
• Periodic testing of fire hydrant and sprinkler systems
• Fire Tenders and Ambulances kept ready
Occupational Health:
• Pre-employment & Annual Medical Examination
• Quarterly/Periodical Physical Examinations
• Canteen Employees Examination
• Fork lift operators Examination
• Recall services & Follow-Up
• Return to work assessment
• Exit Examination
Document No. SCCPL/EIA/01 Issue No. 01 R 01 212
• Training on Counselling, Hearing Conservation Program, HazardousChemical
Awareness Program, Shop floor training, First-aid (Adequate numbers of Certified
First Aiders/employees), etc.
• Legal records: All medical records of employees to be maintained.
• Emergency Medical services: Ambulance services, First-aid boxes, Decontamination
facility etc.
Health Promotional Activities: Awareness on Medical issues, Ergonomics awareness
programs, Stress management, De-addiction program, etc.
❖ Decontamination facility is provided
❖ Breathing air provision is provided at toxic chemical handling area.
Safety System for Toxic Material Handling
Following precaution Taken while handling Toxic materials
❖ Highly Toxic chemical is stored in storage room with lock and key.
❖ Inventory records are maintained.
❖ Toxic material is stored in well ventilation and out of sunlight
❖ It is stored away from incompatible chemicals.
❖ Keeping containers tightly & securely closed when not in use
❖ Toxic chemical charging is done inside the closed room in presence of shift in-
charge.
❖ Local Ventilation system is provided to avoid exposure at work place.
❖ Vent gas is passing through scrubber system for absorption & reduction of pollution.
Standby pump provision is available for scrubber system. Training to employees is
providing for manual handling of toxic chemicals.
❖ First aid training also provided to concern employees.
❖ Antitoxic kit is maintaining inside OHC.
❖ Safety PPE’s is providing during charging.
❖ First aid kit provision is available at work place area.
Eye wash/Safety shower stations are readily available nearby and are tested regularly
To avoid fire and explosion nitrogen blanketing, earthing& bonding, electrical flame proof
equipment’s, pressure rated equipment’ are provided.
Suitable fire extinguisher and spill cleanup equipment are maintained.
Dyke provision is available where liquid toxic chemicals are stored.
❖ Appropriate spill control equipment and procedures is available.
MSDS is maintained inside the concern plant / department.
❖ Precautionary placard is displayed nearby the work place.
Document No. SCCPL/EIA/01 Issue No. 01 R 01 213
❖ Toxic chemicals sign board is displayed on container.
❖ Avoiding any welding, cutting, soldering or other hot work on an empty container of
toxic chemicals.
❖ Good housekeeping is maintaining.
❖ Toxic gas detector also provided at workplace.
❖ Toxic chemical waste is collecting in separate pit and transferring to ETP for its
treatment.
❖ Always ensuring that the waste container used is compatible with the waste material
❖ Ensuring that the waste container is properly and accurately labelled.
❖ Unauthorized person entry is restricted.
❖ Restricted for eating, drinking & smoking at work place.
❖ Employees are trained for emergency of toxic chemicals.
❖ Toxic chemical spill, leak drills are conducting for awareness, preparedness &
response during an emergency.
❖ Work place area monitoring is to be carried out for ensuring exposure at workplace.
❖ Process is performed in closed conditions.
❖ Regular pressure testing for pipelines and equipment to ensure tightness
WORKPLACE MONITORING PLAN
Work zone monitoring is carried out by HSE department every month for gaseous pollutants
and dusts. Records are to be kept in standard Form as per Factories Rules. Location for
samplings shall be identified. Samples are analyzed for Air borne concentration of
hazardous chemicals in ppm.
The analyzed results are compared with the threshold limit values (TLV) of international
organizations. The monitoring program is based on the Action level Concentration (ALC)
which is 50% of the TLV. If the analyzed concentration is < ALC, no regular monitoring is
required, only occasional checks (once in a year) to ensure the acceptability of the system.
If the analyzed concentration is > ALC < TLV then the monitoring is carried out at regular
interval (once in two months). Incase analyzed concentration is > TLV then corrective
actions are decided by Plant Manager, General Manager - works and Engineering Manager
and they are implemented. After implementation again monitoring is carried out.
The sampling for gaseous pollutants and air pollutants are done by Air sampling pump.
Arrangement for ensuring health and safety of workers engaged in handling of toxic
materials
All persons working in manufacturing units are surveyed by regular medical examinations.
Pre-employment Medical examination to be carried out for all employees prior to
employment at well-known multispecialty hospital.
Checkups & tests carried out as per Factory rules / SPCB guidelines.

Document No. SCCPL/EIA/01 Issue No. 01 R 01 214
6.19. Safety Recommendations
6.20. Commonly Recommended Control Measures
A number of preventive control measures for hazardous occurrences have been analysed
and discussed above. Some more salient points are enumerated below:
• All storage tanks in the tank farm should be dyked. Other operation and maintenance features shall be based on established best safety practices.
• Concentration detectors for hazardous chemical vapours (e.g. Pesticides/Toluene/methanol and other chemicals etc.) fire Smoke / heat detectors and fire alarm should be installed at all strategic locations in the plant.
• A schedule for preventive maintenance including health survey of all plant equipment should be adhered to as far as possible.
• Ensure the absence of ignition sources in storage area.
• Ensure placement of firefighting facilities, such as, carbon dioxide, dry chemical powder and foam type fire extinguishers in addition to fire hydrant system, at strategic locations. Spill control measures, such as, removal of all ignition sources from the spill area and ventilating the area as well as soaking the spilled material with paper, towel or mud and letting the volatile substance evaporate slowly in a safe area.
• Compulsory use of protective clothing, non-sparking tools and warning signs during critical operations and maintenance.
• Training / refresher courses on safety information’s / norms.
• Eyewash and showers should be put up at strategic places for use during emergencies.
A group of plant personnel should be trained in first aid, rescue, firefighting and emergency
control measures. These personnel will form core group/emergency squad who will fight
the emergency and also act as rescue and first aid team.
In order to ensure communication from isolated places/locations Walkie-Talkie be made
available to persons working in these areas. This will considerably improve the
effectiveness of emergency management.
There is no substitute for training-mock drills and these must be held at regular interval
keeping the following objectives in mind:
Real time mock-drill should be carried out for probable/likely hazardous situation (after the
plant is successfully commissioned).
Target to be set up for various tasks and events during an emergency.
Weak links should be marked and corrective action taken to improve effectiveness during
emergency.
6.21. Occupational Health and Safety
Occupational Health and Safety (OHS) are of prime importance more so in hazardous
industries. Industries have various types of hazards and QRA is carried out to understand
Document No. SCCPL/EIA/01 Issue No. 01 R 01 215
the hazards potential from various incidents. Pre-emptive steps can be planned to
safeguards from likely causes. Some of the
Frequent causes of accidents
• Fire and explosion: explosives, flammable material
• Hazards from Toxic Materials
• Mechanical Hazards such as:
Being struck by falling objects
Caught in between machine parts
Snapping of cables, ropes, chains, slings
Handling heavy objects
• Electricity Hazards
o Electrocution o Short circuits and consequential fire. o Poor illumination etc.
• Other Hazards:
Falls from height inside industrial units or on the ground
Struck by moving objects;Slipping on wet surfaces
Sharp objects
Oxygen deficiency in confined spaces; Lack of personal protective equipment (PPE),
housekeeping practices, safety signs
• Consequential hazards due to extreme Temperatures;
• Consequential hazards due to vibration
• Consequential hazards due to radiation;
• Many more hazards.
Hazardous substances and wastes
• Heavy and toxic metals
• Lack of hazard communication (storage, labeling, material safety data sheets)
• Batteries, fire-fighting liquids
• Welding fumes
• Volatile organic compounds (solvents)
• Inhalation in confined and enclosed spaces
• Repetitive strain injuries, awkward postures, repetitive and monotonous work,excessive workload
Ergonomic and psychosocial hazards
• Many of the hazards are as result of working environment.
•
Document No. SCCPL/EIA/01 Issue No. 01 R 01 216
• Long working hours, shift work, night work, temporary employment (Long working hours, shift work, night work, temporary employment,Mental stress, human relations) which results in less attention at work place and consequential incidents and accidents.
• Lack of education and training / awareness is another prime cause of accidents.
Considering above, QRA analysis and also the nature of activities at SCCPL the following
steps for OHS activities have been suggested:
• Employee’s health check-up:pre-employment and periodic check-up during employment. The health check-up observations should be informed to employees.
• The health should include any impact due to hazards at work place including (but not limited to) due to noise, heat, illumination, dust, any other chemicals, metals being suspected in environment and going into body of workers either through inhalation, ingestion or through skin absorption and steps taken to avoid musculo-skeletal disorders (MSD), backache, pain in minor and major joints, fatigue etc.
• Training and refresher courses on safety to all employees.
• Employees should be made aware of the hazards in the plant and the preventive actions to be safe from such hazards.
Response to Injuries:Based on a survey of possible injuries, a procedure for response to
injuries or exposure to hazardous substances should be established. All staff should have
minimum training to such response and the procedure ought to include the following:
• Immediate first aid, such as eye splashing, cleansing of wounds and skin, and
Bandage etc.
• Immediate reporting to a responsible designated person
• If possible, retention of the item and details of its source for identification of
possible hazards.
• Medical surveillance
• Recording of the incident
• Investigation, determination and implementation of remedial action
6.22. Emergency Management Plan
SCCPL should develop an Emergency Management Plan (EMP) and regularly carry out
Mock drills to check the effectiveness of the EMP. A sample EMP is attached. SCCPL
should develop the EMP taking guidance from the Sample EMP and plant detailed hazard
analysis/ Plant management set up etc.
6.23. Many of the hazards are as result of working environment
Repetitive strain injuries, awkward postures, repetitive and monotonous work, excessive
workload
Document No. SCCPL/EIA/01 Issue No. 01 R 01 217
Long working hours, shift work, night work, temporary employment (Long working hours,
shift work, night work, temporary employment, Mental stress, human relations) which
results in less attention at work place and consequential incidents and accidents.
Lack of education and training / awareness is another prime cause of accidents.
Considering above, QRA analysis and also the nature of activities at SCCPL the following
steps for OHS activities have been suggested:
Employee’s health check-up: pre-employment and periodic check-up during employment.
The health check-up observations should be informed to employees.
The health should include any impact due to hazards at work place including (but not limited
to) due to noise, heat, illumination, dust, any other chemicals, metals being suspected in
environment and going into body of workers either through inhalation, ingestion or through
skin absorption and steps taken to avoid musculo-skeletal disorders (MSD), backache, pain
in minor and major joints, fatigue etc.
Training and refresher courses on safety to all employees.
Employees should be made aware of the hazards in the plant and the preventive actions to
be safe from such hazards.
Response to injuries: Based on a survey of possible injuries, a procedure for response to
injuries or exposure to hazardous substances should be established. All staff should have
minimum training to such response and the procedure ought to include the following:
o ̇Immediate first aid, such as eye splashing, cleansing of wounds and skin, and Bandage etc.
o Immediate reporting to a responsible designated person o If possible, retention of the item and details of its source for identification of possible
hazards. o Medical surveillance o Recording of the incident
o Investigation, determination and implementation of remedial action
6.24. Key Process Safety Measures
• Flameproof equipment’s and fittings are provided for handling of hazardous chemicals.
• Tanks and all pump motors are earthed.
• Road tanker earthing lines have been provided near the unloading pumps.
• Dykes have been provided for hazardous chemicals storage to contain leakages.
Floors of the dyke area have impervious finish.
• Housekeeping of the plant is as per prescribed norms. Floors, platforms, staircases,
passages are kept free of any obstruction.
• All hazardous operations are explained to the workers. They are periodically trained
on the hazardous processes.
• Dedicated supply of firewater is available in the plant.
• Only authorized persons are allowed inside the plant.
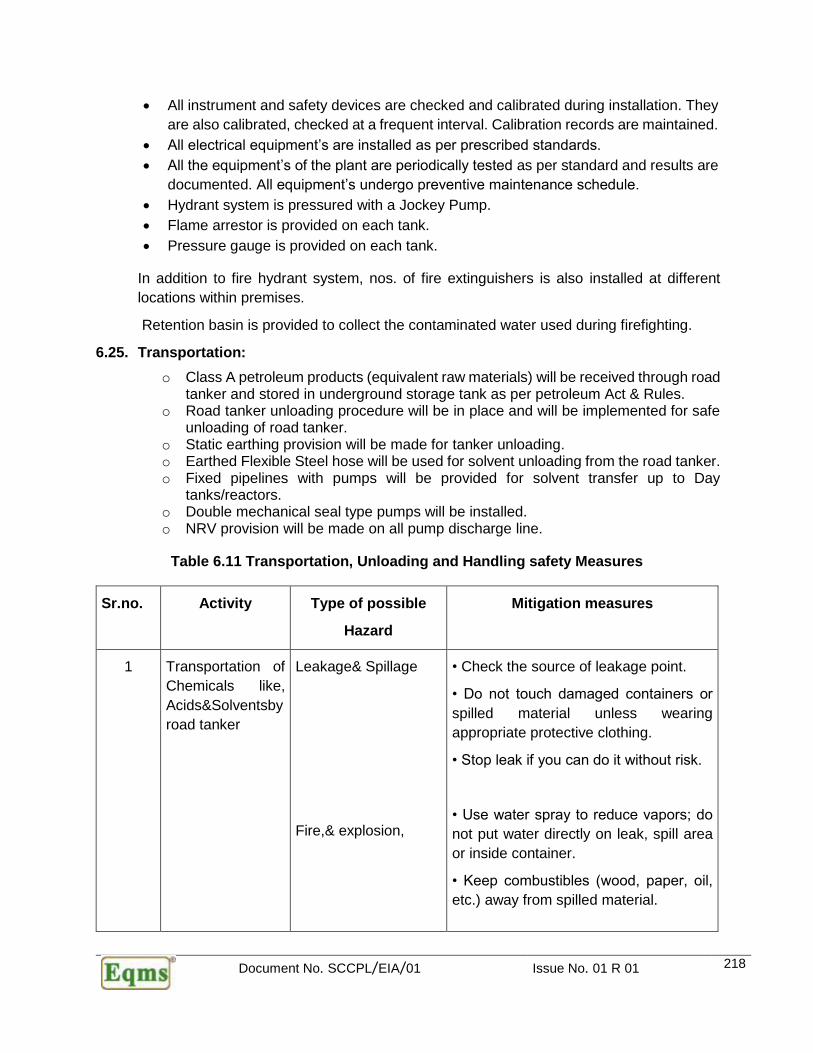
Document No. SCCPL/EIA/01 Issue No. 01 R 01 218
• All instrument and safety devices are checked and calibrated during installation. They
are also calibrated, checked at a frequent interval. Calibration records are maintained.
• All electrical equipment’s are installed as per prescribed standards.
• All the equipment’s of the plant are periodically tested as per standard and results are
documented. All equipment’s undergo preventive maintenance schedule.
• Hydrant system is pressured with a Jockey Pump.
• Flame arrestor is provided on each tank.
• Pressure gauge is provided on each tank.
In addition to fire hydrant system, nos. of fire extinguishers is also installed at different
locations within premises.
Retention basin is provided to collect the contaminated water used during firefighting.
6.25. Transportation:
o Class A petroleum products (equivalent raw materials) will be received through road tanker and stored in underground storage tank as per petroleum Act & Rules.
o Road tanker unloading procedure will be in place and will be implemented for safe unloading of road tanker.
o Static earthing provision will be made for tanker unloading. o Earthed Flexible Steel hose will be used for solvent unloading from the road tanker. o Fixed pipelines with pumps will be provided for solvent transfer up to Day
tanks/reactors. o Double mechanical seal type pumps will be installed. o NRV provision will be made on all pump discharge line.
Table 6.11 Transportation, Unloading and Handling safety Measures
Sr.no. Activity Type of possible
Hazard
Mitigation measures
1 Transportation of
Chemicals like,
Acids&Solventsby
road tanker
Leakage& Spillage
Fire,& explosion,
• Check the source of leakage point.
• Do not touch damaged containers or
spilled material unless wearing
appropriate protective clothing.
• Stop leak if you can do it without risk.
• Use water spray to reduce vapors; do
not put water directly on leak, spill area
or inside container.
• Keep combustibles (wood, paper, oil,
etc.) away from spilled material.
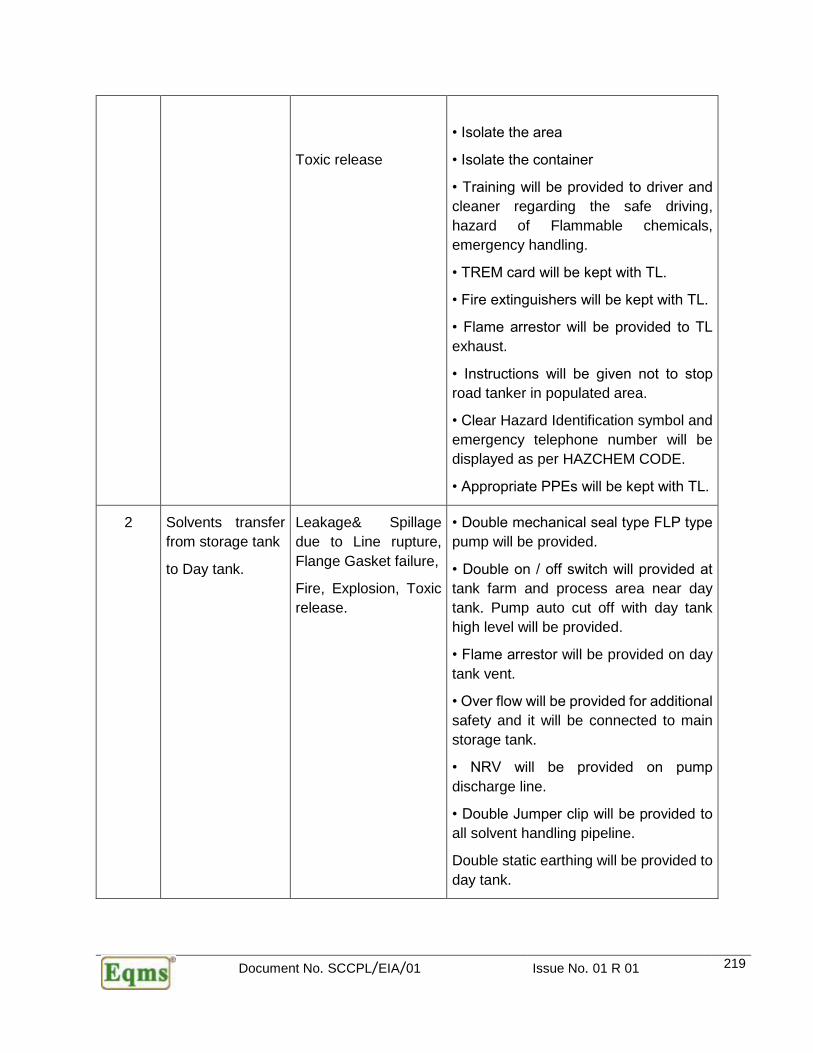
Document No. SCCPL/EIA/01 Issue No. 01 R 01 219
Toxic release
• Isolate the area
• Isolate the container
• Training will be provided to driver and
cleaner regarding the safe driving,
hazard of Flammable chemicals,
emergency handling.
• TREM card will be kept with TL.
• Fire extinguishers will be kept with TL.
• Flame arrestor will be provided to TL
exhaust.
• Instructions will be given not to stop
road tanker in populated area.
• Clear Hazard Identification symbol and
emergency telephone number will be
displayed as per HAZCHEM CODE.
• Appropriate PPEs will be kept with TL.
2 Solvents transfer
from storage tank
to Day tank.
Leakage& Spillage
due to Line rupture,
Flange Gasket failure,
Fire, Explosion, Toxic
release.
• Double mechanical seal type FLP type
pump will be provided.
• Double on / off switch will provided at
tank farm and process area near day
tank. Pump auto cut off with day tank
high level will be provided.
• Flame arrestor will be provided on day
tank vent.
• Over flow will be provided for additional
safety and it will be connected to main
storage tank.
• NRV will be provided on pump
discharge line.
• Double Jumper clip will be provided to
all solvent handling pipeline.
Double static earthing will be provided to
day tank.
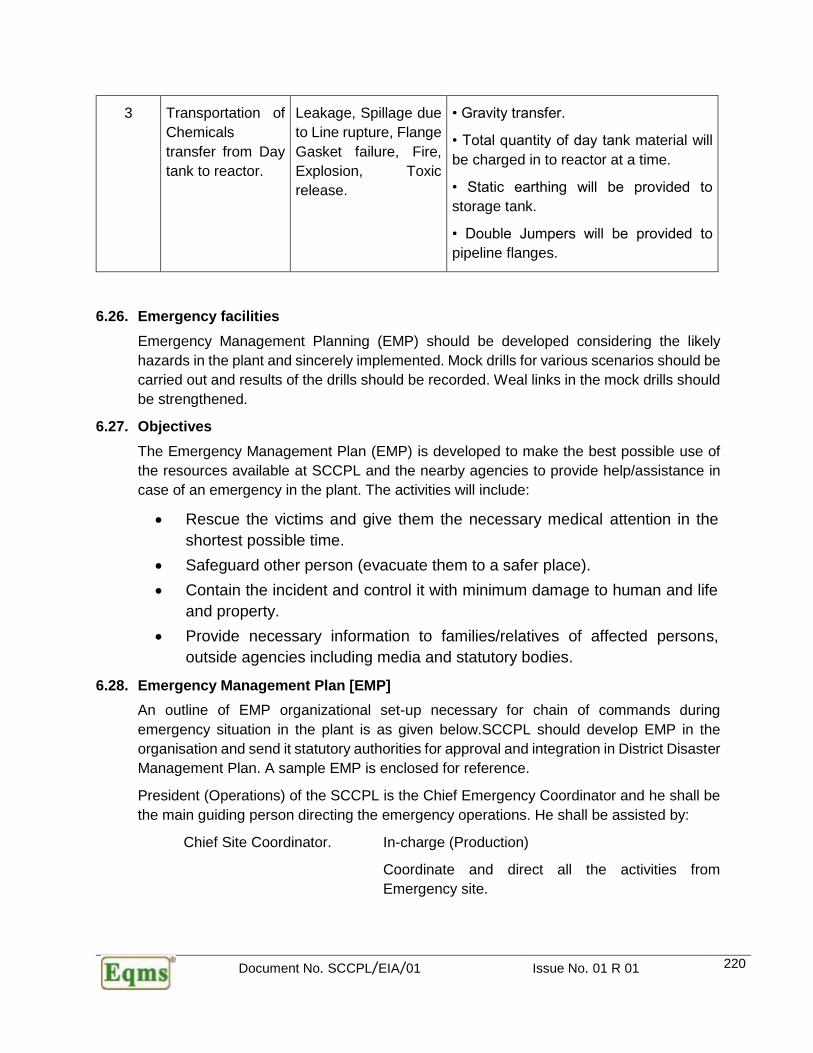
Document No. SCCPL/EIA/01 Issue No. 01 R 01 220
3 Transportation of
Chemicals
transfer from Day
tank to reactor.
Leakage, Spillage due
to Line rupture, Flange
Gasket failure, Fire,
Explosion, Toxic
release.
• Gravity transfer.
• Total quantity of day tank material will
be charged in to reactor at a time.
• Static earthing will be provided to
storage tank.
• Double Jumpers will be provided to
pipeline flanges.
6.26. Emergency facilities
Emergency Management Planning (EMP) should be developed considering the likely
hazards in the plant and sincerely implemented. Mock drills for various scenarios should be
carried out and results of the drills should be recorded. Weal links in the mock drills should
be strengthened.
6.27. Objectives
The Emergency Management Plan (EMP) is developed to make the best possible use of
the resources available at SCCPL and the nearby agencies to provide help/assistance in
case of an emergency in the plant. The activities will include:
• Rescue the victims and give them the necessary medical attention in the
shortest possible time.
• Safeguard other person (evacuate them to a safer place).
• Contain the incident and control it with minimum damage to human and life
and property.
• Provide necessary information to families/relatives of affected persons,
outside agencies including media and statutory bodies.
6.28. Emergency Management Plan [EMP]
An outline of EMP organizational set-up necessary for chain of commands during
emergency situation in the plant is as given below.SCCPL should develop EMP in the
organisation and send it statutory authorities for approval and integration in District Disaster
Management Plan. A sample EMP is enclosed for reference.
President (Operations) of the SCCPL is the Chief Emergency Coordinator and he shall be
the main guiding person directing the emergency operations. He shall be assisted by:
Chief Site Coordinator. In-charge (Production)
Coordinate and direct all the activities from
Emergency site.

Document No. SCCPL/EIA/01 Issue No. 01 R 01 221
In absence of In-charge (Prod.), Manager (Prod. I/II) will act as Chief Site Coordinator.
Chief Maintenance Coordinator Manager-Maintenance
Coordinate all the maintenance activities from the
Emergency Control Center.
In absence of Manager (Maint.), Asst. Manager will
act as Chief maintenance Coordinator.
Chief Service Coordinator Manager (HR)
Coordinate with local administration take care of
transport, medical,canteen arrangements, and
evacuation of people if required.
In absence of Manager (HR), Asst. Manager (P&A)
will act as Chief Service Coordinator.
Chief Material Coordinator Manager (Commercial)
In absence of Manager (Commercial), Asst.
Manager (Commercial) will act as commercial
Coordinator.
Operation Coordinator Manager (Prod.) is the Incident
Controller for Vehicle Control & Security
Personnel Security Officer
In absence of Security Officer,Security Supervisor will act for Vehicle Control & Security Personnel deployment.
Fire & Safety Controller In-charge (F&S)
In absence of In-charge (F&S), Supervisor. (F & S)
will act as Fire & Safety Controller and also for first
aid.
Two “Assembly Points” will be identified (based on wind direction and away from hazardous
areas) and duly marked.
Chief Service Coordinator shall contact the following senior officers stationed at
Bulandsahar.
Format for Telephone Numbers of the Authorities:
Table

Document No. SCCPL/EIA/01 Issue No. 01 R 01 222
6.29. Responsibilities & Role of Key Personnel
6.30. Over all In-charge –President (Operation)
On getting the information about emergency from In-Charge (Prod.) rush to incident site/.
Assess the overall situation and provide guidance in critical decision-making.
6.31. Chief Site Coordinator- Manager (Prod.)
• On getting the information about emergency from Supervisor Plant, inform over all In-
charge Plant (Operation).
• Rush to the emergency site to assess the situation and decide to:
o Declare emergency based on amount/extent of hazards and water/air analysis
(toxic / flammable material release) and advise Incharge (F&S) for sounding
emergency siren.
o Review if plant shutting down is required to contain / control the hazard.
o Review, evacuation from affected areas and sending the affected person to a
safe place.
o Advise Incident Controller and other key personnel to take necessary action.
o He will interact with Chief Service Coordinator and advise him on possible
effects on areas inside and outside the factory to initiate Off- Site Emergency
Response Plan.
o Remain in touch with Overall in-charge (P -O) and inform about the situation &
actions being taken and seek his advice for the critical decisions.
6.32. Chief Maintenance Coordinator- GM (Maintenance)
• After getting information about emergency from manager concerned Plant. Inform all
concerned personnel to be on alert.
• Rush to the ECC, assess the situation and facilitate Chief Site Coordinator-GM (Prod.),
Maintenance support needed to tackle the emergency.
• Facilitate elect. isolation of the affected area, if required through Supervisor (E&I)
• Facilitate lighting arrangements at (a) affected locations and (b) Assembly points if
required through Supervisor (E&I)
• Facilitate work-shop facilities with adequate manpower if required through Manager
(Maintenance). Remain in touch with Chief Site Controller.
6.33. Chief Service Coordinator - Manager (HR)
Document No. SCCPL/EIA/01 Issue No. 01 R 01 223
• On getting information from the Medical Coordinator rush to the Emergency Control
Centre.
• Assess the situation in consultation with Chief Site Coordinator and Incident Controller
and ensure that casualties get adequate transport / medical help.
• Make arrangement to shift all the persons to the safest place if called for.
• Assess 'Law and Order' situation.
• Inform press, TV / Radio, local authorities about the severity of situation in close co-
ordination with Chief site Coordinator and in consultation with Over all In-charge -P (O).
• Inform the District Authority / local police station in case their help is required for
evacuation of personnel / preserving law and order.
• Evacuation of adjoining areas and villages, if required.
• Remain in touch with over all In-charge - P (O) and seek his advice for the critical
decisions.
6.34. Chief Material Coordinator- Manager (Materials)
• Rush to the emergency control center on receipt of the message from Chief Service
Coordinator / on hearing the emergency siren and inform Supervisor. (Store) about the
emergency.
• Get the stores opened for requirement of the Fire fighting/safety and other materials,
which may be required during emergency.
• Assess the situation in consultation with Chief site coordinator & incident controller for
any material requirement /help at the affected site.
• He will be responsible for the arrangements of trucks for movement of bulk material if
required.
• Remain in touch with Chief site coordinator, Incident controller, and Chief maintenance
coordinator.
6.35. Incident Controller Concerned Plant -Manager Concerned Plant
• Rush to the site of emergency after getting information from Shift In-charge assesses
the situation and immediately inform
o GM – Prod.
• Take over charge from shift in charge.
• Ensure that persons working in the area are safe and isolate source of toxic release if
possible.
• Advise and assist In charge (F&S) for providing water curtains to contain toxic release
with in the plant battery.

Document No. SCCPL/EIA/01 Issue No. 01 R 01 224
• Remain in touch with Chief Site Controller and other concerned officers.
• Coordinate with Chief Maintenance / Chief Material coordinators for assistance
required at site.
• Depending upon the severity of incident, ensure that adequate emergency services like
Medical/ Laboratory/ Mechanical/ Electrical etc.are summoned.
• Preservation of evidence as far as possible without affecting the operation of
emergency procedures to facilitate any subsequent inquiries into the causes and
circumstances, which led to the emergency.
6.36. Shift In charge (Concerned Plant):
• Immediately proceed to the site of emergency and assess the situation:
• Emergency Control Room at 101/123 (with name and location of emergency)
• During odd hours/till arrival of Fire shift I/C should act as chief fire coordinator.
• Initiate the shutting down operations for controlling the hazard if unavoidable.
• Cordon off the area and do not allow any body to enter the affected area without
respiratory protection (In case of toxic gas leakage).
• Direct rescue operations with the help of fire and safety staff.
• Open safety Almirah for the use of plant personnel.
• Have regard to the need for preserving evidence that could facilitate subsequent
inquiry.
• Advise Supervisor of the plant to take roll call and account for missing personnel.
• Hand over charge of the operation to the Manager when he arrives at site.
• Ensure service agencies like Electrical, mechanical, instrumentation are mobilized to
handle the emergencies.
6.37. Security Officer Vehicle Control and Security Personnel Deployment at the Locations
• Rush to the spot of emergency on getting information from Security Officer on duty and
inform Manager (HR) about emergency.
• Arrange one emergency vehicle immediately for ECC.
• Keep in touch with Chief Service Coordinator, Chief Site Coordinator and In charge
(F&S).
• He will act as a special rescue Coordinator at the time of evacuation of employees and
others if required.
• Alerts complete staff under his control and make it available at a known point, as per
the guidance of Chief Site Coordinator / Chief Service Coordinator.

Document No. SCCPL/EIA/01 Issue No. 01 R 01 225
• Anticipate and arrange vehicles required at emergency site in consultation with
Incharge (F&S) and Chief Site Coordinator and Chief Service Coordinator.
• On request send vehicles for getting plant personnel / fire personnel required for
emergency.
• Arrange vehicle in consultation with Medical Coordinator / Chief Service Coordinator
for shifting injured to city hospital.
• During emergency arrange for opening of relevant gates/ barriers foreasy movement of
vehicles. Security Guards should be posted on these gates / barriers to prevent
unauthorized entry.
• Arrange transport and temporary shelters for evacuated personnel and inform the
relatives of the affected personnel if required.
6.38. Fire & Safety Controller- Incharge (F&S)
• Rush to the spot of emergency after getting information from ECC and inform to
Supervisor. (F&S).
• Direct rescue operations under the guidance of Chief Site Coordinator/ Incident
controller if required
• Ask additional help from C.S.O. for cordoning off the area and advise fire personnel for
rescue / fire fighting if required
• Arrange to provide water curtains, water monitors, at affected locations if required.
• Organize and supervise fire-fighting operations if called or.
• Provide necessary respiratory equipment to plant personnel for emergency use.
• Advise Chief Site Coordinator to arrange additional help Mutual aid group /
neighbouring industries if required.
• Give safety precautions to the personnel at rescue work.
6.39. Fire Control Room In-Charge
On receiving emergency message from the Incharge(F&S)/ on hearing siren. Rush to ECC
and take charge of Fire Control Centre from the fire operator / fire supervisor.
• Assess the situation and Call fire staff from fire barrack.
• Immediately rush fire crew to emergency spot.
• Inform Medical Centre for sending ambulance to emergency site.
6.40. Fire Supervisor should also ensure the following:
o Supervisor to look for the wind direction and cordon off the area.
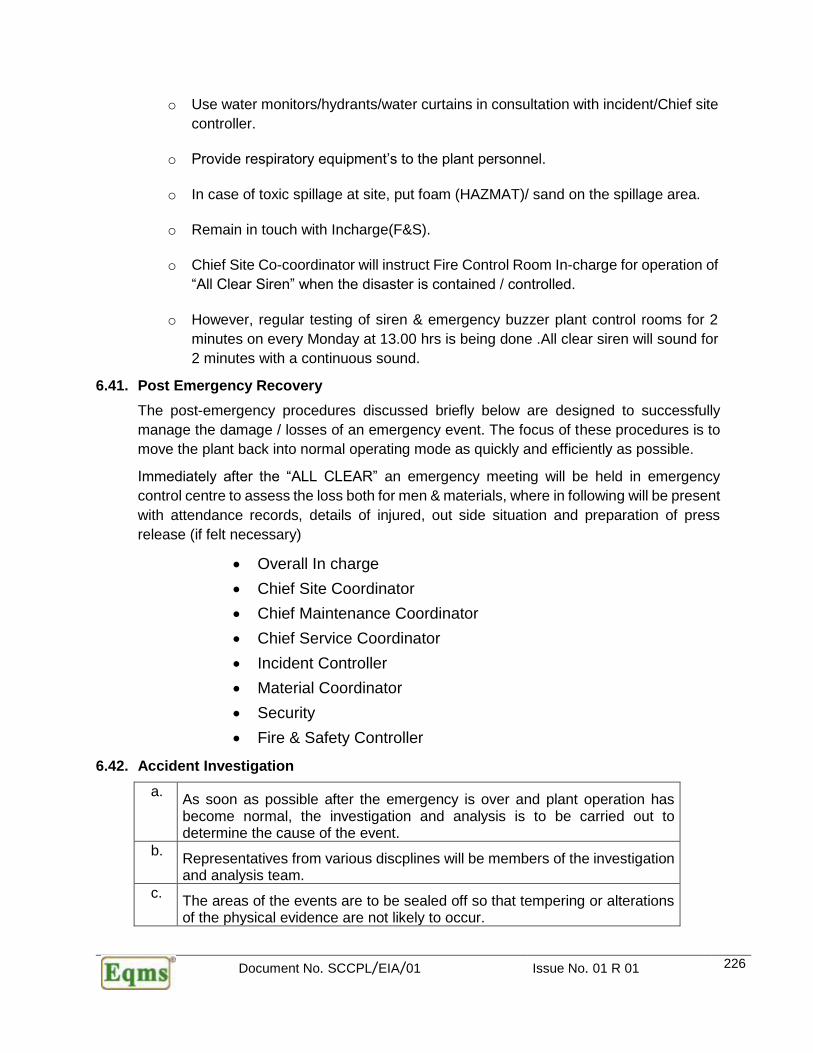
Document No. SCCPL/EIA/01 Issue No. 01 R 01 226
o Use water monitors/hydrants/water curtains in consultation with incident/Chief site
controller.
o Provide respiratory equipment’s to the plant personnel.
o In case of toxic spillage at site, put foam (HAZMAT)/ sand on the spillage area.
o Remain in touch with Incharge(F&S).
o Chief Site Co-coordinator will instruct Fire Control Room In-charge for operation of
“All Clear Siren” when the disaster is contained / controlled.
o However, regular testing of siren & emergency buzzer plant control rooms for 2
minutes on every Monday at 13.00 hrs is being done .All clear siren will sound for
2 minutes with a continuous sound.
6.41. Post Emergency Recovery
The post-emergency procedures discussed briefly below are designed to successfully
manage the damage / losses of an emergency event. The focus of these procedures is to
move the plant back into normal operating mode as quickly and efficiently as possible.
Immediately after the “ALL CLEAR” an emergency meeting will be held in emergency
control centre to assess the loss both for men & materials, where in following will be present
with attendance records, details of injured, out side situation and preparation of press
release (if felt necessary)
• Overall In charge
• Chief Site Coordinator
• Chief Maintenance Coordinator
• Chief Service Coordinator
• Incident Controller
• Material Coordinator
• Security
• Fire & Safety Controller
6.42. Accident Investigation
a. As soon as possible after the emergency is over and plant operation has become normal, the investigation and analysis is to be carried out to determine the cause of the event.
b. Representatives from various discplines will be members of the investigation and analysis team.
c. The areas of the events are to be sealed off so that tempering or alterations of the physical evidence are not likely to occur.
Document No. SCCPL/EIA/01 Issue No. 01 R 01 227
d. Key components are to be photographed and logged with time, place, direction etc.
e. Statements are to be taken from those who were involved with the operation or who witnessed the event.
6.43. Damage Assessment
This phase of recovery establishes the quantum of replacement machinery considered
necessary for bringing back plant to normal operation; property and personnel losses
accounted and culminates in a list of necessary repair, replacement and construction work.
Insurance companies will be informed of the damage and requested to pay the
compensation as per claim.
6.44. Clean-up and Restoration
This phase will only begin once the investigation is complete. Reporting documentations
are to be prepared and forwarded to appropriate authorities. Repair, clean up and
restoration work to begin.
6.45. Conclusion & Recommendations
The hazard analysis and risk assessment incident scenario indicates that incidents mostly
are not limited to plant ba`ttery limits but covers surrounding area also. There are
possibilities of domino effect and the secondary scenario not predictable can be worse than
the primary one. The scenarios (specifically toxic hazards scenarios) are crossing the plant
boundaries. The direction of impact will be in down wind direction (wind direction and speed
varies with season).
Some of the recommendations for Tank farm storage system are as given below:
• Provision of flame detectors/ thermal sensors at strategic locations in
the tank farm area.
• Auto water deluge system on each bulk storage tank for inflammable
liquids. The system should automatically start taking signal from flame
detectors or thermal relay.
• Fixed foam system with adequate capacity.
Human Factors: Company is having well equipped fire station and also safety department
– safety practices. Human factors role in safety cannot be ignored. Odd hours working and
over / long hours work can drain out individual. It shows in lack of efficiency and also the
lack of paper attention the modern which chemical complex demand. They are to be closely
looked into and avoided.
‘Safety’ has unique features:
If no accident has happened so far probability of incident / accident occurring increases.
Document No. SCCPL/EIA/01 Issue No. 01 R 01 228
‘No accident’ / good safety record develops complacency inertia/ over confidence in the
team. This attitude gives rise to gaps / soft spots in the system giving chances to incidents
/ accidents.
Safety requires novelty. Routine training practices get stale with no positive results. Look
for novel scheme of training/ safety practices to build up fresh impetus in safety.
Involvement of employees with refreshed outlook for safety is to be achieved.
SCCPL will strength their safety system by introducing SOP’s, work instruction followed by
mock drill with proper intervals, fire escape routes will be marked with all fire extinguishers
putting in place with proper trained fire team. It is proposing to install fire hydrant system
also as the storage and handling of flammable material will increase.
Above all it is attitude and practice which always help in handling the incident/ accident
occurs at any where especially regular, fire drills and induction training program at plant
before starting the day helps in avoiding the risk. It is also going to made mandatory to use
PPE at site. Company has policy to acheive zero accident rewards system for employs to
motivate and maintain safe environment.
The hazard potential of chemicals and estimation of consequences in case of their
accidental release during storage, transportation and handling has been identified and risk
assessment has been carried out to quantify the extent of damage and suggest
recommendations for safety improvement for the proposed facilities. Risk mitigation
measures based on MCA analysis and engineering judgments are incorporated in order to
improve overall system safety and mitigate the effects of major accidents.
An effective Disaster Management Plan (DMP) to mitigate the risks involved has been
prepared. This plan defines the responsibilities and resources available to respond to the
different types of emergencies envisaged. Training exercises will be held to ensure that all
personnel are familiar with their responsibilities and that communication links are
functioning effectively.
Document No. SCCPL/EIA/01 Issue No. 01 R 01 229
CHAPTER 7. SUMMARY AND CONCLUSION
7.1. Prelude
The present study was aimed at identifying the potential environmental impacts due to the
various project activities, assessment of impact, mitigation measures, and at developing an
environmental management and monitoring plans for proper mitigation of any adverse
environmental impact. In this study, the various activities likely to take place during the
construction and operation phases of the project have been analyzed in relation to the
baseline condition of different environmental components. The mitigation measures
proposed for the construction and operation stages have been proposed and the potential
residual impacts discussed. The key points considered in this study are described in the
following sections:
7.2. Regulatory Compliance
The project is yet at its technical investigation stage. Prior to its implementation, it will be
necessary to acquire all the necessary clearance from the Government of India, as per the
applicable national regulations. Key clearances include obtaining No Objection Certificate
from the Uttar Pradesh Pollution Control Board (UPPCB) under The Water (Prevention and
Control of Pollution) Act, 1974 and Rules, 1975; The Air (Prevention and Control of
Pollution) Act, 1981 and Rules, 1982. In addition to that Hazardous Waste (Management,
Handling and Trans-boundary Movement) Rules, 2016, Bio Medical Waste (Management
& Handling) Rules, 1998 and amendments thereafter, Municipal Solid Waste (Management
& Handling) Rules, 2000 and amendments thereafter will also be applicable to the industry.
7.3. Baseline Conditions
The monitoring of the existing environmental conditions of the proposed project site and of
its close vicinity have been established with respect to physical, biological and human
environment.
The air quality of the area meets the prescribed National Ambient Air Quality Standards
applicable for the Residential & Rural Areas. The background noise levels were also found
well within the standards as at present most of the area is not developed.
No biological and metallic contamination has been found in any of the ground water sample
of the study area. Overall the parameters in ground water sample were well within the
permissible limit of Indian Standard IS: 10500-2012. No metallic and bacterial
contamination was found in the ground water samples
This chapter concludes on the findings that emerged from the environmental assessment study and summarizes the key points to be addressed to ensure the environmental
sustainability of the project during the construction and operation phases.
Document No. SCCPL/EIA/01 Issue No. 01 R 01 230
7.4. Environmental Impacts and Mitigation Measures
The project entails various impacts on the study area, some negative and some positive.
There is going to no adverse impact on water quality or water demand due to proposed
project. Rather overall fresh water demand will get reduced from the present level due to
treated effluent recycle.
The impact (incremental GLC) due to the new stacks were computed and all pollutants post
project GLC will be well within NAAQ norms.
There will be no adverse impact on land or noise level due to proposed project.
SCC has taken adequate measures for EHS aspects for the proposed project. In addition
recommendations have been made to further strengthen the EHS measures, energy
conservation and other EMP aspects.
7.5. Project Benefits
▪ Proposed project will result in considerable growth of stimulating the industrial and
commercial activities in the area. Small and medium scale industries may be further
developed as a consequence.
▪ The project will be beneficial in govt’s target of increase the production capacity and yield
in the field of agriculture.
▪ Increased revenue to the state by way of royalty, taxes and duties;
▪ Overall Growth of the neighboring area viz.: ° Agriculture and animal husbandry. Health
and family welfare; Watershed development; Sustainable livelihood and strengthening of
village Self Help Groups; and Infrastructure development.
▪ In operation phase, the proposed plant would require significant workforce of non-
technical and technical persons.
▪ Migration of persons with better education and professional experience will result in
increase of population and literacy in the surrounding villages.
▪ Civic amenities will be substantial after the commencement of project activities. The basic
requirement of the community needs will be strengthened by extending healthcare,
educational facilities to the community, building/strengthening of existing roads in the area.
▪ The local population will be given preference to employment on the basis of their eligibility
and company requirement. The employment potential will ameliorate economic conditions
of these families directly and provide employment to many other families indirectly who
are involved in business and service oriented activities. The employment of local people
in primary and secondary sectors of project shall upgrade the prosperity of the region. This
in-turn will improve the socio-economic conditions of the area.
▪ Around 50 people will be deployed temporarily during construction of the project and
Around 50 people will be employed during operational stage of the project (direct).
7.6. Conclusion and Recommendations
Based on the environmental impact assessment conducted, the following
recommendations are made:

Document No. SCCPL/EIA/01 Issue No. 01 R 01 231
▪ Since regulations are fast changing in India, the project proponent must keep himself or
herself updated with respect to applicable laws and take appropriate actions in case the
provisions in some regulations undergo change.
▪ The impacts envisaged due to construction activities will be for short limited period. Impact
due to operational activities, systems of periodic auditing and reporting shall be adopted
during the operation period to ensure that the system adheres to the EMP.
▪ The project proponent and its team of consultants and contractors are urged to develop a
strategy for effective communication with local people. The construction team/ developer
should effectively follow the suggestions made in the EMP and/ or any other environmental
measures so as not to damage the environment of the project area.
▪ CSR activities should be further strengthened.

Document No. SCCPL/EIA/01 Issue No. 01 R 01 232
CHAPTER 8. DISCLOSURE OF CONSULTANTS
Declaration by Experts Contributing to the EIA/EMP REPORT of Manufacturing Unit of new
Technical Pesticide at HD-20, 21,22 & HE 27, 28, 29, 30 UPSIDC Industrial area, Sikanddrabad,
District Bulandshahr, Uttar Pradesh by M/s Samradhi Crop Chemicals Pvt Ltd.
I, hereby, certify that I was a part of the EIA team in the following capacity that developed the
above EIA.
EIA Coordinator:
Signature:
Name: P.K Srivastava
Period of Involvement: September 2015 to finalization of report
Contact Information: 011-30003200
Functional Area Experts :
Functional Areas
Name of the
Expert
Involvement (Period and Task**)
June 2015 to finalization of report
Signature
Air Pollution Monitoring & Control (AP)
Y.Bordia
• Micro Meteorology and air pollution monitoring planning also quality check.
• Impact assessment, mitigation & environmental management plan preparation.
Air Quality Modeling and
Prediction (AQ)
Sanjeev Sharma
• Analysis of collected baseline data
• Processing of micrometeorological data for using in model.
• Analysis of predicted impact due to the modelling result.
Water Pollution
(WP) Y.Bordia
• Water Quality monitoring network designing.
• Sampling of water samples (surface and ground water).
• Monitoring of water quality.
• Water Balance
• Identification & assessment of quantum of water pollution and its Mitigation measures.
• ETP Suggestion.
Noise and Vibration
Sanjeev Sharma
• Analysis of collected baseline data
• Processing of data for modelling purposed.
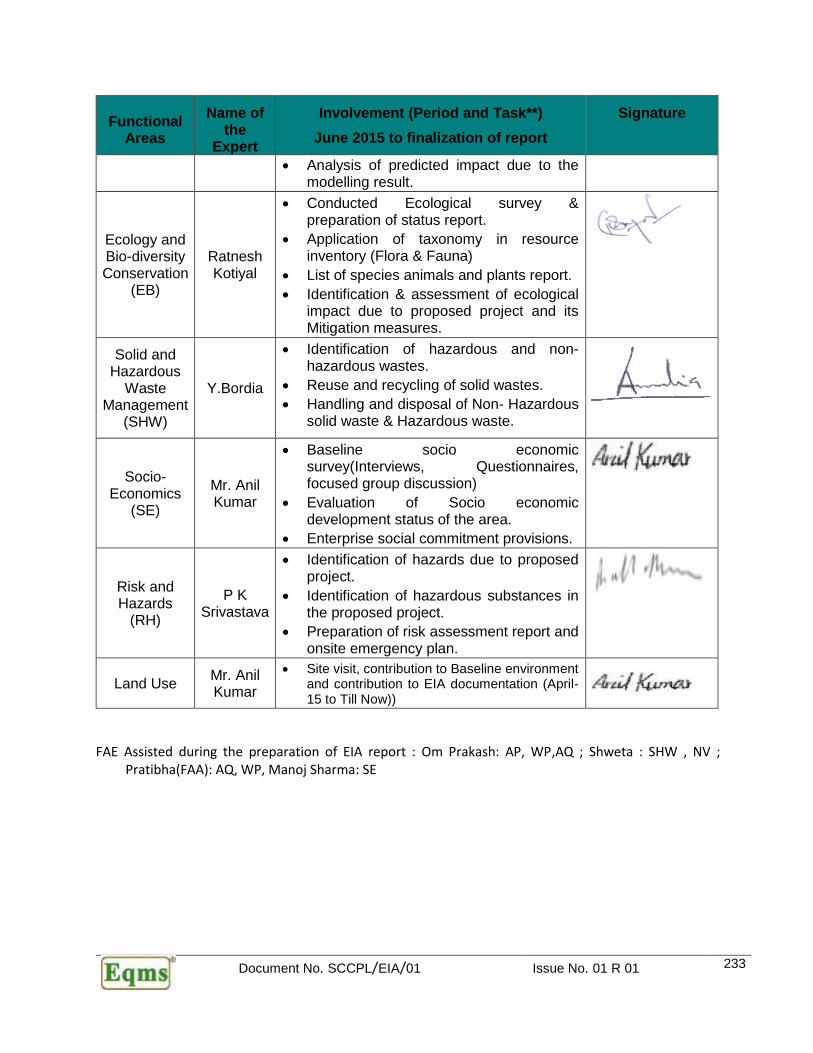
Document No. SCCPL/EIA/01 Issue No. 01 R 01 233
Functional Areas
Name of the
Expert
Involvement (Period and Task**)
June 2015 to finalization of report
Signature
• Analysis of predicted impact due to the modelling result.
Ecology and Bio-diversity Conservation
(EB)
Ratnesh Kotiyal
• Conducted Ecological survey & preparation of status report.
• Application of taxonomy in resource inventory (Flora & Fauna)
• List of species animals and plants report.
• Identification & assessment of ecological impact due to proposed project and its Mitigation measures.
Solid and Hazardous
Waste Management
(SHW)
Y.Bordia
• Identification of hazardous and non-hazardous wastes.
• Reuse and recycling of solid wastes.
• Handling and disposal of Non- Hazardous solid waste & Hazardous waste.
Socio-Economics
(SE)
Mr. Anil Kumar
• Baseline socio economic survey(Interviews, Questionnaires, focused group discussion)
• Evaluation of Socio economic development status of the area.
• Enterprise social commitment provisions.
Risk and Hazards
(RH)
P K Srivastava
• Identification of hazards due to proposed project.
• Identification of hazardous substances in the proposed project.
• Preparation of risk assessment report and onsite emergency plan.
Land Use Mr. Anil Kumar
• Site visit, contribution to Baseline environment and contribution to EIA documentation (April-15 to Till Now))
FAE Assisted during the preparation of EIA report : Om Prakash: AP, WP,AQ ; Shweta : SHW , NV ; Pratibha(FAA): AQ, WP, Manoj Sharma: SE
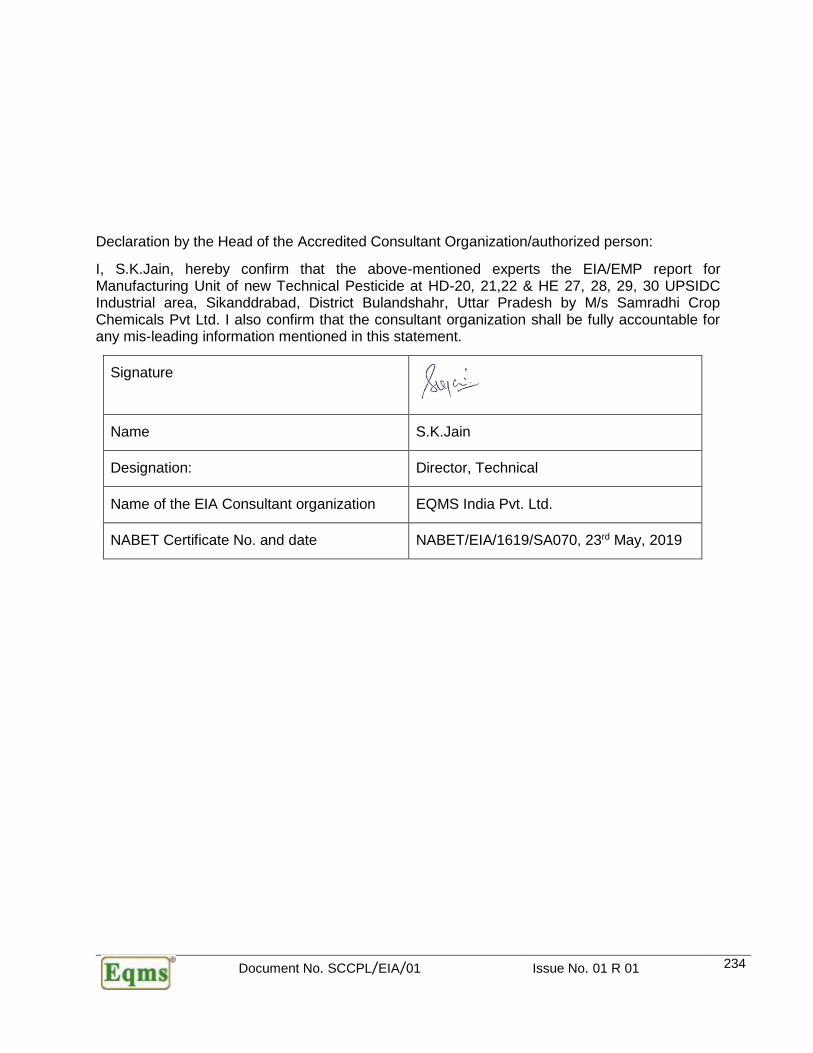
Document No. SCCPL/EIA/01 Issue No. 01 R 01 234
Declaration by the Head of the Accredited Consultant Organization/authorized person:
I, S.K.Jain, hereby confirm that the above-mentioned experts the EIA/EMP report for Manufacturing Unit of new Technical Pesticide at HD-20, 21,22 & HE 27, 28, 29, 30 UPSIDC Industrial area, Sikanddrabad, District Bulandshahr, Uttar Pradesh by M/s Samradhi Crop Chemicals Pvt Ltd. I also confirm that the consultant organization shall be fully accountable for any mis-leading information mentioned in this statement.
Signature
Name S.K.Jain
Designation: Director, Technical
Name of the EIA Consultant organization EQMS India Pvt. Ltd.
NABET Certificate No. and date NABET/EIA/1619/SA070, 23rd May, 2019