Embed Size (px)
Citation preview

1
EPWP presentation to 2010 National and Global Strategic Business
28th July 2010
1

2
Background to EPWP 2 • The first phase of the Expanded Public Works
Programme achieved its 1 million work opportunities targets a year ahead of schedule
• The second phase of the EPWP to scale up further to contribute significantly to halving unemployment by 2014
• Cabinet approved the high level proposals for EPWP 2 in June 08 and the Business Plan at the Lekgotla in January 2009
• R 4.1 billion was allocated over the 2009 MTEF to scale up the EPWP as incentive. In the 2010 MTEF, the incentive has been increased to 5.4 Billion.
• Agreement at the PCC for DPW to set targets for provinces and municipalities and for them to report DPW
• EPWP 2 implementation to started on 1 April 2009
2

3 3
To create 4.5 million work opportunities for poor and unemployed people in South Africa so as to contribute to halving unemployment by
2014, through the delivery of public and community services.
(Scale up from 210 000 FTE in Y1 to 610 000 FTE in Y5; Equivalent to 2 million Full Time Equivalents in 5 years )
EPWP to enable government to act as an employer of last resort as part of the Anti-
Poverty Strategy
Goal of EPWP Phase 2
1
3

4
Critical Success Factors for EPWP 2
• Make creation of paid work the primary objective of the programme (Employer of last resort)
• Locate clear political and administrative accountability for EPWP work creation targets across all spheres of government
• Align EPWP outputs with the core mandates and programmes of implementing public bodies
• Provide fiscal incentives to accelerate scaling up of EPWP outputs across all spheres of government
• Mobilise non-state capacity to deliver additional EPWP work opportunities
4

5
Funding for EPWP Projects • Funding for EPWP projects is through the line
budgets of Public bodies across all the sectors. • Funding for projects in the infrastructure sector is
mainly through the conditional infrastructure grants namely; Infrastructure Grant to Provinces (IGP) and Municipal Infrastructure Grant (MIG).
• Conditions attached to these conditional infrastructure grants require Provincial departments and Municipalities to implement certain projects labour-intensively in line with the EPWP guidelines.
• It is estimated that at least R 28 Billion of the IGP and MIG will be used to fund EPWP infrastructure projects in EPWP phase 2.
5
6
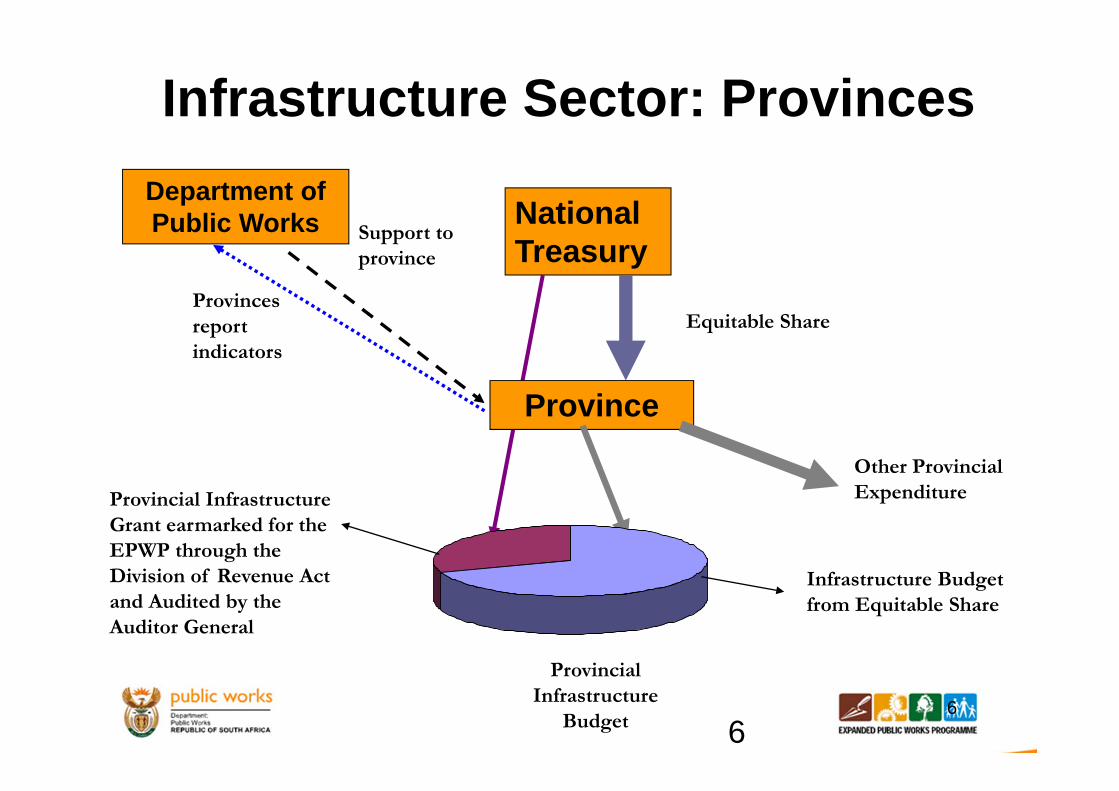
Infrastructure Sector: Provinces
National Treasury
Province
Provincial Infrastructure Grant earmarked for the EPWP through the Division of Revenue Act and Audited by the Auditor General
Provincial Infrastructure
Budget
Infrastructure Budget from Equitable Share
Equitable Share
Other Provincial Expenditure
Department of Public Works Support to
province
Provinces report indicators
6

7
Infrastructure Sector: Municipalities
National Treasury
Municipality
Municipal Infrastructure Grant earmarked for the EPWP through the Division of Revenue Act and Audited by the Auditor General
Municipal Infrastructure
Budget
Infrastructure Budget from Rates, levies and Taxes
Rates, Levies and Taxes
Other Provincial Expenditure
Public Works
Support COGTA
Reporting
7

8
1. Targets and Accountability across all spheres of Government Overall Phase 2 targets will be distributed across all
spheres of government and the five year period so that: Each public body has a clear target for each financial year It is clear which programmes/ activities of the public body are
expected to contribute to the target The targets are adjusted annually over the MTEF in line with
budgets available to and performance of each public body Targets are calculated by applying an employment factor in FTE/ R
million to grants received by public bodies
Respective political and administrative heads to be held accountable for achieving respective targets EPWP Unit to manage the setting, monitoring and feedback
process for performance in relation to all targets 8
Key Components of EPWP 2
8

9
Phase 2 targets in Full Time Equivalents broken down per sphere of government
Local Provincial National Non‐State Totals
2009‐2010 61 922 117 554 22 698 8 696 210 870
2010‐2011 74 371 136 630 28 999 20 870 260 670
2011‐2012 97 342 181 667 40 991 41 739 361 739
2012‐2013 125 853 243 527 56 272 76 522 502 174
2013‐2014 157 086 320 692 76 570 130 435 684 783
Totals 516 573 1 000 070 225 531 278 261 2 020 435
9

10
Phase 2 targets in 100-day work opportunities broken down per sphere of government
Local Provincial National Non‐State Totals
2009‐2010 182 607 247 325 100 068 20 000 550 000
2010‐2011 208 032 281 720 104 248 48 000 642 000
2011‐2012 267 920 370 420 133 660 96 000 868 000
2012‐2013 349 129 501 283 183 588 176 000 1 210,000
2013‐2014 440 721 659 286 249 994 300 000 1 650 000
Totals 1 448 409 2 060 034 771 557 640 000 4 920 000
9

11
Break down of Targets for EPWP phase 2 for different sectors ( work opportunities)
Year Infrastructure Environmental Social Non-state Total
09/10 300,000 150,000 80,000 20,000 550,000
10/11 342,000 156,000 96,000 48,000 642,000
11/12 440,000 200,000 132,000 96,000 868,000
12/13 572,000 275,000 187,000 176,000 1,210,000
13/14 720,000 375,000 255,000 300,000 1,650,000
Total 2,374,000 1,156,000 750,000 640,000 4,920,000
11

12
Break down of Targets for EPWP phase 2 for different sectors ( Full Time Equivalents)
Year Infrastructure Environmental Social Non-state Total
09/10 108,696 32,609 60,870 8,696 210,870
10/11 130,435 41,739 67,826 20,870 268,870
11/12 170,435 59,130 90,435 41,739 361,739
12/13 220,000 81,304 124,348 76,522 502,174
13/14 273,913 110,870 169,565 130,435 684,783
Total 903,478 325,652 513,043 278,261 2,020,435
11

13
2- EPWP Fiscal Incentive • The EPWP incentive is based on paying all public bodies that create
work above a minimum threshold for the EPWP target group an incentive of R50 per day for every day of work created.( Rural Municipalities do not have a minimum threshold). R60 per day to be paid in 10/11 for rural municipalities.
• R4.1 billion has been allocated to DPW over the 09/10 MTEF to pay out the incentive to public bodies and this is expected to grow to at least R 5 billion by 2014. R 5.4 billion has been allocated for the 10/11 MTEF.
• Eligible public bodies that want to participate in the incentive will enter into an agreement with DPW
• While indicative performance targets and incentive amounts are set for each eligible public body, they will only be able to claim the incentive upon proving that work has been created
• Basis for measuring EPWP performance – Number of FTE’s per million Rand of infrastructure budget, taking into
account the different portfolios of infrastructure and the rate at which each can contribute to employment creation
– Each public body must meet a minimum eligibility threshold before they can start accessing the incentive (Does not apply to rural municipalities).
– The incentive is not paid out for work created below the eligibility threshold, but is paid for all work created above this threshold
13

14
2- EPWP Fiscal Incentive • Eligibility: In order for provinces and municipalities to
become eligible for the incentive they must: • Report to DPW on the EPWP • Meet minimum employment creation targets based on their available budgets
• Agreements: Eligible public bodies will enter into agreements with DPW which will specify: • Targets to be met by the public body • Amounts that can be claimed by the public body for reported EPWP work
created • Reporting and verification and audit requirements through the EPWP
Management Information System • EPWP workers may not be paid less than R50 per day
• Appropriation of funds • Eligible public bodies should incorporate the incentive allocation into their
budgeting and planning proces but take into account that payment by DPW will occur quarterly, after employment has been created
14

15
2010 MTEF Allocations - Infrastructure Provinces • Overall performance improved, btw 2007/08 and 2008/09; but 3 provinces had
noticeable declines in performance • Provincial roads depts are the largest contributors in all the provinces and all receive
the largest share of the IGP, although this varies between 80.7% in EC to 42.5% in KZN. Based on 2008/09 performance, FS; LP & NW Transport are all well below average performance levels, but NC Transport just misses being eligible.
Province 2007/08 performance
(FTEs)
2008/09 performance
(FTEs)
% change in performance y‐
o‐y
2009/10 Allocation (3 installments)
2010/11 Allocation (3 installments)
Total year's 2010/11 Allocation
% increase y‐o‐y (3 installments)
% increase y‐o‐y
EC 7 660 10 359 35.20% 29 992 50 356 60 354 67.90% 101.23%FS 3 967 1 786 ‐55.98% 23 008 6 098 13 767 ‐73.50% ‐40.16%GP 348 4 374 1156.90% 500 38 988 39 154 7697.51% 7730.86%KZN 11 716 21 000 79.20% 84 180 141 410 169 470 67.98% 101.32%LP 1 335 759 ‐43.10% 500 2 736 2 903 447.16% 480.51%MP 1 407 2 189 55.60% 5 047 16 392 18 074 224.79% 258.12%NC 336 1 228 265.50% 500 1 000 1 167 100.00% 133.35%NW 1 388 699 ‐49.60% 7 192 500 2 897 ‐93.05% ‐59.72%WC 2 686 3 210 19.50% 500 23 052 23 218 4510.34% 4543.69%Total 29 076 45 604 56.80% 151 419 280 531 331 004 85.3% 118.6%*It should be noted that this is not the full allocation for 2010/11; this is merely a comparison of the estimate of 3 installments based on 2008/09 performance versus the same based on 2007/08 performance.
15

16
2.2 Fiscal incentive to Municipalities
• In order to cater for rural Municipalities in line with comments from the
Select Committee on Finance, the following considerations have been
considered:
- The FTE target for Metros per million rand of expenditure is 6,
different from 3 considered for other Municipalities.
- The FTE minimum threshold for Rural Municipalities = 0.
- Full incentive = ( FTE Target – FTE minimum threshold) X 230 X 50.
• DORA amount = 50% x Full incentive amount.
• The incentive amount to be paid for rural municipalities in the 10/11
financial year is R 60 per person day. R50 will still be paid for Metros
in the 10/11 financial year.
16

17
17 2010 MTEF Allocations - Infrastructure Municipalities • 2009/10 Allocation of R202m is only 2 disbursements in the national financial year VS • 2010/11 Allocation of R421m for the same period in the national financial year • 120 municipalities will be eligible to receive the incentive grant in 2010/11 and another 6 will
be receiving just the Q3&4 payment carried over from 2009/10 VS the 68 municipalities eligible in 2009/10, great improvement in the no. of munis reporting
• Of the 120 municipalities eligible in 2010/11, 66 municipalities receive a nominal allocation for 2010/11 (just over half).
Munis aggregate
d by province
EPWP Performance (in FTEs) 2007/08
Number of munis reportin
g 2007/08
Incentive Allocation in 2009/10 Allocation (30 Oct, 30
Jan)
EPWP Performance (in FTEs) 2008/09
% change in performanc
e y‐o‐y
Number of munis reporting by Q2
2009/10
Incentive Allocation in 2010/11 Allocation (30 Oct, 30
Jan)
% increase y‐o‐y (2
installments)
Total 2010/11 Incentive Allocation
% increase y‐o‐y
EC 8 766 12 53 559 5350 ‐38.97% 25 44 247 ‐17.39% 97 806 82.61% FS 2 002 4 9 073 3010 50.35% 10 22 327 146.08% 31 400 246.08% GP 12 980 5 34 881 34388 164.93% 10 130 167 273.17% 165 048 373.17% KZN 9 199 9 39 974 13323 44.83% 13 83 639 109.23% 123 613 209.23% LP 2 496 10 18 328 3344 33.97% 18 37 026 102.02% 55 355 202.02% MP 1 943 9 13 454 2107 8.44% 17 23 835 77.16% 37 288 177.15% NC 2 450 5 15 496 3845 56.94% 8 34 903 125.24% 50 399 225.24% NW 1 307 7 9 694 1982 51.64% 18 26 356 171.88% 36 049 271.87% WC 2 649 7 7 289 3905 47.41% 7 18 750 157.23% 26 038 257.22% Total 43 792 68 201 748 71 254 62.7% 126 421 250 108.8% 622 996 208.8%
17

18
2.2 Fiscal incentive to Municipalities cont’d • 68 Municipalities were eligible for the
incentive in the 09/10 financial year. These include 10 ISRDP nodes.
• Total incentive allocation to Municipalities is R 201.7 Million, of which R 147.2 Million will go to rural Municipalities and R 54.5 Million for Metros in the 09/10 financial year.
• 126 Municipalities are eligible for the incentive in the 10/11 financial year. The total allocations for municipalities is R 623 million for the 10/11 financial year.
18

19
2.3 Performance on the EPWP infrastructure Incentive after the 3rd quarter of the 09/10 financial year • 5 out of the 16 Provincial Departments have been paid incentive payments
totaling R 53,633 million considering 3rd quarter payment reports. Total
payment to Provincial departments considering payments in previous
quarters is R116.6 million out of an allocation of R 151.4 million (77% of
Provincial allocation).
• 47 of the 68 eligible municipalities have been paid their incentive payment of
R 78.6 million considering the 3rd quarter report of the 09/10 financial year.
Total incentive payment to municipalities after the 3rd quarter is R 114.17
million out an allocation of R 201.7 million ( 57% of Municipal allocation).
• Total incentive payment to Provincial Departments and Municipalities made
for the 09/10 financial year totals R 230.8 million, out of the total allocation of
• R 352.1 million, representing expenditure of 66% of the allocation for the
09/10 financial year. 19

20
Province Incentive allocation for the 09-10 financial year (R’000)
Incentive payment after 3rd quarter 09-10 (R’000)
Incentive payment for 3rd quarter 09-10 ( R’000)
Eastern Cape 29,992 17,457 15,381
Free State 23,008 0 0
Gauteng 500 0 0
KwaZulu-Natal 84,180 84,854 35,100
Limpopo 500 0 0
Mpumalanga 5,047 0 0
Northern Cape 500 0 0
North West 7,192 0 0
Western Cape 500 14,269 3,152 Total 151,419 116,581 53,633
Performance on the EPWP incentive grant by Provinces after 3rd Quarter 09/10 financial year
20

21
Province Incentive allocation for the 09-10 financial year (R’000)
Incentive payment after 3rd quarter 09-10 (R’000)
Incentive payment for 3rd quarter 09-10 (R’000)
Eastern Cape 53,559 7,818 3,905
Free State 9,073 1,956 1,047
Gauteng 34,881 59,875 51,038
KwaZulu-Natal 39,974 26,102 15,038
Limpopo 18,328 6,140 2,626
Mpumalanga 13,454 2,453 1,468
Northern Cape 15,496 5,769 960
North West 9,694 2,787 1,493
Western Cape 7,289 1,271 708 Total 201,748 114,170 78,644
Performance on the EPWP incentive grant by municipalities after 3rd Quarter 09/10 financial year
21

22
2.4 Performance on the EPWP infrastructure Incentive after the 4th quarter of the 09/10 financial year
• 8 out of the 16 Provincial Departments will be paid incentive payments totaling R
54.551 million considering EPWP 4th quarter report for the 09/10 financial year . Total
payment to Provincial departments considering payments in previous quarters is
R171.132 million out of the full incentive allocation of R 201.892 million for 09/10
reporting ( 85% of the full allocation). This payment includes 4th quarter payment paid in
the 10/11 financial year.
• 36 out of the 68 of the eligible municipalities will receive a total incentive payment of
R93.463 million considering the 4th quarter report for the 09/10 financial year.
• Considering the 4th quarter report ( 3rd quarter for municipalities) 56 of the eligible 68
municipalities will have accessed R 207.61 million out of the available R 302.383 million
available in the 09/10 municipal financial year ( 69% of the allocation for the municipal
financial year). This is comparable to the 75% of allocation expected to be paid after 3
of the 4 quarters in the municipal financial year. 22

23
Province Full Incentive allocation for the 09-10 reporting including 4th quarter payment in 10/11 (R’000)
Incentive payment after 4th quarter 09-10 (R’000)
Incentive payment for 4th quarter 09-10 ( R’000)
Percentage of 09/10 full incentive paid (%)
Eastern Cape 39,989 34,789 17,332 87
Free State 30,678 0 0 0
Gauteng 667 2,498 2,498 375
KwaZulu-Natal 112,240 115,259 30,269 103
Limpopo 667 2,617 2,617 393
Mpumalanga 6,730 0 0 0
Northern Cape 667 0 0 0
North West 9,589 0 0 0
Western Cape 667 15,969 1,700 2395
Total 201,892 171,132 54,551 85
Performance on the EPWP incentive grant by Provinces after 4th quarter 09/10 reporting
23

24
Province Incentive allocation considering 09/10 municipal financial year (R’000)
Incentive payment after 4th quarter 09-10 (R’000)
Incentive payment for 4th quarter 09-10 ( R’000)
Percentage of 09/10 full incentive paid (%)
Eastern Cape 80,339 16,778 8,961 21
Free State 13,609 2,093 137 15
Gauteng 52,077 99,081 39,208 190
KwaZulu-Natal 59,962 50,572 24,469 84
Limpopo 27,495 17,358 11,240 63
Mpumalanga 20,181 247 34 12
Northern Cape 23,244 5,801 32 25
North West 14,541 11,581 8,797 80
Western Cape 10,934 1,855 584 17
Total 302,383 207,610 93,463 69
Performance on the EPWP incentive grant by Municipalities after 4th quarter 09/10 reporting ( 3rd quarter 09/10 for municipalities)
24

25
• The EPWP incentive grant is beginning to have the intended performance of encouraging Public bodies to exceed their Full Time Equivalent ( FTE) work opportunity targets. Provincial Departments in KZN, GP, WC and EC have exceeded their targets and have paid extra incentive amounts.
• 11 of the 68 eligible municipalities in GP,KZN, LP, NW and WC have already exceeded their FTE targets by the 4th quarter of reporting ( 3rd quarter of municipalities) for 09/10.
• The number of Municipalities that will access the incentive will increase to 126 municipalities in the 10/11 financial year from the 68 municipalities in the 09/10 financial year.
25

26
3- Non-State Sector • Phase 2 of the EPWP will also see the introduction of the “Non-State”
sector of the EPWP • In this sector, the wage incentive will also be provided to Non-State
bodies like NGO’s, CBO’s and other non-profit organisations whose activities also create work for the EPWP target group
• R80 million of the wage incentive was allocated to the non state sector for 2009-10
• The sector is projected to grow rapidly as many existing non-state programmes have the potential to grow rapidly through the injection of the wage incentive
• The Non-State Sector will be managed by DPW with oversight from other key departments, but will be implemented with the assistance of an intermediary
• Two sets of programmes will be implemented: – Area based: These will include programmes within a specific area that will
generally involve a large range of activities as identified in consultation with the community and local government
– Activity based: These will include programmes by non-state actors that have specific focus areas such as health care, child care, community safety etc
26

27
4- Technical Support • The EPWP unit, in cooperation with the Sector lead departments and the
provincial coordinating departments will increase capacity to provide technical support to those public bodies that require it
• Public bodies who are not able to meet targets or meet all specified requirements should request technical support
• Areas in which technical support will be provided are: – Developing plans to meet targets
– Identifying suitable projects and programmes
– Design of projects and programmes
– Implementation support
– Reporting
• In addition to the EPWP Unit, the Technical Assistance Unit in National Treasury will also be able to support public bodies
• Support programmes for the Environmental and Social Sector are being reviewed and strengthened
27

28
Q4: Work opportunities per sector and province (Overall) (1 April – 31 March 10)
Province Environment & Culture Infrastructure Non-state Social TOTAL
EC 13,742 47,812 21,410 16,969 99,933
FS 5,194 10,912 7,709 14,652 38,467
GP 18,337 66,782 2,909 20,373 108,401
KZN 26,547 75,288 6,674 63,771 172,280
LP 6,854 14,288 4,487 27,952 53,581
MP 3,551 7,967 10,765 21,266 43,549
NC 4,483 10,252 995 6,937 22,667
NW 3,815 12,562 2,272 18,962 37,611
WC 13,419 17,594 2,818 15,539 49,370
TOTAL 95,942 263,457 60,039 206,421 625,859
28
29
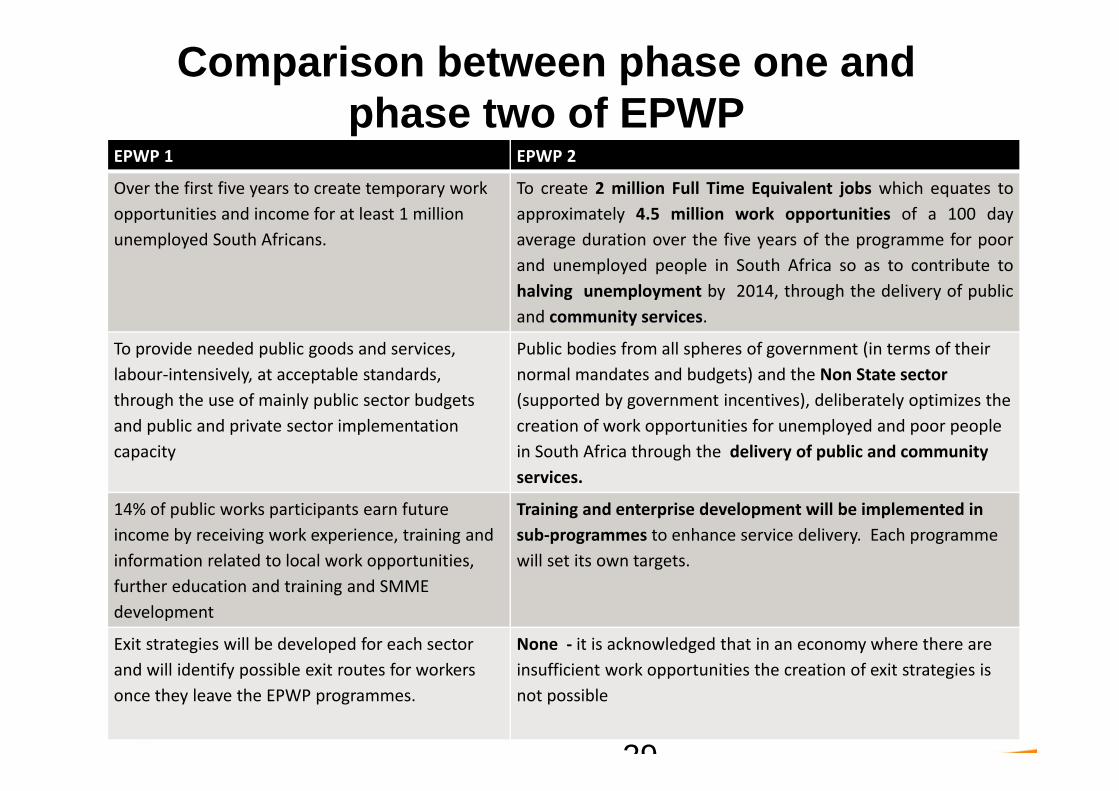
Comparison between phase one and phase two of EPWP
EPWP 1 EPWP 2
Over the first five years to create temporary work opportunities and income for at least 1 million unemployed South Africans.
To create 2 million Full Time Equivalent jobs which equates to approximately 4.5 million work opportunities of a 100 day average duration over the five years of the programme for poor and unemployed people in South Africa so as to contribute to halving unemployment by 2014, through the delivery of public and community services.
To provide needed public goods and services, labour‐intensively, at acceptable standards, through the use of mainly public sector budgets and public and private sector implementation capacity
Public bodies from all spheres of government (in terms of their normal mandates and budgets) and the Non State sector (supported by government incentives), deliberately optimizes the creation of work opportunities for unemployed and poor people in South Africa through the delivery of public and community services.
14% of public works participants earn future income by receiving work experience, training and information related to local work opportunities, further education and training and SMME development
Training and enterprise development will be implemented in sub‐programmes to enhance service delivery. Each programme will set its own targets.
Exit strategies will be developed for each sector and will identify possible exit routes for workers once they leave the EPWP programmes.
None ‐ it is acknowledged that in an economy where there are insufficient work opportunities the creation of exit strategies is not possible
29
30
Conclusions • Investment in infrastructure provision coupled
with the use of labour-intensive methods of constructions promotes the creation of work opportunities contributing towards poverty alleviation as evidenced by EPWP.
• Partnerships between Government and Non-state actors like NGOs can lead to job creation and should be promoted.
30