Embed Size (px)
Citation preview

EPUNet Conference EPUNet Conference Barcelona, 8-9 May 2006Barcelona, 8-9 May 2006

Unemployment risks in four Unemployment risks in four European countriesEuropean countries
Antonio Schizzerotto & Mario LucchiniAntonio Schizzerotto & Mario Lucchini University of Milano BicoccaUniversity of Milano Bicocca
ItalyItaly
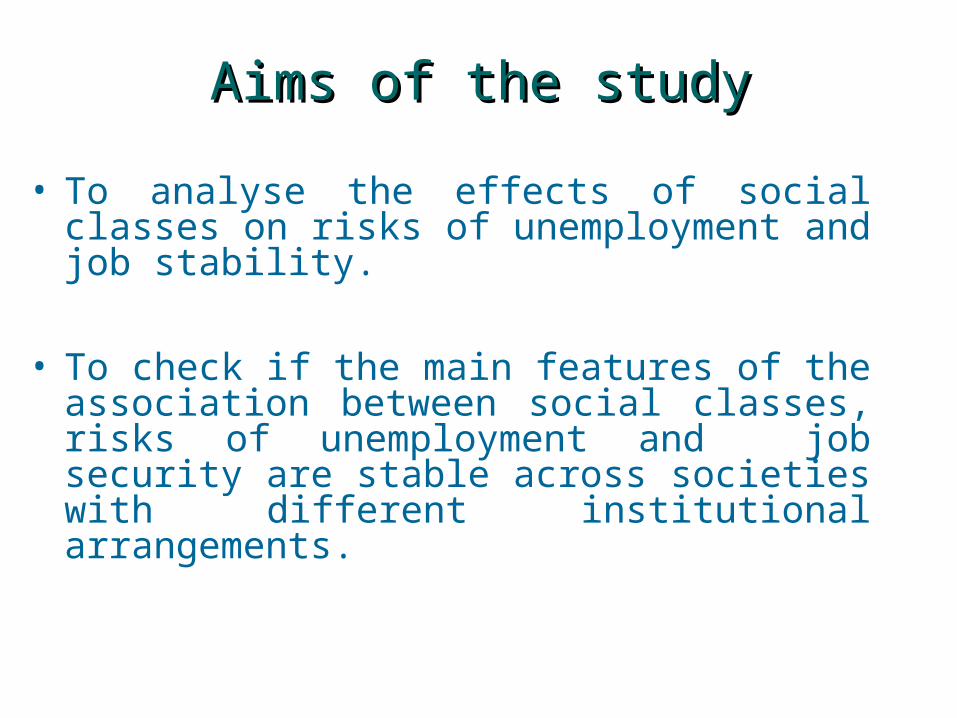
Aims of the studyAims of the study
• To analyse the effects of social classes on risks of unemployment and job stability.
• To check if the main features of the association between social classes, risks of unemployment and job security are stable across societies with different institutional arrangements.

Four EU countriesFour EU countries• Denmark, as representative of countries
where the State plays an important role in the functioning of the whole society.
• Austria and Italy, as representatives of countries where family has a crucial position in the institutional arrangements of the society.
• United Kingdom, as representative of countries that attribute great importance to the market in the workings of the society.
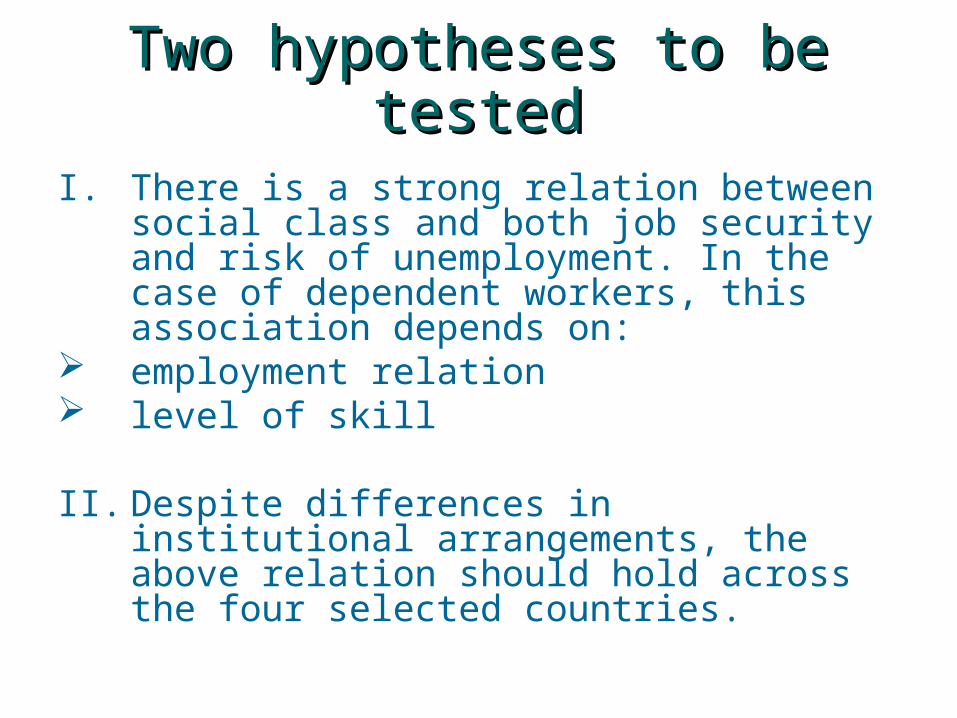
Two hypotheses to be Two hypotheses to be testedtested
I. There is a strong relation between social class and both job security and risk of unemployment. In the case of dependent workers, this association depends on:
employment relation level of skill
II. Despite differences in institutional arrangements, the above relation should hold across the four selected countries.
DataData
European Community Households Panel, eight waves (Jan 1994-Dec 2001): information regarding employment and unemployment episodes.

Methods used for the estimation of Methods used for the estimation of unemployment risks.unemployment risks.
• Model: to estimate unemployment risks, we specified a random-coefficient Poisson regression model. The dependent variable in this model is the incidence rate ratio of being unemployed. Covariates as class and level of education were considered as causal variables.
Class structure was represented using a recently developed nine-fold class scheme known as ESeC (European Socio-economic Classification)
Education was used as coded in ECHP, according to ISCED scheme.
We also controlled for civil status, gender, period effects, age, health condition, public/private sector of activity.

The ESeC class schemaThe ESeC class schema• The ESeC (European Socio-economic
Classification) is based on a widely-used social class schema devised by John Goldthorpe and Robert Erikson, known as the EGP schema.
• It enucleates nine socio-economic classes, resulting from the combination of the following factors:
Occupation, coded according to Isco88(com) classification;
Employment status, used to distinguish between employers, the self-employed, managers, supervisors and employees;
Size of organization, used to distinguish between large and small employers.

The ESeC classesThe ESeC classes• Class 1: Large employers, higher grade professional,
administrative and managerial occupations: ‘higher professionals and managers’;
• Class 2: Lower grade professional, administrative and managerial occupations: higher grade supervisory and technician occupations: ‘lower professionals and managers’;
• Class 3: Intermediate occupations: ‘higher clerical, services and sales workers’;
• Classes 4 and 5: Small employers and self-employed in non-professional occupations: ‘small employers and self-employed’ (4) and ‘farmers’ (5);
• Class 6: Lower supervisory and lower technician occupations: ‘lower supervisors and technicians’;
• Class 7: Lower clerical, services and sales occupations: ‘lower clerical, services and sales workers’;
• Class 8: Lower technical occupations: ‘skilled workers’;• Class 9: Routine occupations: ‘semi- and unskilled
workers’.
The random-coefficient The random-coefficient Poisson regression modelPoisson regression model
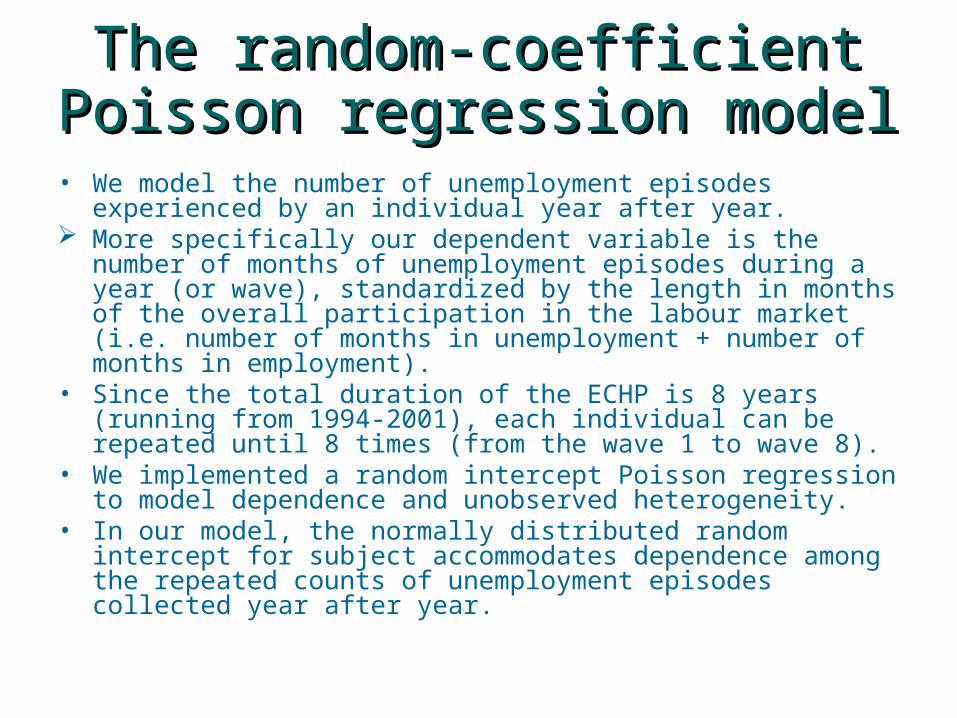
• We model the number of unemployment episodes experienced by an individual year after year.
More specifically our dependent variable is the number of months of unemployment episodes during a year (or wave), standardized by the length in months of the overall participation in the labour market (i.e. number of months in unemployment + number of months in employment).
• Since the total duration of the ECHP is 8 years (running from 1994-2001), each individual can be repeated until 8 times (from the wave 1 to wave 8).
• We implemented a random intercept Poisson regression to model dependence and unobserved heterogeneity.
• In our model, the normally distributed random intercept for subject accommodates dependence among the repeated counts of unemployment episodes collected year after year.

Methods to estimate Methods to estimate unemployment risks.unemployment risks.
• Model: to estimate unemployment risks, we specified a random-coefficient Poisson regression model. The dependent variable in this model is the incidence rate ratio of being unemployed.
• Class and education were considered as independent, causal variables.
Class structure was represented using a recently developed nine-fold class scheme known as ESeC (European Socio-economic Classification)
Education was used as coded in ECHP, according to ISCED scheme.
civil status, gender, ECHP waves (assumed as expressing period effects), age, health condition, public/private sector of activity are treated as control variables

Methods used for the estimation Methods used for the estimation of job stability.of job stability.
To estimate job stability we carried out an event history analysis in order to compute the survival function of each class in each country.
Results of the estimation of Results of the estimation of unemployment risks through a unemployment risks through a
random-coefficient Poisson random-coefficient Poisson regression model. regression model.
Denmark, Italy, Austria and Denmark, Italy, Austria and United Kingdom-ECHP, 1994-United Kingdom-ECHP, 1994-
2001. 2001.

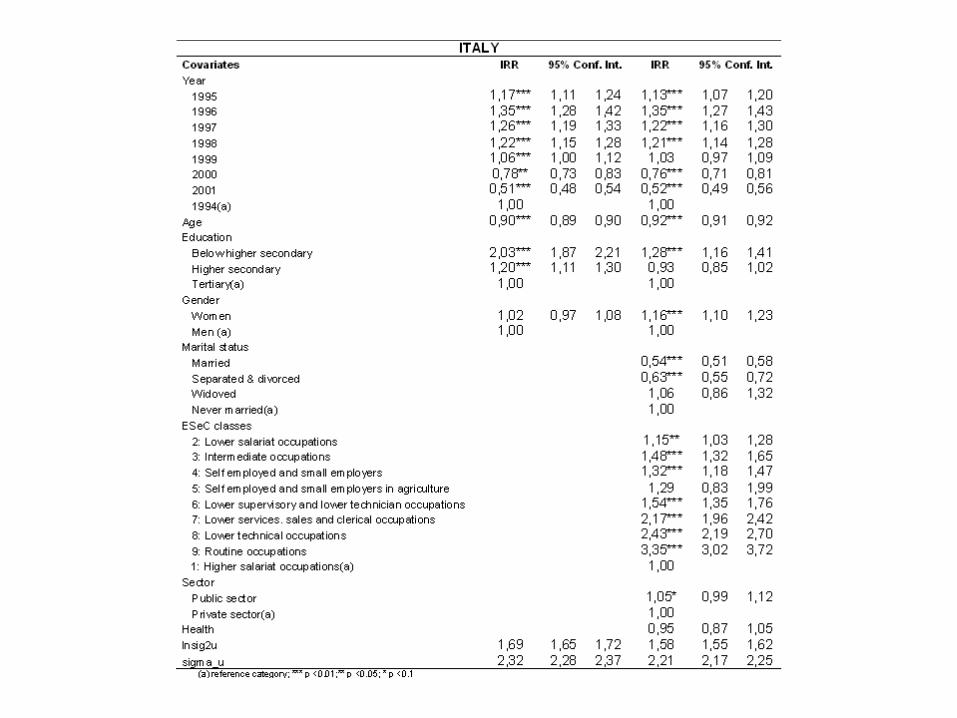


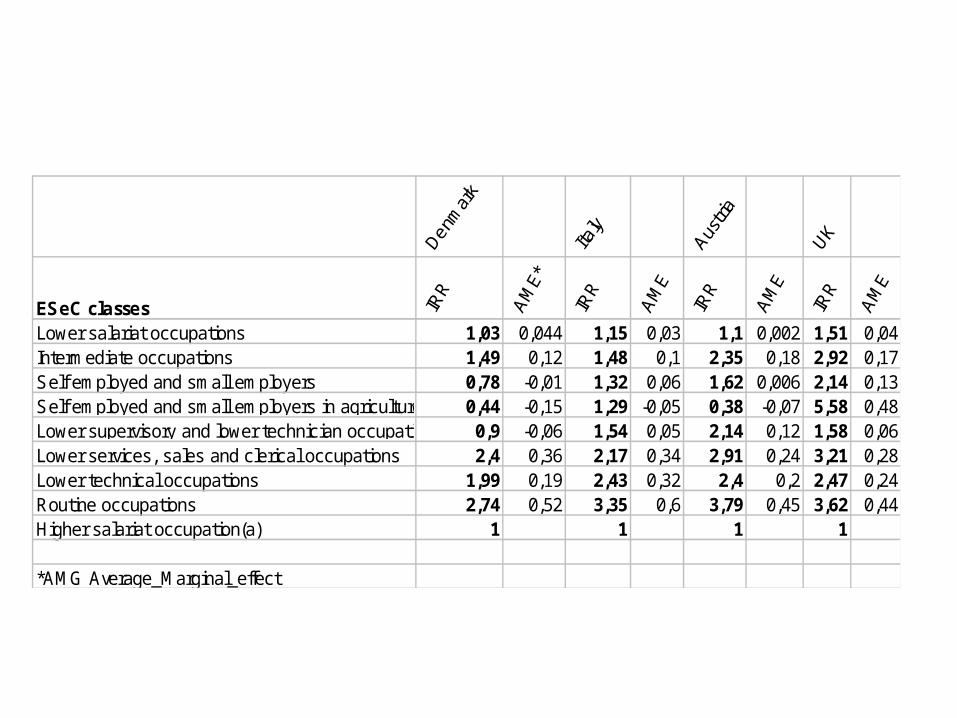
ESeC classesLower salariat occupations 1,03 0,044 1,15 0,03 1,1 0,002 1,51 0,04Intermediate occupations 1,49 0,12 1,48 0,1 2,35 0,18 2,92 0,17Self employed and small employers 0,78 -0,01 1,32 0,06 1,62 0,006 2,14 0,13Self employed and small employers in agriculture 0,44 -0,15 1,29 -0,05 0,38 -0,07 5,58 0,48Lower supervisory and lower technician occupations 0,9 -0,06 1,54 0,05 2,14 0,12 1,58 0,06Lower services, sales and clerical occupations 2,4 0,36 2,17 0,34 2,91 0,24 3,21 0,28Lower technical occupations 1,99 0,19 2,43 0,32 2,4 0,2 2,47 0,24Routine occupations 2,74 0,52 3,35 0,6 3,79 0,45 3,62 0,44Higher salariat occupation(a) 1 1 1 1
*AMG Average_Marginal_effect

-0,2
-0,1
0
0,1
0,2
0,3
0,4
0,5
0,6
0,7
Denmark Italy Austria UK
Lower salariat occupationsIntermediate occupationsSelf employed and small employersSelf employed and small employers in agricultureLower supervisory and lower technician occupationsLower services, sales and clerical occupationsLower technical occupationsRoutine occupations
Average Marginal Effects

ESeC classes and the ESeC classes and the duration of employment duration of employment
episodesepisodes
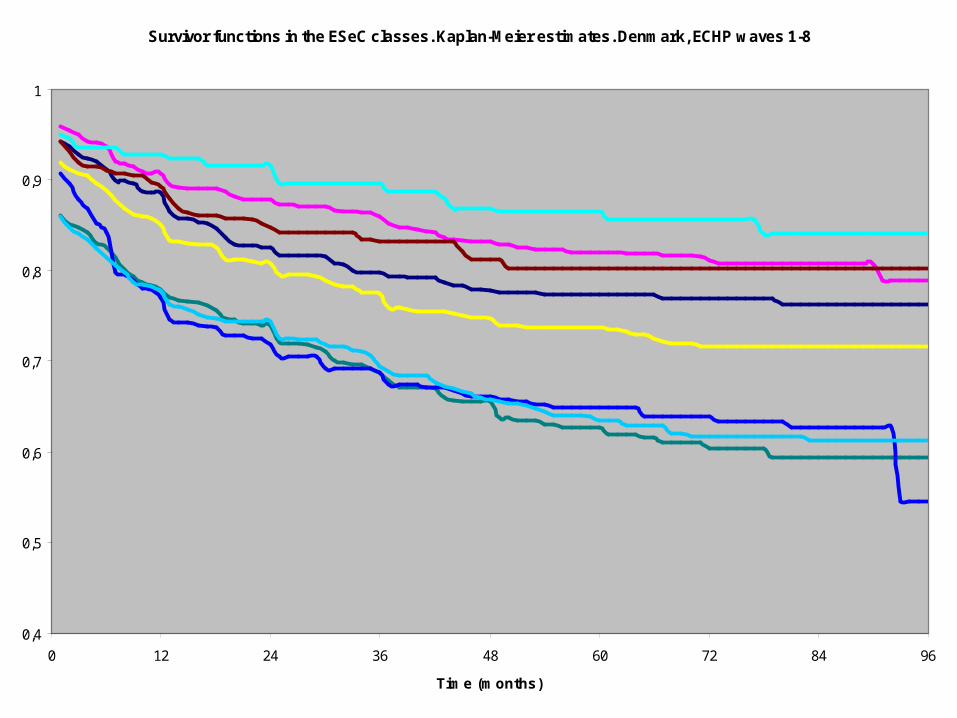
Survivor functions in the ESeC classes. Kaplan-Meier estimates. Denmark, ECHP waves 1-8
0,4
0,5
0,6
0,7
0,8
0,9
1
0 12 24 36 48 60 72 84 96
Time (months)
ESeC 1
ESeC 9
ESeC 8
ESeC 7
ESeC 6 ESeC 4
ESeC 3
ESeC 2

Survivor functions in the ESeC classes. Kaplan-Meier estimates. Italy, ECHP waves 1-8
0,4
0,5
0,6
0,7
0,8
0,9
1
0 12 24 36 48 60 72 84 96
Time (months)
ESeC 1
ESeC 9
ESeC 8
ESeC 7
ESeC 6
ESeC 5
ESeC 4
ESeC 3
ESeC 2

Survivor functions in the ESeC classes. Kaplan-Meier estimates. Austria, ECHP waves 2-8
0,4
0,5
0,6
0,7
0,8
0,9
1
0 12 24 36 48 60 72 84
Time (months)
ESeC 1
ESeC 6
ESeC 5
ESeC 9
ESeC 8
ESeC 7
ESeC 4
ESeC 3
ESeC 2
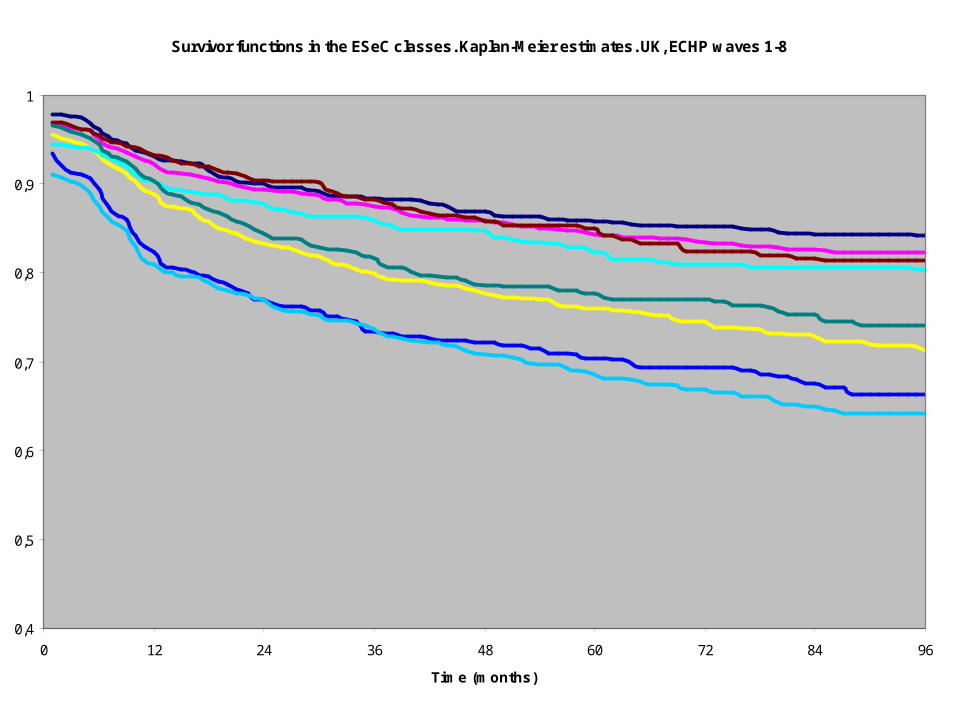
Survivor functions in the ESeC classes. Kaplan-Meier estimates. UK, ECHP waves 1-8
0,4
0,5
0,6
0,7
0,8
0,9
1
0 12 24 36 48 60 72 84 96
Time (months)
ESeC 1
ESeC 9
ESeC 8
ESeC 7
ESeC 6
ESeC 4
ESeC 3
ESeC 2

Conclusive remarks Conclusive remarks • Education displays a protective effect
against the risk of unemployment also in the UK. UK is a partial ecception but even there tertiary education shows this protective effect.
• Class exerts a quite strong effect on the risk of unemployment; generally speaking, members of classes based on service employment relations are less likely to experience an unemployment spell than people belonging to classes based on labour contract.
Yet between classes based on labour contract some differences can be observed.
•Namely, the risk of unemployment varies according to the level of technical skills: the higher the technical expertise, the lower the risk of unemployment.
•Sometimes, the protective effect of technical skills overcomes the effect of the employment relations.

Moving from incidence rate ratios of unemployment to job stability it can be seen that, by and large, occupational classes based on a service employment relationship display longer duration of employment episodes.