Embed Size (px)
Citation preview
Experimental Study and Numerical Simulation of the Progressive Collapse
Resistance of Single-layer Latticed Domes
Ying Xu, Ph.D.1; Qinghua Han, Ph.D.2 G. A. R. Parke3 and Yi-ming Liu4
Abstract: Progressive collapse accidents of single-layer latticed domes seriously
threatened public safety and social security. The structural integrity and progressive
collapse-resisting capacity are gradually becoming an essential requirement in
structural design. The K8-lamella and Geodesic single-layer latticed domes are typical
latticed domes used in large-scale public facilities. In this paper, the experimental
study and a FE analysis were carried out to acquire the mechanism of internal force
redistribution in the progressive collapse of the domes. Three effective methods to
evaluate the progressive collapse resistance of single-layer latticed domes, as well as
the critical displacement were presented and verified. The results indicate that both
the Kiewitt-lamella dome and the Geodesic dome exhibited the snap-through collapse
mode in the experiments. The collapse of the Kiewitt-lamella dome was induced by
the unexpected local instability around the initial failure members, while that of the
Geodesic dome was a result of the rapid change in nodal displacement and the sharp
decline of the structural stiffness.
Keywords:Single-layer latticed dome; Experimental study; Numerical simulation;
1Post Doctor, State Key Laboratory of Hydraulic Engineering Simulation and Safety, School of Civil Engineering, Tianjin University, Tianjin 300350, China. E-mail: [email protected], Key Laboratory of Coast Civil Structure Safety of China Ministry of Education, School of Civil Engineering,Tianjin University, Tianjin 300350, China. (Corresponding author) E-mail: [email protected], Dept. of Civil and Environmental Engineering, Univ. of Surrey, Guildford, Surrey GU2 5XH, U.K. E-mail: [email protected] Candidate, School of Civil Engineering,Tianjin University, Tianjin 300350, China. E-mail: [email protected]
1
2
3
4
5
6
7
8
9
10
11
12
13
14
15
16
17
18
19
123456789

Sensitivity analysis; Progressive collapse; Failure mechanism.
Introduction
Progressive collapse is the spread of an initial local failure from element to element,
eventually resulting in the collapse of an entire structure or a disproportionately large
part of it. In recent years, some serious structural progressive collapse accidents were
reported (Mlakar et al. 2002; Pearson and Delatte 2005; Osteraas 2006; Palmisano et
al. 2007), caused by earthquake disasters, extreme weather or terrorist attacks. As a
result, comprehensive studies have been conducted to investigate the progressive
collapse-resisting capacity of these structures. Currently, most research and design
codes are focused on frame structures (Kaewkulchai and Williamson 2006;
Khandelwal et al. 2008; Kim et al. 2009; Szyniszewski and Krauthammer 2012; GSA
2003; DoD 2009; Mohamed 2006). Nevertheless, progressive collapse studies on
space structures are relatively few. The main reasons for this situation are:1) the most
frequently reported collapsed buildings are frame structures; and 2) space structures
are intuitively considered to have a large number of redundant members and excellent
force redistribution ability. However, it was demonstrated that the failure of some
critical members may also lead to the progressive collapse of space structures
(Downey 2005; Piroglu and Ozakgul 2016). Since space structures usually serve as
public facilities, the collapse-resisting capacities are directly related to the public
safety and social security. Consequently,there is an urgent demand for further studies
on the progressive collapse mechanism of space structures.
20
21
22
23
24
25
26
27
28
29
30
31
32
33
34
35
36
37
38
39
40
So far, research on the progressive collapse resistance of planar trusses (Blandford
1997; Jiang and Chen 2012; Shu and Yu 2015; Zhao et al. 2017), space trusses
(Murtha-Smith 1988; El-Sheikh 1997; Sebastian 2004), and tensegrity systems (Abedi
and Shekastehband 2009; Shekastehband et al. 2011) have been reported by means of
numerical simulations and experimental studies based on the Alternate Load Path
Method (ALP). ALP is the most popular progressive collapse analysis method to
obtain the load transfer path and the internal force redistribution mechanism exhibited
by the structures after the initial member failure. As for the latticed domes, the
dynamic propagation of local snap-through in single-layer braced domes was
discussed by Abedi and Parke (1996). The redundancy and progressive collapse
performance of large-span latticed domes were evaluated based on the ultimate
bearing capacities in both the original and damaged status (Han et al. 2015).
Furthermore, progressive collapse tests of two single-layer latticed Kiewitt domes
were conducted by Zhao et al. (2017), and a totally snap-through collapse was
detected in the experiment. However, to the best of our knowledge, there is still no
determined criterion for the progressive collapse of space structures, either based on
the displacement responses of nodes or the stiffness reduction rates of the structures.
It is worth mentioning that, initial local buckling (buckling of members or nodes)
is one of the most important initiations of the progressive collapse of latticed domes.
For intermediate depth single-layer domes (1/7<h/L<1/4), the progressive collapse
could be initiated by either nodal snap-through buckling or member buckling (Hanaor
1995). The multi-beam method was used to simulate the initial curvature of members,
41
42
43
44
45
46
47
48
49
50
51
52
53
54
55
56
57
58
59
60
61
62

so as to investigate the elasto-plastic stability of reticulated domes by Fan et al.
(2012). To evaluate the progressive collapse resistance of latticed domes, a
redundancy evaluation method based on sensitivity analysis was proposed by Pandey
and Barai (1997). After this, the Japanese Society of Steel Construction (JSSC) and
the Council on Tall Buildings and Urban Habitat (CTBUH) (2005) further presented
the redundancy evaluation method considering the buckling of a single member. It is
worth mentioning that, the sensitivity indices based on the internal force responses of
members should be proposed to determine the critical members in the structure, which
play an important role in evaluating structural safety and reliability (Murtha-Smith
1988; Sebastian 2004; Chen et al. 2015).
Meanwhile, the progressive collapse of latticed domes is typically caused by the
dynamic snap-through instead of a strength failure. As a result, the progressive
collapse resistance of the latticed domes are closely related to the level of geometric
imperfections and the overall buckling behavior of structures. Buckling analysis
should be performed first to acquire the elastic limit of displacements and the stability
bearing capacities of the latticed domes before the progressive collapse analysis.
Aiming at this issue, a group-theoretical method was proposed to investigate the
elastic buckling behavior of prestressed space structures (Chen and Feng, 2015). The
effects of geometric imperfections on the nonlinear buckling behavior of single-layer
lattice domes were evaluated by an alternative reduced-stiffness analytical procedure
(Yamada et al. 2001).
In this paper, the experimental studies and Finite Element (FE) analysis on the
63
64
65
66
67
68
69
70
71
72
73
74
75
76
77
78
79
80
81
82
83
84
progressive resistance of a single-layer Kiewitt-lamella dome and a Geodesic dome
were carried out, respectively. Three methods were used to evaluate the progressive
collapse resistance of single-layer latticed domes, as well as the criterion based on the
maximum displacement responses were proposed and verified. The mechanism of
internal force redistribution and the subsequent failure process of two kinds of latticed
domes were revealed by using the ALP analysis method.
Background
Sensitivity Index Based on the Stress Responses
For space structures, there is no codified guideline for the selection of sensitive
members in the progressive collapse analysis. To solve this problem, a sensitive index
Sij based on the stress responses of members was proposed by Cai et al. (2012). Sij is
the sensitivity index of member i corresponding to the initial failure of member j,
which could be expressed as
Sij=(σ '−σ )/σ (1)
Whereσ and σ 'are the stress responses of member i in the original structure and the
damaged structure, respectively.
As described by Zhao et al., the load-resistance redundancy of a single-layer
latticed dome is of crucial important in resisting progressive collapse. In the
subsequent failure process of latticed domes, the actual failure sequence is closely
related to the stress ratios of the members. Under lower loading levels, the average
stress ratio of members is relatively small. Even if a local failure may cause a large
85
86
87
88
89
90
91
92
93
94
95
96
97
98
99
100
101
102
103
104
105

stress variation of the surrounding members, a local internal force redistribution could
be achieved and the whole structure will regain a balanced state. To accurately
evaluate the sensitivity index of members under different loading levels, the stress
ratios of the members must be considered. The improved sensitivity index (Xu et al.
2016) could be expressed as
Sij=(σ '−σ )/(σ 0−σ ) (2)
Whereσ 0is the allowable stress of member i, which could be further expressed as
{σ0=σ t ,if σ ' ≥ 0σ0=σc ,if σ '<0
(3)
σ t∧σc are the yield stress and the buckling stress of member i, respectively.
WhenSij<0, the stress of member i in the damaged structure is less than that in the
original structure; when 0≤ S ij<1, the stress in member i will increase after the
removal of member j; when Sijachieve the maximum value 1, member i will reach the
allowable stress, and subsequent member failure may occur in the structure. It is
worth mentioning that, in this situation, member j is defined as the sensitive member
of the structure.
Based on the above sensitivity index, the sensitive members can be identified for
further progressive collapse analysis. Furthermore, the buckling of a single member
could be considered in the sensitivity analysis as well.
Important Coefficient
After the sensitivity index of each member is achieved, the average sensitivity index
of all the members in the remaining structure could be acquired, which is defined as
106
107
108
109
110
111
112
113
114
115
116
117
118
119
120
121
122
123
124
125
126

the important coefficientα js ( Xu et al . 2016 ).
α js=∑
i=1 ,i ≠ j
n
⟨ S ij ⟩(n−1)
(4)
Where n is the total number of structural members; ⟨ S ij ⟩=S ij, whenSij≥ 0, ⟨ S ij ⟩=0,
whenSij<0. The important coefficient α jscould be used for evaluating the progressive
collapse resistance of the remaining structure.
Criterion for the progressive collapse
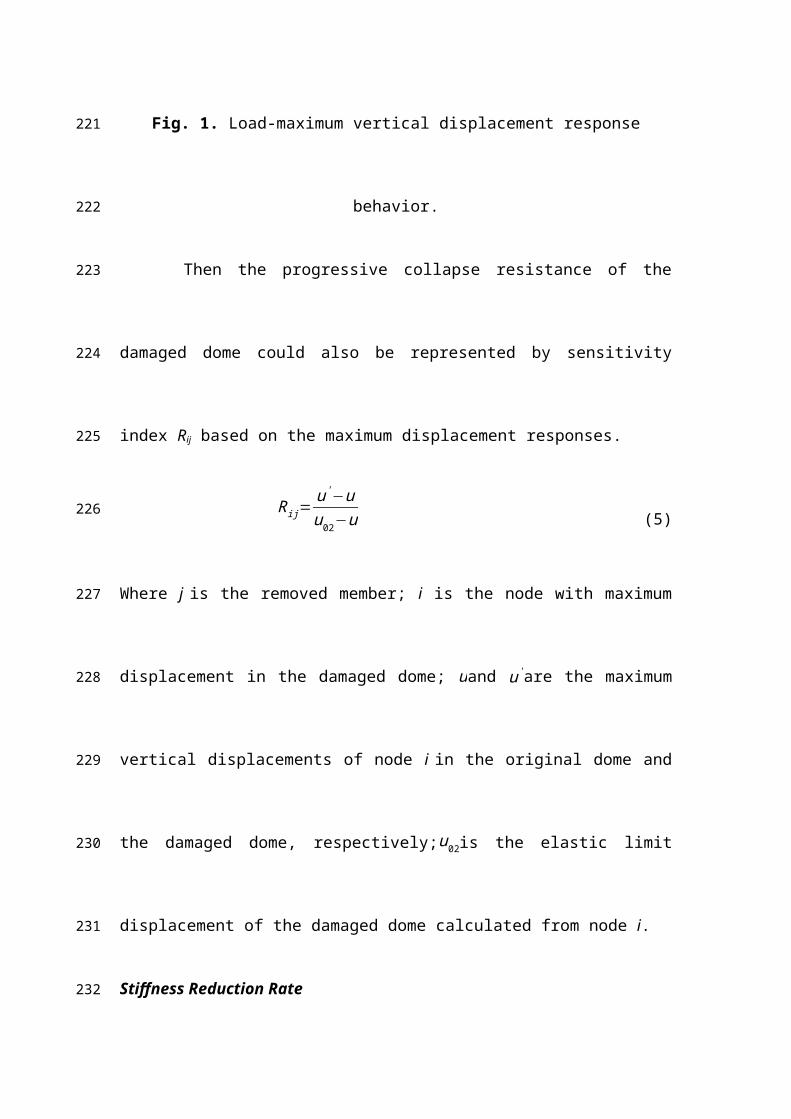
In this paper, the criterion for progressive collapse is established based on the
maximum displacement response in the damaged dome. The elastic limit
displacement u02 corresponding to the stable allowable bearing capacityqk 2was
determined as the critical displacement for progressive collapse.
Therefore, elastic-plastic buckling analysis should be performed first to acquire the
elastic limit displacement and the stability bearing capacity of the damaged dome. The
typical load-vertical displacement curves of single-layer latticed domes are shown in
Fig.1a, and Fig.1b is the partial enlarged view. The consistent mode imperfection
method was adopted. Normally, the stability ultimate bearing capacity of the damaged
dome qu 2 is less than that of the perfect original domequ 1. The maximum vertical
displacement corresponding to the stability ultimate bearing capacityqu 2is defined as
uu 2. The maximum vertical displacement corresponding to the stability allowable
bearing capacityqk 2is defined asu02. According to JGJ 7-2010,qu2=K ∙qk 2, where K is
127
128
129
130
131
132
133
134
135
136
137
138
139
140
141
142
143
144
145

the safety factor. For elastic-plastic buckling analysis, K=2.
Damaged dome Original dome
0 10 20 30 40 50 600
1
2
3
4
5
(u01
, qk1
)
(uu1 , qu1)
(u02 , qk2 )
(uu2 , qu2 )
Load
Maximum vertical displacement
Damaged dome Original dome
0 10 20 300
1
2
3
u'02 u02
K'
q
qk1
qk2
u01 u02
(u01
, qk1
)
(u02
, qk2
)Load
K0
Maximum vertical displacement
(a) (b)Fig. 1. Load-maximum vertical displacement response behavior.
Then the progressive collapse resistance of the damaged dome could also be
represented by sensitivity index Rij based on the maximum displacement responses.
Rij=u'−uu02−u
(5)
Where j is the removed member; i is the node with maximum displacement in the
damaged dome; uand u'are the maximum vertical displacements of node i in the
original dome and the damaged dome, respectively;u02is the elastic limit displacement
of the damaged dome calculated from node i.
Stiffness Reduction Rate
It is worth mentioning that the stiffness reduction rate C could also be used to
represent the progressive collapse resistance of the damaged dome, which is also a
global index factor. Assume that the mass of the removed member can be ignored
compared with the total mass of the structure, then the stiffness of the dome will be
proportional to the square of the natural frequency. The stiffness reduction rate Cof
the damaged dome could be expressed as:
146
147148149
150
151
152
153
154
155
156
157
158
159
160
161
162
163

C= K0−K '
K0 =ω0
2−ω'2
ω02 (6)
WhereK0andK 'are the stiffness, and ω0and ω ' are the natural frequencies of the
original dome and the damaged dome, respectively.
Experimental Program
The Test Model
The test models of the K8-lamella latticed dome and the Geodesic latticed dome
configurations are shown in Figs. 2a and b, respectively. Sectors A and B are the
representative sectors in the domes. As shown in Fig.2c, the joint load was applied by
means of weights. The diameter of the test models was 4.0 m, and the rise-to-span
ratio was 1/5. All the members and joints are made from aluminum alloy grade 5052.
The tubular cross-section of the ribs and the rings was Φ9×1.5(mm) and the tubular
section of the diagonals was Φ8×1.5(mm). The diameter of the ball joints was 50mm
and the thickness was 2.5mm. All edge joints were designed as supporting joints,
fixed on to H-shape steel ring beams. The steel ring beams were supported by steel
tubular columns with a length of 600 mm and a cross-section of Φ70×3 (mm), which
were firmly anchored to the ground.
164
165
166
167
168
169
170
171
172
173
174
175
176
177
178
179

(a) (b)180
181

(c)Fig. 2. Test model layout: (a) Kiewitt-lamella latticed dome; (b) Geodesic latticed
dome; (c) detail of the loading device.
Mechanical Properties of Aluminum Tubes and Joints
The mechanical properties of the aluminum tubes were measured using a universal
testing machine. Three specimens were tested for each specification. The elastic
modulus E, conditional yield strengths f0.2 and f0.1, ultimate strength fu and the
elongation At are listed in Table 1.
Table 1. The mechanical properties of aluminum pipes
Statistics E (GPa) f0.2 (MPa) f0.1 (MPa) fu (MPa) At (%)
Arithmetic mean μ 67.83 184.06 162.66 259.68 11.70Standard deviation σ 2.67 10.76 15.32 5.17 0.32
Coefficient of variation μ/σ (%) 3.94 5.85 9.42 1.99 2.78
The welded hollow spherical joints are widely used in single-layer latticed
domes. In the progressive collapse test, the initial failure member was introduced by
using a member-breaking device. The welding quality and the bearing capacity of the
aluminum ball joints were carefully designed , so that the failure of the joints would
182
183184
185
186
187
188
189
190
191
192
193
194
195
196
not happen prior to the initial member failure. The ultimate bearing capacity tests on
the aluminum ball joints were conducted according to JGT 11-2009. The test
specimens included axial tensile specimens, axial compressive specimens and
eccentric compressive specimens with two different eccentricities. The cross-section
of the aluminum tubes used in the test was Φ20×3 (mm). The axial and lateral
deformation of the ball joints were difficult to measure in the test, the non-contact
strain and displacement acquisition system (Liu et al. 2015) was used to obtain the
spatial strain and displacement of the joints. The values of the ultimate strength of the
aluminum ball joints are listed in Table 2.
Table 2. The ultimate strength of the aluminum ball joints.
StatisticsAxial
tensionAxial
compressionEccentric compression
e= 20 mmEccentric compression
e = 40 mm
Nt (kN) Nc (kN) Nc (kN) M (kNm) Nc (kN) M (kNm)
Arithmetic mean μ 24.88 17.92 4.09 81.81 2.60 103.90Standard deviation σ 0.33 0.43 0.01 0.02 0.04 1.70
Coefficient of variation μ/σ (%) 1.31 2.39 0.20 0.03 1.63 1.64
Note: Nt is the tensile strength, Nc is the compressive strength, M is the flexural strength and e is the eccentricity.
Loading Scheme and Arrangement of the Measuring Points
The maximum uniform load applied on the domes was determined by the preliminary
elastic-plastic buckling analysis. There were five loading cases in the experiment,
namely: 0.17, 0.33, 0.5, 0.63 and 0.83 kN/m2. The static test and the sensitivity tests
were conducted under the load of no more than 0.63 kN/m2 and the progressive
collapse test was conducted under the last loading case. The labeling systems of the
nodal weights in sector A and B are shown in Figs. 3a and b, respectively. The
relationships between the nodal weights and the loading cases are shown in Figs. 3c
197
198
199
200
201
202
203
204
205
206
207208
209
210
211
212
213
214
215
216
and d.
(a) (b) W1 W2 W3 W4 W5 W6 W7 W8 W9
1 2 3 4 50
4
8
12
16
Wei
ght/k
g
Loading grades
W1 W2 W3 W4 W5 W6 W7 W8 W9 W10 W11 W12 W13 W14 W15 W16
1 2 3 4 50
4
8
12
16
Loading grades
Wei
ght/k
g
(c) (d)Fig. 3.The applied weights versus the loading cases: (a) labels of nodal weights in Sector A; (b) labels
of nodal weights in Sector B; (c) nodal weights in the Kiewitt-lamella dome; (d) nodal weights in the
Geodesic dome.
The measuring points in sector A and B are shown in Figs. 4a and b, respectively.
There are 12 displacement observation points and 32 strain gauges in each sector. The
strain in the members were collected using a dynamic strain collecting network at a
sampling frequency of 200Hz, and the displacement of the nodes were collected using
217
218
219
220221222
223
224
225
226
227
228

a non-contact displacement acquisition system at a sampling frequency of 115 Hz (Liu
et al. 2015). The configuration of the non-contact displacement acquisition systemis
shown in Fig.5. Two high-speed cameras were fixed on a bracket, which was placed
close to the ring beam. The highly dynamic 3D displacements of all the observation
points could be acquired by tracking and calculating the 3D coordinates of the targets
in each image caught by the cameras. Take the geodesic dome for example, the targets
in each image are shown in Fig.6.
(a) (b)Fig. 4. Layout of the measuring sensors: (a) Kiewitt-lamella latticed dome; (b) Geodesic latticed dome.
229
230
231
232
233
234
235
236
237238

Fig. 5.Configuration of the non-contact displacement acquisition system.
(a) (b)Fig.6. The stereo images of the targets from the non-contact displacement acquisition system: (a) The
left camera; (b) The right camera.
Member-breaking Device
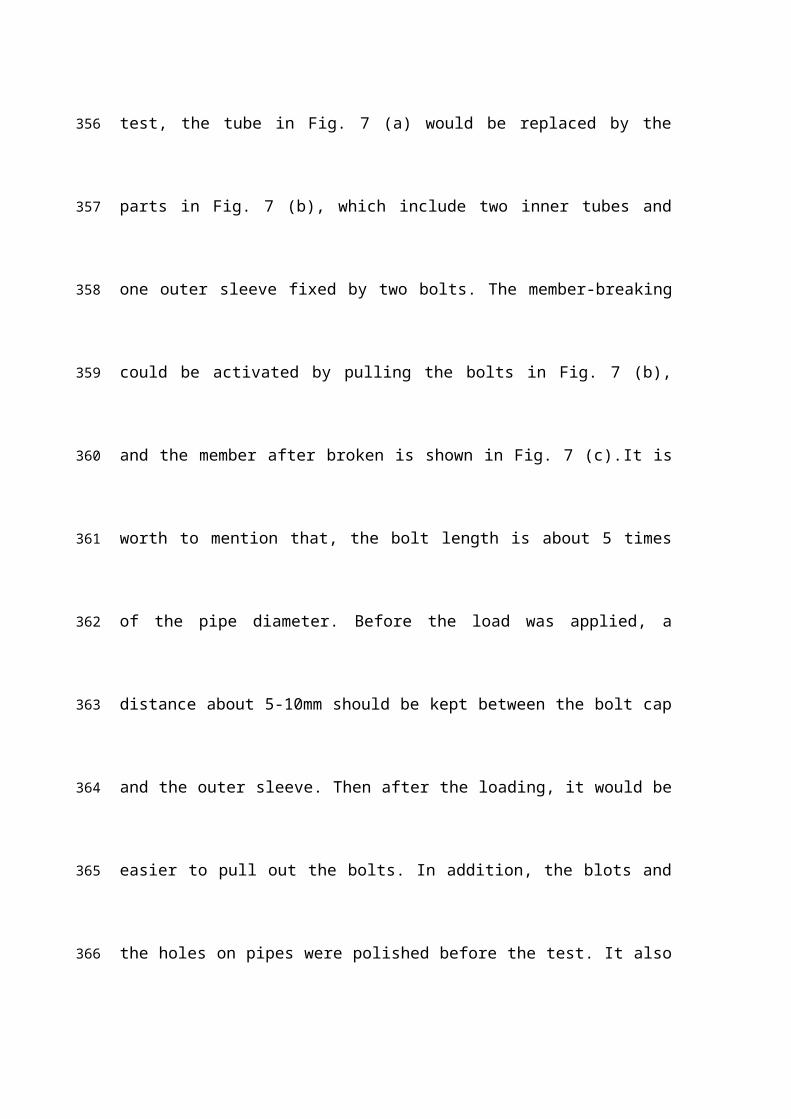
The member-breaking device is shown in Fig. 7. The initial failure members were
activated as shown in Fig. 7 (a) during the construction of the domes. The tubes and
the bars were connected using threaded connections. Before each sensitivity test and
239
240
241
242243
244
245
246
247
248

the progressive collapse test, the tube in Fig. 7 (a) would be replaced by the parts in
Fig. 7 (b), which include two inner tubes and one outer sleeve fixed by two bolts. The
member-breaking could be activated by pulling the bolts in Fig. 7 (b), and the member
after broken is shown in Fig. 7 (c).It is worth to mention that, the bolt length is about
5 times of the pipe diameter. Before the load was applied, a distance about 5-10mm
should be kept between the bolt cap and the outer sleeve. Then after the loading, it
would be easier to pull out the bolts. In addition, the blots and the holes on pipes were
polished before the test. It also helped to activate the member-breaking device
smoothly.
Fig. 7.The member-breaking device: (a) initial status; (b) activating status; (c) failure status
Test Results and Numerical Simulation
The FE Model
249
250
251
252
253
254
255
256
257
258
259
260
261

The FE models of the Kiewitt-lamella dome and Geodesic dome are shown in Fig. 5.
The domes have 6 rings, named as loop i from the apex down to the outer perimeter.
All the members were simulated with element B31 (2-node linear space beam in
ABAQUS). All joints were assumed to be rigid joints, and all the edge supports are
fixed hinge supports. An initial geometric imperfection was considered using the
consistent imperfection modal method, with the maximum value of the initial
imperfection being 1/300 of the span. Each level of uniform load was applied on the
domes as equivalent nodal loads. The member removal time was taken as the same as
that observed in the experiment, which was about 0.3s as shown in Fig. 11 and 12. In
the numerical simulation, an equivalent elasto-plastic hysteresis model invoked by the
ABAQUS material subroutine was used, considering the effect of member buckling
(Xu et al. 2016). The yield stress of the material is 184 MPa, and the ultimate stress is
260 MPa. The MODEL CHANGE option inABAQUS was used to simulate the
removal of elements (Shekastehb et al. 2011). The dynamic effect induced by removal
of the failure member was simulated by undertaking a dynamic implicit analysis.
Furthermore, geometrical large deformation was also considered in the FE analysis.
262
263
264
265
266
267
268
269
270
271
272
273
274
275
276
277

(a) (b)Fig. 8. The FE models: (a) Kiewitt-lamella latticed dome; (b) Geodesic latticed dome
Static Test and FE Analysis
A static test was conducted first to acquire the responses of the original domes before
the removal of any members. Numerical simulation of the static loading was also
carried out to compare with the experimental results. The load-displacement curves
278
280281
282
283
284
285
and the load-strain curves from some of the measuring points under the step loading
(no more than 0.63kN/m2) are shown in Fig. 9 and Fig. 10, respectively. The static
responses are approximately proportional to the loading incremental steps and the
domes performed elastically. In the experiment, the maximum vertical displacement
of the Kiewitt-lamella dome is -1.33mm (node 3), and that of the Geodesic dome is -
3.54mm (node 3). The largest strain response of the Kiewitt-lamella dome (member
28) is -542με, and that of the Geodesic dome is -376με (member 12). The numerical
results fit well with the experimental observation, except for the strain responses of
member 28, 29 and 30 in the Kiewitt-lamella dome. The errors were most likely
caused by the geometric imperfections in the test models.
1 2 3 4 5 6 7 8 9 10 11 12-2.0
-1.5
-1.0
-0.5
0.0
0.5
q=0.17 kN/m2, Test q=0.17 kN/m2, FE q=0.33 kN/m2, Test q=0.33 kN/m2, FE q=0.50 kN/m2, Test q=0.50 kN/m2, FE q=0.63 kN/m2, Test q=0.63 kN/m2, FE
Number of nodes
Ver
tical
disp
lace
men
t/mm
0 10
0
10
1 2 3 4 5 6 7 8 9 10 11 12-4.5
-3.0
-1.5
0.0
Number of nodes
Ver
tical
dis
plac
emen
t/mm
q=0.17 kN/m2, Test q=0.17 kN/m2, FE q=0.33 kN/m2, Test q=0.33 kN/m2, FE q=0.50 kN/m2, Test q=0.50 kN/m2, FE q=0.63 kN/m2, Test q=0.63 kN/m2, FE
0 10
0
10
(a) (b)Fig. 9.Load-displacement curves under the static load: (a) Kiewitt-lamella latticed dome; (b) Geodesic
latticed dome.
286
287
288
289
290
291
292
293
294
295
296297298
299

1 2 3 4 5 6 7 8 9 10 11 12-600
-400
-200
0
200
400
600
2314 302827262516125 9
Number of elements
Stra
in/
q=0.17 kN/m2, Test q=0.17 kN/m2, FE q=0.33 kN/m2, Test q=0.33 kN/m2, FE q=0.50 kN/m2, Test q=0.50 kN/m2, FE q=0.63 kN/m2, Test q=0.63 kN/m2, FE
3
0 2 4 6 8 10
0
2
4
6
8
10
1 2 3 4 5 6 7 8 9 10 11 12-900
-600
-300
0
300
600
2015 302928272117147 11Number of elements
Stra
in/
q=0.17 kN/m2, Test q=0.17 kN/m2, FE q=0.33 kN/m2, Test q=0.33 kN/m2, FE q=0.50 kN/m2, Test q=0.50 kN/m2, FE q=0.63 kN/m2, Test q=0.63 kN/m2, FE
2
0 10
0
10
(a) (b)Fig. 10.Load-stain curves under the static load: (a) Kiewitt-lamella latticed dome; (b) Geodesic latticed
dome.
Sensitivity Test and FE Analysis
Strain and displacement responses
To compare the responses of the damaged domes induced by different initial failure
members, sensitivity test and the corresponding FE analysis were conducted after the
static test. A total of 14 representative initial failure members were selected in each
dome, as shown in Fig. 4. A single initial failure member was removed in each trial,
and the sensitivity analysis could be carried out based on the strain and displacement
responses which are comparable between different trials.The member-breaking device
was installed before loading. Next, a step increase in loading (no more than
0.63kN/m2) was applied on the domes. Then, the initial failure member was
introduced by triggering the member-breaking device, resulting in vibration of the
remaining structure.
Consider, for example, the removal of member 18 in the Kiewitt-lamella dome, a
300
301302
303
304
305
306
307
308
309
310
311
312
313
314
315
316
load transfer path was observed from member 18 to the connecting nodes 8 and 9, and
then to node 5, 12 and other members. Fig. 11a presents the vertical displacements of
node 5, 8 and 12 during the initial member failure. The displacement responses
stabilized after a period of vibration and a new balanced state was observed at about
1.3s. The connecting nodes 8 and 9 have downward displacements, and those of node
5 and 12 are opposite. The largest displacement response was found at node 8, about -
2.4mm. Fig. 12a presents the strain responses of members 10, 16 and 17 during the
removal of member 18. It was found that the strain response of ring member 10 was
larger than other members at about -300με.
Fig. 11b presents the vertical displacements of nodes 8, 9 and 12 during the
removal of member 19 in the Geodesic dome. Similarly, a load transfer path was
found from the initial failure member to the connecting nodes 9 and 11, and then to
nodes 8 and 12 through member 15 and 23, which finally caused significant change of
strain in the diagonal member 27. The maximum displacement of about -2.5mm was
observed at node 9. Fig. 12b presents the strain responses of members 23, 27 and 28
during the initial member failure. The largest value of strain response appeared in
member 27, which was about -380με. Good agreement was observed between the
numerical simulation and the test observation, demonstrating that the FE models and
results are reliable for the subsequent sensitivity analysis.
317
318
319
320
321
322
323
324
325
326
327
328
329
330
331
332
333
334
335
(a) (b)Fig. 11.Displacement time history during the sensitivity analysis: (a) Kiewitt-lamella latticed dome; (b)
Geodesic latticed dome.
(a) (b)Fig. 12.Strain time history during the sensitivity analysis: (a) Kiewitt-lamella latticed dome; (b)
Geodesic latticed dome.
Sensitivity Analysis
The strain and displacement responses acquired in the sensitivity test were substituted
into the Eq. (2) and (4) to obtain the sensitivity indices Sij and the importance
coefficients αjs. The allowable strains of members in the Kiewitt-lamella dome and the
Geodesic dome are listed in Tables 3 and 4, respectively. The slenderness ratios of the
outermost diagonal members in the Kiewitt-lamella dome are much larger than the
other members.
336
337338
339
340
341342
343
344
345
346
347
348
349
350
Table 3. The allowable strains of members in the K8-lemalla dome.
MemberEffective length
(mm)Radius of gyration
(mm)Slenderness
ratioεc (με) εs (με)
3,17,18 231 2.704 85 2162 2706 9,10,11 234 2.704 87 2142 2706
1,2,5,13,23 318 2.704 118 1519 2706 15,16 335 2.358 142 1081 2706
19,20,21,22 351 2.358 149 987 2706 4,6,7,8 369 2.358 156 902 2706
24,25,26,27 370 2.358 157 898 2706 12,14 384 2.358 163 852 2706
28,29,30,31 390 2.358 165 837 2706
32 472 2.704 175 813 2706
Table 4. The allowable strains of members in the Geodesic dome.
MemberEffective length
(mm)Radius of gyration
(mm)Slenderness
ratioεc (με) εs (με)
1,2,5,10,16,25 318 2.704 118 1519 27063 320 2.358 136 1182 27067 324 2.358 137 1154 27066 325 2.358 138 1147 270612 328 2.358 139 1126 2706
11,18 331 2.358 140 1106 270613 332 2.358 141 1100 270627 335 2.358 142 1081 270617 339 2.358 144 1056 2706
20,21 340 2.358 144 1050 270619 342 2.358 145 1038 2706
29,31 347 2.358 147 1009 270626 349 2.358 148 998 2706
30,32 353 2.358 150 976 270628 354 2.358 150 971 2706
22,23,24 362 2.704 134 1213 270614,15 370 2.704 137 1163 27068,9 375 2.704 139 1133 27064 379 2.704 140 1110 2706
The maximum sensitivity indices Sij, max could reflect the possibility of subsequent
member failure in the damaged domes after removing the initial failure members,
which are shown in Figs. 13 a and b. The Sij, max of member 10, 23, 26 and 30 are larger
351
352
353
354
355
than 0.2 in the K8-lamella latticed dome, which means these members are more
sensitive than other members. Similarly, member 16 and 19 are more sensitive than
other members in the Geodesic dome. The average error for the calculation of Sij, max
between the experimental results and the numerical simulation results is about 9.5%.
The importance coefficient αjs is the average sensitivity index of all the members
in the remaining structure. However, it is unpractical to acquire the strain responses of
all the members in the experimental study. Since the reliability of the FE model was
already been proved, the αjs were obtained by numerical simulation, as shown in Figs.
13 c and d. The results show that the average αjs of the Geodesic dome (about 0.67%)
is far larger that of the Kiewitt-lamella dome (about 0.34%). AND……….
(a) (b)
(c) (d) LOOP ?????
356
357
358
359
360
361
362
363
364
365
366
367
368
369
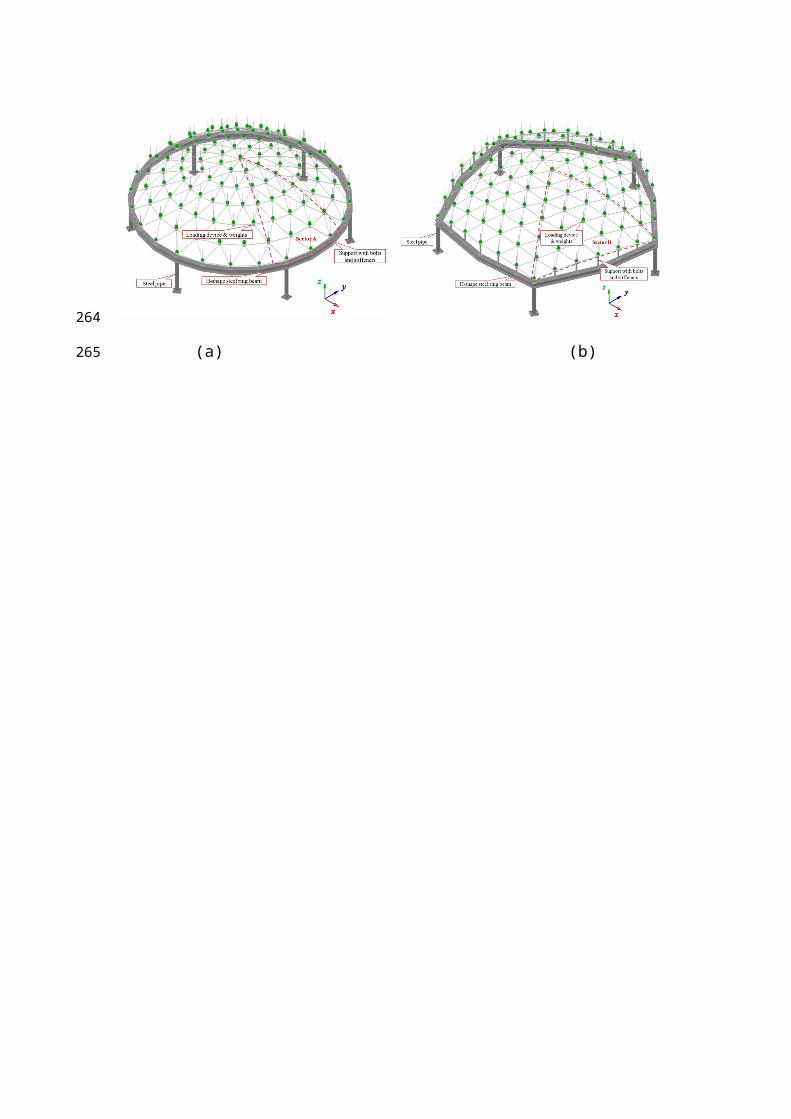
Fig. 13. Sensitivity analysis results of the members: (a) Sij, max in the Kiewitt-lamella latticed dome; (b)
Sij, max in the Geodesic latticed dome; (c) αjs in the Kiewitt-lamella latticed dome; (d) αjs in the Geodesic
latticed dome.
Elastic-plastic buckling analysis was performed to acquire the elastic limit
displacements u02 of the damaged structures, as shown in Table 5. It was found that the
value of u02 varies with the initial failure member and the node considered. The
sensitivity indices Rij based on the maximum displacements were calculated according
to Eq. (5), as shown in Figs. 14 a and b. The members 10 and 21 in the Kiewitt-
lamella dome, and members 2, 6 and 18 in the Geodesic dome have relatively higher
Rij compared with other members. The average Rij of the Geodesic dome (about 0.43)
is larger that of the Kiewitt-lamella dome (about 0.40). It is worth mentioning that,
large errors of Rij based on the displacements of node 12 was noticed in the Kiewitt-
lamella dome, especially for the last two trials. This was mainly caused by the
stiffness reduction of node 12 after repetitive loading, which could be demonstrated
by comparing the displacement results in Fig.9a and Fig.16a.
Table 5. The maximum displacements in the sensitivity test and the corresponding elastic limit
displacement.
Kiewitt-lamella dome Geodesic dome
Removed member
Node with maximum
displacementu02 (mm)
Removed member
Node with maximum
displacementu02 (mm)
1 3 -6.11 2 3 -10.30 3 3 -7.09 6 4 -8.58
370
371
372
373
374
375
376
377
378
379
380
381
382
383
384
385
386
387
6 3 -6.15 9 5 -8.16 10 5 -8.44 10 10 -6.76 13 5 -5.88 12 9 -7.43 14 3 -5.90 15 9 -5.91 15 5 -5.96 16 10 -4.34 18 8 -7.94 18 9 -4.87 21 9 -5.93 19 9 -4.87 23 12 -6.50 20 11 -4.86 12 12 -5.87 23 11 -3.50 31 3 -5.87 27 12 -3.50 30 12 -5.87 29 11 -3.50 32 12 -5.87 32 9 -3.50
(a) (b)Fig. 14.Sensitivity analysis results of the nodes: (a) Rij in the Kiewitt-lamella latticed dome; (b) Rij in
the Geodesic latticed dome. Loop
The stiffness reduction rates C of the damaged domes were calculated according to
Eq. (6) and shown in Fig. 15. The natural frequencies of the damaged domes were
acquired by frequency analysis in ABAQUS. The results indicate that, the stiffness
reduction rate after removing member 2, 6, 9 and 10 were above 50% in the Geodesic
dome. By contrast, the largest stiffness reductions were observed after removal of
member 10 and 18 in the Kiewitt-lamella dome, which were both less than 31%.
Again, the Kiewitt-lamella dome was predicted to have better progressive collapse
388
389
390391
392
393
394
395
396
397
398
399

resistance than the Geodesic dome. The sensitivity analysis results based on the
importance coefficient αjs, the sensitivity indices Rij and the stiffness reduction rates C
were all coincident.
Fig. 15.The stiffness reduction rates of the damaged structures during the sensitivity analysis (acquired
by FE analysis).
Progressive Collapse Test and FE Analysis
Experimental Phenomena
The failure load was determined as 0.83 kN/m2 in the progressive collapse test.
Members 18, 19 and 24 were selected as the initial failure members in the Kiewitt-
lamella dome, which were removed in turn. Member 19 was selected as the initial
failure member in the Geodesic latticed dome.
For the K8-lamella latticed dome, the stiffness of nodes 8, 9, 11 and 12 in cycle 4
and 5 decreased significantly after repetitive loading, as shown in Fig. 16a. The
displacements observed in the experiment are far larger than the numerical results,
even before removing any members, as shown in Fig. 17a. The maximum
400
401
402
403
404
405
406
407
408
409
410
411
412
413
414
415

displacement at node 12 reached to -3.0mm. Meanwhile, the outermost diagonal
members 28 and 30 with higher slenderness ratios were close to buckling as well, as
shown in Fig. 18a. The maximum tension strain appeared in member 29 (about
1212με) and the maximum compression strain appeared in member 30 (about -830με).
After removing member 18, decline of node 3, raise of node 5 and buckling of
members 28 and 30 were observed in the experiment, as shown in Fig. 17b and Fig.
18b. The maximum displacement at node 12 increased to -5.9mm, while the
maximum strain in member 28 increased to -1074με. Obviously vibration of strain
responses was also found in member 17 and 27. After removing member 19, decline
of node 8 and 10 was observed, the maximum displacement at node 12 further
increased to -6.4mm. Obvious vibration of strain responses was detected in member
17 and 21. All the dynamic responses above could be defined as local internal force
redistribution, and no subsequent failure occurred to the dome (which dome?) before
removing member 24.
As shown in Figs. 16b, obvious downward movement of nodes in cycle 4 and 5
were observed after the removal of member 24. Then, the failure region gradually
extended up to the apex. The local damage developed into a snap-through collapse of
the remaining structure, as shown in Fig. 16c. Finally, the whole structure moved to
the mirror inverted position. The progressive collapse of the test model also had an
impact effect on the surrounding supports, partial supports were even pulled off.
The displacement and strain responses in the Geodesic dome before removing
member 19 are shown in Fig. 19 and Fig. 20, respectively. The decline of node 9 and
416
417
418
419
420
421
422
423
424
425
426
427
428
429
430
431
432
433
434
435
436
437

10, as well as the raise of node 11 were observed in the experiment. The maximum
displacement was measured at node 3 (about -4.4mm), which is about 1.5 times that
of the Kiewitt-lamella dome in a similar position. Similarly with Fig. 10b, the test
results of the strain responses fit well with the FE results. The maximum tension strain
appeared in member 25 (about 153με) and the maximum compression strain appeared
in member 12 (about -495με), both far less than the corresponding allowable strain.
After the removal of member 19, the displacements of the connecting nodes 9 and 11
increased dramatically, and the failure region rapidly expanded to the center of the
dome. The progressive collapse of the Geodesic dome also performed a snap-through
collapse, however the structural stiffness decreased more quickly than with the
Kiewitt-lamella dome, which could be observed in Figs. 24 to 27.The test model after
collapse is shown in Figs. 16 d to f, most of the members in the outer loops were
found to have fracture or buckled while all the ball joints remained intact.
438
439
440
441
442
443
444
445
446
447
448
449
450
451
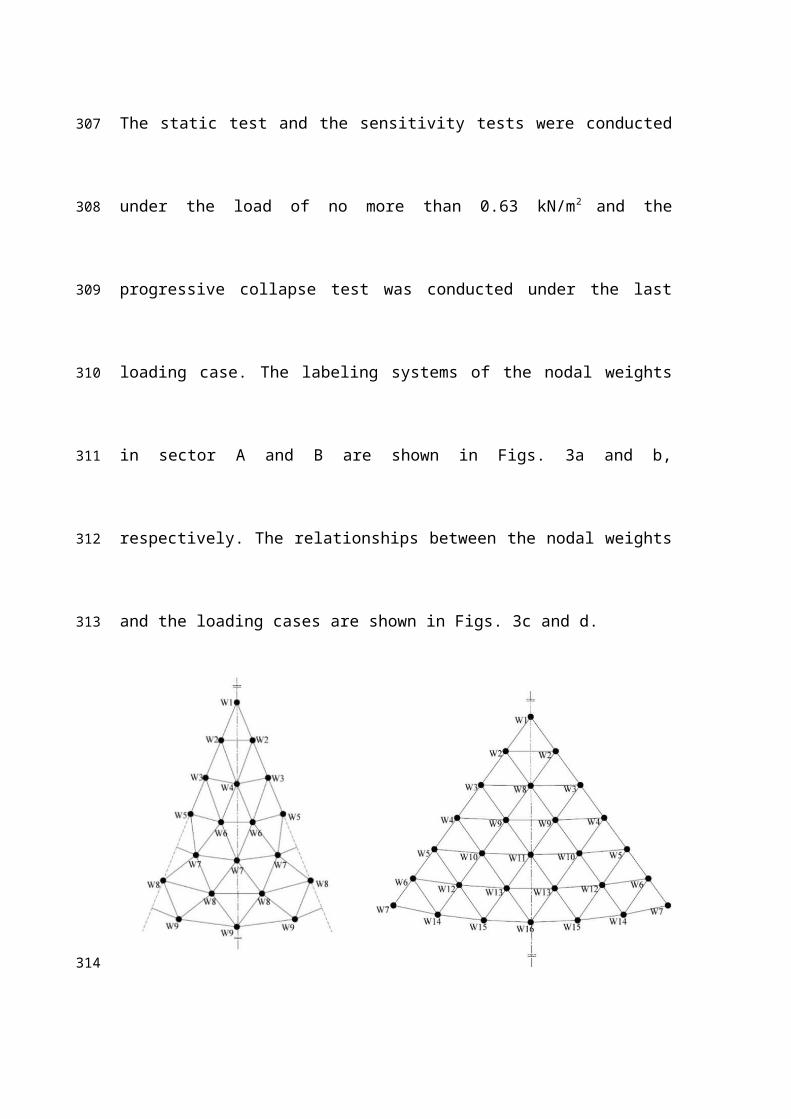
Fig. 16.Experimental phenomena: (a) local instability; (b) expansion of the failed region; (c) collapse
of the Kiewitt-lamella latticed dome; (d) collapse of the Geodesic latticed dome; (e) fracture of a
member; (f) buckling of a member.
(a) (b)Fig. 17. Displacement responses of nodes before the progressive collapse of the Kiewitt-lamella
latticed dome: (a) before initial member failure; (b) after initial member failure. legends
(a) (b)
Fig. 18.Strain responses of elements before the progressive collapse of the Kiewitt-lamella latticed
dome: (a) before initial member failure; (b) after initial member failure
452
453
454
455
456457
458
459
460
461
462

Fig. 19. Displacement responses of nodes before the progressive collapse of the Geodesic latticed
dome.
Fig. 20.Strain responses of elements before the progressive collapse of the Geodesic latticed dome.
Legend
Progressive Collapse Mechanism
Figs. 21 and 22 present the displacement and strain responses of the Kiewitt-lamella
dome after removing member 24. The downward movements of node 8 and 9 were
detected first in the experiment, which induced the bucking of the ring member 31.
After that, a local internal force redistribution lasting about 0.14s was observed before
the fracture of member 28. Then, successive failure of nodes and members generated
463
464
465
466
467
468
469
470
471
472
473
474
from the outer loops to the center of the dome in about 0.6s. It is worth mentioning
that nodes 1, 2 and 3 also had transient upward movements during the progressive
collapse, which could further prove that the whole dome underwent a snap-through
collapse. It is clear that several members in the outer loops with higher slenderness
ratios failed ahead of time, leading to a local instability around the initial failed
members. This is the immediate reason for the progressive collapse of the Kiewitt-
lamella dome.
Fig. 21.Displacement time history during the progressive collapse of the Kiewitt-lamella latticed dome.
Fig. 22. Strain time history during the progressive collapse of the Kiewitt-lamella latticed dome.
Figs. 23 and 24 present the displacement and strain responses of the Geodesic
475
476
477
478
479
480
481
482
483
484
485
486

dome during the progressive collapse. Since an unexpected stoppage of the
displacement measurement system occurred during the test, only the FE results are
given in Fig. 23. The failure of member 19 led to the sudden decline of nodes 9 and
11, and the raise of node 8 and 12. Then the movements of node 9 and 12 generated
compression forces in their connecting members 12 and 27. After that, large vibration
of strain was detected in member 23, 24 and 29, which were connected to node 11.
Subsequently more joints were pulling down by a chain action as shown in Fig.23, the
structural stiffness declined rapidly in less than 0.4s. In this experiment, the
progressive collapse of the Geodesic dome was mainly due to the rapid change of
nodal displacement, which led to the sharp decline in the structural stiffness.
Fig. 23. Displacement time history during the progressive collapse process of the Geodesic latticed
dome. (acquired by FEM) Legend
487
488
489
490
491
492
493
494
495
496
497
498
499
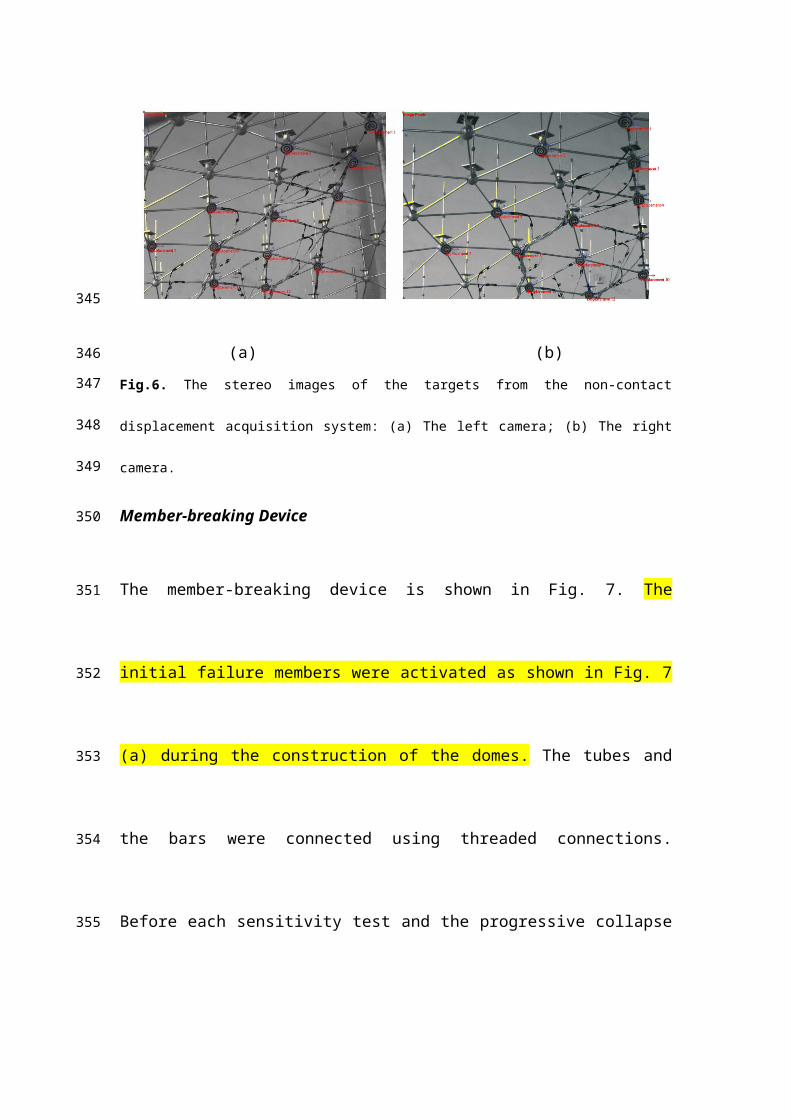
Fig. 24. Strain time history during the progressive collapse process of the Geodesic latticed dome.
Conclusions
The experimental study and FE analysis on the progressive collapse resistance of
single-layer latticed domes were outlined in this paper. Three methods were used to
evaluate the progressive collapse resistance of single-layer latticed domes, as well as
the collapse criterion based on the displacement responses were proposed and verified
in the experimental investigation. The mechanism of internal force redistribution and
the subsequent failure process of two kinds of latticed domes were revealed by ALP
(please put in full) analysis.
(1) The progressive collapse resistance of single-layer latticed domes could be
predicted effectively by use of the importance coefficient αjs, the sensitivity
index Rij and the stiffness reduction rate C as proposed in this paper, which are
based on the member stress, the maximum displacement and the structural
stiffness of the damaged structure, respectively.
(2) Both the Kiewitt-lamella dome and the Geodesic dome underwent a snap-
500
501
502
503
504
505
506
507
508
509
510
511
512
513
514
515
through collapse in the experimental investigation. The collapse of the
Kiewitt-lamella dome was induced by the unexpected local instability around
the initial failure members, a local internal force redistribution was also
detected before the overall collapse.The collapse of the Geodesic dome
resulted from the rapid change in nodal displacement and the sharp decline of
the structural stiffness.
(3) The elastic limit displacement of the damaged structure acquired by an elastic-
plastic buckling analysis was determined as the critical displacement for
progressive collapse of single-layer latticed domes, which will varies with the
initial failure member and the node for calculation.
Acknowledgements
This work was supported by the National Key Research and Development Program of
China (No.2016YFC0701103) and the National Natural Science Foundation of China
(No.51525803& No.51608360).The authors would like to thank the anonymous
reviewers for their valuable comments and thoughtful suggestions.
References
Abedi, K., and Parke, G. A. R. (1996). “Progressive collapse of single-layer braced
domes.” International Journal of Space Structures,11(3), 291-306.
Abedi, K., and Shekastehband, B. (2009). “Effects of member loss on the structural
integrity of tensegrity systems.” Symposium of the International Association for
Shell and Spatial Structures (50th. 2009. Valencia). Evolution and Trends in
Design, Analysis and Construction of Shell and Spatial Structures: Proceedings.
516
517
518
519
520
521
522
523
524
525
526
527
528
529
530
531
532
533
534
535
536
537
Editorial Universitat Politècnica de València.
Blandford, G. E. (1997). “Review of progressive failure analyses for truss structures.”
J. Struct. Eng., 123(2), 122-129.
Cai, J., Wang, F., Feng, J., Zhang, J., and Feng, F. (2012). “Discussion on the
progressive collapse analysis of long-span space structures.” Engineering
Mechanics, 29(3), 143-149 (in Chinese).
Chen, Y., and Feng, J. (2015). “Group-theoretic method for efficient buckling analysis
of prestressed space structures.” Acta Mech., 226(3), 957-973.
Chen, Y., Sareh, P., and Feng, J. (2015). “Effective insights into the geometric
stability of symmetric skeletal structures under symmetric variations.” Int. J. Solids
and Struct., 69, 277-290.
China Architecture & Building Press. (2010). “Technical specification for space frame
structures.” JGJ 7-2010, Beijing (in Chinese).
China Architecture & Building Press. (2009). “Welded hollow spherical node of space
grid structures.” JGT 11-2009, Beijing (in Chinese).
DOD (U.S. Dept. of Defense). (2009). “Design of building to resist progressive
collapse”, UFC 4-023-03, Washington, DC.
Downey, C. (2005). “Investigation of Charles de Gaulle collapse is highly critical.”
Architectural Record, 193(4), 40-40.
El-Sheikh, A. (1997). “Sensitivity of space trusses to sudden member loss.”
International Journal of Space Structures, 12(1), 31-41.
Fan, F., Wang, D., Zhi, X., and Shen, S. (2010). “Failure modes of reticulated domes
subjected to impact and the judgment.” Thin Wall Struct., 48(2), 143-149.
538
539
540
541
542
543
544
545
546
547
548
549
550
551
552
553
554
555
556
557
558
559
560

Fan, F., Yan, J., and Cao, Z. (2012). “Elasto-plastic stability of single-layer reticulated
domes with initial curvature of members.” Thin Wall Struct., 60, 239-246.
GSA (U.S. General Service Administration). (2003). “Progressive collapse analysis
and design guidelines for new federal office buildings and major modernization
projects”, Washington, DC.
Hanaor, A. (1995). “Design and behaviour of reticulated spatial structural
systems.” International Journal of space structures, 10(3), 139-149.
Han, Q., Liu, M., Lu, Y., and Wang, C. (2015). “Progressive collapse analysis of
large-span reticulated domes.” Int. J. Steel Struct., 15(2), 261-269.
Jiang, X., and Chen, Y. (2012). “Progressive collapse analysis and safety assessment
method for steel truss roof.” J. Perform. Constr. Facil., 26(3), 230-240.
JSSC (Japanese Society of Steel Construction) and CTBUH (Council on Tall Building
and Urban Habitat). (2005). “Guidelines for collapse control design- construction
of steel buildings with high redundancy.” JISF (Japanese Iron and Steel
Foundation), Tokyo, Japan.
Kaewkulchai, G., and Williamson, E. B. (2006). “Modeling the impact of failed
members for progressive collapse analysis of frame structures.” J. Perform. Constr.
Facil., 20(4), 375-383.
Khandelwal, K., El-Tawil, S., and Kunnath, S. K. and Lew, H. S. (2008).
“Macromodel-based simulation of progressive collapse: steel frame structures.” J.
Struct. Eng., 134(7), 1070-1078.
Kim, J., and Kim, T. (2009). “Assessment of progressive collapse-resisting capacity
561
562
563
564
565
566
567
568
569
570
571
572
573
574
575
576
577
578
579
580
581
582

of steel moment frames.” J. Constr. Steel Res., 65(1), 169-179.
Liu, X., Tong, X., Yin, X., Gu, X., and Ye, Z. (2015). “Videogrammetric technique
for three-dimensional structural progressive collapse
measurement.” Measurement, 63, 87-99.
Malla, R. B., Agarwal, P., and Ahmad, R. (2011). “Dynamic analysis methodology
for progressive failure of truss structures considering inelastic postbuckling cyclic
member behavior.” Eng. Struct., 33(5), 1503-1513.
Mlakar, P. F., Dusenberry, D., Harris, J. R., Haynes, G., Phan, L., and Sozen, M.
(2003). The Pentagon Building Performance Report, ASCE, Reston, Va.
Mohamed, O. A. (2006). “Progressive collapse of structures: annotated bibliography
and comparison of codes and standards.” J. Perform. Constr. Facil., 20(4), 418-
425.
Murtha-Smith, E. (1988). “Alternate path analysis of space trusses for progressive
collapse.” J. Struct. Eng., 114(9), 1978-1999.
Osteraas, J. D. (2006). “Murrah building bombing revisited: a qualitative assessment
of blast damage and collapse patterns.” J. Perform. Constr. Facil., 20(4), 330-335.
Palmisano, F., Vitone, A., Vitone, C., and Vitone, V. (2007). “Collapse of the Giotto
Avenue building in Foggia.” Struct. Eng. Int., 17(2), 166-171.
Pandey, P. C., and Barai, S. V. (1997). “Structural sensitivity as a measure of
redundancy.” J. Struct. Eng., 123(3), 360-364.
Pearson, C., and Delatte, N. (2005). “Ronan Point apartment tower collapse and its
effect on building codes.” J. Perform. Constr. Facil., 19(2), 172-177.
Piroglu, F., and Ozakgul, K. (2016). “Partial collapses experienced for a steel space
583
584
585
586
587
588
589
590
591
592
593
594
595
596
597
598
599
600
601
602
603
604
605

truss roof structure induced by ice ponds.” Eng. Fail. Anal., 60, 155-165.
Sebastian, W. M. (2004). “Collapse considerations and electrical analogies for
statically indeterminate structures.” J. Struct. Eng., 130(10), 1445-1453.
Shekastehband, B., Abedi, K., and Chenaghlou, M. R. (2011). “Sensitivity analysis of
tensegrity systems due to member loss.” J. Constr. Steel Res., 67(9), 1325-1340.
Shu, G. and Yu, G. (2015). “Experimental study on the progressive collapse of spatial
pipe truss structures,” Progress in steel building structures, 17(5), 32-38 (in
Chinese).
Szyniszewski, S., and Krauthammer, T. (2012). “Energy flow in progressive collapse
of steel framed buildings.” Eng. Struct., 42(12), 142-153.
Xu, Y., Han, Q., and Lian, J. (2016). “Progressive collapse performance of single-
layer latticed shells.” Engineering Mechanics, 33(11), 105-112. (in Chinese).
Yamada, S., Takeuchi, A., Tada, Y., and Tsutsumi, K. (2001). “Imperfection-sensitive
overall buckling of single-layer lattice domes.” J. Eng. Mech., 127(4), 382-386.
Zhao, X., Yan, S., Chen, Y., Xu, Z., and Lu, Y. (2017). “Experimental study on
progressive collapse-resistant behavior of planar trusses.” Eng. Struct., 135, 104-
116.
Zhao, X., Yan, S., and Chen, Y. (2017). “Comparison of progressive collapse
resistance of single-layer latticed domes under different loadings.” J. Constr. Steel
Res., 129, 204-214.
606
607
608
609
610
611
612
613
614
615
616
617
618
619
620
621
622
623
624
625