Embed Size (px)
Citation preview
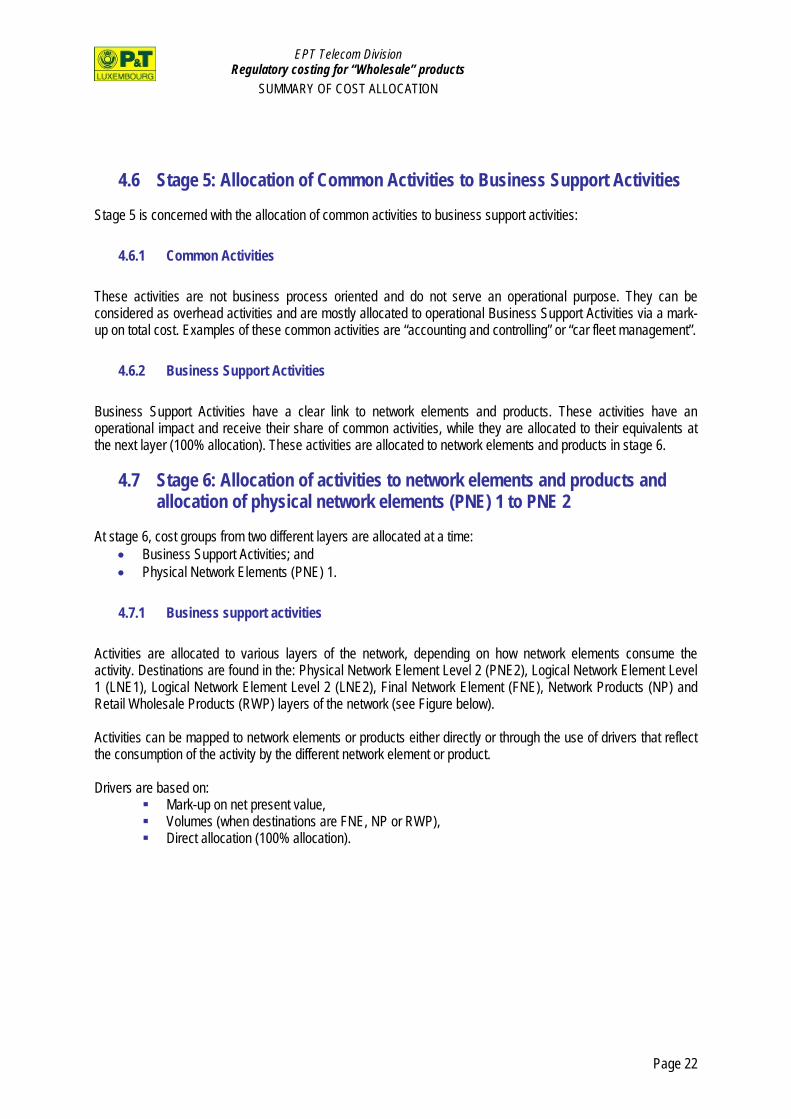
EPT Telecom Division Regulatory costing for “Wholesale” products
SUMMARY OF COST ALLOCATION
EPT
SUMMARY DESCRIPTION OF THE REGULATORY COSTING MODEL FOR WHOLESALE PRODUCTS
EPT Telecom Division Regulatory costing for “Wholesale” products
SUMMARY OF COST ALLOCATION
Page 2
Table of contents
1 INTRODUCTION........................................................................................................................... 4
1.1 LEGAL FRAMEWORK .................................................................................................................... 4 1.2 GENERAL ACCOUNTING PRINCIPLES .......................................................................................... 4 1.3 EPT’S COSTING METHODOLOGY................................................................................................. 4
2 MODEL OVERVIEW AND ALLOCATION METHODS......................................................... 9
2.1 SCOPE OF THE DOCUMENT........................................................................................................... 9 2.2 COST CATEGORIES........................................................................................................................ 9 2.3 COSTING METHODOLOGIES ....................................................................................................... 10
3 MODEL INPUTS.......................................................................................................................... 14
3.1 COSTS .......................................................................................................................................... 14 3.2 VOLUME DATA ............................................................................................................................ 17 3.3 USAGES........................................................................................................................................ 17 3.4 DRIVERS ...................................................................................................................................... 18
4 COST ALLOCATION ................................................................................................................. 19
4.1 MODEL OVERVIEW ..................................................................................................................... 19 4.2 STAGE 1: RE-ALLOCATIONS AND INEFFICIENCY ADJUSTMENTS............................................. 20 4.3 STAGE 2: ALLOCATIONS OF BUILDINGS, IT, VEHICLES AND OTHER SUPPORT COST CENTRES 20 4.4 STAGE 3: ALLOCATION OF SUPPORT CENTRES OF RESPONSIBILITY TO OPERATIONAL CENTRES OF RESPONSIBILITY.............................................................................................................. 21 4.5 STAGE 4: ALLOCATION OF CENTRES OF RESPONSIBILITY TO ACTIVITIES, AND COST CENTRES TO ACTIVITIES, NETWORK ELEMENTS AND PRODUCTS ..................................................................... 21 4.6 STAGE 5: ALLOCATION OF COMMON ACTIVITIES TO BUSINESS SUPPORT ACTIVITIES ....... 22 4.7 STAGE 6: ALLOCATION OF ACTIVITIES TO NETWORK ELEMENTS AND PRODUCTS AND ALLOCATION OF PHYSICAL NETWORK ELEMENTS (PNE) 1 TO PNE 2 ............................................ 22 4.8 STAGE 7 TO STAGE 10 - SUB-NETWORK ELEMENT MAPPING ................................................ 23 4.9 STAGES 11AND 12: ALLOCATION OF FNE TO NETWORK PRODUCTS (NP) AND NP TO RWP 24 4.10 STAGE 13: ALLOCATION OF BUSINESS SUSTAINING COSTS TO RWP .................................... 25
5 MODEL OUTPUTS...................................................................................................................... 26
EPT Telecom Division Regulatory costing for “Wholesale” products
SUMMARY OF COST ALLOCATION
Table of figures
FIGURE 1 CASCADE METHODOLOGY----------------------------------------------------------------------------------------------- 11 FIGURE 2 ABC METHODOLOGY --------------------------------------------------------------------------------------------------- 12 FIGURE 3 THE DIAGRAM ABOVE SHOWS HOW THE COSTING MODEL IN THE RIO COMBINES DIFFERENT ALLOCATION METHODS ------- 13 FIGURE 4 DEFINITION OF COST TYPES USED IN THE MODEL ------------------------------------------------------------------------ 16 FIGURE 5 PROCESS TO GET INPUTS INTO THE RIO MODEL FROM AUDITED ACCOUNTS ---------------------------------------------- 17 FIGURE 6 MODEL OVERVIEW AND COST ALLOCATION FLOW ------------------------------------------------------------------------ 19 FIGURE 7 MAPPING OF BUSINESS SUPPORT ACTIVITIES ---------------------------------------------------------------------------- 23 FIGURE 8 SUB-NETWORK MAPPING WITH CATEGORIES----------------------------------------------------------------------------- 24 FIGURE 9 MAPPING OF FNE TO RWP--------------------------------------------------------------------------------------------- 25
Page 3
EPT Telecom Division Regulatory costing for “Wholesale” products
SUMMARY OF COST ALLOCATION
1 INTRODUCTION
1.1 Legal framework
The Luxembourg Law of May 30 2005 (“Law on network and electronic communication services”), transposed into national law the EU framework Directives issued by the European Commission (Directives 2002/19, -20, -21, -22, -58). The package was designed to recast the existing regulatory framework in order to make the electronic communications sector more competitive and ensuring a more consistent regulatory framework across the European Union.
The Luxembourg Law of May 30, 2005, designates the Institut Luxembourgeois de Régulation (ILR) to analyse markets susceptible to ex ante regulation in order to define dominant operators in the market and to define ex ante obligations to which these operators are then required to comply.
Entreprise des P&T (EPT), as a result of the market analysis conducted by the ILR, is required to produce interconnection and access pricing based on forward-looking long run average incremental costs, which entails an accounting system based on current costs rather than historical costs. This requires also an accounting system based on activity based costing.
1.2 General accounting principles
The following regulatory accounting principles have served as guidelines for EPT in the production of its cost orientated interconnection and access tariffs:
• Cost causality - The principle of cost causality requires that costs are allocated to those services, businesses or activities that cause those costs to arise.
• Transparency - Interconnection and access tariffs should be calculated on the principle of cost orientation and on a transparent basis such that the regulator or a third person can verify that the tariffs are cost orientated.
• Consistency - The same accounting principles and cost allocation methods should be used from year to year; and
• Objectivity - cost allocation must be defined in an objective and consistent way and not be intended to provide a benefit for an operator or a business line.
1.3 EPT’s costing methodology
Cost orientation is one of the fundamental elements of regulatory intervention. Economic theory suggests that in a competitive market price tends towards costs. However, in a monopolistic or oligopolistic environment, the market price may be above cost, resulting in an inefficient allocation of resources. Cost orientation aims to mimic the market outcome by setting tariffs in line with underlying costs.
When implementing a cost orientated interconnection model, a number of decisions need to be made regarding the appropriate cost standards, valuation methodology and approach to cost allocation in the model.
The approach that EPT has adopted in its cost model is set out below:
Page 4
EPT Telecom Division Regulatory costing for “Wholesale” products
SUMMARY OF COST ALLOCATION
1.3.1 Top down versus bottom up
There are two alternative approaches to the calculation of cost orientated tariffs:
• Bottom-up approach: costs are calculated based on an engineering model which estimates the costs of an efficient modern equivalent network and the allocation of the associated costs; and
• Top-down approach: costs are calculated based on the actual costs of the operator expressed in current cost terms, and adjusted to remove inefficiency and costs not incremental to the relevant services.
As in previous years, EPT has adopted a top down approach which draws on the audited costs of its business provided by EPT’s SAP accounting system. The adoption of a top down methodology in the calculation of interconnection and access tariffs for fixed operators is standard practice in the EU for fixed network operators.
1.3.2 Fully Allocated Costs
The Fully Allocated Cost (FAC) of a product or service is the total costs of that product or service divided by the total volumes, eg the average cost of the product or service, and it includes:
• direct variable costs; • direct fixed costs; and • a pro-rata allocation of fixed and common costs.
Under EPT’s top-down approach where accounts-based data is fully allocated to products and services (including a “Parked” cost category), the full telecommunications business costs (operational, depreciation and cost of capital) are all included and recovered.
1.3.3 Long run forward looking costs
If cost orientated tariffs are to provide efficient price signals to the market, then the result must reflect the forward looking (current) costs of building and operating a modern network. Therefore, the top-down approach should be based on forward looking current cost accounting (CCA) standards.
Forward looking costs reflect the costs which will be incurred in the future to meet future objectives and, as such, necessitate some judgment in estimating those forward looking costs. Forward looking costs differ from historic costs in a number of ways. Historic costs were recorded in the past and were related to meeting historic objectives. Furthermore, historic costs are known with certainty and are typically used for financial reporting.
The crucial issue in relation to the distinction between ‘short run’ and ‘long run’ is the variability of inputs. In the short run, many input factors have to be kept constant (network components, employees, etc.). In the long run, a number of input factors can be varied (number of employees, capital charges etc.)
According to the Independent Regulators Group (IRG), the long run view of costs can be defined as
“ the time horizon within which the operator can undertake capital investment or divestment to increase or decrease the capacity of its existing productive assets.”
This does mean that all costs and investments are potentially variable. This approach is increasingly used on regulated markets, as it is pointed out in the ERG report “Regulatory Accounting in Practice 2007”, April 2007.
Page 5
EPT Telecom Division Regulatory costing for “Wholesale” products
SUMMARY OF COST ALLOCATION
To reflect a forward looking long run approach EPT makes a number of adjustments on the cost data. These are as follows:
• Current cost accounting; • Tariffs are calculated based on a forecast of costs in year N; • Costs resulting from inefficiencies must be excluded; therefore, supplementary efficiency studies have
been conducted; and • A modified scorched node approach is employed.
Current cost accounting
EPT’s approach is discussed in detail in the document “EPT 2008 Current Cost Accounting Methodology”.
Cost forecasts
In order to comply with a forward-looking approach, the cost model used by EPT takes into account:
• Historical financial data (audited financials from previous year); • Financial data available for the current year as well as an estimate until the end of the current year, and • Budgeted costs for the next financial year (excluding already costs due to inefficiency)
Inefficient costs
EPT makes adjustments to building assets for unused floor space, and to switching assets for efficiency. EPT’s approach is summarized below and discussed in detail in the document “EPT : Efficiency in the context of RIO 2008”published on EPT website.
Scorched node
The modified scorched node approach assumes that the existing nodes in the network remain in their current locations and that the technology within each may alter (scorched node assumption). The asset within each node may alter to be the modern equivalent asset – this is discussed in more detail in the document “EPT 2008 Current Cost Accounting Methodology”. The future network has fewer nodes than today. This reflects the future efficiency adjustments that an efficient operator may expect.
This contrasts with a scorched earth approach (commonly used in bottom up models), where input costs are on an optimum network design (variable node locations and numbers) were the network to be built today. This approach was not used – such an approach that needs to adapt the network radically would be unrealistic for an incumbent operator. This technique is generally not used by the incumbent operator and was not required by the ILR.
1.3.4 Current Cost Accounting
EPT is required to produce interconnection and access tariffs on a cost orientated basis including a reasonable return on capital employed. Therefore asset values represent a key input in the cost model, as they are used to calculate the allowable return on capital employed through multiplication by the weighted average cost of capital (WACC). The related annual depreciation charge of the asset is also an important input in establishing annualised costs.
Page 6
EPT Telecom Division Regulatory costing for “Wholesale” products
SUMMARY OF COST ALLOCATION
In general there are two primary approaches to asset valuation when calculating cost orientated interconnection and access tariffs:
• Historical cost accounting (HCA) – where the historic book value of the asset and its related depreciation is used as an input, and;
• Current cost accounting (CCA) – where the historic book value of an asset is revalued to reflect its current costs - namely the cost to replace the asset should it be brought today. The related depreciation is also adjusted to reflect the change in the book value from one period to the next.
Regulators consider forward looking costs to be an appropriate basis for interconnection charges because they reflect the costs of providing the service were the investment to be made today, and therefore provide the appropriate signals to new entrants when making their investment decisions, and to consumers when consuming products.
In a document setting out the principles of implementation and best practice (PIB) for CCA1, the Independent Regulator’s Group (IRG) states (in PIB 1) that:
“IRG acknowledges that the use and application of CCA is supported and encouraged by the European Regulatory framework . . . . financial information prepared using CCA methodologies have an important role to play in regulatory decision making”
A report by the European Regulators Group (ERG)2 in 2006 showed that 79% of incumbent operators in European Union countries adopt a CCA approach when valuing their assets for interconnection pricing purposes.
EPT’s approach to its CCA revaluation is discussed in detail in the document “EPT 2008 Current Cost Accounting Methodology” published on EPT website.
In summary EPT’s approach to asset revaluation is as follows:
• EPT will adopt a CCA approach to valuing its assets and calculating depreciation. • EPT will use the FCM accounting concept (where holding gains/losses are reflected through an
additional charge in the RIO model) as opposed to OCM (where such holding gains or losses would not be reflected).
• EPT will use an indexation approach to revaluing assets, applying a MEA price where appropriate, for the following asset types:
o Buildings and land; o Transmission; o Switching equipment; and o Diggings.
• This represents 80% of net book value. All remaining assets will be treated at historical cost. • EPT will separately identify historical depreciation, supplementary depreciation and net holding
gains/losses as inputs into the RIO model.
The approach is in line with European best practice, and meets recommendations issued by the European Union, the ERG and the IRG.
1 IRG Public consultation document – Principles of Implementation and Best Practice regarding the use of current cost accounting methodologies as applied to electronic communication activities – January 2006 2 ERG - Regulatory Accounting in Practice - April 2006.
Page 7
EPT Telecom Division Regulatory costing for “Wholesale” products
SUMMARY OF COST ALLOCATION
1.3.5 Return on capital employed (ROCE)
According to the Access Directive’s Article 13 (1), regulated companies are entitled to have a reasonable return on their investments included in the prices paid by third parties.
Internationally, a reasonable return is calculated by multiplying a company’s net capital employed by its weighted average cost of capital (WACC), and including return in the cost used to calculate interconnection and access tariffs.
WACC has been used in a range of European countries for the purpose of calculating cost oriented tariffs, including Austria, Belgium, Denmark, Finland, France, Germany, Greece, Ireland, Italy, Netherlands, Spain, Sweden and the UK.
The approach to calculating the WACC is is discussed in detail in the document “EPT: Weighted Average Cost Of Capital (WACC) October 2007” published on EPT Website.
The WACC formula
EPT proposes to calculate a nominal pre-tax WACC using the following internationally accepted formula:
VER
VDTRWACC ecd +−= )1(
Where
• Rd is pre-tax cost of debt, assumed to be equal to the return on a risk-free investment plus EPT’s corporate debt premium, i.e. Rd= Rf+Dp. EPT currently has no long-term debt. The cost of debt will therefore have to be estimated for various capital structures.
• Tc is the corporate tax rate. Rd(1-Tc) is therefore the cost of debt after the corporate tax. • D and E are the values of EPT’s debt and equity respectively and V is the sum of D and E. As such, D/V
and E/V represent the relative weighting of debt and equity used to fund EPT’s operations. EPT’s current capital structure (all equity) hence implies E/V=1. An optimal capital structure will be estimated. The final WACC estimate will hence be based on an assumption of E/V<1.
• Re is the cost of equity capital and is derived from the Capital Asset Pricing Model (CAPM).
Page 8
EPT Telecom Division Regulatory costing for “Wholesale” products
SUMMARY OF COST ALLOCATION
2 MODEL OVERVIEW AND ALLOCATION METHODS
2.1 Scope of the document
This section provides an overview of the Regulatory Costing Model (hereby “the model”), and a summary of the attribution methodologies used to allocate telecommunications operational, depreciation and asset costs to interconnection and access wholesale products. Cost types and the processes involved in their allocation or apportionment are described, showing how costs are treated from their initial appearance in EPT’s separated accounting records to their ultimate attribution to costs groups inside the model.
2.2 Cost categories
In the model, allocations are based on cost centres. In the accounting system of EPT, costs are grouped in cost centres allowing an allocation of costs on an disaggregated basis. For analytical view in the model, cost centres can be broadly separated into operational and asset costs. Plus, costs are defined according to their nature as direct costs (sitting in cost centres that are directly attributed to network elements or products) or indirect costs (sitting in cost centres allocated to network elements or products through activities). Some costs centres are not relevant for the calculation of interconnection and access tariffs. These are parked in a separate group within the model and are not taken into account when calculating tariffs. Parked costs include the following items:
• Mobile costs – all costs relating to EPT’s mobile business; • Retail costs – all costs directly relating to retail activities • Inefficient costs – a proportion of costs are removed from buildings and switching equipment
representing spare capacity and efficiencies that could be achieved from optimising the network.
2.2.1 Operational costs
Operational costs are mainly personnel costs and operating charges.
2.2.2 Asset costs
The costs relating to assets – capital costs and the corresponding depreciation – can be categorised as network assets and non-network or general assets. Cost centres that bear network assets costs can be directly (through a one to one mapping) or indirectly (through a one to many mapping) allocated to physical network elements at stage 6, and are then allocated to final products through the sub-network mapping phase, in which physical network elements (i.e. the physical equipment) are mapped to final network elements which represent the logical make up of the network. For example, the cost centre “SDH Commun” is mapped to the physical network element “SDH – core transmission”, among other destinations. This is then allocated to final network elements such as “PSTN core transmission or LL E1 Pop to Pop” via the sub network element mapping.
Page 9
EPT Telecom Division Regulatory costing for “Wholesale” products
SUMMARY OF COST ALLOCATION
The major network assets are as follows:
• Switching equipment; • Transmission equipment; • Underground network – cable and duct.
In addition a significant proportion of EPT’s buildings assets can be directly allocated to Network Elements. Sample data has been used to apportion the costs resulting from the use of network within the sub-network element mapping. The sample has been constructed according to generally accepted statistical methods to meet the following principles:
• Unbiased/ objective • Sample size has been assessed to be statistically significant • Sample is representative of the entire population • It is not biased by seasonal factors
Non-network assets are of a general supporting nature such as general IT equipment, vehicles and non-network buildings. In the model, these are allocated to the centres of responsibility based on the number of full time employees in each centre of responsibility, and thus indirectly to the activities that consume these assets.
2.3 Costing methodologies
The approach for building the model follows three complementary logics: • Cascade allocation, • Activity Based Costing (hereafter referred to as ABC), • Allocation through routing tables.
One of the key principles of regulatory accounting is cost causality which requires that costs are allocated to those services, businesses or activities that cause those costs to arise.
The three principles are not mixed within allocation stages but occur each at specific stages in the model.
2.3.1 Cascade Allocation
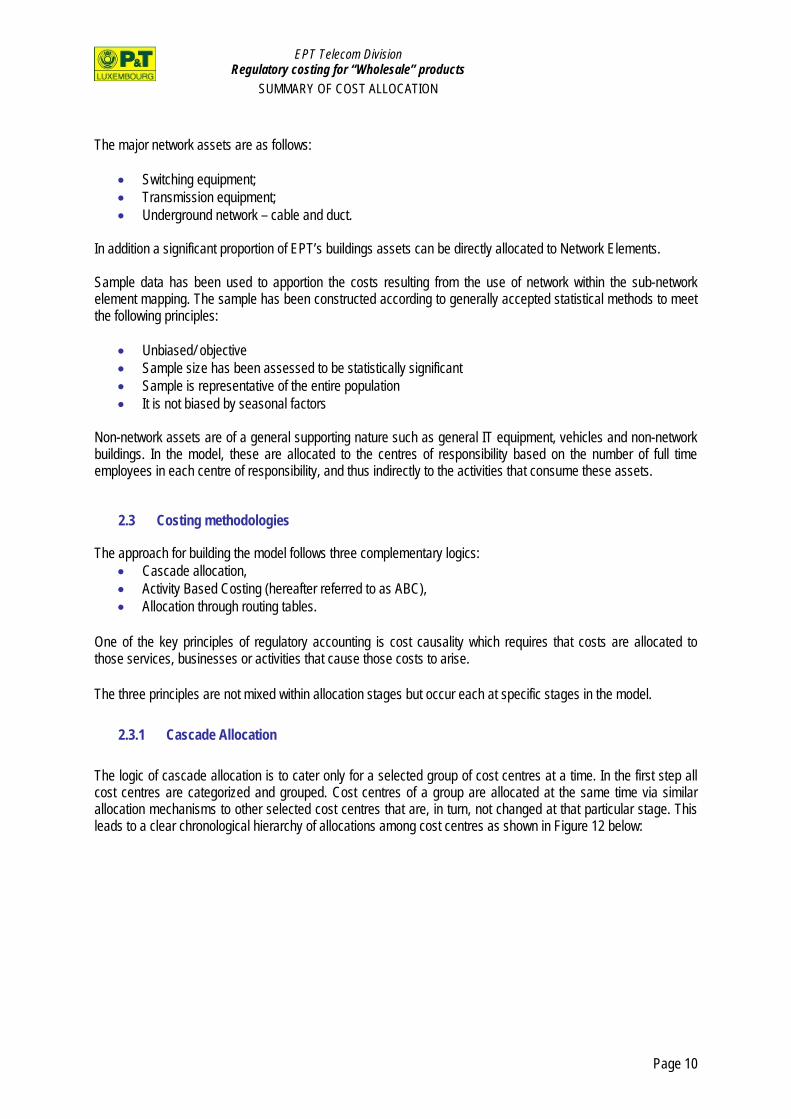
The logic of cascade allocation is to cater only for a selected group of cost centres at a time. In the first step all cost centres are categorized and grouped. Cost centres of a group are allocated at the same time via similar allocation mechanisms to other selected cost centres that are, in turn, not changed at that particular stage. This leads to a clear chronological hierarchy of allocations among cost centres as shown in Figure 12 below:
Page 10
EPT Telecom Division Regulatory costing for “Wholesale” products
SUMMARY OF COST ALLOCATION
Principles of the costs cascade methodology First group of cost centres to be allocated to all other cost centres that are not allocated at this stage
Second group of cost centres to be allocated to all other cost centres that are not allocated at this stage
Third group of cost centres to be allocated to all other cost centres that are not allocated at this stage
Residual cost centres that have received costs from all others
Figure1 Cascade methodology For example:
o At stage 2 in the model Non-CT building cost centres are allocated to all other cost centres; or o At stage 3 in the model support cost centres are allocated to all other cost centres.
2.3.2 Activity Based Costing
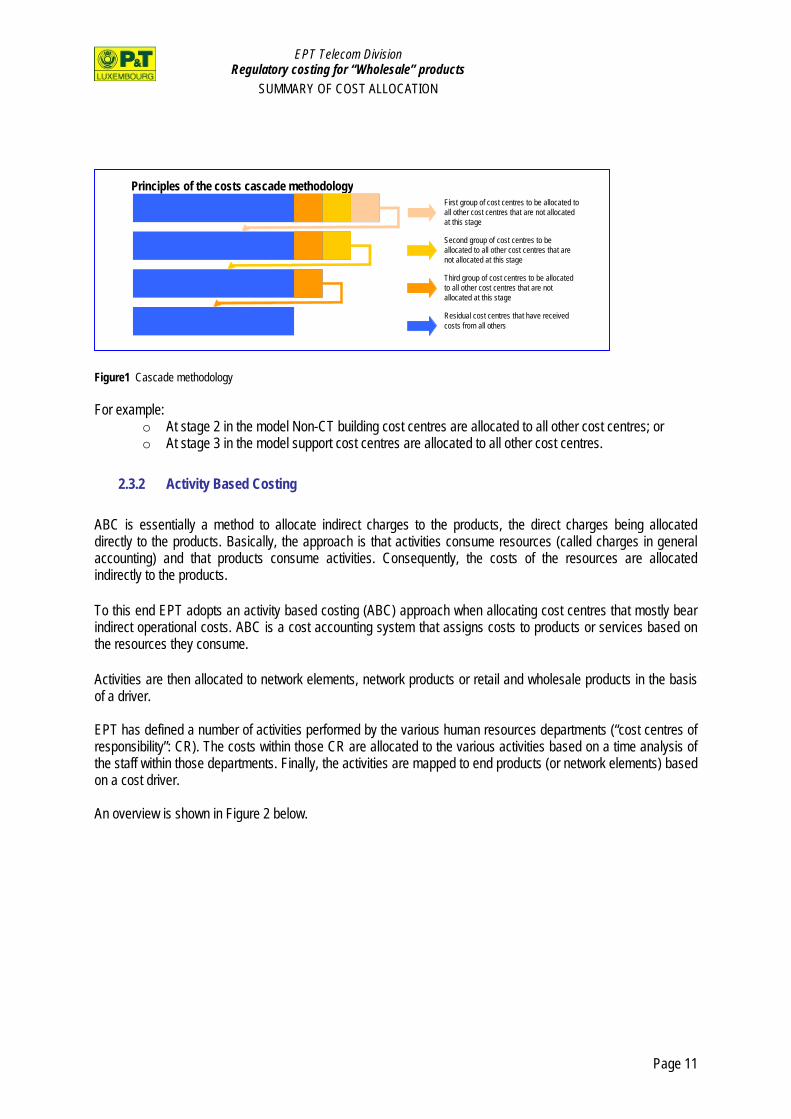
ABC is essentially a method to allocate indirect charges to the products, the direct charges being allocated directly to the products. Basically, the approach is that activities consume resources (called charges in general accounting) and that products consume activities. Consequently, the costs of the resources are allocated indirectly to the products.
To this end EPT adopts an activity based costing (ABC) approach when allocating cost centres that mostly bear indirect operational costs. ABC is a cost accounting system that assigns costs to products or services based on the resources they consume.
Activities are then allocated to network elements, network products or retail and wholesale products in the basis of a driver. EPT has defined a number of activities performed by the various human resources departments (“cost centres of responsibility”: CR). The costs within those CR are allocated to the various activities based on a time analysis of the staff within those departments. Finally, the activities are mapped to end products (or network elements) based on a cost driver. An overview is shown in Figure 2 below.
Page 11
EPT Telecom Division Regulatory costing for “Wholesale” products
SUMMARY OF COST ALLOCATION
Figure 2 ABC methodology
2.3.3 Routing tables
The model has two layers of products – network products and retail and wholesale products. In the network products layer, costs are allocated from network elements to network products through the use of route factors. The network element route factors for call products are based upon the call volume data drawn from a sample from representative period twice a year. A forecast of the traffic has been included in the routing tables. For leased line and rental products route factors represent the average usage of the final network element for each product type and level of capacity. The network products represent generic products that are used both internally by EPT and sold externally to wholesale and retail customers. The next step is therefore to allocate network products to retail and wholesale products through the use of usage factors. This is to demonstrate that the costs that EPT pays internally for network products are equivalent to those it charges other operators.
2.3.4 Direct allocations
Some allocations in the model are performed using specific drivers. In particular, some cost centres consist of direct costs that need to be allocated directly to a target – either among the sub network hierarchies or to the product layers. The drivers that allocate these cost centres are “direct allocation” drivers.
2.3.5 Summary
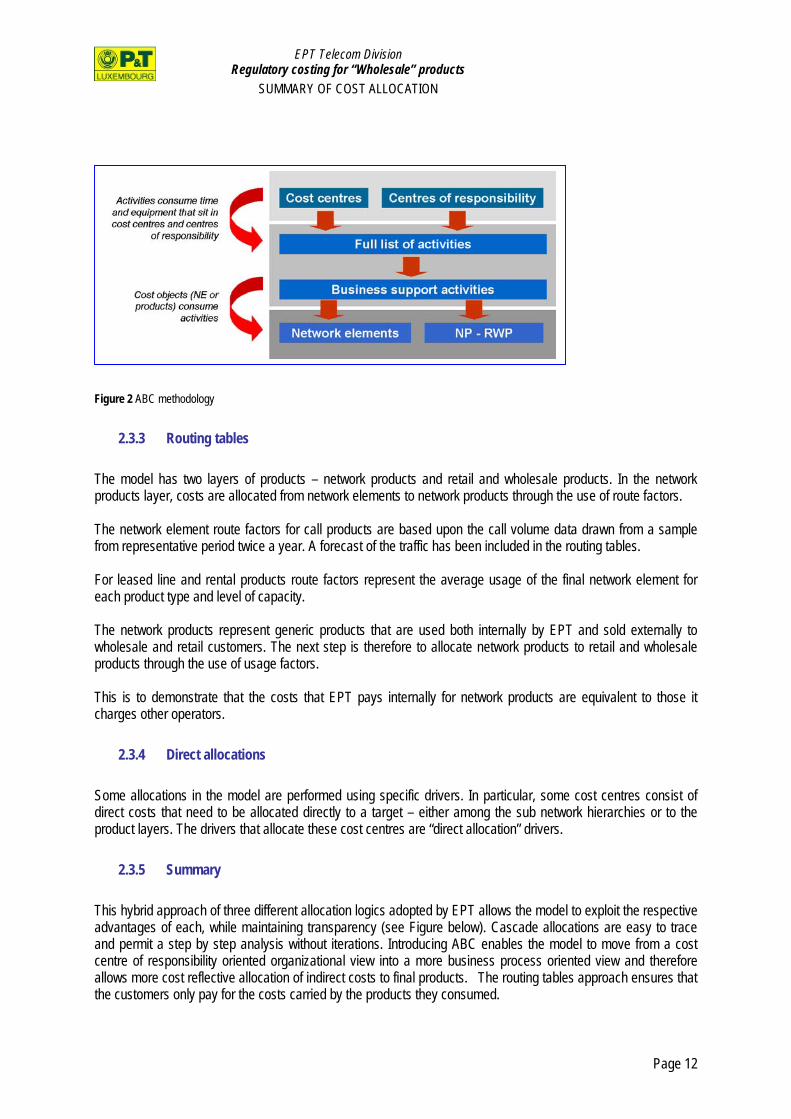
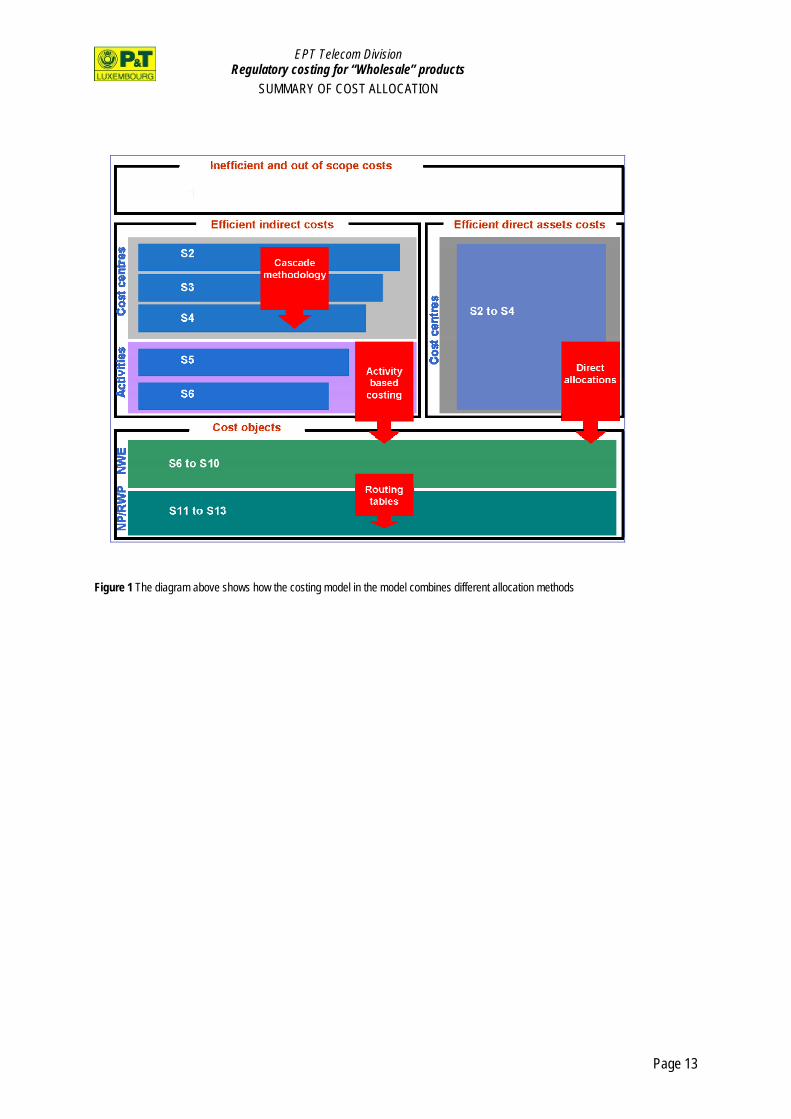
This hybrid approach of three different allocation logics adopted by EPT allows the model to exploit the respective advantages of each, while maintaining transparency (see Figure below). Cascade allocations are easy to trace and permit a step by step analysis without iterations. Introducing ABC enables the model to move from a cost centre of responsibility oriented organizational view into a more business process oriented view and therefore allows more cost reflective allocation of indirect costs to final products. The routing tables approach ensures that the customers only pay for the costs carried by the products they consumed.
Page 12
EPT Telecom Division Regulatory costing for “Wholesale” products
SUMMARY OF COST ALLOCATION
Figure 1 The diagram above shows how the costing model in the model combines different allocation methods
Page 13
EPT Telecom Division Regulatory costing for “Wholesale” products
SUMMARY OF COST ALLOCATION
3 MODEL INPUTS
3.1 Costs
3.1.1 Sources of costs
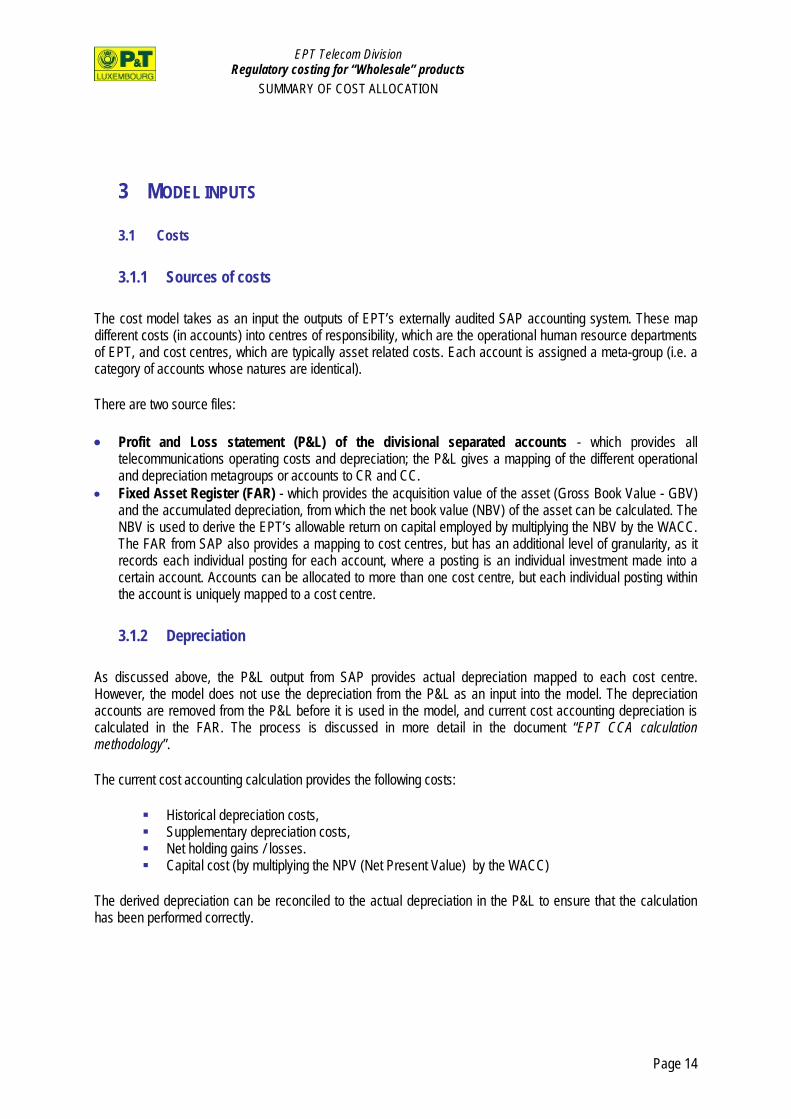
The cost model takes as an input the outputs of EPT’s externally audited SAP accounting system. These map different costs (in accounts) into centres of responsibility, which are the operational human resource departments of EPT, and cost centres, which are typically asset related costs. Each account is assigned a meta-group (i.e. a category of accounts whose natures are identical).
There are two source files:
• Profit and Loss statement (P&L) of the divisional separated accounts - which provides all telecommunications operating costs and depreciation; the P&L gives a mapping of the different operational and depreciation metagroups or accounts to CR and CC.
• Fixed Asset Register (FAR) - which provides the acquisition value of the asset (Gross Book Value - GBV) and the accumulated depreciation, from which the net book value (NBV) of the asset can be calculated. The NBV is used to derive the EPT’s allowable return on capital employed by multiplying the NBV by the WACC. The FAR from SAP also provides a mapping to cost centres, but has an additional level of granularity, as it records each individual posting for each account, where a posting is an individual investment made into a certain account. Accounts can be allocated to more than one cost centre, but each individual posting within the account is uniquely mapped to a cost centre.
3.1.2 Depreciation
As discussed above, the P&L output from SAP provides actual depreciation mapped to each cost centre. However, the model does not use the depreciation from the P&L as an input into the model. The depreciation accounts are removed from the P&L before it is used in the model, and current cost accounting depreciation is calculated in the FAR. The process is discussed in more detail in the document “EPT CCA calculation methodology”.
The current cost accounting calculation provides the following costs:
Historical depreciation costs, Supplementary depreciation costs, Net holding gains / losses. Capital cost (by multiplying the NPV (Net Present Value) by the WACC)
The derived depreciation can be reconciled to the actual depreciation in the P&L to ensure that the calculation has been performed correctly.
Page 14
EPT Telecom Division Regulatory costing for “Wholesale” products
SUMMARY OF COST ALLOCATION
3.1.3 Budgeted figures
The most recently available set of audited accounts are for year N-2. EPT has an internal budgeting process for both the P&L and FAR, for year N-1. Then, EPT makes a forecast for year N that will be used as input into the model.
3.1.4 Definition of cost types
Beside the grouping of accounts in metagroups as defined in the general accounting system of EPT allowing an audit view of the inputs of the model, accounts are also grouped in cost types allowing a more analytical view of costs. When running the model with CCA (Current Cost Accounting) figures, the different cost types used in the model are: • Operational – personnel and other, • Asset costs – cost of capital through WACC applied on net present value, • Depreciation – historic, supplementary, net holding gains or losses.
Page 15
EPT Telecom Division Regulatory costing for “Wholesale” products
SUMMARY OF COST ALLOCATION
Costs types Definition – scope
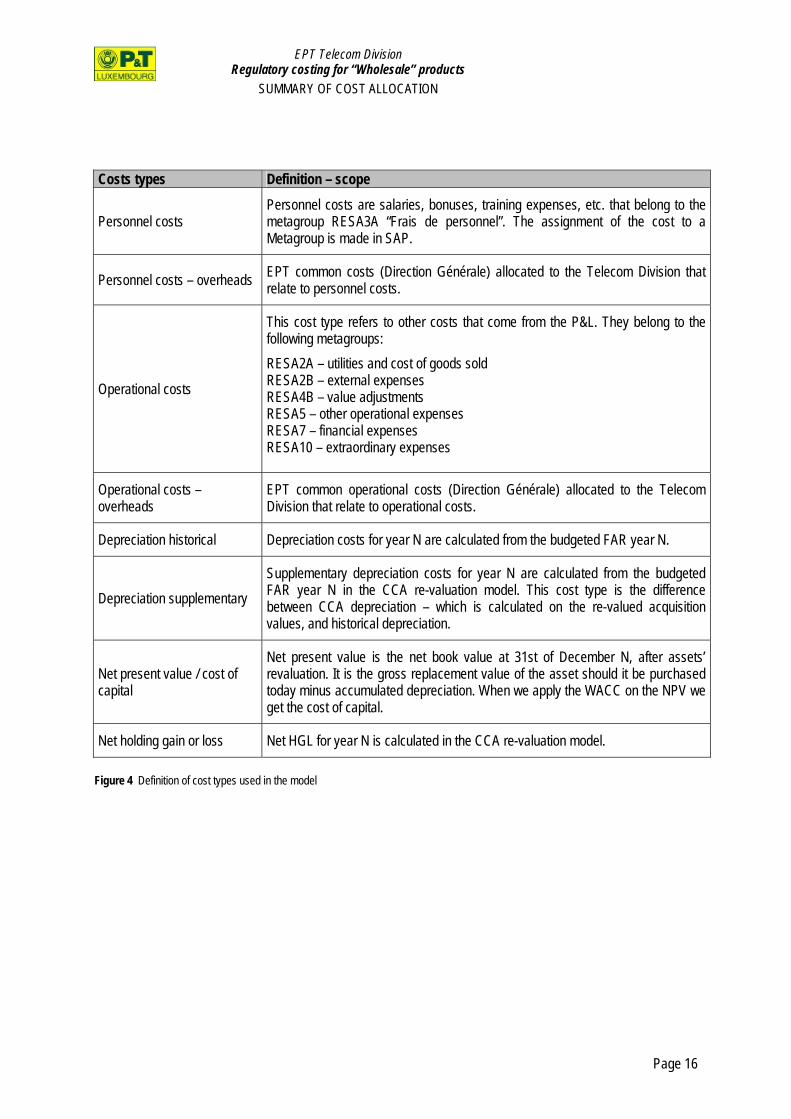
Personnel costs Personnel costs are salaries, bonuses, training expenses, etc. that belong to the metagroup RESA3A “Frais de personnel”. The assignment of the cost to a Metagroup is made in SAP.
Personnel costs – overheads EPT common costs (Direction Générale) allocated to the Telecom Division that relate to personnel costs.
Operational costs
This cost type refers to other costs that come from the P&L. They belong to the following metagroups: RESA2A – utilities and cost of goods sold RESA2B – external expenses RESA4B – value adjustments RESA5 – other operational expenses RESA7 – financial expenses RESA10 – extraordinary expenses
Operational costs – overheads
EPT common operational costs (Direction Générale) allocated to the Telecom Division that relate to operational costs.
Depreciation historical Depreciation costs for year N are calculated from the budgeted FAR year N.
Depreciation supplementary Supplementary depreciation costs for year N are calculated from the budgeted FAR year N in the CCA re-valuation model. This cost type is the difference between CCA depreciation – which is calculated on the re-valued acquisition values, and historical depreciation.
Net present value / cost of capital
Net present value is the net book value at 31st of December N, after assets’ revaluation. It is the gross replacement value of the asset should it be purchased today minus accumulated depreciation. When we apply the WACC on the NPV we get the cost of capital.
Net holding gain or loss Net HGL for year N is calculated in the CCA re-valuation model.
Figure 4 Definition of cost types used in the model
Page 16
EPT Telecom Division Regulatory costing for “Wholesale” products
SUMMARY OF COST ALLOCATION
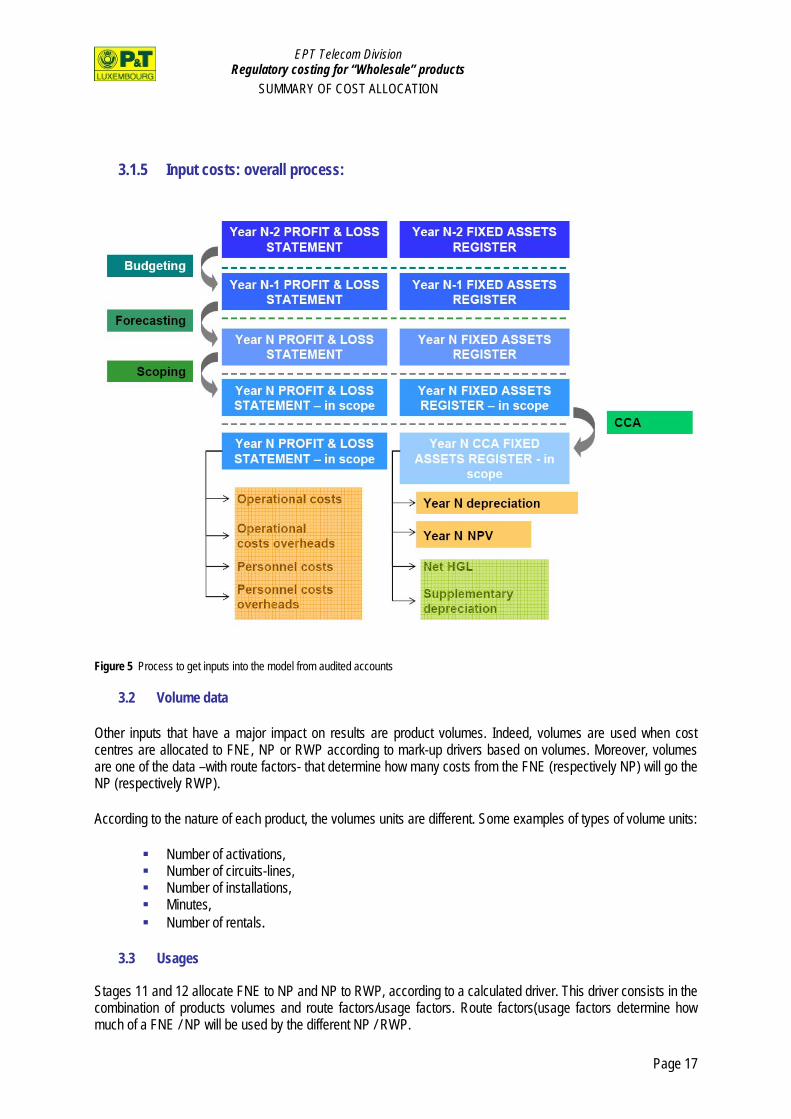
3.1.5 Input costs: overall process:
Figure 5 Process to get inputs into the model from audited accounts
3.2 Volume data
Other inputs that have a major impact on results are product volumes. Indeed, volumes are used when cost centres are allocated to FNE, NP or RWP according to mark-up drivers based on volumes. Moreover, volumes are one of the data –with route factors- that determine how many costs from the FNE (respectively NP) will go the NP (respectively RWP).
According to the nature of each product, the volumes units are different. Some examples of types of volume units:
Number of activations, Number of circuits-lines, Number of installations, Minutes, Number of rentals.
3.3 Usages
Stages 11 and 12 allocate FNE to NP and NP to RWP, according to a calculated driver. This driver consists in the combination of products volumes and route factors/usage factors. Route factors(usage factors determine how much of a FNE / NP will be used by the different NP / RWP.
Page 17
EPT Telecom Division Regulatory costing for “Wholesale” products
SUMMARY OF COST ALLOCATION
3.4 Drivers
Principles The determination of cost drivers must respect the following principles:
• Principle of relevance for the business; • The data used to establish the driver must be relevant to that driver; • Forward-looking principle; • The cost drivers are calculated on basis of current or future prices or information, i.e. current prices of
equipment, forecast of traffic per communication type; and • Principle of an efficient network.
Driver types Drivers are different according to the cost centres they apply on. Specific drivers are generally derived from SAP accounting separation drivers, or have been created with time analysis. Drivers are for example based on:
- full time equivalents (FTE), - time analysis (% split), - square meters, - number of cars, - revenues, - network usage (number of lines, capacity, number of circuits, etc …)
Then, some cost centres are allocated according to mark-up drivers, when destinations are heterogeneous and no relevant keys can be applied on. These mark-ups are made using net present values, total costs or operational costs.
Page 18
EPT Telecom Division Regulatory costing for “Wholesale” products
SUMMARY OF COST ALLOCATION
4 COST ALLOCATION
4.1 Model overview
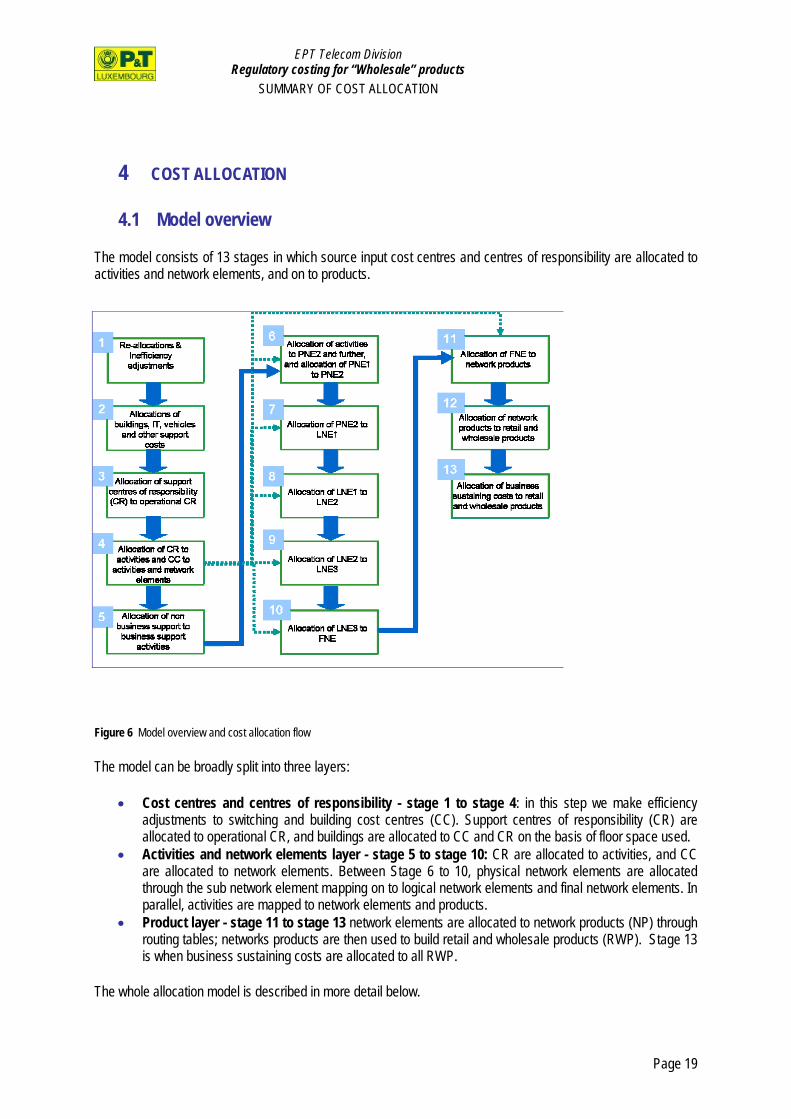
The model consists of 13 stages in which source input cost centres and centres of responsibility are allocated to activities and network elements, and on to products.
Figure 6 Model overview and cost allocation flow
The model can be broadly split into three layers:
• Cost centres and centres of responsibility - stage 1 to stage 4: in this step we make efficiency adjustments to switching and building cost centres (CC). Support centres of responsibility (CR) are allocated to operational CR, and buildings are allocated to CC and CR on the basis of floor space used.
• Activities and network elements layer - stage 5 to stage 10: CR are allocated to activities, and CC are allocated to network elements. Between Stage 6 to 10, physical network elements are allocated through the sub network element mapping on to logical network elements and final network elements. In parallel, activities are mapped to network elements and products.
• Product layer - stage 11 to stage 13 network elements are allocated to network products (NP) through routing tables; networks products are then used to build retail and wholesale products (RWP). Stage 13 is when business sustaining costs are allocated to all RWP.
The whole allocation model is described in more detail below.
Page 19
EPT Telecom Division Regulatory costing for “Wholesale” products
SUMMARY OF COST ALLOCATION
4.2 Stage 1: Re-allocations and inefficiency adjustments
Stage 1 of the model covers two different issues: • Re-allocation of obsolete cost centres; • Deduction of inefficient costs and co-location costs; • Parked costs.
4.2.1 Re-allocations
Re-allocations concern cost centres that contain audited accounts from year N-2, but which will be replaced with newly defined cost centres in year N-1.
4.2.2 Inefficiency
In Stage 1 an efficiency adjustment is made for inefficient costs and for costs incurred for co-location. This is due to the incumbent’s legal obligation to consider only the cost share that is theoretically incurred by an efficient operator. An inefficiency adjustment is made to both CT(“Centrale Téléphonique”) Buildings based on floor space to be unused and Switching Equipment based on the loss incurred by not replacing the local exchanges by RDLU (Remote Digital Line Unit). Furthermore, co-location adjustments only concern certain CT Buildings. Deducted costs are not considered for calculating interconnection and access tariffs. The analysis provides a percentage for the deduction of co-location costs in certain CT Buildings. The rate for co-location varies, depending on the individual CT Building.
4.2.3 Parking
Cost centres that are “Out of Scope” of the model (not DT) are also parked immediately at a dedicated pool.
4.3 Stage 2: allocations of buildings, IT, vehicles and other support cost centres
Stage 2 deals with the allocation of costs that can be classified as supportive in nature: • Non-CT Building costs, buildings not hosting switches devices, • IT costs, IT services that are consumed exclusively by activities, • Vehicle costs, costs incurred for the vehicle fleet of the telecommunications division, • Other Support costs, cost centres that render a service to other cost centres. The output these cost centres produce is consumed by other cost centres, by centres of responsibility or by activities. As a result, the cost sitting in these supportive cost centres must be allocated to the consuming units.
Page 20
EPT Telecom Division Regulatory costing for “Wholesale” products
SUMMARY OF COST ALLOCATION
4.4 Stage 3: allocation of support centres of responsibility to operational centres of responsibility
Stage 3 of the model only concerns centres of responsibility. The full list of centres of responsibility can be subdivided into:
• CR that serve other CR, known as overhead CR, • CR that are part of an activity, known as operational CR.
Overhead CR are allocated to selected groups of operational CR based on FTE keys.
4.5 Stage 4: allocation of centres of responsibility to activities, and cost centres to activities, network elements and products
Stage 4 of the model covers the allocation of remaining cost centres and centres of responsibility:
• Cost centres are allocated to activities, network elements or products; and • Centres of responsibility are allocated to activities.
4.5.1 Cost centres
At stage 4 cost centres have different natures according to which they are allocated:
• Building cost centres are allocated to activities or PNE2(Physical Network Elements Level 2): Building-cost centres e.g. headquarter department buildings do not refer directly to a
switching activity and are therefore allocated to all business support activities, using a key based on the number of FTE.
CT buildings cost centres that host switching devices, and the common part of buildings allocated to the telecommunication division, are allocated to PNE2 using keys based on footprints used by the equipment
• Other cost centres are directly allocated to activities, PNE1(Physical Network Elements Level 1) or
NP(Network Products). Drivers are based on: 100% allocation for cost centres which have a clear target in the next layers, Mark-ups for cost centres assigned to many activities or products, FTE for cost centres allocated to a selected group of activities.
4.5.2 Centres of Responsibility
Centres of responsibility are allocated exclusively to activities. Allocation keys are based on time analysis interviews with the head of departments in each centre of responsibility. The process was to agree on a list of activities each centre of responsibility undertakes and then to estimate the time take on each activity by the individual staff members within that centre of responsibility.
Page 21
EPT Telecom Division Regulatory costing for “Wholesale” products
SUMMARY OF COST ALLOCATION
4.6 Stage 5: Allocation of Common Activities to Business Support Activities
Stage 5 is concerned with the allocation of common activities to business support activities:
4.6.1 Common Activities
These activities are not business process oriented and do not serve an operational purpose. They can be considered as overhead activities and are mostly allocated to operational Business Support Activities via a mark-up on total cost. Examples of these common activities are “accounting and controlling” or “car fleet management”.
4.6.2 Business Support Activities
Business Support Activities have a clear link to network elements and products. These activities have an operational impact and receive their share of common activities, while they are allocated to their equivalents at the next layer (100% allocation). These activities are allocated to network elements and products in stage 6.
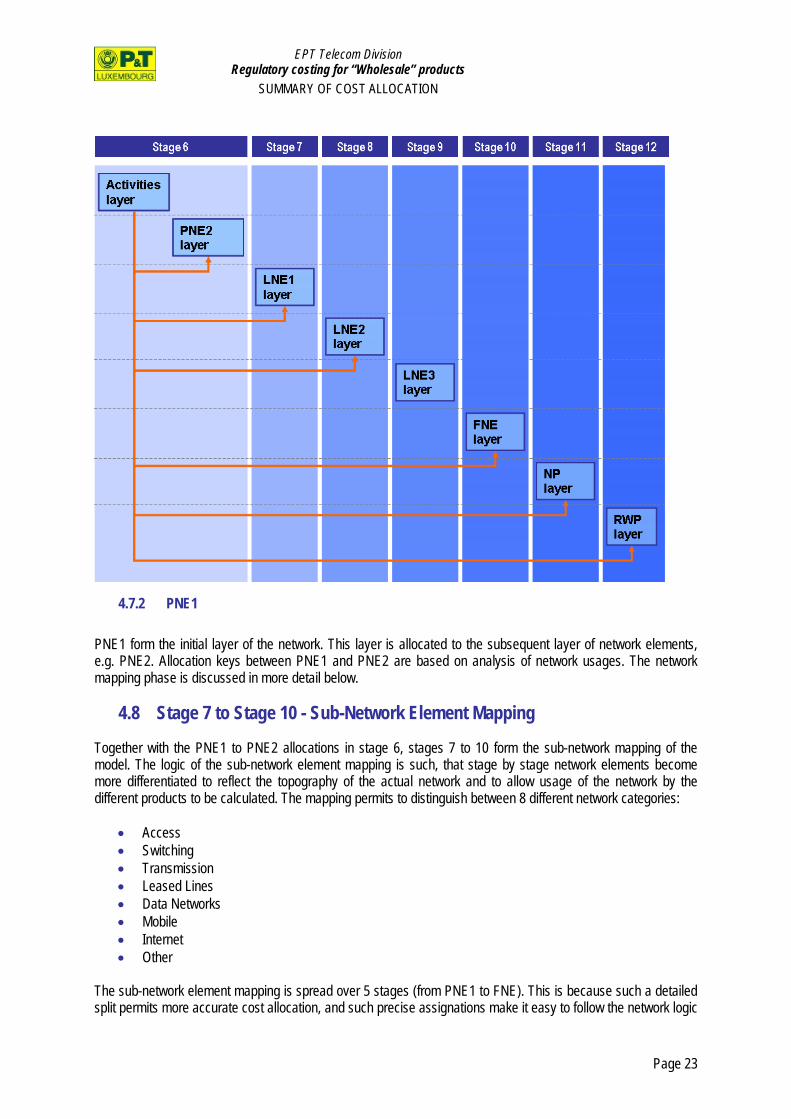
4.7 Stage 6: Allocation of activities to network elements and products and allocation of physical network elements (PNE) 1 to PNE 2
At stage 6, cost groups from two different layers are allocated at a time: • Business Support Activities; and • Physical Network Elements (PNE) 1.
4.7.1 Business support activities
Activities are allocated to various layers of the network, depending on how network elements consume the activity. Destinations are found in the: Physical Network Element Level 2 (PNE2), Logical Network Element Level 1 (LNE1), Logical Network Element Level 2 (LNE2), Final Network Element (FNE), Network Products (NP) and Retail Wholesale Products (RWP) layers of the network (see Figure below). Activities can be mapped to network elements or products either directly or through the use of drivers that reflect the consumption of the activity by the different network element or product. Drivers are based on:
Mark-up on net present value, Volumes (when destinations are FNE, NP or RWP), Direct allocation (100% allocation).
Page 22
EPT Telecom Division Regulatory costing for “Wholesale” products
SUMMARY OF COST ALLOCATION
Figure 7 Mapping of business support activities
4.7.2 PNE1
PNE1 form the initial layer of the network. This layer is allocated to the subsequent layer of network elements, e.g. PNE2. Allocation keys between PNE1 and PNE2 are based on analysis of network usages. The network mapping phase is discussed in more detail below.
4.8 Stage 7 to Stage 10 - Sub-Network Element Mapping
Together with the PNE1 to PNE2 allocations in stage 6, stages 7 to 10 form the sub-network mapping of the model. The logic of the sub-network element mapping is such, that stage by stage network elements become more differentiated to reflect the topography of the actual network and to allow usage of the network by the different products to be calculated. The mapping permits to distinguish between 8 different network categories:
• Access • Switching • Transmission • Leased Lines • Data Networks • Mobile • Internet • Other
The sub-network element mapping is spread over 5 stages (from PNE1 to FNE). This is because such a detailed split permits more accurate cost allocation, and such precise assignations make it easy to follow the network logic
Page 23
EPT Telecom Division Regulatory costing for “Wholesale” products
SUMMARY OF COST ALLOCATION
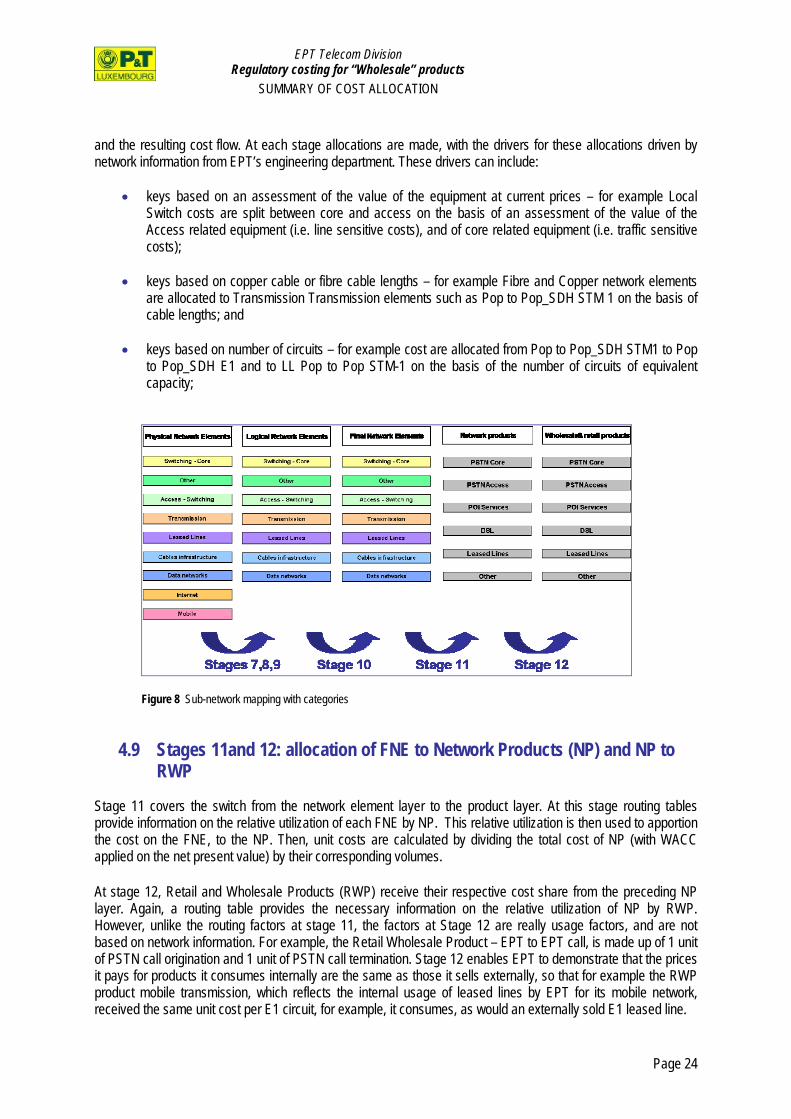
and the resulting cost flow. At each stage allocations are made, with the drivers for these allocations driven by network information from EPT’s engineering department. These drivers can include:
• keys based on an assessment of the value of the equipment at current prices – for example Local
Switch costs are split between core and access on the basis of an assessment of the value of the Access related equipment (i.e. line sensitive costs), and of core related equipment (i.e. traffic sensitive costs);
• keys based on copper cable or fibre cable lengths – for example Fibre and Copper network elements
are allocated to Transmission Transmission elements such as Pop to Pop_SDH STM 1 on the basis of cable lengths; and
• keys based on number of circuits – for example cost are allocated from Pop to Pop_SDH STM1 to Pop
to Pop_SDH E1 and to LL Pop to Pop STM-1 on the basis of the number of circuits of equivalent capacity;
Figure 8 Sub-network mapping with categories
4.9 Stages 11and 12: allocation of FNE to Network Products (NP) and NP to RWP
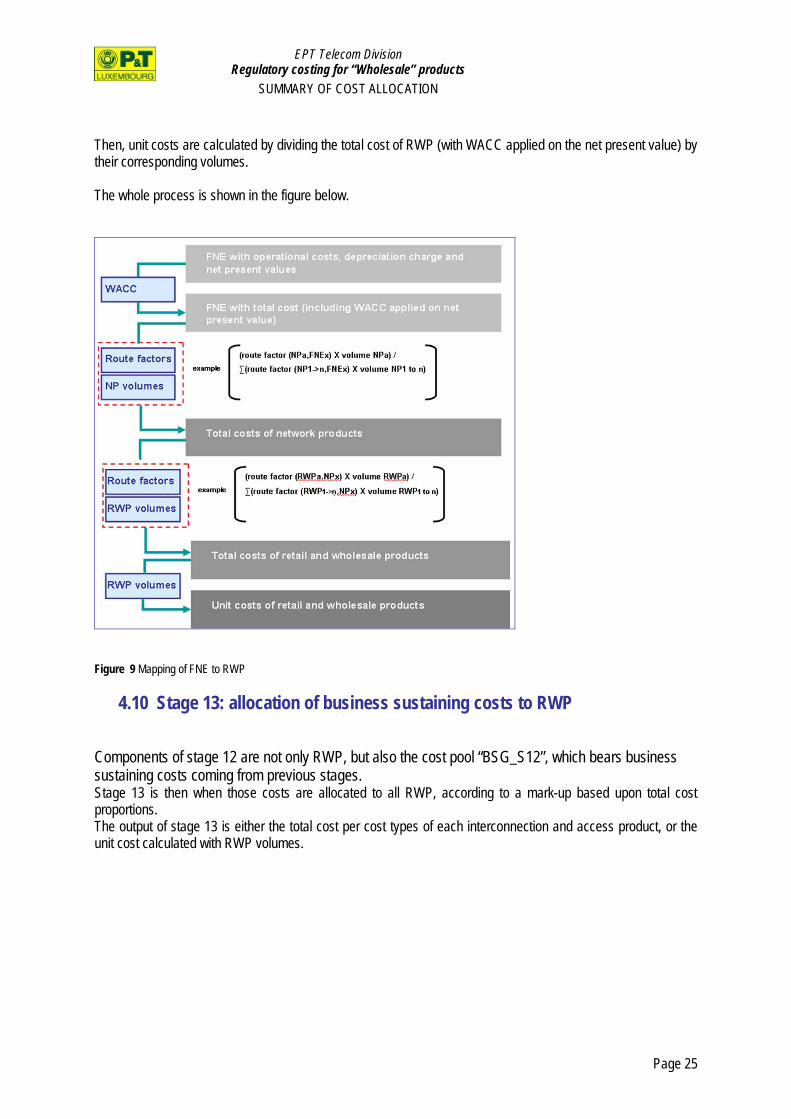
Stage 11 covers the switch from the network element layer to the product layer. At this stage routing tables provide information on the relative utilization of each FNE by NP. This relative utilization is then used to apportion the cost on the FNE, to the NP. Then, unit costs are calculated by dividing the total cost of NP (with WACC applied on the net present value) by their corresponding volumes.
At stage 12, Retail and Wholesale Products (RWP) receive their respective cost share from the preceding NP layer. Again, a routing table provides the necessary information on the relative utilization of NP by RWP. However, unlike the routing factors at stage 11, the factors at Stage 12 are really usage factors, and are not based on network information. For example, the Retail Wholesale Product – EPT to EPT call, is made up of 1 unit of PSTN call origination and 1 unit of PSTN call termination. Stage 12 enables EPT to demonstrate that the prices it pays for products it consumes internally are the same as those it sells externally, so that for example the RWP product mobile transmission, which reflects the internal usage of leased lines by EPT for its mobile network, received the same unit cost per E1 circuit, for example, it consumes, as would an externally sold E1 leased line.
Page 24
EPT Telecom Division Regulatory costing for “Wholesale” products
SUMMARY OF COST ALLOCATION
Then, unit costs are calculated by dividing the total cost of RWP (with WACC applied on the net present value) by their corresponding volumes. The whole process is shown in the figure below.
Figure 9 Mapping of FNE to RWP
4.10 Stage 13: allocation of business sustaining costs to RWP
Components of stage 12 are not only RWP, but also the cost pool “BSG_S12”, which bears business sustaining costs coming from previous stages. Stage 13 is then when those costs are allocated to all RWP, according to a mark-up based upon total cost proportions. The output of stage 13 is either the total cost per cost types of each interconnection and access product, or the unit cost calculated with RWP volumes.
Page 25
EPT Telecom Division Regulatory costing for “Wholesale” products
SUMMARY OF COST ALLOCATION
Page 26
5 MODEL OUTPUTS
Once all the allocations cycles have been performed, we get the total costs of each interconnection or access products, from which we can derive the unit costs. These costs can be split either into the different cost types or the metagroups that constitute them. Moreover, each of the 13 stages of the model can produce results: the total costs of any cost centre at any hierarchical layer can be calculated. This is particularly useful in the sub-network mapping -as costs are identifiable from the PNE1 layer to the RWP layer-, but also at stage 5 to measure the indirect costs that sit in each activity. This capability allows transparency and traceability in the costs allocation process.