Embed Size (px)
Citation preview

EPRA Sustainability Best Practices Recommendations Guidelines
Third versionSeptember 2017
EPRA – Best Practices Recommendations on Sustainability Reporting – third version September 2017 2
1 Foreword 4 2 EPRA Sustainability Committee 5 3 Executive Summary 6
3.1 Introduction 63.2 Scope of EPRA sBPR 63.3 EPRA Sustainability Performance Measures 73.4 Overarching Recommendations 83.5 Linking Overarching Recommendations
to Performance Measures� 11��4� EPRA�Sustainability�Performance�Measures�- Environment� 12
4.1 Elec-Abs Total electricity consumption 124.2 Elec-LfL Like-for-like total electricity consumption 134.3 DH&C-Abs Total district heating & cooling consumption 134.4 DH&C-LfL Like-for-like total district heating
& cooling consumption� 144.5 Fuels-Abs Total fuel consumption 154.6 Fuels-LfL Like-for-like total fuel consumption 164.7 Energy-Int Building energy intensity 174.8 �GHG-Dir-Abs�Total�direct�greenhouse�gas�(GHG) emissions 194.9 GHG-Indir-Abs Total indirect greenhouse gas
(GHG) emissions� 194.10 GHG-Int Greenhouse gas (GHG) emissions intensity 214.11 Water-Abs Total water consumption 234.12 Water-LfL Like-for-like total water consumption 244.13 Water-Int Building water intensity 254.14 Waste-Abs Total weight of waste by disposal route 264.15 Waste-LfL Like-for-like total weight of waste
by disposal route� 274.16� �Cert-Tot�Type�and�number�of�sustainably�certified assets� 28
��5� EPRA�Sustainability�Performance�Measures�- Social� 305.1 Diversity-Emp Employee gender diversity 305.2 Diversity-Pay Gender pay ratio 315.3 Emp-Training Training and development 315.4 Emp-Dev Employee performance appraisals 325.5 Emp-Turnover Employee turnover and retention 335.6 H&S-Emp Employee health and safety 345.7 H&S-Asset Asset health and safety assessments 355.8 H&S-Comp Asset health and safety compliance 365.9 Comty-Eng Community engagement, impact
assessments and�development�programmes� 37
Contents
EPRA – Best Practices Recommendations on Sustainability Reporting – third version September 2017 3
6� EPRA�Sustainability�Performance�Measures�- Governance� 386.1� �Gov-Board�Composition�of�the�highest�governance body� 386.2 Gov-Select Nominating and selecting the highest
governance body� 396.3� Gov-CoI�Process�for�managing�conflicts�of�interest� 39
7 Overarching Recommendations 417.1 Organisational boundaries 417.2 Coverage 427.3 Estimation of landlord-obtained utility consumption 427.4 Third Party Assurance 437.5 Boundaries – reporting on landlord and tenant
utility consumption� 437.6 Normalisation 447.7 egmental analysis (by property type, geography etc.) 457.8� Disclosure�on�own�offices� 467.9 Narrative on performance 467.10� �Location�of�EPRA�Sustainability�Performance�Measures in�
companies’ reports 477.11 Reporting period 477.12 Materiality 47
8 Other issues to consider 498.1 Emerging�Indicator�–�Return�On�Carbon�Emissions (ROCE) 498.2 Socio-Economic Indicators related to Sustainability
Performance 498.3 Transport 508.4 Refrigerant gases 50
��9� Definitions�–�Glossary�of�Terms� 5110� Appendix�–�sample�table�of�EPRA�Sustainability Performance�
Measures 54
EPRA – Best Practices Recommendations on Sustainability Reporting – third version September 2017 4
1. Foreword
We are pleased to publish the third edition of the EPRA Best Practices Recommendations for Sustainability Reporting (EPRA sBPR). Since the launch of the first edition of the EPRA sBPR in 2011 and of the EPRA sBPR awards, we have seen a steady increase in the number of EPRA members and non-EPRA member constituents of the FTSE EPRA/NAREIT Developed Europe REITs Index using the sBPR to report on their environmental performance.
The third edition of the EPRA sBPR draws on the Global Reporting Initiative’s Reporting Standards (2016 edition) and Construction and Real Estate Sector Disclosures (CRESD), and complements the existing and well-established EPRA Financial BPR. Furthermore, the third edition of the guidelines meets the following objectives:
• Providing further clarity, conciseness and support for companies wishing to disclose their performance in accordance with the EPRA sBPR guidelines;
• Aligning with the updated Global Reporting Initiative’s (GRI) Standards 2016.
Significantly, we have expanded the number and scope performance measures to cover the wider social and governance impacts of real estate companies including diversity, employee development, health and safety, community investment, Board composition, selection and conflicts of interest.
On the one hand, establishing common metrics on social and governance issues supports EPRA members and the growing expectation for reporting on non-financial indicators as set out in Directive 2014/95/EU of the European Parliament and of the Council on disclosure of non-financial and diversity information. Secondly, leading real estate companies are already seeking to measure their wider impact and contribution to society at both an asset and corporate level.
We hope the process of reporting in line with these guidelines will facilitate a greater understanding of the environmental, social and governance impacts associated with your company’s activities, leading to efficiency gains and, ultimately, lower operating costs, and social and governance benefits.
Olivier ElamineChief�Executive�Officer,�alstria�office�REITChairman, EPRA Sustainability Committee
Hassan SabirDirector of Finance, EPRA
September 2017
EPRA – Best Practices Recommendations on Sustainability Reporting – third version September 2017 5
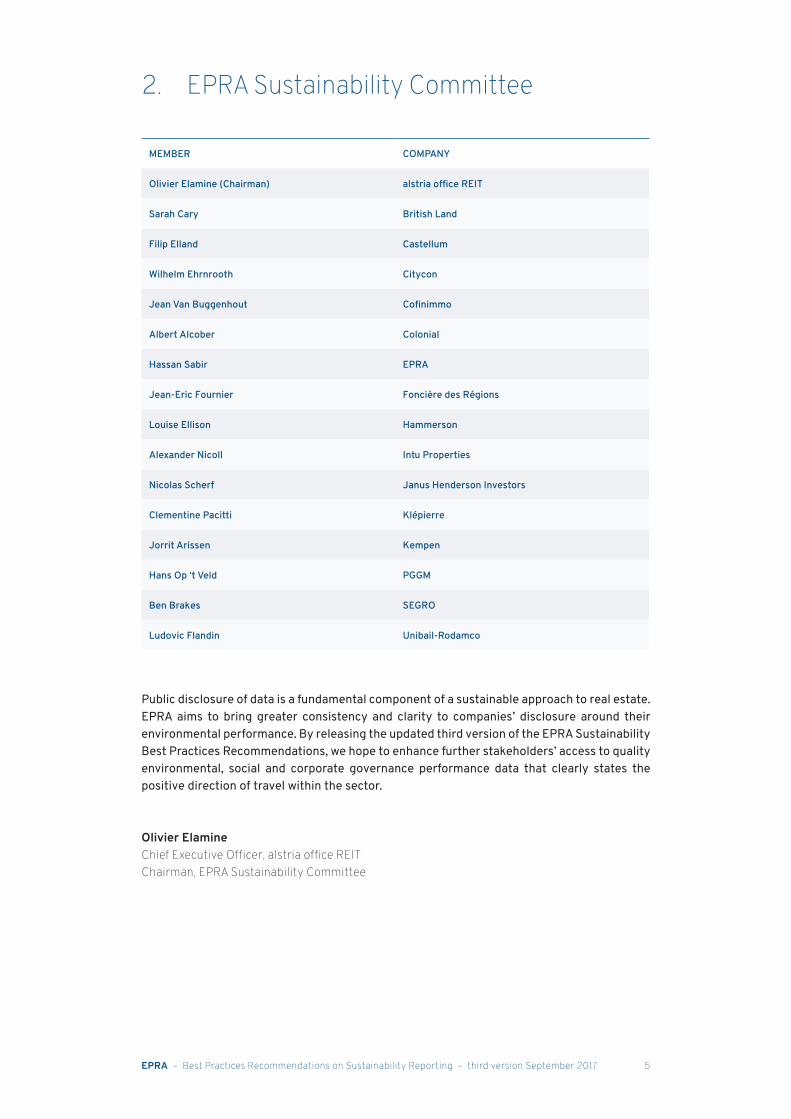
2. EPRA Sustainability Committee
MEMBER COMPANY
Olivier Elamine (Chairman) alstria office REIT
Sarah Cary British Land
Filip Elland Castellum
Wilhelm Ehrnrooth Citycon
Jean Van Buggenhout Cofinimmo
Albert Alcober Colonial
Hassan Sabir EPRA
Jean-Eric Fournier Foncière des Régions
Louise Ellison Hammerson
Alexander Nicoll Intu Properties
Nicolas Scherf Janus Henderson Investors
Clementine Pacitti Klépierre
Jorrit Arissen Kempen
Hans Op ‘t Veld PGGM
Ben Brakes SEGRO
Ludovic Flandin Unibail-Rodamco
Public disclosure of data is a fundamental component of a sustainable approach to real estate. EPRA aims to bring greater consistency and clarity to companies’ disclosure around their environmental performance. By releasing the updated third version of the EPRA Sustainability Best Practices Recommendations, we hope to enhance further stakeholders’ access to quality environmental, social and corporate governance performance data that clearly states the positive direction of travel within the sector.
Olivier ElamineChief�Executive�Officer,�alstria�office�REITChairman, EPRA Sustainability Committee
EPRA – Best Practices Recommendations on Sustainability Reporting – third version September 2017 6
3. Executive Summary
3.1 Introduction
The Sustainability Performance Measures and Overarching Recommendations of the EPRA Sustainability Best Practices Recommendations (sBPR) have been developed by the EPRA Sustainability Reporting Committee (‘the Committee’) in consultation with the wider EPRA membership. These measures are largely based on the GRI Standards (2016 edition) and Construction and Real Estate Sector Supplement Disclosure.
This document contains a number of CORE recommendations for sustainability reporting, which must be reported by all EPRA members, alongside ADDITIONAL recommendations based on the Committee’s observations of good practice. These additional recommendations are especially relevant to companies with a long standing track record of sustainability reporting.
3.2 Scope of EPRA sBPR
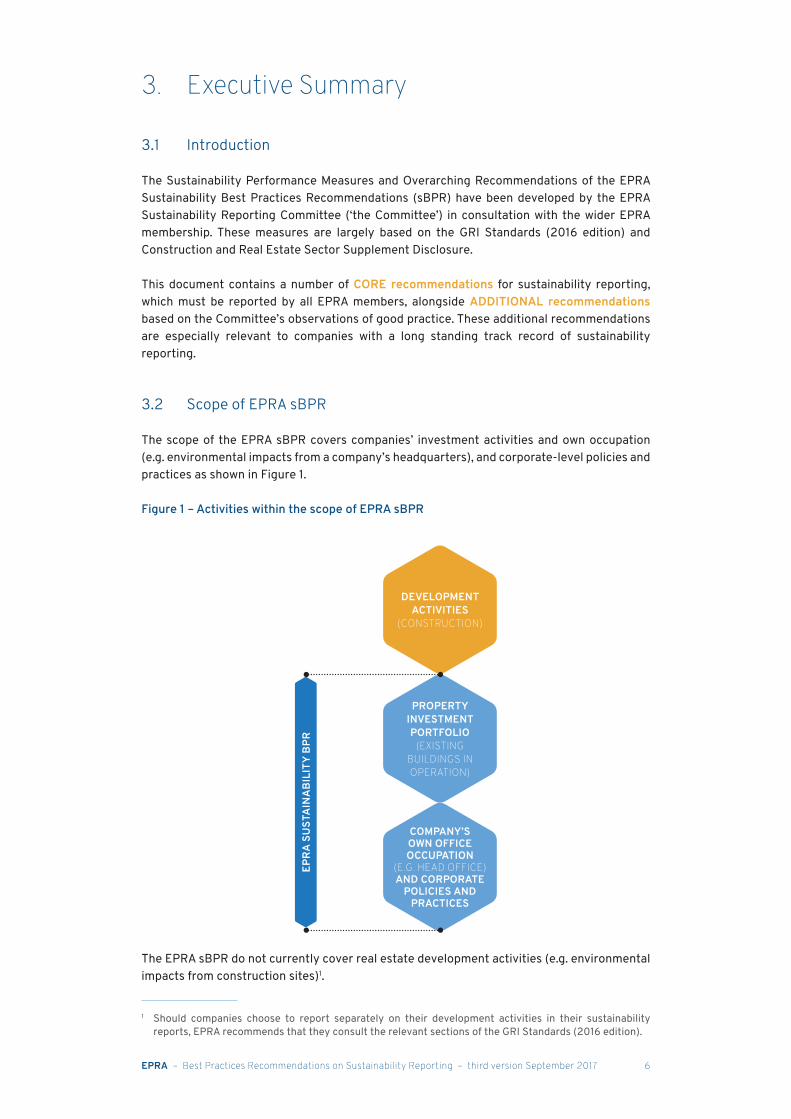
The scope of the EPRA sBPR covers companies’ investment activities and own occupation (e.g. environmental impacts from a company’s headquarters), and corporate-level policies and practices as shown in Figure 1.
Figure 1 – Activities within the scope of EPRA sBPR
The EPRA sBPR do not currently cover real estate development activities (e.g. environmental impacts from construction sites)1.
1 Should companies choose to report separately on their development activities in their sustainability reports, EPRA recommends that they consult the relevant sections of the GRI Standards (2016 edition).
DEVELOPMENT ACTIVITIES
(CONSTRUCTION)
PROPERTY INVESTMENT PORTFOLIO
(EXISTING BUILDINGS IN OPERATION)
COMPANY’S OWN OFFICE OCCUPATION
(E.G. HEAD OFFICE)AND CORPORATE
POLICIES AND PRACTICES
EPRA
SU
STA
INA
BILI
TY B
PR
EPRA – Best Practices Recommendations on Sustainability Reporting – third version September 2017 7
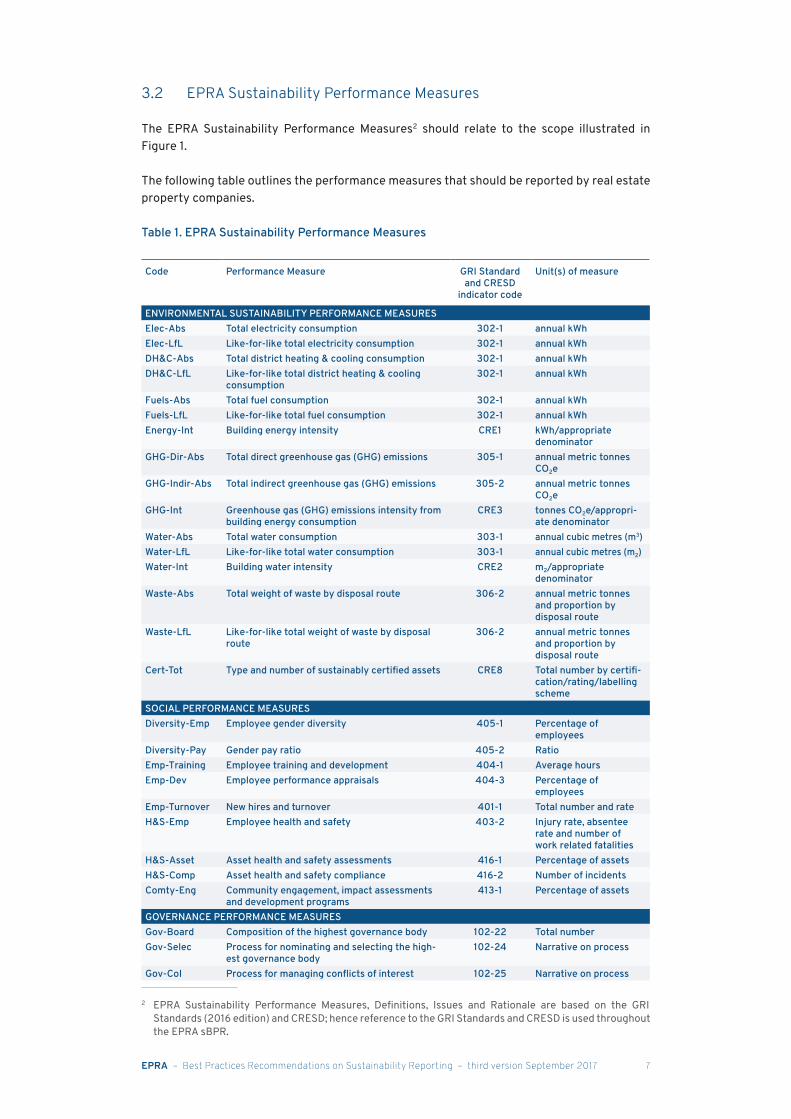
3.2 EPRA Sustainability Performance Measures
The EPRA Sustainability Performance Measures2 should relate to the scope illustrated in Figure 1.
The following table outlines the performance measures that should be reported by real estate property companies.
Table 1. EPRA Sustainability Performance Measures
Code Performance Measure GRI Standard and CRESD
indicator code
Unit(s) of measure
ENVIRONMENTAL SUSTAINABILITY PERFORMANCE MEASURESElec-Abs Total electricity consumption 302-1 annual kWhElec-LfL Like-for-like total electricity consumption 302-1 annual kWhDH&C-Abs Total district heating & cooling consumption 302-1 annual kWhDH&C-LfL Like-for-like total district heating & cooling
consumption302-1 annual kWh
Fuels-Abs Total fuel consumption 302-1 annual kWhFuels-LfL Like-for-like total fuel consumption 302-1 annual kWhEnergy-Int Building energy intensity CRE1 kWh/appropriate
denominatorGHG-Dir-Abs Total direct greenhouse gas (GHG) emissions 305-1 annual metric tonnes
CO2e GHG-Indir-Abs Total indirect greenhouse gas (GHG) emissions 305-2 annual metric tonnes
CO2e GHG-Int Greenhouse gas (GHG) emissions intensity from
building energy consumptionCRE3 tonnes CO2e/appropri-
ate denominatorWater-Abs Total water consumption 303-1 annual cubic metres (m3)Water-LfL Like-for-like total water consumption 303-1 annual cubic metres (m2)Water-Int Building water intensity CRE2 m2/appropriate
denominatorWaste-Abs Total weight of waste by disposal route 306-2 annual metric tonnes
and proportion by disposal route
Waste-LfL Like-for-like total weight of waste by disposal route
306-2 annual metric tonnesand proportion by disposal route
Cert-Tot Type and number of sustainably certified assets CRE8 Total number by certifi-cation/rating/labelling scheme
SOCIAL PERFORMANCE MEASURESDiversity-Emp Employee gender diversity 405-1 Percentage of
employeesDiversity-Pay Gender pay ratio 405-2 RatioEmp-Training Employee training and development 404-1 Average hoursEmp-Dev Employee performance appraisals 404-3 Percentage of
employeesEmp-Turnover New hires and turnover 401-1 Total number and rateH&S-Emp Employee health and safety 403-2 Injury rate, absentee
rate and number of work related fatalities
H&S-Asset Asset health and safety assessments 416-1 Percentage of assetsH&S-Comp Asset health and safety compliance 416-2 Number of incidentsComty-Eng Community engagement, impact assessments
and development programs413-1 Percentage of assets
GOVERNANCE PERFORMANCE MEASURESGov-Board Composition of the highest governance body 102-22 Total numberGov-Selec Process for nominating and selecting the high-
est governance body102-24 Narrative on process
Gov-CoI Process for managing conflicts of interest 102-25 Narrative on process
2 EPRA Sustainability Performance Measures, Definitions, Issues and Rationale are based on the GRI Standards (2016 edition) and CRESD; hence reference to the GRI Standards and CRESD is used throughout the EPRA sBPR.
EPRA – Best Practices Recommendations on Sustainability Reporting – third version September 2017 8
3.4 Overarching Recommendations
Section 7 of this document describes the ‘Overarching Recommendations’ – principles that should apply to the reporting of EPRA Sustainability Performance Measures. The following section briefly describes each of these principles. It is important that readers of this document familiarise themselves with Section 7 in detail before embarking on reporting on EPRA Sustainability Performance Measures since these principles underpin meaningful disclosure.
Organisational boundaries (see section 7.1)
Organisational boundaries for asset level performance measures as defined by the GHG Protocol include Operational Control, Financial Control and Equity-share. Boundaries definition is important because it determines, among other things, which assets a reporter will include or exclude from its reporting. Companies should state the company’s total investment in real estate and what percentage of their investment portfolio is represented within the chosen organisational boundary. Defining organisational boundaries should be preceded by defining one’s ownership structures (specifically, establishing whether assets are owned by subsidiaries, associates or joint ventures) in line with the GHG Protocol3. EPRA is not advocating, at this stage, for any specific organisational boundary (the Committee is aware that operational control is the most common approach).
Coverage (see section 7.2)
Coverage shows the percentage of assets (within the organisational boundary) that areincluded in the data disclosed for each asset-level performance measure. Ideally, 100% of assets within the organisational boundary should be included in each asset-level performance measure. Data coverage should be disclosed (as values or percentages) in terms of number, floor area or financial value of assets within the organisational boundary.
Estimation of landlord-obtained utility consumption (see section 7.3)
When landlord-obtained utility consumption data for some/all asset-level performance measures is partially unavailable or unreliable for an asset, missing data can be estimated. Estimation should be carried out as little as possible. When estimating landlord-obtained utility consumption, a company should:• Only estimate data to fill gaps for missing periods using known consumption from other
periods for the metered supply in question;• Disclose the proportion of total disclosed data that is estimated (as a percentage of the total
disclosed for that performance measure);• Disclose the method of estimation used;• Use the same method of estimation for all performance measures and all assets.
Third party assurance (see section 7.4)
The credibility of sustainability data increases when third party assurance is carried out by an objective and independent assurance provider.
When undertaking third party assurance, consider the following:• EPRA sBPR qualitative performance measures should be verified – ideally all of them and
to the same level;• The level of verification for each performance measure must be disclosed and should ideally
be to the same level as for financial reporting;• The full verification statement must be publicly available, and a link should be provided if it
is not included in the report.
3 Please visit www.ghgprotocol.org/ for further information.
EPRA – Best Practices Recommendations on Sustainability Reporting – third version September 2017 9
Boundaries – reporting on landlord and tenant consumption (see section 7.5)
There is no single, optimal way to report on base (landlord only) or whole building consumption for asset-level environmental performance measures. However, companies should report as follows:• Absolute and like-for-like performance measures should include only landlord-obtained
energy/water;• Where energy/water is obtained by the landlord but consumed in tenant areas and sub-
metered, such consumption should be reported separately (and should not be excluded from the totals).
For intensity indicators only, if known, tenant-obtained consumption can be used in calculations, for example, to achieve a situation where whole building consumption (tenant-obtained and landlord-obtained) is divided by the whole building floor area. Normalisation (see section 7.6)
When calculating intensity indicators, companies should ensure the denominator used and the associated consumption figures are as closely aligned as possible. In other words, they should strive to achieve the ‘matching numerator and denominator’ scenario. Companies should clearly state how their intensity indicators are calculated and what numerators and denominators they have used and why. The most commonly used denominators are:• Floor area• Numbers of people• Revenue• Number of hours/days worked (for health and safety performance measures)
Segmental analysis (by property type geography) (see section 7.7)
For asset-level performance measures, this should be in line with companies’ financial reporting and include, where meaningful, analysis by geography/country and/or property type.
Disclosure on own offices (see section 7.8)
In addition to disclosing on its investment portfolio and corporate practices, a company should disclose the environmental impact of its own occupation separately within its sustainability reporting.
Narrative on performance (see section 7.9)
Companies should provide, where appropriate, additional information and commentary/explanation of past performance, and outline plans for managing future performance.
Location of EPRA Sustainability Performance in companies’ reports (see section 7.10)
It is not necessary for companies to report the entirety of the EPRA Sustainability Performance Measures in their Annual Report and Accounts or Sustainability/Corporate Responsibility reports. However, companies must, as a minimum, include a cross-reference (e.g. a reference or hyperlink) to a comprehensive EPRA sBPR table (or location of the performance measures) that uses the performance measure codes (e.g. Elec-LfL) if these have been published elsewhere (e.g. on the company’s website).
Reporting period (see section 7.11)
EPRA – Best Practices Recommendations on Sustainability Reporting – third version September 2017 10
While like-for-like performance measures must be reported for the two most recent years, companies can choose to report their performance against other performance measures over a much longer period. At the same time, companies must balance the benefits of disclosing longer-term trends with the need to provide meaningful data. A company with multiple years’ worth of historical data, for example, may wish to report the oldest year (especially if it is a baseline year) and significant milestone years along with the most recent three years.
Materiality (see section 7.12)
Although conducting a materiality review is not a mandatory requirement, EPRA nether-the-less recommends that reporting companies give due consideration to materiality when compiling their response to the Sustainability Performance Measures using guidance published by the GRI. If an organisation chooses not to respond to a performance measure because it does not consider it to be material, ‘not material’ should be stated in the EPRA Sustainability Performance Measures tables. However, EPRA considers that an impact can only be legitimately accepted as non-material if shown to be so through a materiality review.
EPRA – Best Practices Recommendations on Sustainability Reporting – third version September 2017 11
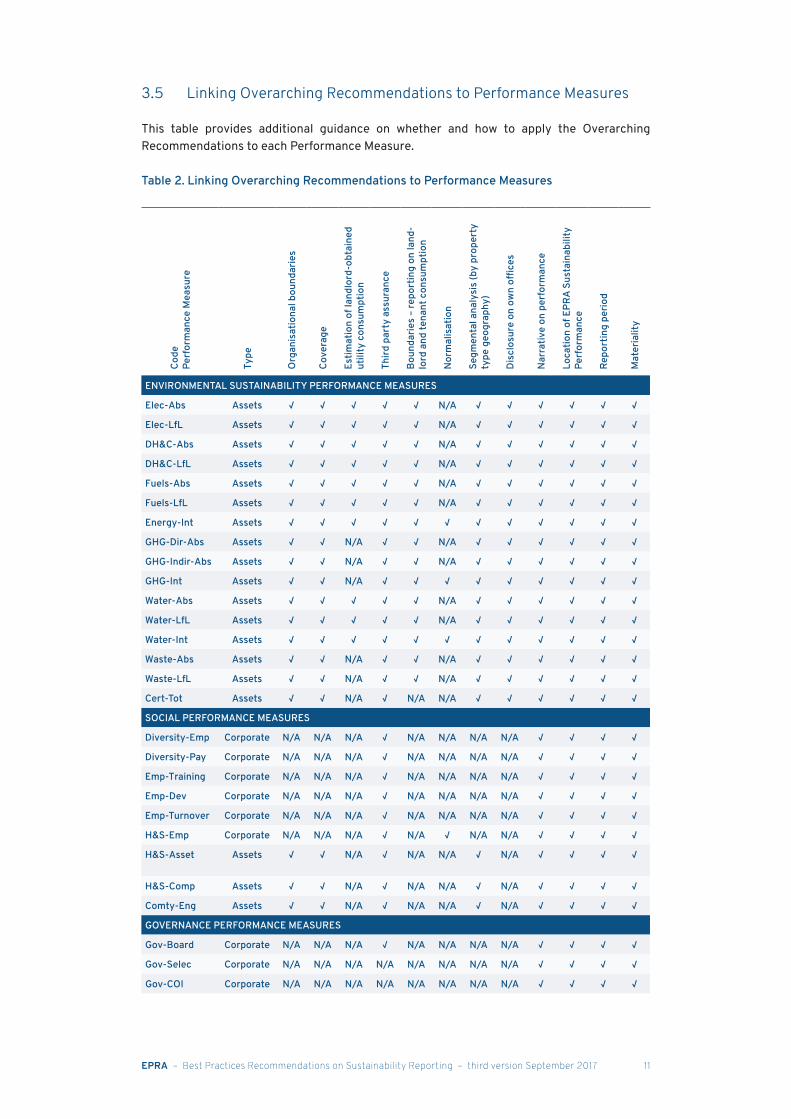
3.5 Linking Overarching Recommendations to Performance Measures
This table provides additional guidance on whether and how to apply the Overarching Recommendations to each Performance Measure.
Table 2. Linking Overarching Recommendations to Performance MeasuresCo
dePe
rfor
man
ce M
easu
re
Type
Org
anis
atio
nal b
ound
arie
s
Cove
rage
Estim
atio
n of
land
lord
-obt
aine
d ut
ility
con
sum
ptio
n
Third
par
ty a
ssur
ance
Boun
darie
s –
repo
rtin
g on
land
-lo
rd a
nd te
nant
con
sum
ptio
n
Nor
mal
isat
ion
Segm
enta
l ana
lysi
s (b
y pr
oper
ty
type
geo
grap
hy)
Disc
losu
re o
n ow
n of
fices
Nar
rativ
e on
per
form
ance
Loca
tion
of E
PRA
Sust
aina
bilit
y Pe
rfor
man
ce
Repo
rtin
g pe
riod
Mat
eria
lity
ENVIRONMENTAL SUSTAINABILITY PERFORMANCE MEASURES
Elec-Abs Assets √ √ √ √ √ N/A √ √ √ √ √ √
Elec-LfL Assets √ √ √ √ √ N/A √ √ √ √ √ √
DH&C-Abs Assets √ √ √ √ √ N/A √ √ √ √ √ √
DH&C-LfL Assets √ √ √ √ √ N/A √ √ √ √ √ √
Fuels-Abs Assets √ √ √ √ √ N/A √ √ √ √ √ √
Fuels-LfL Assets √ √ √ √ √ N/A √ √ √ √ √ √
Energy-Int Assets √ √ √ √ √ √ √ √ √ √ √ √
GHG-Dir-Abs Assets √ √ N/A √ √ N/A √ √ √ √ √ √
GHG-Indir-Abs Assets √ √ N/A √ √ N/A √ √ √ √ √ √
GHG-Int Assets √ √ N/A √ √ √ √ √ √ √ √ √
Water-Abs Assets √ √ √ √ √ N/A √ √ √ √ √ √
Water-LfL Assets √ √ √ √ √ N/A √ √ √ √ √ √
Water-Int Assets √ √ √ √ √ √ √ √ √ √ √ √
Waste-Abs Assets √ √ N/A √ √ N/A √ √ √ √ √ √
Waste-LfL Assets √ √ N/A √ √ N/A √ √ √ √ √ √
Cert-Tot Assets √ √ N/A √ N/A N/A √ √ √ √ √ √
SOCIAL PERFORMANCE MEASURES
Diversity-Emp Corporate N/A N/A N/A √ N/A N/A N/A N/A √ √ √ √
Diversity-Pay Corporate N/A N/A N/A √ N/A N/A N/A N/A √ √ √ √
Emp-Training Corporate N/A N/A N/A √ N/A N/A N/A N/A √ √ √ √
Emp-Dev Corporate N/A N/A N/A √ N/A N/A N/A N/A √ √ √ √
Emp-Turnover Corporate N/A N/A N/A √ N/A N/A N/A N/A √ √ √ √
H&S-Emp Corporate N/A N/A N/A √ N/A √ N/A N/A √ √ √ √
H&S-Asset Assets √ √ N/A √ N/A N/A √ N/A √ √ √ √
H&S-Comp Assets √ √ N/A √ N/A N/A √ N/A √ √ √ √
Comty-Eng Assets √ √ N/A √ N/A N/A √ N/A √ √ √ √
GOVERNANCE PERFORMANCE MEASURES
Gov-Board Corporate N/A N/A N/A √ N/A N/A N/A N/A √ √ √ √
Gov-Selec Corporate N/A N/A N/A N/A N/A N/A N/A N/A √ √ √ √
Gov-COI Corporate N/A N/A N/A N/A N/A N/A N/A N/A √ √ √ √
EPRA – Best Practices Recommendations on Sustainability Reporting – third version September 2017 12
4. EPRA Sustainability Performance Measures�- Environment
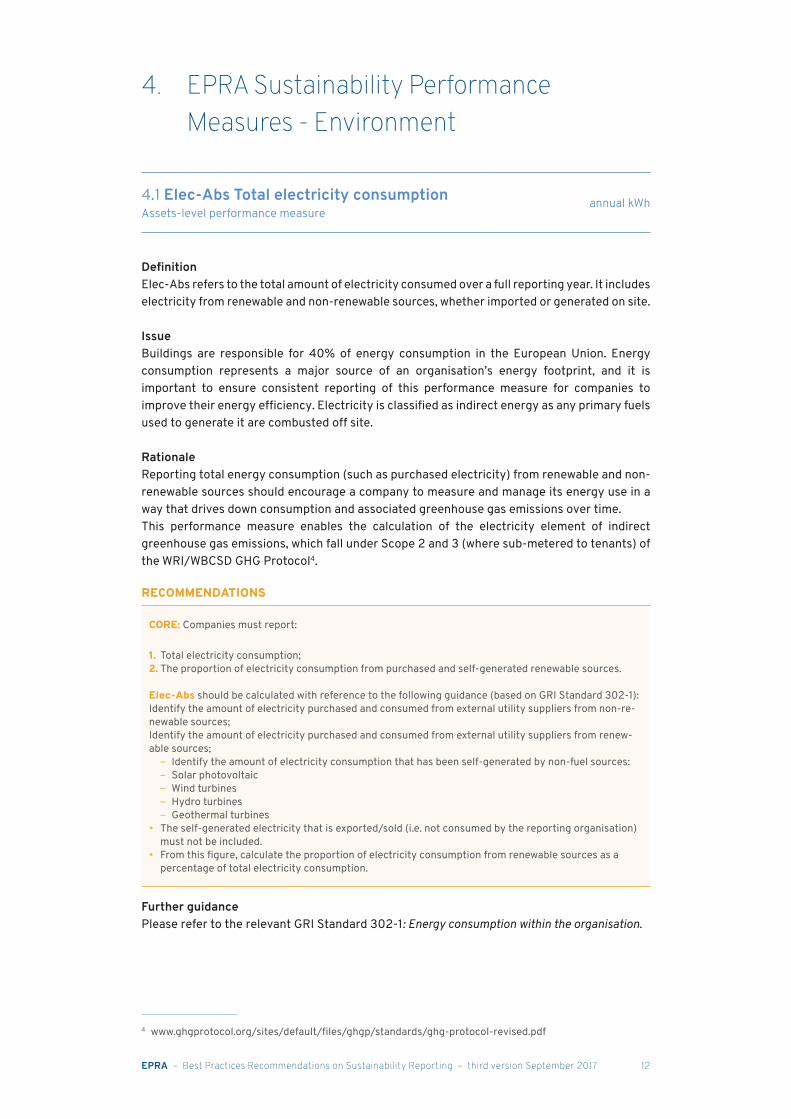
4.1 Elec-Abs Total electricity consumptionAssets-level performance measure
annual kWh
DefinitionElec-Abs refers to the total amount of electricity consumed over a full reporting year. It includes electricity from renewable and non-renewable sources, whether imported or generated on site.
IssueBuildings are responsible for 40% of energy consumption in the European Union. Energy consumption represents a major source of an organisation’s energy footprint, and it is important to ensure consistent reporting of this performance measure for companies to improve their energy efficiency. Electricity is classified as indirect energy as any primary fuels used to generate it are combusted off site.
RationaleReporting total energy consumption (such as purchased electricity) from renewable and non-renewable sources should encourage a company to measure and manage its energy use in a way that drives down consumption and associated greenhouse gas emissions over time. This performance measure enables the calculation of the electricity element of indirect greenhouse gas emissions, which fall under Scope 2 and 3 (where sub-metered to tenants) of the WRI/WBCSD GHG Protocol4.
RECOMMENDATIONS
CORE: Companies must report:
1. Total electricity consumption;2. The proportion of electricity consumption from purchased and self-generated renewable sources.
Elec-Abs should be calculated with reference to the following guidance (based on GRI Standard 302-1):Identify the amount of electricity purchased and consumed from external utility suppliers from non-re-newable sources;Identify the amount of electricity purchased and consumed from external utility suppliers from renew-able sources;
– Identify the amount of electricity consumption that has been self-generated by non-fuel sources: – Solar photovoltaic – Wind turbines – Hydro turbines – Geothermal turbines
• The self-generated electricity that is exported/sold (i.e. not consumed by the reporting organisation) must not be included.
• From this figure, calculate the proportion of electricity consumption from renewable sources as a percentage of total electricity consumption.
Further guidancePlease refer to the relevant GRI Standard 302-1: Energy consumption within the organisation.
4 www.ghgprotocol.org/sites/default/files/ghgp/standards/ghg-protocol-revised.pdf
EPRA – Best Practices Recommendations on Sustainability Reporting – third version September 2017 13
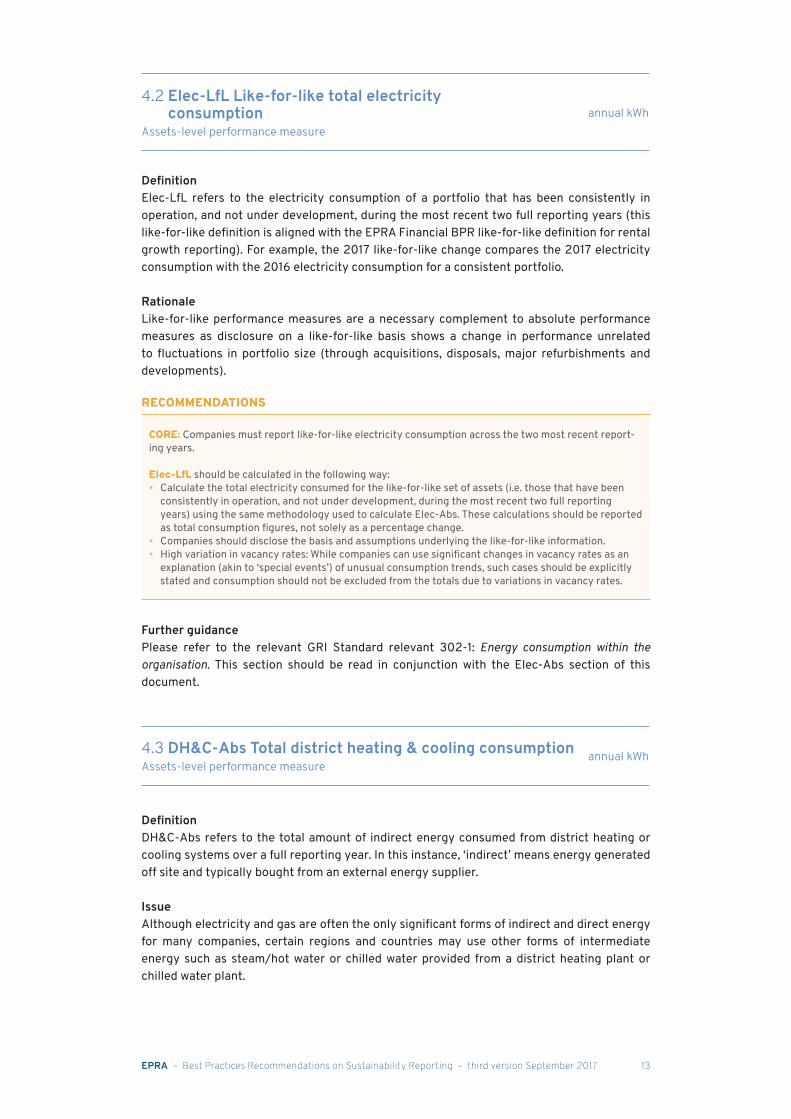
4.2 Elec-LfL Like-for-like total electricity consumption
Assets-level performance measureannual kWh
DefinitionElec-LfL refers to the electricity consumption of a portfolio that has been consistently in operation, and not under development, during the most recent two full reporting years (this like-for-like definition is aligned with the EPRA Financial BPR like-for-like definition for rental growth reporting). For example, the 2017 like-for-like change compares the 2017 electricity consumption with the 2016 electricity consumption for a consistent portfolio.
RationaleLike-for-like performance measures are a necessary complement to absolute performance measures as disclosure on a like-for-like basis shows a change in performance unrelated to fluctuations in portfolio size (through acquisitions, disposals, major refurbishments and developments).
RECOMMENDATIONS
CORE: Companies must report like-for-like electricity consumption across the two most recent report-ing years.
Elec-LfL should be calculated in the following way:• Calculate the total electricity consumed for the like-for-like set of assets (i.e. those that have been
consistently in operation, and not under development, during the most recent two full reporting years) using the same methodology used to calculate Elec-Abs. These calculations should be reported as total consumption figures, not solely as a percentage change.
• Companies should disclose the basis and assumptions underlying the like-for-like information.• High variation in vacancy rates: While companies can use significant changes in vacancy rates as an
explanation (akin to ‘special events’) of unusual consumption trends, such cases should be explicitly stated and consumption should not be excluded from the totals due to variations in vacancy rates.
Further guidancePlease refer to the relevant GRI Standard relevant 302-1: Energy consumption within the organisation. This section should be read in conjunction with the Elec-Abs section of this document.
4.3 DH&C-Abs Total district heating & cooling consumptionAssets-level performance measure
annual kWh
DefinitionDH&C-Abs refers to the total amount of indirect energy consumed from district heating or cooling systems over a full reporting year. In this instance, ‘indirect’ means energy generated off site and typically bought from an external energy supplier.
IssueAlthough electricity and gas are often the only significant forms of indirect and direct energy for many companies, certain regions and countries may use other forms of intermediate energy such as steam/hot water or chilled water provided from a district heating plant or chilled water plant.
EPRA – Best Practices Recommendations on Sustainability Reporting – third version September 2017 14
RationaleDH&C-Abs (total energy consumption from district heating and cooling) should encourage companies to measure and manage energy use in a way that drives down consumption over time.
This performance measure enables calculation of a district heating/cooling-related element of indirect greenhouse gas emissions, which fall under Scope 2 and 3 (where sub-metered to tenants) of the WRI/WBCSD GHG Protocol5.
RECOMMENDATIONS
CORE: Companies must report:
1. Indirect energy consumption from district heating and cooling;2. The proportion of energy consumption from district heating and cooling generated on and/or off site
from renewable sources.
DH&C-Abs should be calculated with reference to the following guidance (based on GRI Standard 302-1):• Identify the amount of district heating and cooling purchased and consumed from non-renewable
sources generated on and off site; • Identify the amount of heating and cooling purchased and consumed from renewable sources gener-
ated on and off site. Renewable energy sources can include: – Solar photovoltaic – Wind turbines – Hydro turbines – Geothermal turbines – Biomass
• Calculate the proportion of district heating and cooling consumed from renewable sources as a per-centage of total energy consumption from district heating and cooling.
• If DH&C-Abs is not procured at any of the properties in the portfolio, the sustainability performance measure should be reported as ‘Not applicable’.
Further guidancePlease refer to the relevant GRI Standard 302-1: Energy consumption within the organisation.
4.4 DH&C-LfL Like-for-like total district heating & cooling consumption
Assets-level performance measureannual kWh
DefinitionDH&C-LfL refers to the district heating and cooling consumed by a portfolio that has been consistently in operation, and not under development, during the most recent two full reporting years (this like-for-like definition is aligned with the EPRA Financial BPR like-for-like definition for rental growth reporting). For example, the 2017 like-for-like change compares the 2017 district heating and cooling consumption with the 2016 district heating & cooling consumption for a consistent portfolio.
RationaleLike-for-like performance measures are a necessary complement to absolute performance measures as disclosure on a like-for-like basis shows a change in performance unrelated to fluctuations portfolio size (through acquisitions, disposals, major refurbishments and developments).
5 www.ghgprotocol.org/sites/default/files/ghgp/standards/ghg-protocol-revised.pdf
EPRA – Best Practices Recommendations on Sustainability Reporting – third version September 2017 15
RECOMMENDATIONS
CORE: Companies must report like-for-like energy consumption from district heating and cooling across the two most recent reporting years.
DH&C-LfL should be calculated in the following way:• Calculate the total district heating and cooling consumed for the like-for-like set of assets (i.e. those
that have been consistently in operation, and not under development, during the most recent two full reporting years) using the same methodology used to calculate DH&C-Abs. These calculations should be reported as total consumption figures, not solely as a percentage change.
• Companies should disclose the basis and assumptions underlying the like-for-like information.• High variation in vacancy rates: While companies can use significant changes in vacancy rates as an
explanation (akin to ‘special events’) of unusual consumption trends, such cases should be explicitly stated and consumption should not be excluded from the totals due to variations in vacancy rates.
Further guidancePlease refer to the relevant GRI Standard 302-1: Energy consumption within the organisation. This section should be read in conjunction with the DH&C-Abs section of this document.
4.5 Fuels-Abs Total fuel consumptionAssets-level performance measure
annual kWh
DefinitionFuels-Abs refers to the total amount of fuel used from direct (renewable and non-renewable) sources (‘direct’ meaning that the fuel is combusted on site) over a full reporting year.
IssueBuildings are responsible for 40% of energy consumption in the European Union and, alongside electricity, fuels (such as natural gas) are one of the most widespread types of energy consumed in buildings. Gas is classified as direct energy as it is burned on site.
RationaleReporting total energy consumption from fuels (classified as direct energy) such as purchased natural gas should encourage companies to identify and manage the use of fuels in a way that drives down fuel consumption over time.
This performance measure enables the calculation of the fuels element of greenhouse gas emissions, which fall under Scope 1 and 3 (where sub-metered to tenants) of the WRI/WBCSD GHG Protocol6.
6 www.ghgprotocol.org/sites/default/files/ghgp/standards/ghg-protocol-revised.pdf
EPRA – Best Practices Recommendations on Sustainability Reporting – third version September 2017 16
RECOMMENDATIONS
CORE: Companies must report:
1. Total amount of fuels used from direct sources; 2. The proportion of the total amount of fuel consumption within the organisation that is from renewable
sources.
Fuels-Abs should be calculated with reference to the following guidance (based on GRI Standard 302-1):Identify the amount of fuel purchased or obtained and consumed within the organisation from non-re-newable sources;• Identify the amount of fuels purchased or obtained and consumed within the organisation from
renewable sources. Renewable energy sources can include biomass and biogas;• Calculate the proportion of fuels purchased, obtained and consumed from renewable sources as a
percentage of the amount of fuels purchased, obtained and consumed. • If electricity and thermals are self-generated by combusting fuels on site, only disclose the fuels con-
sumed in Fuels-Abs. Do not include the resulting electricity/thermals in Elec-Abs/DH&C-Abs to avoid double-counting. If fuels are not purchased, obtained and consumed at any of the properties in the portfolio, the sustainability performance measure should be reported as ‘Not applicable’.
Further guidancePlease refer to the relevant GRI Standard 302-1: Energy consumption within the organisation.
4.6 Fuels-LfL Like-for-like total fuel consumptionAssets-level performance measure
annual kWh
DefinitionFuels-LfL refers to the fuel consumed by a portfolio that has been consistently in operation, and not under development, during the most recent two full reporting years (this like-for-like definition is aligned with the EPRA Financial BPR like-for-like definition for rental growth reporting). For example, the 2017 like-for-like change compares the 2017 Fuels-Abs consumption with the 2016 Fuels-Abs consumption for a consistent portfolio.
RationaleLike-for-like performance measures are a necessary complement to absolute performance measures as disclosure on a like-for-like basis shows a change in performance unrelated to fluctuations in portfolio size (through acquisitions, disposals, major refurbishments and developments).
RECOMMENDATIONS
CORE: Organisations must report like-for-like fuel consumption across the two most recent reporting years.
Fuels-LfL should be calculated in the following way:• Calculate the total fuels consumed for the like-for-like set of assets (i.e. those that have been consis-
tently in operation, and not under development, during the most recent two full reporting years) using the same methodology used to calculate Fuels-Abs. These calculations should be reported as total consumption figures, not solely as a percentage change.
• Companies should disclose the basis and assumptions underlying the like-for-like information.• High variation in vacancy rates: While companies can use significant changes in vacancy rates as an
explanation (akin to ‘special events’) of unusual consumption trends, such cases should be explicitly stated and consumption should not be excluded from the totals due to variations in vacancy rates.
Further guidancePlease refer to the relevant GRI Standard 302-1: Energy consumption within the organisation. This section should be read in conjunction with the Fuels-Abs section of this document.
EPRA – Best Practices Recommendations on Sustainability Reporting – third version September 2017 17
4.7 Energy-Int Building energy intensityAssets-level performance measure
kWh/person/year; orkWh/m2/year; or
kWh/revenue/year
DefinitionEnergy-Int refers to the total amount of direct and indirect energy used by renewable and non-renewable sources in a building over a full reporting year, normalised by an appropriate denominator.
IssueIntensity indicators are widely used to report performance. However, the variety of approaches used by companies to calculate intensity indicators represents a challenge for stakeholders when understanding how to interpret data provided by reporters. Please refer to section 7.5 and 7.6 of the overarching recommendations in this regard.
RationaleBuilding energy intensity is one of the most effective measures of a building’s overall energy efficiency during the occupation and operational phase of the building’s lifecycle, and enables analysis of performance over time without the need to exclude acquired or sold properties. This performance measure can be used for the energy intensity for both those buildings occupied by the reporter and those held in investment portfolios. Building energy intensity is primarily intended to track changes over time for the reporter’s’ assets.
RECOMMENDATIONS
CORE: Companies must report the total amount of direct and indirect energy used (including renewable and non-renewable sources) across their portfolio over a full reporting year, normalised by an appropri-ate denominator.
Energy-Int should be calculated (based on GRI Standard 302-3) as the sum of energy consumption reported for Elec-Abs, DH&C-Abs & Fuels-Abs, normalised using an appropriate denominator.
Common methodologies to calculate energy consumption intensity include:
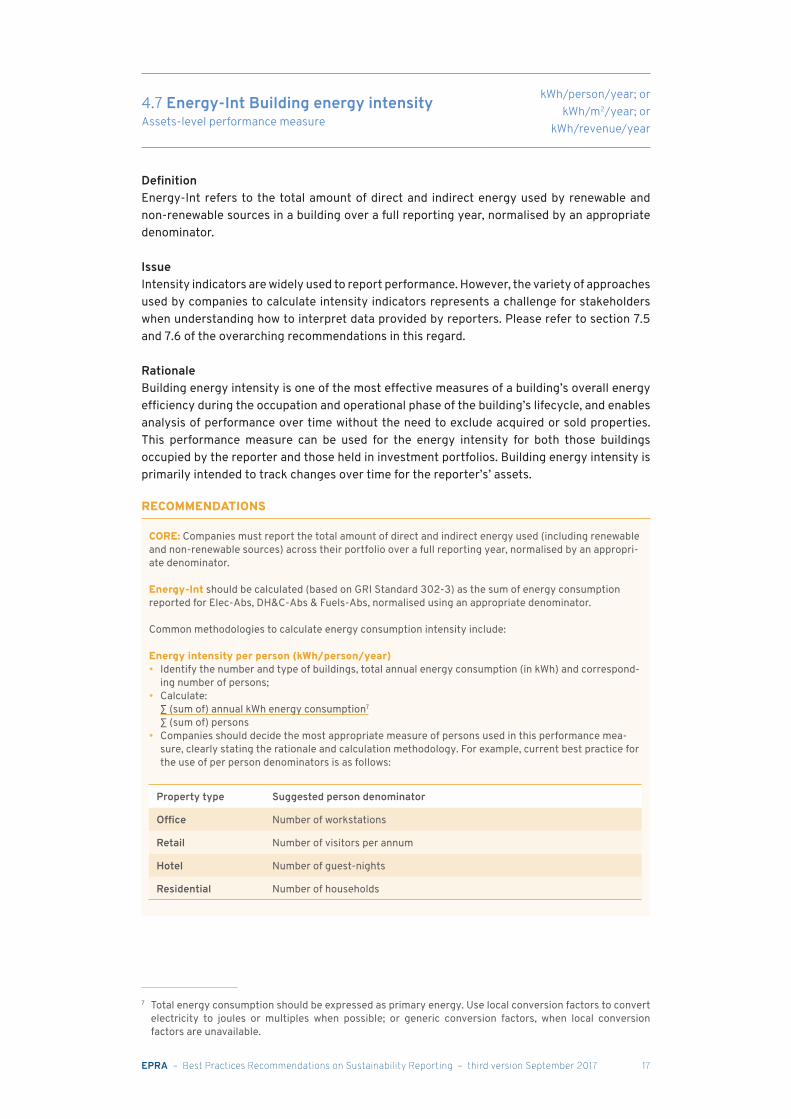
Energy intensity per person (kWh/person/year)• Identify the number and type of buildings, total annual energy consumption (in kWh) and correspond-
ing number of persons;• Calculate: ∑ (sum of) annual kWh energy consumption7
∑ (sum of) persons• Companies should decide the most appropriate measure of persons used in this performance mea-
sure, clearly stating the rationale and calculation methodology. For example, current best practice for the use of per person denominators is as follows:
Property type Suggested person denominator
Office Number of workstations
Retail Number of visitors per annum
Hotel Number of guest-nights
Residential Number of households
7 Total energy consumption should be expressed as primary energy. Use local conversion factors to convert electricity to joules or multiples when possible; or generic conversion factors, when local conversion factors are unavailable.
EPRA – Best Practices Recommendations on Sustainability Reporting – third version September 2017 18
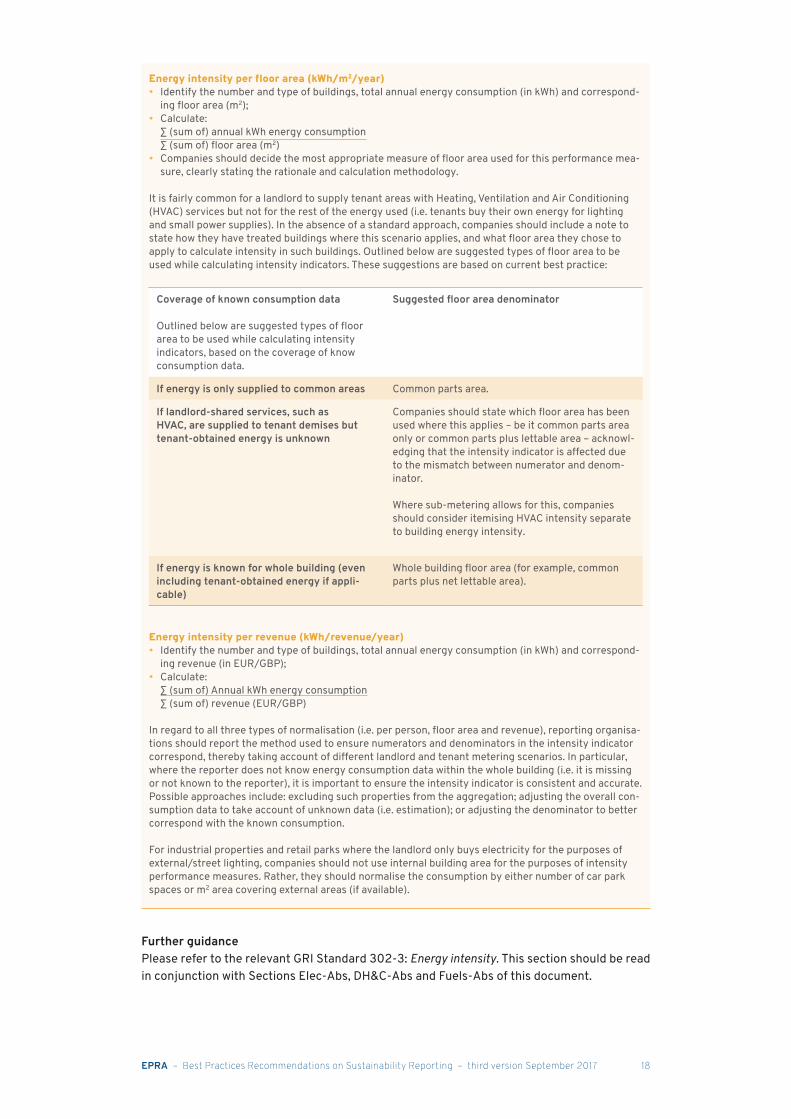
Energy intensity per floor area (kWh/m2/year)• Identify the number and type of buildings, total annual energy consumption (in kWh) and correspond-
ing floor area (m2);• Calculate: ∑ (sum of) annual kWh energy consumption ∑ (sum of) floor area (m2)• Companies should decide the most appropriate measure of floor area used for this performance mea-
sure, clearly stating the rationale and calculation methodology.
It is fairly common for a landlord to supply tenant areas with Heating, Ventilation and Air Conditioning (HVAC) services but not for the rest of the energy used (i.e. tenants buy their own energy for lighting and small power supplies). In the absence of a standard approach, companies should include a note to state how they have treated buildings where this scenario applies, and what floor area they chose to apply to calculate intensity in such buildings. Outlined below are suggested types of floor area to be used while calculating intensity indicators. These suggestions are based on current best practice:
Coverage of known consumption data
Outlined below are suggested types of floor area to be used while calculating intensity indicators, based on the coverage of know consumption data.
Suggested floor area denominator
If energy is only supplied to common areas Common parts area.
If landlord-shared services, such as HVAC, are supplied to tenant demises but tenant-obtained energy is unknown
Companies should state which floor area has been used where this applies – be it common parts area only or common parts plus lettable area – acknowl-edging that the intensity indicator is affected due to the mismatch between numerator and denom-inator.
Where sub-metering allows for this, companies should consider itemising HVAC intensity separate to building energy intensity.
If energy is known for whole building (even including tenant-obtained energy if appli-cable)
Whole building floor area (for example, common parts plus net lettable area).
Energy intensity per revenue (kWh/revenue/year)• Identify the number and type of buildings, total annual energy consumption (in kWh) and correspond-
ing revenue (in EUR/GBP);• Calculate: ∑ (sum of) Annual kWh energy consumption ∑ (sum of) revenue (EUR/GBP)
In regard to all three types of normalisation (i.e. per person, floor area and revenue), reporting organisa-tions should report the method used to ensure numerators and denominators in the intensity indicator correspond, thereby taking account of different landlord and tenant metering scenarios. In particular, where the reporter does not know energy consumption data within the whole building (i.e. it is missing or not known to the reporter), it is important to ensure the intensity indicator is consistent and accurate. Possible approaches include: excluding such properties from the aggregation; adjusting the overall con-sumption data to take account of unknown data (i.e. estimation); or adjusting the denominator to better correspond with the known consumption.
For industrial properties and retail parks where the landlord only buys electricity for the purposes of external/street lighting, companies should not use internal building area for the purposes of intensity performance measures. Rather, they should normalise the consumption by either number of car park spaces or m2 area covering external areas (if available).
Further guidancePlease refer to the relevant GRI Standard 302-3: Energy intensity. This section should be read in conjunction with Sections Elec-Abs, DH&C-Abs and Fuels-Abs of this document.
EPRA – Best Practices Recommendations on Sustainability Reporting – third version September 2017 19
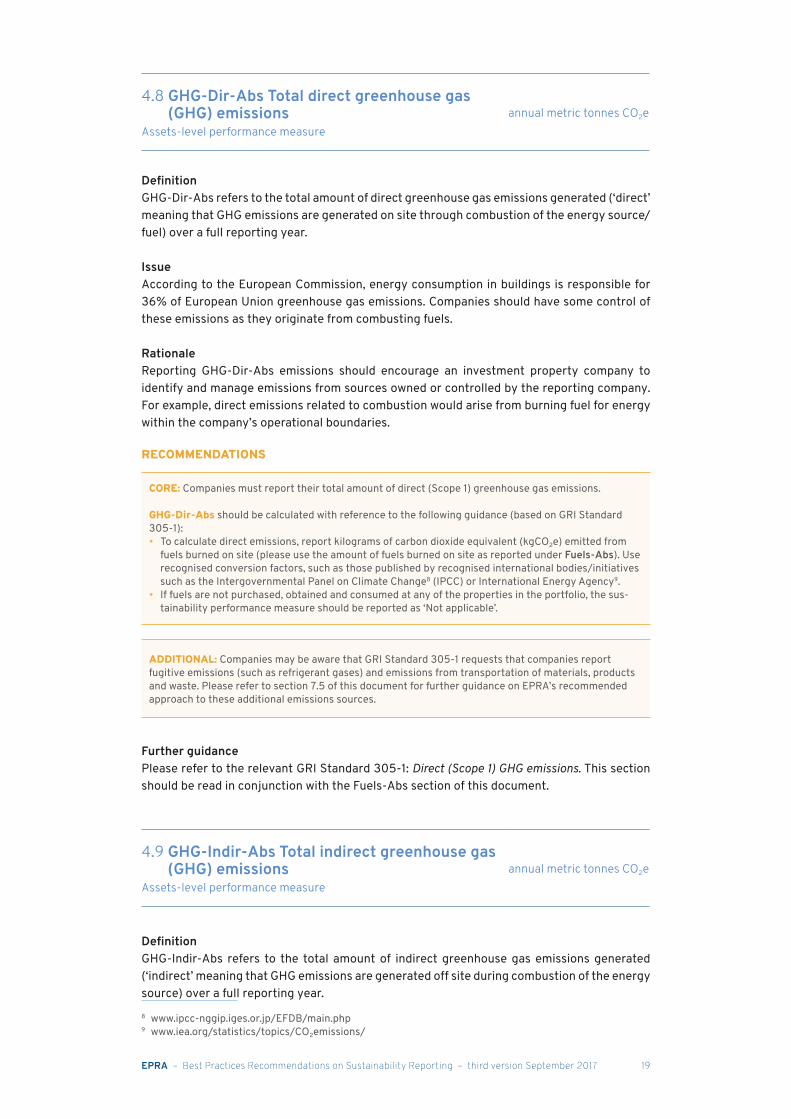
4.8 GHG-Dir-Abs Total direct greenhouse gas (GHG) emissions
Assets-level performance measureannual metric tonnes CO2e
DefinitionGHG-Dir-Abs refers to the total amount of direct greenhouse gas emissions generated (‘direct’ meaning that GHG emissions are generated on site through combustion of the energy source/fuel) over a full reporting year.
IssueAccording to the European Commission, energy consumption in buildings is responsible for 36% of European Union greenhouse gas emissions. Companies should have some control of these emissions as they originate from combusting fuels.
RationaleReporting GHG-Dir-Abs emissions should encourage an investment property company to identify and manage emissions from sources owned or controlled by the reporting company. For example, direct emissions related to combustion would arise from burning fuel for energy within the company’s operational boundaries.
RECOMMENDATIONS
CORE: Companies must report their total amount of direct (Scope 1) greenhouse gas emissions.
GHG-Dir-Abs should be calculated with reference to the following guidance (based on GRI Standard 305-1):• To calculate direct emissions, report kilograms of carbon dioxide equivalent (kgCO2e) emitted from
fuels burned on site (please use the amount of fuels burned on site as reported under Fuels-Abs). Use recognised conversion factors, such as those published by recognised international bodies/initiatives such as the Intergovernmental Panel on Climate Change8 (IPCC) or International Energy Agency9.
• If fuels are not purchased, obtained and consumed at any of the properties in the portfolio, the sus-tainability performance measure should be reported as ‘Not applicable’.
ADDITIONAL: Companies may be aware that GRI Standard 305-1 requests that companies report fugitive emissions (such as refrigerant gases) and emissions from transportation of materials, products and waste. Please refer to section 7.5 of this document for further guidance on EPRA’s recommended approach to these additional emissions sources.
Further guidancePlease refer to the relevant GRI Standard 305-1: Direct (Scope 1) GHG emissions. This section should be read in conjunction with the Fuels-Abs section of this document.
4.9 GHG-Indir-Abs Total indirect greenhouse gas (GHG) emissions
Assets-level performance measureannual metric tonnes CO2e
DefinitionGHG-Indir-Abs refers to the total amount of indirect greenhouse gas emissions generated (‘indirect’ meaning that GHG emissions are generated off site during combustion of the energy source) over a full reporting year. 8 www.ipcc-nggip.iges.or.jp/EFDB/main.php9 www.iea.org/statistics/topics/CO2emissions/
EPRA – Best Practices Recommendations on Sustainability Reporting – third version September 2017 20
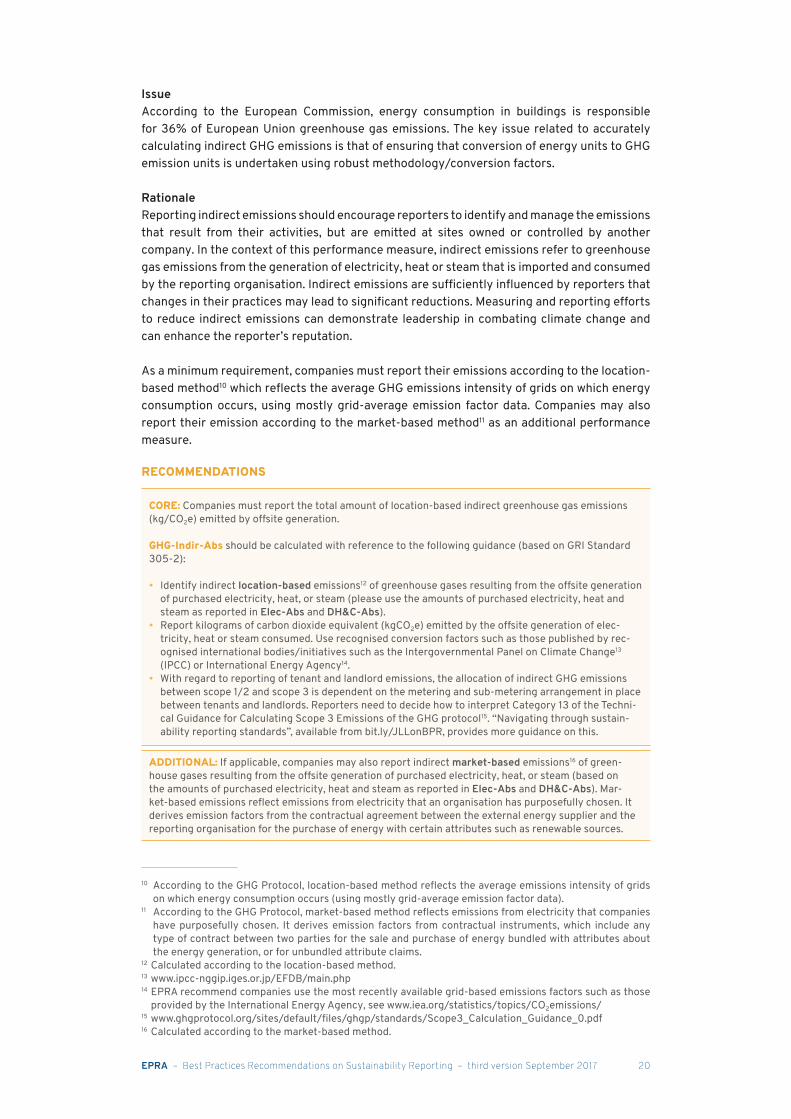
IssueAccording to the European Commission, energy consumption in buildings is responsible for 36% of European Union greenhouse gas emissions. The key issue related to accurately calculating indirect GHG emissions is that of ensuring that conversion of energy units to GHG emission units is undertaken using robust methodology/conversion factors.
RationaleReporting indirect emissions should encourage reporters to identify and manage the emissions that result from their activities, but are emitted at sites owned or controlled by another company. In the context of this performance measure, indirect emissions refer to greenhouse gas emissions from the generation of electricity, heat or steam that is imported and consumed by the reporting organisation. Indirect emissions are sufficiently influenced by reporters that changes in their practices may lead to significant reductions. Measuring and reporting efforts to reduce indirect emissions can demonstrate leadership in combating climate change and can enhance the reporter’s reputation.
As a minimum requirement, companies must report their emissions according to the location-based method10 which reflects the average GHG emissions intensity of grids on which energy consumption occurs, using mostly grid-average emission factor data. Companies may also report their emission according to the market-based method11 as an additional performance measure.
RECOMMENDATIONS
CORE: Companies must report the total amount of location-based indirect greenhouse gas emissions (kg/CO2e) emitted by offsite generation.
GHG-Indir-Abs should be calculated with reference to the following guidance (based on GRI Standard 305-2):
• Identify indirect location-based emissions12 of greenhouse gases resulting from the offsite generation of purchased electricity, heat, or steam (please use the amounts of purchased electricity, heat and steam as reported in Elec-Abs and DH&C-Abs).
• Report kilograms of carbon dioxide equivalent (kgCO2e) emitted by the offsite generation of elec-tricity, heat or steam consumed. Use recognised conversion factors such as those published by rec-ognised international bodies/initiatives such as the Intergovernmental Panel on Climate Change13 (IPCC) or International Energy Agency14.
• With regard to reporting of tenant and landlord emissions, the allocation of indirect GHG emissions between scope 1/2 and scope 3 is dependent on the metering and sub-metering arrangement in place between tenants and landlords. Reporters need to decide how to interpret Category 13 of the Techni-cal Guidance for Calculating Scope 3 Emissions of the GHG protocol15. “Navigating through sustain-ability reporting standards”, available from bit.ly/JLLonBPR, provides more guidance on this.
ADDITIONAL: If applicable, companies may also report indirect market-based emissions16 of green-house gases resulting from the offsite generation of purchased electricity, heat, or steam (based on the amounts of purchased electricity, heat and steam as reported in Elec-Abs and DH&C-Abs). Mar-ket-based emissions reflect emissions from electricity that an organisation has purposefully chosen. It derives emission factors from the contractual agreement between the external energy supplier and the reporting organisation for the purchase of energy with certain attributes such as renewable sources.
10 According to the GHG Protocol, location-based method reflects the average emissions intensity of grids on which energy consumption occurs (using mostly grid-average emission factor data).
11 According to the GHG Protocol, market-based method reflects emissions from electricity that companies have purposefully chosen. It derives emission factors from contractual instruments, which include any type of contract between two parties for the sale and purchase of energy bundled with attributes about the energy generation, or for unbundled attribute claims.
12 Calculated according to the location-based method. 13 www.ipcc-nggip.iges.or.jp/EFDB/main.php14 EPRA recommend companies use the most recently available grid-based emissions factors such as those
provided by the International Energy Agency, see www.iea.org/statistics/topics/CO2emissions/15 www.ghgprotocol.org/sites/default/files/ghgp/standards/Scope3_Calculation_Guidance_0.pdf16 Calculated according to the market-based method.
EPRA – Best Practices Recommendations on Sustainability Reporting – third version September 2017 21
Further guidancePlease refer to the relevant GRI Standard 302-5: Total indirect greenhouse gas emissions by weight. This section should be read in conjunction with the Elec-Abs and DH&C-Abs sections of this document.
Please also refer to section 7.5 and 7.6 of the overarching recommendations and “Navigating through sustainability reporting standards”17.
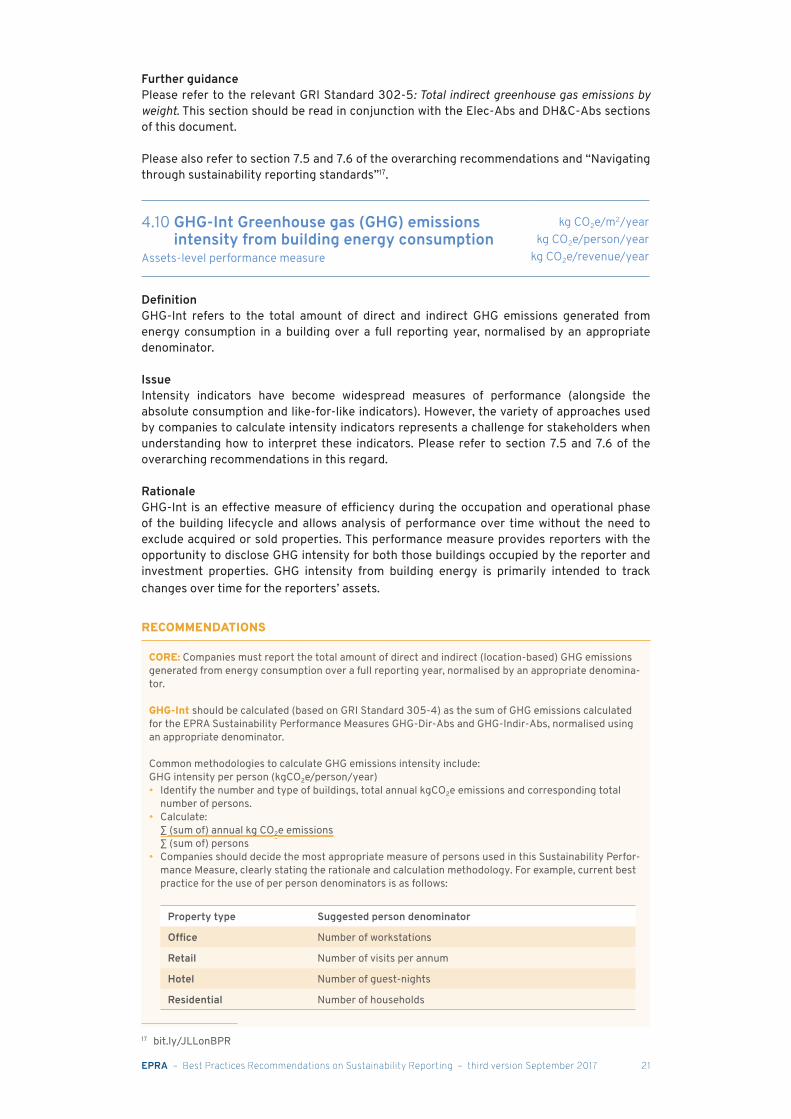
4.10 GHG-Int Greenhouse gas (GHG) emissions intensity from building energy consumption
Assets-level performance measure
kg CO2e/m2/year kg CO2e/person/year
kg CO2e/revenue/year
DefinitionGHG-Int refers to the total amount of direct and indirect GHG emissions generated from energy consumption in a building over a full reporting year, normalised by an appropriate denominator.
IssueIntensity indicators have become widespread measures of performance (alongside the absolute consumption and like-for-like indicators). However, the variety of approaches used by companies to calculate intensity indicators represents a challenge for stakeholders when understanding how to interpret these indicators. Please refer to section 7.5 and 7.6 of the overarching recommendations in this regard.
RationaleGHG-Int is an effective measure of efficiency during the occupation and operational phase of the building lifecycle and allows analysis of performance over time without the need to exclude acquired or sold properties. This performance measure provides reporters with the opportunity to disclose GHG intensity for both those buildings occupied by the reporter and investment properties. GHG intensity from building energy is primarily intended to track changes over time for the reporters’ assets.
RECOMMENDATIONS
CORE: Companies must report the total amount of direct and indirect (location-based) GHG emissions generated from energy consumption over a full reporting year, normalised by an appropriate denomina-tor.
GHG-Int should be calculated (based on GRI Standard 305-4) as the sum of GHG emissions calculated for the EPRA Sustainability Performance Measures GHG-Dir-Abs and GHG-Indir-Abs, normalised using an appropriate denominator.
Common methodologies to calculate GHG emissions intensity include:GHG intensity per person (kgCO2e/person/year)• Identify the number and type of buildings, total annual kgCO2e emissions and corresponding total
number of persons.• Calculate: ∑ (sum of) annual kg CO2e emissions ∑ (sum of) persons• Companies should decide the most appropriate measure of persons used in this Sustainability Perfor-
mance Measure, clearly stating the rationale and calculation methodology. For example, current best practice for the use of per person denominators is as follows:
Property type Suggested person denominator
Office Number of workstations
Retail Number of visits per annum
Hotel Number of guest-nights
Residential Number of households
17 bit.ly/JLLonBPR
EPRA – Best Practices Recommendations on Sustainability Reporting – third version September 2017 22
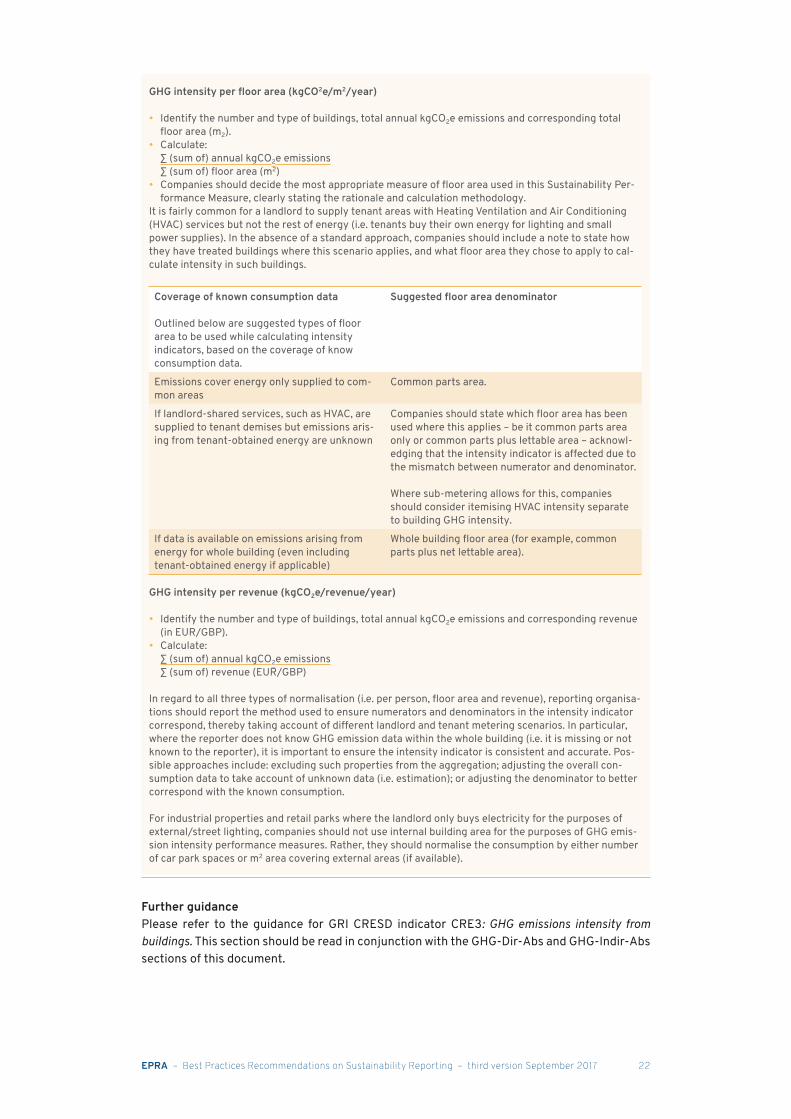
GHG intensity per floor area (kgCO2e/m2/year)
• Identify the number and type of buildings, total annual kgCO2e emissions and corresponding total floor area (m2).
• Calculate: ∑ (sum of) annual kgCO2e emissions ∑ (sum of) floor area (m2) • Companies should decide the most appropriate measure of floor area used in this Sustainability Per-
formance Measure, clearly stating the rationale and calculation methodology. It is fairly common for a landlord to supply tenant areas with Heating Ventilation and Air Conditioning (HVAC) services but not the rest of energy (i.e. tenants buy their own energy for lighting and small power supplies). In the absence of a standard approach, companies should include a note to state how they have treated buildings where this scenario applies, and what floor area they chose to apply to cal-culate intensity in such buildings.
Coverage of known consumption data
Outlined below are suggested types of floor area to be used while calculating intensity indicators, based on the coverage of know consumption data.
Suggested floor area denominator
Emissions cover energy only supplied to com-mon areas
Common parts area.
If landlord-shared services, such as HVAC, are supplied to tenant demises but emissions aris-ing from tenant-obtained energy are unknown
Companies should state which floor area has been used where this applies – be it common parts area only or common parts plus lettable area – acknowl-edging that the intensity indicator is affected due to the mismatch between numerator and denominator.
Where sub-metering allows for this, companies should consider itemising HVAC intensity separate to building GHG intensity.
If data is available on emissions arising from energy for whole building (even including tenant-obtained energy if applicable)
Whole building floor area (for example, common parts plus net lettable area).
GHG intensity per revenue (kgCO2e/revenue/year)
• Identify the number and type of buildings, total annual kgCO2e emissions and corresponding revenue (in EUR/GBP).
• Calculate: ∑ (sum of) annual kgCO2e emissions ∑ (sum of) revenue (EUR/GBP)
In regard to all three types of normalisation (i.e. per person, floor area and revenue), reporting organisa-tions should report the method used to ensure numerators and denominators in the intensity indicator correspond, thereby taking account of different landlord and tenant metering scenarios. In particular, where the reporter does not know GHG emission data within the whole building (i.e. it is missing or not known to the reporter), it is important to ensure the intensity indicator is consistent and accurate. Pos-sible approaches include: excluding such properties from the aggregation; adjusting the overall con-sumption data to take account of unknown data (i.e. estimation); or adjusting the denominator to better correspond with the known consumption.
For industrial properties and retail parks where the landlord only buys electricity for the purposes of external/street lighting, companies should not use internal building area for the purposes of GHG emis-sion intensity performance measures. Rather, they should normalise the consumption by either number of car park spaces or m2 area covering external areas (if available).
Further guidancePlease refer to the guidance for GRI CRESD indicator CRE3: GHG emissions intensity from buildings. This section should be read in conjunction with the GHG-Dir-Abs and GHG-Indir-Abs sections of this document.
EPRA – Best Practices Recommendations on Sustainability Reporting – third version September 2017 23
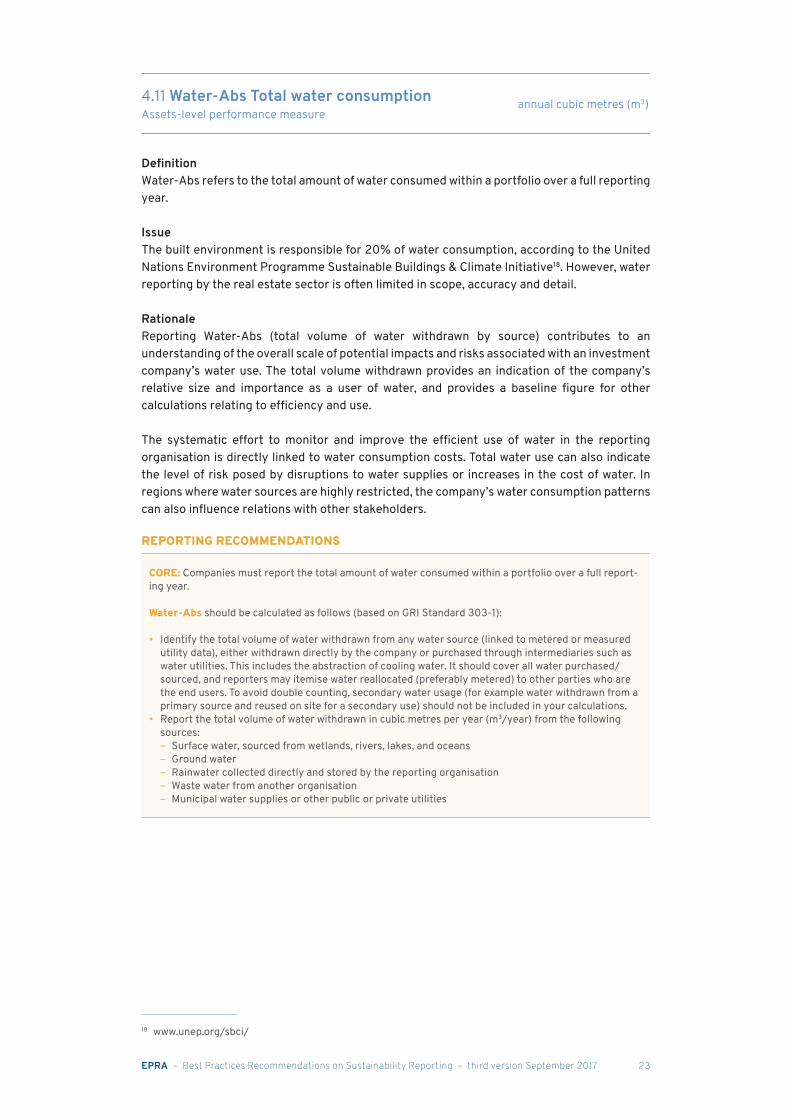
4.11 Water-Abs Total water consumptionAssets-level performance measure
annual cubic metres (m3)
DefinitionWater-Abs refers to the total amount of water consumed within a portfolio over a full reporting year.
IssueThe built environment is responsible for 20% of water consumption, according to the United Nations Environment Programme Sustainable Buildings & Climate Initiative18. However, water reporting by the real estate sector is often limited in scope, accuracy and detail.
RationaleReporting Water-Abs (total volume of water withdrawn by source) contributes to an understanding of the overall scale of potential impacts and risks associated with an investment company’s water use. The total volume withdrawn provides an indication of the company’s relative size and importance as a user of water, and provides a baseline figure for other calculations relating to efficiency and use.
The systematic effort to monitor and improve the efficient use of water in the reporting organisation is directly linked to water consumption costs. Total water use can also indicate the level of risk posed by disruptions to water supplies or increases in the cost of water. In regions where water sources are highly restricted, the company’s water consumption patterns can also influence relations with other stakeholders.
REPORTING RECOMMENDATIONS
CORE: Companies must report the total amount of water consumed within a portfolio over a full report-ing year.
Water-Abs should be calculated as follows (based on GRI Standard 303-1):
• Identify the total volume of water withdrawn from any water source (linked to metered or measured utility data), either withdrawn directly by the company or purchased through intermediaries such as water utilities. This includes the abstraction of cooling water. It should cover all water purchased/sourced, and reporters may itemise water reallocated (preferably metered) to other parties who are the end users. To avoid double counting, secondary water usage (for example water withdrawn from a primary source and reused on site for a secondary use) should not be included in your calculations.
• Report the total volume of water withdrawn in cubic metres per year (m3/year) from the following sources:
– Surface water, sourced from wetlands, rivers, lakes, and oceans – Ground water – Rainwater collected directly and stored by the reporting organisation – Waste water from another organisation – Municipal water supplies or other public or private utilities
18 www.unep.org/sbci/
EPRA – Best Practices Recommendations on Sustainability Reporting – third version September 2017 24
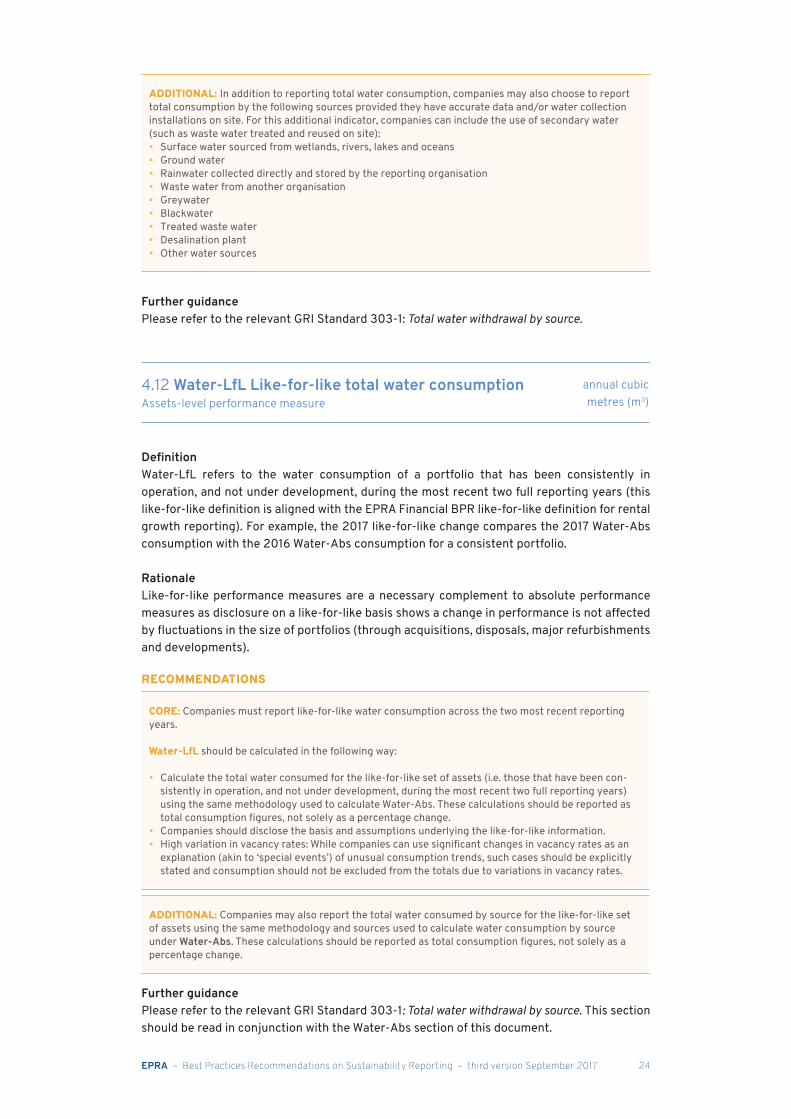
ADDITIONAL: In addition to reporting total water consumption, companies may also choose to report total consumption by the following sources provided they have accurate data and/or water collection installations on site. For this additional indicator, companies can include the use of secondary water (such as waste water treated and reused on site):• Surface water sourced from wetlands, rivers, lakes and oceans• Ground water• Rainwater collected directly and stored by the reporting organisation• Waste water from another organisation• Greywater• Blackwater• Treated waste water• Desalination plant• Other water sources
Further guidancePlease refer to the relevant GRI Standard 303-1: Total water withdrawal by source.
4.12 Water-LfL Like-for-like total water consumptionAssets-level performance measure
annual cubic metres (m3)
DefinitionWater-LfL refers to the water consumption of a portfolio that has been consistently in operation, and not under development, during the most recent two full reporting years (this like-for-like definition is aligned with the EPRA Financial BPR like-for-like definition for rental growth reporting). For example, the 2017 like-for-like change compares the 2017 Water-Abs consumption with the 2016 Water-Abs consumption for a consistent portfolio.
RationaleLike-for-like performance measures are a necessary complement to absolute performance measures as disclosure on a like-for-like basis shows a change in performance is not affected by fluctuations in the size of portfolios (through acquisitions, disposals, major refurbishments and developments).
RECOMMENDATIONS
CORE: Companies must report like-for-like water consumption across the two most recent reporting years.
Water-LfL should be calculated in the following way:
• Calculate the total water consumed for the like-for-like set of assets (i.e. those that have been con-sistently in operation, and not under development, during the most recent two full reporting years) using the same methodology used to calculate Water-Abs. These calculations should be reported as total consumption figures, not solely as a percentage change.
• Companies should disclose the basis and assumptions underlying the like-for-like information.• High variation in vacancy rates: While companies can use significant changes in vacancy rates as an
explanation (akin to ‘special events’) of unusual consumption trends, such cases should be explicitly stated and consumption should not be excluded from the totals due to variations in vacancy rates.
ADDITIONAL: Companies may also report the total water consumed by source for the like-for-like set of assets using the same methodology and sources used to calculate water consumption by source under Water-Abs. These calculations should be reported as total consumption figures, not solely as a percentage change.
Further guidancePlease refer to the relevant GRI Standard 303-1: Total water withdrawal by source. This section should be read in conjunction with the Water-Abs section of this document.
EPRA – Best Practices Recommendations on Sustainability Reporting – third version September 2017 25
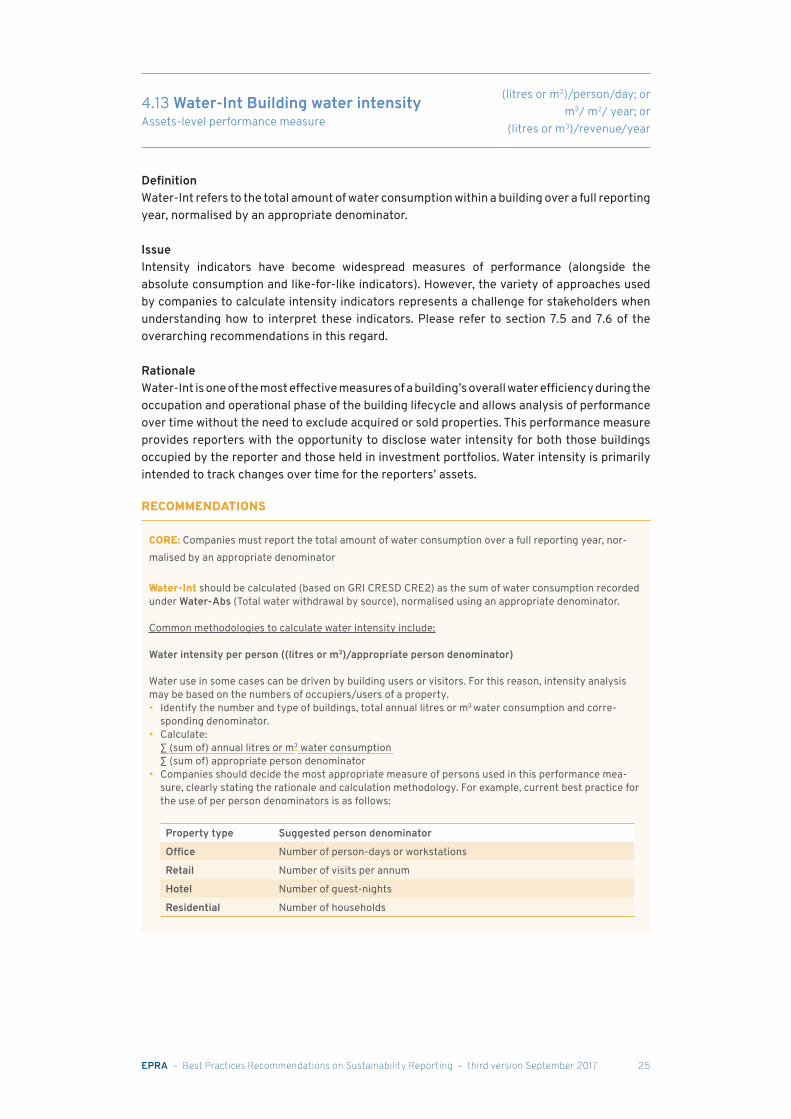
4.13 Water-Int Building water intensityAssets-level performance measure
(litres or m3)/person/day; orm3/ m2/ year; or
(litres or m3)/revenue/year
DefinitionWater-Int refers to the total amount of water consumption within a building over a full reporting year, normalised by an appropriate denominator.
IssueIntensity indicators have become widespread measures of performance (alongside the absolute consumption and like-for-like indicators). However, the variety of approaches used by companies to calculate intensity indicators represents a challenge for stakeholders when understanding how to interpret these indicators. Please refer to section 7.5 and 7.6 of the overarching recommendations in this regard.
RationaleWater-Int is one of the most effective measures of a building’s overall water efficiency during the occupation and operational phase of the building lifecycle and allows analysis of performance over time without the need to exclude acquired or sold properties. This performance measure provides reporters with the opportunity to disclose water intensity for both those buildings occupied by the reporter and those held in investment portfolios. Water intensity is primarily intended to track changes over time for the reporters’ assets.
RECOMMENDATIONS
CORE: Companies must report the total amount of water consumption over a full reporting year, nor-malised by an appropriate denominator
Water-Int should be calculated (based on GRI CRESD CRE2) as the sum of water consumption recorded under Water-Abs (Total water withdrawal by source), normalised using an appropriate denominator.
Common methodologies to calculate water intensity include:
Water intensity per person ((litres or m3)/appropriate person denominator)
Water use in some cases can be driven by building users or visitors. For this reason, intensity analysis may be based on the numbers of occupiers/users of a property.• Identify the number and type of buildings, total annual litres or m3 water consumption and corre-
sponding denominator.• Calculate: ∑ (sum of) annual litres or m3 water consumption ∑ (sum of) appropriate person denominator• Companies should decide the most appropriate measure of persons used in this performance mea-
sure, clearly stating the rationale and calculation methodology. For example, current best practice for the use of per person denominators is as follows:
Property type Suggested person denominator Office Number of person-days or workstationsRetail Number of visits per annumHotel Number of guest-nightsResidential Number of households
EPRA – Best Practices Recommendations on Sustainability Reporting – third version September 2017 26
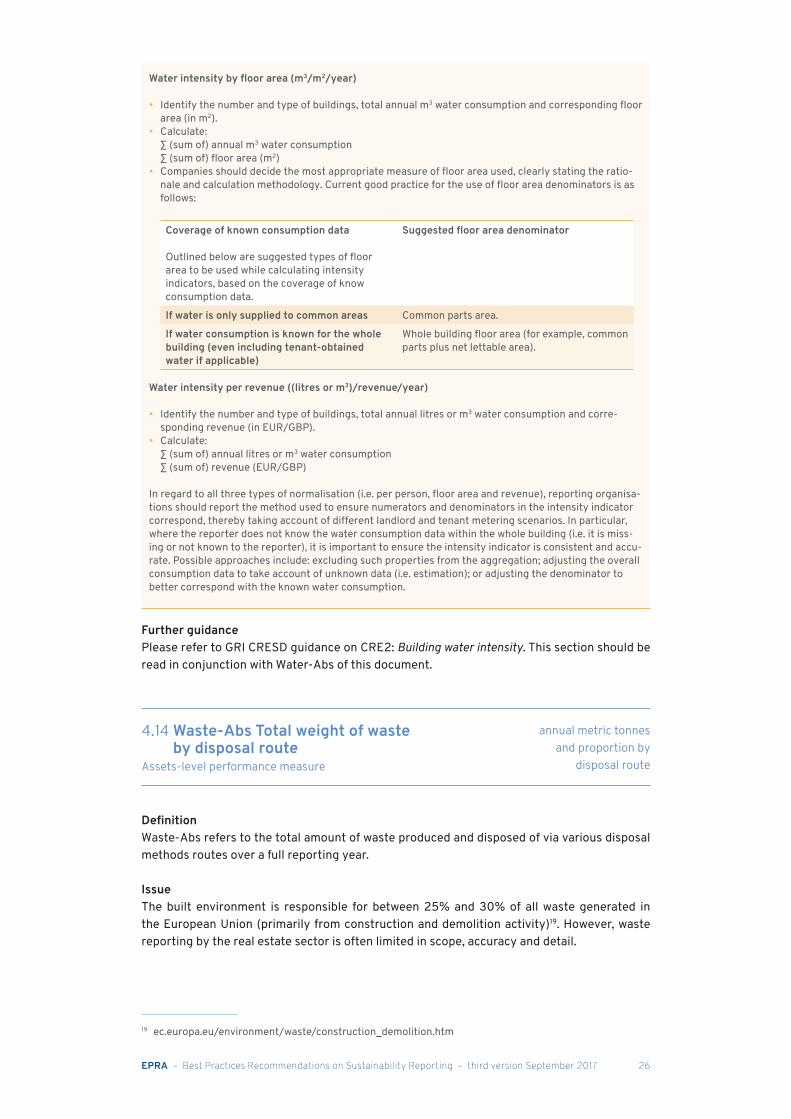
Water intensity by floor area (m3/m2/year)
• Identify the number and type of buildings, total annual m3 water consumption and corresponding floor area (in m2).
• Calculate: ∑ (sum of) annual m3 water consumption ∑ (sum of) floor area (m2) • Companies should decide the most appropriate measure of floor area used, clearly stating the ratio-
nale and calculation methodology. Current good practice for the use of floor area denominators is as follows:
Coverage of known consumption data
Outlined below are suggested types of floor area to be used while calculating intensity indicators, based on the coverage of know consumption data.
Suggested floor area denominator
If water is only supplied to common areas Common parts area.If water consumption is known for the whole building (even including tenant-obtained water if applicable)
Whole building floor area (for example, common parts plus net lettable area).
Water intensity per revenue ((litres or m3)/revenue/year)
• Identify the number and type of buildings, total annual litres or m3 water consumption and corre-sponding revenue (in EUR/GBP).
• Calculate: ∑ (sum of) annual litres or m3 water consumption ∑ (sum of) revenue (EUR/GBP)
In regard to all three types of normalisation (i.e. per person, floor area and revenue), reporting organisa-tions should report the method used to ensure numerators and denominators in the intensity indicator correspond, thereby taking account of different landlord and tenant metering scenarios. In particular, where the reporter does not know the water consumption data within the whole building (i.e. it is miss-ing or not known to the reporter), it is important to ensure the intensity indicator is consistent and accu-rate. Possible approaches include: excluding such properties from the aggregation; adjusting the overall consumption data to take account of unknown data (i.e. estimation); or adjusting the denominator to better correspond with the known water consumption.
Further guidancePlease refer to GRI CRESD guidance on CRE2: Building water intensity. This section should be read in conjunction with Water-Abs of this document.
4.14 Waste-Abs Total weight of waste by disposal route
Assets-level performance measure
annual metric tonnes and proportion by
disposal route
DefinitionWaste-Abs refers to the total amount of waste produced and disposed of via various disposal methods routes over a full reporting year.
IssueThe built environment is responsible for between 25% and 30% of all waste generated in the European Union (primarily from construction and demolition activity)19. However, waste reporting by the real estate sector is often limited in scope, accuracy and detail.
19 ec.europa.eu/environment/waste/construction_demolition.htm
EPRA – Best Practices Recommendations on Sustainability Reporting – third version September 2017 27
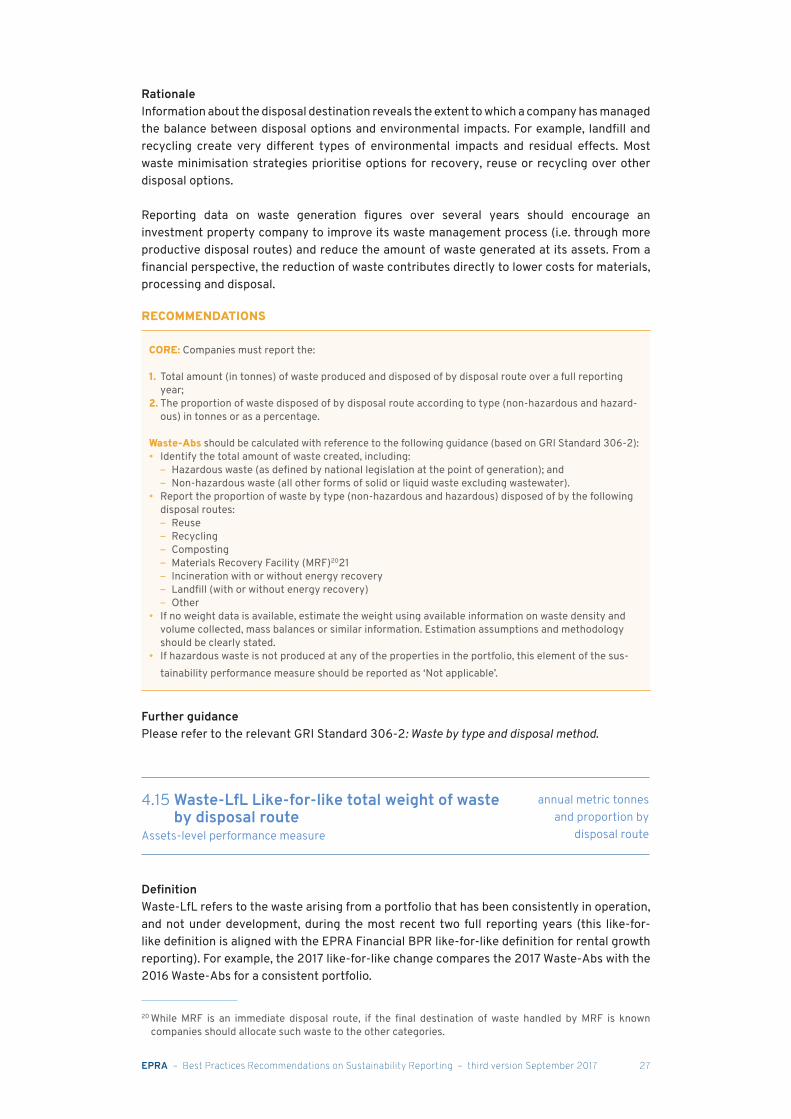
RationaleInformation about the disposal destination reveals the extent to which a company has managed the balance between disposal options and environmental impacts. For example, landfill and recycling create very different types of environmental impacts and residual effects. Most waste minimisation strategies prioritise options for recovery, reuse or recycling over other disposal options.
Reporting data on waste generation figures over several years should encourage an investment property company to improve its waste management process (i.e. through more productive disposal routes) and reduce the amount of waste generated at its assets. From a financial perspective, the reduction of waste contributes directly to lower costs for materials, processing and disposal.
RECOMMENDATIONS
CORE: Companies must report the:
1. Total amount (in tonnes) of waste produced and disposed of by disposal route over a full reporting year;
2. The proportion of waste disposed of by disposal route according to type (non-hazardous and hazard-ous) in tonnes or as a percentage.
Waste-Abs should be calculated with reference to the following guidance (based on GRI Standard 306-2):• Identify the total amount of waste created, including:
– Hazardous waste (as defined by national legislation at the point of generation); and – Non-hazardous waste (all other forms of solid or liquid waste excluding wastewater).
• Report the proportion of waste by type (non-hazardous and hazardous) disposed of by the following disposal routes:
– Reuse – Recycling – Composting – Materials Recovery Facility (MRF)2021 – Incineration with or without energy recovery – Landfill (with or without energy recovery) – Other
• If no weight data is available, estimate the weight using available information on waste density and volume collected, mass balances or similar information. Estimation assumptions and methodology should be clearly stated.
• If hazardous waste is not produced at any of the properties in the portfolio, this element of the sus-tainability performance measure should be reported as ‘Not applicable’.
Further guidancePlease refer to the relevant GRI Standard 306-2: Waste by type and disposal method.
4.15 Waste-LfL Like-for-like total weight of waste by disposal route
Assets-level performance measure
annual metric tonnes and proportion by
disposal route
DefinitionWaste-LfL refers to the waste arising from a portfolio that has been consistently in operation, and not under development, during the most recent two full reporting years (this like-for-like definition is aligned with the EPRA Financial BPR like-for-like definition for rental growth reporting). For example, the 2017 like-for-like change compares the 2017 Waste-Abs with the 2016 Waste-Abs for a consistent portfolio.
20 While MRF is an immediate disposal route, if the final destination of waste handled by MRF is known companies should allocate such waste to the other categories.
EPRA – Best Practices Recommendations on Sustainability Reporting – third version September 2017 28
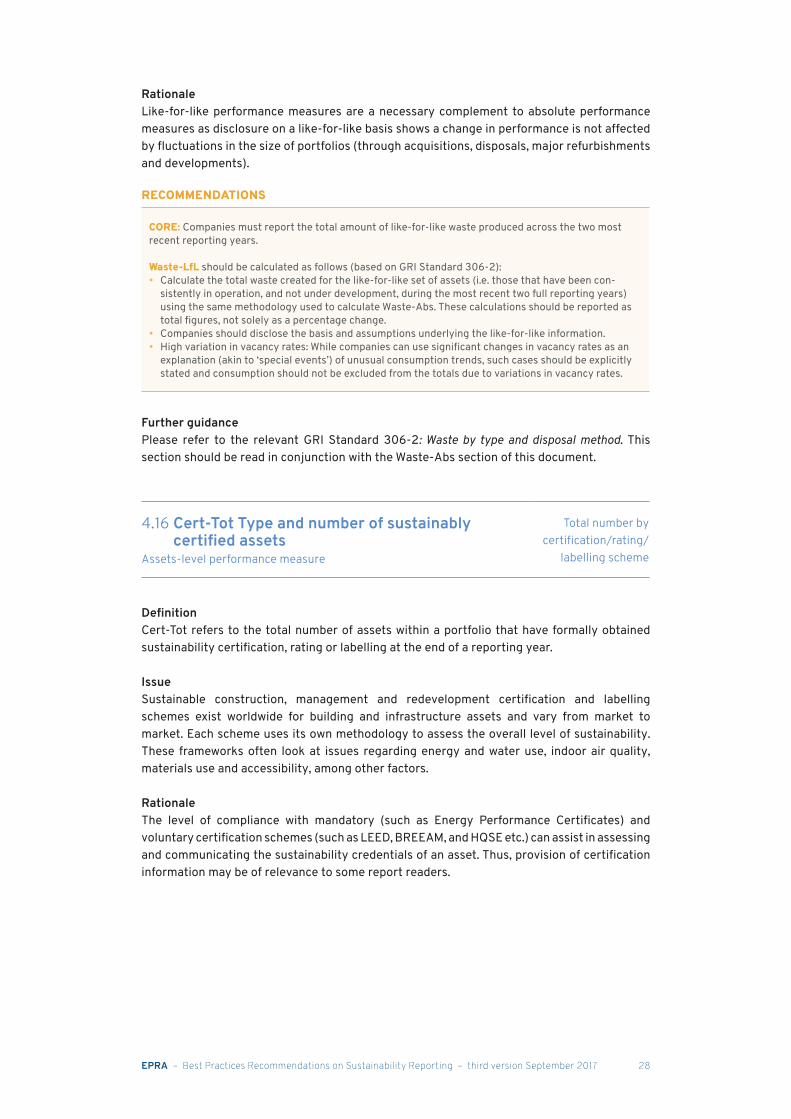
RationaleLike-for-like performance measures are a necessary complement to absolute performance measures as disclosure on a like-for-like basis shows a change in performance is not affected by fluctuations in the size of portfolios (through acquisitions, disposals, major refurbishments and developments).
RECOMMENDATIONS
CORE: Companies must report the total amount of like-for-like waste produced across the two most recent reporting years.
Waste-LfL should be calculated as follows (based on GRI Standard 306-2):• Calculate the total waste created for the like-for-like set of assets (i.e. those that have been con-
sistently in operation, and not under development, during the most recent two full reporting years) using the same methodology used to calculate Waste-Abs. These calculations should be reported as total figures, not solely as a percentage change.
• Companies should disclose the basis and assumptions underlying the like-for-like information.• High variation in vacancy rates: While companies can use significant changes in vacancy rates as an
explanation (akin to ‘special events’) of unusual consumption trends, such cases should be explicitly stated and consumption should not be excluded from the totals due to variations in vacancy rates.
Further guidancePlease refer to the relevant GRI Standard 306-2: Waste by type and disposal method. This section should be read in conjunction with the Waste-Abs section of this document.
4.16 Cert-Tot Type and number of sustainably certified assets
Assets-level performance measure
Total number by certification/rating/
labelling scheme
DefinitionCert-Tot refers to the total number of assets within a portfolio that have formally obtained sustainability certification, rating or labelling at the end of a reporting year.
IssueSustainable construction, management and redevelopment certification and labelling schemes exist worldwide for building and infrastructure assets and vary from market to market. Each scheme uses its own methodology to assess the overall level of sustainability. These frameworks often look at issues regarding energy and water use, indoor air quality, materials use and accessibility, among other factors.
RationaleThe level of compliance with mandatory (such as Energy Performance Certificates) and voluntary certification schemes (such as LEED, BREEAM, and HQSE etc.) can assist in assessing and communicating the sustainability credentials of an asset. Thus, provision of certification information may be of relevance to some report readers.
EPRA – Best Practices Recommendations on Sustainability Reporting – third version September 2017 29
RECOMMENDATIONS
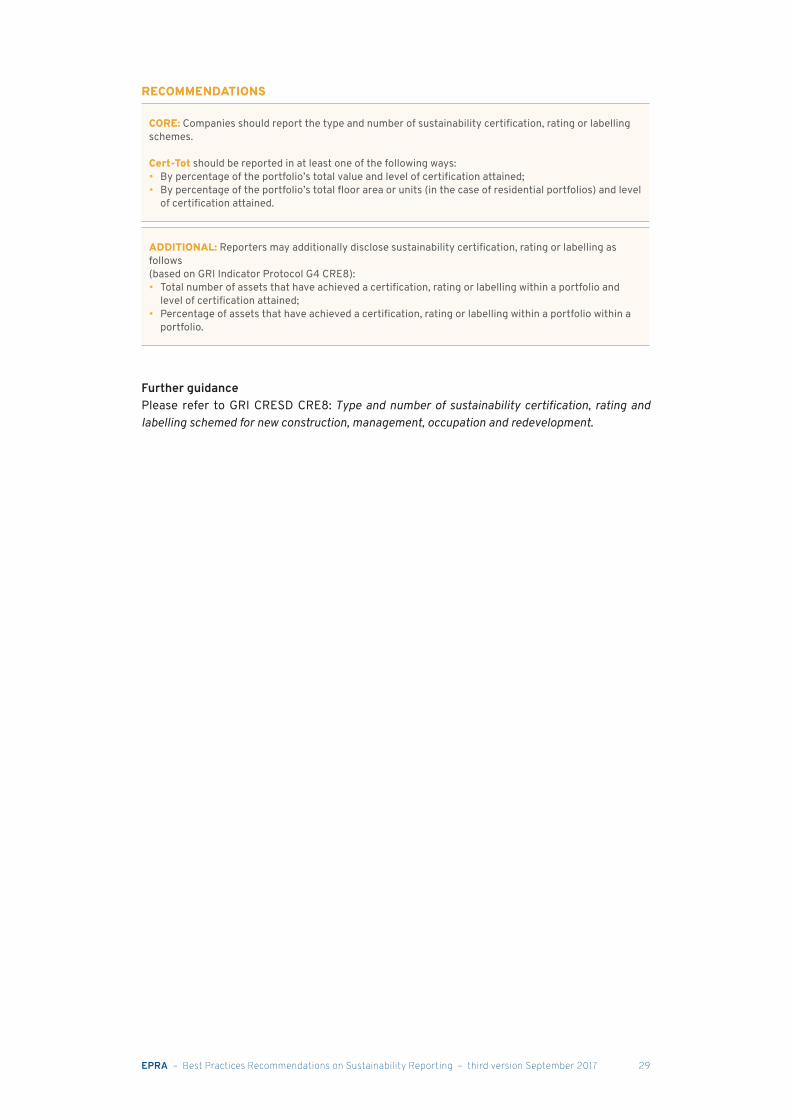
CORE: Companies should report the type and number of sustainability certification, rating or labelling schemes.
Cert-Tot should be reported in at least one of the following ways:• By percentage of the portfolio’s total value and level of certification attained;• By percentage of the portfolio’s total floor area or units (in the case of residential portfolios) and level
of certification attained.
ADDITIONAL: Reporters may additionally disclose sustainability certification, rating or labelling as follows(based on GRI Indicator Protocol G4 CRE8):• Total number of assets that have achieved a certification, rating or labelling within a portfolio and
level of certification attained;• Percentage of assets that have achieved a certification, rating or labelling within a portfolio within a
portfolio.
Further guidancePlease refer to GRI CRESD CRE8: Type and number of sustainability certification, rating and labelling schemed for new construction, management, occupation and redevelopment.
EPRA – Best Practices Recommendations on Sustainability Reporting – third version September 2017 30
5. EPRA Sustainability Performance Measures - Social
5.1 Diversity-Emp Employee gender diversityCorporate-level performance measure
Percentage of male & female employees
DefinitionDiversity-Emp refers to the percentage of male and female employees in the organisation’s governance bodies and other significant employee categories.
IssueThe value of having a diverse workforce is widely recognised. Promoting gender diversity remains a priority for many companies and women often remain underrepresented at management levels in the corporate pipeline, with the disparity greatest in senior leadership. Comparisons between board-level, senior management and other employee categories offer information on the degree by which equal opportunities commitments are embedded throughout the company.
RationaleDiversity-Emp provides a quantitative measure of gender diversity within an organisation. Reporting gender diversity should encourage companies to measure and manage the success of their efforts to promote gender diversity, as well as providing a quantitative measure of diversity that can be used in conjunction with sectorial or regional benchmarks. Secondly, reporting on this performance measure can support companies in their reporting against the mandatory diversity reporting requirements that are steadily being introduced, such as in the United Kingdom where companies are required to disclose the number of female employees on the Board, in senior management and all other positions.
RECOMMENDATIONS
CORE: Companies must report the percentage of male and female employees in the organisation’s governance bodies and other significant employee categories.
Diversity-Emp should be calculated with reference to the following guidance (based on GRI Standard 405-1):• An employee refers to an individual who is in a direct employment relationship with the reporting
organisation (excluding supervised workers and sub-contractors), according to national law or its application.
• Governance body refers to the committee or board responsible for the strategic guidance of the organisation, the effective monitoring of management, and the accountability of management to the broader organisation and its stakeholders. For the purposes of this performance measure, the governance body would typically refer the Board of Directors of the company, and the scope includes Non-Executive Directors.
• Other significant employee categories refer to senior management and non-management functions. Organisations can use their discretion in determining the definition applied to other significant employee categories. As a guide, senior management can be defined as managers (other than direc-tors) who have responsibility for planning, directing or controlling the activities of the entity, or a strategically significant part of it.
Further guidancePlease refer to the relevant GRI Standard 405-1: Diversity of governance bodies and employees.
EPRA – Best Practices Recommendations on Sustainability Reporting – third version September 2017 31
5.2 Diversity-Pay Gender pay ratioCorporate-level performance measure
Pay ratio
DefinitionDiversity-Pay refers to the ratio of the basic salary and/or remuneration of men to women.
IssueA company’s commitment to diversity should apply equally to recruitment, development and remuneration. While there can be a number of causes behind gender pay gaps, companies’ efforts to tackle gender pay gaps can indicate the effectiveness of their commitment to reviewing their operations and decisions in order to promote diversity, eliminate gender bias and support equal opportunity.
RationaleDiversity-Pay can be used to measure the extent of remuneration equality in the workplace. Increasing transparency in this area can raise the issue among an organisation’s stakeholders. The issue is under increasing legislative scrutiny with mandatory reporting requirements covering pay differences being rolled out across the European Union.
RECOMMENDATIONS
CORE: Companies must report the ratio of the basic salary and/or remuneration of male and female employees in the organisations governance bodies and other significant employee categories.
Diversity-Pay should be calculated with reference to the following guidelines (based on GRI Standard 405-2):• Basic salary refers to the fixed, minimum amount paid to an employee for performing his or her
duties, excluding any additional remuneration, such as payments for overtime working, bonuses and/or share options.
• Remuneration refers to the basic salary plus additional amounts paid to a worker. According to GRI guidance, these additional amounts can include those based on years of service, bonuses including cash and equity (such as stocks and shares), benefit payments, overtime, time owed and any addi-tional allowances (such as transportation along with living and childcare allowances).
• Governance bodies and other significant employee categories should mirror the categories identified under Diversity-Emp.
• The ratio can be calculated by dividing the average pay and/or remuneration of male employees by the average pay and/or remuneration of female employees according to each employee category being assessed.
• Reporting companies may use the narrative on performance to explain the pay ratio and any actions being taken to address any gaps.
Further guidancePlease refer to the relevant GRI Standard 405-2: Ratio of basic salary and remuneration of women to men.
5.3 Emp-Training Training and developmentCorporate-level performance measure
Average number of hours
DefinitionEmp-Training refers to the average hours of training that the organisation’s employees have undertaken in the reporting period.
EPRA – Best Practices Recommendations on Sustainability Reporting – third version September 2017 32
IssueDeveloping and retaining talent can increase a company’s competitiveness: talent developed and retained enhances know-how, increases the potential for innovation and supports a strong corporate reputation. Evidence shows that companies who invest in the development of their employees have improved employee satisfaction levels, high retention rates and can boost recruitment.
RationaleEmp-Training provides an insight into the scale and commitment of an organisation’s investment in training and the degree to which the investment is made across the entire employee base.
RECOMMENDATIONS
CORE: Companies must report the average hours of training that the organisation’s employees have undertaken in the reporting period.
Emp-Training should be calculated with reference to the following guidance (based on GRI Standard 404-1):• ‘Employee’ refers to direct employees (excluding supervised workers and sub-contractors) who are
based at the organisation’s offices and assets under management. The denominator used to calculate the average should be the total number of employees at the end of the reporting period and can be expressed as either head count or Full-Time Equivalent (FTE).
• In the context of this performance measure, ‘training’ refers to: – all types of vocational training and instruction; – paid educational leave provided by an organisation for its employees; – training or education pursued externally and paid for in whole or in part by an organisation; – training on specific topics.
• Training does not include onsite coaching by supervisors.• Reporting companies may use the narrative on performance to explain the type and subjects covered
in the training provided, and any explanation of trends if multiple years’ data is provided.
ADDITIONAL: Companies may also disclose the average hours of training by gender and employee category, based on the employee data and categories identified in response to Diversity-Emp.
Further guidancePlease refer to the relevant GRI Standard 404-1: Average hours of training per year per employee.
5.4 Emp-Dev Employee performance appraisalsCorporate-level performance measure
Percentage of total workforce
DefinitionEmp-Dev refers to the percentage of total employees who received regular performance and career development reviews during the reporting period.
IssueRegular performance and career development reviews aid the personal development of individual employees and contribute to skills management and the development of human capital within the organisation. A demonstrable commitment to employee development can, in turn, contribute to high levels of employee satisfaction, which correlates with improved organisational performance and retention rates.
EPRA – Best Practices Recommendations on Sustainability Reporting – third version September 2017 33
RationaleEmp-Dev measures the extent to which an organisation regularly appraises employee performance. It helps to demonstrate how an organisation works to monitor and maintain the skill sets of its employees and the extent to which this is applied throughout the organisation, and whether there is equal access to these opportunities.
RECOMMENDATIONS
CORE: Companies must report the percentage of total employees who received a regular performance and career development review during the reporting period.
Emp-Dev should be calculated with reference to the following guidance (based on GRI Standard 404-3):• ‘Employees’ refers to direct employees (excluding supervised workers and sub-contractors) who are
based at the organisation’s offices and assets under management. The denominator used to calculate the percentage should be the total number of employees at the end of the reporting period.
• Regular performance and career development reviews can be identified as a review: • based on criteria known to the employee and his or her superior and;• undertaken with the knowledge of the employee at least once a year. • The review can include an evaluation of the employee’s direct superior, peers or a wider range of
employees and can also include the human resources department.
ADDITIONAL: Reporters may also disclose the percentage of employees who received a regular perfor-mance and career development review by gender and by employee category, based on the information collected in response to Diversity-Emp.
Further guidancePlease refer to the relevant GRI Standard 404-3: Percentage of employees receiving regular performance and career development reviews.
5.5 Emp-Turnover Employee turnover and retentionCorporate-level performance measure
Total number and rate of new employee hires
and turnover
DefinitionEmp-Turnover refers to the total number and rate of new employee hires and employee turnover during the reporting period.
IssueNew hires and employee turnover result in changes to the human and intellectual capital of the organisation and can have both positive and negative impacts on productivity. They can have direct cost implications either in terms of reduced payroll or greater expenses for the recruitment of employees. A high rate of employee turnover, moreover, can indicate levels of uncertainty and dissatisfaction among employees.
RationaleEmp-Turnover can indicate a company’s ability to attract and retain employees. Reporting the number and rate of new hires and employee turnover can signify the effectiveness of a company’s efforts to retain talent. It also acts as proxy measures of the effectiveness of efforts to boost engagement and satisfaction levels.
EPRA – Best Practices Recommendations on Sustainability Reporting – third version September 2017 34
RECOMMENDATIONS
CORE: Companies must report the:1. Total number and rate of new employee hires;2. Total number and rate of employee turnover.
Emp-Turnover should be calculated with reference to the following guidance (based on GRI Standard 401-1):• New hire and turnover rates should be calculated based on the total employee numbers at the end of
the reporting period and expressed as a percentage or ratio. • ‘Turnover’ refers to employees who leave the organisation voluntarily or due to dismissal, retirement
or death in service. • ‘Employee’ refers to direct employees (excluding supervised workers and sub-contractors) who are
based at the organisation’s offices and assets under management.
ADDITIONAL: Reporters may also disclose the total number and rate of new employee hires and turn-over by gender and by employee category, based on the information collected in response to Diversi-ty-Emp.
Further guidancePlease refer to the relevant GRI Standard 401-1: Percentage of employees receiving regular performance and career development reviews.
5.6 H&S-Emp Employee health and safetyCorporate-level performance measure
Injury rate, lost day rate , absentee rate and work-related fatalities
DefinitionH&S-Emp refers to the occupational health and safety performance of the reporting organisation with relation to its direct employees.
IssueHealth and safety incidents occurring in the workplace can cause harm to workers and expose companies to risks such as reputational damage, fines and loss of productivity. Low injury and absentee rates are generally linked to positive trends in morale and productivity. Maintaining a constant focus on health and safety is necessary to ensure safe behaviours are embedded into the workplace. Accurate monitoring can help to protect employees and contribute to employee well-being.
RationaleH&S-Emp measures the degree by which health and safety management practices are resulting in fewer occupational injuries, lost days and absenteeism rates.

EPRA – Best Practices Recommendations on Sustainability Reporting – third version September 2017 35
RECOMMENDATIONS
CORE: Companies must report the Injury Rate (IR), Lost Day Rate (LDR) or Accident Severity Rate (ASR), Absentee Rate (AR), and work-related fatalities for all direct employees (where material).
H&S-Emp should be calculated with reference to the following guidance (based on GRI Standard 403-2):• ‘Injury Rate’ refers to the frequency of injuries, relative to the total time worked by all employees
during the reporting period. It can be expressed as the number of injuries (the numerator) per multi-ple of hours worked (the denominator). An injury refers to any non-fatal or fatal injury arising out of, or in the course of, work.
• ‘Lost Day Rate’ refers to the impact of occupational accidents and diseases as reflected in time off work by the affected employees. It can be expressed as the total lost days (the numerator) relative to the total number of hours worked (the denominator). A lost day typically refers to the time (‘days’) that cannot be worked as a consequence of an employee or employees being unable to perform their usual work because of an occupational disease or accident.
• Accident Severity Rate’ can be selected as an alternative to the Lost Day Rate for companies that are required to report occupation accidents under this indicator. In this case, occupational diseases can be reported under the Absentee Rate.
• ‘Absentee Rate’ is a measure of actual absentee days lost. It can be expressed as a proportion of total days lost (the numerator) relative to the total number of days scheduled to be worked by employees for the same period (the denominator). Absentee refers to an employee absent from work because of incapacity of any kind such as illness, not just as the result of work-related injury or disease21. Compa-nies reporting absentee rate are encouraged to provide a breakdown of absentee rate by cause.
• ‘Work-related fatality’ refers to the death of an employee occurring in the current reporting period, arising from an occupational disease or injury sustained or contracted while performing work con-trolled by the organisation or in workplaces the organisation controls.
• The scope of this performance measure covers direct employees only (excluding supervised workers and sub-contractors) who are based at the organisation’s offices and assets under management, i.e. whose work, or workplace, is controlled by the reporting company.
• If one or more of the requested indicators is not considered material, reporting organisations can apply the overarching recommendation of Materiality when determining what information to provide.
ADDITIONAL: Reporters may also disclose the injury rate (IR), lost day rate (LDR), absentee rate (AR) and work-related fatalities for all workers whose work, or workplace, is controlled by the organisation. In this instance, workers can be defined as interns, apprentices, self-employed persons, and persons working for organisations other than the reporting organisation, e.g. for suppliers, contractors and sub-contractors
Further guidancePlease refer to the relevant GRI Standard 403-2: Types of injury and rates of injury, occupational diseases, lost days, and absenteeism, and number of work-related fatalities.
5.7 H&S-Asset Asset health and safety assessmentsAssets-level performance measure
Percentage of assets
DefinitionH&S-Asset refers to the proportion of assets controlled by the reporting company for which health and safety impacts have been reviewed or assessed for compliance or improvement.
IssueResponsibility for end user (tenants, visitors, service suppliers and other building users) health and safety impacts that fall under the management responsibility of landlords can vary significantly across assets types: from indoor air quality to fire and elevator safety; disabled access; and training, disaster management and emergency procedures. Health and safety assessments may be conducted as part of a voluntary or mandatory arrangement according 21 Absentee excludes permitted leave absences such as holidays, study, maternity or paternity leave, and
compassionate leave.
EPRA – Best Practices Recommendations on Sustainability Reporting – third version September 2017 36
to health and safety management policies and procedures, legislation or to ensure compliance with the use of established standards such as OHSAS 18001 or other HSE standards.
RationaleH&S-Asset identifies the existence and scope of efforts to address end user health and safety at assets under the operational control of the reporting company.
Recommendations
CORE: Companies must report the percentage of assets for which health and safety impacts are assessed or reviewed for compliance or improvement.
H&S-Asset should be calculated with reference to the following guidance (based on GRI Standard 416-2):• ‘Assessments’ can refer to mandatory and voluntary assessments and reviews, as well as internal and
external audits/re-assessments. For example, mandatory assessments might be those carried out as part of OHSAS 18001 certification. Voluntary assessments can include annual health and safety reviews, audits and compliance checks conducted as part of the reporting company’s health and safety management policy. Companies should disclose the type of assessment included in the calcu-lation as part of their narrative on performance.
• ‘Health and safety impacts’ relate to the impact on end users, such as building occupiers or visitors. Examples of impacts can include indoor air quality standards; fire safety; mechanical systems; acces-sibility standards (including during normal operation, and in the case of emergency); indoor water quality; and hazardous substances and contaminants, including asbestos.
• Organisations should restrict the scope of their reporting to assets that fall under their responsibility and over which they have management control. Assets that fall under the responsibility of the occupi-ers are excluded from this performance measure.
Further guidancePlease refer to the relevant GRI Standard 416-1: Assessment of the health and safety impacts of product and service categories
5.8 H&S-Comp Asset health and safety complianceAssets-level performance measure
Number of incidents
DefinitionH&S-Comp refers to any incidents of non-compliance with regulations and/or voluntary standard concerning the health and safety impacts of assets assessed during the reporting period.
IssueEnsuring compliance regulations and or voluntary standards with regard to health and safety impacts can help to protect building users, reduce costs from fines and protect a company’s reputation. Low incidences of non-compliance demonstrate the effective implementation of policies, practices and training relating to end user health and safety. Maintaining a constant focus on health and safety is necessary to ensure safe behaviours are embedded into asset management practices that relate to end users.
RationaleH&S-Comp evaluates the effectiveness of the reporting company’s policies and practices relating to end user health and safety, and the outcome of the assessments reported under Health & Safety-Assets.

EPRA – Best Practices Recommendations on Sustainability Reporting – third version September 2017 37
RECOMMENDATIONS
CORE: Companies must report any incidents of non-compliance with regulations and voluntary codes concerning the health and safety impacts of assets assessed during the reporting period.
H&S-Comp should be calculated with reference to the following guidance (based on GRI Standard 403-2):• To report against this performance measure, organisations should restrict the scope to assets and
assessments identified under H&S-Assets. • If the organisation has not identified any non-compliance with regulations and/or voluntary codes, a
brief statement of this is sufficient.
Further guidancePlease refer to the relevant GRI Standard 416-2: Incidents of non-compliance concerning the health and safety impacts of products and services. This section should be read in conjunction with the H&S-Asset section of this document.
5.9 Comty-Eng Community engagement, impact assessments and development programmes
Assets-level performance measurePercentage of assets
DefinitionComty-Eng relates to the percentage of assets under operational control that have implemented local community engagement, impact assessments and/or development programmes.
IssueEngagement with the local community can be particularly important for owners and investors of asset types, such as retail. Establishing an effective stakeholder engagement process is important for helping organisations understand how local communities might be affected by their assets, including their actual and potential impacts. This enables an organisation to consider the views of community stakeholders in its decisions, their expectations and needs, and to address its potential impacts on local communities in a timely manner.
RationaleComty-Eng seeks to measure the extent by which community engagement programmes are applied across the reporting organisation’s assets.
RECOMMENDATIONS
CORE: Companies must report the percentage of assets that have implemented local community engagement, impact assessments and/or development programmes.
Comty-Eng should be calculated with reference to the following guidance (based on GRI Standard 413-1):• There are many elements that can be incorporated into local community engagement, impact assess-
ments, and development programmes. For the purposes of this performance measure, organisations can use their discretion to determine what constitutes a ‘community programme’. Companies may identify programmes according to two broad categories:
– Social and environmental impact assessments: This can include the impact of an asset on the local economy and inhabitants, community and environment. It may include ongoing monitoring and local community and development programmes based on the local communities’ needs;
– Stakeholder engagement programmes: This can include broad-based local community consultation committees and formal local community outreach processes.
• A description of the type of programme used by the organisation, including whether it is a corporate policy that applies across all activities or an individual asset-level programme, should be added to the narrative on performance.
Further guidancePlease refer to the relevant GRI Standard 413-1: Operations with local community engagement, impact assessments and development programmes.
EPRA – Best Practices Recommendations on Sustainability Reporting – third version September 2017 38
6. EPRA Sustainability Performance Measures - Governance
6.1 Gov-Board Composition of the highest governance bodyCorporate-level performance measure
Total numbers
DefinitionGov-Board refers to the composition of the highest governance body.
IssueThe composition of a company’s highest governance body provides an insight into the range of opinions, backgrounds and expertise that support its corporate governance. It instills confidence in its decision-making, independence, its ability to deliver value and the skills required to consider the broader social and environmental factors that could impact the long-term future of the company.
RationaleGov-Board provides an overview of the company’s governance structure and its board composition, and their competencies in evaluating economic, environmental and social performance.
RECOMMENDATIONS
CORE: Companies must report the composition of the highest governance body by:1. Number of executive board members; 2. Number of independent/non-executive board members; 3. Average tenure on the governance body;4. Number of independent/non-executive board members with competencies relating to environmental
and social topics.
Gov-Board should be calculated with reference to the following guidance (based on GRI Standard 102-22):• ‘Highest governance body’ refers to the committee or board responsible for the strategic guidance
of the organisation, the effective monitoring of management and the accountability of management to the broader organisation and its stakeholders. For the purposes of this performance measure, the highest governance body is that identified under Diversity-Emp.
• The Number of independent/non-executive board members with competencies relating to environ-mental and social topics can be disclosed by the provision of qualitative information such as biogra-phies detailing the competencies and experience of each member,
• Organisations that are required to report this information under national corporate governance codes can provide a clear reference to where the relevant information is located (either in their annual report or other corporate communications).
Further guidancePlease refer to the relevant GRI Standard 102-22: Composition of the highest governance body and its committees.
EPRA – Best Practices Recommendations on Sustainability Reporting – third version September 2017 39
6.2 Gov-Select Nominating and selecting the highest governance body
Corporate-level performance measure
Narrative description
DefinitionGov-Select refers to the nomination and selection process for the highest governance body and its members, and the criteria used to guide the nomination and selection process.
IssueThe OECD’s22 guidance on good practice corporate governance disclosure recommends that organisations provide transparency around the selection process for members of the highest governance body. This includes transparency on the nomination and selection of board members based on their skills and experience, and the degree to which other factors are considered, including the participation of stakeholders and criteria such as diversity, independence and expertise. This performance measure provides assurances on the organisation’s compliance with established nomination procedures and the selection of a balanced and qualified board composition.
RationaleGov-Select describes the reporting organisation’s processes that ensure effective corporate governance. It provides evidence that the composition of board membership reported under Board-Composition is maintained or enhanced.
RECOMMENDATIONS
CORE: Companies must describe the nomination and selection process for the highest governance body and its members, and the criteria used to guide the nomination and selection process.
Gov-Select should be prepared with reference to the following guidance (based on GRI Standard 102-24):• Report the nomination and selection processes for the highest governance body and its committees;• Report the criteria used for nominating and selecting highest governance body members, including
whether and how: – Stakeholders (including shareholders) are involved; – Diversity is considered; – Independence is considered; – Expertise and experience relating to economic, environmental and social topics are considered.
• Organisations that are required to report this information under national corporate governance codes can provide a clear reference to where the relevant information is located (either in their annual report or other corporate communications).
Further guidancePlease refer to the relevant GRI Standard 102-24: Nominating and selecting the highest governance body.
6.3 Gov-CoI Process for managing conflicts of interestCorporate-level performance measure
Narrative description
DefinitionGov-CoI refers to the processes for the highest governance body to ensure conflicts of interest are avoided and managed.
22 www.oecd.org/corporate/ca/corporategovernanceprinciples/31557724.pdf
EPRA – Best Practices Recommendations on Sustainability Reporting – third version September 2017 40
IssueThe OECD recommends that information on individual board members and key executives is necessary to evaluate their experience and qualifications, and assess any potential conflicts of interest that might affect their judgement. Companies should, therefore, disclose how they manage material conflicts of interest that may affect the exercise of key ownership rights regarding their investments, including share ownership in the company and membership of other boards. It is important to disclose membership of other boards, not only because it is an indication of experience and possible time pressures facing a member of the board, but also because it may reveal potential conflicts of interest and makes transparent the degree to which there are inter-locking boards.23
RationaleGov-CoI provides assurances to shareholders and other stakeholders that the highest governance body has the robust procedures in place to manage potential conflicts of interest.
RECOMMENDATIONS
CORE: Companies must describe their processes to ensure that conflicts of interest are avoided and managed in the highest governance body.
Gov-CoI should be prepared with reference to the following guidance (based on GRI Standard 102-25):• ‘Conflicts of interest’ refers to situations where an individual is confronted with choosing between the
requirements of his or her function and his or her own private interests. • Report whether conflicts of interest are disclosed to stakeholders, including, as a minimum:
– Cross-board membership; – Cross-shareholding with suppliers and other stakeholders; – Existence of controlling shareholder; – Related party disclosure.
• When compiling the information, the reporting organisation should align the definition of ‘controlling shareholder’ to the definition used for the purpose of the organisation’s consolidated financial state-ments or equivalent documents.
• Organisations that are required to report this information under national corporate governance codes can provide a clear reference to where the relevant information is located (either in their annual report or other corporate communications).
Further guidancePlease refer to the relevant GRI Standard 102-25: Conflicts of Interest.
23 www.oecd.org/corporate/ca/corporategovernanceprinciples/31557724.pdf
EPRA – Best Practices Recommendations on Sustainability Reporting – third version September 2017 41
7. Overarching Recommendations
The following recommendations are overarching principles that should be applied to the Sustainability Performance Measures addressed in Sections 4, 5 and 6.
7.1 Organisational boundaries
IssueBoundaries determine the extent of reporting according to assets or organisational activities owned or controlled by the reporting company. Boundary assessments allow a company to establish which operations should be in and out of reporting scope for both asset-level and corporate-level performance measures. It is important that reporters clearly articulate how boundaries are defined so stakeholders can understand the extent of operations and activities included in the performance analysis.
RationaleDefinition of the company’s organisational boundaries represents a key step in sustainability reporting. To date, the GHG Protocol, developed by the World Resources Institute and the World Business Council for Sustainable Development, has been a key reference for companies to inform their decisions on what approach to adopt -Operational Control, Financial Control or Equity share24.
EPRA’s research has shown that the operational control approach has been the most frequently adopted by listed real estate companies in Europe for reporting on asset-level sustainability impacts. The operational control approach is defined as follows: “…A company has operational control over an operation if the former or one of its subsidiaries […] has the full authority to introduce and implement its operating policies at the operation…”25
The operational control approach should not be considered a default or ‘perfect fit’ for real estate companies. Indeed, there are justifications for other approaches, such as equity share where the issue of co-ownership can be addressed by determining which assets are either included or excluded from reporting.
RECOMMENDATION
CORE: It should be noted that, prior to deciding which type of boundary approach a company should choose, it should carefully consider the following:• Companies should map their organisational structure; specifically, due consideration should be made
as to whether assets are subsidiaries, associates, incorporated or unincorporated joint ventures.• For asset-level performance measures, companies should disclose the value or number (absolute or
% of portfolio) of buildings in the portfolio included in the organisational boundary approach taken.• Companies should explain why they have chosen a certain boundary approach over others.• The issue of financial/operational leases is important to consider as part of the boundary approach
definition. It should be noted that the GHG Protocol treats assets leased on financial leases (as opposed to operational leases) differently.
• Although adopting the operational approach is not mandatory, for all asset-level performance mea-sures, companies should aim to report 100% of all assets where they have operational control.
Further guidancePlease refer to the GRI Guidance on setting the organisational boundary and the GHG Protocol for further guidance on this26.
24 www.ghgprotocol.org/standards/corporate-standard25 Ibid.26 www.globalreporting.org/standards/media/1038/gri-103-management-approach-2016.pdf#page=6 and
the GHG Protocol recommendations on ‘Setting Organisational Boundaries’ in www.ghgprotocol.org/sites/default/files/ghgp/standards/ghg-protocol-revised.pdf
EPRA – Best Practices Recommendations on Sustainability Reporting – third version September 2017 42
7.2 Coverage
IssueCoverage delineates what percentage or number of assets within the organisational boundary are included in data disclosed for each asset-level performance measure.
RationaleIt may not be possible to collect data on all asset-level performance measures for all assets within the organisational boundary. A company may also prefer to exclude data for an asset if the data is not considered reliable. This may be the case for all or only some performance measures for an asset.
RECOMMENDATION
CORE: • Ideally, 100% of all assets within the chosen organisational boundary should be included in each
asset-level performance measure.• When this is not the case, the level of data coverage should be specified for each asset-level perfor-
mance measure. • Data coverage for each asset-level performance measure can be disclosed (as values or percentages)
in any of the following ways: – number of assets included in performance measure data
number of assets within organisational boundary approach taken – floor area included in performance measure data
floor area of assets within organisational boundary approach taken – financial value included in performance measure data
financial value of assets within organisational boundary approach taken• If a performance measure is not material for a segmented asset type, or all asset types, this should be
marked as ‘not material’ and the reasons for this decision should be explained (see section 7.12).
7.3 Estimation of landlord-obtained utility consumption
IssueWhen landlord-obtained utility consumption data for asset-level environmental performance measures is partially unavailable or unreliable for an asset, estimation may be necessary.
RationaleEstimation allows complete annual data to be calculated for an asset where data is partially missing or unreliable – though this should not be used as a substitute for gathering complete and accurate data. This allows a company to increase its coverage against some asset-level performance measures.
RECOMMENDATION
CORE: Estimation should be carried out sparingly as datasets should be as complete and accurate as possible. When estimating landlord-obtained utility consumption data for asset-level performance mea-sures, a company should:• Only estimate utility data to fill gaps for missing periods using known consumption from other peri-
ods for the metered supply in question.• Disclose the proportion of total disclosed data estimated (as a percentage of the total disclosed for
that performance measure).• Disclose the method of estimation used. • Use the same method of estimation for all asset-level performance measures and all assets.• If different methods of estimation must be used, this should be clearly indicated for each perfor-
mance measure.• Assets should be excluded from the coverage of data being disclosed in the following cases:
– Where data for one of more meters at an asset is missing for an entire year; – Where the only available data for the asset is unreliable.
EPRA – Best Practices Recommendations on Sustainability Reporting – third version September 2017 43
7.4 Third Party Assurance
IssueThe choice to assure a sustainability report is not a legal requirement across all countries in Europe. However, assurance of sustainability reports by independent third-parties is likely to become increasingly common practice, and EPRA encourages this.
RationaleThe credibility of sustainability data increases when third party assurance is carried out, and the assurance provider is independent and objective.
RECOMMENDATION
CORE: When undertaking third party assurance, reporters should consider the following:• EPRA sBPR quantitative Performance Measures should be verified – ideally all of them and to the
same level.• The level of verification for each Sustainability Performance Measure must be disclosed and should
ideally be to the same level as for financial reporting.• Companies can choose which verification methodology to use and must disclose this in their reports.• EPRA considers assurance credibility to be enhanced if it is undertaken in accordance with rec-
ognised standards such as AA1000 or ISAE3000.• The full verification statement must be publicly available and a link should be provided if it is not
included in the report.
7.5 Boundaries – reporting on landlord and tenant utility consumption
IssueData on tenant-obtained utility consumption for asset-level performance measures are not always available to the landlord. Sub-metering of landlord-obtained consumption that services tenant demises is not always universally undertaken; even where it is, the landlord has less control over such consumption than for landlord services for common parts.
RationaleClarity on what is being reported as part of overall consumption can help stakeholders to assess the level of control a reporter has over performance.
RECOMMENDATION
CORE: There is no single, optimal way to report on base (landlord only) or whole building consumption. For asset-level performance measures, companies should, as a minimum, report on utilities consump-tion that they are responsible for obtaining themselves. The longer-term goal should be to report the entire impact arising within a building, irrespective of the arrangements between landlord and tenant.
The following principles apply: • Absolute and like-for-like asset-level performance measures should include only landlord-ob-
tained2711 energy/water.• Where energy/water is obtained by the landlord but consumed in tenant areas and is sub-metered,
such consumption should be itemised (but should be included in the totals).• Exclusion of consumption obtained by the landlord but sub-metered to the tenant can present a num-
ber of issues, such as: – Distortions of intensity performance measures due to a likely mismatch between numerator (e.g.
kWh) and denominator (e.g. floor area). – Distortions of the absolute and like-for-like asset-level performance measures required for regula-
tory compliance with legislation such as the CRC Energy Efficiency Scheme in the UK (this scheme looks at the total energy obtained by the landlord, irrespective of the end user).
– However, for the purposes of corporate sustainability target setting and monitoring, several report-ers assess performance for just the consumption over which the landlord has fuller control. Itemi-sation of total consumption as shown in the Appendix – sample table of EPRA Sustainability Per-formance Measures (section 10) enables this to be done while ensuring consistency with the EPRA sBPR.
• For the purposes of intensity environmental performance measures only, if known, tenant-obtained consumption can be used in calculations, for example to achieve a situation where whole building consumption (tenant-obtained and landlord-obtained) is divided by the whole building floor area.
• Waste reporting should be in line with the reporter’s operational control approach.
27 Landlord-obtained energy covers both that purchased (e.g. from the grid) and produced (e.g. on site).
EPRA – Best Practices Recommendations on Sustainability Reporting – third version September 2017 44
ADDITIONAL: Where the landlords wish to disclose tenant-obtained utilities consumption, this must be reported separately from landlord-obtained consumption (both absolute and like-for-like). A significant reason to assess tenant-obtained consumption is to compare the scale of Scope 1 & 2 GHG emissions (that are under greater landlord control) with Scope 3 (which includes both tenant-obtained consump-tion and consumption sub-metered to tenants). Such a comparison is often not done annually, rather every three to five years.
Further:• Landlords often have limited access to tenant-obtained utility data and this varies between countries.• Therefore, estimation of tenant-obtained consumption is more acceptable than landlord-obtained
consumption.• To estimate tenant-obtained consumption, often a sample of tenant-obtained consumption data is
used to estimate the total tenant-obtained consumption. Alternatively, entirely theoretical modelling can be undertaken.
• Reporters must clearly state any methods of estimation used and the proportion of disclosed data estimated.
7.6 Normalisation
IssueAbsolute utility consumption and health and safety performance data represents a good measure of a company’s exposure to risk (including regulatory risks, fiscal liability, etc.). However, absolute performance measures are affected by increases and decreases in the size of a company’s portfolio and employee base. This makes intensity (normalised) indicators a useful complementary tool for stakeholders to assess companies’ environmental and health and safety performance.
RationaleFor environmental performance measures, intensity is one of the most effective measures of a building’s overall efficiency during the occupation and operational phase of the building lifecycle.
Some advantages of intensity performance measures include:• Aggregated intensity measures, which enable changes over time to reflect the influence
of acquisitions, disposals and developments/major refurbishments without the need to exclude any properties from aggregation in any year;
• Ability to compare the relative intensity of different portfolios (e.g. an office portfolio versus a shopping centre portfolio).
For health and safety performance measures, normalised injury, lost day and absentee rates provide an established benchmark to compare corporate performance over time, and between peers and industries.
RECOMMENDATIONIntensity indicators are best suited to compare a company’s performance over time, rather than for comparison between companies over time (unless the same methodologies are applied).
Energy, GHG emissions, water, waste and health and safety require different types of intensity indicators, as different factors may drive consumption and performance.
EPRA – Best Practices Recommendations on Sustainability Reporting – third version September 2017 45
CORE: As a general rule, companies should define the exact denominator used in the intensity indicator, as well as the method of matching numerator and denominator to account for different scenarios.
Recommended denominators are as follows:• Numbers of people Reporters may use numbers of people as a denominator as long as they clearly state how they have
defined and measured it. Please note that water benefits most from the use of a ‘per person’ indicator as its consumption is driven by people and users of the building.
• Floor area Although floor areas used in sustainability reporting vary between and within different regions, these
should be consistent with those used in financial reports (reporters should use the same type of area in their sustainability and financial reporting). Companies should ensure the type of floor area, and the associated consumption figures, are as closely aligned as possible in their coverage of the build-ing’s areas i.e. match numerator and denominator.
• Revenue Revenue can be used as a basis for intensity indicators as this might provide valuable insight when
comparing the real estate industry to other industries. The revenue used to calculate the intensity indicator should be the “net rent” received as derived from the IFRS financial statement on the build-ings associated with the consumption (i.e. excluding service charges revenues, asset sales proceeds etc.)
• Days/hours worked Lost days and hours worked (or multiples thereof) are a standard denominator used to calculate
injury, lost day and absenteeism rates. They should relate to the total number of hours/days con-tracted to be worked by total number of employees or Full-Time Equivalent (FTE) included in the scope of the performance measure.
7.7 Segmental analysis (by property type, geography etc.)
IssueBuilding types and their location may have a significant impact on asset-level performance measures. Therefore, aggregated environmental, health and safety and community data across multiple asset types and geographies can make it challenging for stakeholders when understanding the materiality of a performance measure, or which region or asset class might be under/outperforming against other regions or assets groups in the portfolio.
RationaleComparison between geographies and property types can help explain trends in environmental and social performance. • Geographical segmentation can be a helpful way to analyse resource consumption, although
reporters should be mindful when making comparisons between absolute and intensity performance across geographical borders (for example, explaining weather factors which affect consumption in the accompanying narrative).
• Property types provide another useful way to analyse consumption as property types have different consumption patterns and drivers for resource use.
The GRI CRESD also encourages comparison by location (geographical position of a building according to climatic zone) and building types (function or form of a building). These can include high level categorisations such as commercial and residential, as well as more detailed categorisations of these, such as commercial office, retail warehouse and shopping centre). Please refer to GRI CRESD CRE1: Building energy intensity for an example of the segmental analysis approach applied to energy reporting.
Note that there are further segmentations that may be meaningful for certain reporters in addition to geography and property type.
EPRA – Best Practices Recommendations on Sustainability Reporting – third version September 2017 46
RECOMMENDATION
CORE: It is important that meaningful segmental reporting and analysis is adopted in line with the approach selected by companies in their financial reporting.• Companies should use the property typologies adopted in their financial reporting. Where additional
typologies are used, an explanation for this should be provided. • Mixed use developments represent a special case where it should be clear whether mixed use prop-
erties are listed as one asset or broken down by types of use (e.g. office and retail unit element). In all cases, the approach towards mixed use developments should be in line with companies’ financial reporting.
• Segmental reporting and analysis can be applied to both absolute and intensity asset-level perfor-mance measures.
7.8 Disclosureonownoffices
IssueIn addition to disclosing their investment portfolio and corporate-level performance, the environmental impact of a company’s own occupation should also be disclosed within a company’s sustainability report.
RationaleCompanies are responsible for the environmental impact of their own occupation, in leased or owned offices. While this impact may seem minimal compared to the environmental impact of their investment portfolio, it is important to demonstrate that sustainability principles are practised at the corporate level too.
RECOMMENDATION
CORE: When reporting environmental performance measures for a companies’ own office(s):• Own office(s) impacts should be disclosed and reported separately from those of investment portfo-
lios. • The reporter must clearly state any methods of estimation used.• The proportion of disclosed data that is estimated must be clearly stated.
7.9 Narrative on performance
IssueSimilarly to financial performance, the environmental, social and governance performance and position of real estate companies often requires additional narrative information.
RationaleExplaining the context of the company’s operations and management decisions can enhance stakeholders’ assessment and analysis of non-financial performance in the same way as it can help evaluate financial performance.
RECOMMENDATION
CORE:• Adjustments should not be made to asset-level and corporate-level performance measures. Com-
panies should provide, where appropriate, additional information and commentary or explanation of past performance, and outline plans for managing future performance.
• When looking at the environmental performance of a portfolio, it may be useful to understand what factors, other than building management and tenant behaviour, might explain consumption trends. The most frequently used factors that influence environmental performance include weather, levels of building occupancy, ‘special uses’ (e.g. higher consumption in buildings where tenants undertake trading activities) and age of buildings.
EPRA – Best Practices Recommendations on Sustainability Reporting – third version September 2017 47
7.10 Location of EPRA Sustainability Performance Measures in companies’ reports
RationaleIt is EPRA’s view that companies should include yearly Sustainability & Corporate Responsibility content in their Annual Report and Accounts, supporting the transition towards integrated reporting28.
However, it is not necessary for companies to report in detail on EPRA Sustainability Performance Measures in their annual Sustainability & Corporate Responsibility reports, or that complete EPRA sBPR performance tables are disclosed in Annual Report & Accounts. A sample table including environmental and social performance measures is provided for illustrative purposes in Section 10.
RECOMMENDATION
CORE: • Companies must, as a minimum, include a cross-reference (e.g. a reference or hyperlink) to the
location of the most comprehensive EPRA sBPR performance tables that use the performance mea-sure codes (e.g., Elec-LfL) if these have been published elsewhere (e.g. on the company’s website). Companies should report all performance measures in the table format (including corporate-level performance measures) although, for governance performance measures, these tables can include a reference to where the information can be found using the relevant performance measure codes.
7.11 Reporting period
Rationale Companies that have been reporting on their sustainability performance for a long time may have access to many years’ worth of historical data. While like-for-like performance measures must be reported for the two most recent years, companies can choose to report their performance against Absolute and Intensity performance measures over a much longer period. At the same time, companies must balance the benefits of disclosing longer term trends with the need to provide meaningful data.
RECOMMENDATION
CORE: • Historical data for absolute and intensity performance measures can be disclosed at the discretion
of the reporting company. If the reporter has, for example, multiple years of historical data, they may wish to report the oldest year (especially if it is a baseline year), significant milestone years as well as the most recent three years. For example, a company with 17 years of data may report years 2000, 2010, 2015, 2016 and 2017.
7.12 Materiality
IssueMateriality plays a crucial role in identifying which issues a company should focus on in their sustainability strategies, and consequently in their sustainability reports. Furthermore, there is an increasing expectation on companies to conduct a materiality review as a pre-requisite for reporting against both voluntary and mandatory reporting standards.
28 www.integratedreporting.org
EPRA – Best Practices Recommendations on Sustainability Reporting – third version September 2017 48
RationaleMateriality reviews are a compulsory requirement for organisations using the Global Reporting Initiative’s Reporting Standards, under which organisations must report against the aspects that reflect their significant economic, environmental and social impacts, taking into account the views of internal and external stakeholders.
Meanwhile, the EU’s Directive on non-financial reporting classifies an issue as ‘material’ where its omission or misstatement could reasonably be expected to influence decisions users make on the basis of the financial statements of the organisation. Information on non-financial issues should, therefore, be included to the “extent necessary for an understanding of the undertaking’s development, performance or position…the analysis shall include both financial and, where appropriate, non-financial key performance indicators relevant to the particular business, including information relating to environmental and employee matters.”
Factors that may be taken into account when assessing the materiality of information include the company’s business model; its strategy and principal risks; sectoral issues; the interests and expectations of its stakeholders; the impact of the company’s activities; and the regulatory environment.29
RECOMMENDATION
CORE: • Although conducting a materiality review is not a mandatory requirement, EPRA never-the-less rec-
ommends reporting companies give due consideration to materiality when compiling their response to the Sustainability Performance Measures using guidance published by the GRI. If a reporting company chooses not to respond to a performance measure because they do not consider it to be material, ‘not material’ should be stated in the EPRA Sustainability Performance Measures tables. However, EPRA considers an impact can only be legitimately accepted as non-material if shown to be so through a materiality review.
29 eur-lex.europa.eu/legal-content/EN/TXT/PDF/?uri=CELEX:52017XC0705(01)&from=EN
EPRA – Best Practices Recommendations on Sustainability Reporting – third version September 2017 49
8. Other issues to consider
Issues discussed in this section do not currently warrant separate Best Practices Recommendations. However, the topics below represent important issues to consider in the future, in light of the likely direction of reporting trends and stakeholder expectations.
8.1 Emerging Indicator – Return On Carbon Emissions (ROCE)
IssueThere is a growing appetite amongst investors for companies to report their carbon emissions in relation to their financial performance. The industry is yet to establish a standard metric for a financial carbon intensity indicator as the financial denominator tends to be subject to impacts from unrelated variables.
A more meaningful way of presenting financial carbon intensity metrics has been gaining prevalence among commentators. Return on Carbon Emissions (ROCE) represents the financial return on each tonne of carbon emitted. This is achieved by assessing how much carbon is emitted for every Euro of profit generated. Profit before tax (PBT) is being proposed as the most accurate financial metric because it is the most representative of the operational performance of an organisation. This is important because it is the operations of an organisation that are responsible for producing GHG emissions.
Likely future directionIt is expected that the use of this metric will become more widespread as it will allow investors to more accurately calculate the risk posed to a company from carbon pricing schemes. In addition, this metric will allow companies and investors to identify the cost benefits of carbon reduction programmes.
8.2 Socio-Economic Indicators related to Sustainability Performance
IssueSocio-economic indicators seek to quantify the impact of a company’s operations on surrounding communities and the wider society.
Likely future directionThere is still significant variation in the metrics and indicators used to calculate the total value (inputs and outputs) of an organisation’s social contribution or social return on investment (SROI). Given the interest these metrics are receiving from planning authorities and an increasing social conscience from investors, it is likely that socio-economic metrics will become more widely reported. More sophisticated models and calculation tools are expected to be developed in the coming years, with some becoming standard practice within the sector. In addition, real estate is likely to follow other sectors where companies are starting to report their ‘total contribution’, which includes not the just the value of the inputs’ but the value created. As this happens, metrics are likely evolving so that they focus more on the outcomes of investments and initiatives rather than the scale of contributions.
EPRA – Best Practices Recommendations on Sustainability Reporting – third version September 2017 50
8.3 Transport
IssueThe emissions from employee commuting and business travel patterns, and emissions arising from the end users of assets (e.g. visitors or occupiers), can often be significant although difficult to measure accurately on an ongoing basis.
Likely future directionTransport emissions arising from a company’s activities (such as staff travel) as well as emissions arising from the users of the buildings (tenants’ staff and visitors) should be accounted for in the company’s GHG statements as they cause indirect emissions. Companies looking to report on transport emissions should consult the GRI Standards Total direct (305-1) and indirect (305-2) greenhouse gas emissions by weight. EPRA will continue to closely monitor the reporting trend on transport emissions and future versions of the EPRA sBPR may incorporate guidance on reporting transport related issues.
8.4 Refrigerant gases
IssueFugitive emissions, such as refrigerant gases, remain difficult to measure accurately on an ongoing basis.
Likely future directionFugitive emissions arising from a company’s activities (such as building operation) should be accounted for in the company’s GHG statements as they cause direct emissions. Companies looking to report on refrigerant gases should consult the GRI Standards on Total direct (305-1) and indirect (305-2) greenhouse gas emissions by weight, which provides commentary on common fugitive emissions from real estate, including refrigerant gas from HVAC equipment.
EPRA will continue to closely monitor the reporting trend on refrigerant gases and future versions of the EPRA sBPR may incorporate guidance on reporting refrigerant gases.
EPRA – Best Practices Recommendations on Sustainability Reporting – third version September 2017 51
9.� Definitions�–�Glossary�of�Terms�
Absolute energyThe total amount of energy consumed by an entity and those deemed to be within its organisational boundaries.
BoundariesThe boundaries that determine the direct and indirect emissions associated with operations owned or controlled by the reporting company. This assessment allows a company to establish which operations and sources cause direct and indirect emissions, and to decide which indirect emissions that are a consequence of its operations to include. See also the following definitions on financial control, operational control and equity share.
Building energy intensity The amount of energy used per unit of an appropriate denominator (e.g. floor area, persons).
Building GHG intensity The amount of carbon emitted per unit of an appropriate denominator (e.g. floor area, persons).
Building types Categorisation based on the function or form of a building for example offices, shopping centres, retail warehouses, industrial, multi-family housing and hotels.
Building water intensity The amount of water used per unit of an appropriate denominator (e.g. floor area, persons).
Carbon Disclosure ProjectThe Carbon Disclosure Project (CDP) works with shareholders and corporations to disclose the greenhouse gas emissions of major corporations.
Carbon tradingCarbon emissions trading (also known as cap and trade) is a market-based approach used to control pollution by providing economic incentives for achieving reductions in the emissions of pollutants.
Common partsAreas shared with other occupants in multi-let buildings, including entrance areas, corridors, lifts, staircases, waste storage stores, communal kitchen or breakout facilities and any other parts within the asset and outside intended for the use of the occupiers of that asset.
District heating and coolingDistrict heating and cooling is a system for distributing hot or cold steam and water generated in a centralised location for residential and commercial heating requirements such as space heating and water heating. The heat is often obtained from a cogeneration plant burning fossil fuels but increasingly biomass. Heat-only boiler stations, geothermal heating and central solar heating are also used.
EmployeeAn employee refers to an individual who is in a direct employment relationship with the reporting organisation (excluding supervised workers and sub-contractors), according to national law or its application
EPRA – Best Practices Recommendations on Sustainability Reporting – third version September 2017 52
Equity-share Used to define organisational boundaries for financial and sustainability (and especially GHG emissions) reporting. Equity share reflects economic interest, which is the extent of rights a company has to the risks and rewards flowing from an operation. Typically, the share of economic risks and rewards in an operation is aligned with the company’s percentage ownership of that operation, and equity share will normally be the same as the ownership percentage.
Floor areaCodes for defining floor areas vary by location, building type and landlord-tenant arrangement, for example common parts area, lettable/leasable area, internal area, usable area, occupied area and conditioned/treated area.
Financial control Used to define organisational boundaries for financial and sustainability (and especially GHG emissions) reporting. Financial control relates to where the organisation has the ability to direct the financial and operating policies of the operation with a view to gaining economic benefits from its activities.
Fugitive emissionsFugitive emissions are emissions of gases or vapours from pressurised equipment such as air conditioning due to leaks and various other unintended or irregular releases of gases.
Governance bodyGovernance body refers to the committee or board responsible for the strategic guidance of the organisation, the effective monitoring of management and the accountability of management to the broader organisation and its stakeholders. For the purposes of the Sustainability Performance Measures, governance body typically refers the Board of Directors of the company.
Greenhouse gas (GHG) emissionsGreenhouse gases (sometimes abbreviated to GHG) are gases in the Earth’s atmosphere that cause the greenhouse effect, which can greatly affect the temperature of the Earth. GHGs are the six gases listed in the Kyoto Protocol: carbon dioxide (CO2); methane (CH4); nitrous oxide (N2O); hydrofluorocarbons (HFCs); perfluorocarbons (PFCs); and sulphur hexafluoride (SF6). Since the beginning of the Industrial revolution, the burning of fossil fuels has substantially increased carbon dioxide (CO2) emissions into the atmosphere, thereby contributing to the greenhouse gas effect.
HVACHeating, Ventilation and Air Conditioning
Like-for-likeConsumption of a portfolio that has been consistently in operation, and not under development, during the most recent two full reporting years. This like-for-like definition is aligned with the EPRA Financial BPR like-for-like definition for rental growth reporting. For example, the 2017 like-for-like change compares the 2017 Elec-Abs consumption with the 2016 Elec-Abs consumption for a consistent portfolio. This is the simplest way to take account of changes in the size and composition of a portfolio.
Mandatory disclosure requirementsLegally binding reporting requirements for listed or non-listed companies. In the EU, these requirements include the European Accounts Modernisation Directive, which is interpreted in different ways by different countries.
EPRA – Best Practices Recommendations on Sustainability Reporting – third version September 2017 53
Materiality Material topics for a reporting organisation include those topics that have a direct or indirect impact on an organisation’s ability to create, preserve or erode economic, environmental and social value for itself, its stakeholders and society at large.
Operational control Used to define organisational boundaries for financial and sustainability (and especially GHG emissions) reporting. Operational control relates to where the organisation or one of its subsidiaries has the full authority to introduce and implement its operating policies at the operation.
PersonsThe average number of persons used as a denominator of a building energy intensity indicator. For example visits in shopping centres, workstations in offices, workers in industrial warehouses, residents in multi-family housing or guests in hotels.
Renewable energyEnergy sources that can be replenished in a short time through ecological cycles. Renewable energy sources include geothermal, wind, solar, hydro and biomass.
Total direct GHG emissionsDirect GHG emissions come from sources owned or controlled by the reporting organisation. All direct emission sources are classified as scope 1 under the GHG Protocol.
Total indirect GHG emissionsIndirect GHG emissions are those that are a consequence of the activities of the organisation, but that occur at sources owned or controlled by another organisation or company. Indirect emission sources are classified as either scope 2 or scope 3 under the GHG Protocol. For the purposes of GHG-Indir-Abs, indirect GHG emissions relate to Scope 2 emissions from landlord obtained consumption.
Vacancy ratesThe proportion of lettable/leasable area that is unoccupied.
Waste by disposal route The method by which waste is treated or disposed of, including reuse, recycling, composting, recovery, incineration, landfill, deep well injection and onsite storage.
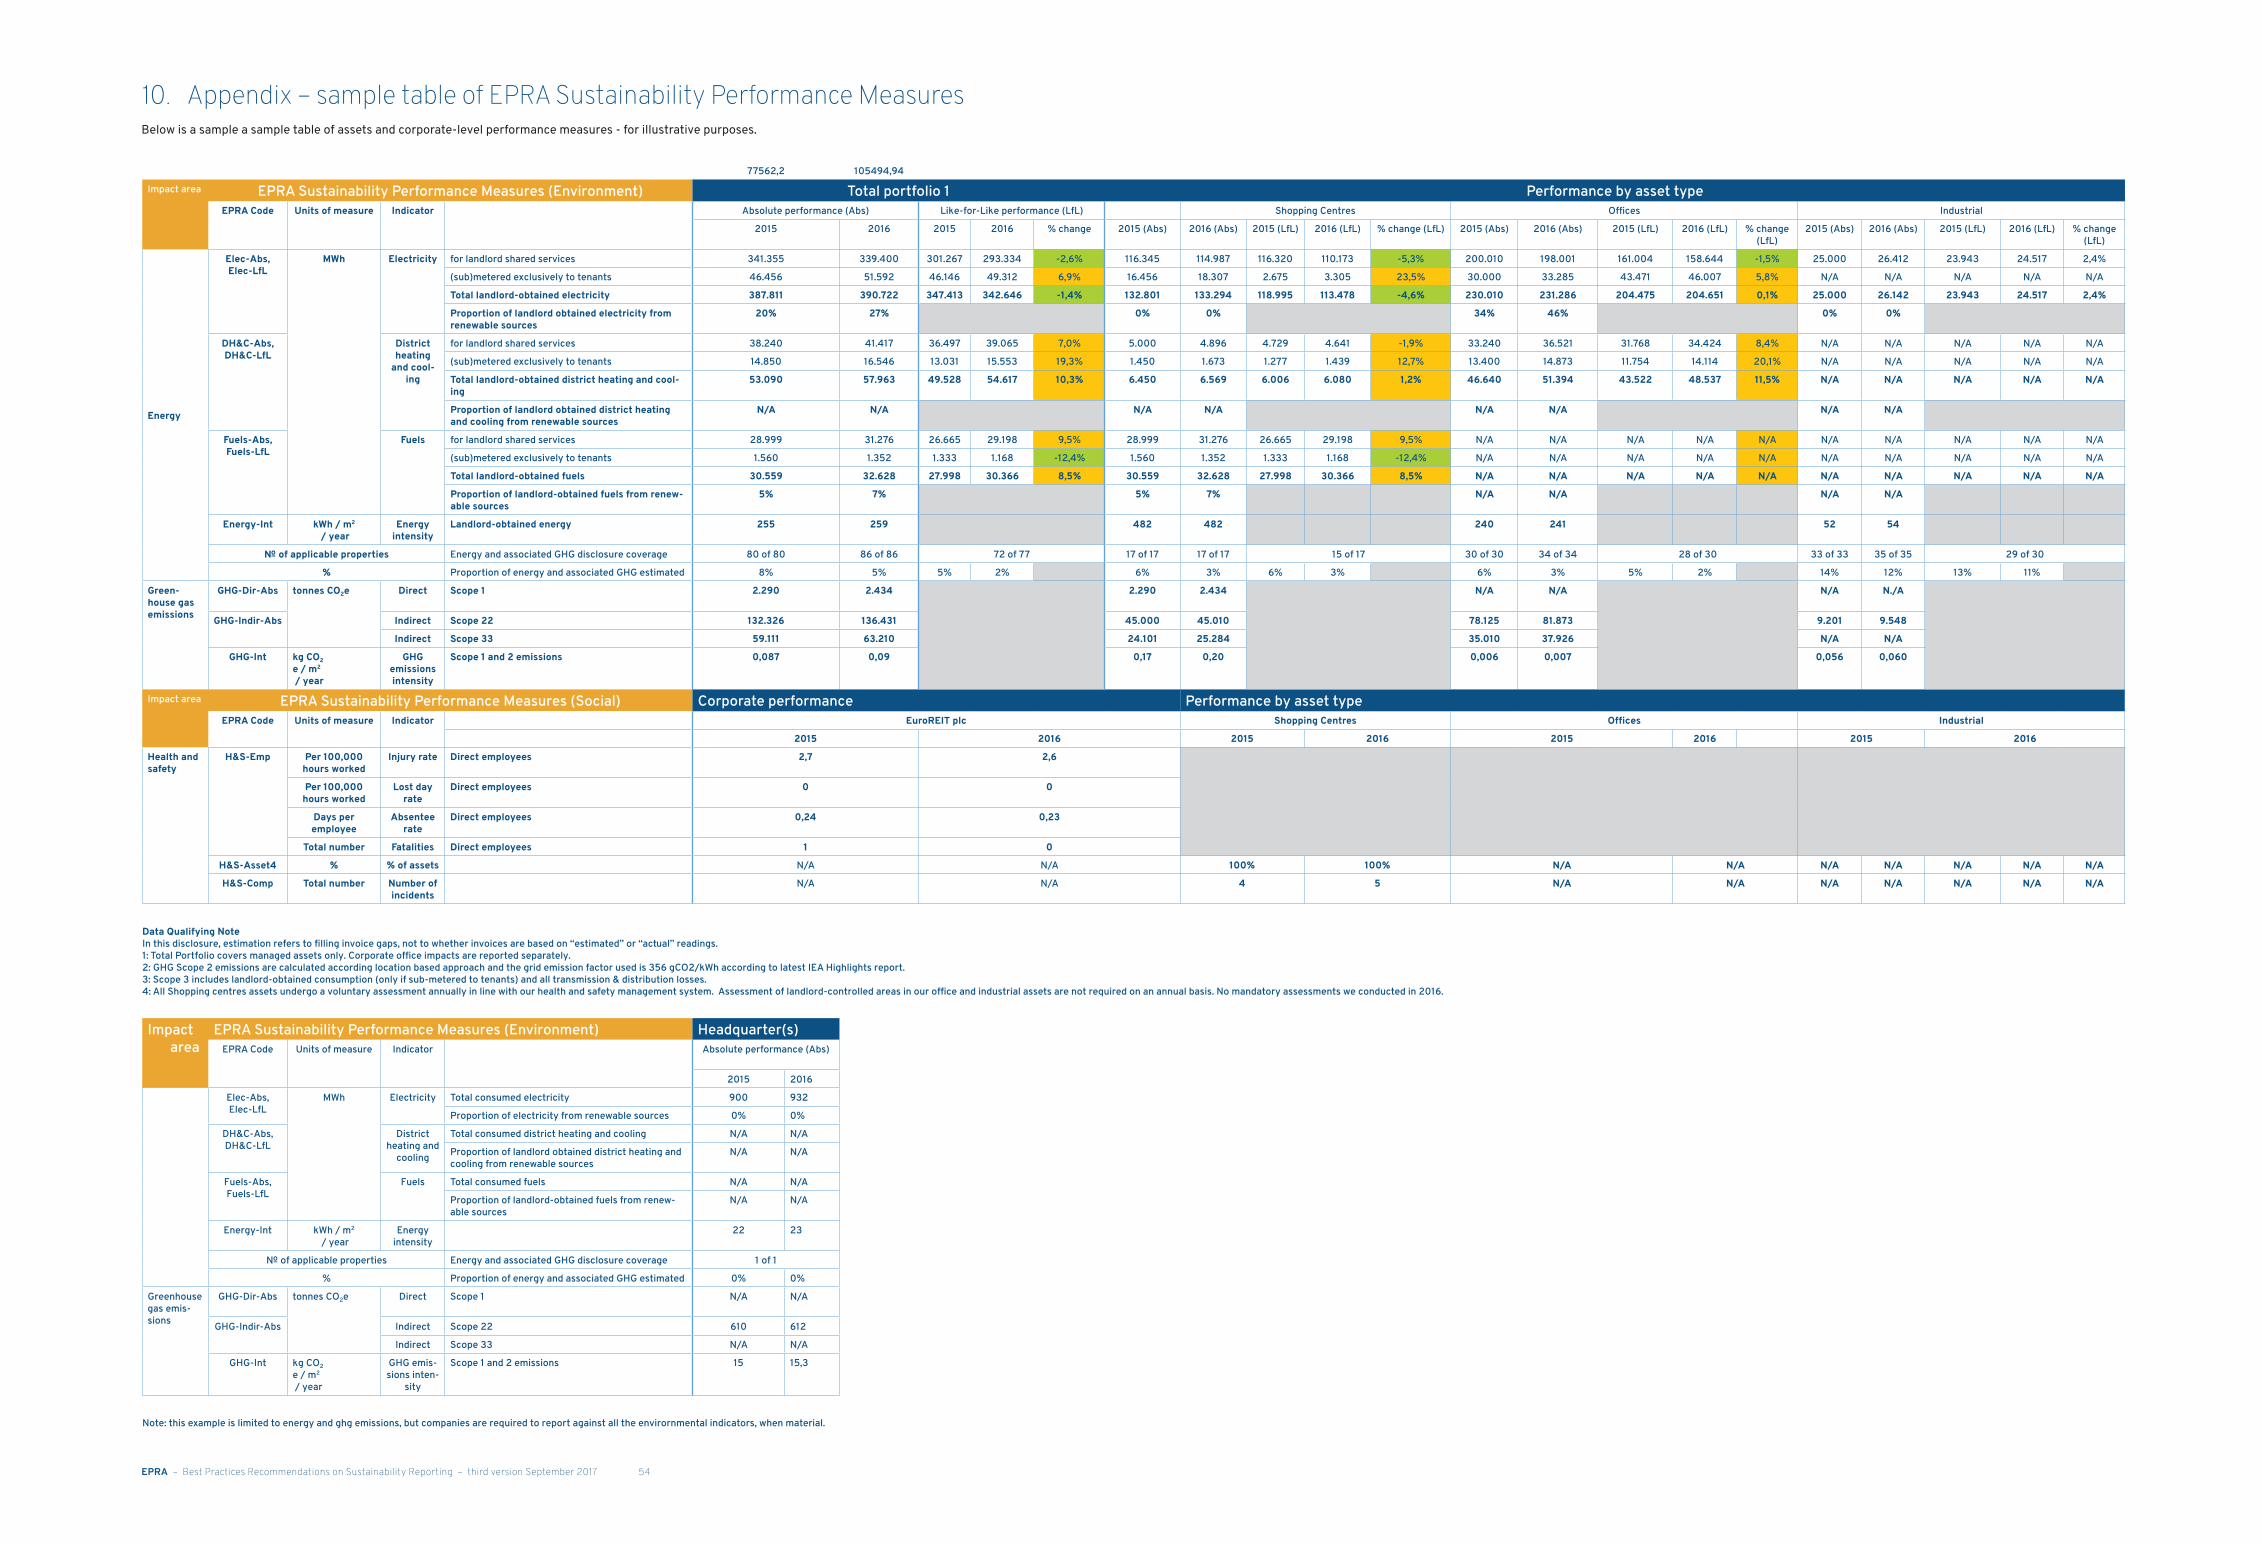
EPRA – Best Practices Recommendations on Sustainability Reporting – third version September 2017 54
10. Appendix – sample table of EPRA Sustainability Performance MeasuresBelow is a sample a sample table of assets and corporate-level performance measures - for illustrative purposes.
77562,2 105494,94
Impact area EPRA Sustainability Performance Measures (Environment) Total portfolio 1 Performance by asset type EPRA Code Units of measure Indicator Absolute performance (Abs) Like-for-Like performance (LfL) Shopping Centres Offices Industrial
2015 2016 2015 2016 % change 2015 (Abs) 2016 (Abs) 2015 (LfL) 2016 (LfL) % change (LfL) 2015 (Abs) 2016 (Abs) 2015 (LfL) 2016 (LfL) % change (LfL)
2015 (Abs) 2016 (Abs) 2015 (LfL) 2016 (LfL) % change (LfL)
Energy
Elec-Abs, Elec-LfL
MWh Electricity for landlord shared services 341.355 339.400 301.267 293.334 -2,6% 116.345 114.987 116.320 110.173 -5,3% 200.010 198.001 161.004 158.644 -1,5% 25.000 26.412 23.943 24.517 2,4%
(sub)metered exclusively to tenants 46.456 51.592 46.146 49.312 6,9% 16.456 18.307 2.675 3.305 23,5% 30.000 33.285 43.471 46.007 5,8% N/A N/A N/A N/A N/A
Total landlord-obtained electricity 387.811 390.722 347.413 342.646 -1,4% 132.801 133.294 118.995 113.478 -4,6% 230.010 231.286 204.475 204.651 0,1% 25.000 26.142 23.943 24.517 2,4%
Proportion of landlord obtained electricity from renewable sources
20% 27% 0% 0% 34% 46% 0% 0%
DH&C-Abs, DH&C-LfL
District heating
and cool-ing
for landlord shared services 38.240 41.417 36.497 39.065 7,0% 5.000 4.896 4.729 4.641 -1,9% 33.240 36.521 31.768 34.424 8,4% N/A N/A N/A N/A N/A
(sub)metered exclusively to tenants 14.850 16.546 13.031 15.553 19,3% 1.450 1.673 1.277 1.439 12,7% 13.400 14.873 11.754 14.114 20,1% N/A N/A N/A N/A N/A
Total landlord-obtained district heating and cool-ing
53.090 57.963 49.528 54.617 10,3% 6.450 6.569 6.006 6.080 1,2% 46.640 51.394 43.522 48.537 11,5% N/A N/A N/A N/A N/A
Proportion of landlord obtained district heating and cooling from renewable sources
N/A N/A N/A N/A N/A N/A N/A N/A
Fuels-Abs, Fuels-LfL
Fuels for landlord shared services 28.999 31.276 26.665 29.198 9,5% 28.999 31.276 26.665 29.198 9,5% N/A N/A N/A N/A N/A N/A N/A N/A N/A N/A
(sub)metered exclusively to tenants 1.560 1.352 1.333 1.168 -12,4% 1.560 1.352 1.333 1.168 -12,4% N/A N/A N/A N/A N/A N/A N/A N/A N/A N/A
Total landlord-obtained fuels 30.559 32.628 27.998 30.366 8,5% 30.559 32.628 27.998 30.366 8,5% N/A N/A N/A N/A N/A N/A N/A N/A N/A N/A
Proportion of landlord-obtained fuels from renew-able sources
5% 7% 5% 7% N/A N/A N/A N/A
Energy-Int kWh / m2 / year
Energy intensity
Landlord-obtained energy 255 259 482 482 240 241 52 54
№ of applicable properties Energy and associated GHG disclosure coverage 80 of 80 86 of 86 72 of 77 17 of 17 17 of 17 15 of 17 30 of 30 34 of 34 28 of 30 33 of 33 35 of 35 29 of 30
% Proportion of energy and associated GHG estimated 8% 5% 5% 2% 6% 3% 6% 3% 6% 3% 5% 2% 14% 12% 13% 11%
Green-house gas emissions
GHG-Dir-Abs tonnes CO2e Direct Scope 1 2.290 2.434 2.290 2.434 N/A N/A N/A N./A
GHG-Indir-Abs Indirect Scope 22 132.326 136.431 45.000 45.010 78.125 81.873 9.201 9.548
Indirect Scope 33 59.111 63.210 24.101 25.284 35.010 37.926 N/A N/A
GHG-Int kg CO2 e / m2 / year
GHG emissions intensity
Scope 1 and 2 emissions 0,087 0,09 0,17 0,20 0,006 0,007 0,056 0,060
Impact area EPRA Sustainability Performance Measures (Social) Corporate performance Performance by asset type EPRA Code Units of measure Indicator EuroREIT plc Shopping Centres Offices Industrial
2015 2016 2015 2016 2015 2016 2015 2016
Health and safety
H&S-Emp Per 100,000 hours worked
Injury rate Direct employees 2,7 2,6
Per 100,000 hours worked
Lost day rate
Direct employees 0 0
Days per employee
Absentee rate
Direct employees 0,24 0,23
Total number Fatalities Direct employees 1 0
H&S-Asset4 % % of assets N/A N/A 100% 100% N/A N/A N/A N/A N/A N/A N/A
H&S-Comp Total number Number of incidents
N/A N/A 4 5 N/A N/A N/A N/A N/A N/A N/A
Data Qualifying NoteIn this disclosure, estimation refers to filling invoice gaps, not to whether invoices are based on “estimated” or “actual” readings.1: Total Portfolio covers managed assets only. Corporate office impacts are reported separately.2: GHG Scope 2 emissions are calculated according location based approach and the grid emission factor used is 356 gCO2/kWh according to latest IEA Highlights report. 3: Scope 3 includes landlord-obtained consumption (only if sub-metered to tenants) and all transmission & distribution losses.4: All Shopping centres assets undergo a voluntary assessment annually in line with our health and safety management system. Assessment of landlord-controlled areas in our office and industrial assets are not required on an annual basis. No mandatory assessments we conducted in 2016.
Impact area
EPRA Sustainability Performance Measures (Environment) Headquarter(s)EPRA Code Units of measure Indicator Absolute performance (Abs)
2015 2016
Elec-Abs, Elec-LfL
MWh Electricity Total consumed electricity 900 932
Proportion of electricity from renewable sources 0% 0%
DH&C-Abs, DH&C-LfL
District heating and
cooling
Total consumed district heating and cooling N/A N/A
Proportion of landlord obtained district heating and cooling from renewable sources
N/A N/A
Fuels-Abs, Fuels-LfL
Fuels Total consumed fuels N/A N/A
Proportion of landlord-obtained fuels from renew-able sources
N/A N/A
Energy-Int kWh / m2 / year
Energy intensity
22 23
№ of applicable properties Energy and associated GHG disclosure coverage 1 of 1
% Proportion of energy and associated GHG estimated 0% 0%
Greenhouse gas emis-sions
GHG-Dir-Abs tonnes CO2e Direct Scope 1 N/A N/A
GHG-Indir-Abs Indirect Scope 22 610 612
Indirect Scope 33 N/A N/A
GHG-Int kg CO2 e / m2 / year
GHG emis-sions inten-
sity
Scope 1 and 2 emissions 15 15,3
Note: this example is limited to energy and ghg emissions, but companies are required to report against all the envirornmental indicators, when material.