Embed Size (px)
Citation preview
Quality Costing and Lessons Learned on Projects Port Elizabeth, South Africa
Hannelie Nel
5th International Conference on Engineering, Project and Production Management 27 November 2014
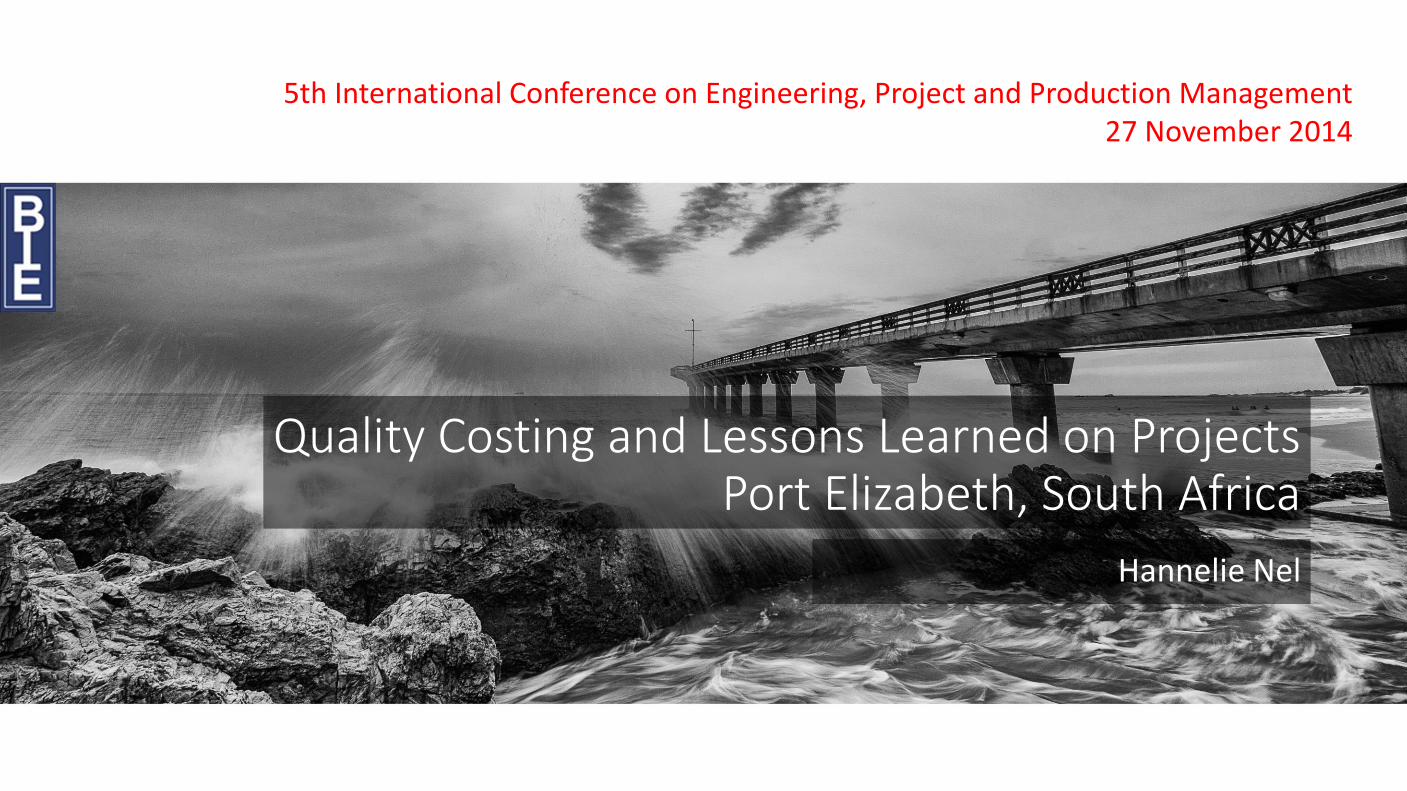
The BIE Group
BIE Became listed in 1994 on the
UNITED Nations Approvals Scheme
for the inspection of commodities
and materials deployed to sensitive
international regions of the world.
The BIE Value StatementBIE is the largest non-listed quality management company in the world. It’s an international and independent third-party company that has the capability and highly-skilled resources to provide Project Management and Quality Services from project design to commissioning. BIE also provides Quality Assurance on manufacturing and installation during project execution; and offers Quality Costing throughout the project lifecycle.
Quality Costing and Lessons Learned on Projects 2
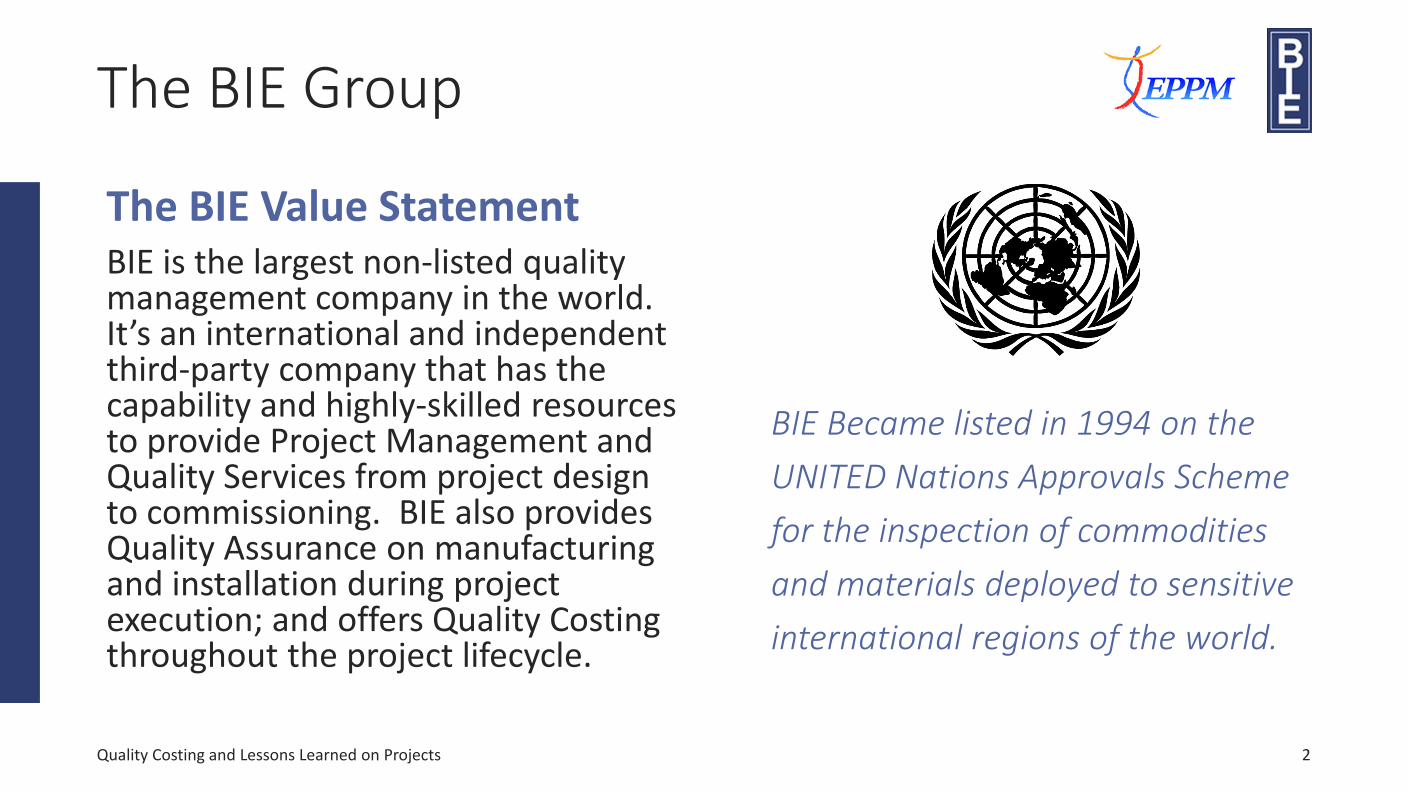
BIE Group Global Footprint
Quality Costing and Lessons Learned on Projects 3
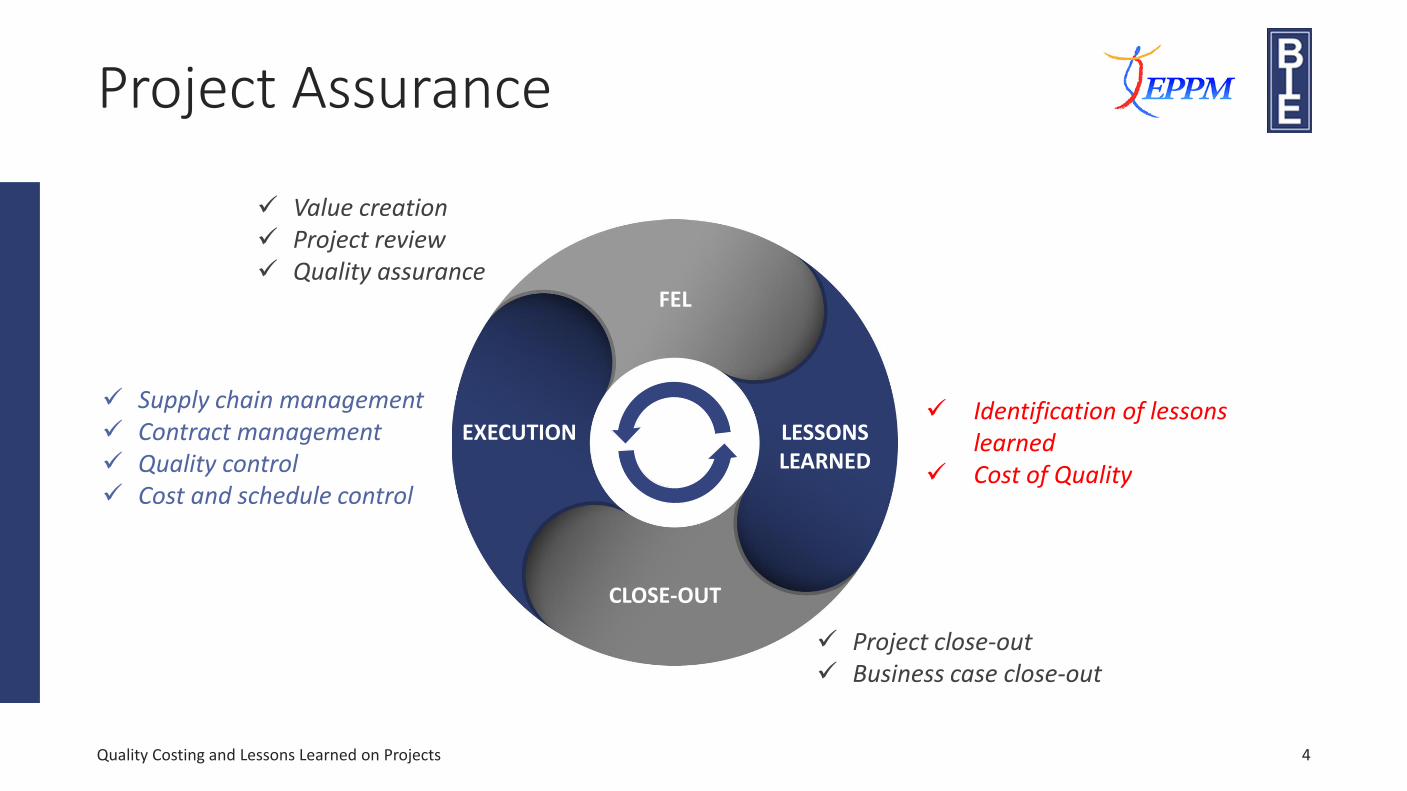
Project Assurance
Quality Costing and Lessons Learned on Projects
FEL
LESSONS LEARNED
CLOSE-OUT
EXECUTION Identification of lessons
learned Cost of Quality
Supply chain management Contract management Quality control Cost and schedule control
Project close-out Business case close-out
Value creation Project review Quality assurance
4
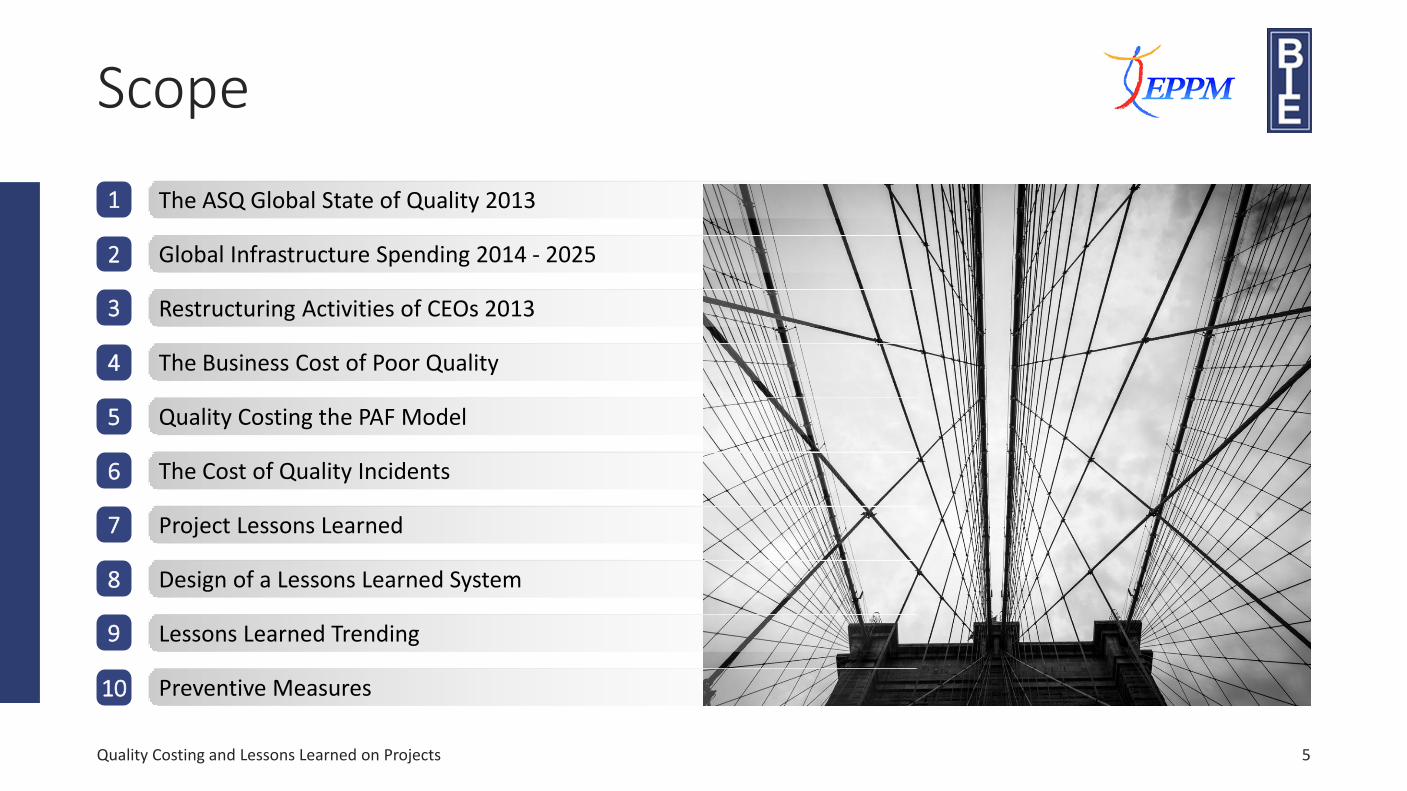
Scope
2
1
3
4
5
7
6
8
9
Global Infrastructure Spending 2014 - 2025
The ASQ Global State of Quality 2013
Restructuring Activities of CEOs 2013
The Business Cost of Poor Quality
Quality Costing the PAF Model
Project Lessons Learned
The Cost of Quality Incidents
Design of a Lessons Learned System
Lessons Learned Trending
Preventive Measures10
Quality Costing and Lessons Learned on Projects 5
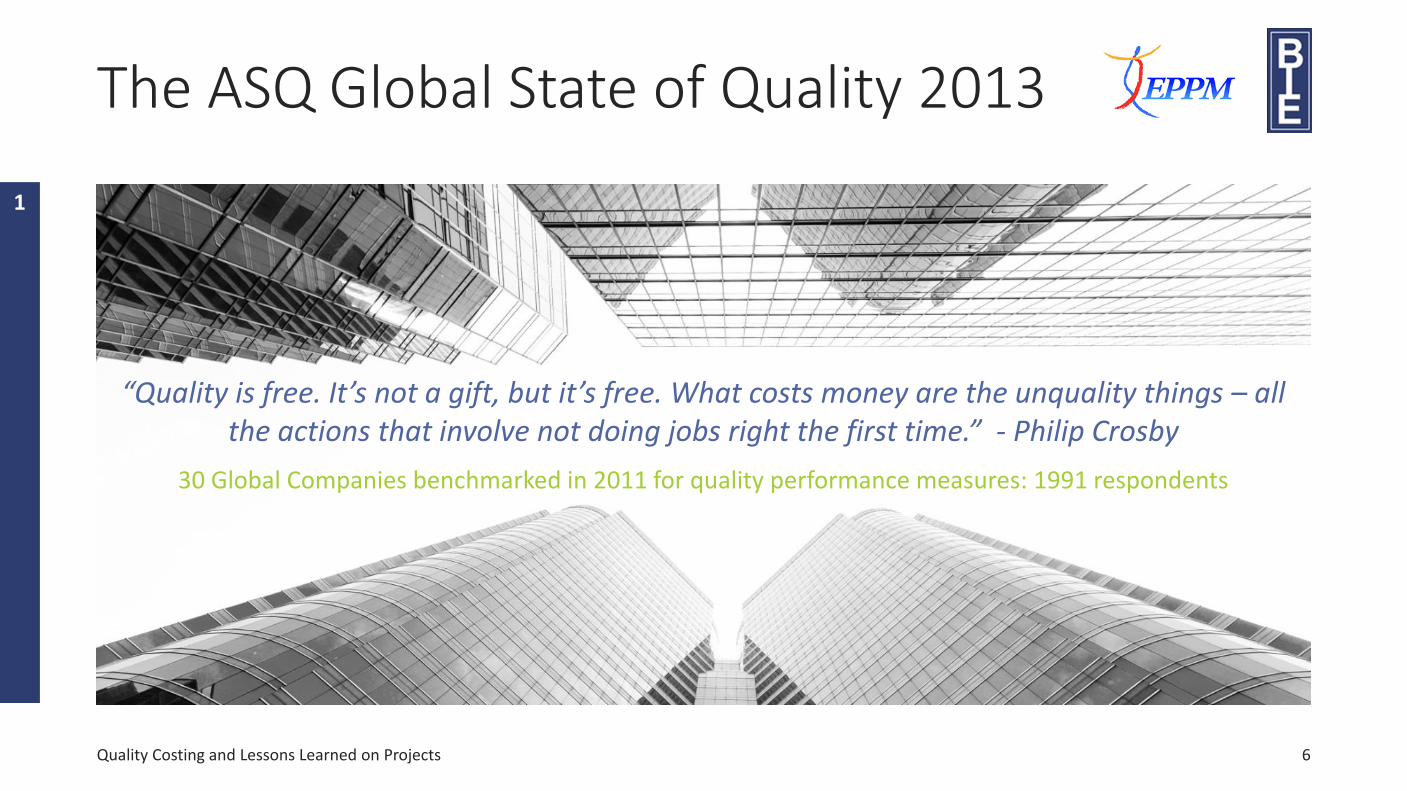
The ASQ Global State of Quality 2013
Quality Costing and Lessons Learned on Projects
“Quality is free. It’s not a gift, but it’s free. What costs money are the unquality things – all the actions that involve not doing jobs right the first time.” - Philip Crosby
30 Global Companies benchmarked in 2011 for quality performance measures: 1991 respondents
1
6
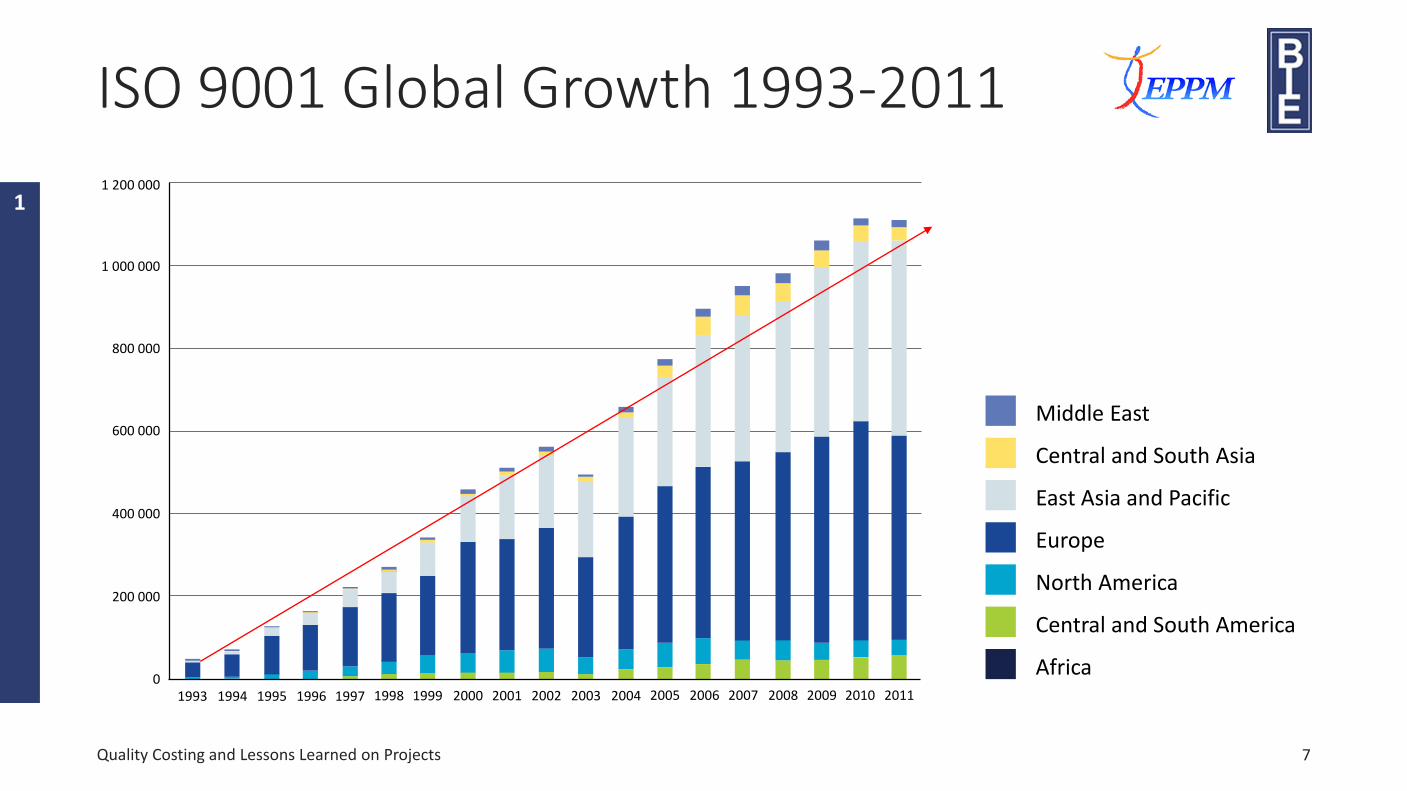
ISO 9001 Global Growth 1993-2011
Quality Costing and Lessons Learned on Projects
200 000
1994 1995 1996 1997 1998 1999 2000 2001 2002 2003 2004 2005 2006 2007 2008 201120102009
400 000
600 000
800 000
1 000 000
1 200 000
19930
Middle East
Central and South Asia
East Asia and Pacific
Europe
North America
Central and South America
Africa
7
1
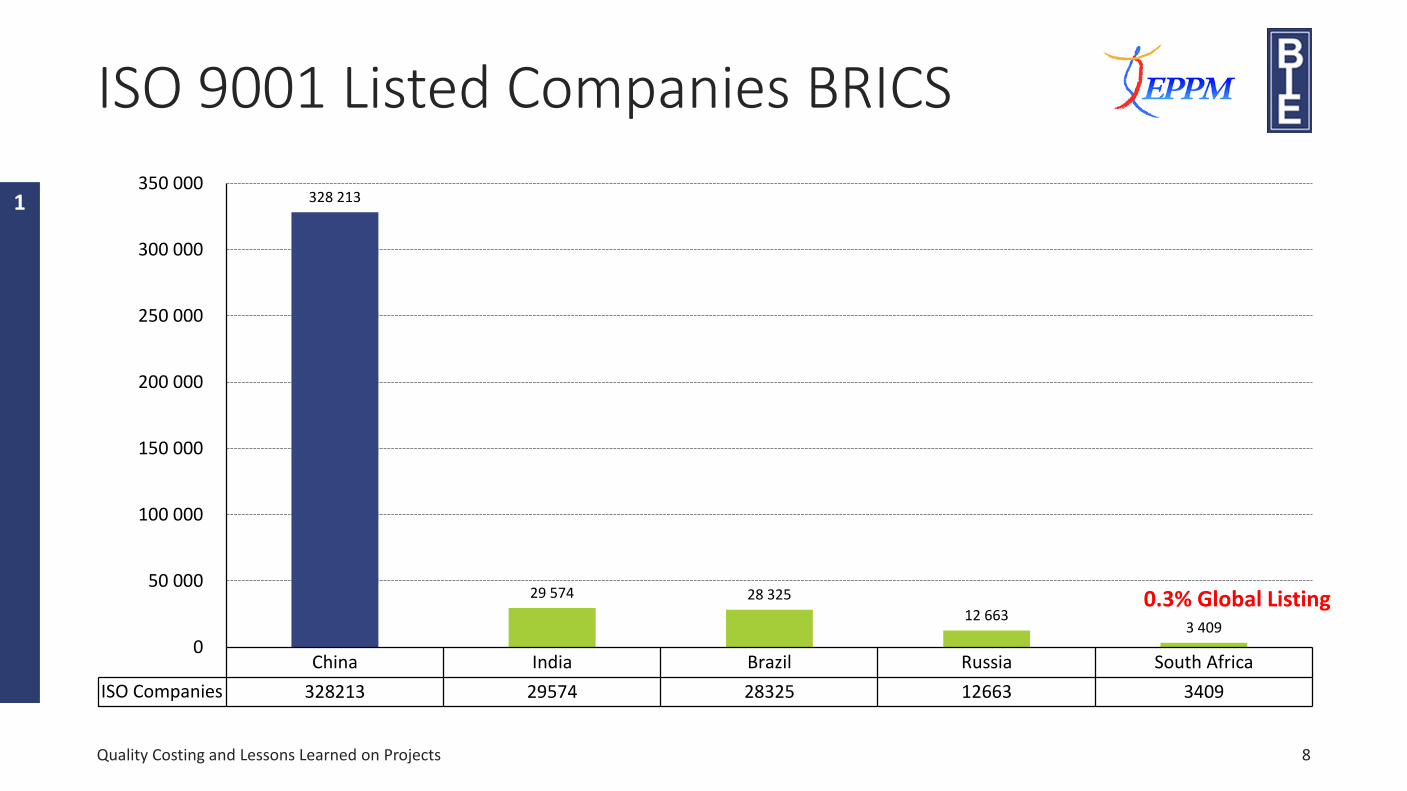
China India Brazil Russia South Africa
ISO Companies 328213 29574 28325 12663 3409
328 213
29 574 28 325
12 663 3 409
0
50 000
100 000
150 000
200 000
250 000
300 000
350 000
ISO 9001 Listed Companies BRICS
Quality Costing and Lessons Learned on Projects 8
1
0.3% Global Listing
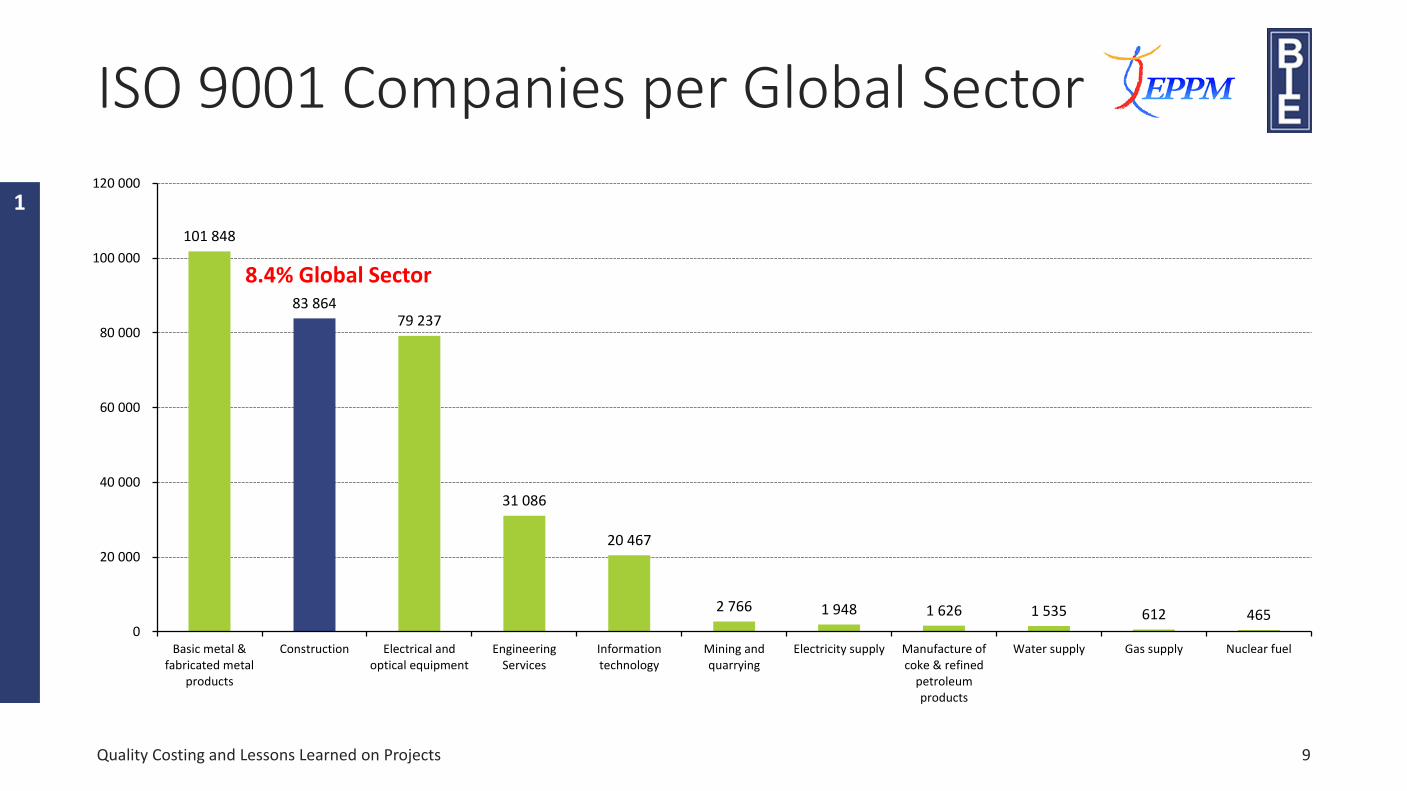
101 848
83 864 79 237
31 086
20 467
2 766 1 948 1 626 1 535 612 465 0
20 000
40 000
60 000
80 000
100 000
120 000
Basic metal &fabricated metal
products
Construction Electrical andoptical equipment
EngineeringServices
Informationtechnology
Mining andquarrying
Electricity supply Manufacture ofcoke & refined
petroleumproducts
Water supply Gas supply Nuclear fuel
ISO 9001 Companies per Global Sector
Quality Costing and Lessons Learned on Projects 9
1
8.4% Global Sector
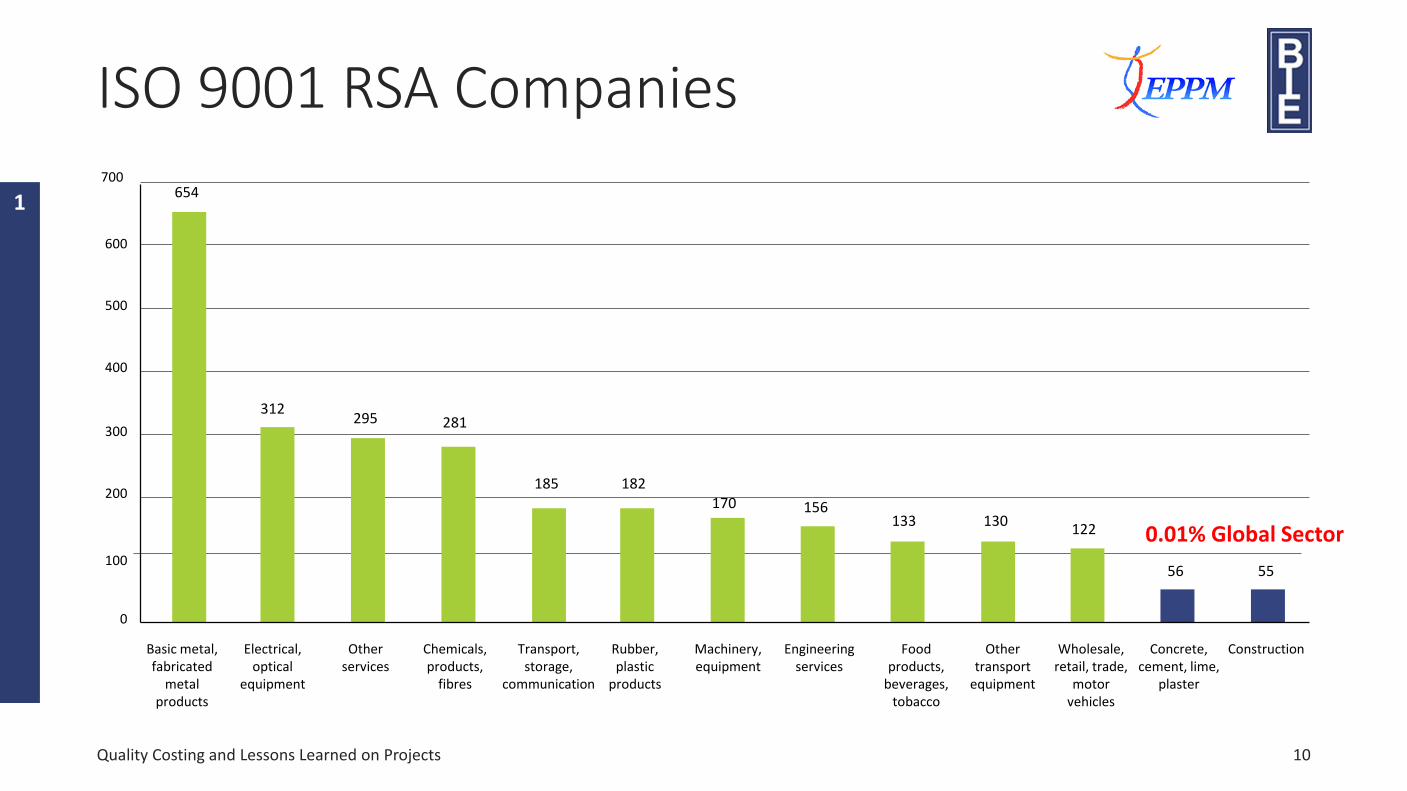
ISO 9001 RSA Companies
Quality Costing and Lessons Learned on Projects
Basic metal, fabricated
metal products
Electrical, optical
equipment
Other services
Chemicals, products,
fibres
Transport, storage,
communication
Rubber, plastic
products
Machinery, equipment
Engineering services
Food products,
beverages, tobacco
Other transport
equipment
Wholesale, retail, trade,
motor vehicles
Concrete, cement, lime,
plaster
Construction
654
312295 281
185 182170 156
133 130122
56 55
0
100
200
300
400
500
600
700
10
1
0.01% Global Sector
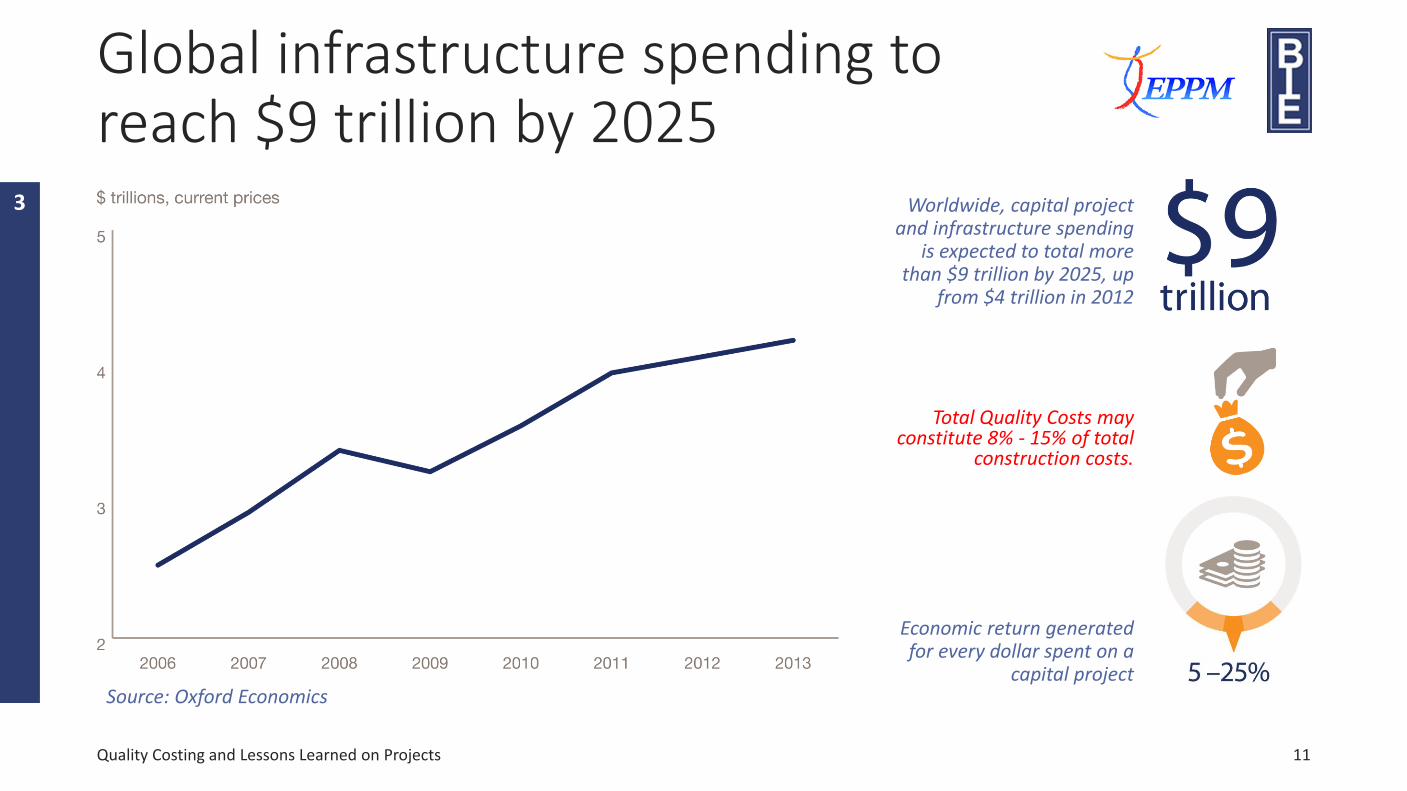
Global infrastructure spending to reach $9 trillion by 2025
Quality Costing and Lessons Learned on Projects
Source: Oxford Economics
Worldwide, capital project and infrastructure spending
is expected to total more than $9 trillion by 2025, up
from $4 trillion in 2012
Economic return generated for every dollar spent on a
capital project
11
Total Quality Costs may constitute 8% - 15% of total
construction costs.
3
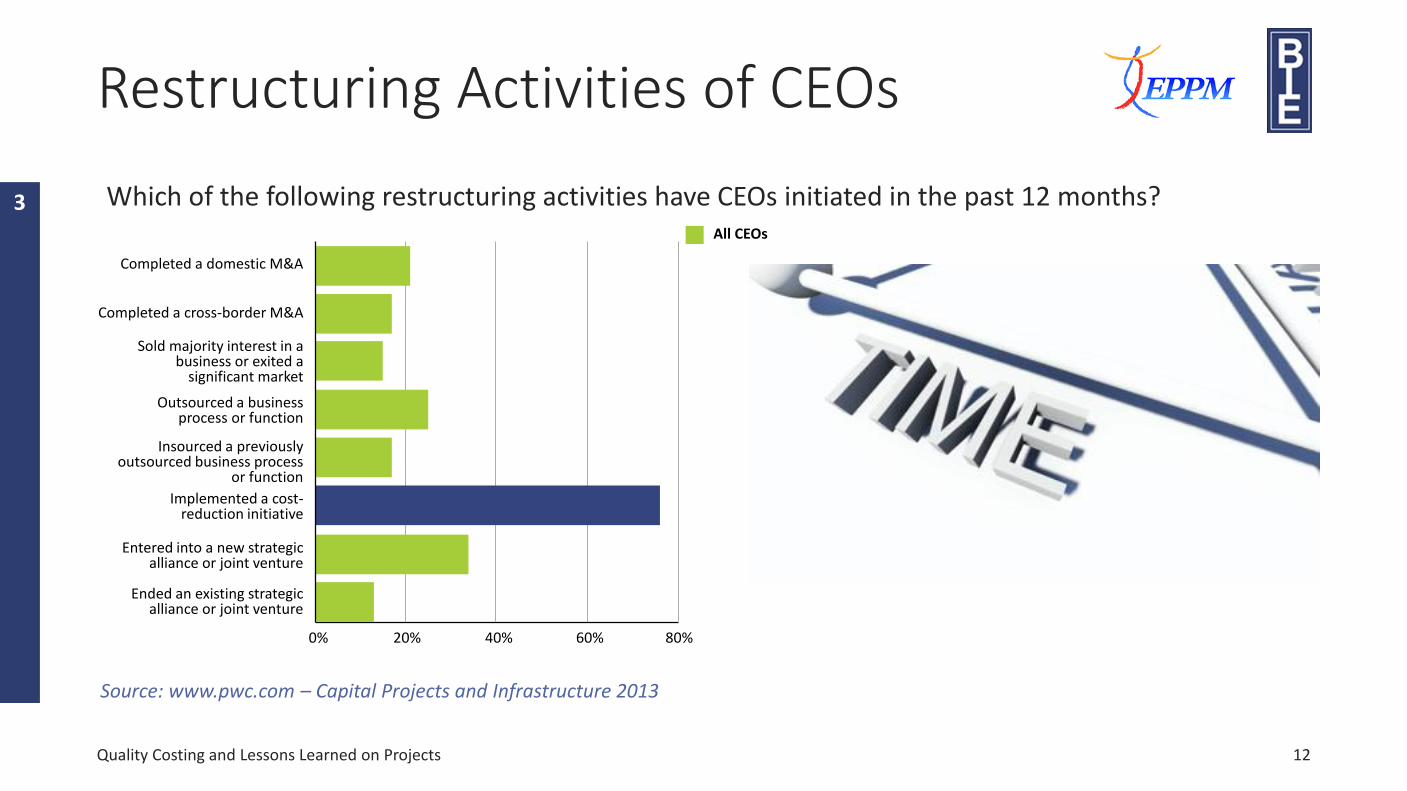
Restructuring Activities of CEOs
Which of the following restructuring activities have CEOs initiated in the past 12 months?
Quality Costing and Lessons Learned on Projects
Source: www.pwc.com – Capital Projects and Infrastructure 2013
12
Completed a domestic M&A
Completed a cross-border M&A
Sold majority interest in a business or exited a
significant market
Outsourced a business process or function
Insourced a previously outsourced business process
or function
Implemented a cost-reduction initiative
Entered into a new strategic alliance or joint venture
Ended an existing strategic alliance or joint venture
0% 20% 40% 60% 80%
All CEOs
3
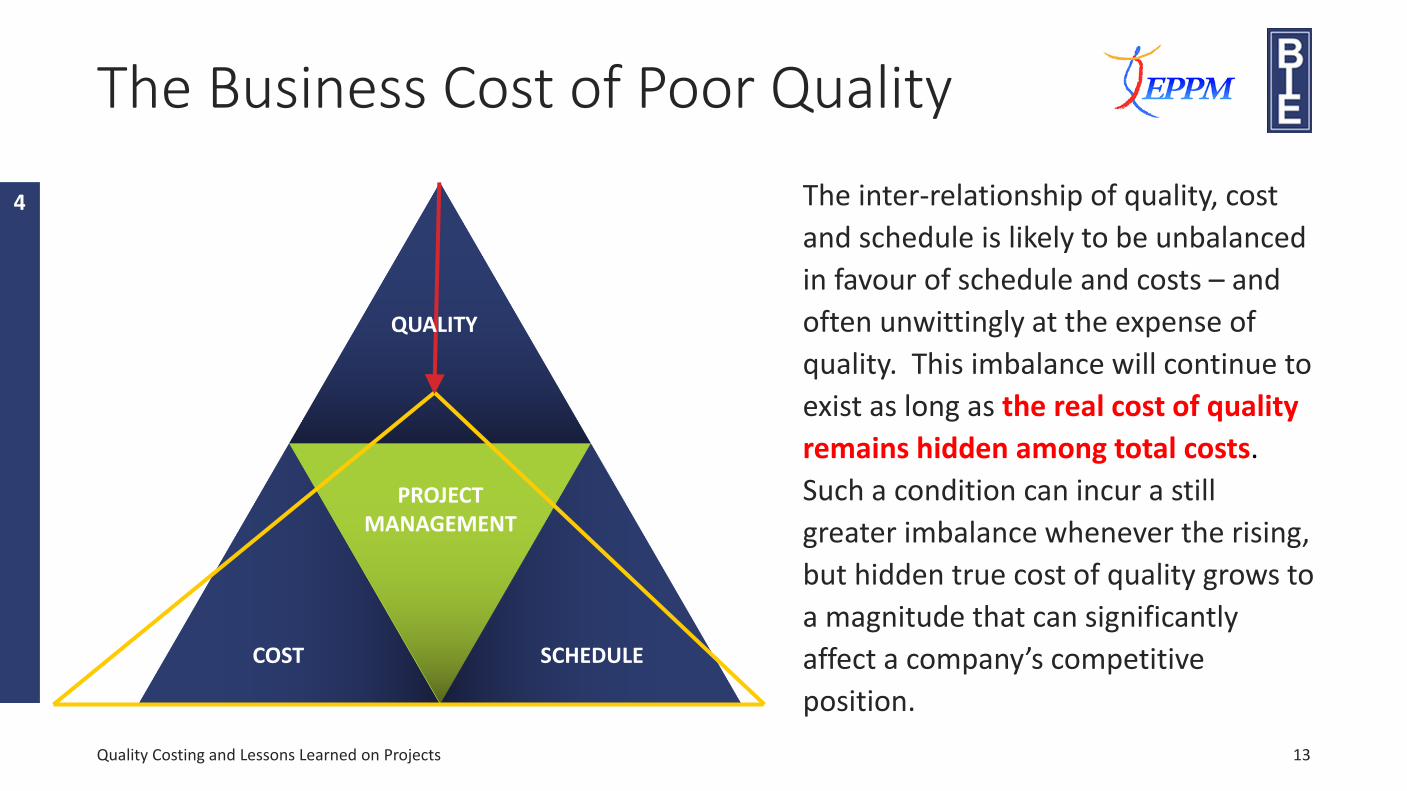
The Business Cost of Poor Quality
Quality Costing and Lessons Learned on Projects
COST SCHEDULE
PROJECTMANAGEMENT
QUALITY
13
4 The inter-relationship of quality, cost
and schedule is likely to be unbalanced
in favour of schedule and costs – and
often unwittingly at the expense of
quality. This imbalance will continue to
exist as long as the real cost of quality
remains hidden among total costs.
Such a condition can incur a still
greater imbalance whenever the rising,
but hidden true cost of quality grows to
a magnitude that can significantly
affect a company’s competitive
position.
The Business Cost of Poor QualityThe Business Cost of Poor Quality
• Safety and environmental implications due to non-compliance with statutory quality requirements.
• Non-conformance of products.
• Replacement and rework cost.
• Project delays due to non-compliance with regulations and resultant rework.
• Lack of quality management (QA & QC) on a project/service/ product.
• Lack of quality requirements in Client enquiries or final contracts with Suppliers.
• Incompetent suppliers leading to delivery of substandard products/services.
• Project delays due to replacement of suppliers.
• Additional cost and compensation claims from suppliers.
• Reduced plant availability, reliability and life.
The Cost of Quality
Quality Costing and Lessons Learned on Projects 14
4
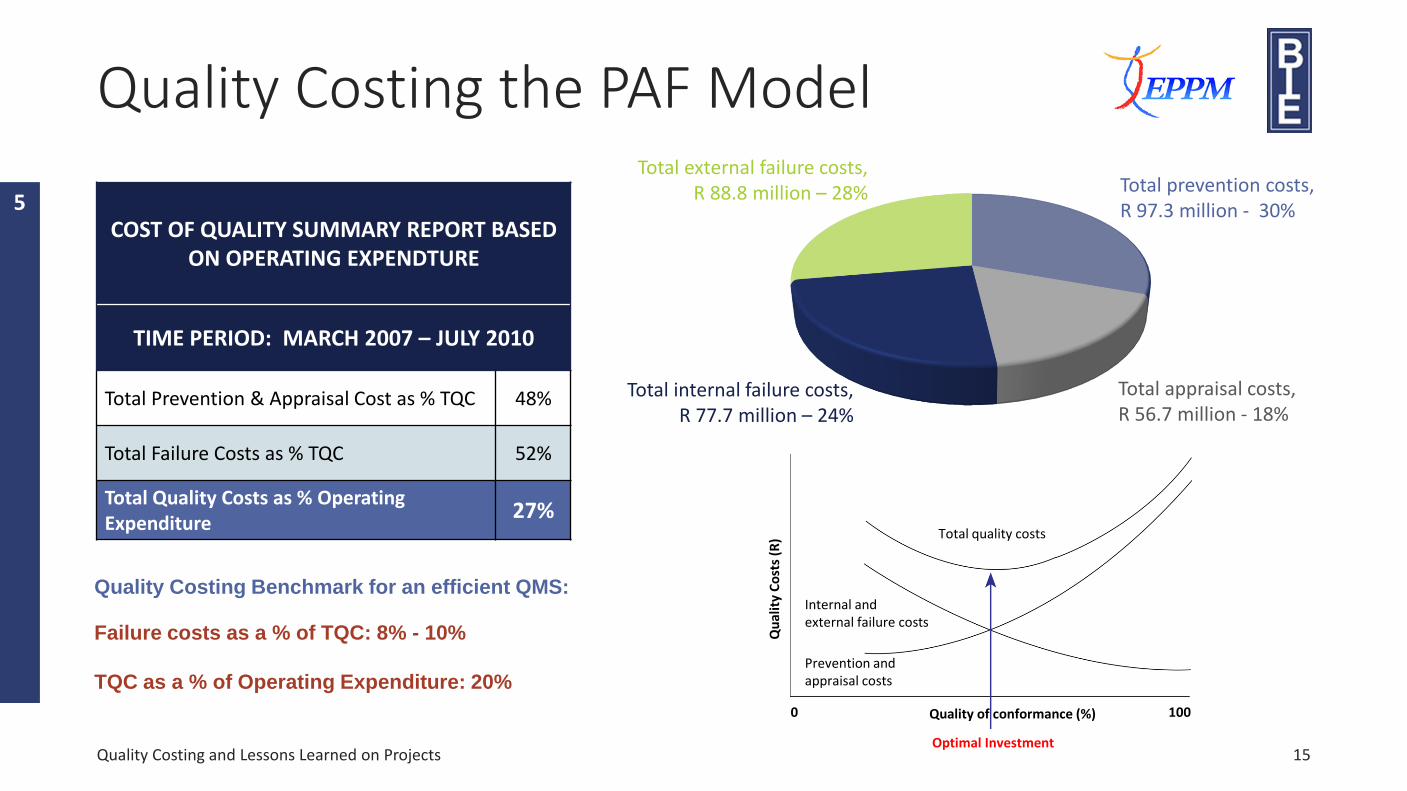
Quality Costing the PAF Model
COST OF QUALITY SUMMARY REPORT BASED ON OPERATING EXPENDTURE
TIME PERIOD: MARCH 2007 – JULY 2010
Total Prevention & Appraisal Cost as % TQC 48%
Total Failure Costs as % TQC 52%
Total Quality Costs as % Operating Expenditure
27%
Quality Costing Benchmark for an efficient QMS:
Failure costs as a % of TQC: 8% - 10%
TQC as a % of Operating Expenditure: 20%
Quality Costing and Lessons Learned on Projects 15
Total prevention costs, R 97.3 million - 30%
Total appraisal costs, R 56.7 million - 18%
Total internal failure costs, R 77.7 million – 24%
Total external failure costs, R 88.8 million – 28%
Qu
alit
y C
ost
s (R
)
Internal and external failure costs
Prevention and appraisal costs
Total quality costs
0 100Quality of conformance (%)
Optimal Investment
5
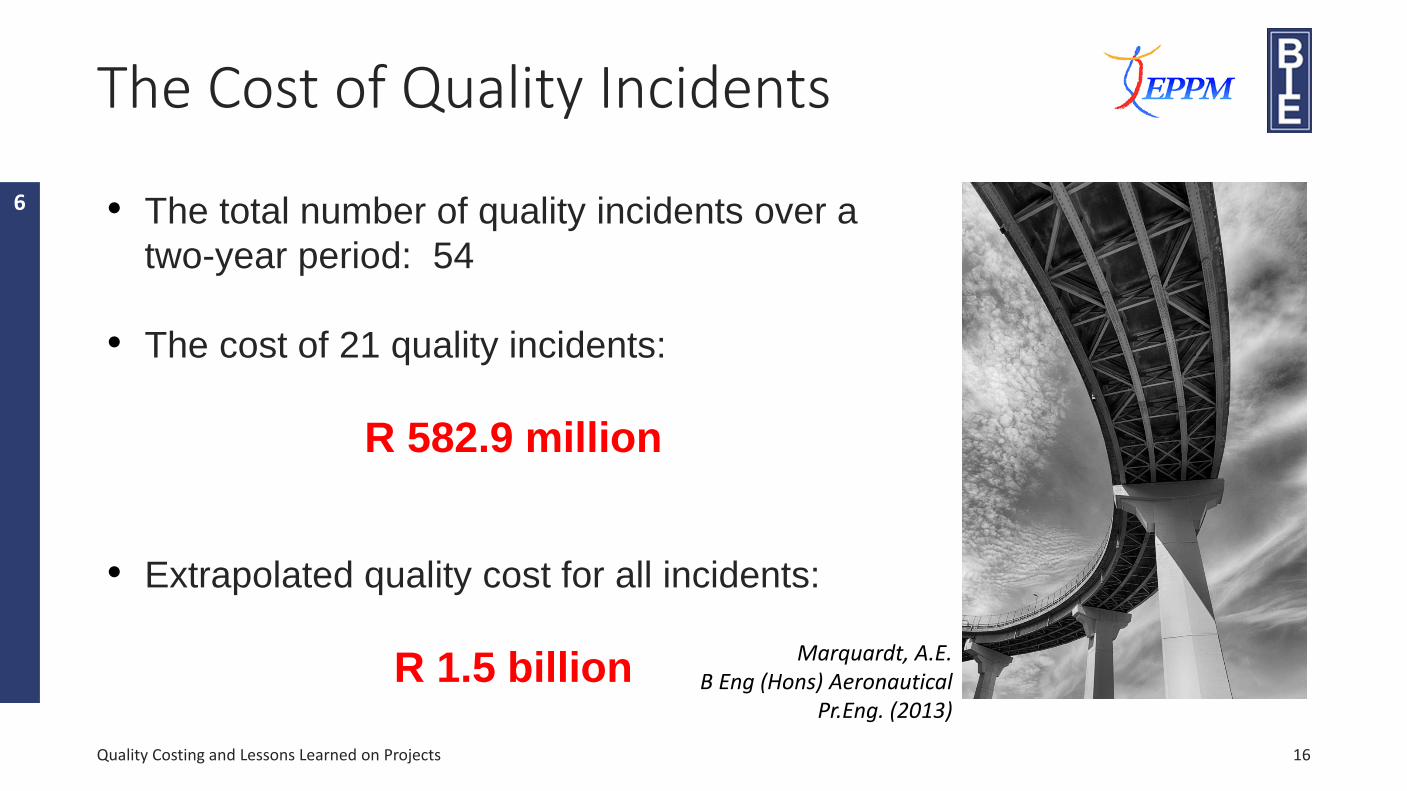
Quality CostingThe Cost of Quality Incidents
• The total number of quality incidents over a
two-year period: 54
• The cost of 21 quality incidents:
R 582.9 million
• Extrapolated quality cost for all incidents:
R 1.5 billion
Quality Costing and Lessons Learned on Projects 16
Marquardt, A.E. B Eng (Hons) Aeronautical
Pr.Eng. (2013)
6
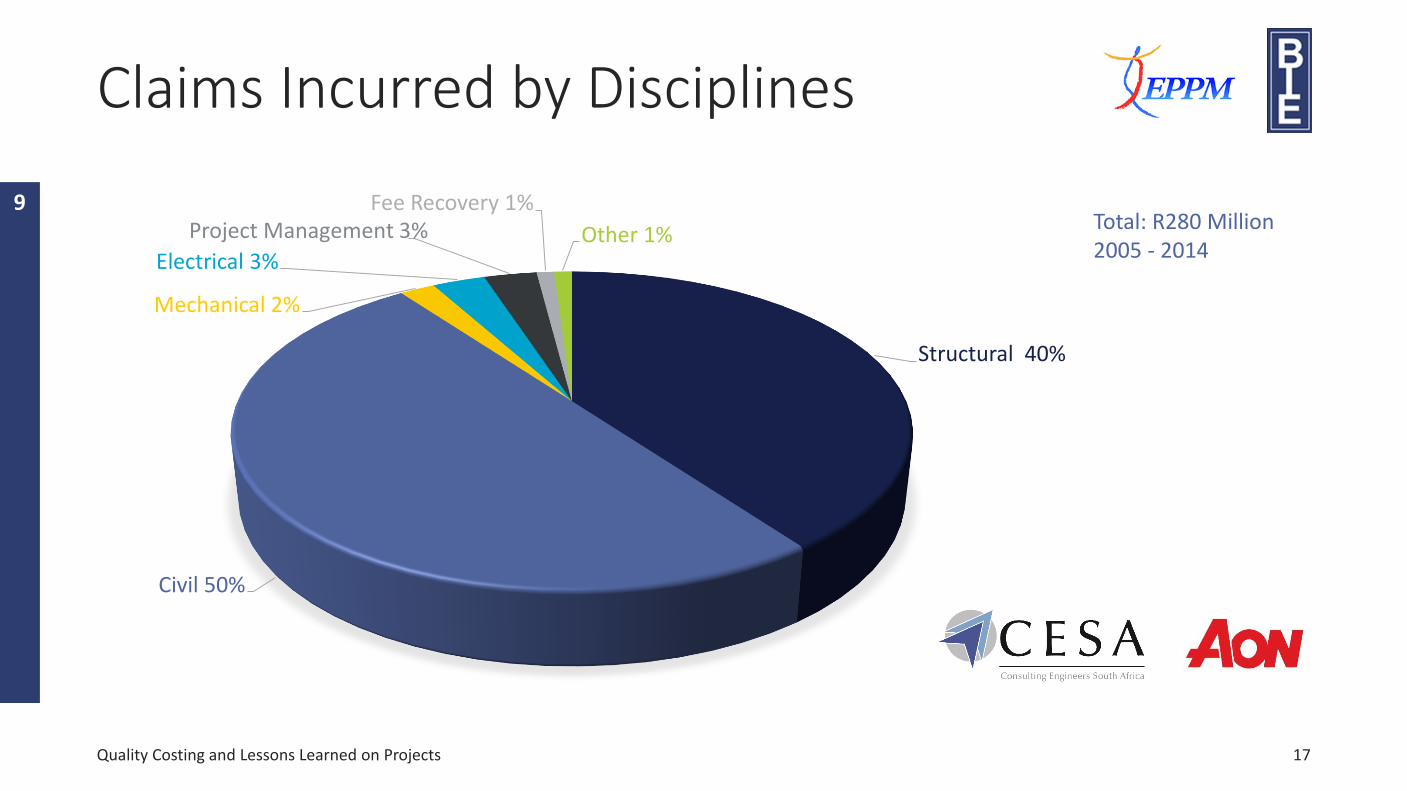
Claims Incurred by Disciplines
Structural 40%
Civil 50%
Mechanical 2%
Electrical 3%
Project Management 3%Fee Recovery 1%
Other 1%
Quality Costing and Lessons Learned on Projects 17
9Total: R280 Million2005 - 2014
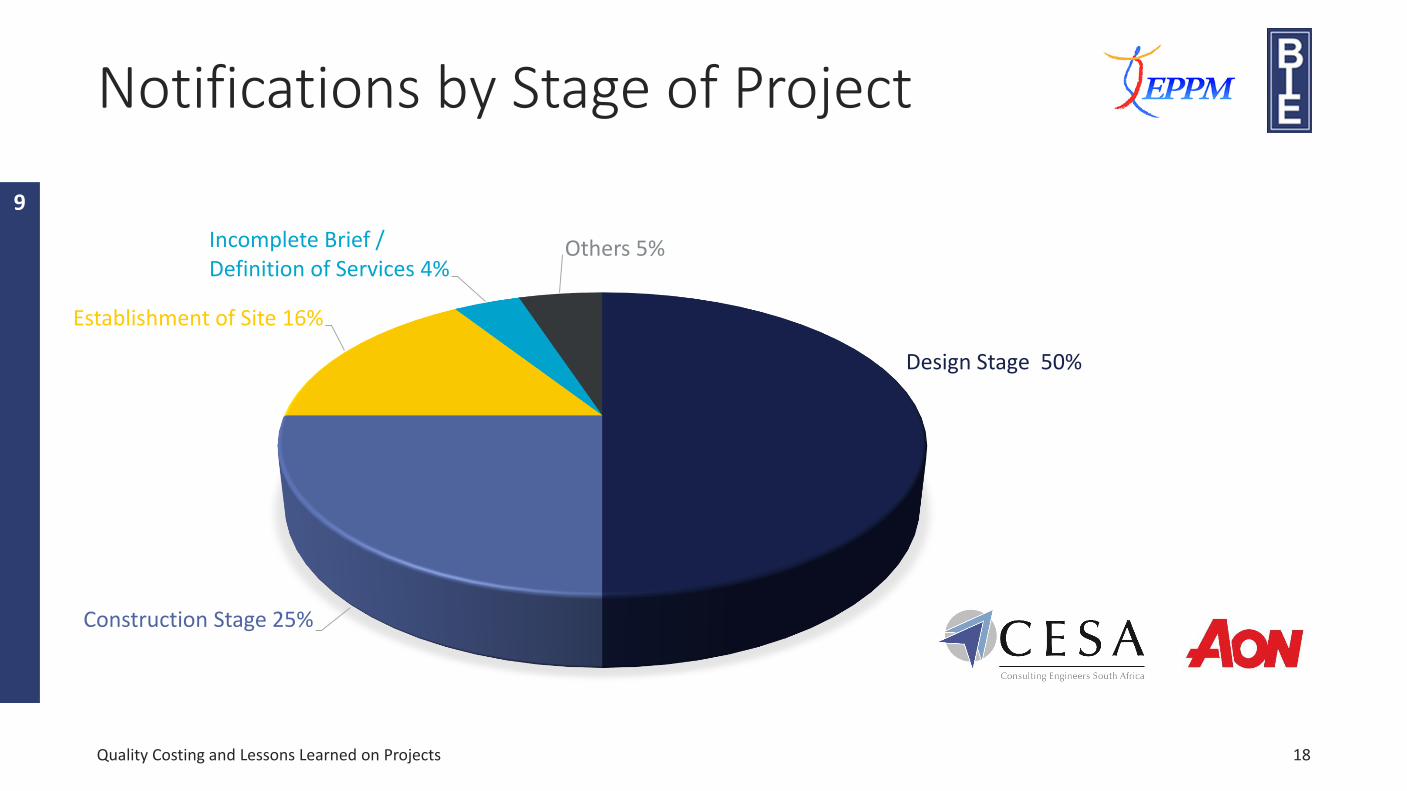
Notifications by Stage of Project
Design Stage 50%
Construction Stage 25%
Establishment of Site 16%
Incomplete Brief / Definition of Services 4%
Others 5%
Quality Costing and Lessons Learned on Projects 18
9
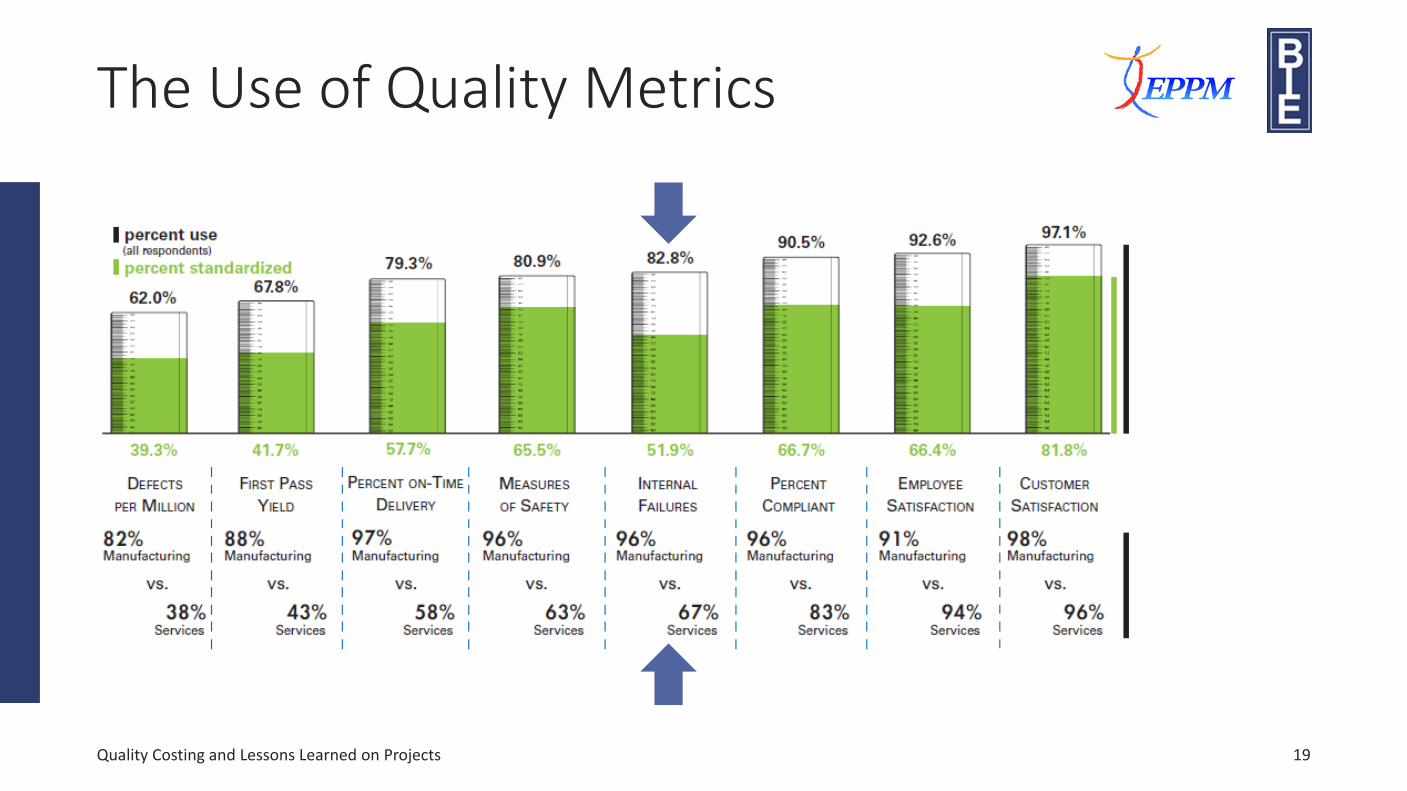
The Use of Quality Metrics
Quality Costing and Lessons Learned on Projects 19
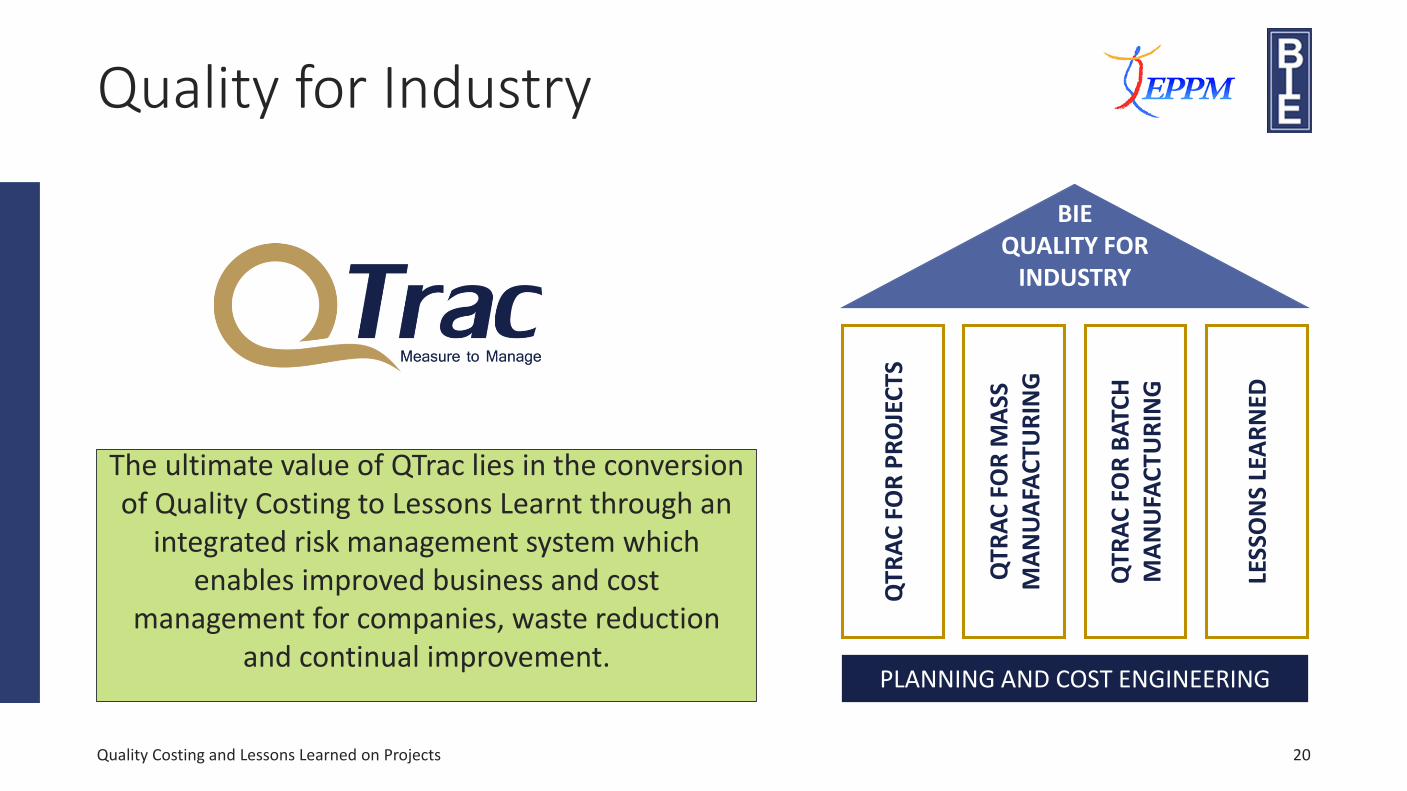
Quality for Industry
The ultimate value of QTrac lies in the conversion of Quality Costing to Lessons Learnt through an
integrated risk management system which enables improved business and cost
management for companies, waste reduction and continual improvement.
Quality Costing and Lessons Learned on Projects
QTR
AC
FO
R P
RO
JEC
TS
QTR
AC
FO
R M
ASS
M
AN
UA
FAC
TUR
ING
QTR
AC
FO
R B
ATC
H
MA
NU
FAC
TUR
ING
LESS
ON
S LE
AR
NED
BIEQUALITY FOR
INDUSTRY
PLANNING AND COST ENGINEERING
20
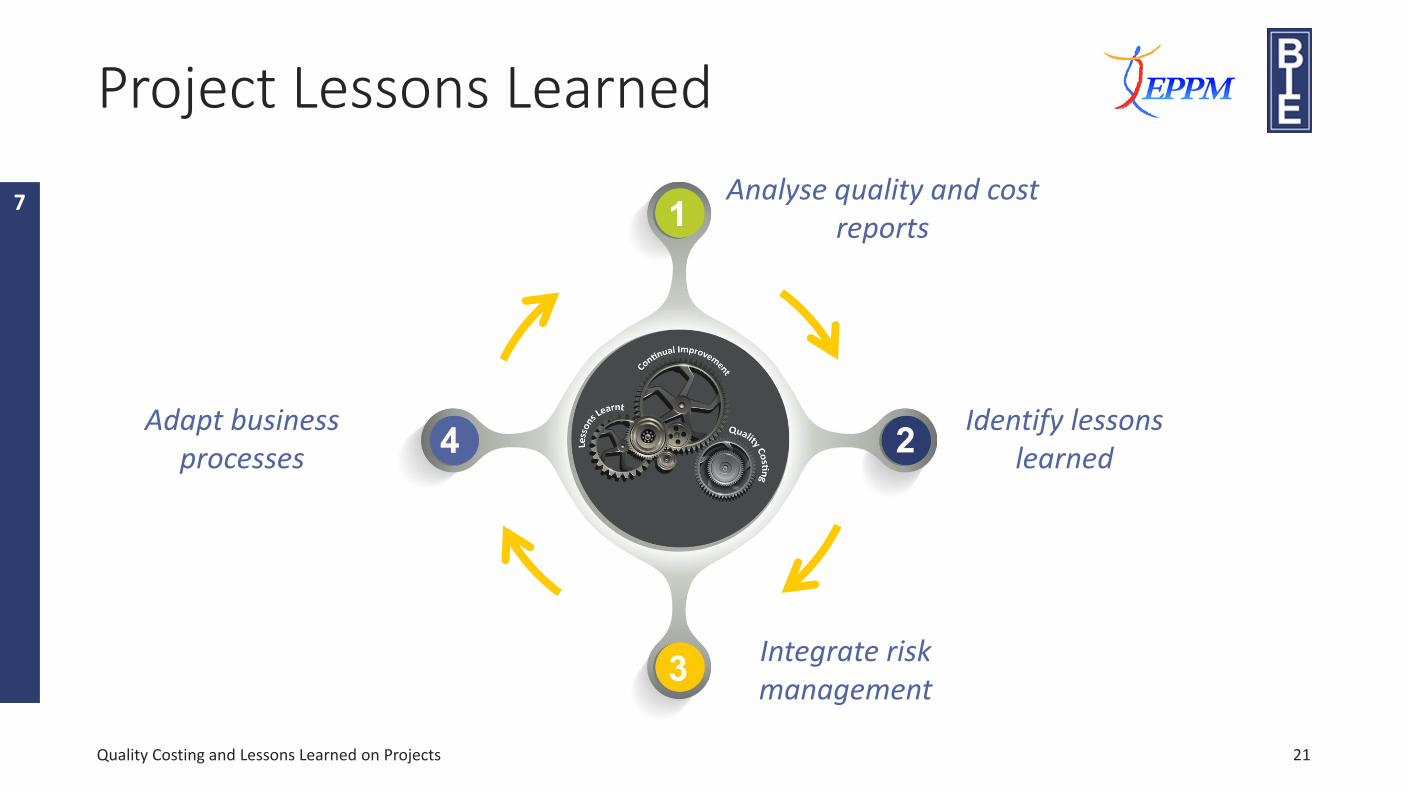
Project Lessons Learned
Quality Costing and Lessons Learned on Projects
Analyse quality and cost reports
Identify lessons learned
Integrate risk management
Adapt business processes
7
21
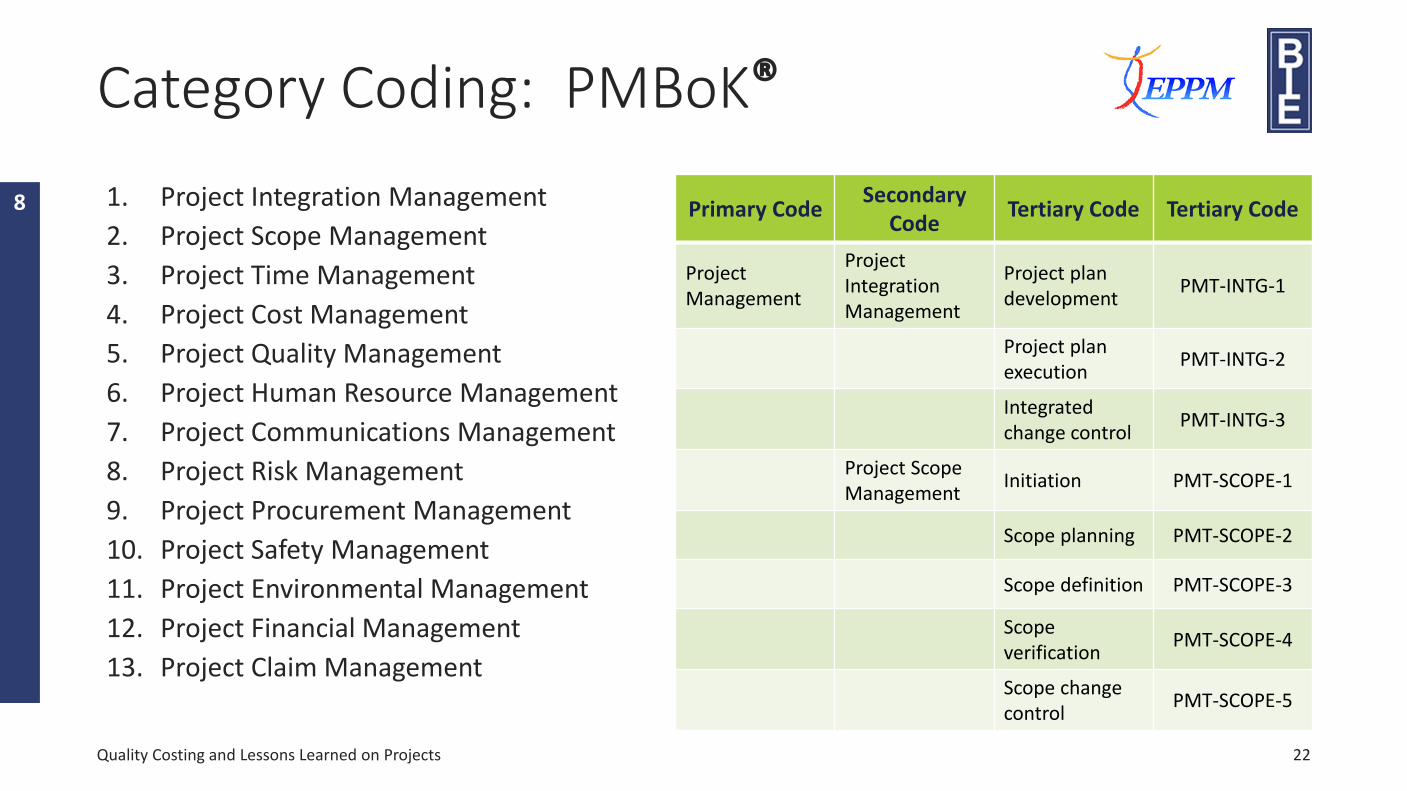
Category Coding: PMBoK®
1. Project Integration Management
2. Project Scope Management
3. Project Time Management
4. Project Cost Management
5. Project Quality Management
6. Project Human Resource Management
7. Project Communications Management
8. Project Risk Management
9. Project Procurement Management
10. Project Safety Management
11. Project Environmental Management
12. Project Financial Management
13. Project Claim Management
Primary CodeSecondary
CodeTertiary Code Tertiary Code
Project Management
Project Integration Management
Project plan development
PMT-INTG-1
Project plan execution
PMT-INTG-2
Integrated change control
PMT-INTG-3
Project Scope Management
Initiation PMT-SCOPE-1
Scope planning PMT-SCOPE-2
Scope definition PMT-SCOPE-3
Scope verification
PMT-SCOPE-4
Scope changecontrol
PMT-SCOPE-5
Quality Costing and Lessons Learned on Projects 22
8
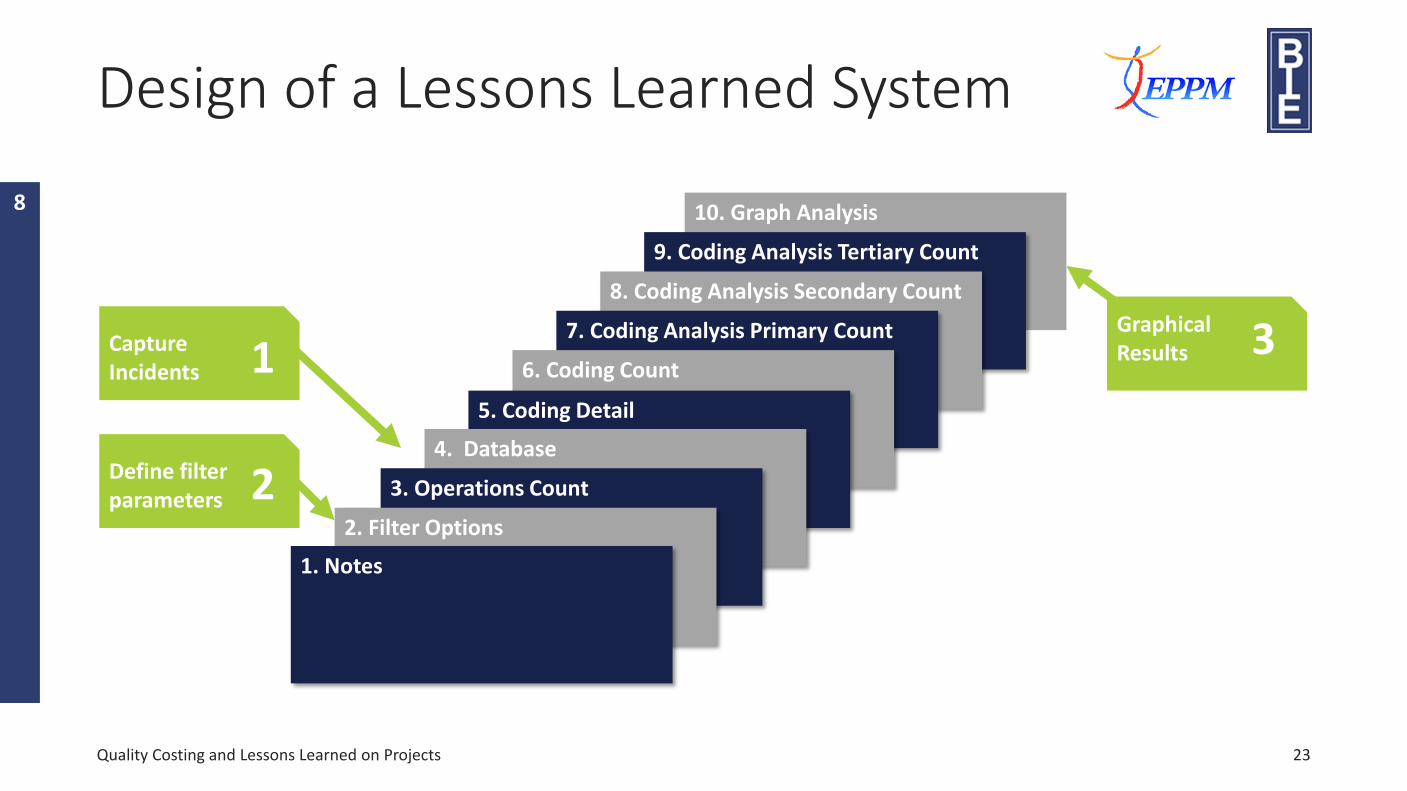
Lessons Learned and Best Practices System Design
Design of a Lessons Learned System
10. Graph Analysis
9. Coding Analysis Tertiary Count
8. Coding Analysis Secondary Count
7. Coding Analysis Primary Count
6. Coding Count
5. Coding Detail
4. Database
3. Operations Count
2. Filter Options
1. Notes
Define filter parameters 2
Capture Incidents 1
GraphicalResults 3
Quality Costing and Lessons Learned on Projects 23
8
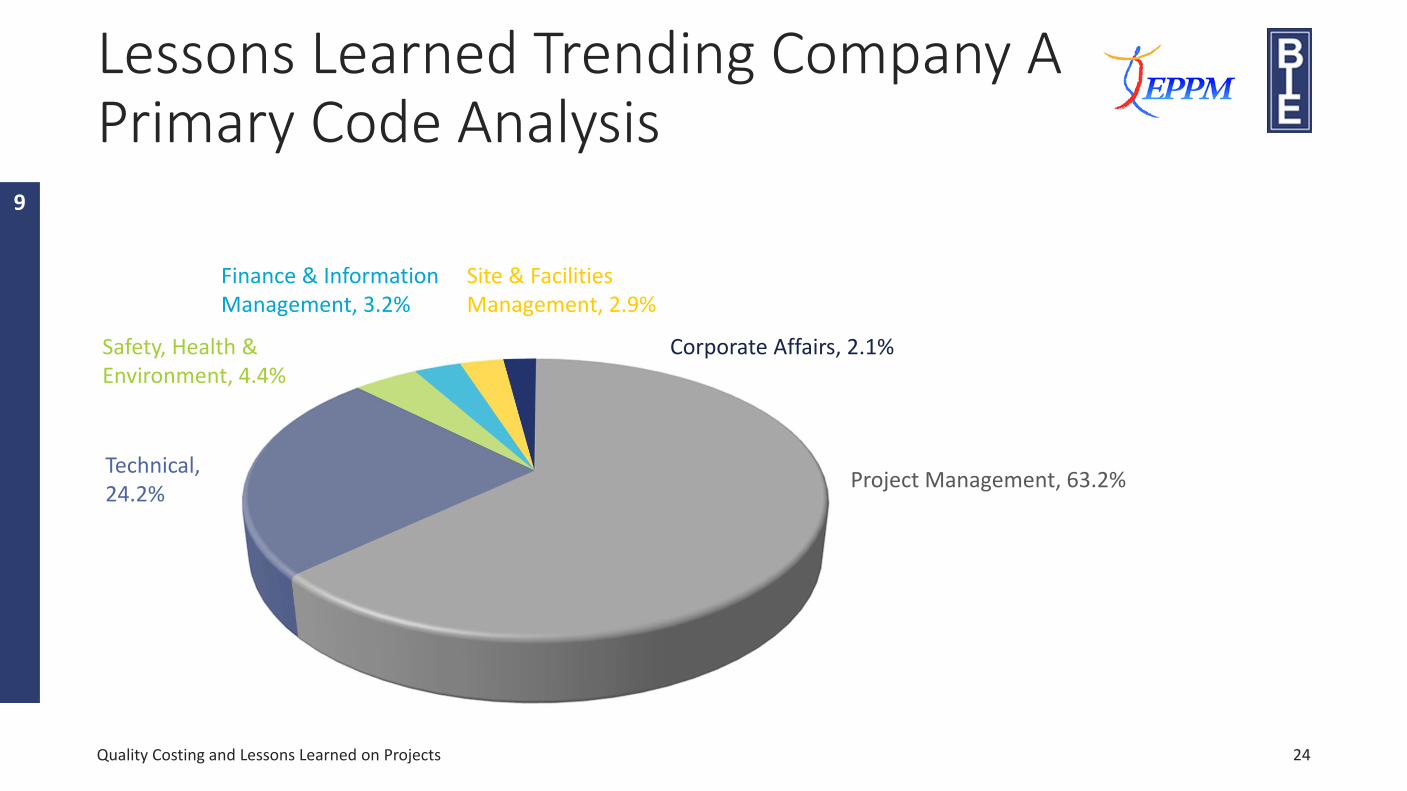
Lessons Learned Trending Company APrimary Code Analysis
Quality Costing and Lessons Learned on Projects
Technical, 24.2%
Safety, Health & Environment, 4.4%
Finance & Information Management, 3.2%
Site & Facilities Management, 2.9%
Corporate Affairs, 2.1%
Project Management, 63.2%
24
9
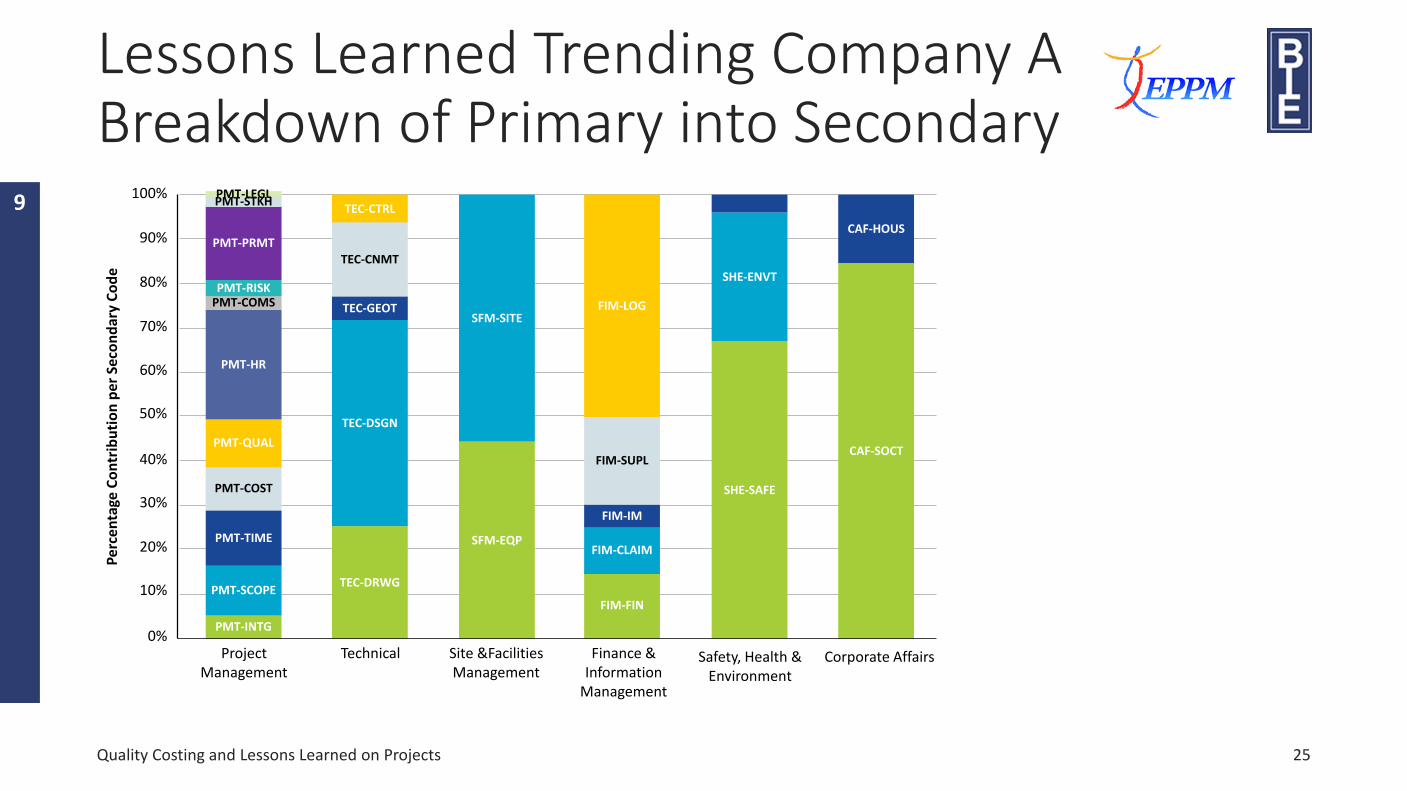
Lessons Learned Trending Company ABreakdown of Primary into Secondary
Quality Costing and Lessons Learned on Projects
CAF-SOCT
SHE-SAFE
FIM-FIN
SFM-EQP
TEC-DRWG
PMT-INTG
PMT-SCOPE
TEC-DSGN
SFM-SITE
FIM-CLAIM
SHE-ENVT
PMT-TIME
TEC-GEOT
FIM-IM
CAF-HOUS
PMT-COST
FIM-SUPL
PMT-QUAL
TEC-CTRL
TEC-CNMT
FIM-LOG
PMT-HR
PMT-COMSPMT-RISK
PMT-PRMT
PMT-STKHPMT-LEGL
Project Management
Technical Site &Facilities Management
Finance & Information
Management
Safety, Health & Environment
Corporate Affairs
0%
10%
20%
30%
40%
50%
60%
70%
80%
90%
100%
Per
cen
tage
Co
ntr
ibu
tio
n p
er S
eco
nd
ary
Co
de
25
9
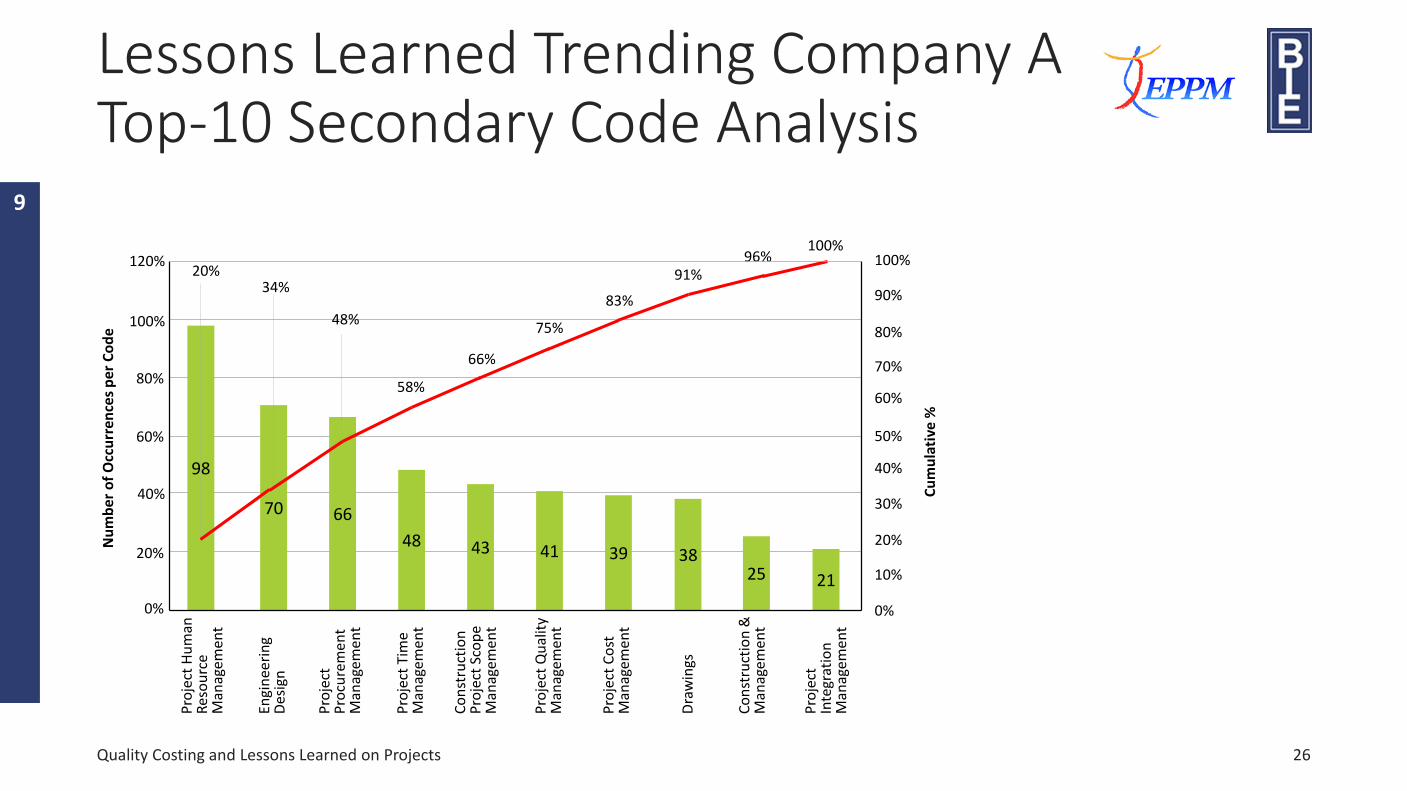
Lessons Learned Trending Company ATop-10 Secondary Code Analysis
Quality Costing and Lessons Learned on Projects
98
70 66
48 43 41 39 3825 21
0%
10%
20%
30%
40%
50%
60%
70%
80%
90%
100%
0%
20%
40%
60%
80%
100%
120%20%
34%
48%
58%
66%
83%
75%
91%96%
100%
Pro
ject
Hu
man
R
eso
urc
e M
anag
eme
nt
Engi
nee
rin
g D
esig
n
Pro
ject
P
rocu
rem
en
t M
anag
eme
nt
Pro
ject
Tim
e M
anag
eme
nt
Co
nst
ruct
ion
P
roje
ct S
cop
e M
anag
eme
nt
Pro
ject
Qu
alit
y M
anag
eme
nt
Pro
ject
Co
st
Man
agem
en
t
Dra
win
gs
Co
nst
ruct
ion
&
Man
agem
en
t
Pro
ject
In
tegr
atio
n
Man
agem
en
t
Cu
mu
lati
ve %
Nu
mb
er o
f O
ccu
rren
ces
per
Co
de
26
9
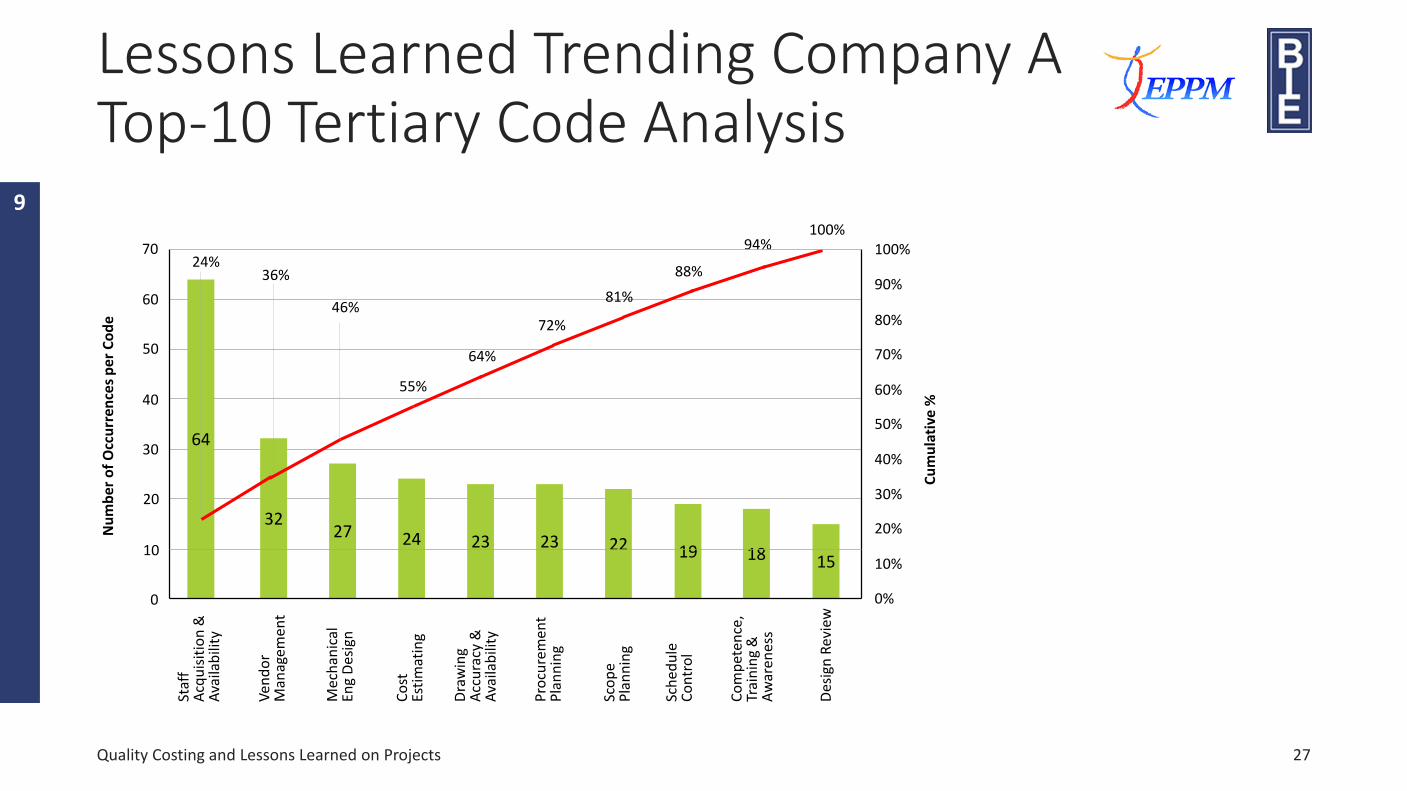
Lessons Learned Trending Company ATop-10 Tertiary Code Analysis
Quality Costing and Lessons Learned on Projects
64
3227 24 23 23 22 19 18 15
0%
10%
20%
30%
40%
50%
60%
70%
80%
90%
100%
0
10
20
30
40
50
7024%
36%
46%
55%
64%
81%
72%
88%
94%100%
60
Staf
f A
cqu
isit
ion
&
Ava
ilab
ility
Ven
do
r M
anag
eme
nt
Mec
han
ical
En
gD
esig
n
Co
st
Esti
mat
ing
Dra
win
g A
ccu
racy
&
Ava
ilab
ility
Pro
cure
me
nt
Pla
nn
ing
Sco
pe
Pla
nn
ing
Sch
edu
le
Co
ntr
ol
Co
mp
eten
ce,
Trai
nin
g &
A
war
enes
s
Des
ign
Rev
iew
Cu
mu
lati
ve %
Nu
mb
er o
f O
ccu
rren
ces
per
Co
de
27
9
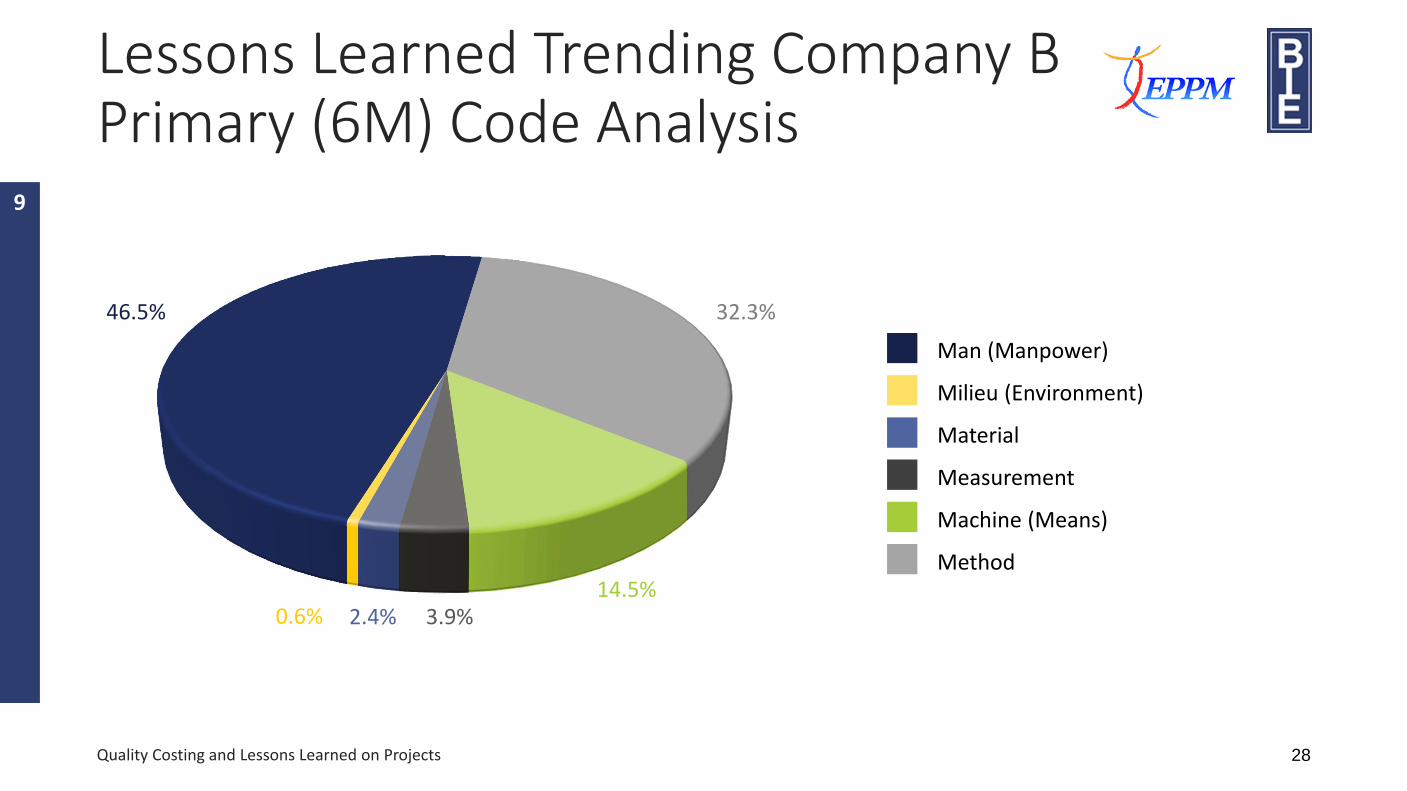
Lessons Learned Trending Company B Primary (6M) Code Analysis
28Quality Costing and Lessons Learned on Projects
2.4%14.5%
0.6%
46.5% 32.3%
3.9%
Man (Manpower)
Milieu (Environment)
Material
Measurement
Machine (Means)
Method
9
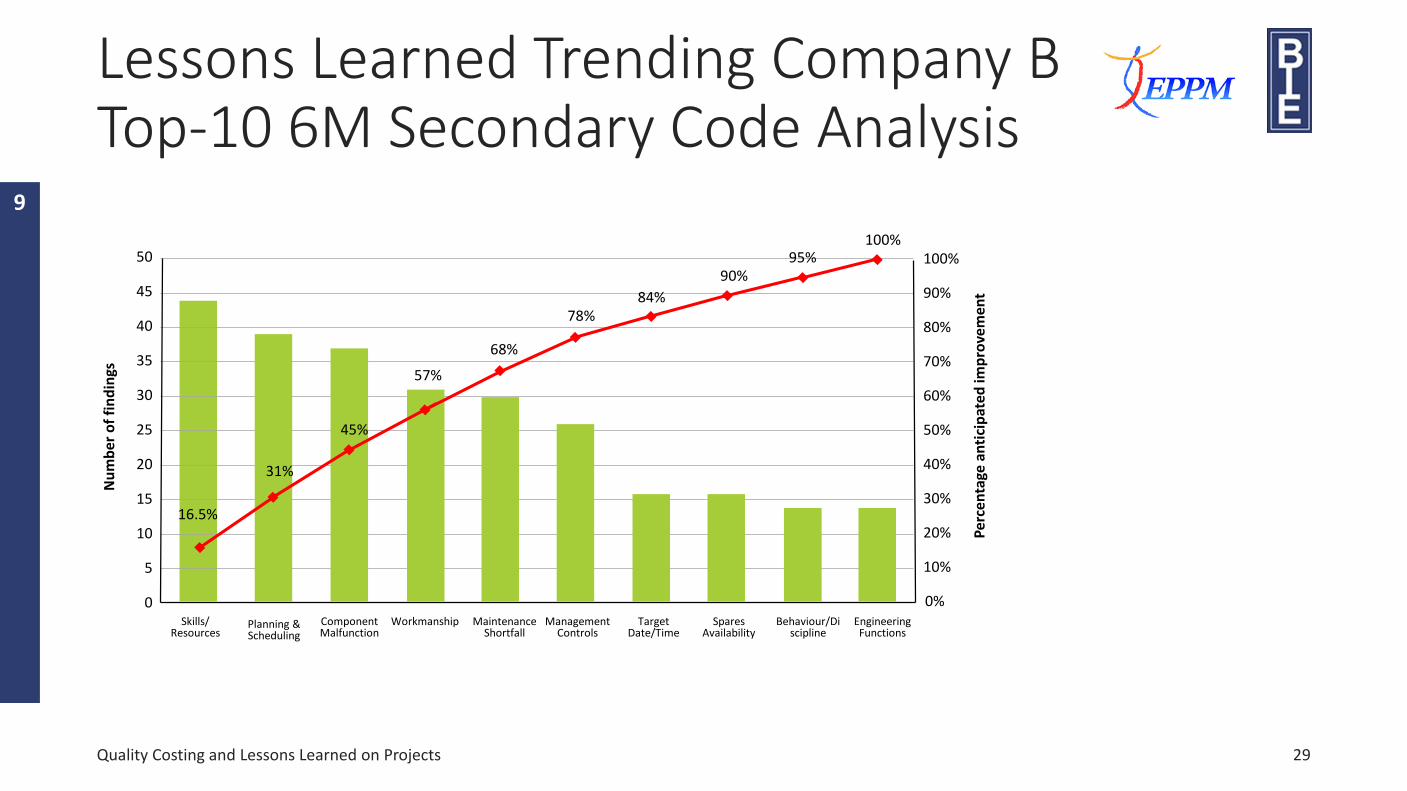
Lessons Learned Trending Company BTop-10 6M Secondary Code Analysis
Quality Costing and Lessons Learned on Projects 29
0Skills/
ResourcesPlanning & Scheduling
ComponentMalfunction
Workmanship MaintenanceShortfall
Management Controls
Target Date/Time
Spares Availability
Behaviour/Discipline
EngineeringFunctions
0%
10%
20%
30%
40%
50%
60%
70%
80%
90%
100%
5
10
15
20
25
3557%
68%
84%78%
90%95%
100%
30
Per
cen
tage
an
tici
pat
ed im
pro
vem
ent
Nu
mb
er o
f fi
nd
ings
40
45
50
45%
31%
16.5%
9
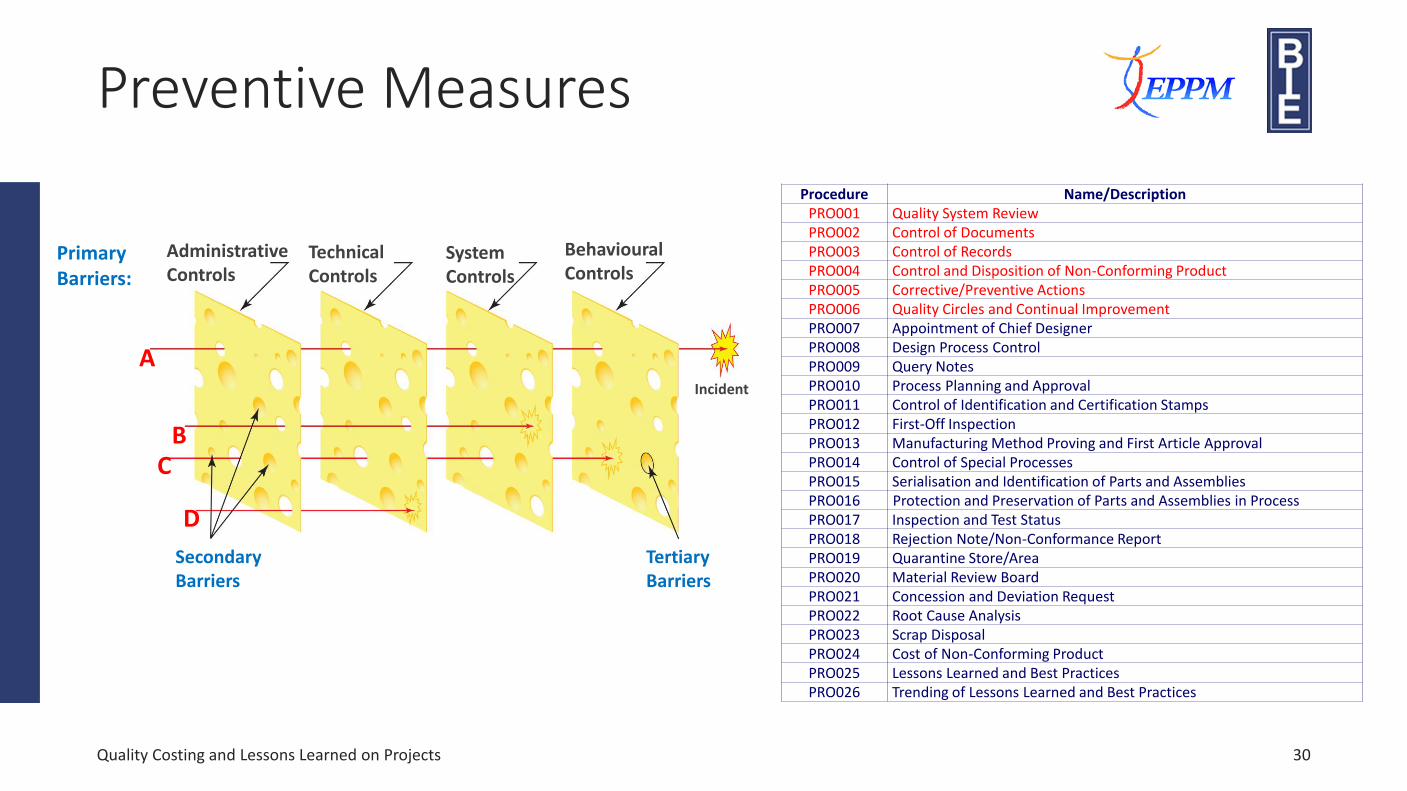
Preventive Measures
Quality Costing and Lessons Learned on Projects 30
Primary Barriers:
Administrative Controls
TechnicalControls
SystemControls
Behavioural Controls
Incident
Tertiary Barriers
Secondary Barriers
A
BC
D
Procedure Name/DescriptionPRO001 Quality System ReviewPRO002 Control of DocumentsPRO003 Control of RecordsPRO004 Control and Disposition of Non-Conforming ProductPRO005 Corrective/Preventive ActionsPRO006 Quality Circles and Continual ImprovementPRO007 Appointment of Chief DesignerPRO008 Design Process ControlPRO009 Query NotesPRO010 Process Planning and ApprovalPRO011 Control of Identification and Certification StampsPRO012 First-Off InspectionPRO013 Manufacturing Method Proving and First Article ApprovalPRO014 Control of Special ProcessesPRO015 Serialisation and Identification of Parts and AssembliesPRO016 Protection and Preservation of Parts and Assemblies in ProcessPRO017 Inspection and Test StatusPRO018 Rejection Note/Non-Conformance ReportPRO019 Quarantine Store/AreaPRO020 Material Review BoardPRO021 Concession and Deviation RequestPRO022 Root Cause AnalysisPRO023 Scrap DisposalPRO024 Cost of Non-Conforming ProductPRO025 Lessons Learned and Best PracticesPRO026 Trending of Lessons Learned and Best Practices
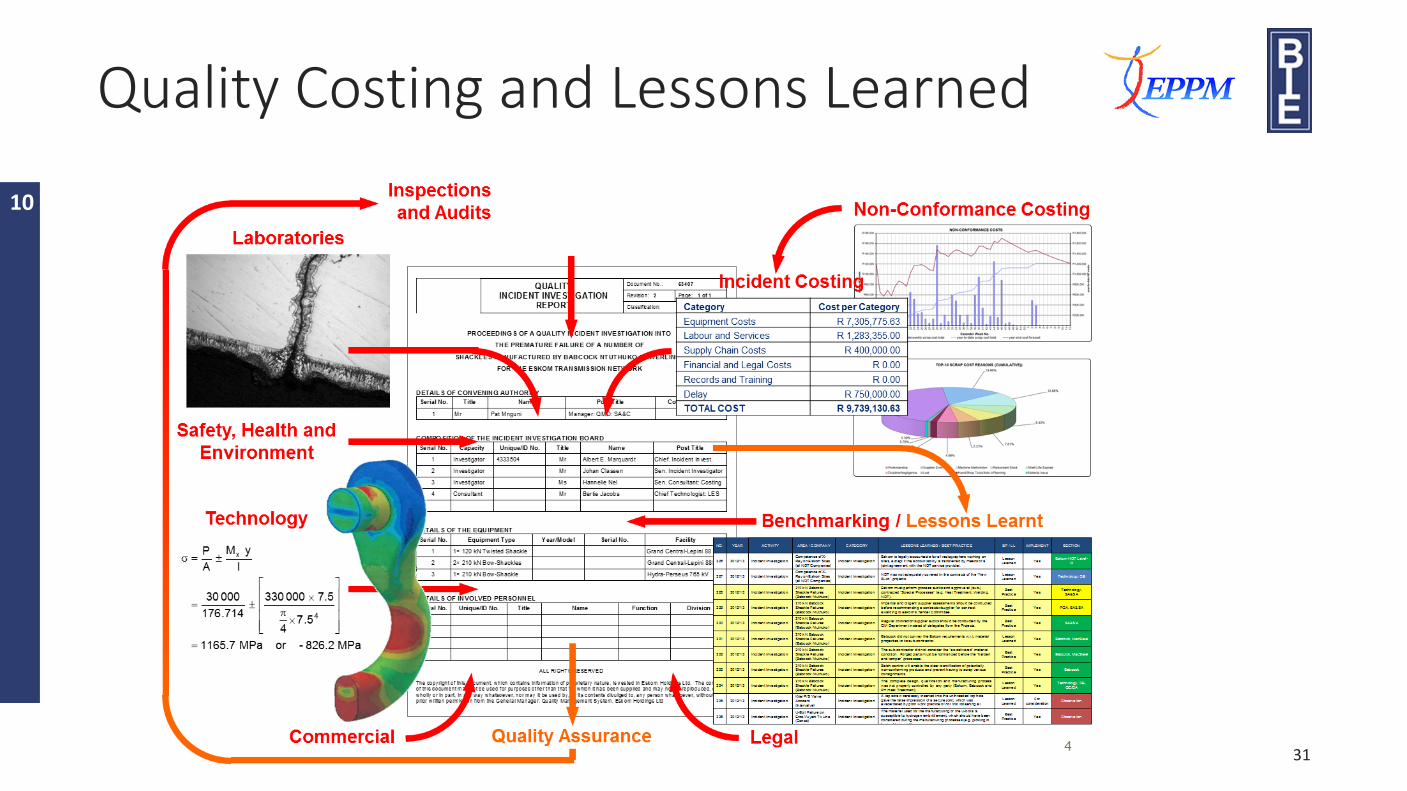
Quality Costing and Lessons Learned
31
10
Quality Costing and Lessons Learned on Projects 32
Thank you for your attention.
Questions?