Embed Size (px)
Citation preview

AirLabs Environmental Page 1 of 27
DATE OF REPORT: 24TH FEBRUARY, 2017
Mr Tim Radimissis Adelaide Brighton Cement Limited PO Box 77 Port Adelaide SA 5015
REPORT NO. OCT16190_A.2
AIR QUALITY IMPACT ASSESSMENT
OF THE ABC BIRKENHEAD CEMENT FACILITY – 2H 2016
AUTHORISATION:
BIPIN BHENSDADIA SENIOR AIR QUALITY
CONSULTANT
ABHILASH AITHARAJU M.E., B.E. PRINCIPAL AIR QUALITY CONSULTANT

Report to Adelaide Brighton Cement Limited
Air Quality Impact Assessment of the ABC Birkenhead Cement Facility – 2H 2016 Report No. OCT16190_A.2
AirLabs Environmental Page 2 of 27
Table of Contents
1.0 INTRODUCTION ........................................................................................................................................ 4
2.0 SOURCE LOCATION AND DESCRIPTION ............................................................................................. 4
3.0 REGULATORY GUIDELINES ..................................................................................................................... 5
3.1 National Legislation .............................................................................................................................. 5
3.2 South Australia Legislation .................................................................................................................. 5
3.3 Summary of Air Criteria for the Project Goals ................................................................................ 5
4.0 ASSESSMENT METHODOLOGY ............................................................................................................. 8
4.1 Meteorological Modelling ................................................................................................................... 8
4.2 Comparison of Observed Le Fevre 1 Meteorological Data with Model Data ....................... 11
4.3 Emission Rates and Source characteristics ...................................................................................... 15
4.5 Estimates of Background Levels for Criteria Pollutants ................................................................ 16
4.5 Dispersion Modelling .......................................................................................................................... 18
5.0 RESULTS AND DISCUSSION .................................................................................................................. 19
6.0 CONCLUSIONS ....................................................................................................................................... 26
7.0 REFERENCES ............................................................................................................................................. 27
LIST OF TABLES
Table 1: Air Quality Criteria for the Project .................................................................................................... 6
Table 2: TAPM Model Configuration for the Project ...................................................................................... 8
Table 3: CALMET Model Configuration for the Project .................................................................................. 9
Table 4: Stack Parameters (Stack 4A and Stack 4B) ................................................................................... 15
Table 5: Modelled Emission Rates (Stack 4A and Stack 4B) ....................................................................... 15
Table 6: Estimates of Background Levels ........................................................................................................ 17
Table 7: CALPUFF Model Configuration ......................................................................................................... 18
Table 8: Dispersion Modelling Results – Predicted Maximum Concentration (µg/m3) outside Facility Boundary ............................................................................................................................................................... 21
LIST OF FIGURES
Figure 1: Stack 4A and Stack 4B – ABC Birkenhead Facility ....................................................................... 5
Figure 2: CALMET – Simulated Terrain at 100 m Resolution (10 km x 10 km Domain) ......................... 10
Figure 3: CALMET – Simulated Land Cover at 100 m Resolution (10 km x 10 km Domain) ................. 10
Figure 4: CALMET Annual Wind Roses for Meteorological Year – 2009 ................................................ 11
Figure 5: Comparison of Annual and Seasonal Wind Roses for Meteorological Year – 2009 ........... 12
Figure 6: Comparison of Wind Class Frequency Distribution for Meteorological Year – 2009 .......... 13

Report to Adelaide Brighton Cement Limited
Air Quality Impact Assessment of the ABC Birkenhead Cement Facility – 2H 2016 Report No. OCT16190_A.2
AirLabs Environmental Page 3 of 27
Figure 7: Location of Background Monitoring Stations ................................................................................. 18
Figure 8: Predicted Maximum Cumulative Ground Level Concentrations of NO2 (µg/m3) (1 hour averaging period) Based on Lower Bound of Emission Rates ..................................................................... 23
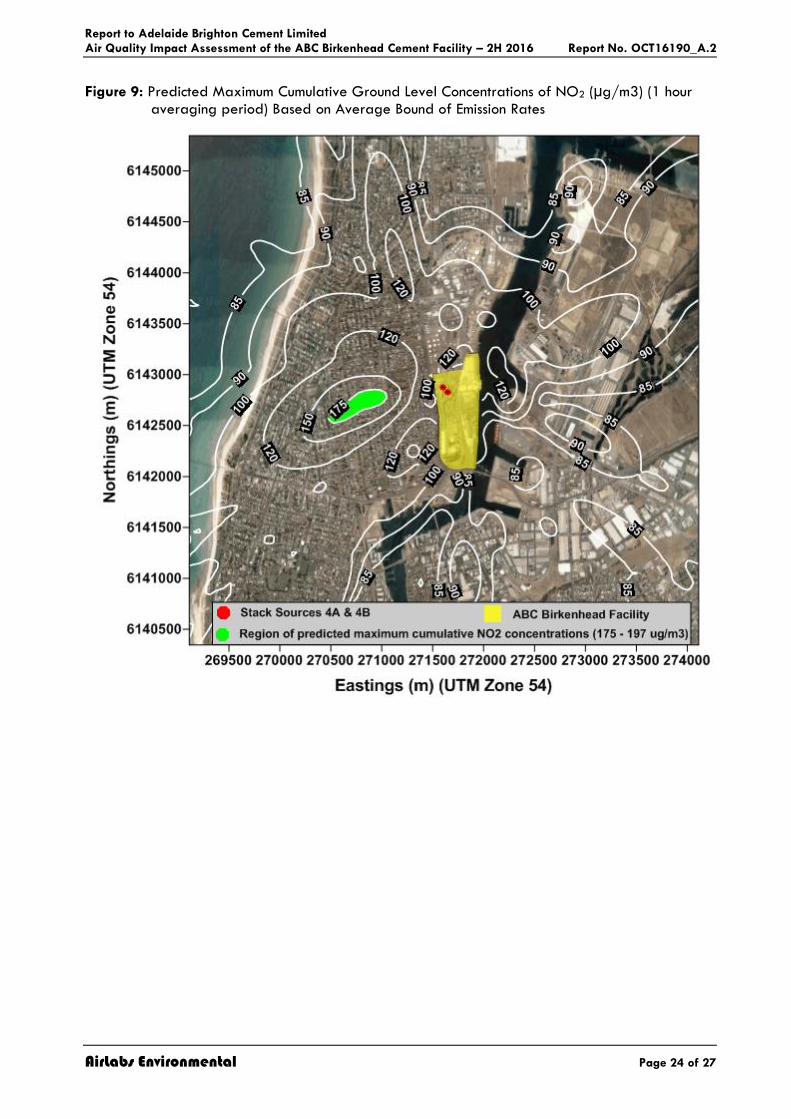
Figure 9: Predicted Maximum Cumulative Ground Level Concentrations of NO2 (µg/m3) (1 hour averaging period) Based on Average Bound of Emission Rates ................................................................ 24
Figure 10: Predicted Cumulative Maximum Ground Level Concentrations of NO2 (µg/m3) (1 hour averaging period) Based on Upper Bound of Emission Rates .................................................................... 25

Report to Adelaide Brighton Cement Limited
Air Quality Impact Assessment of the ABC Birkenhead Cement Facility – 2H 2016 Report No. OCT16190_A.2
AirLabs Environmental Page 4 of 27
1.0 INTRODUCTION
AirLabs Environmental Pty Ltd (AirLabs) was commissioned by Adelaide Brighton Cement Limited (ABC) to conduct an air quality assessment of the ABC Birkenhead Cement Plant (the facility) located in Birkenhead, South Australia.
This assessment is based on data obtained during source sampling undertaken by Airlabs during October 2016 (Airlabs Report OCT16190.2, issued on 23rd February, 2017). The objective of this assessment is to numerically determine the air quality impacts beyond the facility’s boundary. This is achieved by undertaking dispersion modelling.
In response to comments issued by the SA Environment Protection Authority (SA EPA) (correspondence date 7th November 2016, email to Tim Radimissis, from Gerard Hocking - Senior Marine Adviser), the following changes have been incorporated in this report:
Section 3 - Regulatory Guidelines have been updated to reflect the changes in AAQNEPM and South Australis’s new Environment Protection (Air Quality) Policy 2016.
Meteorological Modelling - Meteorology dataset from 2009 have been developedand used in dispersion modelling as year 2009 is considered a typical year andconsistent with advice provided by SA EPA for impact assessment for otheroperations/facilities.
CALPUFF Dispersion Model – Air quality impact assessment for this report havebeen carried out using CALPUFF dispersion model (instead of AUSPLUME) consideringthe coastal location of the facility.
The use of 1st rank values instead of 99.9th percentile – Predicted ground levelconcentration have been assessed using 100th percentile values instead of 99.9th
percentile.
Inclusion of Background Concentrations – The Design Ground Level PollutantConcentrations (DGLC) criteria have now been superseded with South Australis’s newEnvironment Protection (Air Quality) Policy 2016. To compare the predictedconcentrations from the facility with the new Air EPP criteria, inclusion ofrepresentative background is necessary. Background levels have been included forthe criteria pollutants (NO2, SO2, CO and particulates) using observed values atNEPM monitoring stations in the vicinity of the facility.
This report presents a brief overview of the assessment methodology, an outline of the regulatory framework and a summary of the findings of the assessment.
2.0 SOURCE LOCATION AND DESCRIPTION
The Birkenhead facility manufactures cement used in the construction and mining industry. Based on previous modelling studies undertaken and Airlabs’ knowledge of the facility, the main sources include the licenced Dry Process Kiln Stack (Stack 4A) and the Pre-Calciner Plant Stack (Stack 4B). Source parameters are discussed in the subsequent sections of this report.

Report to Adelaide Brighton Cement Limited
Air Quality Impact Assessment of the ABC Birkenhead Cement Facility – 2H 2016 Report No. OCT16190_A.2
AirLabs Environmental Page 5 of 27
Figure 1: Stack 4A and Stack 4B – ABC Birkenhead Facility
Dry Process Kiln Stack (Stack 4A) Pre-Calciner Plant Stack (Stack 4B)
3.0 REGULATORY GUIDELINES
3.1 National Legislation
In June 1988, the National Environment Protection Council (NEPC) developed the Ambient Air Quality National Environmental Protection Measure (NEPM) which set uniform standards for air quality at the national level and included ambient air quality standards for carbon monoxide, nitrogen dioxide, photochemical oxidants (as ozone), sulphur dioxide, lead and particulate matter (PM10 and PM2.5). The National Environmental Protection (Air Toxics) Measure (NEPM, 2004) includes standards for toxics such as Polycyclic Aromatic Hydrocarbons (PAHs).
In December 2015, the NEPC approved a variation (NEPM, 2015) to the Ambient Air Quality Measure to incorporate annual and daily reporting standards for PM2.5 of 8 µg/m3 and 25 µg/m3
respectively.
3.2 South Australia Legislation
The Environment Protection Air Quality Policy 2016 (SA Air EPP, 2016) came into effect on 23rd July 2016 and provides a legislative basis for air quality regulation and management in the state of South Australia. The policy simplifies the regulation of air quality by consolidating several previous guidelines and environment protection policies.
The EPA also recognises the air quality standards set by National Environmental Protection Council under the National Environmental Protection (Ambient Air Quality) Measure (NEPM, 2015) and National Environmental Protection (Air Toxics) Measure (NEPM, 2004).
3.3 Summary of Air Criteria for the Project Goals
The air quality criteria adopted for the Project considering the local and national regulatory guidelines are summarised in Table 1.

Report to Adelaide Brighton Cement Limited
Air Quality Impact Assessment of the ABC Birkenhead Cement Facility – 2H 2016 Report No. OCT16190_A.2
AirLabs Environmental Page 6 of 27
Table 1: Air Quality Criteria for the Project
Pollutant Averaging
Period Criteria (µg/m3)
Classification
Criteria Pollutants
Nitrogen dioxide (NO2) 1 hour 250 Toxicity
Nitrogen dioxide (NO2) Annual 60 Toxicity
Sulfur dioxide (SO2) 1 hour 570 Toxicity
Sulfur dioxide (SO2) 24 hours 230 Toxicity
Sulfur dioxide (SO2) Annual 60 Toxicity
Carbon monoxide (CO) 1 hour 31,240 Toxicity
Carbon monoxide (CO) 8 hour 11,250 Toxicity
Particulate matter (PM10) 24 hours 50 Health
Particulate matter (PM2.5) 24 hours 25 Health
Particulate matter (PM2.5 ) Annual 8 Health
Metals, Metalloids and Metal Fumes
Antimony and compounds 3 minutes 19 Toxicity
Arsenic and compounds 3 minutes 0.19 Toxicity
Barium (soluble compound) 3 minutes 19 Toxicity
Benzene 3 minutes 58 IARC Group 1 Carcinogen
Benzene Annual 10 IARC Group 1 Carcinogen
Beryllium and compounds 3 minutes 0.008 IARC Group 1 Carcinogen
Cadmium and compounds 3 minutes 0.036
Toxicity , IARC Group 1 Carcinogen
Chromium (III) compounds 3 minutes 19 Toxicity
Chromium (VI) compounds 3 minutes 0.19 IARC Group 1 Carcinogen
Copper fumes 3 minutes 7.3 Toxicity
Iron oxide fumes 3 minutes 190 Toxicity
Lead (as particles) Annual 0.5 Toxicity
Magnesium oxide fumes 3 minutes 360 Toxicity
Manganese and compounds 3 minutes 36 Toxicity
Mercury - inorganic 3 minutes 4 Bioaccumulation
Mercury - organic 3 minutes 0.36 Bioaccumulation
Nickel and compounds 3 minutes 0.36 IARC Group 1 Carcinogen
Zinc oxide 3 minutes 190 Toxicity
Report to Adelaide Brighton Cement Limited
Air Quality Impact Assessment of the ABC Birkenhead Cement Facility – 2H 2016 Report No. OCT16190_A.2
AirLabs Environmental Page 7 of 27
Pollutant Averaging
Period Criteria (µg/m3)
Classification
Polycyclic Aromatic Hydrocarbons (PAH)
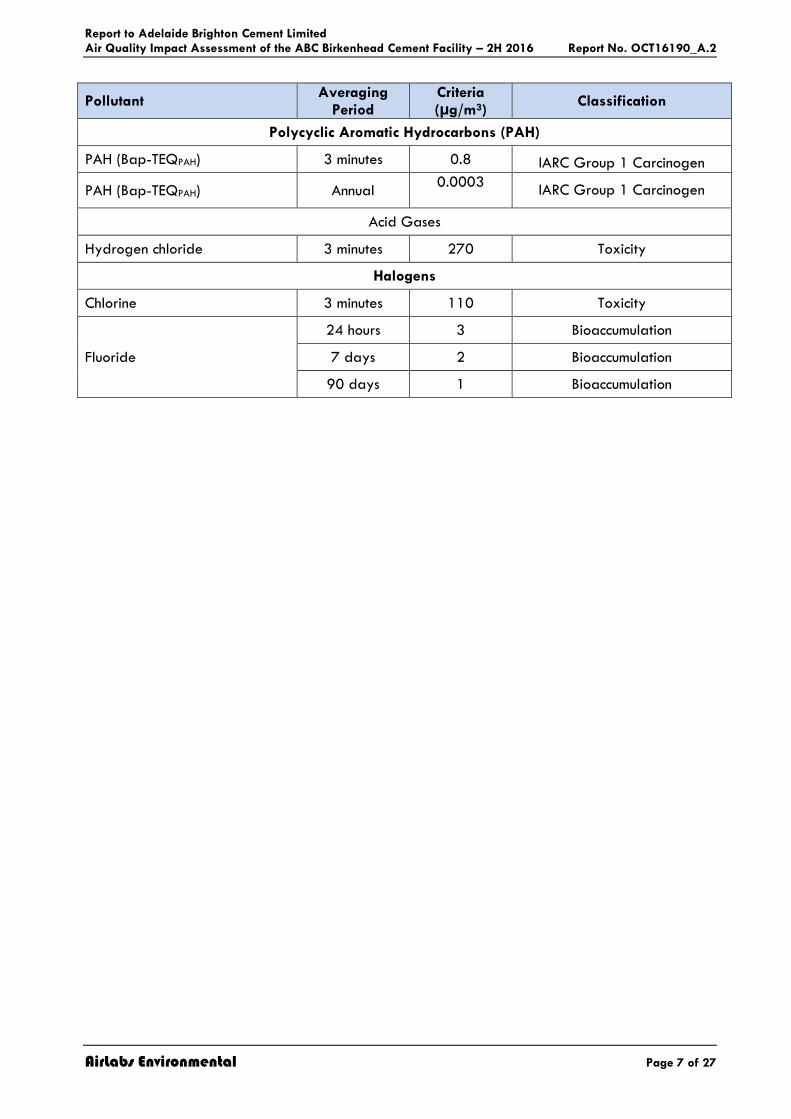
PAH (Bap-TEQPAH) 3 minutes 0.8 IARC Group 1 Carcinogen
PAH (Bap-TEQPAH) Annual 0.0003
IARC Group 1 Carcinogen
Acid Gases
Hydrogen chloride 3 minutes 270 Toxicity
Halogens
Chlorine 3 minutes 110 Toxicity
Fluoride
24 hours 3 Bioaccumulation
7 days 2 Bioaccumulation
90 days 1 Bioaccumulation

Report to Adelaide Brighton Cement Limited
Air Quality Impact Assessment of the ABC Birkenhead Cement Facility – 2H 2016 Report No. OCT16190_A.2
AirLabs Environmental Page 8 of 27
4.0 ASSESSMENT METHODOLOGY
In order to predict the impacts from 4A and 4B stacks, dispersion modelling has been used, details of which are presented in this section of the report.
4.1 Meteorological Modelling
Meteorological mechanisms govern the generation, dispersion, transformation and eventual removal of pollutants from the atmosphere. The local meteorology at the site plays a significant role in understanding the pollutant transport and dispersion mechanisms, and in order to adequately characterise the local meteorological conditions, information is needed on key parameters such as prevailing wind regime, mixing depth, atmospheric stability, ambient temperatures, rainfall and relative humidity.
For this assessment, the meteorological model ‘The Air Pollution Model (TAPM) (Version 4.0.5)’ was used to generate the prognostic output. TAPM, developed by the Commonwealth Scientific and Industrial Research Organisation (CSIRO) is a prognostic model which is used to predict three-dimensional meteorological data and air pollution concentrations. TAPM allows users to generate synthetic observations by referencing in-built databases (e.g. terrain information, synoptic scale meteorological observations, vegetation and soil type etc.) which are subsequently used in generating site-specific hourly meteorological data (Hurley P.J., 2008). Hourly varying wind speed and wind direction data from the North Western Adelaide Le Fevre 1 Monitoring station (located 1 km south west of the facility) was assimilated into TAPM to nudge the predicted solution towards the observation.
Details of the TAPM configuration for this project are outlined in Table 2.
Table 2: TAPM Model Configuration for the Project
Parameter Value
Year of analysis 2009 (01/01/2009 to 31/12/2009)
Centre of analysis (Easting, Northing) (m) 271636, 6142852 (UTM Zone 54 S)
Number of grids (spacing) 4 (30km, 10km, 3km, 1km)
Grid dimensions (nx, ny, nz) 25, 25, 25
Data assimilation North Western Adelaide Le Fevre 1 Met station
CALMET (version 6.4.0) was used to derive meteorological fields at 100 m resolution over a 10 km x 10 km modelling domain centred over the Project site.
The Geophysical dataset for CALMET contains terrain and land use information for the modelling domain. For this assessment, terrain for the CALMET grid was extracted from 1- arc second (30 m) spaced elevation data obtained via NASA’s Shuttle Radar Topography Mission (SRTM, 2000). A three-dimensional view of the terrain data at 100 m resolution overlaid over the aerial base map is shown in Figure 2. The figure highlights the relatively flat terrain along the coastline and area in the vicinity of the facility.
The land use or land cover data for the modelling domain as shown in Figure 3 was manually generated based on aerial images from Google earth. The geotechnical parameters for the land use classification were adopted from the default CALMET corresponding land use categories.
Using geophysical datasets, prognostic and surface observational data, CALMET then develops the higher resolution flow fields to include (in general) the kinematic effects of terrain, slope flows,

Report to Adelaide Brighton Cement Limited
Air Quality Impact Assessment of the ABC Birkenhead Cement Facility – 2H 2016 Report No. OCT16190_A.2
AirLabs Environmental Page 9 of 27
blocking effects and 3-dimensional divergence minimisation as well as differential heating and surface roughness associated with variations in land use categories across the modelling domain.
CALMET was ran in No-Obs mode in accordance with the ‘Generic Guidance and Optimum Model Settings for the CALPUFF Modelling System for Inclusion into the ‘Approved Methods for the Modelling and Assessments of Air Pollutants in NSW, Australia’ (OEH, 2011).
The domain size, grid resolution and other configuration of the CALMET model is specified in Table 3.
Table 3: CALMET Model Configuration for the Project
Parameter Value
Year of Analysis 2009
No. X Grid Cells (NX), No. Y Grid Cells (NY) 101, 101
Grid spacing (DGRIDKM) (km) 0.1
XORIGIN (km), YORIGIN (km) 266.56132, 6137.79521
No. of Vertical Levels 10
Radius of influence RMAX1,RMAX2,RMAX3 (km) 10,10,10
Radius of influence of terrain TERRAD (km) 10
No Observation Mode (NOOBS) 2 (i.e. use MM4/MM5/3D for surface,
overwater, and upper air data)
Terrain data 1-arc second, 30 m resolution (SRTM, 2000)
Land cover data Manually generated from aerial imagery

Report to Adelaide Brighton Cement Limited
Air Quality Impact Assessment of the ABC Birkenhead Cement Facility – 2H 2016 Report No. OCT16190_A.2
AirLabs Environmental Page 10 of 27
Figure 2: CALMET – Simulated Terrain at 100 m Resolution (10 km x 10 km Domain)
Figure 3: CALMET – Simulated Land Cover at 100 m Resolution (10 km x 10 km Domain)

Report to Adelaide Brighton Cement Limited
Air Quality Impact Assessment of the ABC Birkenhead Cement Facility – 2H 2016 Report No. OCT16190_A.2
AirLabs Environmental Page 11 of 27
Hourly wind speeds and directions for calendar year 2009 were extracted from the CALMET output at the centre of the facility and is visually presented in the form of wind roses in Figure 4. Winds are dominant from southwest direction followed by northeast. Infrequent winds are observed from other directions.
Figure 4: CALMET Annual Wind Roses for Meteorological Year – 2009
4.2 Comparison of Observed Le Fevre 1 Meteorological Data with Model Data
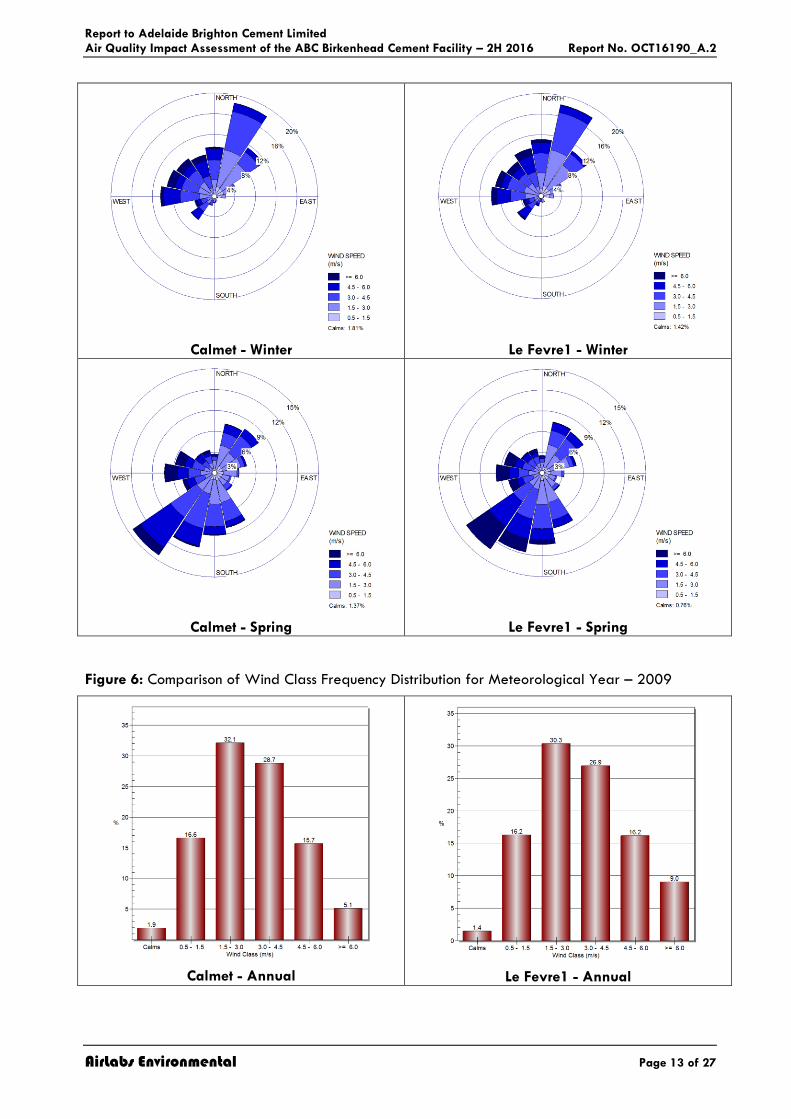
Comparison of annual and season winds observed at the Le Fevre1 monitoring station (located 1.0 km southwest of the facility) with Calmet predicted winds at the facility location is presented in Figure 4. Observed wind pattern at the Le Fevre 1 station throughout the year are similar to that of simulated winds predicted by Calmet. Comparison of the wind class frequency distribution (Figure 6) shows that Calmet predicted slightly higher percentage of calms and lower percentage of higher wind speeds compared to Le Fevre1 observations. Occurrence of higher percentage of calms may lead to poor dispersion and higher predicted pollutant concentration in the vicinity of source. However the difference in Calmet predicted and observed (Le Fevre1) calms percentage is not significant to cause erroneous predictions from the model.

Report to Adelaide Brighton Cement Limited
Air Quality Impact Assessment of the ABC Birkenhead Cement Facility – 2H 2016 Report No. OCT16190_A.2
AirLabs Environmental Page 12 of 27
Figure 5: Comparison of Annual and Seasonal Wind Roses for Meteorological Year – 2009
Calmet - Annual Le Fevre1 - Annual
Calmet - Summer Le Fevre1 - Summer
Calmet - Autumn Le Fevre1 - Autumn
Report to Adelaide Brighton Cement Limited
Air Quality Impact Assessment of the ABC Birkenhead Cement Facility – 2H 2016 Report No. OCT16190_A.2
AirLabs Environmental Page 13 of 27
Calmet - Winter Le Fevre1 - Winter
Calmet - Spring Le Fevre1 - Spring
Figure 6: Comparison of Wind Class Frequency Distribution for Meteorological Year – 2009
Calmet - Annual Le Fevre1 - Annual

Report to Adelaide Brighton Cement Limited
Air Quality Impact Assessment of the ABC Birkenhead Cement Facility – 2H 2016 Report No. OCT16190_A.2
AirLabs Environmental Page 14 of 27
Calmet - Summer Le Fevre1 - Summer
Calmet - Autumn Le Fevre1 - Autumn
Calmet - Winter Le Fevre1 - Winter

Report to Adelaide Brighton Cement Limited
Air Quality Impact Assessment of the ABC Birkenhead Cement Facility – 2H 2016 Report No. OCT16190_A.2
AirLabs Environmental Page 15 of 27
Calmet - Spring Le Fevre1 - Spring
4.3 Emission Rates and Source characteristics
Stack testing was conducted in October 2016 (Airlabs Report OCT16190.2 – Air Emissions Monitoring of Release Points 4A & 4B at Adelaide Brighton Cement Ltd in Birkenhead, issued on 23rd February, 2017) to sample the emission rates and source characteristics from Stacks 4A and 4B. Dispersion modelling parameters obtained from the stack testing undertaken in October 2016 are presented in Table 4. Emission rates used in the dispersion modelling assessment are presented in Table 5.
Table 4: Stack Parameters (Stack 4A and Stack 4B)
Parameter Stack 4A Stack 4B
Sampling Date 24th – 25th October 2016 24th – 25th October 2016
Stack height (m) 75.5 96
Stack diameter (m) 3.23 3.0
Stack temperature (°C) 107 105
Exit velocity (m/s) 19.3 18.6
Table 5: Modelled Emission Rates (Stack 4A and Stack 4B)
Pollutant
Emission Rates (g/s)
Stack 4A 24th – 25th October 2016
Stack 4B 24th – 25th October 2016
Criteria Pollutants
Oxides of nitrogen (as NO2) - Minimum 51.0 42.7
Oxides of nitrogen (as NO2) - Average 62.5 50.3
Oxides of nitrogen (as NO2) - Maximum 81.0 57.8
Sulfur dioxide (SO2) 4.2 0.2
Carbon monoxide (CO) 28.5 22.7

Report to Adelaide Brighton Cement Limited
Air Quality Impact Assessment of the ABC Birkenhead Cement Facility – 2H 2016 Report No. OCT16190_A.2
AirLabs Environmental Page 16 of 27
Pollutant
Emission Rates (g/s)
Stack 4A 24th – 25th October 2016
Stack 4B 24th – 25th October 2016
Particulate matter (PM10) 2.37 0.83
Particulate matter (PM2.5) 0.62 0.42
Metals, Metalloids and Metal Fumes(1)
Arsenic and compounds 0.000037 0.000013
Antimony and compounds 0.000010 0.000008
Barium 0.00038 0.00018
Benzene 0.008 0.014
Beryllium and compounds 0.000010 0.000008
Cadmium and compounds 0.0000025 0.0000007
Chromium (III) compounds 0.00043 0.00005
Chromium (VI) compounds 0.000053 0.000012
Copper oxide 0.00183 0.00023
Iron oxide 0.053 0.018
Lead 0.00010 0.00003
Magnesium oxide fumes 0.23 0.11
Manganese and compounds 0.0014 0.0004
Mercury - inorganic 0.0000016 0.0000008
Mercury - organic 0.0000007 0.0000003
Nickel and nickel compounds 0.000103 0.000032
Zinc oxide 0.00092 0.00035
Polycyclic Aromatic Hydrocarbons (PAH)
PAH (as Benzo (a)pyrene) (Bap-TEQPAH) 0.00000082 0.00000112
Acid Gases
Hydrogen chloride 0.45 0.53
Halogens
Chlorine 0.40 0.16
Fluoride 0.010 0.008
Notes:
(1): Where the measured results were less than the detection limit, the detection limit was used for modelling purposes.
4.5 Estimates of Background Levels for Criteria Pollutants
For the purpose of this assessing background levels for the Project, ambient monitoring data for the latest year (2016) was collated for the NEPM monitoring stations located in the vicinity of the facility (SA EPA, 2017).
The nearest ambient monitoring station (Le Fevre1) to the facility records observations of particulates (PM10 and PM2.5) only. The nearest monitoring station recording NO2 and SO2 observations is Le Fevre2. CO monitoring is not currently undertaken at Le Fevre1 or Le Fevre2 monitoring stations hence the recorded observations from Adelaide CBD monitoring station were used. The relative location of the three monitoring stations with respect to the facility is shown in Figure 7.
The suitable percentile employed in estimating background concentration of a particular pollutant may depend on a number of factors such as representativeness of the monitoring data set in terms

Report to Adelaide Brighton Cement Limited
Air Quality Impact Assessment of the ABC Birkenhead Cement Facility – 2H 2016 Report No. OCT16190_A.2
AirLabs Environmental Page 17 of 27
of influence from local sources, representativeness of meteorological conditions at monitoring site and dominance of emission source. Environmental Protection Authority Victoria (VIC EPA, 2001) recommends the use of the 70th percentile (Victoria, 2001). The approach in NSW (NSW, 2016) is to utilise data time series contemporaneously to assess the predicted impacts for Level 2 assessment. For this assessment 100th percentile background concentration have been used as background for NO2, SO2 and CO.
For 24-hour average particulates (PM10 and PM2.5) concentration, a background level of 90th percentile have been used in the assessment. Exceedence of the PM10 24-hour average criteria was observed during the year 2016 at Le Fevre1 station (due to regional storm events), hence 90th percentile value were estimated and used for the background.
The background pollutant levels adopted for the purposes of this assessment are presented in Table 6.
Table 6: Estimates of Background Levels
Pollutant Averaging
Period Background
Level (µg/m3) Reference
NO2 1 hour 63.9 Maximum observed hourly record at Le Fevre2 (2016) monitoring station
NO2 Annual 8.0 Annual average of observed hourly records at Le Fevre2 (2016) monitoring station
SO2 1 hour 57.6 Maximum observed hourly record at Le Fevre2 (2016) monitoring station
SO2 24-hour 6.5 Maximum observed daily record (calculated from hourly data) at Le Fevre2 (2016) monitoring station
SO2 Annual 0.5 Annual average of observed hourly records at Le Fevre2 (2016) monitoring station
CO 1 hour 2,800 Maximum observed hourly record at Adelaide CBD (2016) monitoring station
CO 8 hours 2,600 Maximum 8 hourly record (calculated from hourly data) at Adelaide CBD (2016) monitoring station
PM10 24 hours 29.9 90th percentile of daily observed records (calculated from hourly data) at Le Fevre1 (2016) monitoring station 1
PM2.5 24 hours 10.8 90th percentile of daily observed records (calculated from hourly data) at Le Fevre1 (2016) monitoring station 1
PM2.5 Annual 7.6 Annual average of observed hourly records at Le Fevre1 (2016) monitoring station
Notes:
(1): Particulate data were missing for the first two months in 2016 at Le Fevre1 monitoring station hence the missing records during the months of
January and February were replaced with 2015 data from the same monitoring station where available.

Report to Adelaide Brighton Cement Limited
Air Quality Impact Assessment of the ABC Birkenhead Cement Facility – 2H 2016 Report No. OCT16190_A.2
AirLabs Environmental Page 18 of 27
Figure 7: Location of Background Monitoring Stations
4.5 Dispersion Modelling
Dispersion modelling was undertaken using the CALPUFF model v.6.42 utilising meteorological wind fields generated through CALMET for the year 2009. A 5 km by 5 km subset of CALMET modelling domain centred over the facility was sufficient to capture the impacts of stack emissions on the local surroundings. Gridded receptors were sampled at 100 m resolution. General run control parameters and technical options that were selected are presented in Table 7. The location of the two stack sources with reference to the facility boundary is shown in Figure 1.
Table 7: CALPUFF Model Configuration
Parameter Value
CALPUFF version 6.42
Year modelled 2009
Stack modelled 4A & 4B (as point source)
Computational grid size 5 km x 5 km Subset of CALMET
Computational grid resolution 100 m
Gridded receptors used (LSAMP) True
Gridded receptor grid resolution 100 m

Report to Adelaide Brighton Cement Limited
Air Quality Impact Assessment of the ABC Birkenhead Cement Facility – 2H 2016 Report No. OCT16190_A.2
AirLabs Environmental Page 19 of 27
Discrete receptors modelled False
Building wake algorithm BPIP Prime
Method used to compute dispersion coefficient (MDISP) 3
Dry Deposition modelled False
Wet deposition False
Buildings in the vicinity of the sources play a major role in pollutant dispersion as they may create zones of strong turbulence and enhance downward mixing resulting in higher ground-level concentrations. The impact of building wake effects on plume dispersion has been included in the modelling for buildings and structures located around the stack. The heights and locations of these structures were entered into the Building Profile Input Program (BPIP) utility using PRIME algorithm. The wind direction-specific building dimensions calculated by BPIP for each stack were entered into the CALPUFF model.
Peak to mean ratio to estimate the 3 minute average concentrations from hourly averages generated by dispersion modelling was based on CSIRO peak-to-mean scaling (CSIRO, 2008).
Measurements of oxides of nitrogen (NOX) emissions around Power Station plume in central Queensland (Bofinger, 1986) indicate that up to 30% of NOX may be transformed into nitrogen dioxide (NO2). The ratio accounts for the expectation that approximately 5%-10% of the NOX is emitted from the source as NO2. The remaining portion of the NO2 is transformed from the photochemical oxidation of nitric oxide, which tends to peak at approximately 30%, ten to fifteen kilometres downwind.
To account for the chemical transformation of NOx to NO2 with distance downwind of the facility, emission rates of total oxides of nitrogen were modelled and the results within the domain were scaled with the scale factor varying linearly with distance from the kiln sources. The scale factor ranged from 10% (kiln sources) to 30% (at a distance of 10 km from the site boundary).
5.0 RESULTS AND DISCUSSION
CALPUFF dispersion model was set to predict concentrations of modelled pollutants at gridded receptor at 100 m resolution over the 5 km x 5 km modelling domain. Contour plots showing the predicted impacts on local surrounding were generated based on results at these gridded receptors using kriging algorithm.
The predicted ground level concentrations of all air pollutants modelled are summarised in Table 8 below. Maximum concentrations presented are 100th percentile for all pollutants and averaging period. Representative background levels are included for the criteria pollutants to assess the cumulative impacts.
From the results outlined in Table 8, it is observed that predicted cumulative ground level concentrations of all pollutants are below their respective criteria. Of all the modelled pollutants, highest concentrations were observed for particulate matter PM2.5 followed by NO2.
The maximum predicted cumulative PM2.5 annual average concentrations outside the facility boundary is 7.7 µg/m3 (inclusive of 7.6 µg/m3 background) compared to criterion of 8 µg/m3. The maximum predicted cumulative PM2.5 24-hour average concentrations outside the facility boundary is 11.7 µg/m3 (inclusive of 10.8 µg/m3 background) compared to criterion of 25 µg/m3
.
The maximum predicted cumulative PM10 24-hour average concentrations outside the facility boundary is 32.5 µg/m3 (inclusive of 29.9 µg/m3 background) compared to criterion of 50 µg/m3.

Report to Adelaide Brighton Cement Limited
Air Quality Impact Assessment of the ABC Birkenhead Cement Facility – 2H 2016 Report No. OCT16190_A.2
AirLabs Environmental Page 20 of 27
The maximum predicted cumulative NO2 1-hour average concentrations outside the facility boundary ranges from 88% to 71% of the air quality criteria for upper bound and lower bound of emission rates, respectively.
The maximum predicted cumulative CO 8-hour average concentrations outside the facility boundary is 2719 µg/m3 (inclusive of 2600 µg/m3 background) compared to criterion of 11,250 µg/m3.
The maximum predicted cumulative SO2 1-hour average concentrations outside the facility boundary is 117.6 µg/m3 (inclusive of 57.6 µg/m3 background) compared to criterion of 570 µg/m3.
For all other modelled pollutants, the maximum predicted ground level concentrations were below 20% of the air quality criteria adopted for this project.
For visual illustration, the highest 1-hour average NO2 concentration isopleths for lower, average and upper bound emission rates are presented in Figure 8 , Figure 9 and Figure 10, respectively.

Report to Adelaide Brighton Cement Limited
Air Quality Impact Assessment of the ABC Birkenhead Cement Facility – 2H 2016 Report No. OCT16190_A.2
AirLabs Environmental Page 21 of 27
Table 8: Dispersion Modelling Results – Predicted Maximum Concentration (µg/m3) outside Facility Boundary
Pollutant Averaging
Period Criteria (µg/m3)
Predicted Incremental From Facility
(µg/m3)
Incremental (% of Criteria)
Estimated Background
Concentration (µg/m3)
Background (% of Criteria)
Cumulative (Incremental + Background)
(µg/m3)
Cumulative (% of Criteria)
Nitrogen Dioxide (NO2) – Minimum Emissions
1 hour 250 112.5 45.0% 63.9 25.6% 176.4 70.6%
Annual 60 0.7 1.1% 8 13.3% 8.7 14.5%
Nitrogen Dioxide (NO2) – Average Emissions
1 hour 250 133.5 53.4% 63.9 25.6% 197.4 79.0%
Annual 60 0.8 1.4% 8 13.3% 8.8 14.7%
Nitrogen Dioxide (NO2) – Maximum Emissions
1 hour 250 156.4 62.6% 63.9 25.6% 220.3 88.1%
Annual 60 1.0 1.7% 8 13.3% 9.0 15.0%
Sulfur dioxide (SO2)
1 hour 570 59.9 10.5% 57.64 10.1% 117.6 20.6%
24 hours 230 4.0 1.7% 6.5 2.8% 10.5 4.5%
Annual 60 0.3 0.5% 0.5 0.8% 0.8 1.4%
Carbon monoxide (CO) 1 hour 31240 675 2.2% 2800 9.0% 3475 11.1%
8 hours 11250 119 1.1% 2600 23.1% 2719 24.2%
Particulate matter (PM10) 24 hours 50 2.6 5.2% 29.9 59.8% 32.5 65.0%
Particulate matter (PM2.5) 24 hours 25 0.9 3.4% 10.8 43.2% 11.7 46.6%
Annual 8 0.1 0.9% 7.6 95.0% 7.7 95.9%
Antimony and compounds 3 minutes 19 0.0007 0.004% 0 0% 0.0007 0.004%
Arsenic and compounds 3 minutes 0.19 0.0018 0.93% 0 0% 0.0018 0.93%
Barium (soluble compound) 3 minutes 19 0.019 0.10% 0 0% 0.019 0.10%
Benzene 3 minutes 58 0.989 1.7% 0 0% 0.989 1.7%
Annual 10 0.0015 0.01% 0 0% 0.0015 0.01%
Beryllium and compounds 3 minutes 0.008 0.0007 8.8% 0 0% 0.0007 8.8%
Cadmium and compounds 3 minutes 0.036 0.0001 0.32% 0 0% 0.0001 0.32%
Chromium (III) compounds 3 minutes 19 0.019 0.10% 0 0% 0.019 0.10%

Report to Adelaide Brighton Cement Limited
Air Quality Impact Assessment of the ABC Birkenhead Cement Facility – 2H 2016 Report No. OCT16190_A.2
AirLabs Environmental Page 22 of 27
Pollutant Averaging
Period Criteria (µg/m3)
Predicted Incremental From Facility
(µg/m3)
Incremental (% of Criteria)
Estimated Background
Concentration (µg/m3)
Background (% of Criteria)
Cumulative (Incremental + Background)
(µg/m3)
Cumulative (% of Criteria)
Chromium (VI) compounds 3 minutes 0.19 0.0024 1.27% 0 0% 0.0024 1.27%
Copper oxide fumes 3 minutes 7.3 0.079 1.09% 0 0% 0.079 1.09%
Iron oxide fumes 3 minutes 190 2.56 1.35% 0 0% 2.56 1.35%
Lead (as particles) Annual 0.5 0.000009 0.002% 0 0% 0.000009 0.002%
Magnesium oxide fumes 3 minutes 360 11.83 3.3% 0 0% 11.83 3.3%
Manganese & compounds 3 minutes 36 0.064 0.18% 0 0% 0.064 0.18%
Mercury - inorganic 3 minutes 4 0.0001 0.002% 0 0% 0.0001 0.002%
Mercury - organic 3 minutes 0.36 0.00003 0.01% 0 0% 0.00003 0.01%
Nickel & compounds 3 minutes 0.36 0.0049 1.35% 0 0% 0.0049 1.35%
Zinc oxide 3 minutes 190 0.045 0.02% 0 0% 0.045 0.02%
PAH (as Benzo(a)pyrene) (Bap-TEQPAH)
3 minutes 0.8 0.00008 0.01% 0 0% 0.00008 0.01%
Annual 0.0003 0.0000001 0.04% 0 0% 0.0000001 0.04%
Hydrogen chloride 3 minutes 270 40.7 15.1% 0 0% 40.7 15.1%
Chlorine 3 minutes 110 19.7 17.9% 0 0% 19.7 17.9%
Fluoride (as HF)
24 hours 3 0.015 0.51% 0 0% 0.015 0.51%
7 days 2 0.0045 0.22% 0 0% 0.0045 0.22%
90 days 1 0.0023 0.23% 0 0% 0.0023 0.23%

Report to Adelaide Brighton Cement Limited
Air Quality Impact Assessment of the ABC Birkenhead Cement Facility – 2H 2016 Report No. OCT16190_A.2
AirLabs Environmental Page 23 of 27
Figure 8: Predicted Maximum Cumulative Ground Level Concentrations of NO2 (µg/m3) (1 hour averaging period) Based on Lower Bound of Emission Rates
Report to Adelaide Brighton Cement Limited
Air Quality Impact Assessment of the ABC Birkenhead Cement Facility – 2H 2016 Report No. OCT16190_A.2
AirLabs Environmental Page 24 of 27
Figure 9: Predicted Maximum Cumulative Ground Level Concentrations of NO2 (µg/m3) (1 hour averaging period) Based on Average Bound of Emission Rates

Report to Adelaide Brighton Cement Limited
Air Quality Impact Assessment of the ABC Birkenhead Cement Facility – 2H 2016 Report No. OCT16190_A.2
AirLabs Environmental Page 25 of 27
Figure 10: Predicted Cumulative Maximum Ground Level Concentrations of NO2 (µg/m3) (1 hour averaging period) Based on Upper Bound of Emission Rates

Report to Adelaide Brighton Cement Limited
Air Quality Impact Assessment of the ABC Birkenhead Cement Facility – 2H 2016 Report No. OCT16190_A.2
AirLabs Environmental Page 26 of 27
6.0 CONCLUSIONS
The CALPUFF dispersion model, in conjunction with TAPM/CALMET generated meteorological data for the year 2009, was used to predict the maximum ground level concentrations of various air pollutants outside the boundaries of the Adelaide Brighton Cement facility in Birkenhead. Emission rates for stack 4A and 4B considered in this assessment were based on results from stack testing conducted by Airlabs Environmental during October 2016 (Airlabs Report OCT16190.2).
In response to comments issued by SA EPA (correspondence dated 7th November 2016) appropriate changes have been incorporated in this report.
Results from the dispersion modelling (Table 8) suggest that all the modelled pollutants are below their respective regulatory criteria.
Report to Adelaide Brighton Cement Limited
Air Quality Impact Assessment of the ABC Birkenhead Cement Facility – 2H 2016 Report No. OCT16190_A.2
AirLabs Environmental Page 27 of 27
7.0 REFERENCES
AirLabs Environmental (2017): Test report OCT16190.2 Air Emissions Monitoring of Release Points 4A & 4B At Adelaide Brighton Cement Ltd in Birkenhead, 24th – 25st October, 2016. Prepared for Adelaide Brighton Cement. Report dated 23rd February, 2017.
Bofinger (1986): Bofinger, N.D., Best, P.R., Cliff, D.I., Stumer, L.J., (1986): The oxidation of nitric oxide to nitrogen dioxide in power station plumes, Proceedings of the Seventh World Clean Air Congress, Sydney, 384-392.
CSIRO (2008): The peak-to-mean-scaling, CSIRO Marine and Atmospheric Research website http://www.cmar.csiro.au/airquality/peaktomean.html
Hurley P.J. (2008): TAPM V4. Part 1: Technical Description, CSIRO Marine and Atmospheric Research Paper No. 25.
NEPM (1998): National Environment Protection (Ambient Air Quality) Measure. National Environment Protection Council.
NEPM (2004): National Environment Protection (Air Toxic) Measure. National Environment Protection Council.
NEPM (2015): National Environmental Protection (Ambient Air Quality) Measure. National Environmental Protection Council. Revised in December 2015.
NSW (2016): Approved Methods for the Modelling and Assessment of Air Pollutions in New South Wales.
OEH (2011): Generic Guidance and Optimum Model Settings for the CALPUFF Modelling System for Inclusion into the ‘Approved Methods for the Modelling and Assessments of Air Pollutants in NSW, Australia’, March 2011.
SA Air EPP (2016): The Environment Protection (Air Quality) Policy 2016 (Air Quality EPP). South Australia Environment protection Agency (SA EPA).
SA EPA (2017): Ambient hourly air monitoring data for Le Fevre1, Le Fevre2 and Adelaide CBD, downloaded from SA EPA website https://data.sa.gov.au/data/organization/environment-protection-authority-epa
SRTM (2000): Shuttle Radar Topography Mission SRTM 1 Arc-Second Global data, downloaded from USGS website.
Vic EPA (2001): Victoria Environmental Protection Agency (VIC-EPA) Air Quality Guidelines – VIC EPA Gazette S 240 Schedule A