Embed Size (px)
Citation preview

The Neuroscientist18(4) 360 –372© The Author(s) 2012Reprints and permission: http://www. sagepub.com/journalsPermissions.navDOI: 10.1177/1073858411422754http://nro.sagepub.com
Review
Epilepsy, the condition of recurrent unprovoked seizures resulting from a wide variety of causes, is the world’s most prominent serious brain disorder, affecting some 50 million people worldwide. For an estimated 30% of these patients, seizures remain poorly controlled despite maxi-mal medical management (Duncan and others 2006). Moreover, control of epilepsy through medication and surgery often results in significant, sometimes debilitat-ing, side effects. Advancing the therapeutic management of epilepsy requires a detailed understanding of the neu-rophysiological underpinnings that give rise to seizures and how seizures are initiated and subsequently spread across interconnected brain regions. The majority of work in this field has focused on the molecular, anatomi-cal, and cellular physiological changes involved in the development of epilepsy (epileptogenesis) and in the ini-tiation of seizures (ictogenesis). Until recently, little attention had been paid to interactions between activities in different brain regions. This type of analysis—focused on functional connectivity and resulting network maps—has expanded enormously in the last 5 years and has offered important new perspectives and insights into the nature of epilepsy. Research into the network organiza-tion of seizures has spanned a variety of different model systems and data sources, explored the rhythmic nature of epileptic activity, and both used and motivated the devel-opment of innovative analytic techniques. In this review,
we briefly discuss some of the relevant background infor-mation on these different aspects of epilepsy, provide a short course on network analysis, and then delve more deeply into recent findings and implications of network investigations in patients with epilepsy.
Overview of Epilepsy and Seizures, Rhythms, and NetworksDifferent Kinds of Seizures and Implications for Spatial Characterization of Epilepsy
Seizures and epilepsy have traditionally been divided into two different types: primary generalized seizures and focal seizures. Primary generalized seizures involve all of the brain or large portions of the brain at the outset. A
422754 NROXXX10.1177/1073858411422754Kramer and CashThe Neuroscientist
1Department of Mathematics and Statistics, Boston University, Boston, MA2Department of Neurology, Massachusetts General Hospital, Boston, MA3Harvard Medical School, Boston, MA
Corresponding Author:Mark A. Kramer, 111 Department of Mathematics and Statistics, Boston University, Cummington St, Boston, MA 02215 Email: [email protected]
Epilepsy as a Disorder of Cortical Network Organization
Mark A. Kramer1 and Sydney S. Cash2,3
Abstract
The brain is naturally considered as a network of interacting elements which, when functioning properly, produces an enormous range of dynamic, adaptable behavior. However, when elements of this network fail, pathological changes ensue, including epilepsy, one of the most common brain disorders. This review examines some aspects of cortical network organization that distinguish epileptic cortex from normal brain as well as the dynamics of network activity before and during seizures, focusing primarily on focal seizures. The review is organized around four phases of the seizure: the interictal period, onset, propagation, and termination. For each phase, the authors discuss the most common rhythmic characteristics of macroscopic brain voltage activity and outline the observed functional network features. Although the characteristics of functional networks that support the epileptic seizure remain an area of active research, the prevailing trends point to a complex set of network dynamics between, before, and during seizures.
Keywords
seizure, coupling, functional network, structural network, rhythms
at BOSTON UNIV on June 9, 2015nro.sagepub.comDownloaded from
Kramer and Cash 361
substantial body of work has indicated that generalized seizures likely involve a perturbation in existing thala-mocortical network interrelationships (for an excellent review, see Chang and Lowenstein 2003). Focal seizures, in contrast, originate from a circumscribed region of the brain and may or may not spread. As implied by the name, the focus of the seizure may determine exactly what symptoms occur. In addition, localization of the focus can be enormously important in trying to understand the cause of the disease, the prognosis, and—especially when surgical options are considered—targets for ther-apy. Although the division between these types of seizures or epileptic syndromes seems clear, there is mounting evi-dence that these phenomena exist on a spectrum with overlapping or at least related mechanisms.
Sources of DataAnimal models, both in vitro and in vivo, provide power-ful techniques to address the biophysical mechanisms that support the seizure (McCormick and Contreras 2001) and have been the mainstay of much of the research in epilepsy. However, both methods possess important qualifications. First, in vitro preparations nec-essarily remove a brain section from its surrounding network. Second, animal models of epilepsy are just that—models. A powerful alternative to animal models of epilepsy is to study spontaneously occurring seizures in vivo from human patients. Although significant work has been done based on electroencephalogram (EEG) record-ings made from the scalp surface of patients with epi-lepsy, even more detail has been derived from intracranial recordings. In some cases of pharmaco-resistant epilepsy (when medications fail to prevent seizures), invasive electrocorticogram (ECoG) recordings are performed. These recordings of voltage activity—directly from the brain’s surface or deep brain regions—provide both high temporal and spatial resolution as well as adequate brain coverage (Fig. 1).
Neuronal Rhythms of SeizuresUnderstanding the vast quantities of voltage data recorded in the ECoG typically requires analysis beyond visual inspection. One technique to characterize these activities is the quantitative assessment of neuronal rhythms that appear during the seizure. Epilepsy is perhaps best char-acterized as a disease of brain rhythms—a paroxysmal cerebral dysrhythmia (Gibbs and others 2002)—and the voltage activity recorded from an ECoG electrode often reveals stereotyped dynamics (e.g., spike-wave complexes during the “absence seizures” of a primary generalized epilepsy). During a typical secondarily gen-eralized seizure (i.e., a seizure that spreads from a focus
to include a large portion of the brain network), there is often a characteristic sequence of neuronal rhythms evolving from low amplitude, fast activity to large ampli-tude, slow activity. The appearance and characterization of these changing neuronal rhythms provide critical information about the different stages of the seizure (Pinto and others 2005; Schiff and others 2005), as we described in detail below.
Characterization of Coupling and NetworksCharacterizing the synchronization—or coupling—between brain areas during seizures is critical for devel-oping a deeper understanding of epilepsy. The synchronization between a few electrode pairs is readily visualized and interpreted. However, for the high- density, multi-electrode recordings of interest here (Fig. 1), complex patterns of network connectivity may emerge whose quantitative understanding requires graph theory and network analysis techniques. In the next section, we
A
B
0.1s
Figure 1. Example ECoG recording. (A) An 8 × 8 electrode grid (1 cm spacing between electrodes) is placed directly on the cortical surface and recordings are made usually for several days or even weeks. The voltage data (B) recorded continuously for multiple days typically exhibit complicated dynamic activity.
at BOSTON UNIV on June 9, 2015nro.sagepub.comDownloaded from

362 The Neuroscientist 18(4)
provide a brief introduction to the growing field of net-works in neuroscience. There already exist many excel-lent and thorough reviews of this subject (Bullmore and Sporns 2009; Sporns 2010; Stam and Reijneveld 2007); our purpose in the next section is simply to familiarize the reader with some terms from network science that will be helpful in understanding the results for seizure networks presented below.
Primer on Network Analysis and Synthetic NetworksStructural versus Functional Networks
The human brain is naturally conceived as a network consisting of two fundamental components: nodes (e.g., individual neurons or brain regions) and edges (e.g., synaptic connections or white matter tracts) that connect node pairs. In neuroscience, “brain networks” (i.e., graphs representing the connectivity of brain compo-nents) are typically divided into two categories: struc-tural networks and functional networks. In structural networks, the edges represent physical connections between nodes (Fig. 2). At the microscopic spatial scale, these include synaptic or gap junctional connections between individual neurons. The only complete brain structural network mapped at this scale is for the 302 neurons of the nematode worm Caenorhabditis elegans (White and others 1986). For the human brain, consist-ing of more than 1010 neurons and 1012 synapses, defin-ing the complete structural network remains intractable. At a coarser spatial scale, noninvasive in vivo neuroim-aging techniques (e.g., magnetic resonance imaging or MRI) can be used to infer the brain’s white matter tracks and construct millimeter scale, macroscopic structural networks in humans (Gong and others 2009; Hagmann and others 2008; Iturria-Medina and others 2007).
In contrast to the anatomically defined structural net-work, functional networks represent the coupling between
dynamic activity recorded from separate brain areas (Fig. 2) (Friston 1994). Different types of multivariate neuro-imaging data, from single neuron recordings to the func-tional magnetic resonance imaging (fMRI) blood oxygen level dependent (BOLD) signal, are used to construct functional networks at different spatial and temporal scales (Sporns 2010). Critical to the establishment of a functional network is the choice of coupling measure, of which there are many options (Pereda and others 2005). An open question, and area of active research, is deter-mining which coupling measures are most appropriate. Different measures exist that focus on linear interactions, nonlinear interactions, wavelet coherence, causality, and many other methods (Pereda and others 2005). Each mea-sure provides a different view of the coupling and requires different processing methods and assumptions (e.g., fil-tering the data in a specific frequency band to extract phase information, or choice of embedding dimension). Recent studies suggest that linear and nonlinear coupling measures perform equally well when applied to macro-scopic voltage data, although subtle changes in the physi-ological state of the brain may require more sophisticated approaches (Ansari-Asl and others 2006; Mormann and others 2005; Osterhage and others 2007).
After selecting a coupling measure for building a func-tional network, additional choices must be made. One of the most important is determining the level of coupling that constitutes an edge. In Figure 2 we connected elec-trode pairs with edges whose coupling measure exceeded a threshold value (e.g., 0.5), and different choices of threshold may result in different networks. For example, a higher threshold choice (e.g., 0.95) results in fewer edges (Fig. 2). No technique yet exists to choose the most appropriate coupling threshold. One approach is to exam-ine the networks produced for a variety of threshold val-ues and seek consistent results (e.g., Kramer and others 2008; Ponten and others 2007).
Another approach to defining coupling threshold is first to apply a statistical hypothesis test to the coupling
Structural network Node dynamics Functional networks
Threshold = 0.5 Threshold = 0.95
Choice of coupling measure & threshold
Figure 2. Structural networks (left) represent physical connections between nodes (e.g., axons or white matter tracks). Here the nodes represent macroscopic brain regions that generate population voltage activity (middle). From the coupling between the node dynamics, functional networks are inferred (right) whose structure depends upon the choice of coupling measure and threshold.
at BOSTON UNIV on June 9, 2015nro.sagepub.comDownloaded from

Kramer and Cash 363
result computed for each electrode pair. Doing so, a P value may be assigned to each edge and these P values thresholded, rather than the original coupling measure value. An advantage of this approach is that multiple comparisons (a P value exists for each electrode pair) may be addressed using sophisticated statistical tech-niques and a measure of network uncertainty deduced, namely the number of spurious edges in the network (Kramer and others 2009). One difficulty of this approach is the development of an appropriate method to assess the statistical significance of a coupling value. For classical linear measures (such as the coherence or cross-correla-tion), analytic techniques exist to determine the statistical significance of the measure, although these typically require specific assumptions about the data (e.g., the asymptotic case of extremely large sample sizes). For modern nonlinear measures, no such analytic methods to assess statistical significance exist. Instead, one might use a bootstrapping procedure; however, bootstrapping techniques are computationally expensive and may not be tractable for large networks.
Linking Structural and Functional Brain NetworksBrain structural and functional networks are intimately related. In general, structural networks constrain func-tional networks—coupled activity between two areas typically requires (direct or indirect) structural connec-tions. But brain dynamics (used to infer the functional networks) modify brain structure, through processes such as spike-timing-dependent plasticity (Rubinov and others 2009). Computational studies have examined the rela-tionship between brain structural and functional net-works (Ponten and others 2010; Zhou and others 2006) and suggested that the structure–function relationship depends on the time scale of activity (Honey and others 2007). At the slow time scale of fMRI and BOLD obser-vations (i.e., on the order of seconds), a general relation-ship exists between brain structural and functional connectivity (Hagmann and others 2008). But the voltage dynamics of the seizure evolve on a much faster time scale, and recent observations suggest that so do the functional networks (Kramer and others 2010). How functional networks inferred at the faster time scale of ECoG voltage recordings relate to structural networks remains incompletely understood.
Definition of Network Measures and Simple Network ModelsMany network models and measures to characterize net-works exist. We outline below the network models and measures used to describe the cortical networks of sei-zure. In doing so we attempt to provide some intuition for
these characterizations, and the interested reader is referred to the literature for many excellent and thorough discussions (e.g., Kolaczyk 2009; Newman 2003; Rubinov and Sporns 2010; Stam and Reijneveld 2007).
Network Measures: Density, Path Length, Clustering CoefficientBrain functional networks are typically complicated structures that require characterization tools beyond visual inspection. Many such tools exist, of which we describe three of the most important. Perhaps the most fundamental network measure is the density—the actual number of edges in the network divided by the number of possible edges. A network with density 0 contains no edges, whereas a density of 1 indicates that all possible edges exist. The path length is the minimum number of edges traversed to travel from one node to another in the network, and the average path length is calculated as the path length between all possible node pairs. Short aver-age path lengths typically suggest fast communication in a network. Finally, the average clustering coefficient measures the number of completed triangles in a net-work. In social networks, clustering is typically high (i.e., near 1); for example, the friends (nearest neighbors) of an individual (the chosen node) also tend to be friends. These three measures of network structure provide sim-ple numeric summaries to characterize complex net-works, consisting of many nodes and edges. There are many additional possible measures that characterize the topology of the network in more detailed and specific fashion (Kolaczyk 2009; Rubinov and Sporns 2010).
Network Models: Regular, Random, and Small-WorldMany different types of model networks exist (Newman 2003). We focus here on three simple models important to understanding the cortical networks in epilepsy (Fig. 3). In a regular network, each node connects to its k near-est neighbors. Regular networks have a mesh-like con-nectivity, resulting in many completed triangles (i.e., high average clustering coefficient) and a large average path length—traveling between nodes requires proceed-ing along the circumference of the circle in Figure 3A. In a traditional random network, node pairs are connected randomly with some probability P. The result is a net-work with low average clustering coefficient (the proba-bility that a node’s “friends” are also friends in a random network is P) and low average path length (because travel is no longer restricted to the circumference in Fig. 3C). Finally, a small-world network possesses high clustering coefficients (like regular networks) and short average path lengths (like random networks) (Bassett and Bullmore 2006; Watts and Strogatz 1998). To construct a
at BOSTON UNIV on June 9, 2015nro.sagepub.comDownloaded from

364 The Neuroscientist 18(4)
small-world network, a small number of edges in a regu-lar network are “rewired.” The modified edges typically serve as shortcuts through the network, allowing quick traversal from one side of the network to the other. Because only a few edges are modified, the clustering coefficient remains large (Fig. 3B). We will see that all three network models can be used to represent different stages of functional network progression during seizures and may characterize ictogenic cortex in general.
Networks That Characterize the Epileptic Brain between SeizuresClassically seizures are thought to represent a hyper-synchronous state (Penfield and Jasper 1954) and epi-lepsy is rudimentarily considered to be a disease of hypersynchronization—a problem of regions and neu-rons connected or communicating too readily. With this baseline idea in mind, several groups have sought evi-dence of pathological network relationships in the resting (i.e., not seizing) brain of patients with epilepsy. Even the healthy brain at rest is expected to show some synchronized activity, typically dominated by low-frequency rhythms. The expectation, however, is that in patients with epilepsy the degree of connectivity will be higher, particularly but not necessarily exclusively in the seizure-onset zone. A variety of different studies suggest that this concept has some validity. In patients with mesial temporal lobe epi-lepsy, for example, fMRI (Zhang and others 2009) and EEG (Bettus and others 2008; Liao and others 2010) studies have indicated that there is increased connectivity in the temporal lobes. In these same studies there was decreased connectivity in frontal and parietal lobes—regions outside of the location of seizure initiation.
Furthermore, abnormal connectivity and network topol-ogy have also been reported, specifically in the δ and θ bands, in patients with focal epilepsy (Horstmann and others 2010; Wilke and others 2010). This later study also reported a more regular network topology, again in the θ band, in patients with epilepsy compared with healthy controls as measured with EEG (Horstmann and others 2010).
This emerging area of translational neuroscience has already begun to deepen our understanding of how epi-lepsy arises and suggests some new pathways for diagno-sis and treatment. For example, it may soon be possible to take a short segment of non-invasive physiological data (EEG or magnetoencephalogram) or imaging data (fMRI or even structural MRI) and make direct inferences about the underlying disease. For example, the development of network analysis techniques may allow researchers to (1) predict that a patient with a single seizure will go on to develop epilepsy or (2) help localize the area of seizure onset in a patient with intractable focal epilepsy.
Recent research points to the feasibility of both approaches. For example, if global synchronization dif-fers between healthy subjects and epilepsy patients in the interictal state (the periods between seizures), these dif-ferences may be present early in the disease and enable an early diagnosis. Indeed, EEG-based measures of func-tional connectivity from children with absence seizures (Rosso and others 2009) and mixed types of idiopathic epi-lepsy (Righi and others 2008) differed from healthy con-trols, suggesting a diagnostic utility of such measures. Similarly, synchronization likelihood analysis of EEG from patients with new-onset seizures could predict later develop-ment of epilepsy, albeit with sensitivity and specificity of 62% and 76%, respectively (Douw and others 2010).
A B C
Regular networkAverage path length ~ 3 Average clustering coe�cient ~ 0.5
Small world networkAverage path length ~ 2.4 Average clustering coe�cient ~ 0.4
Random networkAverage path length ~ 2.2 Average clustering coe�cient ~ 0.15
Figure 3. Examples of three networks structures: regular (A), small-world (B), and random (C). In the regular network, a path between two nodes (green and yellow) is shown in green. For each network, the approximate average path length and clustering coefficient are shown.
at BOSTON UNIV on June 9, 2015nro.sagepub.comDownloaded from
Kramer and Cash 365
These functional network approaches provide new techniques not only for diagnosis but also for localization of seizure-onset areas in focal epilepsy. It is reasonable to expect that ictogenic regions will show some form of increased correlation with other brain areas—a form of hypersynchrony (for review, see Lehnertz and others 2009). Indeed, a variety of different studies using widely different measures of synchrony in the interictal EEG have shown some ability to delineate epileptogenic cor-tex (Arnhold and others 1999; Ben-Jacob and others 2007; Mormann and others 2000; Ortega and others 2008; Schevon and others 2007; Towle and others 1999). Nonetheless, much work is needed to more completely understand which measures of connectivity work best to delineate ictogenic regions and how to incorporate these topological results into clinical determinations.
In summary, a rapidly expanding body of literature has identified differences in functional connectivity between healthy subjects and patients with epilepsy during seizure free intervals. These differences might be seen in patients with generalized epilepsy and those with focal forms of epilepsy, and the differences may be robust enough to be used as a marker of epilepsy and ictal onset areas. This growing body of information is also beginning to illumi-nate why seizures actually arise. What happens in the brain during the seizure itself—namely, its initiation, spread, and termination—is the focus of the next section of this review.
Networks That Characterize the Seizure ItselfSynchronization during the Seizure
From a simplistic perspective, focal seizures can be understood as local events that begin in a circumscribed region. This local activity may then spread, from the central focus outward, through the recruitment of other brain areas in a cascade of activity that includes both pathological and normal brain tissue. Presumably, this spread manifests as increased synchronization through-out the brain network. Mathematical measures now allow a formal characterization of this claim, and recent obser-vations challenge the assertion that seizures are uni-formly hypersynchronous events (Bartolomei and others 2004; Netoff and others 2004; Kramer and others 2010; Truccolo and others 2011). In the next sections, we describe the different seizure stages and how neural rhythms and synchronization evolve during the seizure. To organize our discussion, we focus on three stages of the focal seizure: onset, propagation, and termination. Within each stage, we consider three issues: (1) the types of rhythmic activity observed, (2) the coupling between voltage data recorded from separate spatial locations, and
(3) the types of network structures observed within each stage. As described in detail below, these insights have altered the traditional perspective of the seizure as a purely hypersynchronous state.
Seizure Onset: HFO, Decoupling, and the Axon Plexus
Rhythms. There exist many informal definitions for seizure onset. Perhaps the most obvious manifestation of seizure onset is the emergence of clinical symptoms (e.g., convulsions in tonic–clonic seizures). But more subtle changes in brain voltage activity typically precede this clinical onset. These include rhythmic phenomena, such as the low-amplitude, high-frequency “beta buzz” (near 20 Hz) (Curtis and Gnatkovsky 2009). These rapid dis-charges are associated with the epileptogenic zone, and optimal resection may target these localized sites of high-frequency activity (Alarcon and others 1995). Recently, even faster rhythms have been associated with seizure onset. These include high-frequency oscillations (HFOs) with frequency ranges that typically exceed 100 Hz (Bra-gin and others 1999). Localization of seizure onset, through identification of pathological HFO activity, may also help target the epileptogenic zone critical for seizure resection (Fisher and others 1992; Jirsch and others 2006).
A proposed biological mechanism supporting HFO, of particular relevance to this review, involves a structural network between individual neurons: the axon plexus. The axon plexus is a collection of pyramidal cells with axons connected by gap junctions. To support HFO, rela-tively infrequent spontaneous action potentials propagate across gap junctions between pyramidal cell axons. In this network model, the period of the HFO is determined by the global topological structure of the axon plexus net-work (Traub and Whittington 2010). We note that the bio-logical mechanisms supporting HFO remain under investigation; another possible mechanism—inhibitory interneuron discharges on pyramidal cells (Penttonen and others 1998)—does not depend on the network structure of the axon plexus.
Coupling and networks. Analysis of voltage activity recorded at seizure onset has typically revealed decreases in coupling between brain regions, although not always. Decoupling has been observed in the 80- to 200-Hz fre-quency band among different gyri (although correlated activity appears within a gyrus) (Grenier and others 2001) and during β frequency discharges from patients with mesial temporal lobe epilepsy (Bartolomei and others 2004). In addition, depth electrode recordings of initial fast ictal discharges (60–90 Hz) in patients with partial epilepsy exhibit spatial decorrelations, compared with intervals immediately preceding and following (Wendling and others 2003). Decorrelations also appear
at BOSTON UNIV on June 9, 2015nro.sagepub.comDownloaded from

366 The Neuroscientist 18(4)
immediately at seizure onset in high-frequency bands (80–200 Hz) in depth and strip electrode recordings from patients with complex-partial and secondarily general-ized seizures (Schindler and others 2010). However, other analyses that focused on lower frequency bands have revealed increased correlation at seizure onset. A measure of non-linear coupling, the synchronization like-lihood, increases in the α (8–13 Hz), β (13–30 Hz), and δ (1–4 Hz) frequency bands during the rapid discharges characteristic of seizure onset. The associated functional networks tend to exhibit increased clustering coefficients and path lengths during the rapid discharges compared with interictal intervals (Ponten and others 2007). In addition, cross-correlation analysis of wideband ECoG data from surface and depth electrodes suggests increased correlation (and therefore increased network density) immediately at seizure onset (Kramer and others 2010; Schindler, Leung, and others 2007). The different results may occur for many reasons, including differences in coupling measures, patient populations, recording elec-trodes, definitions of seizure onset, and selection of “nodes” included in the analysis. The observation of decorrelation in high-frequency bands at seizure onset may be interpreted as an initial functional disconnection between distant brain regions, whereas the observation of increased correlation in low-frequency bands at onset may reflect recruitment of brain regions preceding sei-zure spread. Thus the properties of brain functional con-nectivity at seizure onset remain an open area of active research.
Propagation: Ictal Chirps and DecouplingRhythms. Following a focal onset, the pathological
seizure activity spreads throughout the cortical network. At this point, the macroscopic brain voltage dynamics (i.e., as recorded in the ECoG) typically transition from low-amplitude, fast rhythmic activity in spatially focal regions to large-amplitude, slower rhythmic activity
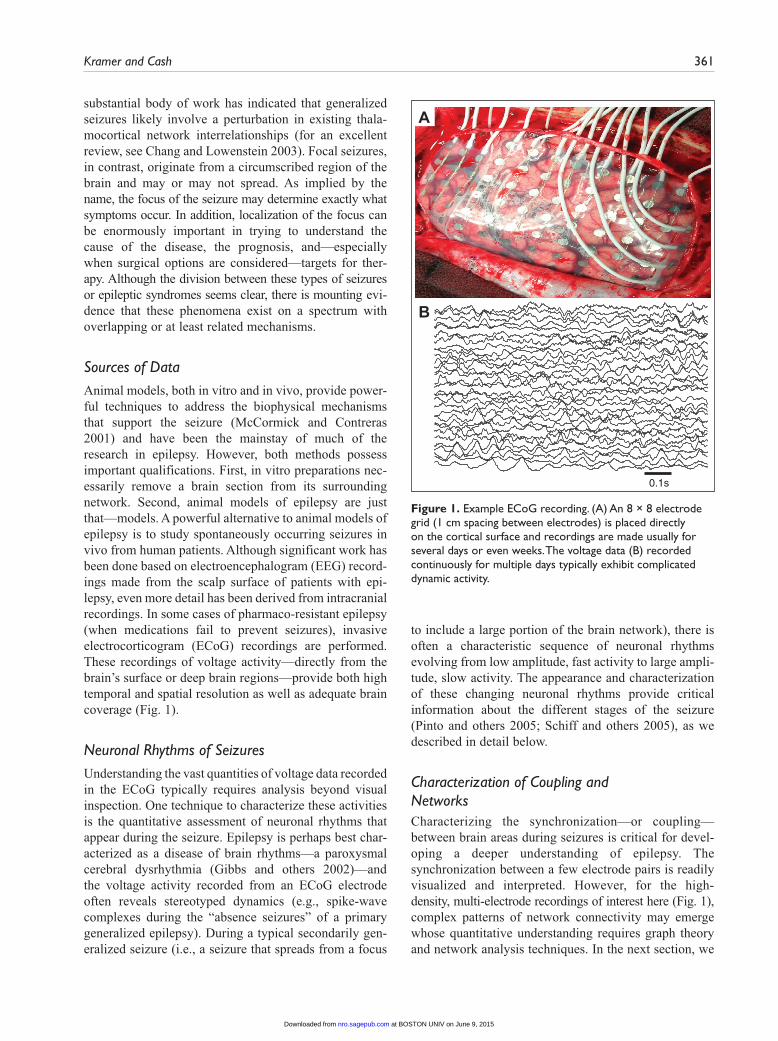
across spatially widespread areas. Different types of widespread rhythmic patterns appear, including spike-wave complexes (Gibbs and others 2002) and voltage rhythms that decrease in frequency with time—the “brain chirp” (Schiff and others 2000)—in generalized seizures (Fig. 4).
In generalized seizures, this rhythmic activity is wide-spread, appearing throughout the brain. The large-amplitude oscillations characteristic of seizure are commonly thought of as “hypersynchronous” events (Schindler, Leung, and others 2007). This may be true at the mesoscopic spatial scale in which the summed postsynaptic activity of many thousands of synapses generates population voltage activity observable in a single EEG electrode (Penfield and Jasper 1954). However, whether hypersynchrony persists at the microscopic scale of individual neurons or larger macro-scopic spatial scales is questionable. Individual neuronal activity during focal seizures in humans seems not to show the highly ordered synchrony that would be expected (Truccolo and others 2011). Furthermore, recent analysis has shown that at the macroscopic spatial scale of ECoG recordings, brain activity decouples, as we now describe.
Coupling and networks. At the macroscopic spatial scale (e.g., in ECoG recordings) the transition from sei-zure onset to propagation may result in a period of decreased (linear) correlation between brain regions (Kramer and others 2010; Schindler and others 2008; Schindler, Leung, and others 2007). This decoupling appears independent of the anatomical location of seizure onset, duration of seizure, and number of recording chan-nels (Schindler, Leung, and others 2007). However other measures of coupling, including phase or amplitude cor-relations (Schiff and others 2005) and the synchroniza-tion likelihood (Ponten and others 2007), remain elevated during the seizure. The elevated synchronization likeli-hood has also been observed in different seizure types and frequency bands, including the 8- to 12-Hz band from patients with nocturnal frontal lobe seizures (Ferri
15
10
5
Freq
uenc
y [H
z]A
B 10s
Figure 4. Example of ictal dynamics. (A) Voltage trace from a single ECoG electrode during seizure. Visual inspection begins to suggest the different dynamic regimes. (B) A time–frequency spectrum of the voltage signal in (A). Warm (cool) colors indicate high (low) amplitude oscillations. As time evolves, the dominant rhythms slow.
at BOSTON UNIV on June 9, 2015nro.sagepub.comDownloaded from

Kramer and Cash 367
and others 2004) and broadband in neonatal patients (Altenburg and others 2003). Again, this apparent incon-sistency in coupling changes during the middle part of seizure may result from many factors, including differ-ences in the coupling measures (e.g., linear versus nonlin-ear) and differences in seizure types.
As coupling of voltage activity changes between brain regions, so too does the functional network structure. Changes in the simplest measure of network structure—the density—follow patterns consistent with some of the coupling results; decreased linear correlation during sei-zure propagation results in sparser functional networks (i.e., network with fewer edges) (Schindler and others 2008), and the dominant connected components fracture into smaller structures (Kramer and others 2010). Measures of more subtle network properties include the average path length (PL) and clustering coefficient (CC). Functional networks (based on correlation measures) suggest that the CC and PL increase during the first half of the seizure and then gradually decrease (Kramer and others 2010; Schindler and others 2008). A nonlinear measure of coupling (synchronization likelihood) also results in functional networks whose CC and PL increase during the seizure (Ponten and others 2007). These results all suggest a shift toward a more regular (less random) network topology during seizure propagation. In addi-tion, the PL and CC permit assessment of the small-world characteristics of the networks. The small-world property has been proposed to become more significant during sei-zure (Ponten and others 2007; Wu and others 2006) but remains controversial (Antiqueira and others 2010; Bialonski and others 2010; Gerhard and others 2011).
The network mechanisms that support seizure propa-gation remain unknown. One proposal, consistent with the decrease in coupling during propagation, is that an initial interval of extremely intense neuronal firing at sei-zure onset saturates “hub” neurons—which maintain many connections to other neurons. When these hub neu-rons shut off, the result is a functional disconnection between local substructures and decreased coupling (Schindler and others 2008). In computational models of seizure (Morgan and Soltesz 2008) and in observations of human seizures (Kramer and others 2008), hubs serve important roles and may perhaps be useful as targets for surgical treatment of epilepsy (Wilke and others 2011). In addition, simulation studies suggest that the pathological organization of seizing activity is supported by small-world topologies (Netoff and others 2004; Percha and others 2005). Although network topology itself influ-ences the neuronal activity, the interaction of network structure and intrinsic neuronal properties is also crucial (Bogaard and others 2009; Dyhrfjeld-Johnsen and others 2007) but remains poorly understood.
Termination: Slow Rhythms and RecouplingRhythms. Like the other stages of the seizure, the
voltage dynamics of seizure termination exhibit charac-teristic behaviors. The first, as mentioned in the previous section, is the slowing of the voltage rhythms (i.e., the brain chirp; Schiff and others 2000) in the approach to seizure termination. The second is the nearly simultane-ous cessation of voltage activity across the brain at termi-nation, as observed in both macroscale ECoG recording and the microscale activity of individual neurons (Fig. 5). Analyses of functional network topologies in the approach to seizure termination are providing additional information.
Coupling and networks. One hypothesis is that in the approach to seizure termination, the coupling of brain activity increases. This has been observed using (linear) measures of cross-correlation in the broadband (Kramer and others 2010; Schindler and others 2008; Schindler, Elger, and others 2007) and high-frequency (80–200 Hz) band (Schindler and others 2010), appeared independent of anatomical location of seizure-onset zone and duration of seizure, and occurred for both partial complex and secondarily generalized seizures (Schindler, Leung, and others 2007). In addition, the non-linear correlation coef-ficient, applied to voltage activity recorded at temporal lobe and thalamus, increased in the approach to seizure termination, and the maximal values of synchrony were observed during the last part of the seizure (Guye and
−0. 5 0 0. 5 1 1.50
20
40
60
80
100
120
140
Time (min)
Neu
ron
rank
ing
Figure 5. Neuronal spike raster recorded in vivo from a human subject during seizure. The neurons (n = 149) are arranged according to increasing mean spike rate. The seizure begins at t = 0 min (solid red line) and ends near t = 1 min. Visual inspection suggests a nearly simultaneous cessation of spiking activity for most neurons at seizure termination. Adapted from Truccolo and others (2011).
at BOSTON UNIV on June 9, 2015nro.sagepub.comDownloaded from

368 The Neuroscientist 18(4)
others 2006). These results are consistent with animal models showing that synchrony progressively increased toward the late seizure stage (Topolnik and others 2003).
This coupling increase affects the functional network structure by increasing the network density (i.e., the num-ber of edges) (Kramer and others 2010; Schindler and others 2008) and supporting the emergence of a giant connected component—the coalescence of the functional network (Kramer and others 2010). More specific measures of the network structure suggest that in the approach to sei-zure termination the PL and CC decrease, and therefore the networks move in the direction of becoming more random (Kramer and others 2010; Schindler and others 2008).
Understanding the mechanisms that end the seizure remains an important goal, and these analyses of coupling and functional network structure at seizure termination are beginning to provide additional clues. An important question to address is whether the increase in synchrony before termination is an epiphenomenon of another pro-cess or an active mechanism for seizure termination. One proposal for seizure termination is that the self-organiza-tion of neuronal activity (as reflected by the increased cou-pling) drives neuronal populations into a hypo-excitable, refractory state (Schindler, Elger, and others 2007). The biophysical mechanisms that may support this transition include the activation of potassium currents across large neuronal networks that overcome hyperpolarization- activated depolarizing currents (Schindler, Elger, and others 2007). The role of deep brain structures, such as the thalamus, in seizures remains an area of active research with some observations from animal models suggesting an important role for the thalamus (Bertram and others 2001), and others not (Timofeev and Steriade 2004). Whether the thalamus, or another deep brain region, serves to mediate coordination between cortical regions and thereby terminate activity remains unknown (Lado and Moshé 2008).
Conclusions and Open QuestionsIn this review we considered the rhythmic activity and func-tional networks observed during seizures and in the interic-tal state. We focused on three stages of seizure—onset, propagation, and termination—and summarized the types of rhythms and functional networks observed in each stage. In general, the rhythmic stages of seizure are fairly well characterized, although new recording modalities have allowed the observation of new phenomena (e.g., high-frequency voltage recordings and HFO). The infer-ence and characterization of functional networks during seizures remain an active area of research; nonetheless, we attempted to summarize some of most common
observations (Fig. 6). These include changes in coupling during the seizure and in particular increased coupling at seizure termination. In terms of network structure, obser-vations suggest that networks acquire larger path lengths and clustering coefficients near the beginning of the sei-zure and that networks become more small-world during seizure propagation and more random at seizure termina-tion. For each stage, we also noted contradicting observa-tions. These discrepancies may exist for many reasons, including differences in the types of coupling measures used (e.g., linear versus nonlinear) and the types of patients analyzed. We hope that future research will help reduce these discrepancies and will further understanding of the functional networks of seizure.
These observations suggest a refinement of the tradi-tional idea that seizures are hypersynchronous events. Although the current analysis of interictal data points to at least some degree of increased coupling between brain regions, particularly within the seizure-onset zone in patients with focal epilepsy, this hypothesis needs substantiation across larger patient groups and situa-tions and will likely lead to a more nuanced conclusion regarding what regions show hypersynchronization at a network level. At the microscopic spatial scale of indi-vidual neurons, some correlated neuronal activity must occur to produce the large-amplitude, macroscopic fields observable in the ECoG during the seizure (although seizure-like activity induced in rat hippocam-pal slices also shows desynchronization of neuronal fir-ing; Netoff and Schiff 2002). However, hypersynchrony at the microscopic spatial scale does not imply corre-lated activity between macroscopic brain regions. In fact, variability in propagation between brain regions may act to decorrelate macroscopic brain activity during the seizure (Schindler, Leung, and others 2007). The results reviewed here and other investigations are begin-ning to reveal more details of the entire scope of interic-tal and ictal activity.
Epilepsy is a disease with many causes and manifesta-tions and one for which many research questions remain. For example, are the network characteristics between and during seizures of different causes the same; in other words, is there a “final common pathway” linking the dif-ferent causes at a mechanistic level? Perhaps the most important remaining issue, and perhaps the most difficult to approach, is how to link these network-level descrip-tions with the vast but still incomplete understanding of seizures and epilepsy at the cellular and subcellular levels. Linking these different spatial scales and intellectual frameworks would provide a comprehensive description of the disease and undoubtedly lead to novel therapeutic interventions.
at BOSTON UNIV on June 9, 2015nro.sagepub.comDownloaded from

Kramer and Cash 369
Declaration of Conflicting Interests
The author(s) declared no potential conflicts of interest with respect to the research, authorship, and/or publication of this article.
FundingThe author(s) disclosed receipt of the following financial sup-port for the research, authorship, and/or publication of this article: M.A.K. holds a Career Award at the Scientific Interface from the Burroughs Wellcome Fund. S.S.C. was supported by funds from the National Institute of Neurological Disorders and Stroke Grant R01 NS062092.
References
Alarcon G, Binnie CD, Elwes RD, Polkey CE. 1995. Power spectrum and intracranial EEG patterns at seizure onset in partial epilepsy. Electroencephalogr Clin Neurophysiol 94(5):326–37.
Altenburg J, Vermeulen RJ, Strijers RLM, Fetter WPF, Stam CJ. 2003. Seizure detection in the neonatal EEG with synchro-nization likelihood. Clin Neurophysiol 114(1):50–5.
Ansari-Asl K, Senhadji L, Bellanger J-J, Wendling F. 2006. Quantitative evaluation of linear and nonlinear methods
characterizing interdependencies between brain signals. Phys Rev E 74(3 pt 1):031916.
Antiqueira L, Rodrigues FA, van Wijk BCM, da F Costa L, Daffertshofer A. 2010. Estimating complex cortical net-works via surface recordings—a critical note. Neuroimage 53(2):439–49.
Arnhold J, Grassberger P, Lehnertz K, Elger C. 1999. A robust method for detecting interdependences: application to intra-cranially recorded EEG. Physica D 134(4):419–30.
Bartolomei F, Wendling F, Régis J, Gavaret M, Guye M, and others. 2004. Pre-ictal synchronicity in limbic networks of mesial temporal lobe epilepsy. Epilepsy Res 61(1-3): 89–104.
Bassett DS, Bullmore E. 2006. Small-world brain networks. Neuroscientist 12(6):512–23.
Ben-Jacob E, Doron I, Gazit T, Rephaeli E, Sagher O, Towle VL. 2007. Mapping and assessment of epileptogenic foci using frequency-entropy templates. Phys Rev E 76(5 pt 1):051903.
Bettus G, Wendling F, Guye M, Valton L, Régis J, Chauvel P, and others. 2008. Enhanced EEG functional connectiv-ity in mesial temporal lobe epilepsy. Epilepsy Res 81(1): 58–68.
Onset Propagation TerminationRhythmic Low amplitude & high frequency
HFOBeta buzz
High amplitude & low frequencyBrain chirp
High amplitude & low frequencySlow rhythm, brain chirp
Network
CC & PL increase(Ponten and other 2007)
Coupling decrease(Schindler and others 2007b;Schindler and others 2008;Kramer and others 2010)
Coupling increase(Altenberg and others 2003;Ferri and others 2004;Schiff and others 2005;Ponten and others 2007)
Coupling increase(Guye and others 2006;Schindler and others 2007a;Schindler and others 2007b;Schindler and others 2008;Kramer and others 2010;Schindler and others 2010)
More small world(Wu and others 2005)(Ponten and others 2007)
Coupling increase(Ponten and others 2007;Schindler and others 2007b;Kramer and others 2010)
Coupling decrease(Grenier and others 2001;Wendling and others 2003;Bartolomei and others 2004;Schindler and others 2010)
Coupling
PL decrease(Schindler and others 2008;Kramer and others 2010)
CC decrease(Schindler and others 2008;Kramer and others 2010)
CC increase(Ponten and other 2007)
PL increase(Ponten and other 2007)
CC & PL increase, then CC & PL decrease(Schindler and others 2008;Kramer and others 2010)
Figure 6. Summary of functional network organization during different seizure stages. Three different stages of seizure—onset, propagation, and termination—are shown with a typical voltage trace during seizure. The characteristics of the rhythms (top row), coupling (middle row), and networks (bottom row) are indicated as observed in each state and with references to the literature. HFO = high-frequency oscillation, CC = clustering coefficient, PL = path length.
at BOSTON UNIV on June 9, 2015nro.sagepub.comDownloaded from

370 The Neuroscientist 18(4)
Bertram EH, Mangan PS, Zhang D, Scott CA, Williamson JM. 2001. The midline thalamus: alterations and a potential role in limbic epilepsy. Epilepsia 42(8):967–78.
Bialonski S, Horstmann M-T, Lehnertz K. 2010. From brain to earth and climate systems: small-world interaction net-works or not? Chaos (Woodbury, NY) 20(1):013134.
Bogaard A, Parent J, Zochowski M, Booth V. 2009. Interac-tion of cellular and network mechanisms in spatiotempo-ral pattern formation in neuronal networks. J Neurosci 29(6):1677–87.
Bragin A, Engel J, Wilson CL, Fried I, Buzsáki G. 1999. High-frequency oscillations in human brain. Hippocampus 9(2):137–42.
Bullmore E, Sporns O. 2009. Complex brain networks: graph theoretical analysis of structural and functional systems. Nat Rev Neurosci 10(3):186–98.
de Curtis M, Gnatkovsky V. 2009. Reevaluating the mecha-nisms of focal ictogenesis: the role of low-voltage fast activity. Epilepsia 50(12):2514–25.
Chang BS, Lowenstein DH. 2003. Epilepsy. N Engl J Med 349(13):1257–66.
Douw L, de Groot M, van Dellen E, Heimans JJ, Ronner HE, and others. 2010. “Functional connectivity” is a sensitive predictor of epilepsy diagnosis after the first seizure. PLoS ONE 5(5):e10839.
Duncan JS, Sander JW, Sisodiya SM, Walker MC. 2006. Adult epilepsy. Lancet 367(9516):1087–100.
Dyhrfjeld-Johnsen J, Santhakumar V, Morgan RJ, Huerta R, Tsimring L, and others. 2007. Topological determinants of epileptogenesis in large-scale structural and functional models of the dentate gyrus derived from experimental data. J Neurophysiol 97(2):1566–87.
Ferri R, Stam CJ, Lanuzza B, Cosentino FII, Elia M, and oth-ers. 2004. Different EEG frequency band synchronization during nocturnal frontal lobe seizures. Clin Neurophysiol 115(5):1202–11.
Fisher RS, Webber WR, Lesser RP, Arroyo S, Uematsu S. 1992. High-frequency EEG activity at the start of seizures. J Clin Neurophysiol 9(3):441–8.
Friston K. 1994. Functional and effective connectivity in neuro-imaging: a synthesis. Hum Brain Mapp 2(1-2):56–78.
Gerhard F, Pipa G, Lima B, Neuenschwander S, Gerstner W. 2011. Extraction of network topology from multi-electrode recordings: is there a small-world effect? Front Comput Neurosci 5:4.
Gibbs F, Gibbs E, Lennox W. 2002. Epilepsy: a paroxysmal cerebral dysrhythmia. Epilepsy Behav 3(4):395–401.
Gong G, He Y, Concha L, Lebel C, Gross DW, Evans AC, and others. 2009. Mapping anatomical connectivity patterns of human cerebral cortex using in vivo diffusion tensor imag-ing tractography. Cereb Cortex 19(3):524–36.
Grenier F, Timofeev I, Steriade M. 2001. Focal synchronization of ripples (80-200 Hz) in neocortex and their neuronal cor-relates. J Neurophysiol 86(4):1884–98.
Guye M, Régis J, Tamura M, Wendling F, McGonigal A, Chauvel P, and others. 2006. The role of corticothalamic coupling in human temporal lobe epilepsy. Brain 129(pt 7):1917–28.
Hagmann P, Cammoun L, Gigandet X, Meuli R, Honey C, Wedeen V, and others. 2008. Mapping the structural core of human cerebral cortex. PLoS Biol 6(7):e159 EP.
Honey CJ, Kötter R, Breakspear M, Sporns O. 2007. Network structure of cerebral cortex shapes functional connec-tivity on multiple time scales. Proc Natl Acad Sci U S A 104(24):10240–5.
Horstmann M-T, Bialonski S, Noennig N, Mai H, Prusseit J, Wellmer J, and others. 2010. State dependent properties of epileptic brain networks: comparative graph-theoretical analyses of simultaneously recorded EEG and MEG. Clin Neurophysiol 121(2):172–85.
Iturria-Medina Y, Canales-Rodríguez EJ, Melie-García L, Valdés-Hernández PA, Martínez-Montes E, Alemán-Gómez Y, and others. 2007. Characterizing brain anatomical con-nections using diffusion weighted MRI and graph theory. Neuroimage 36(3):645–60.
Jirsch JD, Urrestarazu E, LeVan P, Olivier A, Dubeau F, Gotman J. 2006. High-frequency oscillations during human focal seizures. Brain 129(pt 6):1593–608.
Kolaczyk ED. 2009. Statistical Analysis of Network Data: Methods and Models. New York: Springer.
Kramer MA, Eden UT, Cash SS, Kolaczyk ED. 2009. Network inference with confidence from multivariate time series. Phy Rev E 79(6 pt 1):061916.
Kramer MA, Eden UT, Kolaczyk ED, Zepeda R, Eskandar EN, Cash SS. 2010. Coalescence and fragmentation of cortical networks during focal seizures. J Neurosci 30(30):10076–85.
Kramer MA, Kolaczyk ED, Kirsch HE. 2008. Emergent net-work topology at seizure onset in humans. Epilepsy Res 79(2-3):173–86.
Lado FA, Moshé SL. 2008. How do seizures stop? Epilepsia 49(10):1651–64.
Lehnertz K, Bialonski S, Horstmann M-T, Krug D, Rothkegel A, Staniek M, and others. 2009. Synchronization phenom-ena in human epileptic brain networks. J Neurosci Meth 183(1):42–8.
Liao W, Zhang Z, Pan Z, Mantini D, Ding J, Duan X, and oth-ers. 2010. Altered functional connectivity and small-world in mesial temporal lobe epilepsy. PLoS ONE 5(1):e8525.
McCormick DA, Contreras D. 2001. On the cellular and network bases of epileptic seizures. Ann Rev Physiol 63:815–46.
Morgan RJ, Soltesz I. 2008. Nonrandom connectivity of the epi-leptic dentate gyrus predicts a major role for neuronal hubs in seizures. Proc Natl Acad Sci U S A 105(16):6179–84.
Mormann F, Kreuz T, Rieke C, Andrzejak RG, Kraskov A, David P, and others. 2005. On the predictability of epileptic seizures. Clin Neurophysiol 116(3):569–87.
Mormann F, Lehnertz K, David P, Elger C. 2000. Mean phase coherence as a measure for phase synchronization and its
at BOSTON UNIV on June 9, 2015nro.sagepub.comDownloaded from
Kramer and Cash 371
application to the EEG of epilepsy patients. Physica D 144(3-4):358–69.
Netoff TI, Clewley R, Arno S, Keck T, White JA. 2004. Epi-lepsy in small-world networks. J Neurosci 24(37):8075–83.
Netoff TI, Schiff SJ. 2002. Decreased neuronal synchronization during experimental seizures. J Neurosci 22(16):7297–307.
Newman M. 2003. The structure and function of complex net-works. SIAM Rev 45(2):167.
Ortega GJ, de la Prida LM, Sola RG, Pastor J. 2008. Synchro-nization clusters of interictal activity in the lateral temporal cortex of epileptic patients: intraoperative electrocortico-graphic analysis. Epilepsia 49(2):269–80.
Osterhage H, Mormann F, Staniek M. 2007. Measuring syn-chronization in the epileptic brain: a comparison of different approaches. Int J Bifurcat Chaos 17(10):3539-3555.
Penfield W, Jasper H. 1954. Epilepsy and the Functional Anat-omy of the Human Brain. Little Brown.
Penttonen M, Kamondi A, Acsády L, Buzsáki G. 1998. Gamma frequency oscillation in the hippocampus of the rat: intra-cellular analysis in vivo. Eur J Neurosci 10(2):718–28.
Percha B, Dzakpasu R, Zochowski M, Parent J. 2005. Transi-tion from local to global phase synchrony in small world neural network and its possible implications for epilepsy. Phys Rev E 72(3 pt 1):031909.
Pereda E, Quiroga R, Bhattacharya J. 2005. Nonlinear multi-variate analysis of neurophysiological signals. Prog Neuro-biol 77:1-37.
Pinto DJ, Patrick SL, Huang WC, Connors BW. 2005. Initia-tion, propagation, and termination of epileptiform activity in rodent neocortex in vitro involve distinct mechanisms. J Neurosci 25(36):8131–40.
Ponten SC, Bartolomei F, Stam CJ. 2007. Small-world networks and epilepsy: graph theoretical analysis of intracerebrally recorded mesial temporal lobe seizures. Clin Neurophysiol 118(4):918–27.
Ponten SC, Daffertshofer A, Hillebrand A, Stam CJ. 2010. The relationship between structural and functional connectivity: graph theoretical analysis of an EEG neural mass model. Neuroimage 52(3):985–94.
Righi M, Barcaro U, Starita A, Karakonstantaki E, Miche-loyannis S. 2008. Detection of signs of brain dysfunction in epileptic children by recognition of transient changes in the correlation of seizure-free EEG. Brain Topogr 21(1):43–51.
Rosso OA, Mendes A, Rostas JA, Hunter M, Moscato P. 2009. Distinguishing childhood absence epilepsy patients from controls by the analysis of their background brain electrical activity. J Neurosci Meth 177(2):461–8.
Rubinov M, Sporns O. 2010. Complex network measures of brain connectivity: uses and interpretations. Neuroimage 52(3):1059–69.
Rubinov M, Sporns O, van Leeuwen C, Breakspear M. 2009. Symbiotic relationship between brain structure and dynam-ics. BMC Neurosci 10:55.
Schevon CA, Cappell J, Emerson R, Isler J, Grieve P, Good-man R, and others. 2007. Cortical abnormalities in epilepsy revealed by local EEG synchrony. Neuroimage 35(1):140–8.
Schiff SJ, Colella D, Jacyna GM, Hughes E, Creekmore JW, Marshall A, and others. 2000. Brain chirps: spectro-graphic signatures of epileptic seizures. Clin Neurophysiol 111(6):953–8.
Schiff SJ, Sauer T, Kumar R, Weinstein SL. 2005. Neuronal spatiotemporal pattern discrimination: the dynamical evo-lution of seizures. Neuroimage 28(4):1043–55.
Schindler KA, Bialonski S, Horstmann M-T, Elger CE, Lehnertz K. 2008. Evolving functional network proper-ties and synchronizability during human epileptic seizures. Chaos (Woodbury, NY) 18(3):033119.
Schindler K, Amor F, Gast H, Müller M, Stibal A, Mariani L, and others. 2010. Peri-ictal correlation dynamics of high-frequency (80-200 Hz) intracranial EEG. Epilepsy Res 89(1):72–81.
Schindler K, Elger CE, Lehnertz K. 2007. Increasing synchro-nization may promote seizure termination: evidence from status epilepticus. Clin Neurophysiol 118(9):1955–68.
Schindler K, Leung H, Elger CE, Lehnertz K. 2007. Assessing seizure dynamics by analysing the correlation structure of multichannel intracranial EEG. Brain 130(pt 1):65–77.
Sporns O. 2010. Networks of the Brain. Cambridge, MA: MIT Press.
Stam CJ. Reijneveld JC. 2007. Graph theoretical analysis of complex networks in the brain. Nonlinear Biomed Phys 1(1):3.
Timofeev I, Steriade M. 2004. Neocortical seizures: initiation, development and cessation. Neuroscience 123(2):299–336.
Topolnik L, Steriade M, Timofeev I. 2003. Partial cortical deaf-ferentation promotes development of paroxysmal activity. Cereb Cortex 13(8):883–93.
Towle VL, Carder RK, Khorasani L, Lindberg D. 1999. Elec-trocorticographic coherence patterns. J Clin Neurophysiol 16(6):528–47.
Traub RD, Whittington MA. 2010. Cortical Oscillations in Health and Disease. New York: Oxford University Press.
Truccolo W, Donoghue J, Hochberg L, Eskandar E, Madsen J, Anderson W, and others. 2011. Single-neuron dynamics in human focal epilepsy. Nat Neurosci 14(5):635–41.
Watts DJ, Strogatz SH. 1998. Collective dynamics of “small-world” networks. Nature 393(6684):440–2.
Wendling F, Bartolomei F, Bellanger JJ, Bourien J, Chauvel P. 2003. Epileptic fast intracerebral EEG activity: evidence for spatial decorrelation at seizure onset. Brain 126(pt 6):1449–59.
White J, Southgate E, Thomson J, Brenner S. 1986. The struc-ture of the nervous system of the nematode Caenorhabditis elegans. Philos Trans R Soc Lond B Biol Sci 314(1165): 1–340.
Wilke C, van Drongelen W, Kohrman M, He B. 2010. Neocorti-cal seizure foci localization by means of a directed transfer function method. Epilepsia 51(4):564–72.
at BOSTON UNIV on June 9, 2015nro.sagepub.comDownloaded from

372 The Neuroscientist 18(4)
Wilke C, Worrell G, He B. 2011. Graph analysis of epileptogenic networks in human partial epilepsy. Epilepsia 52(1):84–93.
Wu H, Li X, Guan X. 2006. Networking property during epilep-tic seizure with multi-channel EEG recordings. In: Wang J, et al, editors. Lecture Notes in Computer Science. vol 3976. p. 573—578.
Zhang Z, Lu G, Zhong Y, Tan Q, Liao W, Chen Z, and others. 2009. Impaired perceptual networks in temporal lobe epi-lepsy revealed by resting fMRI. J Neurol 256(10):1705–13.
Zhou C, Zemanová L, Zamora G, Hilgetag CC, Kurths, J. 2006. Hierarchical organization unveiled by functional connectivity in complex brain networks. Phys Rev Lett 97(23):238103.
at BOSTON UNIV on June 9, 2015nro.sagepub.comDownloaded from