Embed Size (px)
Citation preview

Epigenetics LabDecember 1, 2008
Goals of today’s lab:
1. Understand the basic molecular techniques used in the lab to study epigenetic silencing in cancer
2. Analyze primary data and draw conclusions3. Design DNA primers for future experiments

Restriction Sensitive SouthernDraw the bands that you would expect of
the following digests.
Lane 1: Normal tissue undigested
Lane 2: Normal tissue digested with RE1
Lane 3: Normal tissue digested with MSRE1
Lane 4: Tumor tissue undigested
Lane 5: Tumor tissue digested with RE1
Lane 6: Tumor tissue digested with MSRE1
1000
900
800
700
600
500
400
300
200
100
1 2 3 4 5 6
CpG Island
0 1000
750 bpRE1 and MSRE1
cut site

Follow up questions to restriction enzyme southern
1. What would you expect the digest of a tumor sample that is 50% methylated to look like?
2. Why is the non-methylation sensitive restriction digest a necessary control?
3. Why is a parent band digest needed?

Sodium Bisulfite Conversion
Write the following sequence after bisulfite conversion:
5’ CATCCGTTACCGTTGGGCTCGAAA 3’1. If unmethylated
2. If methylated
Follow-up question:1. If you wanted to perform PCR in a methylated sensitive manner -
would you do PCR before or after sodium bisulfite conversion? Why?

Primer Design
• Take the following sequence and design a forward (or sense) and reverse (or anti sense) primer to amplify this sequence. Start with the base pair that is underlined and work in the 5’ to 3’ direction. Primers must be between 7- 10 base pairs. Underlining is fine. Make sure you annealing temperatures match.
5’ ACAGATCTGGGTACAACTGACACGGACTTGAC 3’
3’ TGTCTAGACCCATGTTGACTGTGCCTGAACTG 5’
Remember 4 C/G + 2 A/T
QuickTime™ and aTIFF (Uncompressed) decompressor
are needed to see this picture.
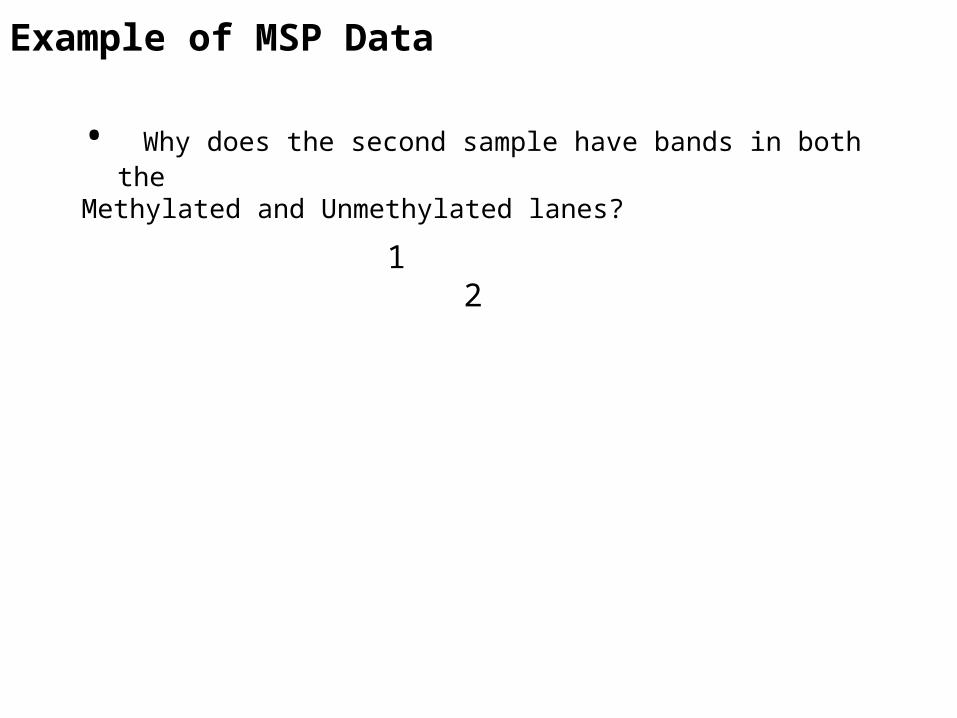
Example of MSP Data
• Why does the second sample have bands in both theMethylated and Unmethylated lanes?
1 2

Assignment Part I: Analyzing MSP Data
• After looking at the MSP data answer the following questions:1. Is this gene methylated in normal tissue (if so, how often)?
2. Is this gene methylated in tumor samples (if so, how often)?
3. Based on the MSP data from Normal/Tumor pairs - would you hypothesize Gene X is a TSG or an oncogene? Why?
4. Why is normal tissue DNA methylation a good control?
QuickTime™ and aTIFF (Uncompressed) decompressor
are needed to see this picture.
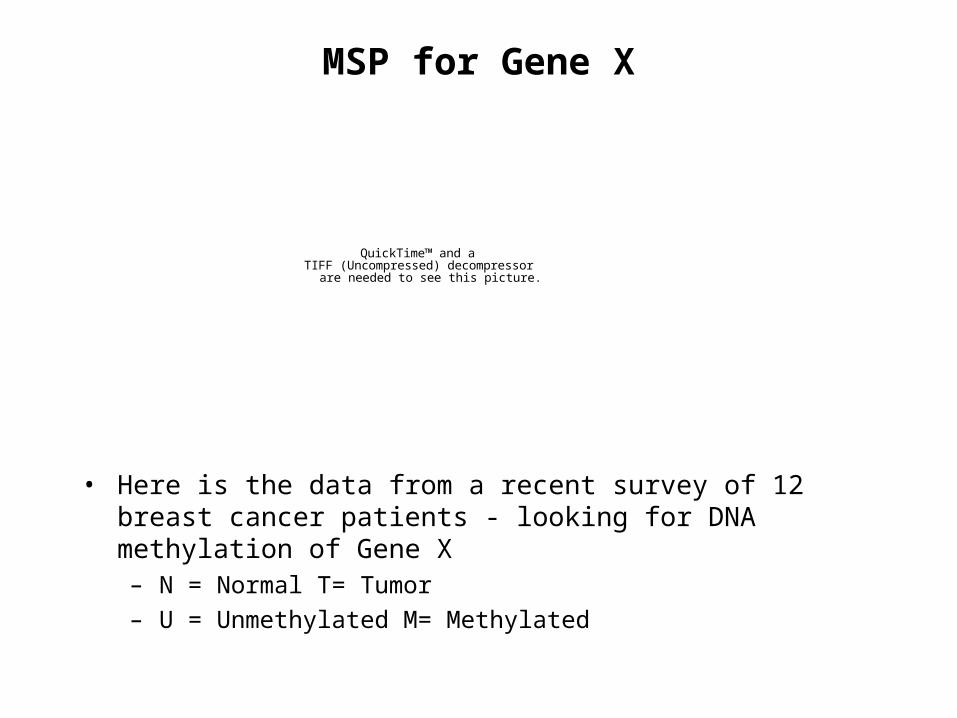
MSP for Gene X
• Here is the data from a recent survey of 12 breast cancer patients - looking for DNA methylation of Gene X– N = Normal T= Tumor
– U = Unmethylated M= Methylated

Create MSP primers
• You have the DNA sequence to the CpG island of a known TSG– To determine the methylation status
of this gene in tumor samples you are planning on using MSP (since you are now an expert)
• You must design MSP primers (both Sense and Anti-sense and Methylated and Unmethylated)

For Homework: Criteria for MSP primers
• Each primer:– Must encompass 3 CpGs– Each primer must be between 20-30 bp– Methylated S and AS primers must have the same
melting temperatures (4 G/C + 2 A/T)– Unmethylated pair must match as well – Account for each unmethylated Cytosines to be
converted into a Uracil (both CpG and C)– Remember you only have the Sense strand of DNA
(you must account for the anti-sense)– Your PCR product should be between 100-300 bp– All primers (S and AS) are written 5’ to 3’– Please write down sequence to primers as well as
underlining on the sequence

CpG island to design MSP primers from:
• Written 5’ to 3’ (remember this is only written single stranded)• 1 CGGGTCCCACCTCGCAGGCCAGCTGGAGGGCGCGATCCTGGCGTCCCCCG
• 53 ACGGCCTGGGGCCCCAATCCAGAGGCCTGGGTGGGAGGGGACCAAGGGT
• 102 GTAGTAAGGAAGCGCCTTTTGCTGGAGGGCAACGGACCGGGGCGGGGAGTC
• 153 GGGAGACCAGAGTGGGAGGAAGGCGGGGAGTCCAGGTTCCGCCCCGGAGCC
• 204 GACTTCCTCCTGGTCGGCGGCTGCAGCGGGGTGAGCGGCGGCAGCGGCCGGG
• 256 GATCCTGGAGCCATGGGGCGCGCGCGCGACGCCATCCTGGATGCGCTGGA
• 306 GAACCTGACCGCCGAGGAGCTCAAGAAGTTCAAGCTGAAGCTGCTGTCGGTG
• 358 CCGCTGCGCGAGGGCTACGGGCGCATCCCGCGGGGCGCGCTGCTGTCCATGGA
• 411 CGCCTTGGACCTCACCGACAAGCTGGTCAGCTTCTACCTGGAGACCTACGGC

• After analyzing the MSP and reverse transcriptase PCR from breast cancer cells lines analyze the following questions
1. Do methylation and gene expression correlate? If so, in what way?
2. Why can’t we just do PCR directly from RNA?
3. Why is ß-actin shown for each sample?
4. Does this data support or refute your conclusions from part I?
Comparing Methylation and Expression Data

QuickTime™ and aTIFF (Uncompressed) decompressor
are needed to see this picture.
MSP for gene X
Reverse Transcriptase PCR for gene X

Analyzing bisulfite sequencing results
• Draw the lollipop figure of DNA methylation status for the following 2 sequences:
Original sequence: 5’ACGTCGCGTCCACCGCGTAAGGTCGCTCGACGATCGTCG 3’
Sequence of clone #1:5’ATGTTGTGTTTATCGCGTAAGGTTGTTTGACGATCGTCG 3’
Sequence of clone #2:5’ ACGTCGCGTTTATCGCGTAAGGTCGTTCGACGATCGTCG 3’

Follow up questions to bisulfite sequencing analysis
1. Which clone #1 or #2 would you hypothesize came from the tumor and which from the normal tissue? Why?
2. If you had an unknown tissue sample and you wanted to know the methylation status of your favorite gene. What technique would you use and why?
3. Which technique to you think would be most suited to look at the effects of epigenetic therapy (DNA methylation inhibitors) on a tumor sample? Why?