Embed Size (px)
Citation preview

M I C H E L L E P L U S Q U I N P A O L O V I N E I S
EXPOSOMICSPILOT RESULTS EPIGENAIR
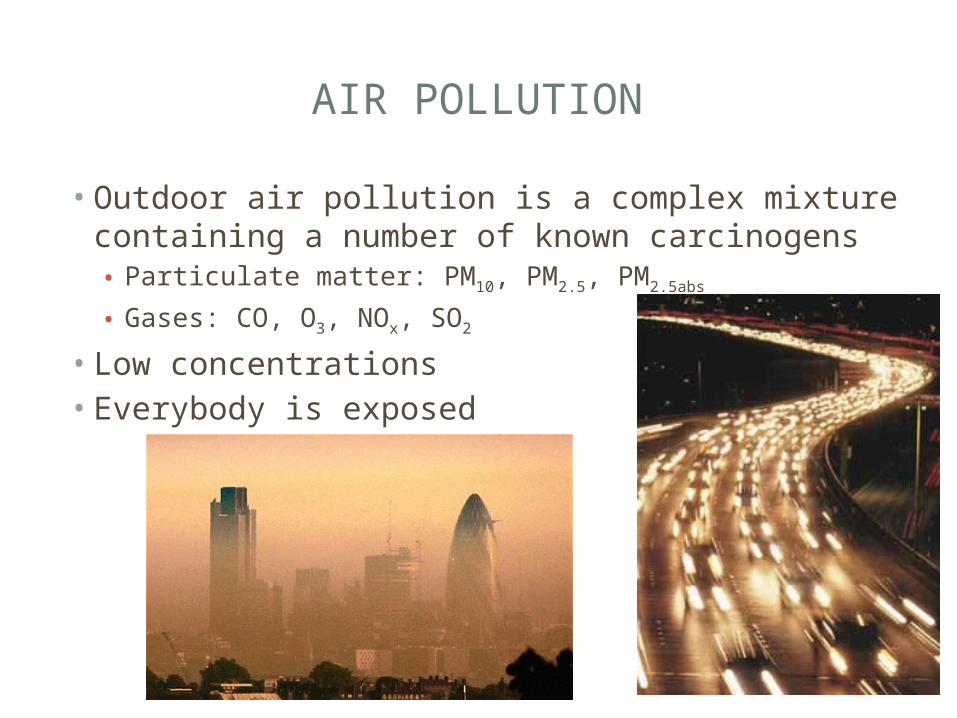
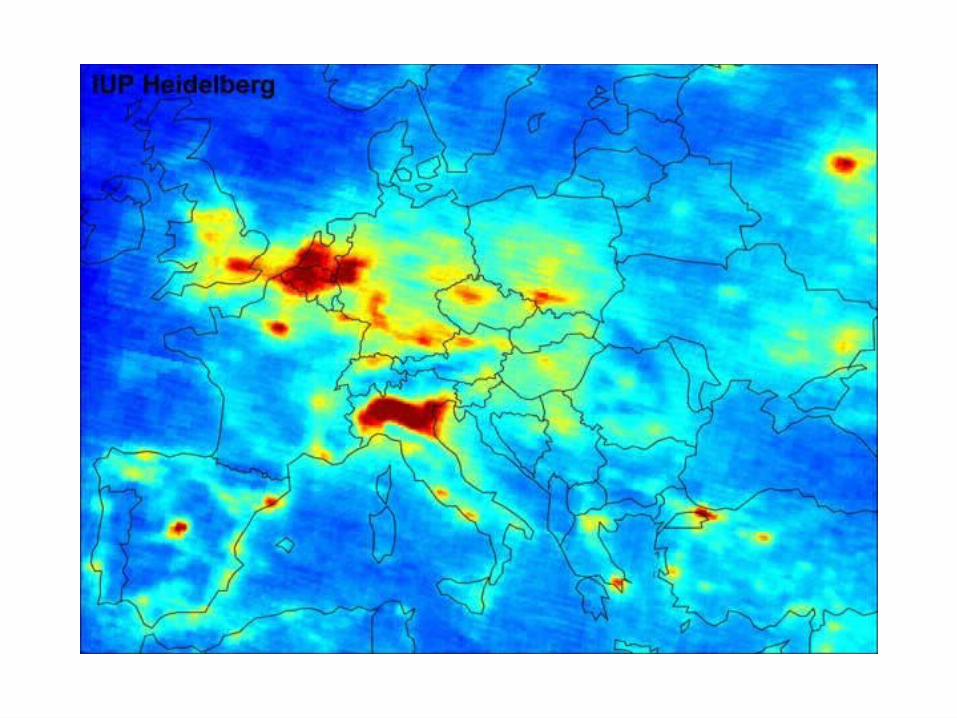
AIR POLLUTION
• Outdoor air pollution is a complex mixture containing a number of known carcinogens• Particulate matter: PM10, PM2.5, PM2.5abs
• Gases: CO, O3, NOx, SO2
• Low concentrations• Everybody is exposed
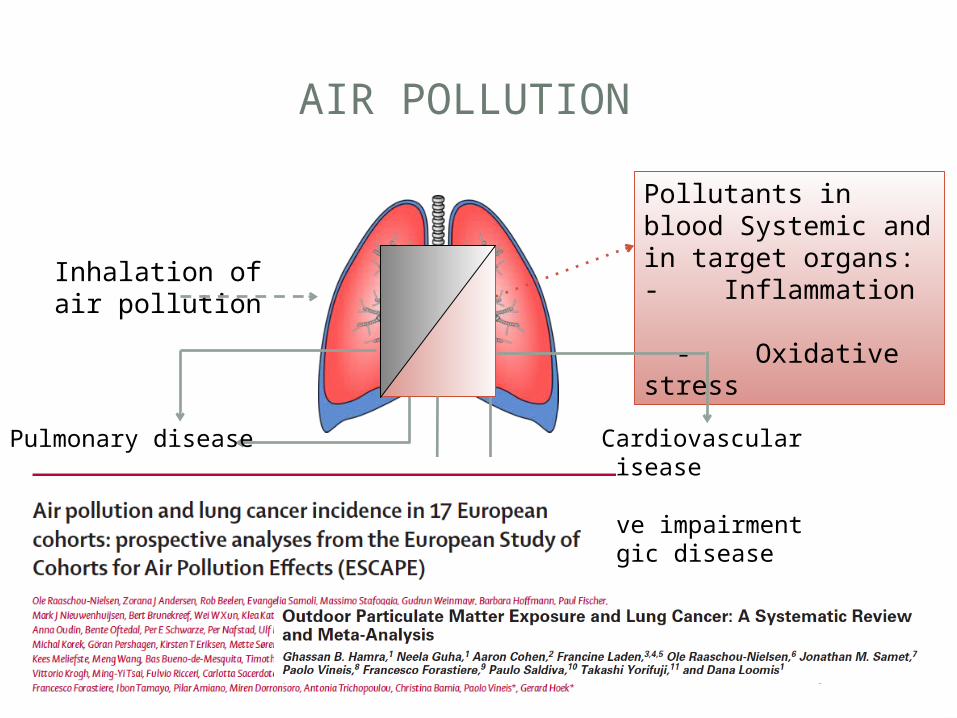
Pulmonary disease
Cognitive impairmentNeurologic disease
AIR POLLUTION Pollutants in blood Systemic and in target organs:- Inflammation - Oxidative stress
Inhalation of air pollution
Cardiovascular disease
Cancer
However, the exact mechanism leading to this reduced risk amongsmokers is still unclear. Thus, more careful consideration of potential interaction between PM and smoking for lung cancer and other diseases seems warranted; large, robust data sets will be needed for this work
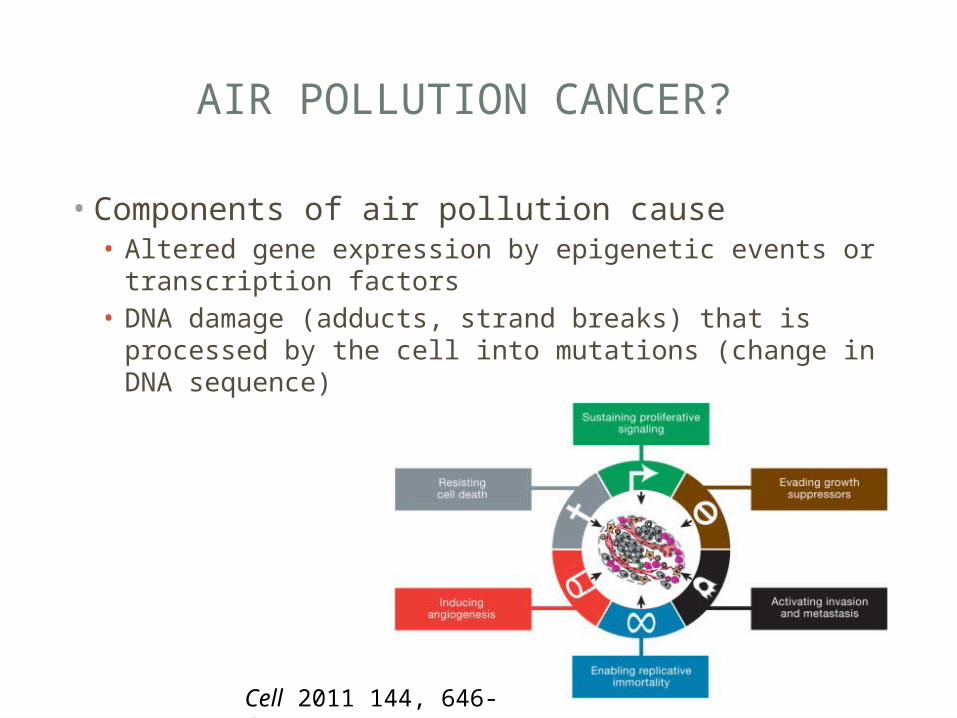
AIR POLLUTION CANCER?
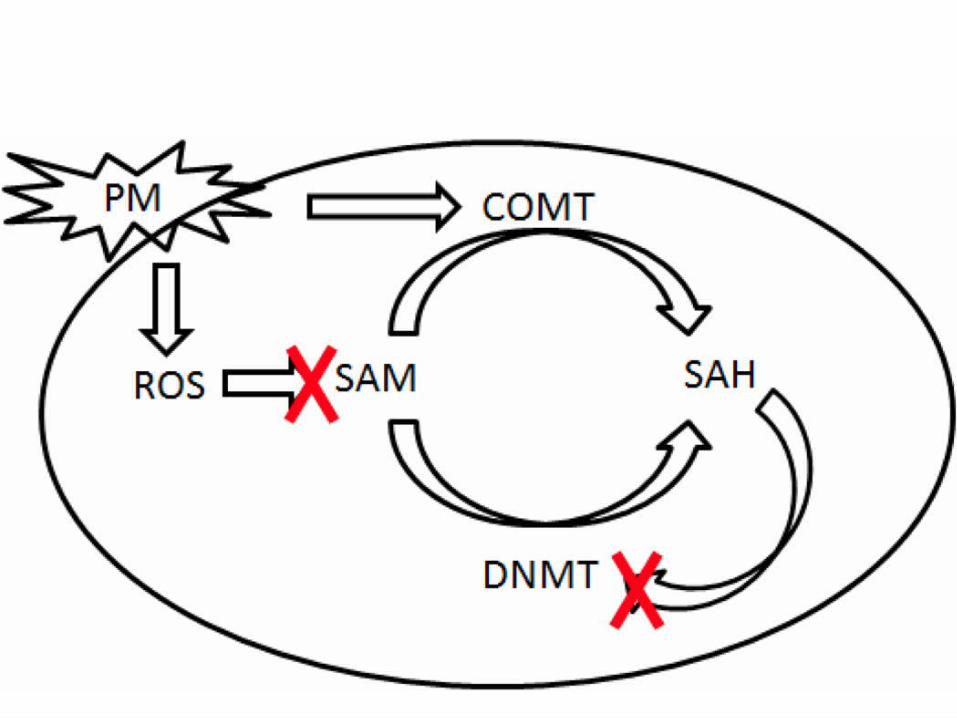
• Components of air pollution cause• Altered gene expression by epigenetic events or
transcription factors• DNA damage (adducts, strand breaks) that is processed
by the cell into mutations (change in DNA sequence)
Cell 2011 144, 646-674
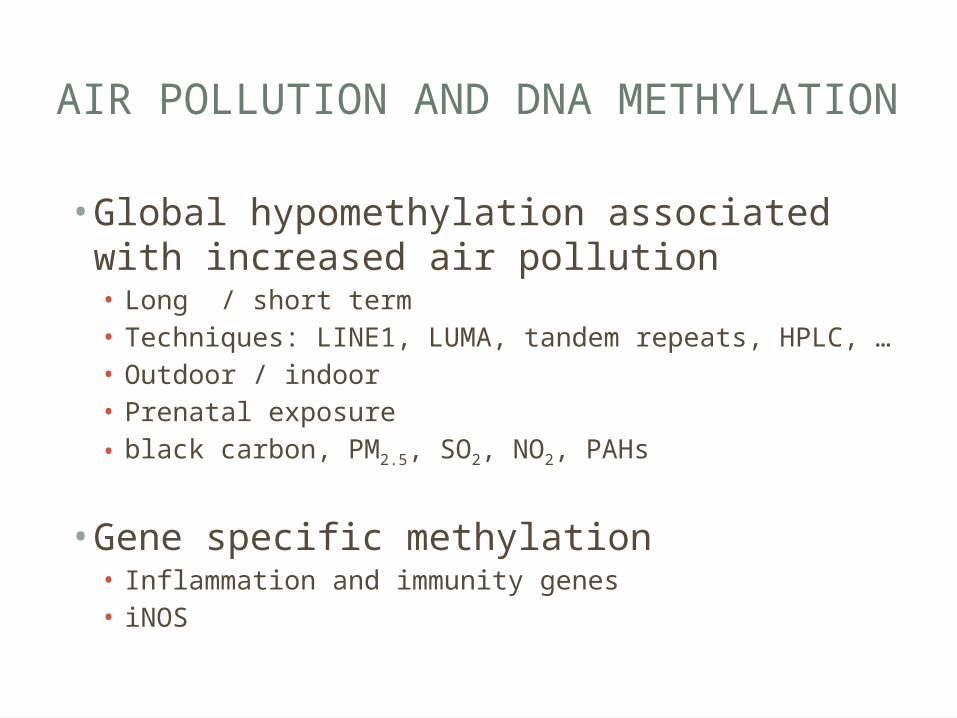
AIR POLLUTION AND DNA METHYLATION
• Global hypomethylation associated with increased air pollution • Long / short term• Techniques: LINE1, LUMA, tandem repeats, HPLC, …• Outdoor / indoor• Prenatal exposure• black carbon, PM2.5, SO2, NO2, PAHs
• Gene specific methylation • Inflammation and immunity genes• iNOS
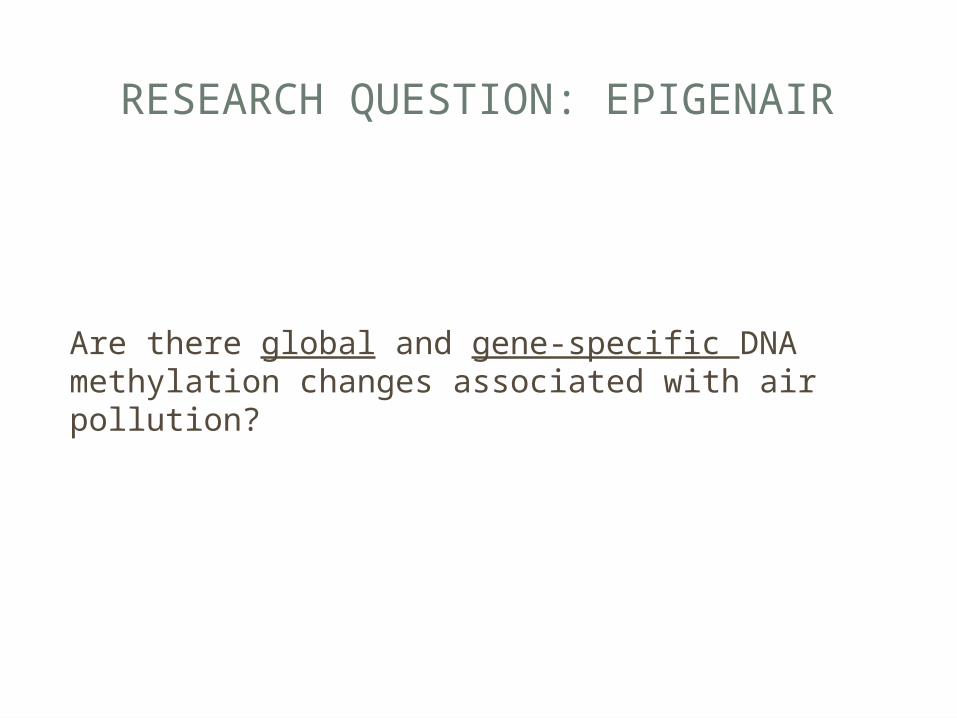
RESEARCH QUESTION: EPIGENAIR
Are there global and gene-specific DNA methylation changes associated with air pollution?
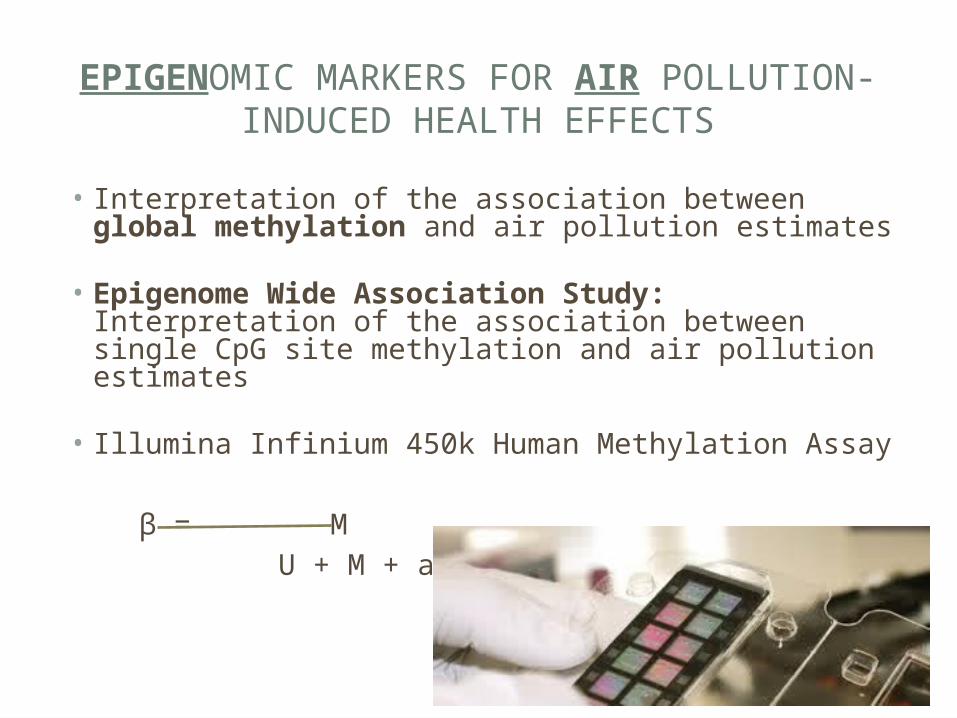
EPIGENOMIC MARKERS FOR AIR POLLUTION-INDUCED HEALTH EFFECTS
• Interpretation of the association between global methylation and air pollution estimates
• Epigenome Wide Association Study: Interpretation of the association between single CpG site methylation and air pollution estimates
• Illumina Infinium 450k Human Methylation Assay β = M U + M + a

METHODS
• Epic Italy, Epic Netherlands, Epic Sweden (EnviroGenomarkers)
• Air pollution data Escape• Pre-processing of array data• Background subtraction• Dye base correction• Remove probes with detection p-values≥0.05• Exclude probes with >20% of samples NA
• Beta-values• Beta-regression adjusted for :
chip, position, gender, age, smoking, being a case• Bonferroni correction
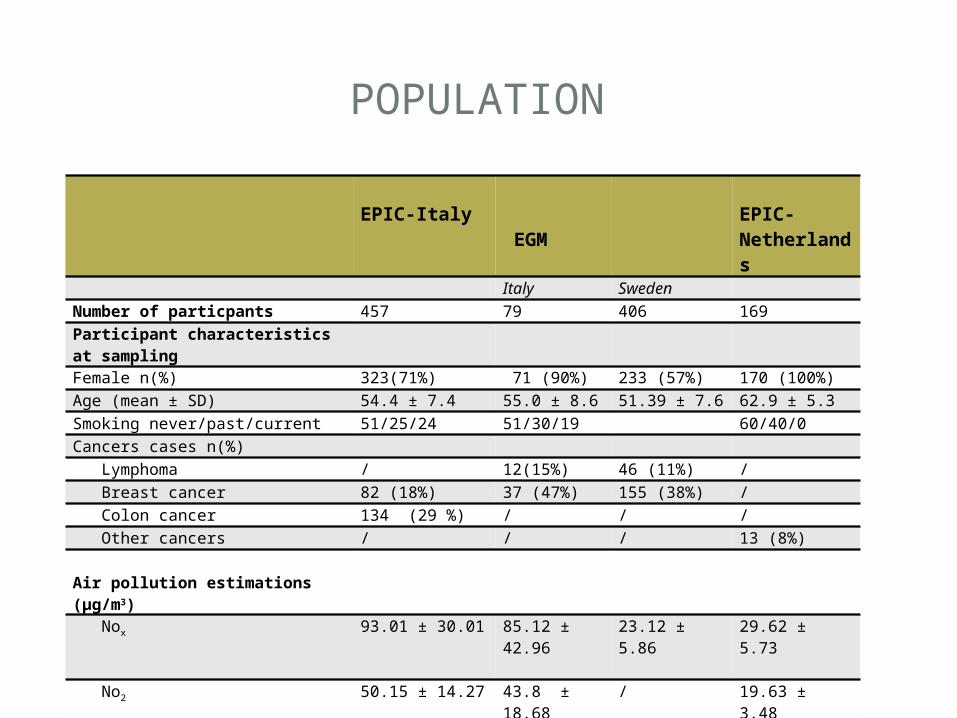
POPULATION
EPIC-Italy EGM
EPIC-Netherlands
Italy Sweden Number of particpants 457 79 406 169Participant characteristicsat sampling
Female n(%) 323(71%) 71 (90%) 233 (57%) 170 (100%)Age (mean ± SD) 54.4 ± 7.4 55.0 ± 8.6 51.39 ± 7.6 62.9 ± 5.3Smoking never/past/current 51/25/24 51/30/19 60/40/0Cancers cases n(%) Lymphoma / 12(15%) 46 (11%) / Breast cancer 82 (18%) 37 (47%) 155 (38%) / Colon cancer 134 (29 %) / / / Other cancers / / / 13 (8%)
Air pollution estimations (μg/m3)
Nox 93.01 ± 30.01 85.12 ± 42.96
23.12 ± 5.86
29.62 ± 5.73
No2 50.15 ± 14.27 43.8 ± 18.68
/ 19.63 ± 3.48
PM2.5 46.99 ± 4.59 24.48 ± 0.68 PM10 30.10 ± 1.98 16.62 ± 0.39 PM2.5absorbance 3.10 ± 0.44 1.04 ± 0.33 PMcoarse 16.8 ± 2.99 1.19 ±0.13
1ST RESEARCH QUESTION
Does air pollution cause a change in global DNA methylation?
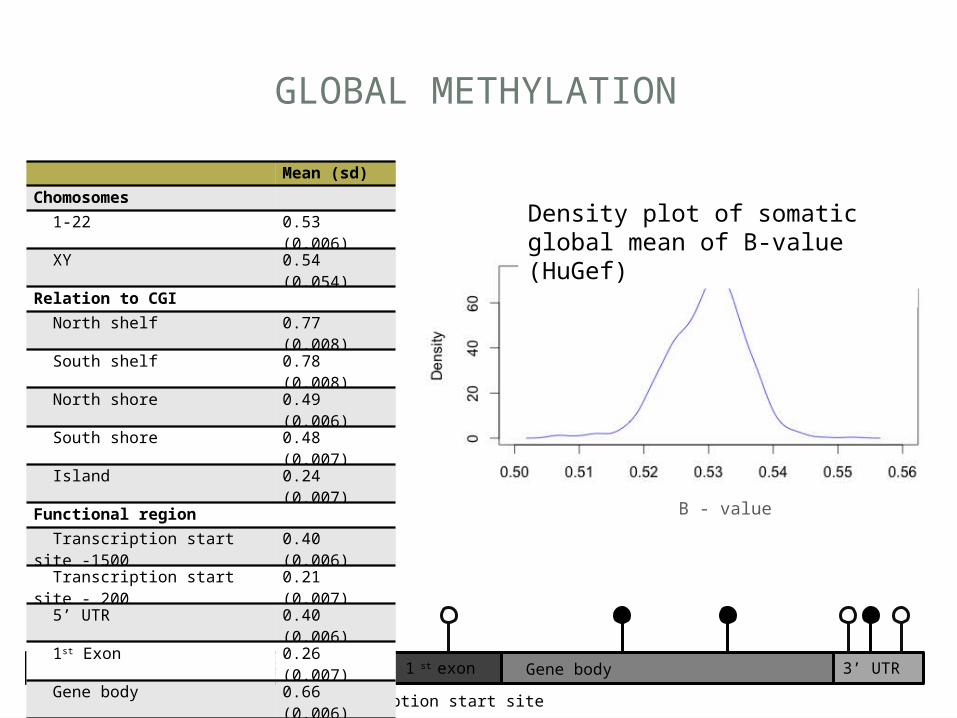
Density plot of somatic global mean of B-value (HuGef)
B - value
Transcription start siteTSS 1500 TSS 200 5’ UTR 1 st exon Gene body 3’ UTR
Mean (sd)Chomosomes 1-22 0.53 (0.006) XY 0.54 (0.054)Relation to CGI North shelf 0.77 (0.008) South shelf 0.78 (0.008) North shore 0.49 (0.006) South shore 0.48 (0.007) Island 0.24 (0.007)Functional region Transcription start site -1500
0.40 (0.006)
Transcription start site - 200
0.21 (0.007)
5’ UTR 0.40 (0.006) 1st Exon 0.26 (0.007) Gene body 0.66 (0.006) 3’ UTR 0.76
(0.008)
GLOBAL METHYLATION
Region Beta coefficient ± standard error
Crude p-value (* *Bonferroni
treshold < 0.0038)
Somatic chromosomes -6.43 e-5 ± 3.54 e-5 0.07Sex chromosomes -3.00 e-4 ± 7.17 e-5 <0.001**
North shelf -4.05 e-5 ± 5.42 e-5 0.45South shelf -3.54 e-5 ± 5.61 e-5 0.53North shore -1.00 e-4 ± 3.38 e-5 0.0030**South shore -1.06 e-4 ± 3.39 e-5 0.0018**
Island -1.40 e-4 ± 4.32 e-5 0.0011**
Transcription start site - 1500 -1.11 e-4 ± 3.70 e-5 0.0027**Transcription start site - 200 -1.60 e-4 ± 5.67 e-5 0.0049*
5’ UTR -1.40 e-4 ± 4.84 e-5 0.0039*1st Exon -9.54 e-5 ± 3.84 e-5 0.0129*
Gene body -5.45 e-5 ± 3.49 e-5 0.123’ UTR -5.76 e-5 ± 4.90 e-5 0.24
Transcription start site
TSS 1500 TSS 200 5’ UTR 1 st exon Gene body 3’ UTR
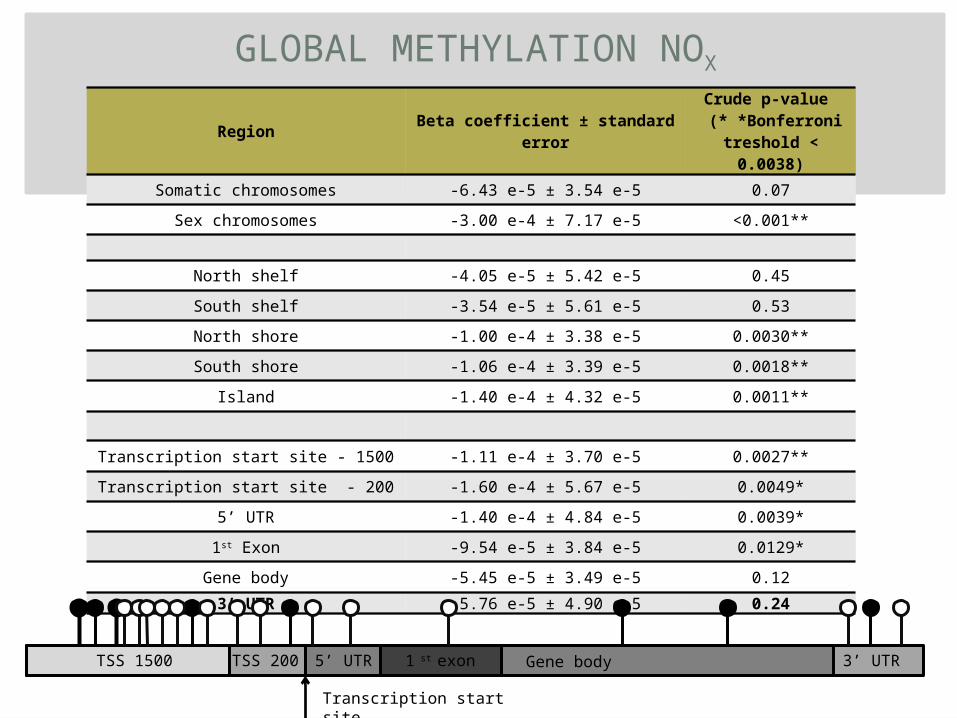
GLOBAL METHYLATION NOX
Region Beta coefficient ± standard error
Crude p-value (* Bonferroni
treshold < 0.0038)
Somatic chromosomes -3.03 e-4 ± 9.86 e-5 0.0022**Sex chromosomes -3.46 e-4 ± 2.46 e-4 0.15
North shelf -3.50 e-4 ± 1.65 e-4 0.0338*South shelf -3.68 e-4 ± 1.72 e-4 0.0326*North shore -3.28 e-4 ± 9.81 e-5 0.0008**South shore -3.11 e-4 ± 9.78 e-5 0.0015**
Island -3.01 e-4 ± 1.20 e-4 0.0125*
Transcription start site - 1500 -3.47 e-4 ± 1.05 e-4 0.0009*Transcription start site - 200 -4.52 e-4 ± 1.38 e-4 0.0011**
5’ UTR -3.39 e-4 ± 1.55 e-4 0.0286*1st Exon -3.23 e-4 ± 1.07 e-4 0.0024**
Gene body -2.70 e-4 ± 1.04 e-4 0.0095*3’ UTR -3.97 e-4 ± 1.24 e-4 0.0013*
Transcription start site
TSS 1500 TSS 200 5’ UTR 1 st exon Gene body 3’ UTR
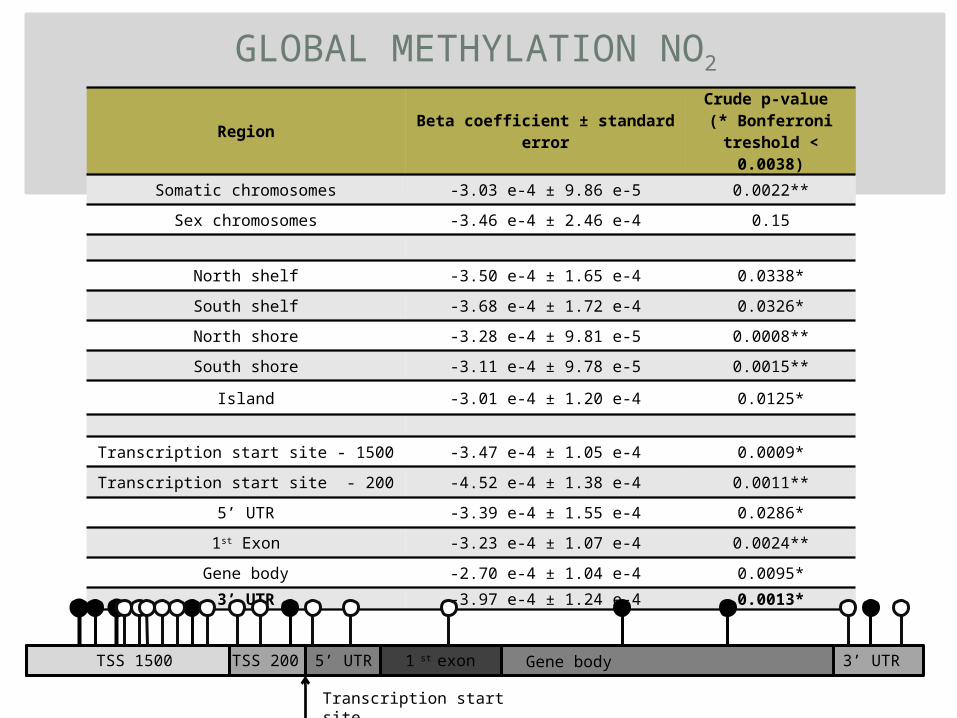
GLOBAL METHYLATION NO2

Region Beta coefficient ± standard error
Crude p-value (* Bonferroni
treshold < 0.0038)
Somatic chromosomes -4.88 e-4 ± 9.6 e-4 0.61Sex chromosomes 2.18 e-03 ± 2.4 e-3 0.36
North shelf -3.90 e-4 ± 1.6 e-3 0.81South shelf -3.76 e-4 ± 1.7 e-3 0.82North shore 1.69 e-4 ± 9.2 e-4 0.85South shore 2.29e-4 ± 9.2 e-4 0.80
Island 2.10 e-4 ± 1.1 e-3 0.85
Transcription start site - 1500 -1.52 e-4 ± 9.9 e-4 0.88Transcription start site - 200 -3.41 e-5 ± 1.3 e-3 0.98
5’ UTR -3.40 e-4 ± 1.0 e-3 0.741st Exon -5.29 e-05 ± 1.1 e-3 0.96
Gene body -2.54 e-4 ± 1.0 e-3 0.803’ UTR -6.94 e-4 ± 1.5 e-3 0.65
Transcription start site
TSS 1500 TSS 200 5’ UTR 1 st exon Gene body 3’ UTR
GLOBAL METHYLATION PM2.5

Region Beta coefficient ± standard error
Crude p-value (* Bonferroni
treshold < 0.0038)
Somatic chromosomes 2.60 e-4 ± 4.15 e-4 0.53Sex chromosomes 2.51 e-3 ± 1.03 e-3 0.0146
North shelf 3.49 e-4 ± 6.88 e-4 0.61South shelf 3.60 e-4 ± 7.18 e-4 0.62North shore 4.32 e-4 ± 3.98 e-4 0.28South shore 4.71 e-4 ± 3.97 e-4 0.23
Island 4.71 e-4 ± 4.89 e-4 0.34
Transcription start site - 1500 4.69 e-4 ± 4.31 e-4 0.28Transcription start site - 200 5.55 e-4 ± 5.69 e-4 0.33
5’ UTR 2.96 e-4 ± 6.56 e-4 0.651st Exon 4.90 e-4 ± 5.08 e-4 0.33
Gene body 3.04 e-4 ± 4.36 e-4 0.493’ UTR 3.75 e-4 ± 4.48 e-4 0.40
Transcription start site
TSS 1500 TSS 200 5’ UTR 1 st exon Gene body 3’ UTR
GLOBAL METHYLATION PM10
Region Beta coefficient ± standard error
Crude p-value (* Bonferroni
treshold < 0.0038)
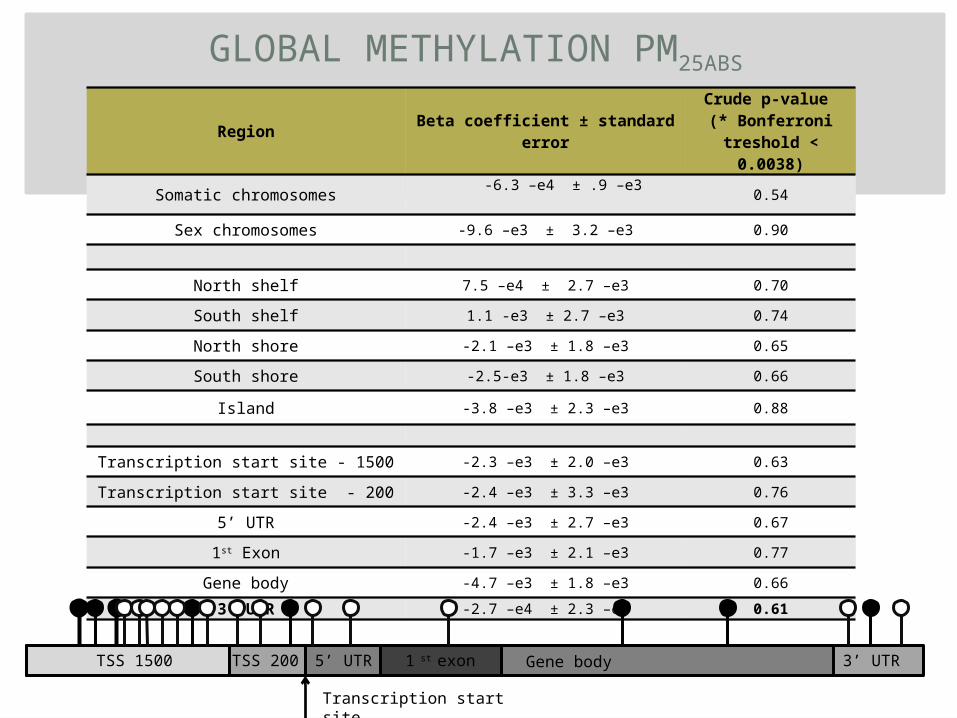
Somatic chromosomes -6.3 –e4 ± .9 –e3 0.54
Sex chromosomes -9.6 –e3 ± 3.2 –e3 0.90
North shelf 7.5 –e4 ± 2.7 –e3 0.70South shelf 1.1 -e3 ± 2.7 –e3 0.74North shore -2.1 –e3 ± 1.8 –e3 0.65South shore -2.5-e3 ± 1.8 –e3 0.66
Island -3.8 –e3 ± 2.3 –e3 0.88
Transcription start site - 1500 -2.3 –e3 ± 2.0 –e3 0.63Transcription start site - 200 -2.4 –e3 ± 3.3 –e3 0.76
5’ UTR -2.4 –e3 ± 2.7 –e3 0.671st Exon -1.7 –e3 ± 2.1 –e3 0.77
Gene body -4.7 –e3 ± 1.8 –e3 0.663’ UTR -2.7 –e4 ± 2.3 –e3 0.61
Transcription start site
TSS 1500 TSS 200 5’ UTR 1 st exon Gene body 3’ UTR
GLOBAL METHYLATION PM25ABS

NOx NO2
SPARSE PARTIAL LEAST SQUARES
Variable
-> to be studied further
2ND QUESTION
Does air pollution cause a change in overall DNA methylation?
NOx – NO2 : global hypomethylationPM : not hypomethylation (with current
techniques) -> Progress study with cluster
techniques
Can we identify CpG’s that are associated with air pollution?
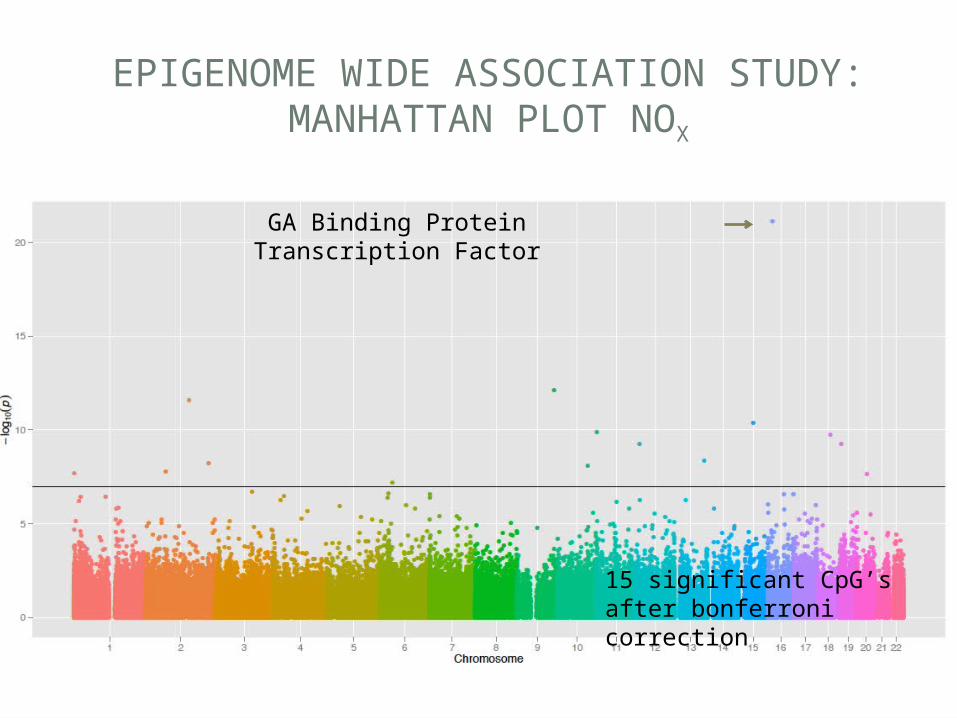
EPIGENOME WIDE ASSOCIATION STUDY:MANHATTAN PLOT NOX
GA Binding Protein Transcription Factor
15 significant CpG’safter bonferroni correction
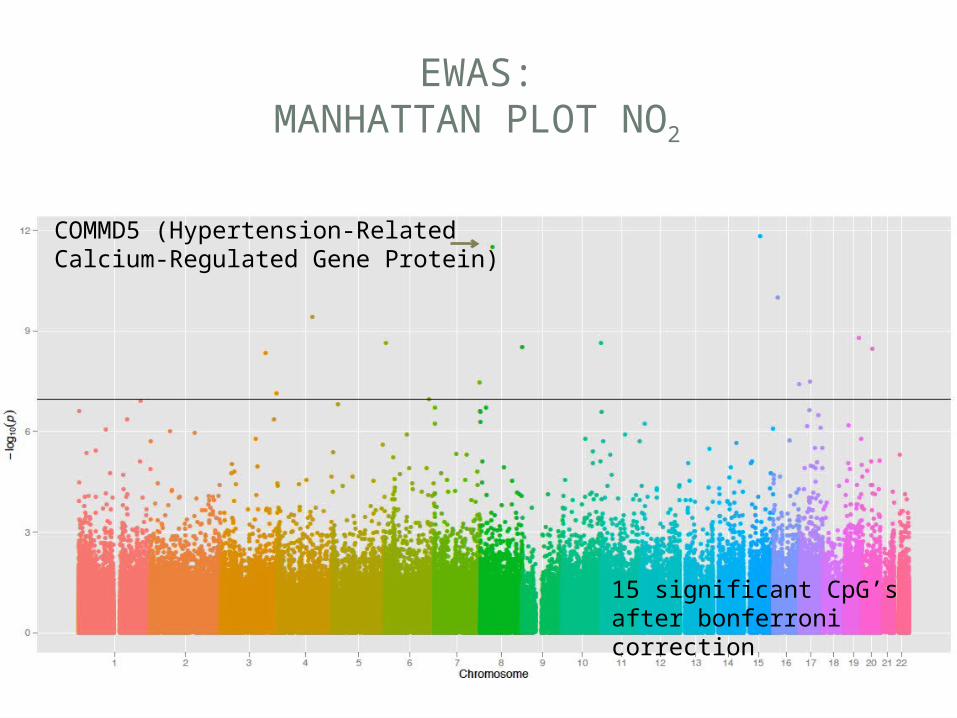
EWAS:MANHATTAN PLOT NO2
COMMD5 (Hypertension-Related Calcium-Regulated Gene Protein)
15 significant CpG’safter bonferroni correction
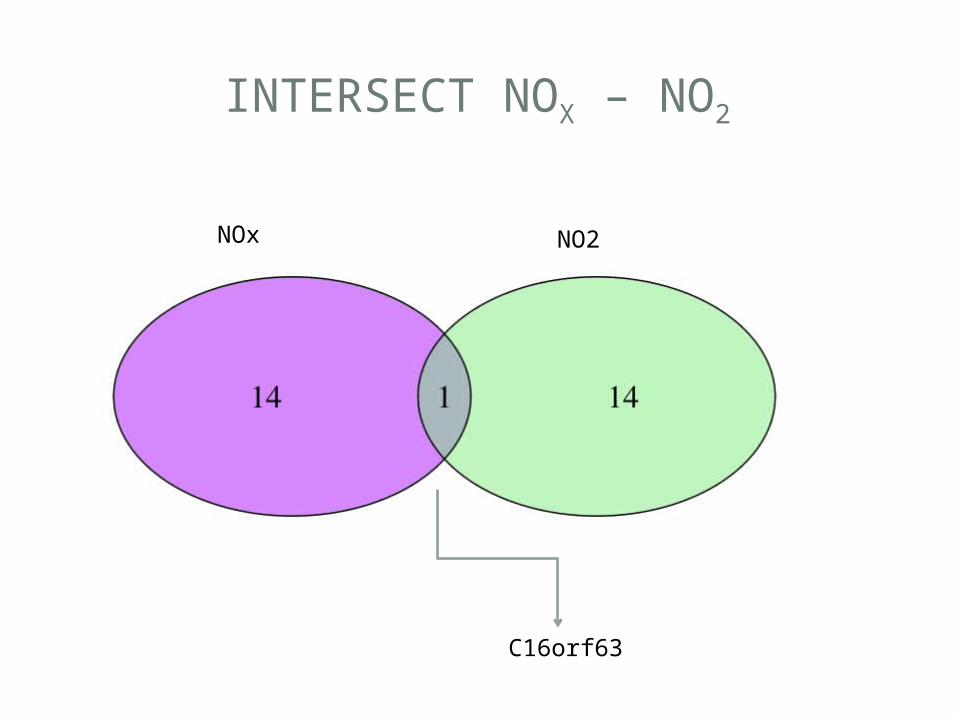
INTERSECT NOX – NO2
C16orf63
NOx NO2
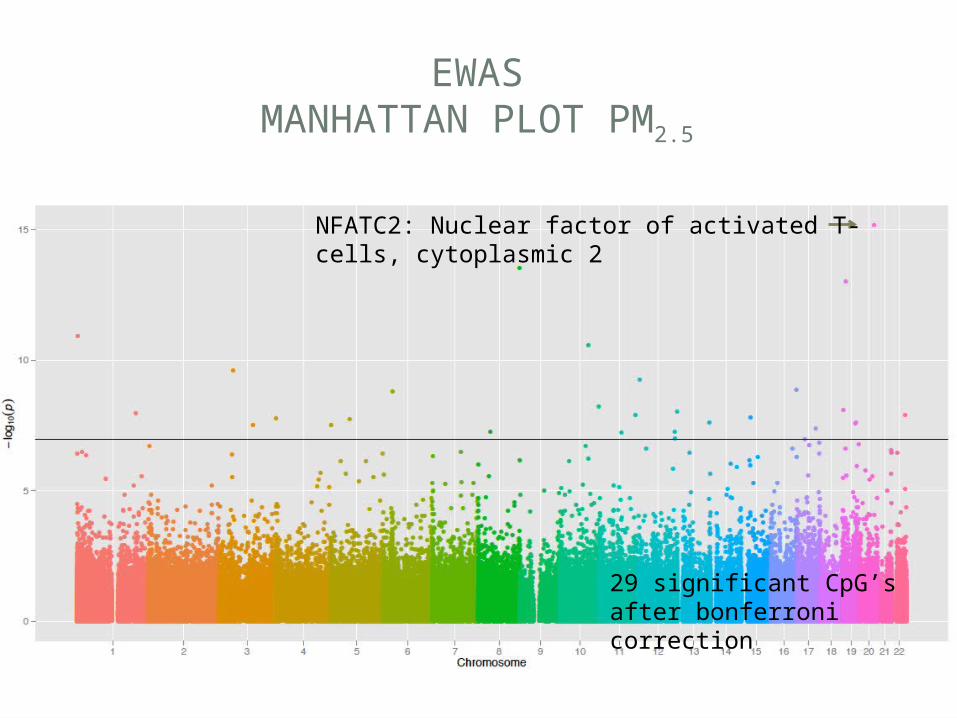
EWASMANHATTAN PLOT PM2.5
29 significant CpG’safter bonferroni correction
NFATC2: Nuclear factor of activated T-cells, cytoplasmic 2
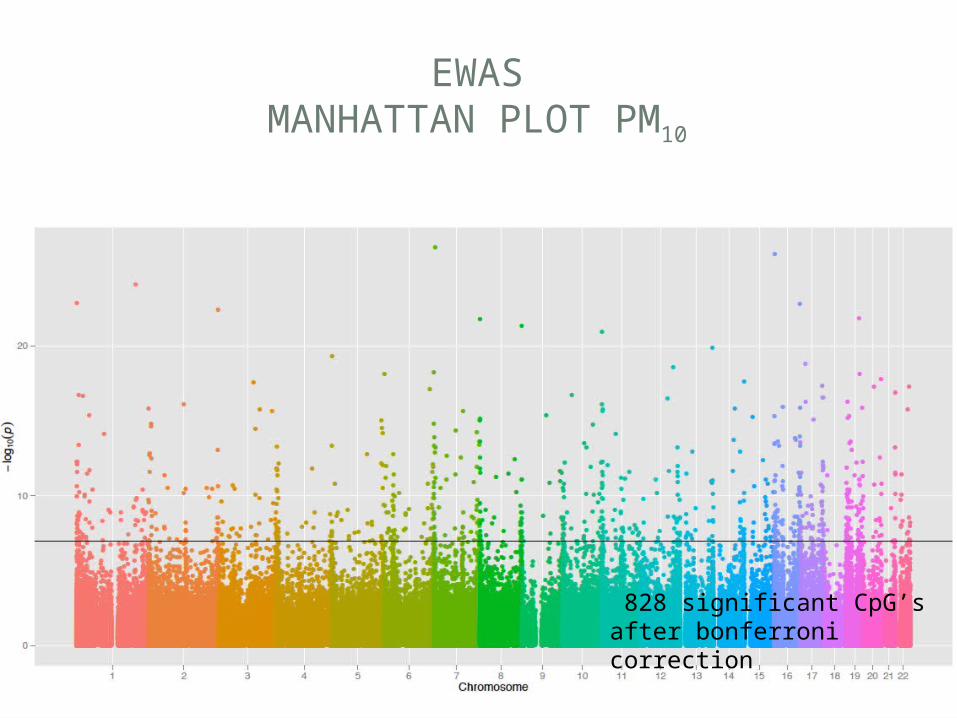
EWASMANHATTAN PLOT PM10
828 significant CpG’safter bonferroni correction
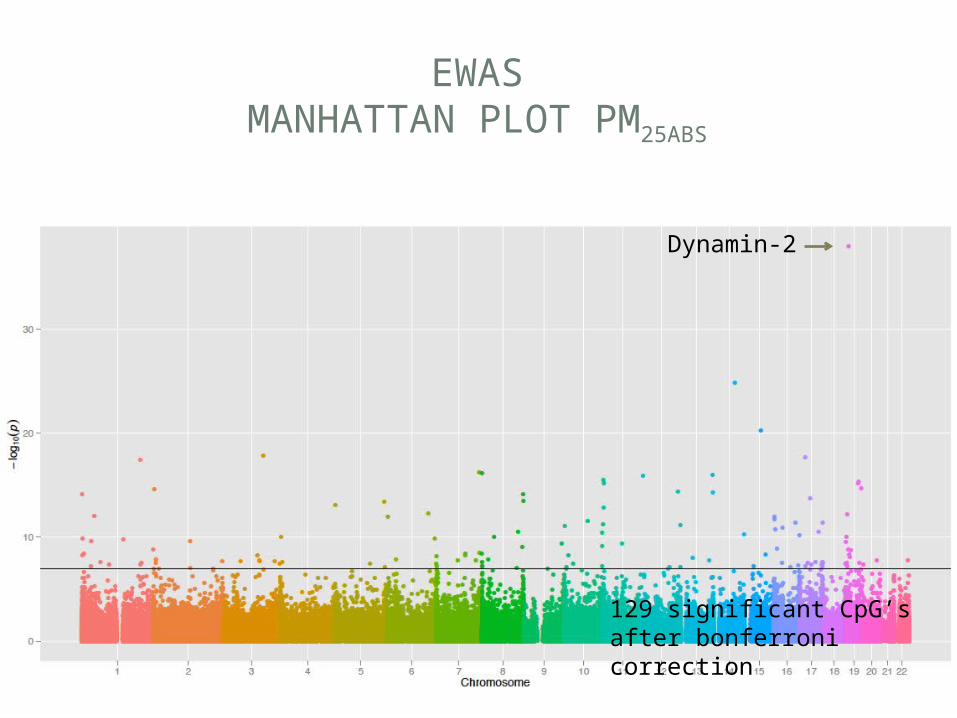
EWASMANHATTAN PLOT PM25ABS
Dynamin-2
129 significant CpG’safter bonferroni correction
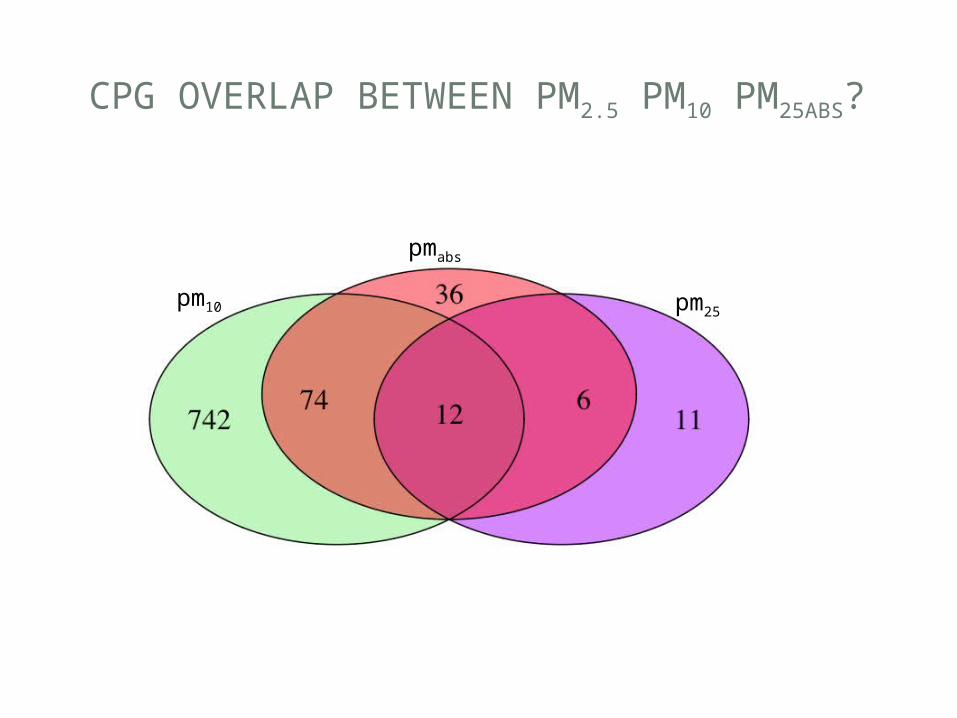
CPG OVERLAP BETWEEN PM2.5 PM10 PM25ABS?
pm10 pm25
pmabs

CPG OVERLAP BETWEEN PM2.5 PM10 PM25ABS
IlmnID CHR MAPINFO Abbreviation Name Group Relation_to_CGIcg21167817 1 3277557 PRDM16 PR Domain Containing 16 Body S_Shelf
cg20382344 1 204587945 LRRN2Leucine-rich repeat neuronal
protein 2 Body /
cg11337598 3 119121088 CDGAPCDC42 GTPase-activating
protein Body Island
cg17276794 5 1474048 LPCAT1Lysophosphatidylcholine
Acyltransferase Body /
cg10366851 10 131406630 MGMTO-6-Methylguanine-DNA
Methyltransferase Body /
cg17211612 12 124330647 DNAH10Dynein, Axonemal, Heavy
Chain 10 Body /
cg00124836 13 111295144 CARS2cysteinyl-tRNA synthetase 2,
mitochondrial Body S_Shore
cg05058069 16 88091975 BANPScaffold/Matrix-Associated
Region-1-Binding Protein Body /cg19927510 19 10829071 DNM2 Dynamin 2 1stExon Islandcg08337835 19 43918868 TEX101 testis expressed 101 TSS200 Island
cg02359773 19 46307846 RSPH6ARadial Spoke Head-Like
Protein Body Islandcg10346758 22 47097389 CERK Ceramide Kinase Body Island

3RD QUESTION
Does air pollution cause a change in overall DNA methylation? NOx – NO2 -> global hypomethylationPM –> no global hypomethylation
Can we identify CpG’s that are associated with air pollution?Yes, several from different classes:immune system, cardiovascular, housekeeping, genes, cell division genes
Are genes related to tumor development involved?

ONCOGENES AND TUMOR SUPPRESSOR GENES
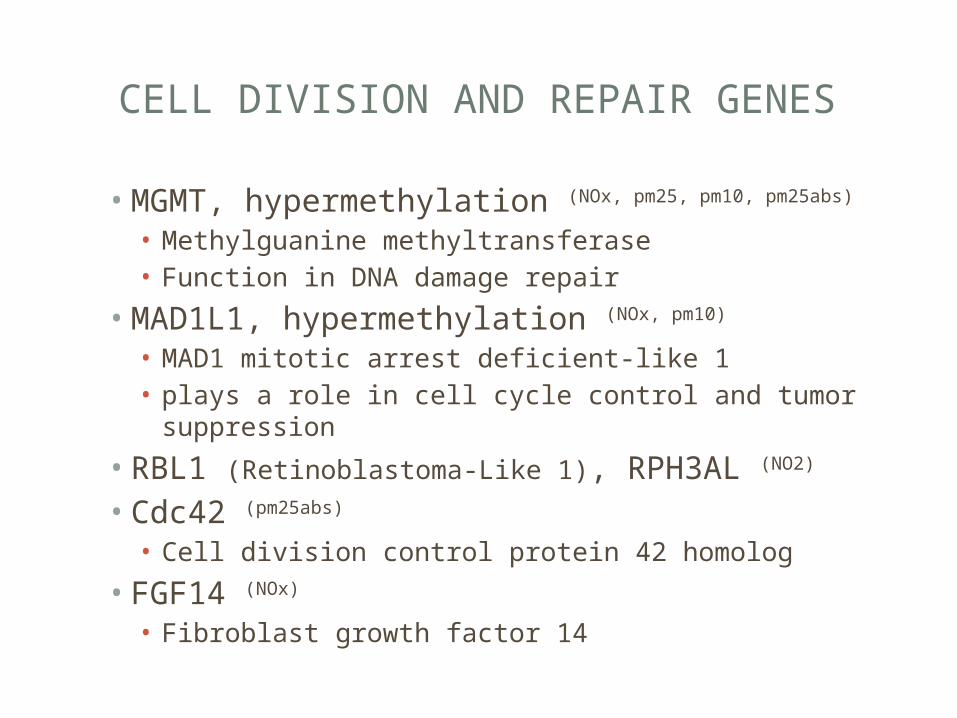
CELL DIVISION AND REPAIR GENES
• MGMT, hypermethylation (NOx, pm25, pm10, pm25abs)
• Methylguanine methyltransferase• Function in DNA damage repair
• MAD1L1, hypermethylation (NOx, pm10)
• MAD1 mitotic arrest deficient-like 1 • plays a role in cell cycle control and tumor suppression
• RBL1 (Retinoblastoma-Like 1), RPH3AL (NO2)
• Cdc42 (pm25abs)
• Cell division control protein 42 homolog• FGF14 (NOx)
• Fibroblast growth factor 14
CONCLUSION
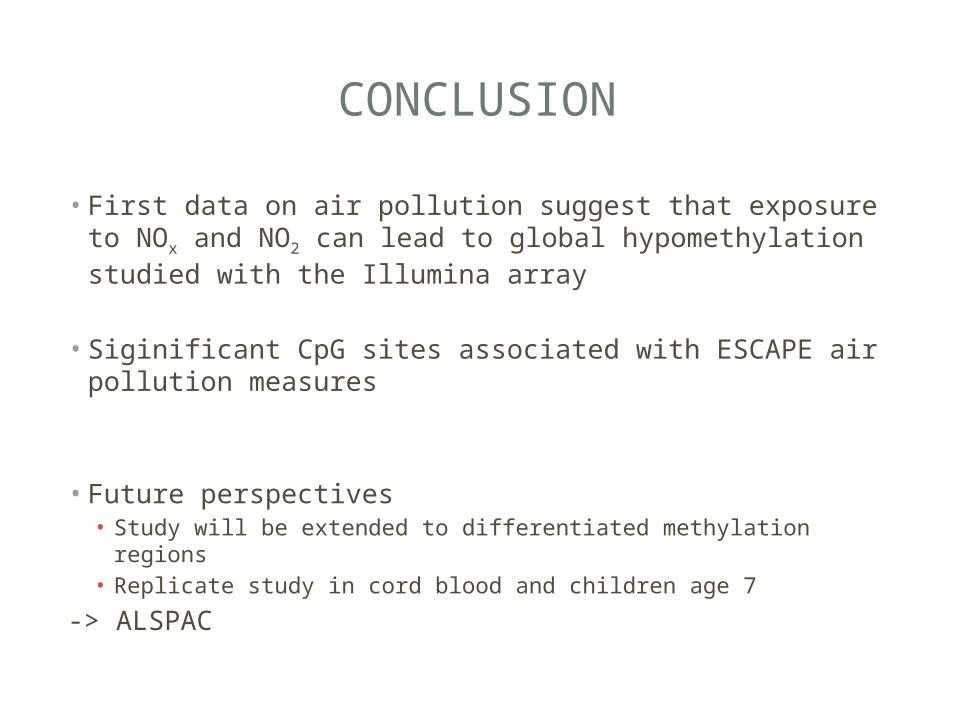
• First data on air pollution suggest that exposure to NOx and NO2 can lead to global hypomethylation studied with the Illumina array
• Siginificant CpG sites associated with ESCAPE air pollution measures
• Future perspectives• Study will be extended to differentiated methylation regions• Replicate study in cord blood and children age 7
-> ALSPAC
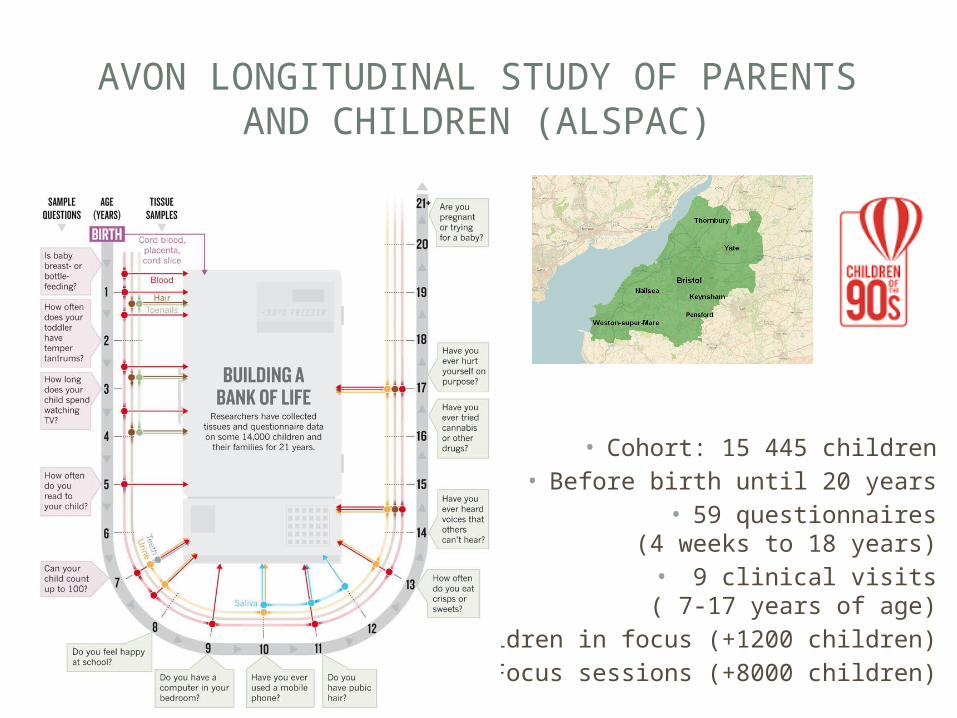
AVON LONGITUDINAL STUDY OF PARENTS AND CHILDREN (ALSPAC)
• Cohort: 15 445 children• Before birth until 20 years
• 59 questionnaires(4 weeks to 18 years)
• 9 clinical visits( 7-17 years of age)
• Children in focus (+1200 children)• Focus sessions (+8000 children)
ALSPAC AND EXPOSOMICS
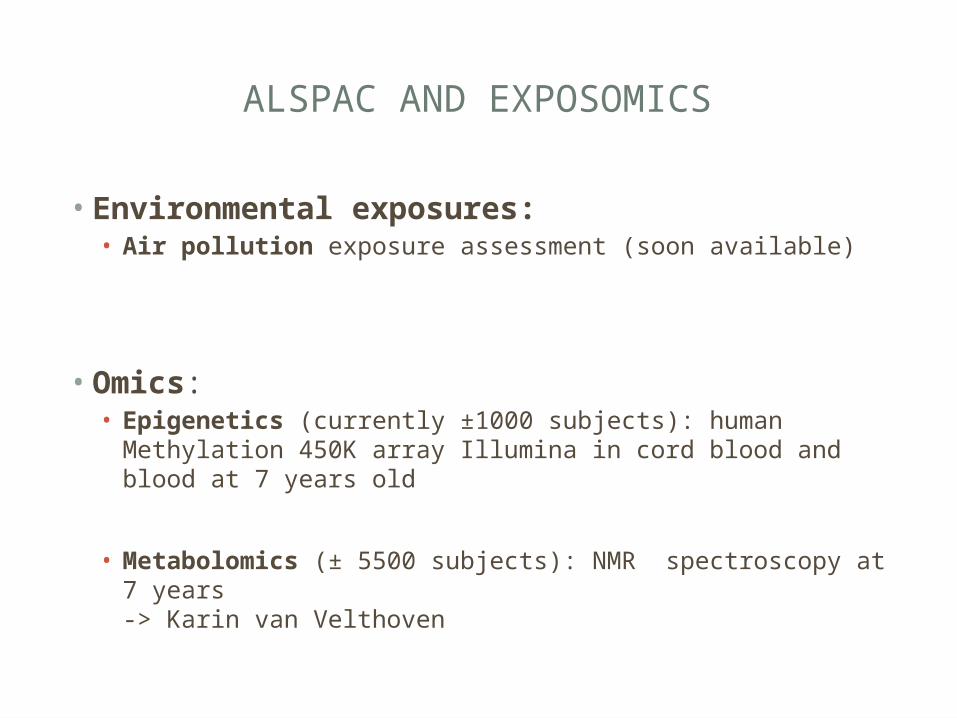
ALSPAC AND EXPOSOMICS
• Environmental exposures:• Air pollution exposure assessment (soon available)
• Omics: • Epigenetics (currently ±1000 subjects): human Methylation
450K array Illumina in cord blood and blood at 7 years old
• Metabolomics (± 5500 subjects): NMR spectroscopy at 7 years -> Karin van Velthoven

ACKNOWLEDGEMENTS
ALSPAC AND EXPOSOMICS
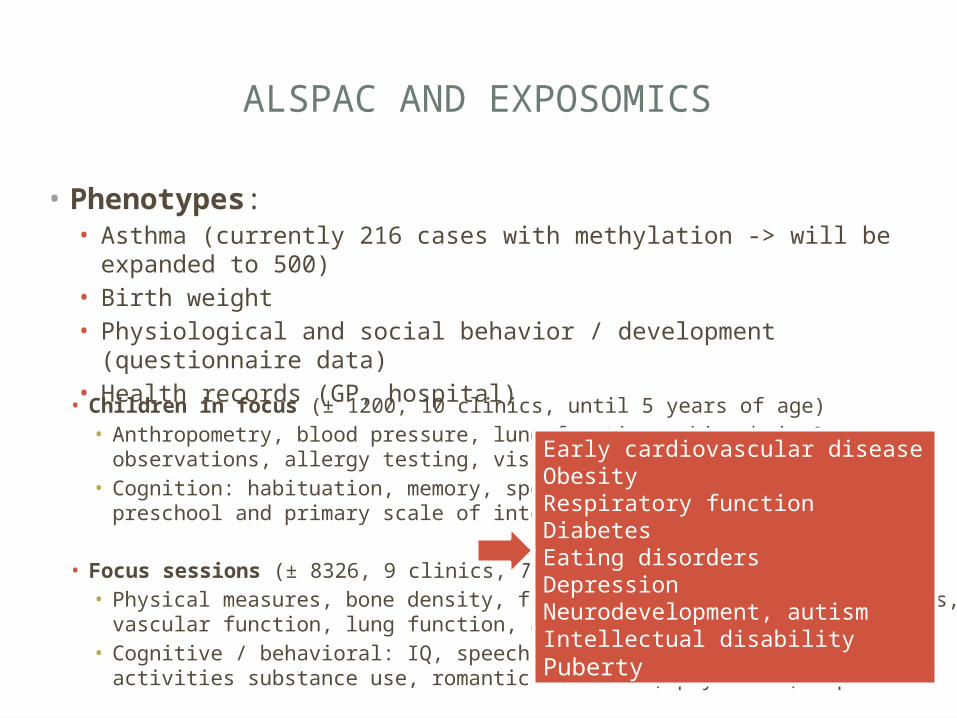
• Phenotypes:• Asthma (currently 216 cases with methylation -> will be expanded
to 500) • Birth weight • Physiological and social behavior / development (questionnaire
data)• Health records (GP, hospital)• Children in focus (± 1200, 10 clinics, until 5 years of age) • Anthropometry, blood pressure, lung function, skin, hair & eye observations,
allergy testing, vision, hearing, dental• Cognition: habituation, memory, speech (Griffiths test and Wechsler preschool
and primary scale of intelligence)
• Focus sessions (± 8326, 9 clinics, 7 years untill 17)• Physical measures, bone density, fitness, vision, hearing, allergies,
vascular function, lung function, acne• Cognitive / behavioral: IQ, speech & language, bullying, antisocial
activities substance use, romantic relations, psychosis, depression
Early cardiovascular disease ObesityRespiratory functionDiabetesEating disordersDepressionNeurodevelopment, autismIntellectual disabilityPuberty
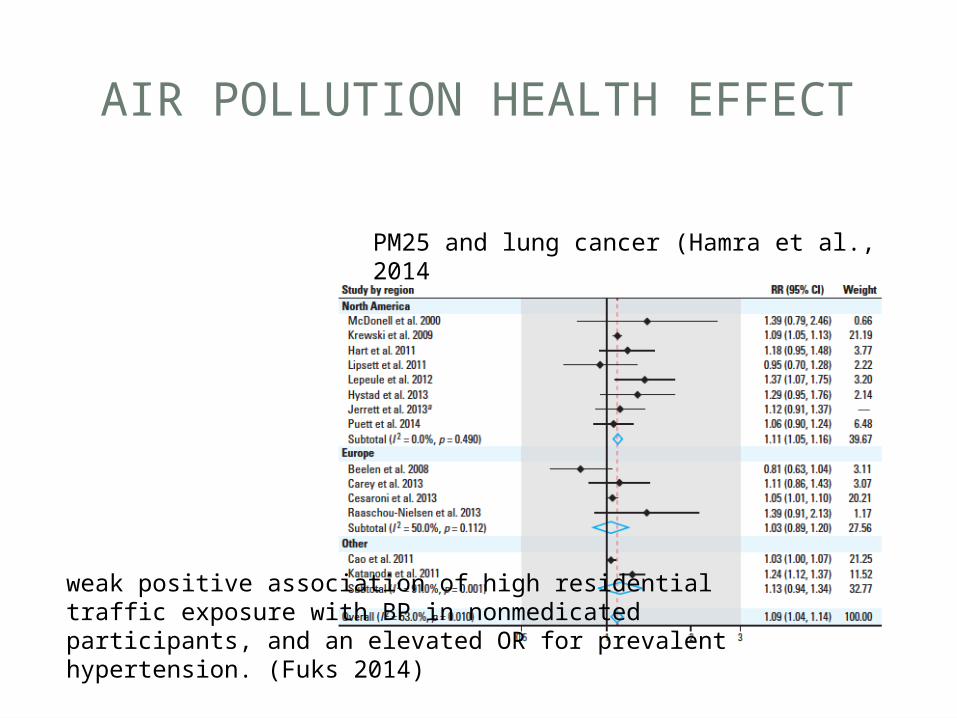
AIR POLLUTION HEALTH EFFECT
PM25 and lung cancer (Hamra et al., 2014
weak positive association of high residential traffic exposure with BP in nonmedicated participants, and an elevated OR for prevalent hypertension. (Fuks 2014)