Embed Size (px)
Citation preview
Epigenetic variation reflects dynamic habitat conditionsin a rare floodplain herb
BENJAMIN SCHULZ,* ROLF LUTZ ECKSTEIN* and WALTER DURKA†
*Institute of Landscape Ecology and Resource Management, Interdisciplinary Research Centre (IFZ), Justus Liebig University
Giessen, Heinrich-Buff-Ring 26-32, D-35393 Giessen, Germany, †Department of Community Ecology (BZF), Helmholtz Centre
for Environmental Research—UFZ, Theodor-Lieser-Straße 4, D-06120 Halle (Saale), Germany
Abstract
Variation of DNA methylation is thought to play an important role for rapid adjust-
ments of plant populations to dynamic environmental conditions, thus compensating
for the relatively slow response time of genetic adaptations. However, genetic and epi-
genetic variation of wild plant populations has not yet been directly compared in fast
changing environments. Here, we surveyed populations of Viola elatior from two adja-
cent habitat types along a successional gradient characterized by strong differences in
light availability. Using amplified fragment length polymorphisms (AFLP) and methyl-
ation-sensitive amplification polymorphisms (MSAP) analyses, we found relatively
low levels of genetic (H0gen = 0.19) and epigenetic (H0
epi = 0.23) diversity and high
genetic (/ST = 0.72) and epigenetic (/ST = 0.51) population differentiation. Diversity
and differentiation were significantly correlated, suggesting that epigenetic variation
partly depends on the same driving forces as genetic variation. Correlation-based gen-
ome scans detected comparable levels of genetic (17.0%) and epigenetic (14.2%) outlier
markers associated with site specific light availability. However, as revealed by sepa-
rate differentiation-based genome scans for AFLP, only few genetic markers seemed to
be actually under positive selection (0–4.5%). Moreover, principal coordinates analyses
and Mantel tests showed that overall epigenetic variation was more closely related to
habitat conditions, indicating that environmentally induced methylation changes may
lead to convergence of populations experiencing similar habitat conditions and thus
may play a major role for the transient and/or heritable adjustment to changing envi-
ronments. Additionally, using a new MSAP-scoring approach, we found that mainly
the unmethylated (/ST = 0.60) and CG-methylated states (/ST = 0.46) of epiloci contrib-
uted to population differentiation and putative habitat-related adaptation, whereas
CHG-hemimethylated states (/ST = 0.21) only played a marginal role.
Keywords: AFLP, ecological epigenetics, environmental gradient, methylation, MSAP, Viola
elatior
Received 18 December 2013; revision received 5 June 2014; accepted 6 June 2014
Introduction
To cope with spatial heterogeneity and temporal
dynamics of their habitats, plants as sessile organisms
constantly need to respond to varying environmental
conditions. While slow adaptation of morphology,
physiology or development can be attained by genetic
changes through mutation, drift and selection, rapid
responses to biotic or abiotic alterations necessitate
alternative regulations (Boyko & Kovalchuk 2011). As
an alternative to ‘hard-’ or ‘Mendelian inheritance’, ‘soft
inheritance’ through epigenetic mechanisms has been
proposed to fill this gap between random genetic and
environmental variation (Richards 2006). Epigenetic
silencing or activation of protein coding genes, which is
sensitive to environmental variation, may convert envi-
ronmental heterogeneity into phenotypic differencesCorrespondence: Benjamin Schulz, Fax: +49 (0)641 9937169;
E-mail: [email protected]
© 2014 John Wiley & Sons Ltd
Molecular Ecology (2014) 23, 3523–3537 doi: 10.1111/mec.12835
(Flores et al. 2013). These epigenetically induced pheno-
typic changes can then be inherited through meiosis
over several generations (reviewed in Jablonka & Raz
2009), giving rise to so-called epialleles. Furthermore,
due to its semi-stable nature, inherited epigenetic varia-
tion is suited to plastically react to environmental fluc-
tuations that last for only few generations. Especially in
long-lived perennials and species that mainly reproduce
vegetatively or through self-pollination, such fast
adjustment through epigenetic processes seems essential
to ensure continued survival of populations under epi-
sodic stress (Castonguay & Angers 2012; Br€autigam
et al. 2013).
An array of epigenetic mechanisms has been identified,
including chemical modification of DNA and histones,
position effects and interference by small non-coding
RNAs (Berger 2007). Without changing the underlying
DNA sequence, these mechanisms can rapidly modulate
existing genetic information through the control of gene
expression or the reorganization of chromatin structure
(Sahu et al. 2013). The most extensively studied and best
understood epigenetic mechanism is the potentially
reversible methylation of DNA, which in higher eukary-
otes mainly involves the methylation of cytosine residues
(Feng et al. 2010). In plants, cytosine methylations are
found throughout the genome in three different sequence
contexts, symmetric CG and CHG sites (H = A, C, T) and
asymmetric CHH sites. Methylations in all three contexts
are predominantly found in transposable elements and
repetitive sequences where they generally are related to
transcriptional repression (Saze et al. 2012).
Various studies have shown that the amount and pat-
tern of DNA methylation in plants is sensitive to biotic
and abiotic stressors such as pathogens (Wada et al.
2004), herbivores (Herrera & Bazaga 2013), drought
(Labra et al. 2002), extreme temperatures (Boyko et al.
2010) or nutrient availability (Boyko et al. 2010; Kou
et al. 2011). Depending on the species, genotype and
environmental cue, stress treatments induced hypo- or
hypermethylation or balanced shifts in global methyla-
tion patterns that in some cases were stably transmitted
to the next generation (e.g. Verhoeven et al. 2010; Kou
et al. 2011). Recent studies even directly correlated
stress-induced inherited changes of DNA methylation
with adaptive plant responses to salt stress (Boyko et al.
2010) or high temperature (Correia et al. 2013). Taken
together, the inheritance and the adaptive value of
stress-induced alterations in DNA methylations strongly
support the idea of an epigenetically regulated system
of ‘soft inheritance’ (Zhang et al. 2013).
However, there is still a dearth of studies that explore
the extent of epigenetic variation and its adaptive
potential in natural populations (Angers et al. 2010;
Latzel et al. 2013). Moreover, whereas previous surveys
mostly focused on species with very little or no genetic
variation (e.g. Richards et al. 2012; Yu et al. 2013),
improving the ability to attribute epigenetic variation to
specific environmental conditions (Ledon-Rettig 2013),
only few studies compared the impact of genetic and
epigenetic variation in genetically diverse species (Her-
rera & Bazaga 2010; Lira-Medeiros et al. 2010; Abra-
towska et al. 2012; Wu et al. 2013). However, most plant
populations are genetically diverse, implying a complex
relationship between genetic, epigenetic and environ-
mental variation. Indeed, the available studies found a
certain correlation between genetic and epigenetic varia-
tion, but also revealed that epigenetic differentiation
was more closely aligned with the environment than
genetic differentiation (Lira-Medeiros et al. 2010; Abra-
towska et al. 2012), suggesting that heritable epigenetic
changes might play an important role for local adapta-
tion. However, all of the investigated habitats repre-
sented temporally stable conditions that persisted for
long periods of time (e.g. differences in salinity, heavy
metal content or altitude), potentially resulting in exten-
sive genetic adaptation. Hence, this complicates the
study of epigenetically based ‘soft inheritance’ as a
mechanism for rapid and independent environmental
adjustment. Consequently, there is a need for studies
that focus on more dynamic, faster changing systems
that are less probably to allow for genetic adaptation.
One such fast changing environmental parameter is
the decreasing light availability along successional gradi-
ents. Both, quality and quantity of light may have effects
on DNA methylation (Tatra et al. 2000; Greco et al. 2013).
Moreover, as light is a strong environmental cue, influ-
encing an array of other biotic and abiotic parameters
(e.g. competition, water availability or temperature) a
high selection pressure is expected under changing light
conditions, making successional gradients an ideal study
system to compare genetic and epigenetic variation in
response to fast changing environments.
To assess methylation variation of large numbers of
individuals, population studies mostly use methylation-
sensitive amplification polymorphisms (MSAP) that
essentially can differentiate unmethylated, CG-methylat-
ed and CHG-hemimethylated states of particular epiloci
(Salmon et al. 2008). However, for statistical analyses,
most previous studies combined the two discernible
methylation types into one common state, ignoring reg-
ulatory and potential functional differences. Moreover,
unmethylated states are generally not considered, thus
missing further resolution and information about the
putatively active state of the epigenome (Schulz et al.
2013). Consequently, there is a need for studies that
consider all three MSAP fragment types and thus
potentially enable more detailed insights into epigenetic
processes.
© 2014 John Wiley & Sons Ltd
3524 B. SCHULZ, R . L . ECKSTEIN and W. DURKA
Here, we investigated genetic and epigenetic varia-
tion of Viola elatior in two adjacent habitat types along a
successional gradient characterized by strong differ-
ences in light availability. Using amplified fragment
length polymorphisms (AFLP) and MSAP and applying
genome scan approaches to detect putatively adaptive
genetic and epigenetic outlier loci, we asked the follow-
ing questions: (i) Do genetic and epigenetic variation
contribute differentially to habitat-related differentia-
tion? (ii) Are epigenetic differences between habitat
types consistent among regions and thus potentially de-
coupled from genetic variation? (iii) How do different
methylation types (i.e. unmethylated, CG-methylated or
CHG-hemimethylated fragments) contribute to epige-
netic population structuring?
Material and methods
Study species
Viola elatior (Violaceae) is a perennial iteroparous hemi-
cryptophyte. In Central Europe, the species is restricted
to different floodplain habitats ranging from floodplain
meadows to alluvial woodland fringes, characterized by
changing environmental conditions due to disturbance
and succession (Eckstein & Otte 2005; Eckstein et al.
2006). These environmental changes may proceed rather
fast, encompassing a time span of only few plant gener-
ations. Although V. elatior survives under a wide range
of light conditions, with increasing succession to closed
alluvial forests, population sizes decline and the species
finally disappears (Eckstein et al. 2006). However, due
to its persistent seed bank, after major disturbance
events, populations may recover even after years of
absence from the above-ground vegetation (Eckstein
et al. 2006). In Germany, the species is rare and endan-
gered with populations of varying sizes from tens to
several hundred individuals. The species is octoploid
(2n = 40) and exhibits a mixed mating system with
potentially cross-pollinated chasmogamous (CH) and
obligatory self-pollinated cleistogamous (CL) flowers
(Eckstein et al. 2006). Nonetheless, seed production
through CL-flowers is dominating. In common garden
experiments only around 4% of capsules were produced
by CH-flowers (Eckstein & Otte 2005; B. Schulz, unpub-
lished), suggesting a high selfing rate also in natural
populations. Additionally, vegetative reproduction by
disintegration of old pleiocorms or formation of root
buds occurs (Eckstein et al. 2006).
Sampling design
The study was conducted with six stands (hereafter
called populations) from the Upper Rhine Valley
located in the nature reserves ‘K€uhkopf-Knoblochsaue’
(K) and ‘Lampertheimer Altrhein’ (L) near Frankfurt,
Germany (Fig. 1). First, all known populations of
V. elatior in the two regions were visually classified
according to their light environment. Then, populations
for the two extremes of the species’ environmental
range, that is, sunny floodplain meadows (M) and
shady alluvial woodland fringes (W), were selected.
Due to limited numbers of appropriate populations in
the different habitat types with more than 20 individu-
als, we chose two M- and one W-site in region K and
one M- and two W-sites in region L (Fig. 1, Table 1).
Distance between regions is 25 km and within regions,
distances between populations range between 0.5 and
4 km.
After mapping V. elatior at each site on a 1 m grid,
20–25 populated grid cells were randomly selected and
young undamaged leaves from one reproductive plant
per cell were collected. Samples were immediately
cooled to below 10 °C, stored at �25 °C and freeze-
dried for 48 h.
Light availability
Mean transmitted photosynthetic active radiation (PAR)
per site was assessed with hemispherical photography.
At each site, 20 digital hemispherical photographs were
taken in randomly selected populated grid cells (i.e.
independent from plant sampling) with a Nikon Cool-
Pix 4500 camera and a Fish-eye converter lens FC-E8
(Nikon, Tokyo, Japan) mounted on a tripod 70 cm
above ground. Aperture and exposure time were fitted
following the study of Zhang et al. (2005). Images were
converted to black and white bitmaps using automatic
threshold detection algorithms with SIDELOOK 1.1.01
(Nobis & Hunziker 2005) and then analysed using GAP
LIGHT ANALYZER (GLA) 2.0 (Frazer et al. 1999). Light avail-
ability for each site was subsequently quantified as
mean daily percentage of transmitted total PAR for the
period from 1 May to 30 September averaged across the
20 images (Table 1).
AFLP genotyping and MSAP epigenotyping
We investigated a total of 132 individuals for genetic
and epigenetic variation with AFLP and MSAP. For
each individual, the same DNA sample was used for
both approaches. Total genomic DNA was extracted
from dried leaf tissue using the DNeasy 96 Plant extrac-
tion Kit (QIAGEN). AFLP and MSAP methodology fol-
lowed the protocol as described in Appendix S1
(Supporting information), using eight selective primer
combinations, respectively (Table S1, Supporting infor-
mation).
© 2014 John Wiley & Sons Ltd
EPIGENETIC VARIATION ALONG A LIGHT GRADIENT 3525
For MSAP analyses, comparison of the banding pat-
terns of EcoRI/HpaII and EcoRI/MspI reactions results
in four conditions of a particular fragment: I = frag-
ments present in both profiles (1/1), indicating an
unmethylated state; II = fragments present only in
EcoRI/MspI profiles (0/1), indicating hemi- or fully
methylated CG-sites; III = fragments present only in
EcoRI/HpaII profiles (1/0), indicating hemimethylated
CHG-sites; IV = absence of fragments in both profiles
(0/0), representing an uninformative state caused either
by different types of methylation or due to restriction
site polymorphism. To separate unmethylated and
methylated fragments and to test for the particular
impact of the methylated conditions II and III, we used
the ‘Mixed-Scoring 2’ approach (Schulz et al. 2013). This
approach generates the final epigenetic data matrix by
transforming the three discernible methylation states at
each multistate epilocus into separate binary subepiloci,
A B
C
D
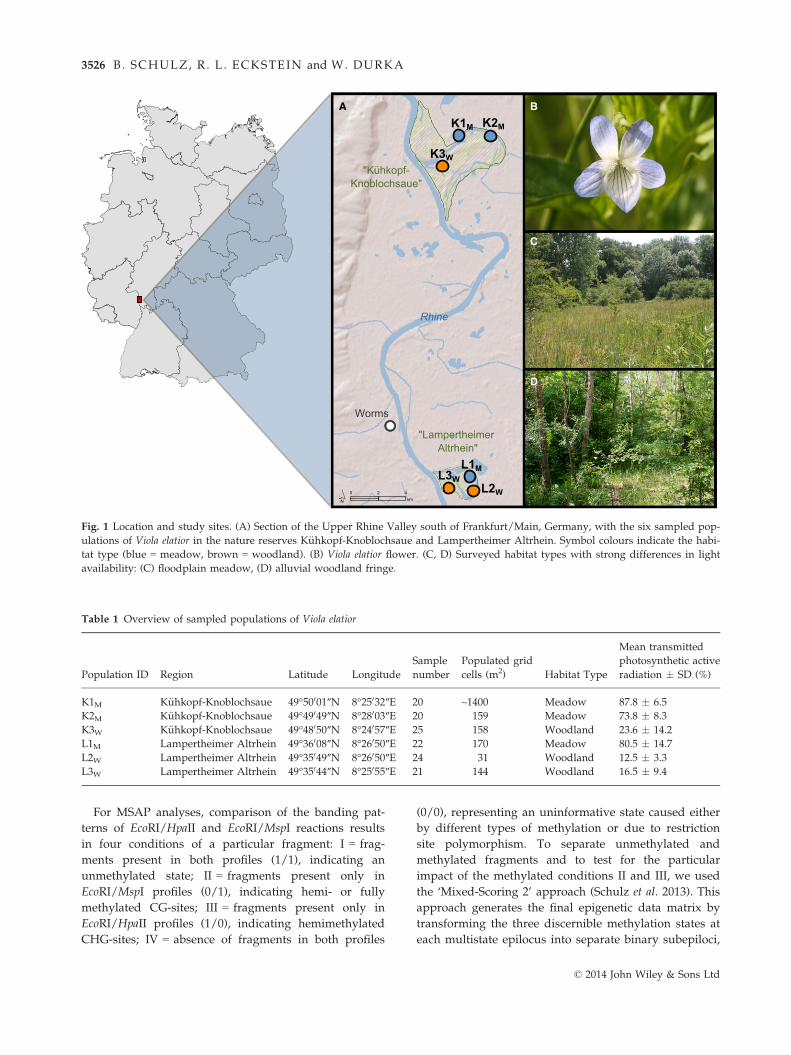
Fig. 1 Location and study sites. (A) Section of the Upper Rhine Valley south of Frankfurt/Main, Germany, with the six sampled pop-
ulations of Viola elatior in the nature reserves K€uhkopf-Knoblochsaue and Lampertheimer Altrhein. Symbol colours indicate the habi-
tat type (blue = meadow, brown = woodland). (B) Viola elatior flower. (C, D) Surveyed habitat types with strong differences in light
availability: (C) floodplain meadow, (D) alluvial woodland fringe.
Table 1 Overview of sampled populations of Viola elatior
Population ID Region Latitude Longitude
Sample
number
Populated grid
cells (m2) Habitat Type
Mean transmitted
photosynthetic active
radiation � SD (%)
K1M K€uhkopf-Knoblochsaue 49°50001″N 8°25032″E 20 ~1400 Meadow 87.8 � 6.5
K2M K€uhkopf-Knoblochsaue 49°49049″N 8°28003″E 20 159 Meadow 73.8 � 8.3
K3W K€uhkopf-Knoblochsaue 49°48050″N 8°24057″E 25 158 Woodland 23.6 � 14.2
L1M Lampertheimer Altrhein 49°36008″N 8°26050″E 22 170 Meadow 80.5 � 14.7
L2W Lampertheimer Altrhein 49°35049″N 8°26050″E 24 31 Woodland 12.5 � 3.3
L3W Lampertheimer Altrhein 49°35044″N 8°25055″E 21 144 Woodland 16.5 � 9.4
© 2014 John Wiley & Sons Ltd
3526 B. SCHULZ, R . L . ECKSTEIN and W. DURKA
thereby keeping all available information and allowing
for fragment specific analyses. Thus, for a particular
epilocus, up to three subepiloci are generated, coding
the nonmethylated (n-subepiloci), the CG-methylated
(m-subepiloci) and the CHG-hemimethylated state (h-
subepiloci). For a detailed description of the steps of
epigenotyping, see Schulz et al. (2013). Overall error
rate for AFLP and MSAP data was 3.3% and 2.1%,
respectively, based on 33 replicate samples.
Data analysis
Binary AFLP and MSAP data sets were analysed
following the same framework using a band- or mar-
ker-based strategy, that is, without calculating allele
frequencies (Bonin et al. 2007). Genetic and epigenetic
diversity within populations were quantified using the
R SCRIPT MSAP_CALC (Schulz et al. 2013) as (i) percentage
of total and private bands and (ii) percentage of
polymorphic loci (PLPgen) and subepiloci (PLPepi) and
(iii) mean Shannon’s information index H0gen and H0
epi.
Patterns of individual relationships were depicted by
principal coordinates analyses (PCoA) with GENALEX 6.41
(Peakall & Smouse 2006) based on a matrix of Nei and
Li distances calculated with DISTAFLP (Mougel et al.
2002). Distance matrices were square root transformed
to meet the assumptions of PCoA analyses (Legendre &
Legendre 1998).
Genetic and epigenetic variation among groups of
populations (/CT), among populations within groups
(/SC) and within populations (/ST) was partitioned with
hierarchical analysis of molecular variance (AMOVA)
using ARLEQUIN 3.5.1.2 (Excoffier & Lischer 2010). Addi-
tionally, pairwise /ST values were estimated among
populations. Significance levels were determined after
9999 permutations.
To evaluate the relationships between geography and
habitat type and genetic and epigenetic differentiation,
we conducted pairwise and partial Mantel tests using
the ‘vegan’ library in R (Oksanen et al. 2007) with 999
permutations. We used Euclidian geographic distances,
and for habitat types, we constructed a matrix coding
pairs of meadow-woodland populations by ‘1’ and
pairs of equal habitats by ‘0’.
To detect signatures of light-related adaptation in the
genetic and epigenetic data sets, we used the Spatial
Analysis Method (SAM; Joost et al. 2007), which uses
multiple univariate logistic regression. In our case, the
site-specific mean values of percentage of transmitted
PAR (Table 1) were assigned to genetic and epigenetic
marker data of all individuals from one population. SAM
uses the individual as reference unit, functions indepen-
dently of any presumed population structure and is
largely assumption free (Joost et al. 2007; Paun et al.
2010). Only if the two statistical tests implemented in
SAM (likelihood ratio G and Wald test) reject the null
hypothesis, a model is considered significant (Joost et al.
2007). Bonferroni correction of the significance level for
multiple comparisons was applied corresponding to a
95% and 99% confidence interval (CI).
To depict effects of putatively adaptive markers on
population structure, AFLP and MSAP data sets were
partitioned into subsets of neutral and outlier markers
(95% CI) and were then visualized with PCoA as
described previously. For MSAP data, corresponding
n-, m- or h-subepiloci (i.e. resulting from one epilocus)
were jointly excluded from the neutral data set when at
least one of them was classified as an outlier.
To obtain further information on the degree of posi-
tive selection at the genetic level, we used two differen-
tiation based genome scan approaches on the AFLP
data: DFDIST/FDIST (Beaumont & Balding 2004) as
included in the workbench MCHEZA (Antao & Beaumont
2011) and BAYESCAN 2.1 (Foll & Gaggiotti 2008). DFDIST/
FDIST analyses in MCHEZA were conducted with 50 000
simulations, using the combined ‘Neutral mean FST’
and ‘Force mean FST’ algorithms and two detection lev-
els at 95% and 99% CI. Results were corrected for multi-
ple comparisons by setting false discovery rate to 0.1.
BAYESCAN analyses were run with a burn-in of 50 000 iter-
ations, a sample size of 10 000 and a thinning interval
of 50, resulting in a total of 550 000 iterations. An addi-
tional burn-in was carried out by 20 short pilot runs of
5000 iterations. Only loci exceeding a ‘strong’ detection
level (Bayesian factor BF > 10) were considered as puta-
tive outliers.
Results
Genetic and epigenetic diversity
The AFLP analysis resulted in 428 scorable loci of
which 112 (26%) were polymorphic. Across all individ-
uals, 106 unique AFLP phenotypes were found, that is,
20% of individuals had shared AFLP phenotypes, rang-
ing from 10% in K1M to 42% in L2W. Within popula-
tions, between one and four AFLP phenotypes were
shared by more than one individual (Table 2). As the
mean distance between individuals with shared AFLP
phenotypes was 14.1 m and only six of 49 pairs were
separated by <3 m, we assumed that the majority of
pairs do not represent vegetative clones but closely
related, inbred individuals. Thus, all individuals were
retained in the subsequent analyses. Assessment of
genetic diversity across populations (Table 2) revealed
mean values of 67.7% for percentage of bands present,
2.7% for private bands, 37.5% for PLPgen and 0.19 for
H0gen.
© 2014 John Wiley & Sons Ltd
EPIGENETIC VARIATION ALONG A LIGHT GRADIENT 3527
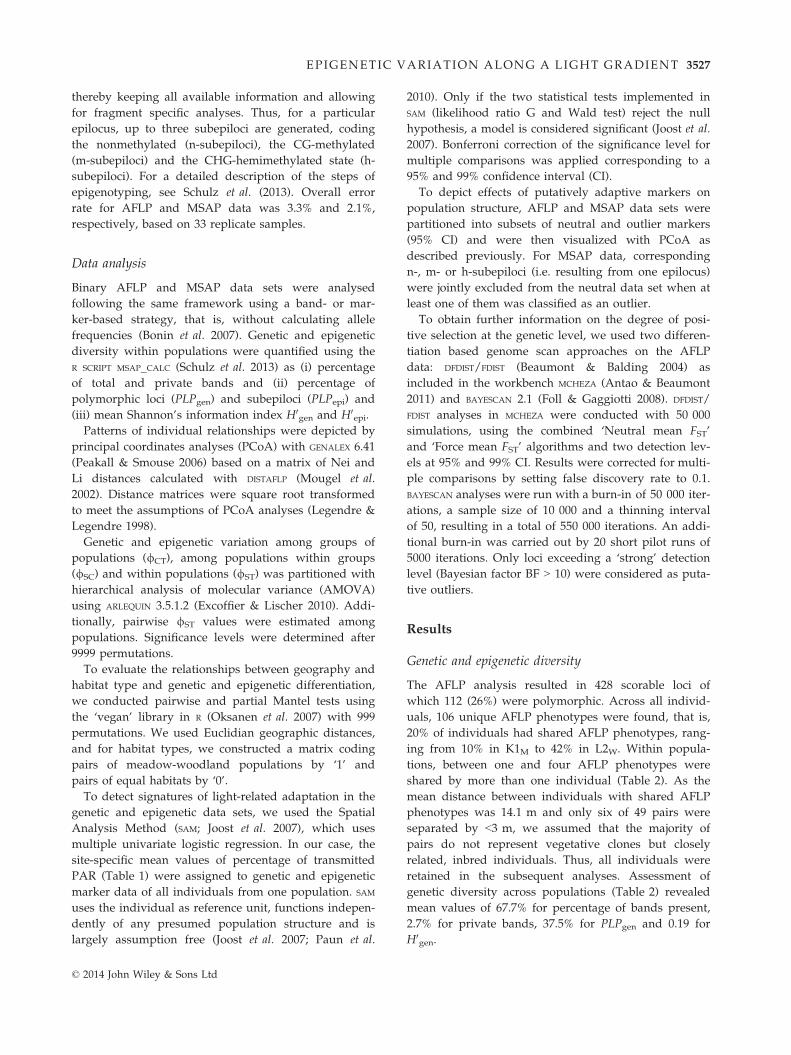
The MSAP analysis resulted in 555 scorable epiloci of
which 275 (49.5%) were polymorphic. These polymor-
phic epiloci yielded 444 polymorphic subepiloci, con-
sisting of 207 n-, 157 m- and 80 h-subepiloci. 42.9% of
all epiloci resulted in only one subepilocus type (19.3%,
11.3% and 12.4% for n-, m- and h-subepiloci, respec-
tively), 40.4% in n- and m-subepiloci, 11.2% in n- and
h-subepiloci, 1.1% in m- and h-subepiloci and 4.4%
yielded all three types of subepiloci. All 132 individuals
had unique MSAP phenotypes. Values of diversity for
the different subepiloci across populations are given in
Table 2. Population-level genetic and epigenetic diver-
sity was significantly correlated (Spearman rank-correla-
tion: q = 0.83, P = 0.042 for PLP; q = 0.89, P = 0.019 for
H0), and epigenetic diversity was or tended to be higher
than genetic diversity [paired t-test: t(5) = �3.20,
P = 0.024 for PLP; t(5) = �2.43, P = 0.060 for H0].
Table 2 Measures of genetic and epigenetic diversity within six populations of Viola elatior
AFLP MSAP all MSAP n-subepiloci MSAP m-subepiloci MSAP h-subepiloci
Polymorphic loci 112 444 207 157 80
Phenotypes per population*
K1M (n = 20) 18 (2) 20 20 20 20
K2M (n = 20) 14 (4) 20 20 20 20
K3W (n = 25) 22 (1) 25 25 25 25
L1M (n = 22) 19 (2) 22 22 22 22
L2W (n = 24) 14 (4) 24 24 24 24
L3W (n = 21) 18 (1) 21 21 21 21
Bands per population (%)
K1M 62.5 61.7 61.4 72.6 41.3
K2M 75.9 70.9 74.4 72.6 58.8
K3W 67.0 63.7 61.8 68.8 58.8
L1M 67.9 56.1 54.6 63.7 45.0
L2W 61.6 52.3 51.7 61.1 36.3
L3W 71.4 62.2 63.8 67.5 47.5
Mean 67.7 61.1 61.3 67.7 47.9
Private bands per population (%)
K1M 2.7 1.6 1.4 1.9 1.3
K2M 3.6 5.4 5.8 4.5 6.3
K3W 0.0 2.9 2.9 1.3 6.3
L1M 4.5 2.5 2.4 1.9 3.8
L2W 1.8 0.9 1.0 0.6 1.3
L3W 3.6 2.0 2.4 1.3 2.5
Mean 2.7 2.6 2.7 1.9 3.5
PLP
K1M 37.5 45.1 43.0 51.6 37.5
K2M 40.2 61.0 61.8 61.8 57.5
K3W 39.3 49.8 43.0 55.4 56.3
L1M 32.1 36.7 31.9 40.1 42.5
L2W 17.9 27.7 22.7 30.6 35.0
L3W 46.4 46.9 43.0 52.2 46.3
Mean 35.6 44.5 40.9 48.6 45.8
H0
K1M 0.22 0.25 0.24 0.29 0.19
K2M 0.26 0.34 0.35 0.34 0.29
K3W 0.15 0.23 0.22 0.24 0.25
L1M 0.19 0.19 0.17 0.20 0.24
L2W 0.08 0.13 0.11 0.14 0.18
L3W 0.25 0.24 0.22 0.28 0.22
Mean 0.19 0.23 0.22 0.25 0.23
Overall 0.59 0.44 0.50 0.43 0.31
*Numbers in brackets indicate amplified fragment length polymorphisms (AFLP) phenotypes that were shared by more than one
individual. PLP, percentage of polymorphic loci (PLPgen) and epiloci [PLPepi]; H0, Shannon’s information index (H0
gen for genetic data
and H0epi for epigenetic data).
© 2014 John Wiley & Sons Ltd
3528 B. SCHULZ, R . L . ECKSTEIN and W. DURKA
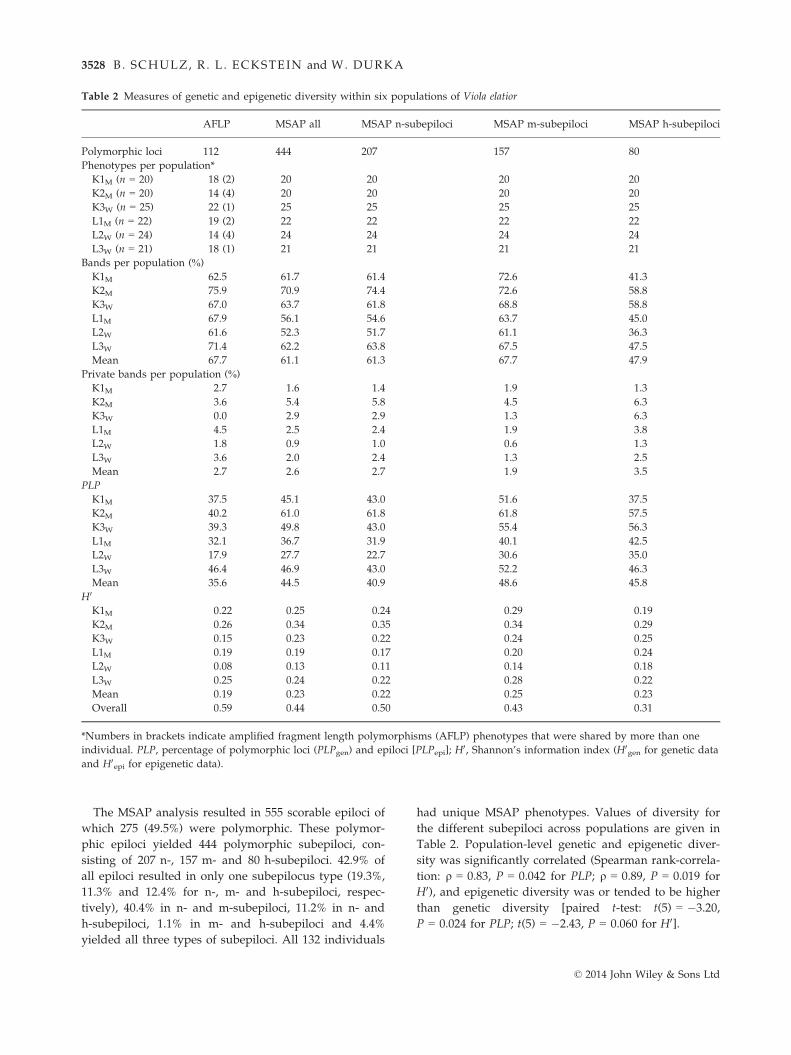
Genetic and epigenetic structure
Principal coordinates analysis of genetic distances sepa-
rated K- and L-sites, both being further subdivided into
two clusters (Fig. 2). Whereas regions were mainly
separated along the second coordinate, no grouping for
habitat type could be observed.
Principal coordinates analyses of epigenetic distances
revealed varying population differentiation patterns
among subepiloci (Fig. 2). For n-subepiloci, in contrast
to genetic data, K3W was separated from both K-mea-
dow sites that formed two mixed clusters. All L-sites
were clearly separated. For m-subepiloci, individuals
were less clumped but clustering overall resembled that
of n-subepiloci. For both, n- and m-subepiloci habitat
types tended to be separated along the first axis. In con-
trast, for h-subepiloci individuals were widely scattered
and without clear population differentiation. When n-,
m- and h-subepiloci were combined in one analysis,
similar patterns of population differentiation were
found as for n- and m-subepiloci (data not shown).
Analysis of molecular variance of genetic data
revealed a global /ST of 0.72 and pairwise /ST between
0.52 and 0.84 (Table S2, Supporting information), indi-
cating very strong genetic population differentiation.
Hierarchical AMOVA (Table 3) showed that 11.6% of
genetic variance resided between regions, but only 2.1%
between habitats. Most variation was partitioned among
populations within geographic or habitat groups (62.1%
and 70.5%, respectively).
For the combined epigenetic data set (Table 3), over-
all differentiation was lower than for genetic data but
still high (global /ST = 0.51), with pairwise population
/ST ranging from 0.35 to 0.67 (Table S2, Supporting
information). Hierarchical AMOVA revealed that only
1.2% of epigenetic variance resided between regions,
but 6.1% between habitats. Variation among popula-
tions within groups was similar for regions (49.7%) and
habitats (45.9%). Considering n-, m- and h-subepiloci
separately revealed global /ST values of 0.60, 0.46, and
0.21, respectively. In all MSAP data sets, stronger
Coord.3 (15.8%)
Coord
.1 (2
8.5%
)
Coord.2 (18.3%)
Coord.3 (20.2%)
Coord
.1 (2
8.0%
)
Coord.2 (21.2%)
Coord.3 (20.4%)
Coord
.1 (2
5.9%
)
Coord.2 (21.4%)
Coord.3 (18.2%)
Coord
.1 (2
8.5%
)
Coord.2 (22.0%)
MSAP-n
MSAP-mMSAP-h
AFLP
K1M
K2M
K3W
L1M
L2W
L3W
A B
C D
Fig. 2 Principal coordinates analyses
(PCoA) of genetic (A) and epigenetic dis-
tances (B–D) of six populations of Viola
elatior. Epigenetic data were partitioned
into the three discriminable methylation
types, that is, (B) unmethylated (n), (C)
CG-methylated (m) and (D) CHG-hemime-
thylated (h) subepiloci. Regions are indi-
cated by symbol type (circle = K€uhkopf-
Knoblochsaue, diamond = Lampertheimer
Altrhein). Habitats are displayed by colour
(blue = meadow, brown = woodland).
© 2014 John Wiley & Sons Ltd
EPIGENETIC VARIATION ALONG A LIGHT GRADIENT 3529
differentiation was observed among habitats than
among regions, contrary to the AFLP data.
Mantel tests revealed a strong correlation between
genetic and epigenetic differentiation (r = 0.76,
P < 0.005). However, no simple isolation-by-distance or
isolation-by-habitat pattern was found as no signific-
ant relationship existed between genetic or epigenetic
differentiation and geographical distance (P > 0.18) or
habitat similarity (P > 0.1; Table S3, Supporting infor-
mation). However, when controlling for geographic dis-
tance, habitat similarity was significantly correlated
with epigenetic (P = 0.04), but not with genetic differen-
tiation (P = 0.30).
Outlier detection
For the AFLP data set, SAM identified 19 (17.0%) and 17
(15.2%) outliers that were associated with light environ-
ment at 95% and 99% CI, respectively (Table 4,
Table S4, Supporting information). In contrast, with
both differentiation-based genome scans, the number of
genetic outliers was strongly reduced. Whereas DFDIST/
FDIST detected 5 (4.5%) and 1 (0.9%) outliers at 95% and
99% CI (Table S4, Supporting information), respectively,
no outliers at all were identified by BAYESCAN. Two
(1.8%) outliers were similarly detected by SAM and
DFDIST/FDIST.
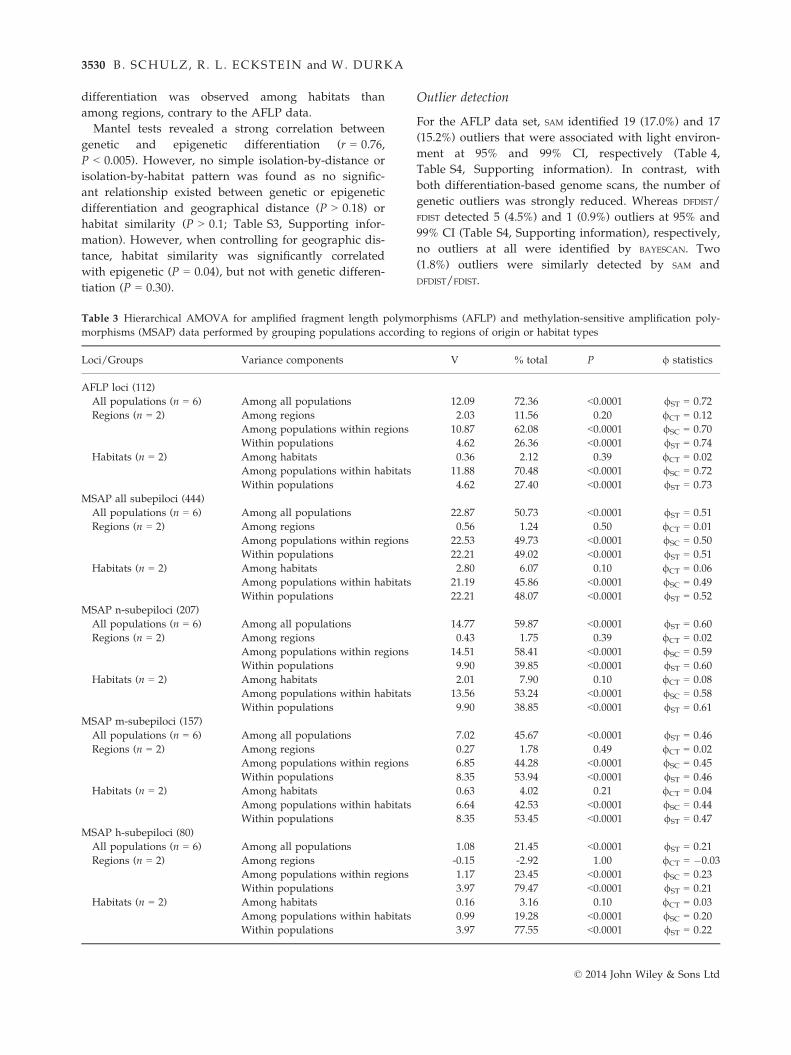
Table 3 Hierarchical AMOVA for amplified fragment length polymorphisms (AFLP) and methylation-sensitive amplification poly-
morphisms (MSAP) data performed by grouping populations according to regions of origin or habitat types
Loci/Groups Variance components V % total P / statistics
AFLP loci (112)
All populations (n = 6) Among all populations 12.09 72.36 <0.0001 /ST = 0.72
Regions (n = 2) Among regions 2.03 11.56 0.20 /CT = 0.12
Among populations within regions 10.87 62.08 <0.0001 /SC = 0.70
Within populations 4.62 26.36 <0.0001 /ST = 0.74
Habitats (n = 2) Among habitats 0.36 2.12 0.39 /CT = 0.02
Among populations within habitats 11.88 70.48 <0.0001 /SC = 0.72
Within populations 4.62 27.40 <0.0001 /ST = 0.73
MSAP all subepiloci (444)
All populations (n = 6) Among all populations 22.87 50.73 <0.0001 /ST = 0.51
Regions (n = 2) Among regions 0.56 1.24 0.50 /CT = 0.01
Among populations within regions 22.53 49.73 <0.0001 /SC = 0.50
Within populations 22.21 49.02 <0.0001 /ST = 0.51
Habitats (n = 2) Among habitats 2.80 6.07 0.10 /CT = 0.06
Among populations within habitats 21.19 45.86 <0.0001 /SC = 0.49
Within populations 22.21 48.07 <0.0001 /ST = 0.52
MSAP n-subepiloci (207)
All populations (n = 6) Among all populations 14.77 59.87 <0.0001 /ST = 0.60
Regions (n = 2) Among regions 0.43 1.75 0.39 /CT = 0.02
Among populations within regions 14.51 58.41 <0.0001 /SC = 0.59
Within populations 9.90 39.85 <0.0001 /ST = 0.60
Habitats (n = 2) Among habitats 2.01 7.90 0.10 /CT = 0.08
Among populations within habitats 13.56 53.24 <0.0001 /SC = 0.58
Within populations 9.90 38.85 <0.0001 /ST = 0.61
MSAP m-subepiloci (157)
All populations (n = 6) Among all populations 7.02 45.67 <0.0001 /ST = 0.46
Regions (n = 2) Among regions 0.27 1.78 0.49 /CT = 0.02
Among populations within regions 6.85 44.28 <0.0001 /SC = 0.45
Within populations 8.35 53.94 <0.0001 /ST = 0.46
Habitats (n = 2) Among habitats 0.63 4.02 0.21 /CT = 0.04
Among populations within habitats 6.64 42.53 <0.0001 /SC = 0.44
Within populations 8.35 53.45 <0.0001 /ST = 0.47
MSAP h-subepiloci (80)
All populations (n = 6) Among all populations 1.08 21.45 <0.0001 /ST = 0.21
Regions (n = 2) Among regions -0.15 -2.92 1.00 /CT = �0.03
Among populations within regions 1.17 23.45 <0.0001 /SC = 0.23
Within populations 3.97 79.47 <0.0001 /ST = 0.21
Habitats (n = 2) Among habitats 0.16 3.16 0.10 /CT = 0.03
Among populations within habitats 0.99 19.28 <0.0001 /SC = 0.20
Within populations 3.97 77.55 <0.0001 /ST = 0.22
© 2014 John Wiley & Sons Ltd
3530 B. SCHULZ, R . L . ECKSTEIN and W. DURKA
For the complete set of the 444 MSAP, subepiloci SAM
identified 50 (11.3%) and 30 (6.8%) outliers at 95% and
99% CI, respectively (Table 4, Table S5, Supporting
information). Related to the original 275 epiloci, 39
(14.2%) and 24 (8.7%) of all epiloci resulted in one or
two outlier subepiloci at 95% and 99% CI, respectively
(Table S5, Supporting information). At 95% CI, the three
methylation types contributed differently to outliers as
15.0%, 10.2% and 3.8% of the n-, m- and h-subepiloci,
respectively, revealed signatures of adaptation
(v2 = 6.21, P = 0.045).
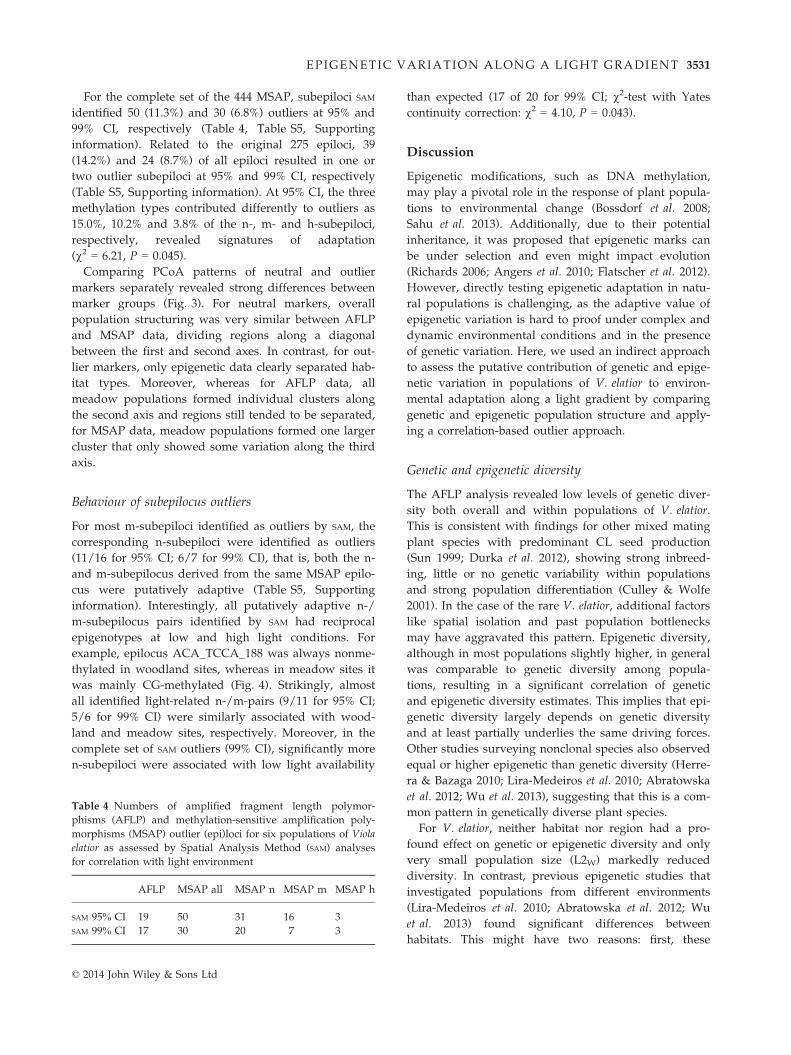
Comparing PCoA patterns of neutral and outlier
markers separately revealed strong differences between
marker groups (Fig. 3). For neutral markers, overall
population structuring was very similar between AFLP
and MSAP data, dividing regions along a diagonal
between the first and second axes. In contrast, for out-
lier markers, only epigenetic data clearly separated hab-
itat types. Moreover, whereas for AFLP data, all
meadow populations formed individual clusters along
the second axis and regions still tended to be separated,
for MSAP data, meadow populations formed one larger
cluster that only showed some variation along the third
axis.
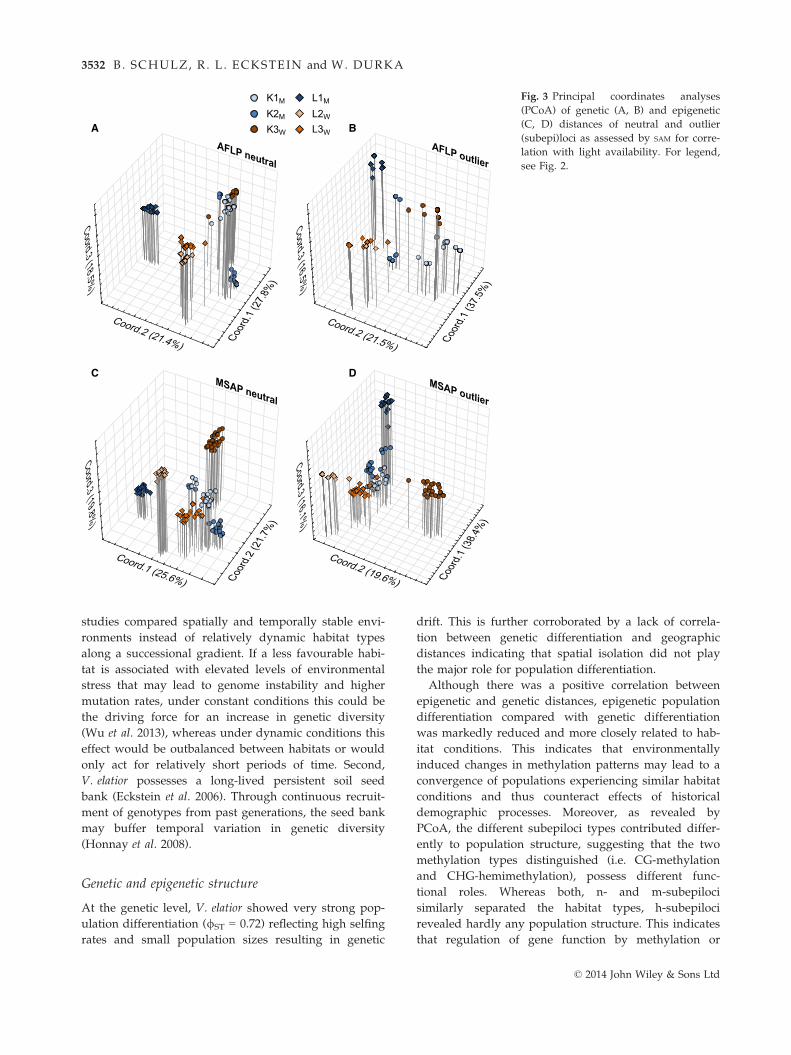
Behaviour of subepilocus outliers
For most m-subepiloci identified as outliers by SAM, the
corresponding n-subepiloci were identified as outliers
(11/16 for 95% CI; 6/7 for 99% CI), that is, both the n-
and m-subepilocus derived from the same MSAP epilo-
cus were putatively adaptive (Table S5, Supporting
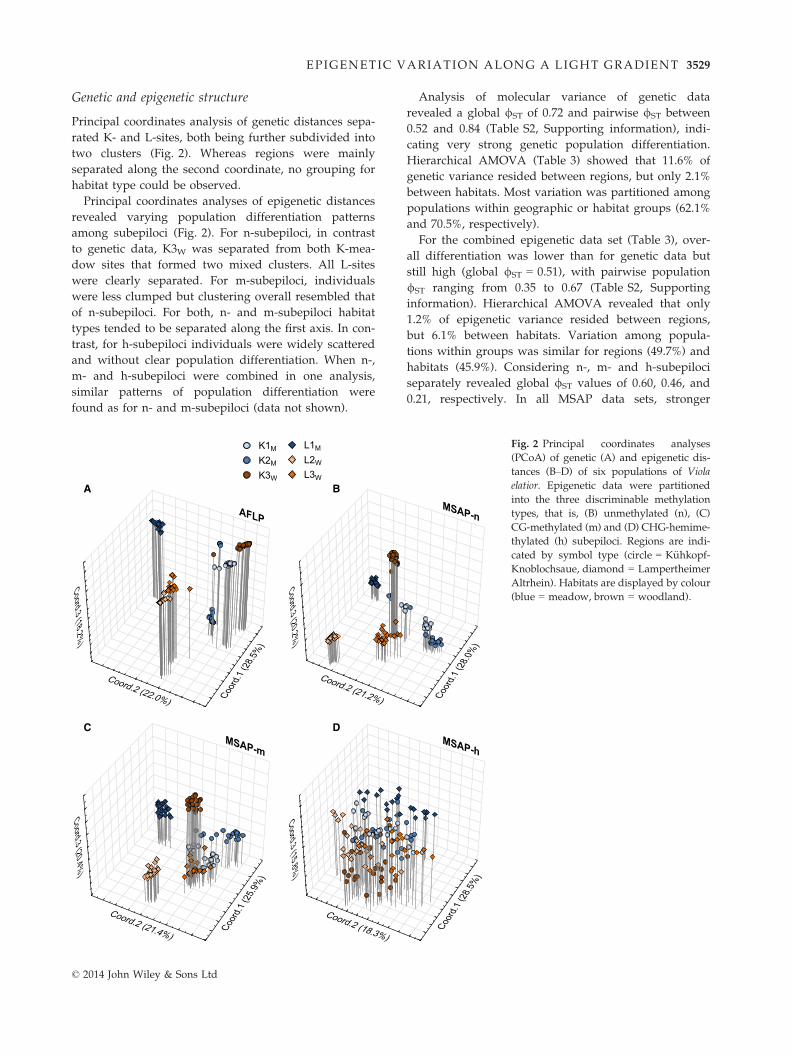
information). Interestingly, all putatively adaptive n-/
m-subepilocus pairs identified by SAM had reciprocal
epigenotypes at low and high light conditions. For
example, epilocus ACA_TCCA_188 was always nonme-
thylated in woodland sites, whereas in meadow sites it
was mainly CG-methylated (Fig. 4). Strikingly, almost
all identified light-related n-/m-pairs (9/11 for 95% CI;
5/6 for 99% CI) were similarly associated with wood-
land and meadow sites, respectively. Moreover, in the
complete set of SAM outliers (99% CI), significantly more
n-subepiloci were associated with low light availability
than expected (17 of 20 for 99% CI; v2-test with Yates
continuity correction: v2 = 4.10, P = 0.043).
Discussion
Epigenetic modifications, such as DNA methylation,
may play a pivotal role in the response of plant popula-
tions to environmental change (Bossdorf et al. 2008;
Sahu et al. 2013). Additionally, due to their potential
inheritance, it was proposed that epigenetic marks can
be under selection and even might impact evolution
(Richards 2006; Angers et al. 2010; Flatscher et al. 2012).
However, directly testing epigenetic adaptation in natu-
ral populations is challenging, as the adaptive value of
epigenetic variation is hard to proof under complex and
dynamic environmental conditions and in the presence
of genetic variation. Here, we used an indirect approach
to assess the putative contribution of genetic and epige-
netic variation in populations of V. elatior to environ-
mental adaptation along a light gradient by comparing
genetic and epigenetic population structure and apply-
ing a correlation-based outlier approach.
Genetic and epigenetic diversity
The AFLP analysis revealed low levels of genetic diver-
sity both overall and within populations of V. elatior.
This is consistent with findings for other mixed mating
plant species with predominant CL seed production
(Sun 1999; Durka et al. 2012), showing strong inbreed-
ing, little or no genetic variability within populations
and strong population differentiation (Culley & Wolfe
2001). In the case of the rare V. elatior, additional factors
like spatial isolation and past population bottlenecks
may have aggravated this pattern. Epigenetic diversity,
although in most populations slightly higher, in general
was comparable to genetic diversity among popula-
tions, resulting in a significant correlation of genetic
and epigenetic diversity estimates. This implies that epi-
genetic diversity largely depends on genetic diversity
and at least partially underlies the same driving forces.
Other studies surveying nonclonal species also observed
equal or higher epigenetic than genetic diversity (Herre-
ra & Bazaga 2010; Lira-Medeiros et al. 2010; Abratowska
et al. 2012; Wu et al. 2013), suggesting that this is a com-
mon pattern in genetically diverse plant species.
For V. elatior, neither habitat nor region had a pro-
found effect on genetic or epigenetic diversity and only
very small population size (L2W) markedly reduced
diversity. In contrast, previous epigenetic studies that
investigated populations from different environments
(Lira-Medeiros et al. 2010; Abratowska et al. 2012; Wu
et al. 2013) found significant differences between
habitats. This might have two reasons: first, these
Table 4 Numbers of amplified fragment length polymor-
phisms (AFLP) and methylation-sensitive amplification poly-
morphisms (MSAP) outlier (epi)loci for six populations of Viola
elatior as assessed by Spatial Analysis Method (SAM) analyses
for correlation with light environment
AFLP MSAP all MSAP n MSAP m MSAP h
SAM 95% CI 19 50 31 16 3
SAM 99% CI 17 30 20 7 3
© 2014 John Wiley & Sons Ltd
EPIGENETIC VARIATION ALONG A LIGHT GRADIENT 3531
studies compared spatially and temporally stable envi-
ronments instead of relatively dynamic habitat types
along a successional gradient. If a less favourable habi-
tat is associated with elevated levels of environmental
stress that may lead to genome instability and higher
mutation rates, under constant conditions this could be
the driving force for an increase in genetic diversity
(Wu et al. 2013), whereas under dynamic conditions this
effect would be outbalanced between habitats or would
only act for relatively short periods of time. Second,
V. elatior possesses a long-lived persistent soil seed
bank (Eckstein et al. 2006). Through continuous recruit-
ment of genotypes from past generations, the seed bank
may buffer temporal variation in genetic diversity
(Honnay et al. 2008).
Genetic and epigenetic structure
At the genetic level, V. elatior showed very strong pop-
ulation differentiation (/ST = 0.72) reflecting high selfing
rates and small population sizes resulting in genetic
drift. This is further corroborated by a lack of correla-
tion between genetic differentiation and geographic
distances indicating that spatial isolation did not play
the major role for population differentiation.
Although there was a positive correlation between
epigenetic and genetic distances, epigenetic population
differentiation compared with genetic differentiation
was markedly reduced and more closely related to hab-
itat conditions. This indicates that environmentally
induced changes in methylation patterns may lead to a
convergence of populations experiencing similar habitat
conditions and thus counteract effects of historical
demographic processes. Moreover, as revealed by
PCoA, the different subepiloci types contributed differ-
ently to population structure, suggesting that the two
methylation types distinguished (i.e. CG-methylation
and CHG-hemimethylation), possess different func-
tional roles. Whereas both, n- and m-subepiloci
similarly separated the habitat types, h-subepiloci
revealed hardly any population structure. This indicates
that regulation of gene function by methylation or
Coord.1 (25.6%) Coord
.2 (2
1.7%
)
Coord.3 (19.8%)
Coord
.1 (2
7.8%
)
Coord.2 (21.4%)
Coord.3 (18.5%)
Coord
.1 (3
7.5%
)
Coord.2 (21.5%)
Coord.3 (16.5%)
Coord
.1 (3
8.4%
)
Coord.2 (19.6%)
Coord.3 (16.1%)
AFLP neutralAFLP outlier
MSAP neutralMSAP outlier
K1M
K2M
K3W
L1M
L2W
L3WA B
C D
Fig. 3 Principal coordinates analyses
(PCoA) of genetic (A, B) and epigenetic
(C, D) distances of neutral and outlier
(subepi)loci as assessed by SAM for corre-
lation with light availability. For legend,
see Fig. 2.
© 2014 John Wiley & Sons Ltd
3532 B. SCHULZ, R . L . ECKSTEIN and W. DURKA
demethylation in the CG-context plays a more impor-
tant role for habitat adjustment than changes of hemi-
methylation in the CHG-context. A functional difference
between the two methylation types is further supported
by the observation that of all polymorphic epiloci only
5.5% included both fragment types, whereas 51.7% and
23.6% included methylations either only in the CG- or
CHG-context, respectively. These findings clearly show
the need for separate analyses of CG- and CHG-methy-
lated states, which are rarely distinguished in epigenetic
population studies (but see Salmon et al. 2008; Paun
et al. 2010).
Outlier detection
Outlier detection is a widely used approach to analyse
putative selection processes using anonymous genetic
marker data. However, genome scan approaches have
been rarely used for MSAP data (Paun et al. 2010; Sch-
rey et al. 2012), which may reflect the uncertainty if
the central underlying assumption is valid for methyla-
tion variation, namely that heritable marker loci give
rise to phenotypes which are targets of natural selec-
tion leading to change in frequencies of adaptive
markers. First, epigenetic variation may depend on
genetic variation (i.e. obligatory and facilitated epige-
netic variation sensu Richards 2006). Hence, it is
impossible to distinguish whether a certain epigenetic
state or any underlying causative genetic state is puta-
tively under selection. Second, epigenetic variation can
be either generated randomly (epimutation) or environ-
mentally induced, which has different implications for
selection processes (Shea et al. 2011; Verhoeven & Preite
2014) and thus their detectability. Third, epigenetic vari-
ation can have different degrees of transgenerational sta-
bility (Herman et al. 2014), ranging from transient
changes, over short-term (i.e. across two generations) to
long-term heritable changes (i.e. several generations).
The traditional view is that adaptive traits are selected
for by natural selection only if traits are heritable. Thus,
the degree of epigenetic heritability will impact the
selective outcome. However, if over a long time, the
same advantageous phenotype arises every generation
by transient epigenetic modifications it will also be
selected for. Recent theory (Herman et al. 2014) and
some first evidence in natural populations (Herrera et al.
2014) suggest that epigenetic stability itself is a selective
trait, thus introducing another layer of complexity to the
system. Lastly, in outlier locus analyses, AFLP loci are
used as markers that can track differentiation based on
selection at linked loci. In contrast, the epigenetic inter-
pretation of MSAP outlier loci is different as it must be
assumed that the MSAP locus itself is causal to function.
Taken together, epigenetic variation does not easily fit
into the hitherto existing framework of selection and
adaptation and thus may not easily be suited for
classical differentiation-based genome scan analyses.
This notwithstanding, correlation-based genome scan
approaches like SAM, which are largely assumption free,
still offer a good opportunity to study putatively
0 10 20 30 40 50 60 70 80 90 1000 10 20 30 40 50 60 70 80 90 100
1
0.9
0.8
0.7
0.6
0.5
0.4
0.3
0.2
0.1
0
1
0.9
0.8
0.7
0.6
0.5
0.4
0.3
0.2
0.1
0
n_subepilocus ACA_TCCA_188 m_subepilocus ACA_TCCA_188
Pro
babi
lity
Pro
babi
lity
Mean transmitted PAR (%) Mean transmitted PAR (%)
Fig. 4 Example of two corresponding outlier subepiloci, illustrating a putatively adaptive epigenetic switch mechanism. The proba-
bility of band presence/absence of both, n- and m-subepilocus of the methylation-sensitive amplification polymorphisms (MSAP)
marker ACA_TCCA_188 are significantly associated with mean percentage of transmitted photosynthetic-active radiation (PAR). The
graphs show the logistic sigmoid function of marker presence vs. the mean light availability at the sampling sites. At low light
(woodland), the marker ACA_TCCA_188 is found to be completely unmethylated, while at high light (meadow) nearly all individu-
als show a CG-methylation. Bars represent the number of present (top) and absent (bottom) bands for each of the six surveyed popu-
lations.
© 2014 John Wiley & Sons Ltd
EPIGENETIC VARIATION ALONG A LIGHT GRADIENT 3533
adaptive methylation variation in relationship to envi-
ronmental conditions.
Spatial Analysis Method analyses of V. elatior popula-
tions resulted in comparable percentages of light-related
outlier markers for genetic (17.0%) and epigenetic
(14.2%) data. Given the limited power to detect signifi-
cant marker associations due to the relative small num-
ber of surveyed populations and the use of averaged
light values for all individuals from one site, the results
imply that both levels of variation may play an impor-
tant role for habitat-related adaptation. However, as
revealed by differentiation-based genome scan appro-
aches, for AFLP data, the percentage of genetic outliers
was strongly reduced and only very few of the SAM
outliers (two of 19) actually seemed to be under posi-
tive selection. Moreover, with DFDIST/FDIST (4.5%) and
BAYESCAN (0%), the percentage of genetic outliers was
strongly reduced, thus questioning a large impact of
genetic selection. In contrast, PCoA results for neutral
and outlier MSAP markers strongly support the hypoth-
esis that methylation variation plays a major role in
response to habitat conditions. Whereas for neutral
markers, genetic and epigenetic population structure
were almost identical, for outlier markers only epige-
netic variation led to a close clustering of the genetically
well differentiated meadow populations. Interestingly,
such clustering was not observed for woodland popula-
tions, suggesting that this habitat is more heterogeneous
and thus entailing higher differentiation in response to
other environmental parameters than light. A stronger
habitat-related impact of epigenetic variation is further-
more corroborated by the results of partial Mantel tests,
showing that when controlling for geographical distance,
only epigenetic but not genetic variation was signifi-
cantly correlated with habitat similarity.
There is rising evidence from experimental studies
that large proportions of stress-induced changes in
epigenetic variation may be heritable across genera-
tions (Verhoeven et al. 2010; Kou et al. 2011). Verho-
even et al. (2010) found that ecological stressors led to
methylation changes of 15–30% of polymorphic epiloci
in apomictic dandelions. Strikingly, the vast majority
of methylation changes (74–92%) were faithfully trans-
mitted to the unstressed progeny and only a small
proportion reverted back to the original state. Compa-
rably high percentages of inheritance of methylation
polymorphisms (75%) and subsequent persistence of
multilocus epigenetic differentiation occurred in popu-
lations of Helloborus foetidus (Herrera et al. 2013). Thus,
it seems plausible that also in the case of V. elatior a
considerable amount of the epigenetic outliers
detected by SAM are heritable and hence might enable
‘soft inheritance’. However, as we surveyed only one
generation of plants, our study cannot distinguish
whether the observed epigenetic correlation with habi-
tats reflects epigenetically mediated within-generation
phenotypic plasticity or indeed heritable adaptations.
Behaviour of subepilocus outliers
Our scoring approach allowed us to differentiate indi-
vidual MSAP fragment types. The finding that at 95%
CI only 3.8% of the h-subepiloci, but 10.2% of the m-
subepiloci were detected as outliers further indicates
functional differences between the two methylation types.
Even more interesting was the observation that the vast
majority of outliers were n-subepiloci (15% of all
n-subepiloci), suggesting that primarily the demethylated
and thus probably active state of an epilocus is correlated
with specific environmental conditions. This is corrobo-
rated by the fact that for almost all m-subepiloci outliers
also the corresponding n-subepiloci were outliers.
Of the outliers identified by SAM most n-subepiloci
were related to low light and most m-subepiloci to high
light, indicating a directional epigenetic regulation mech-
anism. Especially, the corresponding n- and m-subepiloci
outliers suggest a switch mechanism that activates
stress-related genes by demethylation under low-light
conditions and downregulates them by methylation
under high light conditions. Indeed, biotic and abiotic
stressors can induce selective demethylation processes
and transcriptional activation of stress-related genes
(Wada et al. 2004; Choi & Sano 2007). Moreover, global
hypomethylation may be a response to environmental
stressors (e.g. Zhong et al. 2009; Wang et al. 2011) or
different habitats (Lira-Medeiros et al. 2010; Wu et al.
2013). However, stress-induced DNA hypermethylation
has been observed, too (Labra et al. 2002; Lu et al. 2007)
and also the few studies specifically addressing the
effects of light availability are equivocal: whereas
reduction of light led to genome hypermethylation in
seagrass (Greco et al. 2013), low R/FR ratios as a signal
of foliage shade resulted in genome hypomethylation
in Stellaria longipes (Tatra et al. 2000). Additionally,
demethylation was a crucial factor controlling stem
elongation (Tatra et al. 2000) and thus might trigger
shade-avoidance responses. Overall, our results indicate
that while demethylation is a common response to
stress, species-specific and stress-specific responses are
to be expected.
Conclusions
The results of our study suggest that DNA methylation
variation plays a decisive role in the response of V. elat-
ior to changing light conditions. Epigenetic population
differentiation was more strongly related to habitat
types than was genetic differentiation and epigenetic
© 2014 John Wiley & Sons Ltd
3534 B. SCHULZ, R . L . ECKSTEIN and W. DURKA
outlier loci led to a stronger habitat related population
clustering than genetic outlier loci. This implies that
under dynamic conditions the environmental shaping
of the epigenome is a stronger force than selection
changing the genome. Especially for rare and inbreed-
ing species like V. elatior suffering from spatial isolation
and small population sizes, genetically independent
adaptive epigenetic variation may facilitate long-term
population survival in dynamic and strongly contrast-
ing habitats. Thus, provided that epigenetic variation is
heritable, ‘soft inheritance’, that is, environmentally
induced methylation change, represents an alternative
system to classical ‘hard inheritance’.
The application of a novel MSAP-scoring approach
revealed new insights into the contribution of methyla-
tion types to population differentiation and potential
habitat-related adaptation. Using a pure methylation-
scoring approach would have obscured the association
between the environment and demethylated fragments,
thus missing information about the putative transcrip-
tional active part of the epigenome, as well as about
corresponding outlier pairs that may represent an epi-
genetic switch mechanism. Future epigenetic population
studies using mixed scoring approaches will give fur-
ther insights into the interplay of methylation types and
will show if the differences observed in this study rep-
resent a general epigenetic pattern under contrasting
environmentally conditions.
Acknowledgements
We want to thank Josef Scholz vom Hofe and Lena F€ohr for
help during field work, and Aur�elie Bonin, Ovidiu Paun and
two anonymous reviewers for valuable comments on the man-
uscript. Financial support was obtained from the Deutsche
Forschungsgemeinschaft (DFG, grant EC209/7-1).
References
Abratowska A, Wasowicz P, Bednarek PT, Telka J, Wierzbicka
M (2012) Morphological and genetic distinctiveness of metal-
licolous and non-metallicolous populations of Armeria mariti-
ma s.l. (Plumbaginaceae) in Poland. Plant Biology, 14, 586–595.
Angers B, Castonguay E, Massicotte R (2010) Environmentally
induced phenotypes and DNA methylation: how to deal
with unpredictable conditions until the next generation and
after. Molecular Ecology, 19, 1283–1295.Antao T, Beaumont MA (2011) Mcheza: a workbench to detect
selection using dominant markers. Bioinformatics, 27, 1717–1718.
Beaumont MA, Balding DJ (2004) Identifying adaptive genetic
divergence among populations from genome scans. Molecular
Ecology, 13, 969–980.Berger SL (2007) The complex language of chromatin regula-
tion during transcription. Nature, 447, 407–412.
Bonin A, Ehrich D, Manel S (2007) Statistical analysis of ampli-
fied fragment length polymorphism data: a toolbox for
molecular ecologists and evolutionists. Molecular Ecology, 16,
3737–3758.Bossdorf O, Richards CL, Pigliucci M (2008) Epigenetics for
ecologists. Ecology Letters, 11, 106–115.Boyko A, Kovalchuk I (2011) Genome instability and epigenetic
modification—heritable responses to environmental stress?
Current Opinion in Plant Biology, 14, 260–266.
Boyko A, Blevins T, Yao Y et al. (2010) Transgenerational adap-
tation of Arabidopsis to stress requires DNA methylation and
the function of Dicer-like proteins. PLoS ONE, 5, e9514.
Br€autigam K, Vining KJ, Lafon-Placette C et al. (2013) Epige-
netic regulation of adaptive responses of forest tree species
to the environment. Ecology and Evolution, 3, 399–415.
Castonguay E, Angers B (2012) The key role of epigenetics in
the persistence of asexual lineages. Genetics Research Interna-
tional, 2012, 1–9.Choi C-S, Sano H (2007) Abiotic-stress induces demethylation
and transcriptional activation of a gene encoding a glycer-
ophosphodiesterase-like protein in tobacco plants. Molecular
Genetics and Genomics, 277, 589–600.Correia B, Valledor L, Meij�on M et al. (2013) Is the interplay
between epigenetic markers related to the acclimation of
cork oak plants to high temperatures? PLoS ONE, 8,
e53543.
Culley TM, Wolfe AD (2001) Population genetic structure of
the cleistogamous plant species Viola pubescens Aiton (Viola-
ceae), as indicated by allozyme and ISSR molecular markers.
Heredity, 86, 545–556.
Durka W, Nossol C, Welk E et al. (2012) Extreme genetic dep-
auperation and differentiation of both populations and spe-
cies in Eurasian feather grasses (Stipa). Plant Systematics and
Evolution, 299, 259–269.
Eckstein RL, Otte A (2005) Effects of cleistogamy and pollen
source on seed production and offspring performance in
three endangered violets. Basic and Applied Ecology, 6, 339–350.
Eckstein RL, H€olzel N, Danihelka J (2006) Biological Flora of
Central Europe: Viola elatior, V. pumila and V. stagnina. Per-
spectives in Plant Ecology, Evolution and Systematics, 8, 45–66.Excoffier L, Lischer H (2010) Arlequin suite ver 3.5: a new ser-
ies of programs to perform population genetics analyses
under Linux and Windows. Molecular Ecology Resources, 10,
564–567.Feng S, Jacobsen SE, Reik W (2010) Epigenetic reprogramming
in plant and animal development. Science, 330, 622–627.Flatscher R, Frajman B, Sch€onswetter P, Paun O (2012) Envi-
ronmental heterogeneity and phenotypic divergence: can
heritable epigenetic variation aid speciation? Genetics
Research International, 2012, 1–9.Flores KB, Wolschin F, Amdam GV (2013) The role of methyla-
tion of DNA in environmental adaptation. Integrative and
Comparative Biology, 53, 359–372.
Foll M, Gaggiotti O (2008) A genome-scan method to identify
selected loci appropriate for both dominant and codominant
markers: a Bayesian perspective. Genetics, 180, 977–993.Frazer GW, Canham CD, Lertzman KP (1999) Gap Light Ana-
lyzer (GLA), Version 2.0: Imaging Software to Extract Canopy
Structure and Gap Light Transmission Indices from True-Colour
Fisheye Photographs, Users Manual and Program Documentation.
© 2014 John Wiley & Sons Ltd
EPIGENETIC VARIATION ALONG A LIGHT GRADIENT 3535
Simon Fraser University, Burnaby, British Columbia,
Canada; and Institute of Ecosystem, Millbrook, New York.
Greco M, Chiappetta A, Bruno L, Bitonti M (2013) Effects of
light deficiency on genome methylation in Posidonia oceanica.
Marine Ecology Progress Series, 473, 103–114.
Herman JJ, Spencer HG, Donohue K, Sultan SE (2014) How sta-
ble “should” epigenetic modifications be? Insights from
adaptive plasticity and bet hedging. Evolution, 68, 632–643.Herrera CM, Bazaga P (2010) Epigenetic differentiation and
relationship to adaptive genetic divergence in discrete popu-
lations of the violet Viola cazorlensis. New Phytologist, 187,
867–876.Herrera CM, Bazaga P (2013) Epigenetic correlates of plant
phenotypic plasticity: DNA methylation differs between
prickly and nonprickly leaves in heterophyllous Ilex aquifoli-
um (Aquifoliaceae) trees. Botanical Journal of the Linnean Soci-
ety, 171, 441–452.
Herrera CM, Medrano M, Bazaga P (2013) Epigenetic differenti-
ation persists after male gametogenesis in natural populations
of the perennial herb Helleborus foetidus (Ranunculaceae).
PLoS ONE, 8, e70730.
Herrera CM, Medrano M, Bazaga P (2014) Variation in DNA
methylation transmissibility, genetic heterogeneity and
fecundity-related traits in natural populations of the peren-
nial herb Helleborus foetidus. Molecular Ecology, 23, 1085–1095.
Honnay O, Bossuyt B, Jacquemyn H, Shimono A, Uchiyama K
(2008) Can a seed bank maintain the genetic variation in the
above ground plant population? Oikos, 117, 1–5.
Jablonka E, Raz G (2009) Transgenerational epigenetic inheri-
tance: prevalence, mechanisms, and implications for the
study of heredity and evolution. The Quarterly Review of Biol-
ogy, 84, 131–176.
Joost S, Bonin A, Bruford MW et al. (2007) A spatial analysis
method (SAM) to detect candidate loci for selection: towards
a landscape genomics approach to adaptation. Molecular
Ecology, 16, 3955–3969.
Kou HP, Li Y, Song XX et al. (2011) Heritable alteration in DNA
methylation induced by nitrogen-deficiency stress accompa-
nies enhanced tolerance by progenies to the stress in rice
(Oryza sativa L.). Journal of Plant Physiology, 168, 1685–1693.
Labra M, Ghiani A, Citterio S et al. (2002) Analysis of cytosine
methylation pattern in response to water deficit in pea root
tips. Plant Biology, 4, 694–699.Latzel V, Allan E, Bortolini Silveira A et al. (2013) Epigenetic
diversity increases the productivity and stability of plant
populations. Nature Communications, 4, 2875. doi:10.1038/
ncomms3875.
Ledon-Rettig CC (2013) Ecological epigenetics: an introduction
to the symposium. Integrative and Comparative Biology, 53,
307–318.
Legendre P, Legendre L (1998) Numerical Ecology. Elsevier Sci-
ence, Amsterdam.
Lira-Medeiros CF, Parisod C, Fernandes RA et al. (2010) Epige-
netic variation in mangrove plants occurring in contrasting
natural environment. PLoS ONE, 5, e10326.
Lu G, Wu X, Chen B, Gao G, Xu K (2007) Evaluation of genetic
and epigenetic modification in rapeseed (Brassica napus)
induced by salt stress. Journal of Integrative Plant Biology, 49,
1599–1607.Mougel C, Thioulouse J, Perri G, Nesme X (2002) A mathemati-
cal method for determining genome divergence and species
delineation using AFLP. International Journal of Systematic and
Evolutionary Microbiology, 52, 573–586.Nobis M, Hunziker U (2005) Automatic thresholding for hemi-
spherical canopy-photographs based on edge detection. Agri-
cultural and Forest Meteorology, 128, 243–250.
Oksanen J, Kindt R, Legendre P et al. (2007) vegan: Community
ecology package version 1.15-1. Available from http://www.
r-project.org.
Paun O, Bateman RM, Fay MF et al. (2010) Stable epigenetic
effects impact adaptation in allopolyploid orchids (Dactylorhiza:
Orchidaceae).Molecular Biology and Evolution, 27, 2465–2473.
Peakall ROD, Smouse PE (2006) GENALEX 6: genetic analysis
in Excel. Population genetic software for teaching and
research. Molecular Ecology Notes, 6, 288–295.Richards EJ (2006) Inherited epigenetic variation—revisiting
soft inheritance. Nature Reviews Genetics, 7, 395–401.Richards CL, Schrey AW, Pigliucci M (2012) Invasion of
diverse habitats by few Japanese knotweed genotypes is cor-
related with epigenetic differentiation. Ecology Letters, 15,
1016–1025.Sahu PP, Pandey G, Sharma N et al. (2013) Epigenetic mecha-
nisms of plant stress responses and adaptation. Plant Cell
Reports, 32, 1151–1159.
Salmon A, Clotault J, Jenczewski E, Chable V, Manzanares-
Dauleux MJ (2008) Brassica oleracea displays a high level of
DNA methylation polymorphism. Plant Science, 174, 61–70.Saze H, Tsugane K, Kanno T, Nishimura T (2012) DNA meth-
ylation in plants: relationship to small RNAs and histone
modifications, and functions in transposon inactivation. Plant
and Cell Physiology, 53, 766–784.
Schrey AW, Coon CAC, Grispo MT et al. (2012) Epigenetic var-
iation may compensate for decreased genetic variation with
introductions: a case study using house sparrows (Passer do-
mesticus) on two continents. Genetics Research International,
2012, 1–7.Schulz B, Eckstein RL, Durka W (2013) Scoring and analysis of
methylation-sensitive amplification polymorphisms for epi-
genetic population studies. Molecular Ecology Resources, 13,
642–653.Shea N, Pen I, Uller T (2011) Three epigenetic information
channels and their different roles in evolution: epigenetic
mechanisms and evolution. Journal of Evolutionary Biology, 24,
1178–1187.Sun M (1999) Cleistogamy in Scutellaria indica (Labiatae): effec-
tive mating system and population genetic structure. Molecu-
lar Ecology, 8, 1285–1295.
Tatra GS, Miranda J, Chinnappa CC, Reid DM (2000) Effect of
light quality and 5-azacytidine on genomic methylation and
stem elongation in two ecotypes of Stellaria longipes. Physiolo-
gia Plantarum, 109, 313–321.
Verhoeven KJF, Preite V (2014) Epigenetic variation in asexu-
ally reproducing organisms. Evolution, 68, 644–655.
Verhoeven KJF, Jansen JJ, Van Dijk PJ, Biere A (2010) Stress-
induced DNA methylation changes and their heritability in
asexual dandelions. New Phytologist, 185, 1108–1118.Wada Y, Miyamoto K, Kusano T, Sano H (2004) Association
between up-regulation of stress-responsive genes and hy-
pomethylation of genomic DNA in tobacco plants. Molecular
Genetics and Genomics, 271, 658–666.Wang W, Zhao X, Pan Y et al. (2011) DNA methyla-
tion changes detected by methylation-sensitive amplified
© 2014 John Wiley & Sons Ltd
3536 B. SCHULZ, R . L . ECKSTEIN and W. DURKA
polymorphism in two contrasting rice genotypes under salt
stress. Journal of Genetics and Genomics, 38, 419–424.Wu W-Q, Yi MR, Wang X-F et al. (2013) Genetic and epigenetic
differentiation between natural Betula ermanii (Betulaceae)
populations inhabiting contrasting habitats. Tree Genetics &
Genomes, 9, 1321–1328.Yu Y, Yang X, Wang H et al. (2013) Cytosine methylation alter-
ation in natural populations of Leymus chinensis induced by
multiple abiotic stresses. PLoS ONE, 8, e55772.
Zhang Y, Chen JM, Millerb JR (2005) Determining digital hemi-
spherical photograph exposure for leaf area index estimation.
Agricultural and Forest Meteorology, 133, 166–181.Zhang Y-Y, Fischer M, Colot V, Bossdorf O (2013) Epigenetic
variation creates potential for evolution of plant phenotypic
plasticity. New Phytologist, 197, 314–322.
Zhong X, Wang Y, Liu X et al. (2009) DNA methylation poly-
morphism in annual wild soybean (Glycine soja Sieb. et
Zucc.) and cultivated soybean (G. max L. Merr.). Canadian
Journal of Plant Science, 89, 851–863.
B.S., R.L.E. and W.D. designed research; B.S. and R.L.E.
performed field work; B.S. and W.D. performed labora-
tory work; B.S. analysed data and wrote the manuscript
with contributions from W.D. and R.L.E.
Data accessibility
Grid maps with individual sample and hemispherical
photography coordinates, and AFLP and MSAP data
are deposited at the Dryad repository under the acces-
sion doi:10.5061/dryad.m1b66.
Supporting information
Additional supporting information may be found in the online ver-
sion of this article.
Appendix S1 AFLP and MSAP protocol.
Table S1 Adaptor and primer sequences used for AFLP and
MSAP analyses.
Table S2 Pairwise population /ST for AFLP loci and MSAP
subepiloci.
Table S3 Results of simple and partial Mantel tests for genetic
and epigenetic pairwise population /ST with geographic dis-
tance and habitat matrices.
Table S4 Detailed list of AFLP outlier loci.
Table S5 Detailed list of MSAP outlier subepiloci.
© 2014 John Wiley & Sons Ltd
EPIGENETIC VARIATION ALONG A LIGHT GRADIENT 3537