Embed Size (px)
Citation preview
Epigenetic silencing of microRNA-203 is required for EMT and cancer stem cell
properties
Joseph H. Taube1,2, Gabriel G. Malouf3,4, Emily Lu5, Nathalie Sphyris1,2, Vidya Vijay1,2,
Priyanka P. Ramachandran1,2, Katumasa R. Ueno1, Sanchaika Gaur1, Milena S.
Nicoloso6, Simona Rossi6, Jason I. Herschkowitz7, Jeffrey M. Rosen7, Jean-Pierre J.
Issa8, George A. Calin6, Jeffrey T. Chang5,9, Sendurai A. Mani1,2, *
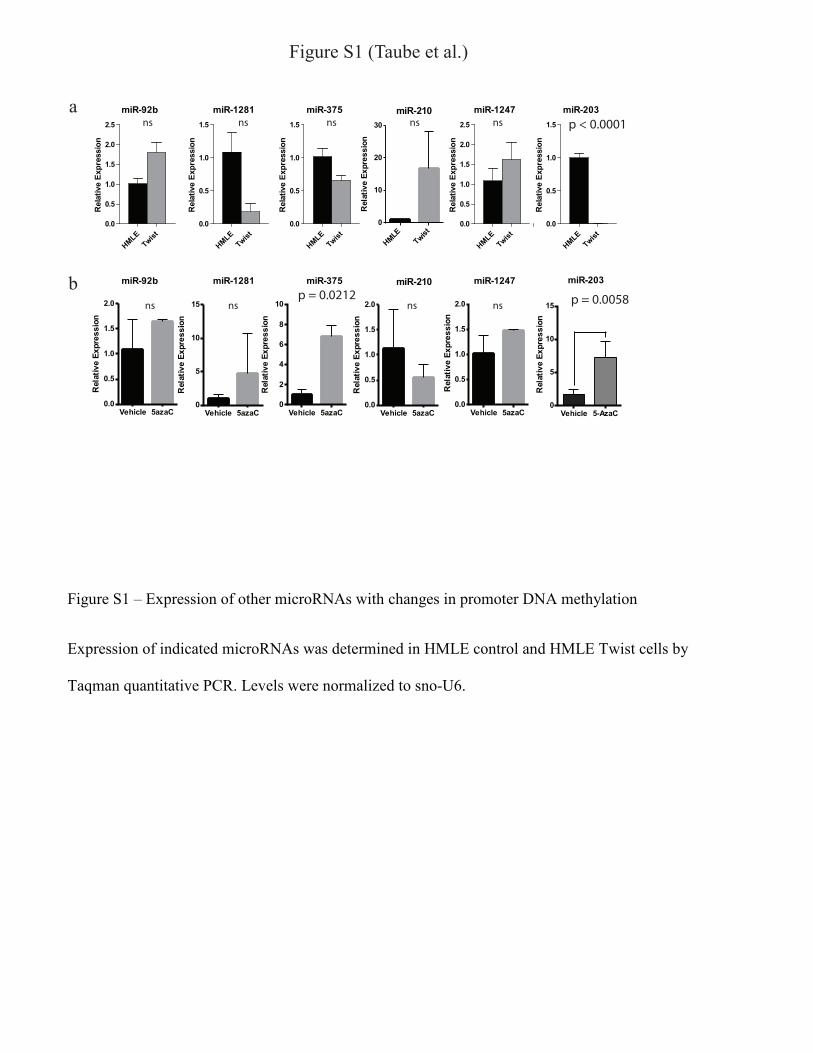
Figure S1 (Taube et al.)
a
b
miR-92b
HMLETwist
0.0
0.5
1.0
1.5
2.0
2.5
Rel
ativ
e Ex
pres
sion
miR-375
HMLETwist
0.0
0.5
1.0
1.5
Rel
ativ
e Ex
pres
sion
miR-1247
HMLETwist
0.0
0.5
1.0
1.5
2.0
2.5
Rel
ativ
e Ex
pres
sion
miR-1281
HMLETwist
0.0
0.5
1.0
1.5
Rel
ativ
e Ex
pres
sion
miR-203
miR-203
HMLETwist
0.0
0.5
1.0
1.5
Rel
ativ
e Ex
pres
sion
Figure S1 – Expression of other microRNAs with changes in promoter DNA methylation
Expression of indicated microRNAs was determined in HMLE control and HMLE Twist cells by
Taqman quantitative PCR. Levels were normalized to sno-U6.
Rel
ativ
e Ex
pres
sion
Vehicle 5azaC0.0
0.5
1.0
1.5
2.0
Rel
ativ
e Ex
pres
sion
Vehicle 5azaC0
5
10
15
Rel
ativ
e Ex
pres
sion
Vehicle 5azaC0
2
4
6
8
10
Rel
ativ
e Ex
pres
sion
Rel
ativ
e Ex
pres
sion
Vehicle 5azaC0.0
0.5
1.0
1.5
2.0
Rel
ativ
e Ex
pres
sion
Vehicle 5azaC0.0
0.5
1.0
1.5
2.0
miR-210
miR-92b miR-375 miR-1247miR-1281 miR-210
Rel
ativ
e Ex
pres
sion
HMLETwist
0
10
20
30
ns ns ns ns
nsnsnsnsns
Vehicle 5-AzaC0
5
10
15
p < 0.0001
p = 0.0212 p = 0.0058
D
A
Figure S2 (Taube et al.)
miR-20
3let
-7a
miR-92
a
miR-10
7
miR-12
6
miR-15
5
miR-20
0b
miR-22
4
miR-45
0a
miR-87
40.00001
0.0001
0.001
0.01
0.1
1
10
100 SUM159 ControlSUM159 miR-203
Fold
Cha
nge
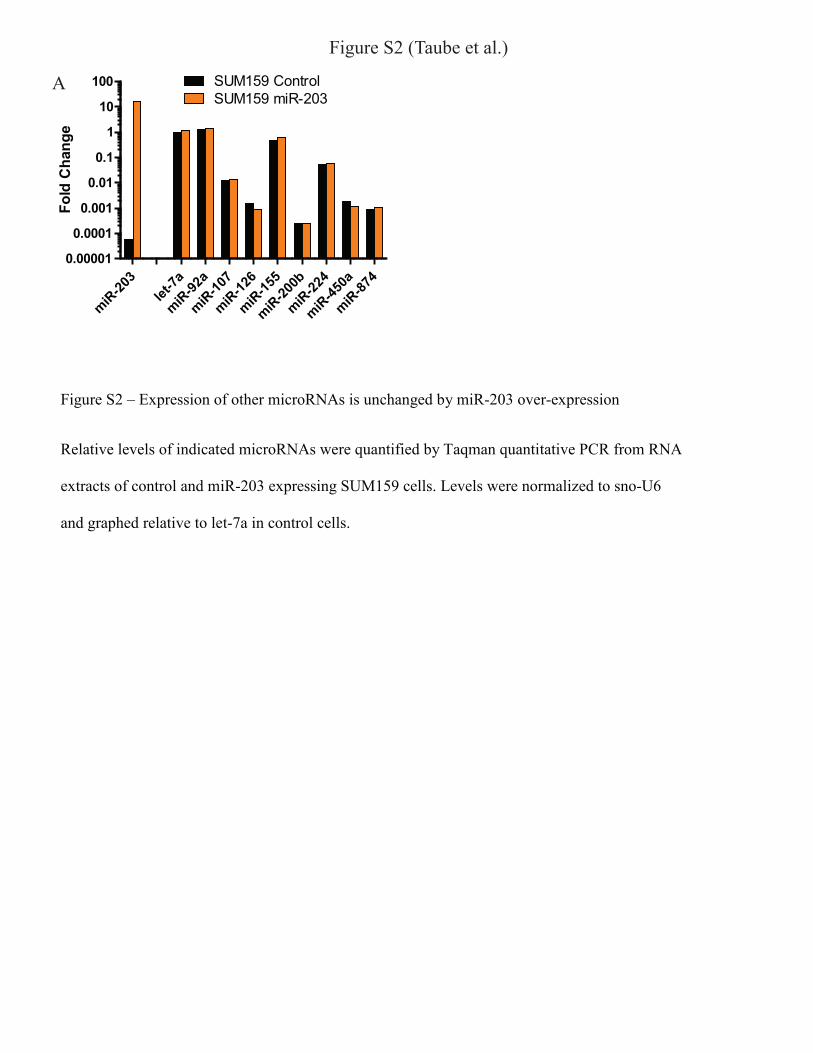
Figure S2 – Expression of other microRNAs is unchanged by miR-203 over-expression
Relative levels of indicated microRNAs were quantified by Taqman quantitative PCR from RNA
extracts of control and miR-203 expressing SUM159 cells. Levels were normalized to sno-U6
and graphed relative to let-7a in control cells.
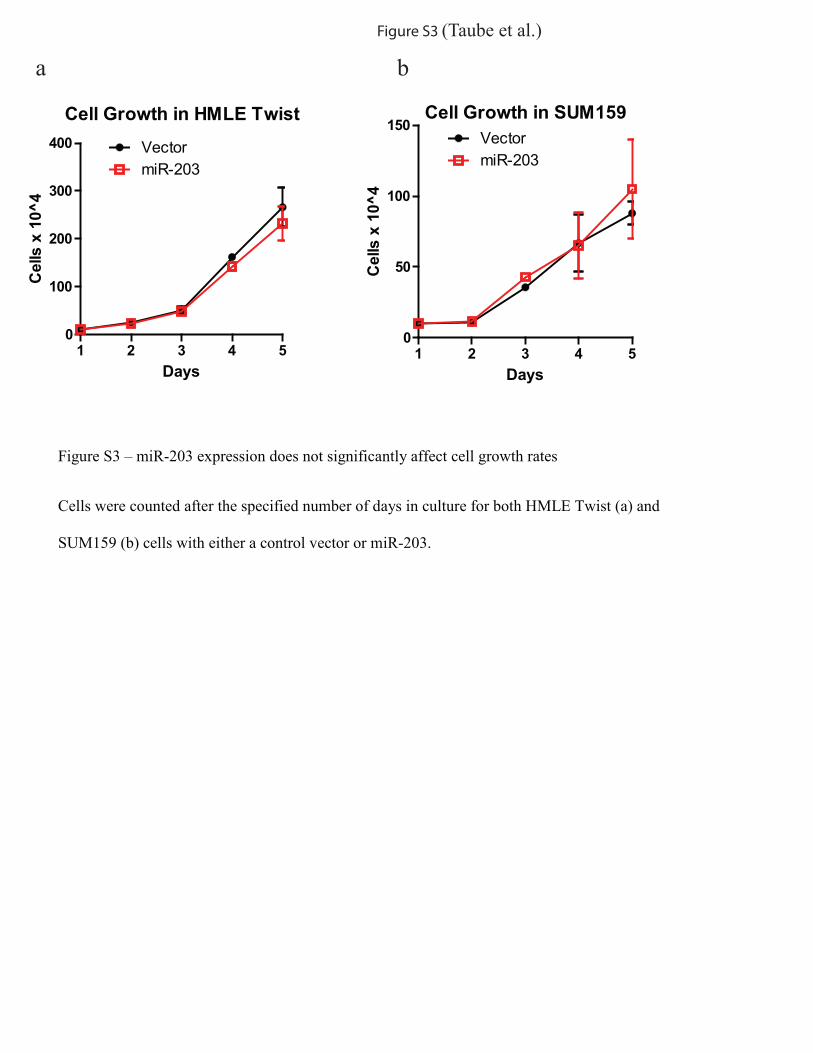
Figure S3 (Taube et al.)
a b
Figure S3 – miR-203 expression does not significantly affect cell growth rates
Cells were counted after the specified number of days in culture for both HMLE Twist (a) and
SUM159 (b) cells with either a control vector or miR-203.
Cell Growth in HMLE Twist
1 2 3 4 50
100
200
300
400 VectormiR-203
Days
Cel
ls x
10^
4
Cell Growth in SUM159
1 2 3 4 50
50
100
150VectormiR-203
DaysC
ells
x 1
0^4
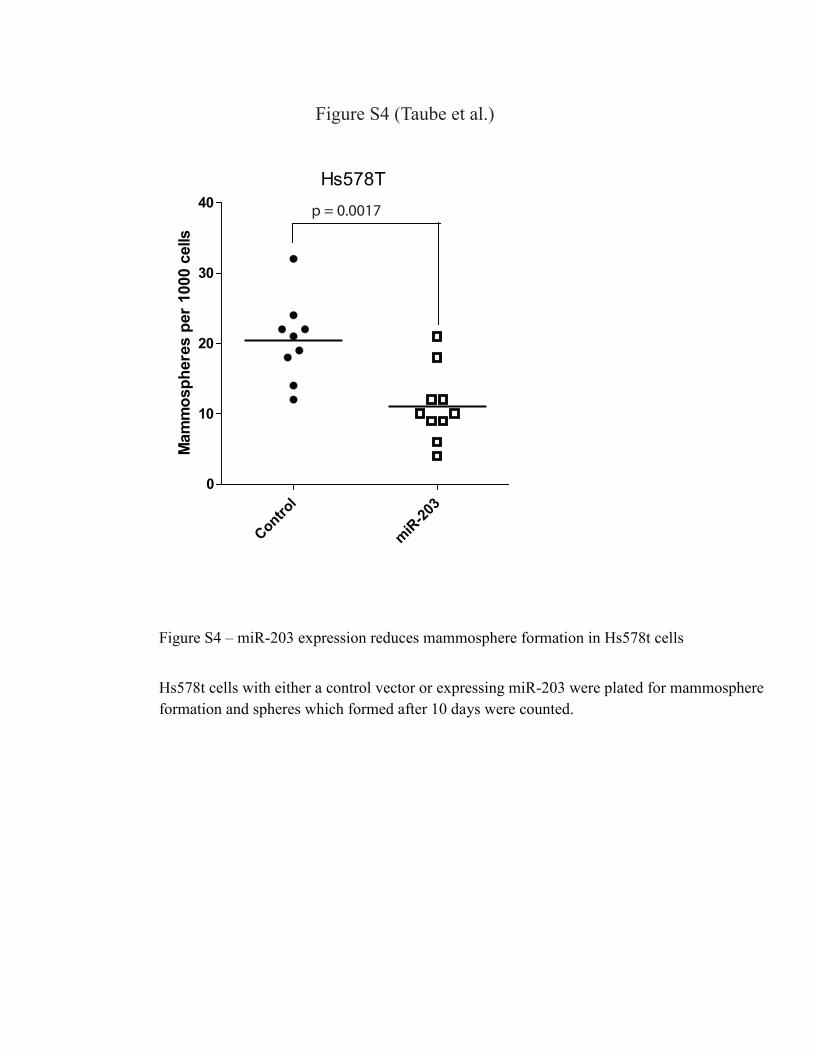
Figure S4 (Taube et al.)
Hs578T
Control
miR-20
30
10
20
30
40M
amm
osph
eres
per
100
0 ce
lls
Figure S4 – miR-203 expression reduces mammosphere formation in Hs578t cells
Hs578t cells with either a control vector or expressing miR-203 were plated for mammosphere formation and spheres which formed after 10 days were counted.
p = 0.0017
a
Figure S5 (Taube et al.)
Control miR-2030
5
10
15
20
25%
CD
24+
cells
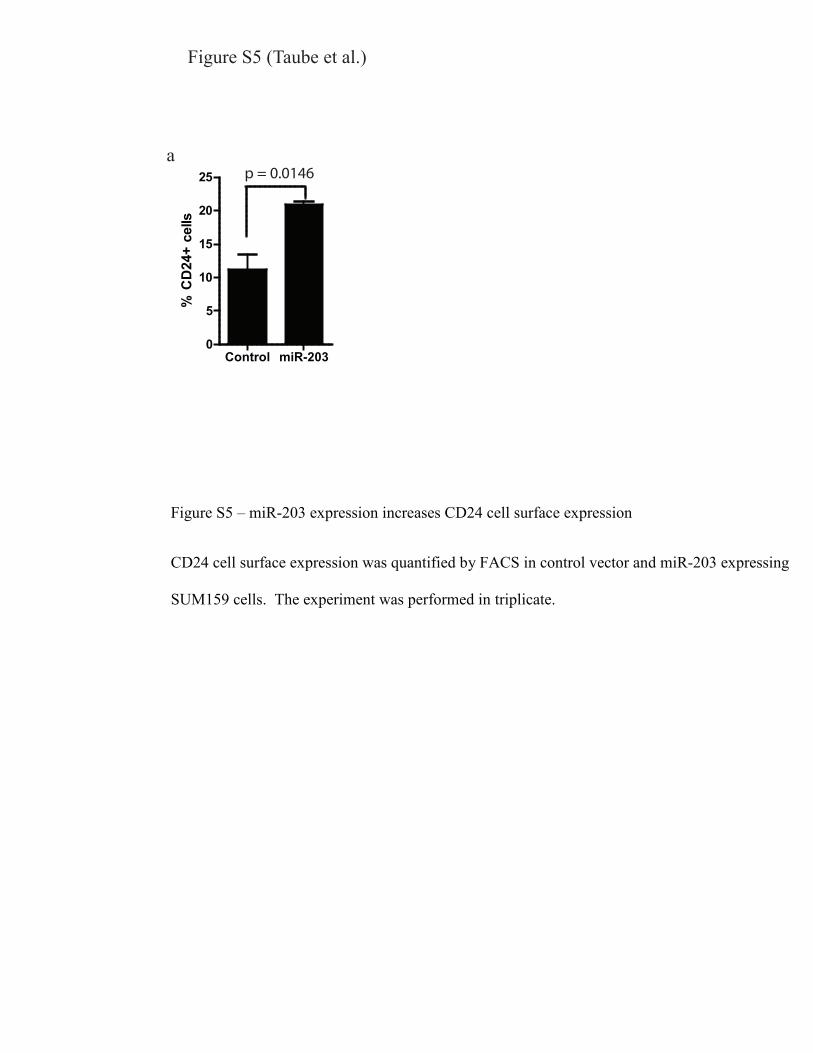
Figure S5 – miR-203 expression increases CD24 cell surface expression
CD24 cell surface expression was quantified by FACS in control vector and miR-203 expressing
SUM159 cells. The experiment was performed in triplicate.
p = 0.0146
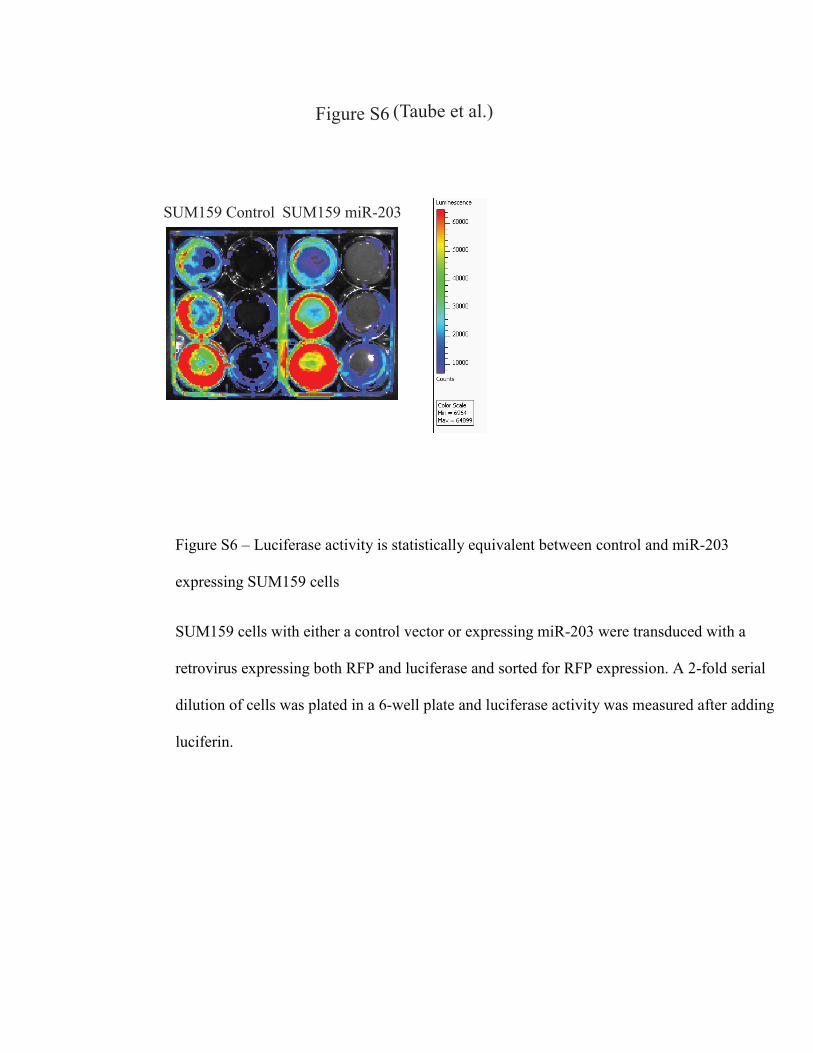
SUM159 Control SUM159 miR-203
Figure S6
Figure S6 – Luciferase activity is statistically equivalent between control and miR-203
expressing SUM159 cells
SUM159 cells with either a control vector or expressing miR-203 were transduced with a
retrovirus expressing both RFP and luciferase and sorted for RFP expression. A 2-fold serial
dilution of cells was plated in a 6-well plate and luciferase activity was measured after adding
luciferin.
(Taube et al.)