Embed Size (px)
Citation preview
International Journal of
Molecular Sciences
Article
Epigenetic Modulation of Human InducedPluripotent Stem Cell Differentiationto Oligodendrocytes
Panagiotis Douvaras 1, Tomasz Rusielewicz 1, Kwi Hye Kim 2, Jeffery D. Haines 2,Patrizia Casaccia 2,* and Valentina Fossati 1,*
1 The New York Stem Cell Foundation Research Institute, New York, NY 10032, USA;[email protected] (P.D.); [email protected] (T.R.)
2 Department of Neuroscience, Icahn School of Medicine at Mount Sinai, New York, NY 10029, USA;[email protected] (K.H.K.); [email protected] (J.D.H.)
* Correspondence: [email protected] (P.C.); [email protected] (V.F.);Tel.: +1-212-659-5988 (P.C.); +1-212-851-5422 (V.F.)
Academic Editor: Wenbin DengReceived: 11 March 2016; Accepted: 19 April 2016; Published: 22 April 2016
Abstract: Pluripotent stem cells provide an invaluable tool for generating human, disease-relevantcells. Multiple sclerosis is an inflammatory demyelinating disease of the central nervous system,characterized by myelin damage. Oligodendrocytes are the myelinating cells of the central nervoussystem (CNS); they differentiate from progenitor cells, and their membranes ensheath axons,providing trophic support and allowing fast conduction velocity. The current understanding ofoligodendrocyte biology was founded by rodent studies, where the establishment of repressiveepigenetic marks on histone proteins, followed by activation of myelin genes, leads to lineageprogression. To assess whether this epigenetic regulation is conserved across species, we differentiatedhuman embryonic and induced pluripotent stem cells to oligodendrocytes and asked whethersimilar histone marks and relative enzymatic activities could be detected. The transcriptional levelsof enzymes responsible for methylation and acetylation of histone marks were analyzed duringoligodendrocyte differentiation, and the post-translational modifications on histones were detectedusing immunofluorescence. These studies showed that also in human cells, differentiation alongthe oligodendrocyte lineage is characterized by the acquisition of multiple repressive histone marks,including deacetylation of lysine residues on histone H3 and trimethylation of residues K9 and K27.These data suggest that the epigenetic modulation of oligodendrocyte identity is highly conservedacross species.
Keywords: human induced pluripotent stem cells; oligodendrocyte differentiation; histone modifications
1. Introduction
Over the past decade, advances in stem cell biology led to the possibility of reprogrammingsomatic cells to a pluripotent state equivalent to that of embryonic stem cells (ESCs). Inducedpluripotent stem cells (iPSCs) have been extensively used since their discovery to generate any desiredsomatic cell type [1]. iPSC technology is emerging as a particularly useful tool for understandingdiseases, such as neurodegenerative disorders, that lack a good animal model. While studies havebeen hampered by the limited access to primary brain cells, only through highly invasive procedures,the differentiation of iPSCs offers the unprecedented opportunity of obtaining disease-relevant cellsin large numbers [2–4]. Notably, building on pioneering studies [5,6], our laboratory has recentlydeveloped an efficient differentiation protocol to generate iPSC-derived oligodendrocyte progenitorcells (OPCs) and oligodendrocytes [7].
Int. J. Mol. Sci. 2016, 17, 614; doi:10.3390/ijms17040614 www.mdpi.com/journal/ijms
Int. J. Mol. Sci. 2016, 17, 614 2 of 16
OPCs are the myelinating cells of the central nervous system (CNS). They differentiate into highlyarborized oligodendrocytes, expressing myelin-specific proteins and reaching out with their processesto proximal nerve fibers. Recognition and contact with axonal targets induce the synthesis of lipid-richlamellae of myelin and wrapping of segments of axons into a compact multilayer spiral. This creates ahighly specialized insulation that allows for the fast and efficient transmission of electrical signals [8].The importance of myelin is evident in pathological conditions, such as multiple sclerosis (MS), inwhich its damage results in slower impulse transmission, more vulnerable axons, functional deficitsand eventually irreversible axonal degeneration. Genetic deletion of oligodendrocyte-specific proteins,such as 21,31-cyclic nucleotide phosphohydrolase (CNP) in transgenic mice, does not lead to anyapparent defect in myelin, but causes profound axonal degeneration in the long-term, manifestedthrough progressive accumulation of neurological symptoms (e.g., convulsions, gait abnormalities,weakness) and ultimately precocious death [9]. These findings suggest that oligodendrocytes andmyelin are essential for neuronal health and optimal CNS functioning, and recent evidence highlightedthe importance of myelin in cognition, memory and learning of complex skills [10]. Thus, a thoroughunderstanding of the processes leading to the generation of myelinating oligodendrocytes is of highrelevance to a vast number of neurological and psychiatric disorders. Most of our knowledge onthe processes of oligodendrocyte differentiation and maturation has been extensively investigated,and their major regulators have been identified in rodent models [11–15]. It is now clear that theoligodendrocyte lineage commitment results from subsequent waves of regulation of gene expressionthat first reduce precursor markers and inhibitory signals and then increase the expression of maturemarkers. This is achieved by the deposition of specific repressive and activating marks on lysineresidues in the tail of histone H3 [11,15,16]. In particular, deacetylation of lysine residues on H3 hasbeen involved in the early repression of transcriptional inhibitors of myelin genes at the progenitorstate, as cells stop proliferating and initiate a transcriptional program of differentiation [15,17,18].The repressive trimethylation of K27 (H3K27me3) by the enzyme EZH2 has been shown by our groupand others to critically regulate the repression of neuronal genes during the transition from neuralstem cells (NSCs) to OPCs [19], while the deposition of the trimethyl mark on H3K9 (H3K9me3) hasbeen shown to repress the expression of genes modulating the electrical properties of oligodendrocyteprogenitors, which need to be silenced during the maturation into electrically-silent myelinatingoligodendrocytes [11]. While these studies identified the importance of several epigenetic processesfor developmental myelination in rodents, the translation to human cells is fundamental, and this isthe goal of this study.
In this study, we asked whether the molecular mechanisms of oligodendrocyte differentiation areconserved among species, with an emphasis on the investigation of the repressive changes in histonesoccurring during oligodendrocyte lineage commitment and differentiation of human iPSCs.
2. Results
2.1. Histone Deacetylases, Histone Acetyltransferases and Histone Methyltransferases in HumanOligodendrocyte Differentiation from Embryonic Stem Cells
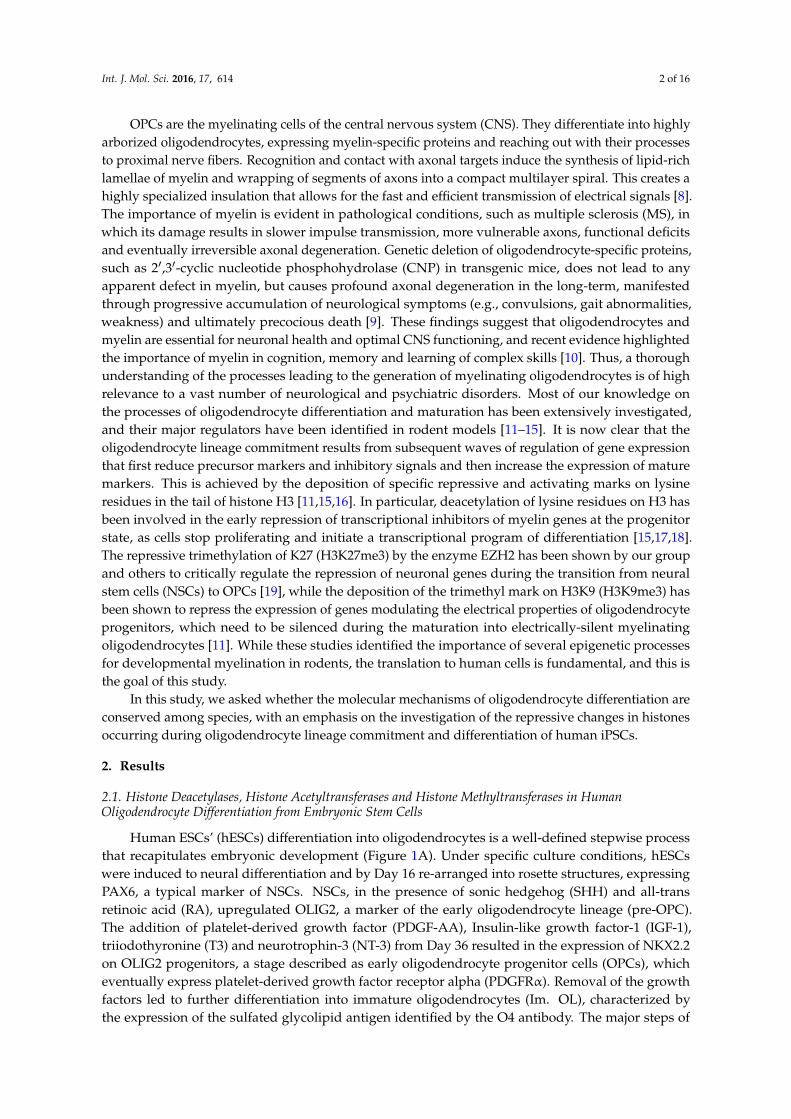
Human ESCs’ (hESCs) differentiation into oligodendrocytes is a well-defined stepwise processthat recapitulates embryonic development (Figure 1A). Under specific culture conditions, hESCswere induced to neural differentiation and by Day 16 re-arranged into rosette structures, expressingPAX6, a typical marker of NSCs. NSCs, in the presence of sonic hedgehog (SHH) and all-transretinoic acid (RA), upregulated OLIG2, a marker of the early oligodendrocyte lineage (pre-OPC).The addition of platelet-derived growth factor (PDGF-AA), Insulin-like growth factor-1 (IGF-1),triiodothyronine (T3) and neurotrophin-3 (NT-3) from Day 36 resulted in the expression of NKX2.2on OLIG2 progenitors, a stage described as early oligodendrocyte progenitor cells (OPCs), whicheventually express platelet-derived growth factor receptor alpha (PDGFRα). Removal of the growthfactors led to further differentiation into immature oligodendrocytes (Im. OL), characterized bythe expression of the sulfated glycolipid antigen identified by the O4 antibody. The major steps of
Int. J. Mol. Sci. 2016, 17, 614 3 of 16
oligodendrocyte differentiation were assessed by immunofluorescent analysis, which highlighted thecharacteristic morphology of cells at each stage of maturation, including bipolar OPCs and ramifiedIm. OL (Figure 1B).
Int. J. Mol. Sci. 2016, 17, 614 3 of 16
oligodendrocyte differentiation were assessed by immunofluorescent analysis, which highlighted the characteristic morphology of cells at each stage of maturation, including bipolar OPCs and ramified Im. OL (Figure 1B).
Figure 1. Expression pattern of histone modifiers and relative histone marks during oligodendrocyte differentiation of ESCs. (A) Diagram depicting the major steps of oligodendrocyte differentiation with the corresponding cellular markers that peak at different days of differentiation. In green are described the technical procedures and in red the reagent withdrawal. ESC: embryonic stem cell; EB: embryoid body; NSC: neural stem cell; OPC: oligodendrocyte progenitor cell; Im. OL: immature oligodendrocyte; (B) Representative images showing immunofluorescent detection of oligodendrocyte-lineage markers during differentiation. From left to right: PAX6 in rosette-like structures, OLIG2 in free-floating spheroids, coexpression of OLIG2 and NKX2.2 in free-floating spheroids, PDGFRα in single cells after trituration of spheroids, live O4 staining in single cells; scale bars: 100 µm; (C) Transcriptional levels of histone acetyltransferases, deacetylases and methyltransferases during oligodendrocyte differentiation. The bars are the mean ± SEM relative to GAPDH; (D) Western blot analysis of specific epigenetic marks on H3 at different days of differentiation; (E) Quantification of Western blots was performed by determining the relative expression level of (from left to right) Ac-H3-K9, Me3-H9-K9 and Me3-H9-K27 relative to histone H3. Data were normalized to ESC, and results are expressed as the mean ± SEM (* p < 0.05; **** p < 0.0001).
Figure 1. Expression pattern of histone modifiers and relative histone marks during oligodendrocytedifferentiation of ESCs. (A) Diagram depicting the major steps of oligodendrocyte differentiation withthe corresponding cellular markers that peak at different days of differentiation. In green are describedthe technical procedures and in red the reagent withdrawal. ESC: embryonic stem cell; EB: embryoidbody; NSC: neural stem cell; OPC: oligodendrocyte progenitor cell; Im. OL: immature oligodendrocyte;(B) Representative images showing immunofluorescent detection of oligodendrocyte-lineage markersduring differentiation. From left to right: PAX6 in rosette-like structures, OLIG2 in free-floatingspheroids, coexpression of OLIG2 and NKX2.2 in free-floating spheroids, PDGFRα in single cells aftertrituration of spheroids, live O4 staining in single cells; scale bars: 100 µm; (C) Transcriptional levels ofhistone acetyltransferases, deacetylases and methyltransferases during oligodendrocyte differentiation.The bars are the mean ˘ SEM relative to GAPDH; (D) Western blot analysis of specific epigeneticmarks on H3 at different days of differentiation; (E) Quantification of Western blots was performed bydetermining the relative expression level of (from left to right) Ac-H3-K9, Me3-H9-K9 and Me3-H9-K27relative to histone H3. Data were normalized to ESC, and results are expressed as the mean ˘ SEM(* p < 0.05; **** p < 0.0001).
Int. J. Mol. Sci. 2016, 17, 614 4 of 16
Others and we have previously shown that the acetylation state of lysine residues onhistone H3 is high in proliferating oligodendrocyte progenitor cells and is catalyzed by histoneacetyltransferases (HATs, which place the acetyl group on lysines), while the early stages ofdifferentiation are characterized by the removal of these activating marks catalyzed by histonedeacetylases (HDACs) [20,21]. Lineage progression is further characterized by repressive histonemethylation of lysine residues K9 and K27, which is catalyzed by specific histone methyltransferasesfor K9 (e.g., EHMT2) [22] and K27 (e.g., EZH2) [23]. As a first step towards the characterizationof epigenetic changes during oligodendrocyte differentiation of human stem cells, we assessed thetranscript levels of histone acetyltransferases, histone deacetylases and histone methyltransferases inthe sequential stages described above (Figure 1C).
Consistent with the previous report of increased acetylation at myelin gene promoters andenhancers during differentiation [24], expression of the acetyltransferase genes CREBBP, EP300 andMYST family showed an increase at the final Im. OL stage of differentiation. On the other hand, thespecific activity of class I HDACs (HDAC-1, -2, -3, -8) has been implicated in the development ofmyelinating oligodendrocytes to initiate chromatin compaction [15]. Transcript levels of HDAC3 andHDAC8 progressively increased from NSCs to Im. OL, while HDAC1 and HDAC2 expression remainsimilar at the various stages of the differentiation.
Next, we examined the expression levels of the major enzymes responsible for the methylation ofH3K9 and H3K27. Our results were consistent with previous reports [19] on increased levels of theH3K27-specific methyltransferase EZH2 during the transition from the NSC stage to the OLIG2 earlyprogenitors’ stage. In addition, we identified a marked increase of the H3K9-specific methyltransferaseEHMT2 (also known as G9a), as progenitors mature into Im. OLs.
To determine whether these patterns of gene expression were associated with actual changesin histone marks, we also performed a Western blot analysis of protein extracts from NSCs, OPCsand Im. OLs (Figure 1D). We have previously shown that rodent oligodendrocyte progenitors inculture and in developing white matter tracts are characterized by histone acetylation [12,15] andthat their differentiation into oligodendrocytes requires HDAC activity to remove the acetyl groupsfrom nucleosomal histone tails [15,17]. Oligodendrocyte differentiation is accompanied by additionalrepressive modifications on histone H3, including: trimethylation of H3K27, which is prominentalready at the OPC stage and di- and tri-methylation of H3K9 residues [11], functionally responsiblefor the repression of alternative lineage traits and electrical excitability during the transition of OPCto myelinating oligodendrocytes [11]. In line with the rodent data, in human cells, we detectedincreased levels of H3K27me3 from NSCs to immature OL and significantly decreased levels of histoneacetylation (i.e., H3K9ac) at the early stages of OPC differentiation, associated with increasing levels ofH3K9me3 during OPC maturation (Figure 1E).
2.2. The Epigenetic Signature Is Conserved in Induced Pluripotent Stem Cell-Derived Oligodendrocytes
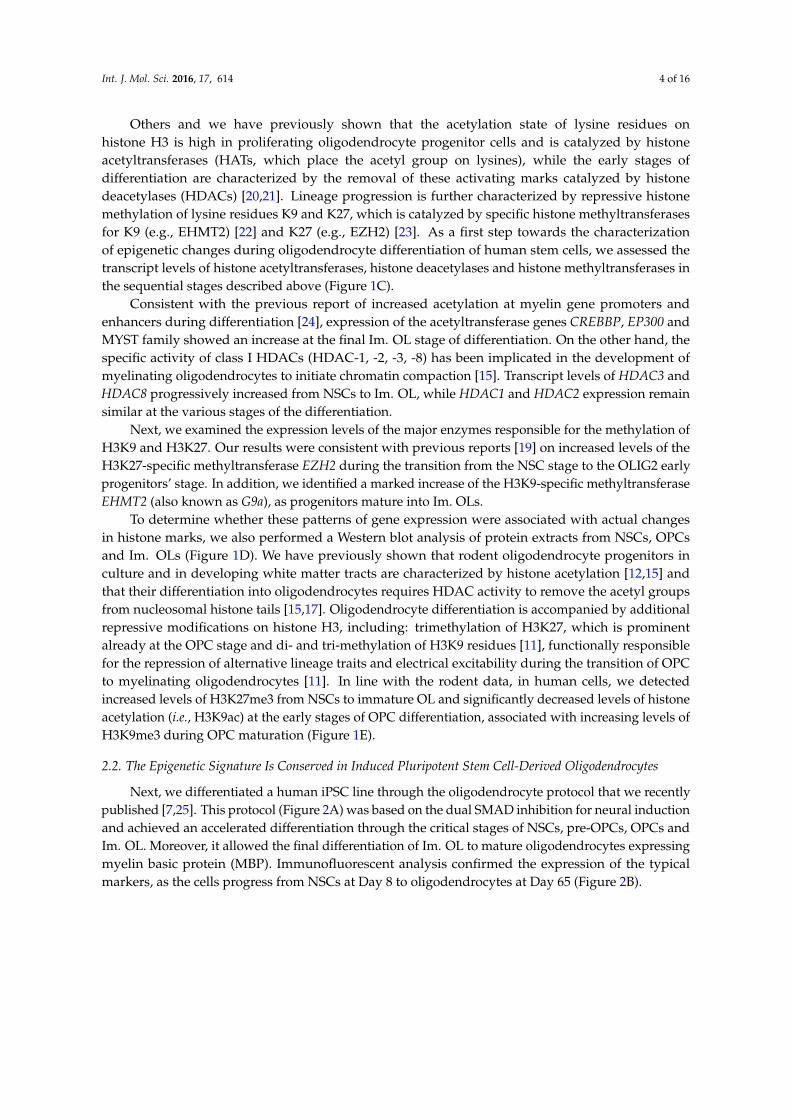
Next, we differentiated a human iPSC line through the oligodendrocyte protocol that we recentlypublished [7,25]. This protocol (Figure 2A) was based on the dual SMAD inhibition for neural inductionand achieved an accelerated differentiation through the critical stages of NSCs, pre-OPCs, OPCs andIm. OL. Moreover, it allowed the final differentiation of Im. OL to mature oligodendrocytes expressingmyelin basic protein (MBP). Immunofluorescent analysis confirmed the expression of the typicalmarkers, as the cells progress from NSCs at Day 8 to oligodendrocytes at Day 65 (Figure 2B).
Int. J. Mol. Sci. 2016, 17, 614 5 of 16Int. J. Mol. Sci. 2016, 17, 614 5 of 16
Figure 2. Transcriptional profile of histone modifiers during differentiation of human induced pluripotent stem cells (iPSCs) into oligodendrocytes. (A) Schematic representation of the oligodendrocyte differentiation protocol, including oligodendrocyte lineage markers along the differentiation. In green are described the technical procedures and in red the reagent withdrawal; (B) Representative images depicting the most important oligodendrocyte lineage markers after immunofluorescent labeling. From left to right: PAX6, OLIG2 in the 3D structures, SOX10 and OLIG2 staining in cells growing out of the plated aggregates, live O4 staining of cells migrating out of the spheres, myelin basic protein (MBP) staining of oligodendrocytes at the end of the differentiation; scale bars: 200 µm; (C) Quantitative RT-PCR showed differences in the transcript levels of enzymes responsible for acetylation, deacetylation and methylation during oligodendrocyte lineage commitment. The bars are the mean ± SEM, relative to GAPDH levels.
The levels of the EED and EZH2, subunits of the enzymatic complex responsible for H3K27 methylation, peaked at the NSC stage and slowly tapered off as OPC differentiated. Surprisingly, EZH1 expression was increased in both ESC-derived Im. OL and iPSC-derived OL (Figures 1C and 2C).
Among the enzymes responsible for the di- and tri-methylation of H3K9, EHMT2 expression increased at the OPC and mature oligodendrocyte stages; SUV39H1 expression remained constant over time; and SUV39H2 expression slightly increased from the NSC stage (Figure 2C).
To validate the functional significance of the transcriptional data on histone modifiers, we asked whether the histone marks in differentiated iPSCs would be consistent with the predicted changes of enzymatic activities. For this reason, we performed double immunofluorescence using antibodies specific for each stage-appropriate oligodendrocyte marker and for the post-translational modifications of lysine residues on histone H3 (Figures 3–6).
Figure 2. Transcriptional profile of histone modifiers during differentiation of human inducedpluripotent stem cells (iPSCs) into oligodendrocytes. (A) Schematic representation of theoligodendrocyte differentiation protocol, including oligodendrocyte lineage markers along thedifferentiation. In green are described the technical procedures and in red the reagent withdrawal;(B) Representative images depicting the most important oligodendrocyte lineage markers afterimmunofluorescent labeling. From left to right: PAX6, OLIG2 in the 3D structures, SOX10 andOLIG2 staining in cells growing out of the plated aggregates, live O4 staining of cells migrating out ofthe spheres, myelin basic protein (MBP) staining of oligodendrocytes at the end of the differentiation;scale bars: 200 µm; (C) Quantitative RT-PCR showed differences in the transcript levels of enzymesresponsible for acetylation, deacetylation and methylation during oligodendrocyte lineage commitment.The bars are the mean ˘ SEM, relative to GAPDH levels.
The analysis of HATs, HDACs and K9 and K27 histone methyltransferases was overall consistentwith the findings obtained from ESC-derived cells. We observed a steady increase of transcript levelsfor the HATS: CREBBP and MYST5. We also confirmed that HDAC8 was upregulated as early asthe NSC stage, while HDAC1 and HDAC2 did not display significant patterns of expression acrossthe lineage. In agreement with published evidence on the critical importance of HDAC11 activityfor oligodendrocyte development in rats [26], we detected increased levels of HDAC11 only in MBP+
mature oligodendrocytes.
Int. J. Mol. Sci. 2016, 17, 614 6 of 16
The levels of the EED and EZH2, subunits of the enzymatic complex responsible for H3K27methylation, peaked at the NSC stage and slowly tapered off as OPC differentiated. Surprisingly, EZH1expression was increased in both ESC-derived Im. OL and iPSC-derived OL (Figures 1C and 2C).
Among the enzymes responsible for the di- and tri-methylation of H3K9, EHMT2 expressionincreased at the OPC and mature oligodendrocyte stages; SUV39H1 expression remained constantover time; and SUV39H2 expression slightly increased from the NSC stage (Figure 2C).
To validate the functional significance of the transcriptional data on histone modifiers, we askedwhether the histone marks in differentiated iPSCs would be consistent with the predicted changesof enzymatic activities. For this reason, we performed double immunofluorescence using antibodiesspecific for each stage-appropriate oligodendrocyte marker and for the post-translational modificationsof lysine residues on histone H3 (Figures 3–6).
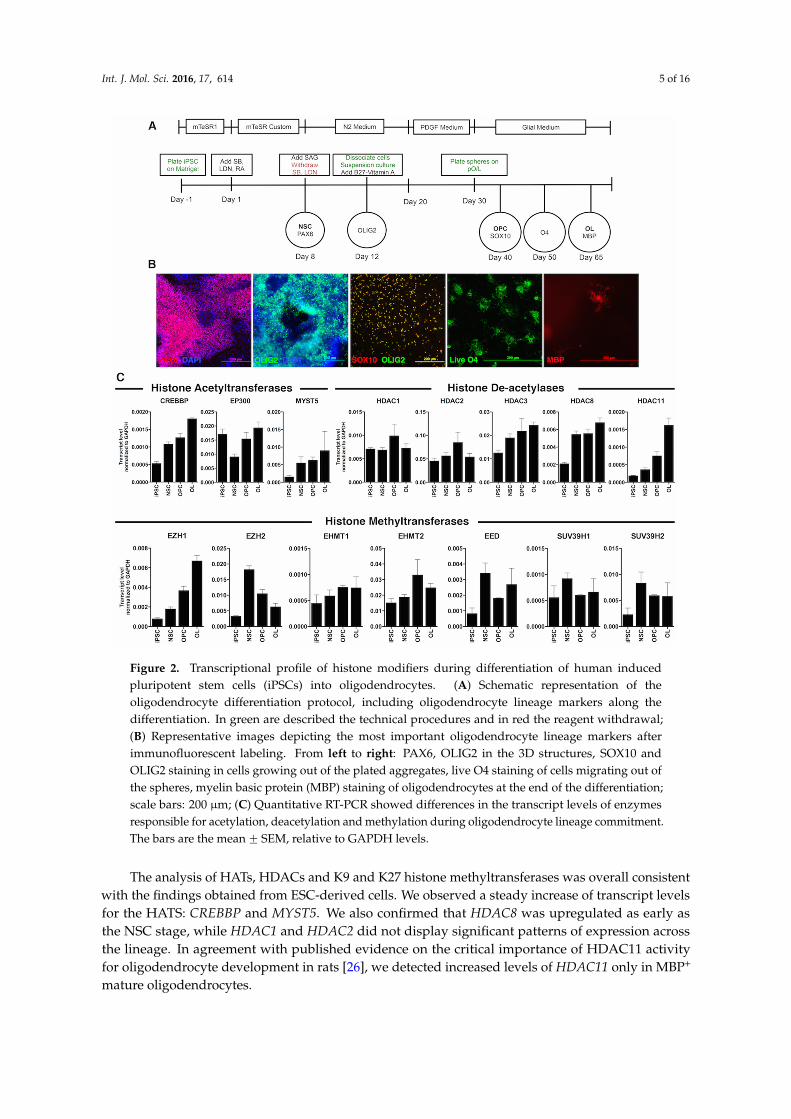
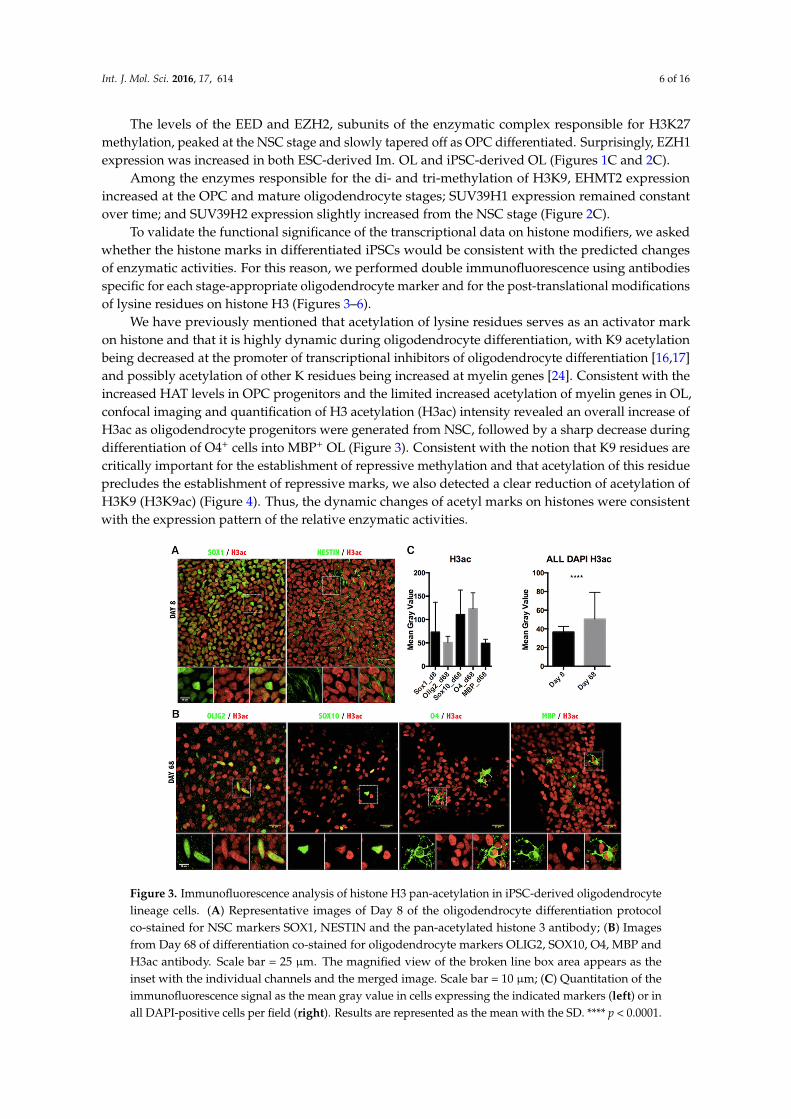
We have previously mentioned that acetylation of lysine residues serves as an activator markon histone and that it is highly dynamic during oligodendrocyte differentiation, with K9 acetylationbeing decreased at the promoter of transcriptional inhibitors of oligodendrocyte differentiation [16,17]and possibly acetylation of other K residues being increased at myelin genes [24]. Consistent with theincreased HAT levels in OPC progenitors and the limited increased acetylation of myelin genes in OL,confocal imaging and quantification of H3 acetylation (H3ac) intensity revealed an overall increase ofH3ac as oligodendrocyte progenitors were generated from NSC, followed by a sharp decrease duringdifferentiation of O4+ cells into MBP+ OL (Figure 3). Consistent with the notion that K9 residues arecritically important for the establishment of repressive methylation and that acetylation of this residueprecludes the establishment of repressive marks, we also detected a clear reduction of acetylation ofH3K9 (H3K9ac) (Figure 4). Thus, the dynamic changes of acetyl marks on histones were consistentwith the expression pattern of the relative enzymatic activities.
Int. J. Mol. Sci. 2016, 17, 614 6 of 16
We have previously mentioned that acetylation of lysine residues serves as an activator mark on histone and that it is highly dynamic during oligodendrocyte differentiation, with K9 acetylation being decreased at the promoter of transcriptional inhibitors of oligodendrocyte differentiation [16,17] and possibly acetylation of other K residues being increased at myelin genes [24]. Consistent with the increased HAT levels in OPC progenitors and the limited increased acetylation of myelin genes in OL, confocal imaging and quantification of H3 acetylation (H3ac) intensity revealed an overall increase of H3ac as oligodendrocyte progenitors were generated from NSC, followed by a sharp decrease during differentiation of O4+ cells into MBP+ OL (Figure 3). Consistent with the notion that K9 residues are critically important for the establishment of repressive methylation and that acetylation of this residue precludes the establishment of repressive marks, we also detected a clear reduction of acetylation of H3K9 (H3K9ac) (Figure 4). Thus, the dynamic changes of acetyl marks on histones were consistent with the expression pattern of the relative enzymatic activities.
Figure 3. Immunofluorescence analysis of histone H3 pan-acetylation in iPSC-derived oligodendrocyte lineage cells. (A) Representative images of Day 8 of the oligodendrocyte differentiation protocol co-stained for NSC markers SOX1, NESTIN and the pan-acetylated histone 3 antibody; (B) Images from Day 68 of differentiation co-stained for oligodendrocyte markers OLIG2, SOX10, O4, MBP and H3ac antibody. Scale bar = 25 µm. The magnified view of the broken line box area appears as the inset with the individual channels and the merged image. Scale bar = 10 µm; (C) Quantitation of the immunofluorescence signal as the mean gray value in cells expressing the indicated markers (left) or in all DAPI-positive cells per field (right). Results are represented as the mean with the SD. **** p < 0.0001.
Figure 4. Cont.
Figure 3. Immunofluorescence analysis of histone H3 pan-acetylation in iPSC-derived oligodendrocytelineage cells. (A) Representative images of Day 8 of the oligodendrocyte differentiation protocolco-stained for NSC markers SOX1, NESTIN and the pan-acetylated histone 3 antibody; (B) Imagesfrom Day 68 of differentiation co-stained for oligodendrocyte markers OLIG2, SOX10, O4, MBP andH3ac antibody. Scale bar = 25 µm. The magnified view of the broken line box area appears as theinset with the individual channels and the merged image. Scale bar = 10 µm; (C) Quantitation of theimmunofluorescence signal as the mean gray value in cells expressing the indicated markers (left) or inall DAPI-positive cells per field (right). Results are represented as the mean with the SD. **** p < 0.0001.
Int. J. Mol. Sci. 2016, 17, 614 7 of 16
Int. J. Mol. Sci. 2016, 17, 614 6 of 16
We have previously mentioned that acetylation of lysine residues serves as an activator mark on histone and that it is highly dynamic during oligodendrocyte differentiation, with K9 acetylation being decreased at the promoter of transcriptional inhibitors of oligodendrocyte differentiation [16,17] and possibly acetylation of other K residues being increased at myelin genes [24]. Consistent with the increased HAT levels in OPC progenitors and the limited increased acetylation of myelin genes in OL, confocal imaging and quantification of H3 acetylation (H3ac) intensity revealed an overall increase of H3ac as oligodendrocyte progenitors were generated from NSC, followed by a sharp decrease during differentiation of O4+ cells into MBP+ OL (Figure 3). Consistent with the notion that K9 residues are critically important for the establishment of repressive methylation and that acetylation of this residue precludes the establishment of repressive marks, we also detected a clear reduction of acetylation of H3K9 (H3K9ac) (Figure 4). Thus, the dynamic changes of acetyl marks on histones were consistent with the expression pattern of the relative enzymatic activities.
Figure 3. Immunofluorescence analysis of histone H3 pan-acetylation in iPSC-derived oligodendrocyte lineage cells. (A) Representative images of Day 8 of the oligodendrocyte differentiation protocol co-stained for NSC markers SOX1, NESTIN and the pan-acetylated histone 3 antibody; (B) Images from Day 68 of differentiation co-stained for oligodendrocyte markers OLIG2, SOX10, O4, MBP and H3ac antibody. Scale bar = 25 µm. The magnified view of the broken line box area appears as the inset with the individual channels and the merged image. Scale bar = 10 µm; (C) Quantitation of the immunofluorescence signal as the mean gray value in cells expressing the indicated markers (left) or in all DAPI-positive cells per field (right). Results are represented as the mean with the SD. **** p < 0.0001.
Figure 4. Cont.
Int. J. Mol. Sci. 2016, 17, 614 7 of 16
Figure 4. Immunofluorescence analysis of histone H3 lysine 9 acetylation in iPSC-derived oligodendrocyte lineage cells. (A) Representative images of Day 8 of the oligodendrocyte differentiation protocol co-stained for NSC markers SOX1, NESTIN and the H3K9ac antibody; (B) Images from Day 68 of differentiation co-stained for oligodendrocyte markers OLIG2, SOX10, O4, MBP and H3K9ac antibody. Scale bar = 25 µm. The magnified view of the broken line box area appears as the inset with the individual channels and the merged image. Scale bar = 10 µm; (C) Quantitation of the immunofluorescence signal as the mean gray value in cells expressing the indicated markers (left) or in all DAPI-positive cells per field (right). Results are represented as the mean with the SD. **** p < 0.0001.
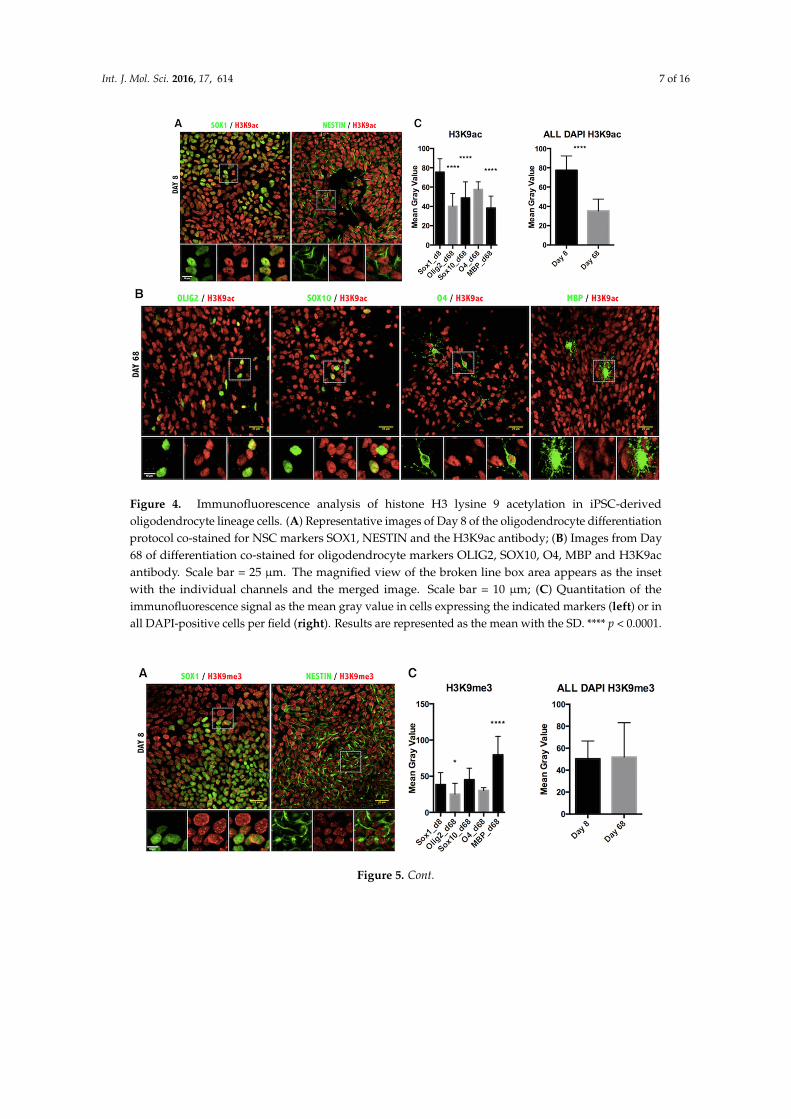
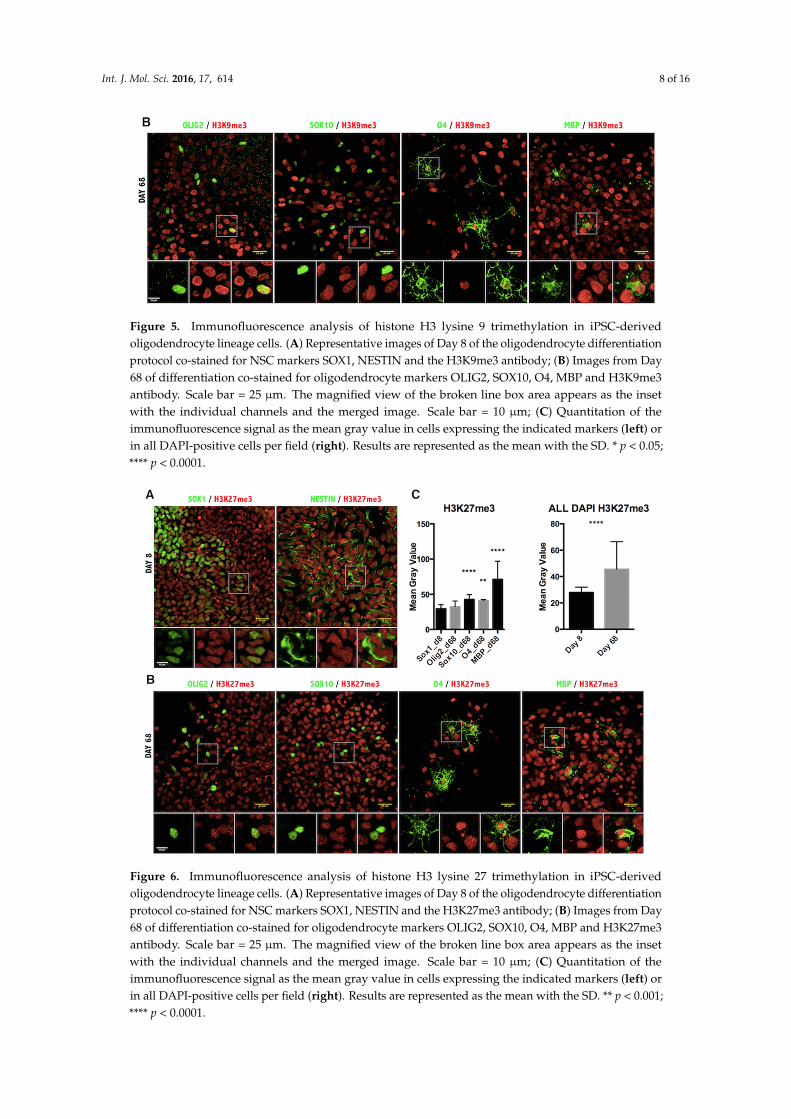
Lastly, we assessed the repressive epigenetic marks H3K9me3 (Figure 5) and H3K27me3 (Figure 6). The pattern of H3K9me3 nuclear distribution at Day 8 of differentiation was evident as punctuated fluorescence, indicating the focal formation of heterochromatin at the initial stages of development. As cells differentiated further, the appearance of H3K9me3 changed drastically, staining uniformly the whole nucleus in the MBP+ stage of differentiation (Figure 5B) and indicating the massive increase of heterochromatin formation characteristic of mature oligodendrocytes [27]. Quantification of H3K9me3 intensity in the oligodendrocyte nuclei confirmed a significant increase in maturing oligodendrocytes (Figure 5C). Furthermore, quantification of intensity showed a significant increase in the H3K27me3 repressive mark, as well (Figure 6).
Figure 5. Cont.
Figure 4. Immunofluorescence analysis of histone H3 lysine 9 acetylation in iPSC-derivedoligodendrocyte lineage cells. (A) Representative images of Day 8 of the oligodendrocyte differentiationprotocol co-stained for NSC markers SOX1, NESTIN and the H3K9ac antibody; (B) Images from Day68 of differentiation co-stained for oligodendrocyte markers OLIG2, SOX10, O4, MBP and H3K9acantibody. Scale bar = 25 µm. The magnified view of the broken line box area appears as the insetwith the individual channels and the merged image. Scale bar = 10 µm; (C) Quantitation of theimmunofluorescence signal as the mean gray value in cells expressing the indicated markers (left) or inall DAPI-positive cells per field (right). Results are represented as the mean with the SD. **** p < 0.0001.
Int. J. Mol. Sci. 2016, 17, 614 7 of 16
Figure 4. Immunofluorescence analysis of histone H3 lysine 9 acetylation in iPSC-derived oligodendrocyte lineage cells. (A) Representative images of Day 8 of the oligodendrocyte differentiation protocol co-stained for NSC markers SOX1, NESTIN and the H3K9ac antibody; (B) Images from Day 68 of differentiation co-stained for oligodendrocyte markers OLIG2, SOX10, O4, MBP and H3K9ac antibody. Scale bar = 25 µm. The magnified view of the broken line box area appears as the inset with the individual channels and the merged image. Scale bar = 10 µm; (C) Quantitation of the immunofluorescence signal as the mean gray value in cells expressing the indicated markers (left) or in all DAPI-positive cells per field (right). Results are represented as the mean with the SD. **** p < 0.0001.
Lastly, we assessed the repressive epigenetic marks H3K9me3 (Figure 5) and H3K27me3 (Figure 6). The pattern of H3K9me3 nuclear distribution at Day 8 of differentiation was evident as punctuated fluorescence, indicating the focal formation of heterochromatin at the initial stages of development. As cells differentiated further, the appearance of H3K9me3 changed drastically, staining uniformly the whole nucleus in the MBP+ stage of differentiation (Figure 5B) and indicating the massive increase of heterochromatin formation characteristic of mature oligodendrocytes [27]. Quantification of H3K9me3 intensity in the oligodendrocyte nuclei confirmed a significant increase in maturing oligodendrocytes (Figure 5C). Furthermore, quantification of intensity showed a significant increase in the H3K27me3 repressive mark, as well (Figure 6).
Figure 5. Cont. Figure 5. Cont.
Int. J. Mol. Sci. 2016, 17, 614 8 of 16Int. J. Mol. Sci. 2016, 17, 614 8 of 16
Figure 5. Immunofluorescence analysis of histone H3 lysine 9 trimethylation in iPSC-derived oligodendrocyte lineage cells. (A) Representative images of Day 8 of the oligodendrocyte differentiation protocol co-stained for NSC markers SOX1, NESTIN and the H3K9me3 antibody; (B) Images from Day 68 of differentiation co-stained for oligodendrocyte markers OLIG2, SOX10, O4, MBP and H3K9me3 antibody. Scale bar = 25 µm. The magnified view of the broken line box area appears as the inset with the individual channels and the merged image. Scale bar = 10 µm; (C) Quantitation of the immunofluorescence signal as the mean gray value in cells expressing the indicated markers (left) or in all DAPI-positive cells per field (right). Results are represented as the mean with the SD. * p < 0.05; **** p < 0.0001.
Figure 6. Immunofluorescence analysis of histone H3 lysine 27 trimethylation in iPSC-derived oligodendrocyte lineage cells. (A) Representative images of Day 8 of the oligodendrocyte differentiation protocol co-stained for NSC markers SOX1, NESTIN and the H3K27me3 antibody; (B) Images from Day 68 of differentiation co-stained for oligodendrocyte markers OLIG2, SOX10, O4, MBP and H3K27me3 antibody. Scale bar = 25 µm. The magnified view of the broken line box area appears as the inset with the individual channels and the merged image. Scale bar = 10 µm; (C) Quantitation of the immunofluorescence signal as the mean gray value in cells expressing the indicated markers (left) or in all DAPI-positive cells per field (right). Results are represented as the mean with the SD. ** p < 0.001; **** p < 0.0001.
Figure 5. Immunofluorescence analysis of histone H3 lysine 9 trimethylation in iPSC-derivedoligodendrocyte lineage cells. (A) Representative images of Day 8 of the oligodendrocyte differentiationprotocol co-stained for NSC markers SOX1, NESTIN and the H3K9me3 antibody; (B) Images from Day68 of differentiation co-stained for oligodendrocyte markers OLIG2, SOX10, O4, MBP and H3K9me3antibody. Scale bar = 25 µm. The magnified view of the broken line box area appears as the insetwith the individual channels and the merged image. Scale bar = 10 µm; (C) Quantitation of theimmunofluorescence signal as the mean gray value in cells expressing the indicated markers (left) orin all DAPI-positive cells per field (right). Results are represented as the mean with the SD. * p < 0.05;**** p < 0.0001.
Int. J. Mol. Sci. 2016, 17, 614 8 of 16
Figure 5. Immunofluorescence analysis of histone H3 lysine 9 trimethylation in iPSC-derived oligodendrocyte lineage cells. (A) Representative images of Day 8 of the oligodendrocyte differentiation protocol co-stained for NSC markers SOX1, NESTIN and the H3K9me3 antibody; (B) Images from Day 68 of differentiation co-stained for oligodendrocyte markers OLIG2, SOX10, O4, MBP and H3K9me3 antibody. Scale bar = 25 µm. The magnified view of the broken line box area appears as the inset with the individual channels and the merged image. Scale bar = 10 µm; (C) Quantitation of the immunofluorescence signal as the mean gray value in cells expressing the indicated markers (left) or in all DAPI-positive cells per field (right). Results are represented as the mean with the SD. * p < 0.05; **** p < 0.0001.
Figure 6. Immunofluorescence analysis of histone H3 lysine 27 trimethylation in iPSC-derived oligodendrocyte lineage cells. (A) Representative images of Day 8 of the oligodendrocyte differentiation protocol co-stained for NSC markers SOX1, NESTIN and the H3K27me3 antibody; (B) Images from Day 68 of differentiation co-stained for oligodendrocyte markers OLIG2, SOX10, O4, MBP and H3K27me3 antibody. Scale bar = 25 µm. The magnified view of the broken line box area appears as the inset with the individual channels and the merged image. Scale bar = 10 µm; (C) Quantitation of the immunofluorescence signal as the mean gray value in cells expressing the indicated markers (left) or in all DAPI-positive cells per field (right). Results are represented as the mean with the SD. ** p < 0.001; **** p < 0.0001.
Figure 6. Immunofluorescence analysis of histone H3 lysine 27 trimethylation in iPSC-derivedoligodendrocyte lineage cells. (A) Representative images of Day 8 of the oligodendrocyte differentiationprotocol co-stained for NSC markers SOX1, NESTIN and the H3K27me3 antibody; (B) Images from Day68 of differentiation co-stained for oligodendrocyte markers OLIG2, SOX10, O4, MBP and H3K27me3antibody. Scale bar = 25 µm. The magnified view of the broken line box area appears as the insetwith the individual channels and the merged image. Scale bar = 10 µm; (C) Quantitation of theimmunofluorescence signal as the mean gray value in cells expressing the indicated markers (left) orin all DAPI-positive cells per field (right). Results are represented as the mean with the SD. ** p < 0.001;**** p < 0.0001.
Int. J. Mol. Sci. 2016, 17, 614 9 of 16
Lastly, we assessed the repressive epigenetic marks H3K9me3 (Figure 5) and H3K27me3 (Figure 6).The pattern of H3K9me3 nuclear distribution at Day 8 of differentiation was evident as punctuatedfluorescence, indicating the focal formation of heterochromatin at the initial stages of development. Ascells differentiated further, the appearance of H3K9me3 changed drastically, staining uniformly thewhole nucleus in the MBP+ stage of differentiation (Figure 5B) and indicating the massive increase ofheterochromatin formation characteristic of mature oligodendrocytes [27]. Quantification of H3K9me3intensity in the oligodendrocyte nuclei confirmed a significant increase in maturing oligodendrocytes(Figure 5C). Furthermore, quantification of intensity showed a significant increase in the H3K27me3repressive mark, as well (Figure 6).
3. Discussion
Epigenetic repression seems to be a common mechanism to drive the differentiation of differentcell-types and is highly conserved from fish to mammals [28]. However, very little is knownabout the epigenetic identity of human oligodendrocytes, since primary cells have been hardlyavailable for research. The accessibility to human pluripotent stem cells (encompassing both ESCsand iPSCs) provided us with a tool to address the question on the conservation of the epigeneticlandscape in humans. Most of the previous studies on the epigenetic changes occurring during thedifferentiation of OPC into oligodendrocytes had been performed in rodent cells and establishedthat post-translational modifications of histones, such as dynamic modulation of histone acetylationand repressive methylation, regulated the acquisition of the oligodendrocyte identity. Others andwe, for instance, reported deacetylation of lysine residues in the tail of histone H3 as critical for theonset of myelination in rats as pharmacological inhibitors of HDACs [12,15] or genetic ablation ofHDACs [21] impaired OPCs differentiation. It was suggested that removal of acetyl groups fromlysine residues of nucleosomal histones at promoters of genes encoding for transcriptional inhibitorsof myelin gene expression would favor oligodendrocyte differentiation [20]. However, it was alsoclear that at late stages of differentiation (after the inhibitors have been repressed), acetylation ofhistone H3 at promoters and enhancers of myelin genes facilitates gene expression [24]. We thereforesuggested that overall deacetylation is needed during the early stages of OPC differentiation to“remove the differentiation breaks”, and this occurs mostly by deacetylating a critical lysine residue,H3K9. However, acetylation is a relatively unstable mark, driven by the equilibrium between HATsand HDACs, and we reasoned that deacetylation of K9 would be necessary to guarantee accessto histone methyltransferases, which can methylate K9 and thereby provide a more stable form ofrepression, by initiating the formation of heterochromatin [11,29]. The detection of high transcriptlevels of EZH2, the enzymatic activity responsible for methylation of H3K27, in human NSCs derivedeither from ESC or iPSC differentiation, was consistent with previous reports on the function of H3K27trimethylation as critical for the restriction of multipotentiality in ESCs [30] and on the role of EZH2during the oligodendrocyte lineage choice of NSCs, associated with the repression of astrocyte andneuronal lineage gene [19]. The levels of H3K9 dimethyltransferases (i.e., EHMT2), in contrast, showeda tendency towards increase at later stages of oligodendrocyte differentiation (Figures 1C and 2C). Thisis consistent with the detection of repressive H3K9 methylation marks in human cells (Figure 5) andwith the previous reports in rodent cells [11]. While in human cells, we have not conducted silencingexperiments in any of the enzymes, the combined evaluation of knockdown experiments for the distinctmethyltransferases in rodent cells, together with the genomic distribution of H3K9me3 and H3K27me3ChipSeq data suggest unique and redundant roles for K9 HMTs and K27 HMTs [11]. Taken together,our data in rodents suggest that methylation at K9 and K27 residues have very distinct functionsand that the H3K27me3 mark, deposited by EZH2, occurs early during the commitment of NSC tothe oligodendroglial fate, during the transition from NSCs to OPCs, while the repressive H3K9me3marks occur later in the oligodendrocyte lineage and serve the function to further silence neuronalgenes and channels contributing the electrical properties of OPCs, which need to be silenced duringthe maturation to oligodendrocytes [11]. This model further implies that oligodendrogenesis results
Int. J. Mol. Sci. 2016, 17, 614 10 of 16
from the repression of neurogenesis and astrogliogenesis and is a unidirectional process, as matureoligodendrocytes cannot revert to an early undifferentiated state. Using two distinct human culturesystems, ESC and iPSC, we identified a pattern of epigenetic changes that was consistent betweenthe two human cell systems and in agreement with the rodent results. Histone modifications duringdifferentiation along the OL lineage were reproducible, not altered by the reprogramming process oniPSCs and occurred independently of the culture protocol used for differentiation.
It is widely accepted that histone-specific marks, even at specific residues of a single histoneprotein, can be associated with multiple enzymes. Although there may be variability in the levels ofhistone modification enzymes, the end result is the deposition or removal of the specific repressiveor activating mark on the histone residues. The fluctuation of transcript levels of enzymes and theirkinetics in our qPCR data can probably be explained by the redundancy and/or cell specificity ofthese enzymes. Furthermore, this apparent discrepancy in the upregulation of both HATs and HDACs(Figures 1C and 2C) could also reflect the existence of alternative mechanisms of activation. It shouldbe noted that the qRT-PCR technique is performed with mRNA isolated from entire cultures andnot from purified cell-types, therefore containing contaminant cells, such as neurons and astrocytes.Indeed, in our panel of immunofluorescent images, only a fraction of the total population expressed theOLIG2 marker. Therefore, the definite answer for the epigenetic status of the chromatin should comefrom the in situ identification of the end product, that is the H3ac on the oligodendrocyte lineage cells.The immunofluorescent staining revealed that acetylation of H3K9 was significantly reduced duringoligodendrocyte differentiation of iPSCs (Figure 4C), and a similar conclusion could be drawn from theWestern blot analysis during ESC differentiation (Figure 1D,E). The removal of the acetyl group fromthis lysine residue is critical for the deposition of the repressive methylation mark, and in agreementwith this determination, H3K9me3 was found to be specifically increased in the MBP-expressingoligodendrocytes (Figure 5C). The other repressive mark, H3K27me3, was significantly increased in theMBP+ oligodendrocytes (Figure 6C, left panel), as well as in the total number of cells (DAPI+) at Day 68of differentiation (Figure 6C, right panel). However, H3K27me3 was not significantly increased whenonly the OLIG2 population was scored; this could have been related to the heterogeneous compositionof the OLIG2+ population, which includes OPCs, Im. OL and mature oligodendrocytes, as this markeris present at all developmental stages of oligodendrogenesis. Because H3K9me3 is associated withrepressive heterochromatin formation, it is important that its nuclear localization changes over thecourse of differentiation, starting with punctate staining patterns (Figure 5A), presumably representingsmall heterochromatic foci, and then spreading throughout the nucleus as heterochromatin occupiesthe majority of the differentiated OL nuclei (Figure 5B) [27].
An additional layer of regulation of gene expression is provided by the microRNAs, whichhave been shown to be important and critical for oligodendrocyte biology [31]. We suggestthat while histone modifications are likely to shape the architecture of the epigenomic landscapeassociated with lineage-specific choices, the microRNAs serve to fine-tune the levels of specifictranscriptional modulators.
Our results clearly underline the importance of epigenetic regulation in the commitment of humanOPCs to myelinating oligodendrocytes and suggest that enzymes regulating epigenetic marks shouldbe further investigated as potential targets for treating disorders involving oligodendrocytes andmyelin. Of note, we have previously found changes in histone acetylation in brain specimens frompatients affected by multiple sclerosis (MS), a chronic demyelinating disease of the CNS [32]. We havealso generated several MS-specific iPSC lines, and the comparison of the epigenetic profiles may revealsome novel mechanisms of pathogenesis. Remyelinating therapies represent a current unmet needin the MS field, and many efforts are focusing on stimulating the endogenous OPCs that are stillpresent in the brain of the patients, but fail to differentiate. Targeting the epigenetic landscape, forexample, by combining molecules interfering with histone acetylation [33] and increasing H3K9me3could potentially hold the key to successful treatment.
Int. J. Mol. Sci. 2016, 17, 614 11 of 16
4. Materials and Methods
4.1. Human Pluripotent Stem Cell Culture Conditions
One ESC line and one iPSC line were used for this study. WA09 (H9) is an NIH-approved ESC,obtained from the WiCell Research Institute under a material transfer agreement with the Casaccialaboratory. hESCs were grown on gamma-irradiated mouse embryonic fibroblasts (γ-MEF) preparedby Icahn School of Medicine Stem Cell Core Facility in ES medium (DMEM-F12, 20% knock out serumreplacement, 1ˆ non-essential amino acids, ß-mercaptoethanol (all from ThermoFisher, Cambridge,MA, USA) supplemented with 10 ng/mL of bFGF (R & D Systems, Minneapolis, MN, USA).
The iPSC line iPSC49026 was generated at the New York Stem Cell Foundation Research Instituteby mRNA/miRNA reprogramming technology from skin fibroblasts of a de-identified male healthydonor [34]. Skin biopsy was obtained upon institutional review board approval and receipt ofinformed consent. iPSCs were maintained in feeder free conditions, seeded onto matrigel-coatedplates (BD Biosciences, San Jose, CA, USA) in the presence of mTeSR1 medium (StemCell Technologies,Vancouver, BC, Canada).
4.2. Oligodendrocyte Differentiation Protocol from hESCs
Oligodendrocyte differentiation of ESCs was performed following previously-publishedmethods [35] with minor changes. Specifically, embryoid bodies (EBs) were formed by incubatinghESC clusters in ES media without bFGF supplement in suspension. At Day 5, EBs were collected andtransferred to N2 media (DMEM/F12, 1ˆ N2 supplement (ThermoFisher), 1ˆ non-essential aminoacids and 2 µg/mL heparin, Sigma-Aldrich, St. Louis, MO, USA). From Day 8, EBs were platedand maintained on Matrigel-coated plates in N2 media. At Day 11, the media was supplementedwith 1 µM all-trans retinoic acid (RA, Sigma-Aldrich) until the detection of neural rosettes aroundDay 16. Neural rosettes were isolated and maintained in suspension in N2 media supplemented withRA, 1ˆ B-27 without vitamin A (ThermoFisher) and 1 µM purmorphamine (Stemgent, Cambridge,MA, USA) or 100 ng/mL sonic hedgehog (SHH, R & D Systems). On Day 26 of differentiation, RAwas removed, and 10 ng/mL bFGF were added in the media for 10 days. From Day 36, the cellswere further differentiated in oligodendrocyte differentiation media (ODM), containing N2 medium,1ˆ B27 without vitamin A and 60 ng/mL triiodo-L-thyroxine (T3, Sigma-Aldrich), adding 10 ng/mLof PDGF-AA (Peprotech, Rocky Hill, NJ, USA), IGF-1 (Peprotech) and NT-3 (Peprotech) and 1 µMpurmorphamine or 100 ng/mL sonic hedgehog (SHH). Finally, cells were dissociated by triturationafter treatment with accutase (ThermoFisher) and plated onto Matrigel-coated dishes in ODM medium.
4.3. Oligodendrocyte Differentiation Protocol from Human iPSCs
Oligodendrocyte differentiation from iPSCs followed the “fast” protocol, as described in ourprevious paper, where catalogue numbers for all reagents used can be found [7]. Briefly, smalliPSC colonies were induced in mTeSR custom medium (mTeSR1 minus 5 factors that sustainpluripotency, Stem Cell Technologies) containing 10 µM SB431542 (Stemgent), 250 nM LDN189193(Stemgent) and 100 nM all-trans RA (Sigma-Aldrich). From Day 8, cells were cultured in N2medium (DMEM/F12, NEAA, GlutaMAX 2-mercaptoethanol, penicillin-streptomycin, plus N2supplement, all from Life Technologies, Carlsbad, CA, USA) adding 100 nM RA and 1 µM smoothenedagonist (SAG) (EMD Millipore, Billerica, MA, USA), and at Day 12, they were lifted by accutase(Life Technologies) treatment. Floating spheres were then cultured in N2B27 medium (N2 mediumplus B27 without vitamin A and 25 µg/mL insulin) containing RA and SAG until Day 20, whenPDGF medium was used to drive oligodendrocyte commitment. PDGF medium: N2B27 medium,PDGF 10 ng/mL, IGF 10 ng/mL, HGF 5 ng/mL (all from R & D Systems), NT-3 10 ng/mL(Millipore), biotin 100 ng/mL, cAMP 1 µM, T3 60 ng/mL (all from Sigma). At Day 30, sphereswere plated onto poly-L-ornithine/laminin-coated dishes (poly-L-ornithine, Sigma; natural mouse
Int. J. Mol. Sci. 2016, 17, 614 12 of 16
laminin, Life Technologies) in glial medium, consisting of N2B27 medium plus ascorbic acid 20 µg/mL,HEPES 10 mM (both from Sigma), biotin 100 ng/mL, cAMP 1 µM and T3 60 ng/mL.
4.4. RNA Isolation and Quantitative RT-PCR
hESC-derived cells at specific stages of oligodendrocyte differentiation were collected in TRIzol,and RNA was isolated following the manufacturer’s recommendation. RNA was further cleaned usingRNEasy Mini Kit (Qiagen, Hilden, Germany). mRNA was reverse-transcribed using qScript (Quanta,Houston, TX, USA), and changes in the transcript level were measured by q-RT-PCR using SYBR-greendetector (Quanta).
hiPSC-derived cells at specific stages of oligodendrocyte differentiation were collected in lysisbuffer, and RNA was isolated using the RNeasy Plus Mini Kit (Qiagen) with QIAshredder (Qiagen),according to the manufacturer instructions. RNA was quantified using Nanodrop 8000 (ThermoScientific), and its quality was assessed by the OD260/OD280 ratio. Zero-point-five micrograms ofmRNA were reverse-transcribed using the GoScript Reverse Transcription System (Promega, Madison,WI, USA) using random primers. cDNAs were loaded with SYBR-select master-mix (Life Technologies),and qRT-PCR was performed on Stratagene Mx300P qPCR System (Agilent Technologies, Santa Clara,CA, USA). The melting curves were measured to ensure the specificity of the products. Data werenormalized to the housekeeping gene GAPDH and analyzed using the comparative CT method (∆Ct).Values are the means of technical replicates with SEM as the error bars. The primers used are listedin Table 1.
Table 1. List of primers used for qRT-PCR experiments.
Gene Forward Primer Reverse Primer
EHMT1 GCTTCAGAAGGTGCTCCTCATG CTGAACCAGCATGTGGCAGATGSUV39H1 CCGCCTACTATGGCAACATCTC CTTGTGGCAAAGAAAGCGATGCGSUV39H2 CCATAAATGCTGGAGAAGAGCTG GGTAACCTCTGCAAGTCACAGC
EED GACGAGAACAGCAATCCAGACC TCCTTCCAGGTGCATTTGGCGTMYST1 TGGAGCCGTTCGTCTTTTAC ATGAGGAACTTCCCGTAGCCMYST2 GACAACAACAGGCATGCAAC CCGTGTGTTCCCATAGGTCTMYST3 CAAGGCTGCCCAAATTGTAT ATCTCATTGGCAGGAGGATGMYST4 GACCGCAGTACAGGGTCAAT TCATGGGGTAGAAGGCTGACMYST5 GGCTGAGGACAGCTCAAAAA CCGGATCCCTTCTCACTGTA
CREBBP GCCACGTCCCTTAGTAACCA CCCCAAGTGTCCCTGATCTAEP300 CGCTTTGTCTACACCTGCAA TGCTGGTTGTTGCTCTCATC
HDAC1 GATCTGCTCCTCTGACAAACGAA CCCTCTCCCTCCTCTTCAGAAHDAC2 TGGAGGAGGTGGCTACACAAT AATCTCACAATCAAGGGCAACTGHDAC3 TCTACCTCACTGACCGGGTCAT ACCTGTGCCAGGGAAGAAGTAAHDAC8 GGATCCCATGTGCTCCTTTA ATAGCCTCCTCCTCCCAAAA
HDAC11 GAGCTGGCCCTTCCTCTACT CTATGGGCTGGTGACTTCGTEHMT2 GCCCGTTACTATGGCAACAT GTCAAACCCTAGCTCCTCCCEZH1 GTGGATGCTACTCGGAAAGG CCCCACGTACTTGAGAGCATEZH2 TGCTATGCAAAAGTTATGATGGTT AGTCTGGATGGCTCTCTTGGOCT4 GAAGGAGAAGCTGGAGCAAA CATCGGCCTGTGTATATCCCPAX6 CCCAGCCAGACCTCCTCATA CTTCCGGGAACTTGAACTGGOLIG2 AGCGCTGTCTGGCTTTAACCT ATGCACACAGCGGTACCTTTT
NKX2.2 GAACCCCTTCTACGACAGC GGTCTCCTTGTCATTGTCCGMBP TAGGTACAGGGGCAAGTGG TCACAAGGGATTCAAGGGAG
GAPDH TGTTGCCATCAATGACCCCTT CTCCACGACGTACTCAGCG
4.5. Immunofluorescent Analysis
At specific days during oligodendrocyte differentiation, cells grown on Thermanox plasticcoverslips were fixed with 4% paraformaldehyde (PFA) (Santa Cruz Biotechnology, Dallas, TX, USA)for 7 min at room temperature (RT). For immunostaining, cells were washed 3ˆ in PBS-T (PBS with0.1% Triton-X, Life Technologies) for 10 min and then incubated in blocking serum (PBS-T with 5%
Int. J. Mol. Sci. 2016, 17, 614 13 of 16
serum from the species of the secondary antibody used) for 2 h at RT. Primary antibodies were dilutedin PBS-T, applied overnight and incubated at 4 ˝C. Antibodies were washed 3ˆ for 15 min at RT withPBS-T, and secondary antibodies were then applied, incubating for 2 h at RT. Cells were washed 3ˆ
with PBS-T, stained with DAPI for 15 min and finally washed with PBS 2ˆ for 10 min. Secondaryantibodies were donkey or goat Alexa Fluor 488, Alexa Fluor 568 or Alexa Fluor 647 conjugated(Life Technologies); they were all diluted 1:500 in PBS-T. The primary antibodies used are described inTable 2. Images were acquired using an Olympus IX71 inverted microscope, equipped with a DP30BWblack and white digital camera or a Zeiss LSM5 Pascal Confocal Microscope situated on an air-actuatedself-leveling table with Argon 458-, 488-, 514-nm and He 543-, 633-nm lasers with the capabilityto create topological and 3-dimensional images of cells and software for imaging/documentationsystems. Z-stacks were acquired using a Zeiss Plan-Neofluar 40ˆ/1.3 Oil objective. Fluorescentcolors were digitally applied using the Olympus software DP Manager. Image quantitation wasperformed in ImageJ Version 2.0.0-rc-43/1.5 g. All quantitation was performed by measuring meangray values inside Regions of Interest (ROIs) created automatically using the Nucleus counter pluginand corresponding to indicate cell markers in the channels measured. Statistics were performed inPrism 6 for Mac OS X Version 6.0 g using either ordinary one-way ANOVA with Dunnett’s multiplecomparisons test or the unpaired t-test.
Table 2. Antibodies used in immunofluorescent stainings.
Target Species Company Catalogue # Dilution
H3-Ac Rb EMD Millipore 06-599 1:400H3-K9Ac Rb Abcam AB4441 1:500
H3-triMeK9 Rb Abcam AB8898 1:500H3-triMeK27 Rb EMD Millipore 07-449 1:500
PAX6 Rb Covance PRB-278P 1:250NESTIN Ms EMD Millipore MAB5326 1:1000OLIG2 Ms EMD Millipore MABN50 1:500SOX1 Gt R & D Systems AF3369 1:300
SOX10 Gt R & D Systems AF2864 1:100O4 Ms Kind gift James Goldman 1:30
MBP Rat EMD Millipore MAB386 1:200PDGFRα Ms R & D Systems MAB322 1:100NKX2.2 Ms DSHB 74.5A5 1:50
4.6. Histone Isolation, Western Blotting and Protein Quantification
Histones were isolated from ESC cultures using a previously-published protocol [36]. Briefly,cell cultures were extracted in lysis buffer containing 0.5% NP-40, 1.5 mM MgCl2, 1 mM KCl, 10 mMTris-HCl (all from Sigma-Aldrich) supplemented with protease and phosphatase inhibitor cocktails.The lysis was performed on ice with mild vortexing, followed by centrifugation to pellet cell nuclei.Nuclei were then acid extracted with 0.4 N H2SO4 by rocking overnight. The next day, insolubledebris was pelleted and discarded, and the proteins were precipitated using 100% TCA solution for 1h at 4 ˝C, followed by high-speed centrifugation to pellet the histone fraction. Pellets were washed2ˆ with HCl-acidified acetone and pelleted after each wash. Tubes were then allowed to air-dry,and the histone protein samples were resuspended in TBS containing protease and phosphataseinhibitor cocktail. Extracted histones were quantified using the Bradford protein assay (Bio-RadLaboratories, Hercules, CA, USA), and 10 µg of purified histones were electrophoresed on denaturingSDS polyacrylamide gels. Gels were transferred to PVDF membranes and blocked for 1 h in 5% (wt/vol)skim milk in TBS-Tween. Following blocking, membranes were incubated with primary antibodies:anti-histone H3 AcK9 (Abcam, Cambridge, MA, USA, Catalogue Number.: ab4441), anti-histone H3Me3K9 (Abcam, Catalogue Number.: ab8898), anti-histone H3 Me3K27 (Abcam, Catalogue Number:ab6002) or anti-histone H3 (Abcam, Catalogue Number: ab1791). Primary antibody incubations
Int. J. Mol. Sci. 2016, 17, 614 14 of 16
were performed overnight, followed by washing 5 ˆ 5 min with TBS-Tween. Membranes wereincubated with either anti-rabbit- or anti-mouse-HRP conjugated secondary antibodies for 1 h atRT, followed by washing 5 ˆ 5 min in TBS-Tween. Blots were developed by incubating blots withECL chemiluminescent reagent (Amersham, Little Chalfont, UK) and exposing to X-ray film. Proteinquantification: Western blots were quantified by measuring the average pixel intensity using ImageJ.The pixel intensity of the bands was normalized to ESC expression, and bands were expressed relativeto total levels of the loading control histone H3. Statistical analysis of two independent experimentswas performed using one-way ANOVA with Dunnett’s test, comparing all treatment groups relativeto ESC.
Acknowledgments: We thank Scott Noggle, Daniel Paull and the NYSCF automation team for sharing the iPSCline; we thank James E. Goldman (Columbia University) for the O4 antibody. Images in graphical abstract wereobtained from Servier Medical Art. This work was supported by the Conrad N. Hilton Foundation to Fossati andby the grant NIH NINDS R37 NS42095 to Casaccia. Jeffery D. Haines was supported by postdoctoral fellowshipsfrom the Multiple Sclerosis Society of Canada and the Fonds de la recherche en Santé du Québec. PanagiotisDouvaras is a New York Stem Cell Foundation-Druckenmiller fellow. Tomasz Rusielewicz is supported by theDepartment of Defense Grant W81XWH-15-1-0448.
Author Contributions: Patrizia Casaccia, Valentina Fossati and Jeffery D. Haines conceived of and designed theexperiments. Jeffery D. Haines and Kwi Hye Kim performed the experiments with ESCs and analyzed the data.Panagiotis Douvaras and Tomasz Rusielewicz performed the experiments with iPSC cells and analyzed the data.Valentina Fossati, Panagiotis Douvaras, Patrizia Casaccia and Tomasz Rusielewicz wrote the paper. All authorsedited the paper and approved the final version.
Conflicts of Interest: The authors declare no conflict of interest.
Abbreviations
hESCs human embryonic stem cellshiPSC human induced pluripotent stem cellsNSCs neural stem cellsOPCs oligodendrocyte progenitor cellsIm. OL immature oligodendrocytesOL OligodendrocytesEZH1 Enhancer Of Zeste 1 Polycomb Repressive Complex 2 SubunitEZH2 Enhancer Of Zeste 2 Polycomb Repressive Complex 2 SubunitCREBBP cAMP response element binding proteinEP300 E1A binding protein P300EED Embryonic Ectoderm DevelopmentSUV39H1 Suppressor Of Variegation 3-9 Homolog 1SUV39H2 Suppressor Of Variegation 3-9 Homolog 2EHMT2 Euchromatic Histone-Lysine N-Methyltransferase 2RA retinoic acidSAG smoothened agonistPDGF platelet-derived growth factorIGF-1 insulin-like growth factorHGF hepatocyte growth factorT3 triiodothyronineNT3 neurotrophin 3HAT histone acetyltransferaseHDAC histone deacetylaseHMT histone methyl transferaseH3ac histone 3 acetylationH3K9ac histone 3 lysine 9 acetylationH3K9me3 histone 3 lysine 9 trimethylationH3K27me3 histone 3 lysine 27 trimethylationCNS central nervous systemMS multiple sclerosisMBP myelin basic protein
Int. J. Mol. Sci. 2016, 17, 614 15 of 16
References
1. Takahashi, K.; Tanabe, K.; Ohnuki, M.; Narita, M.; Ichisaka, T.; Tomoda, K.; Yamanaka, S. Induction ofpluripotent stem cells from adult human fibroblasts by defined factors. Cell 2007, 131, 861–872. [CrossRef][PubMed]
2. Brennand, K.J.; Simone, A.; Jou, J.; Gelboin-Burkhart, C.; Tran, N.; Sangar, S.; Li, Y.; Mu, Y.; Chen, G.; Yu, D.;et al. Modelling schizophrenia using human induced pluripotent stem cells. Nature 2011, 473, 221–225.[CrossRef] [PubMed]
3. Miller, J.D.; Ganat, Y.M.; Kishinevsky, S.; Bowman, R.L.; Liu, B.; Tu, E.Y.; Mandal, P.K.; Vera, E.; Shim, J.W.;Kriks, S.; et al. Human iPSC-based modeling of late-onset disease via progerin-induced aging. Cell Stem Cell2013, 13, 691–705. [CrossRef] [PubMed]
4. Yang, Y.M.; Gupta, S.K.; Kim, K.J.; Powers, B.E.; Cerqueira, A.; Wainger, B.J.; Ngo, H.D.; Rosowski, K.A.;Schein, P.A.; Ackeifi, C.A.; et al. A small molecule screen in stem-cell-derived motor neurons identifies akinase inhibitor as a candidate therapeutic for ALS. Cell Stem Cell 2013, 12, 713–726. [CrossRef] [PubMed]
5. Hu, B.Y.; Du, Z.W.; Li, X.J.; Ayala, M.; Zhang, S.C. Human oligodendrocytes from embryonic stem cells:Conserved SHH signaling networks and divergent FGF effects. Development 2009, 136, 1443–1452. [CrossRef][PubMed]
6. Wang, S.; Bates, J.; Li, X.; Schanz, S.; Chandler-Militello, D.; Levine, C.; Maherali, N.; Studer, L.;Hochedlinger, K.; Windrem, M.; et al. Human iPSC-derived oligodendrocyte progenitor cells can myelinateand rescue a mouse model of congenital hypomyelination. Cell Stem Cell 2013, 12, 252–264. [CrossRef][PubMed]
7. Douvaras, P.; Fossati, V. Generation and isolation of oligodendrocyte progenitor cells from human pluripotentstem cells. Nat. Protoc. 2015, 10, 1143–1154. [CrossRef] [PubMed]
8. Miron, V.E.; Kuhlmann, T.; Antel, J.P. Cells of the oligodendroglial lineage, myelination, and remyelination.Biochim. Biophys. Acta 2011, 1812, 184–193. [CrossRef] [PubMed]
9. Lappe-Siefke, C.; Goebbels, S.; Gravel, M.; Nicksch, E.; Lee, J.; Braun, P.E.; Griffiths, I.R.; Nave, K.A.Disruption of Cnp1 uncouples oligodendroglial functions in axonal support and myelination. Nat. Genet.2003, 33, 366–374. [CrossRef] [PubMed]
10. Fields, R.D. White matter in learning, cognition and psychiatric disorders. Trends Neurosci. 2008, 31, 361–370.[CrossRef] [PubMed]
11. Liu, J.; Magri, L.; Zhang, F.; Marsh, N.O.; Albrecht, S.; Huynh, J.L.; Kaur, J.; Kuhlmann, T.; Zhang, W.;Slesinger, P.A.; et al. Chromatin landscape defined by repressive histone methylation during oligodendrocytedifferentiation. J. Neurosci. 2015, 35, 352–365. [CrossRef] [PubMed]
12. Marin-Husstege, M.; Muggironi, M.; Liu, A.; Casaccia-Bonnefil, P. Histone deacetylase activity is necessaryfor oligodendrocyte lineage progression. J. Neurosci. 2002, 22, 10333–10345. [PubMed]
13. Pozniak, C.D.; Langseth, A.J.; Dijkgraaf, G.J.; Choe, Y.; Werb, Z.; Pleasure, S.J. Sox10 directs neural stemcells toward the oligodendrocyte lineage by decreasing Suppressor of Fused expression. Proc. Natl. Acad.Sci. USA 2010, 107, 21795–21800. [CrossRef] [PubMed]
14. Rowitch, D.H.; Kriegstein, A.R. Developmental genetics of vertebrate glial-cell specification. Nature 2010,468, 214–222. [CrossRef] [PubMed]
15. Shen, S.; Li, J.; Casaccia-Bonnefil, P. Histone modifications affect timing of oligodendrocyte progenitordifferentiation in the developing rat brain. J. Cell Biol. 2005, 169, 577–589. [CrossRef] [PubMed]
16. Magri, L.; Gacias, M.; Wu, M.; Swiss, V.A.; Janssen, W.G.; Casaccia, P. c-Myc-dependent transcriptionalregulation of cell cycle and nucleosomal histones during oligodendrocyte differentiation. Neuroscience 2014,276, 72–86. [CrossRef] [PubMed]
17. Shen, S.; Sandoval, J.; Swiss, V.A.; Li, J.; Dupree, J.; Franklin, R.J.; Casaccia-Bonnefil, P. Age-dependentepigenetic control of differentiation inhibitors is critical for remyelination efficiency. Nat. Neurosci. 2008, 11,1024–1034. [CrossRef] [PubMed]
18. Swiss, V.A.; Nguyen, T.; Dugas, J.; Ibrahim, A.; Barres, B.; Androulakis, I.P.; Casaccia, P. Identification of agene regulatory network necessary for the initiation of oligodendrocyte differentiation. PLoS ONE 2011, 6,e18088. [CrossRef] [PubMed]
Int. J. Mol. Sci. 2016, 17, 614 16 of 16
19. Sher, F.; Rossler, R.; Brouwer, N.; Balasubramaniyan, V.; Boddeke, E.; Copray, S. Differentiation of neuralstem cells into oligodendrocytes: Involvement of the polycomb group protein EZH2. Stem Cells 2008, 26,2875–2883. [CrossRef] [PubMed]
20. Liu, J.; Casaccia, P. Epigenetic regulation of oligodendrocyte identity. Trends Neurosci. 2010, 33, 193–201.[CrossRef] [PubMed]
21. Ye, F.; Chen, Y.; Hoang, T.; Montgomery, R.L.; Zhao, X.H.; Bu, H.; Hu, T.; Taketo, M.M.; van Es, J.H.;Clevers, H.; et al. HDAC1 and HDAC2 regulate oligodendrocyte differentiation by disrupting theβ-catenin-TCF interaction. Nat. Neurosci. 2009, 12, 829–838. [CrossRef] [PubMed]
22. Tachibana, M.; Sugimoto, K.; Fukushima, T.; Shinkai, Y. Set domain-containing protein, G9a, is a novellysine-preferring mammalian histone methyltransferase with hyperactivity and specific selectivity to lysines9 and 27 of histone H3. J. Biol. Chem. 2001, 276, 25309–25317. [CrossRef] [PubMed]
23. Cao, R.; Wang, L.; Wang, H.; Xia, L.; Erdjument-Bromage, H.; Tempst, P.; Jones, R.S.; Zhang, Y. Role of histoneH3 lysine 27 methylation in polycomb-group silencing. Science 2002, 298, 1039–1043. [CrossRef] [PubMed]
24. Liu, J.; Sandoval, J.; Doh, S.T.; Cai, L.; Lopez-Rodas, G.; Casaccia, P. Epigenetic modifiers are necessary butnot sufficient for reprogramming non-myelinating cells into myelin gene-expressing cells. PLoS ONE 2010, 5,e13023. [CrossRef] [PubMed]
25. Douvaras, P.; Wang, J.; Zimmer, M.; Hanchuk, S.; O’Bara, M.A.; Sadiq, S.; Sim, F.J.; Goldman, J.; Fossati, V.Efficient generation of myelinating oligodendrocytes from primary progressive multiple sclerosis patientsby induced pluripotent stem cells. Stem Cell Rep. 2014, 3, 250–259. [CrossRef] [PubMed]
26. Liu, H.; Hu, Q.; D'Ercole, A.J.; Ye, P. Histone deacetylase 11 regulates oligodendrocyte-specific geneexpression and cell development in OL-1 oligodendroglia cells. Glia 2009, 57, 1–12. [CrossRef] [PubMed]
27. Liu, J.; Dietz, K.; DeLoyht, J.M.; Pedre, X.; Kelkar, D.; Kaur, J.; Vialou, V.; Lobo, M.K.; Dietz, D.M.;Nestler, E.J.; et al. Impaired adult myelination in the prefrontal cortex of socially isolated mice. Nat. Neurosci.2012, 15, 1621–1623. [CrossRef] [PubMed]
28. Cunliffe, V.T. Histone deacetylase 1 is required to repress notch target gene expression during zebrafishneurogenesis and to maintain the production of motoneurones in response to hedgehog signalling.Development 2004, 131, 2983–2995. [CrossRef] [PubMed]
29. Volpe, T.A.; Kidner, C.; Hall, I.M.; Teng, G.; Grewal, S.I.; Martienssen, R.A. Regulation of heterochromaticsilencing and histone H3 lysine-9 methylation by RNAi. Science 2002, 297, 1833–1837. [CrossRef] [PubMed]
30. Bernstein, B.E.; Mikkelsen, T.S.; Xie, X.; Kamal, M.; Huebert, D.J.; Cuff, J.; Fry, B.; Meissner, A.; Wernig, M.;Plath, K.; et al. A bivalent chromatin structure marks key developmental genes in embryonic stem cells. Cell2006, 125, 315–326. [CrossRef] [PubMed]
31. Dugas, J.C.; Cuellar, T.L.; Scholze, A.; Ason, B.; Ibrahim, A.; Emery, B.; Zamanian, J.L.; Foo, L.C.;McManus, M.T.; Barres, B.A. Dicer1 and miR-219 are required for normal oligodendrocyte differentiationand myelination. Neuron 2010, 65, 597–611. [CrossRef] [PubMed]
32. Pedre, X.; Mastronardi, F.; Bruck, W.; Lopez-Rodas, G.; Kuhlmann, T.; Casaccia, P. Changed histoneacetylation patterns in normal-appearing white matter and early multiple sclerosis lesions. J. Neurosci.2011, 31, 3435–3445. [CrossRef] [PubMed]
33. Gacias, M.; Gerona-Navarro, G.; Plotnikov, A.N.; Zhang, G.; Zeng, L.; Kaur, J.; Moy, G.; Rusinova, E.;Rodriguez, Y.; Matikainen, B.; et al. Selective chemical modulation of gene transcription favorsoligodendrocyte lineage progression. Chem. Biol. 2014, 21, 841–854. [CrossRef] [PubMed]
34. Paull, D.; Sevilla, A.; Zhou, H.; Hahn, A.K.; Kim, H.; Napolitano, C.; Tsankov, A.; Shang, L.; Krumholz, K.;Jagadeesan, P.; et al. Automated, high-throughput derivation, characterization and differentiation of inducedpluripotent stem cells. Nat. Methods 2015, 12, 885–892. [CrossRef] [PubMed]
35. Hu, B.Y.; Du, Z.W.; Zhang, S.C. Differentiation of human oligodendrocytes from pluripotent stem cells.Nat. Protoc. 2009, 4, 1614–1622. [CrossRef] [PubMed]
36. Shechter, D.; Dormann, H.L.; Allis, C.D.; Hake, S.B. Extraction, purification and analysis of histones.Nat. Protoc. 2007, 2, 1445–1457. [CrossRef] [PubMed]
© 2016 by the authors; licensee MDPI, Basel, Switzerland. This article is an open accessarticle distributed under the terms and conditions of the Creative Commons Attribution(CC-BY) license (http://creativecommons.org/licenses/by/4.0/).


![Epigenetic modulation in chronic hepatitis B virus infection...core particles intransgenic mice [ 3,4] and toinduceepigenetic repression of the cccDNA in human hepatocytes both in](https://img.pdfslide.us/doc/110x75/5f7739c01a26166de361212c/epigenetic-modulation-in-chronic-hepatitis-b-virus-infection-core-particles.jpg)