Embed Size (px)
Citation preview
1
Umeå University Medical DissertationsNew Series No 1151 ISSN 0346-6612 ISBN 978-91-7264-492-2
Epidemiology and Public Health SciencesDepartment of Public Health and Clinical Medicine
Umeå University, SE-901 87 Umeå, Sweden
Epidemiology of Cardiovascular Disease Risk Factors in Ethiopia:
The rural-urban gradient
Fikru Tesfaye2008
Epidemiology & Public Health Sciences, Department of Public Health and Clinical Medicine
Umeå University, Sweden

2
Epidemiology and Public Health SciencesDepartment of Public Health and Clinical MedicineUmeå UniversitySE-901 87 Umeå, Sweden
© Fikru Tesfaye 2008Printed by Print & Media, Umeå University, Umeå 2008:2004042
•

3
Dedicated to the Great Ethiopian Athletes – who continue to fill our hearts with pride, and our eyes with tears.

4
•

i
List of original papers
1. F Tesfaye, NG Nawi, H Van Minh, P Byass, Y Berhane, R Bonita and S Wall. Association between body mass index and blood pressure across three populations in Africa
and Asia. J Hum Hypertens 2007; 21: 28–37 2. F Tesfaye, P Byass, S Wall. Concurrent Comparison of Energy Intake and Expenditure
among Adults in Butajira District – ETHIOPIA. Public Health Nutrition 2008 (In press; DOI: 10.1017/S1368980008001705).
3. F Tesfaye, P Byass, Y Berhane, R Bonita and S Wall. Cigarette Smoking and Khat (Cata
Edulis Forsk) Use are Associated with elevated Blood Pressure among Adults in Addis Ababa- ETHIOPIA. Preventing Chronic Diseases 2007 (In press).
4. F Tesfaye, P Byass, S Wall. High Blood Pressure among Adults in Addis Ababa: a silent epi-
demic. (Submitted to Journal of Human Hypertension Jan 2008).

ii
•

iii
Table of contents
List of original papers .............................................................................................................. iTable of contents ................................................................................................................... iiiAcronyms ............................................................................................................................... vGlossary ............................................................................................................................... viiPreface ................................................................................................................................... ixAbstract ................................................................................................................................. xi
1. Introduction ....................................................................................................................... 1
2. Background Review ............................................................................................................ 3
3. Objectives ......................................................................................................................... 17
4. Methods ........................................................................................................................... 19 4.1 Study Areas and Populations ....................................................................................... 19 4.2 Study Design and Sampling ........................................................................................ 22 4.3 Survey Instruments ..................................................................................................... 24
5. Results .............................................................................................................................. 27 5.1 Review of main findings from papers I to IV ............................................................... 28 5.2 Rural-Urban Gradient of Cardiovascular Disease Risk Factors .................................... 34
6. Discussion ........................................................................................................................ 49 6.1 Blood Pressure ............................................................................................................ 49 6.2 Overweight and Obesity ............................................................................................. 50 6.3 Physical Inactivity ....................................................................................................... 51 6.4 Dietary Intake of Fruit and Vegetables ........................................................................ 53 6.5 Dietary Salt ................................................................................................................. 53 6.6 Dietary Energy Intake ................................................................................................. 54 6.7 Cigarette Smoking ...................................................................................................... 55 6.8 Khat Use ..................................................................................................................... 56 6.9 Strengths and Limitations ........................................................................................... 58
6.10 Implications for Policy .............................................................................................. 59
7. Conclusion and Recommendations .................................................................................. 61
8. References ........................................................................................................................ 63
Acknowledgements ............................................................................................................... 75

iv
•
v
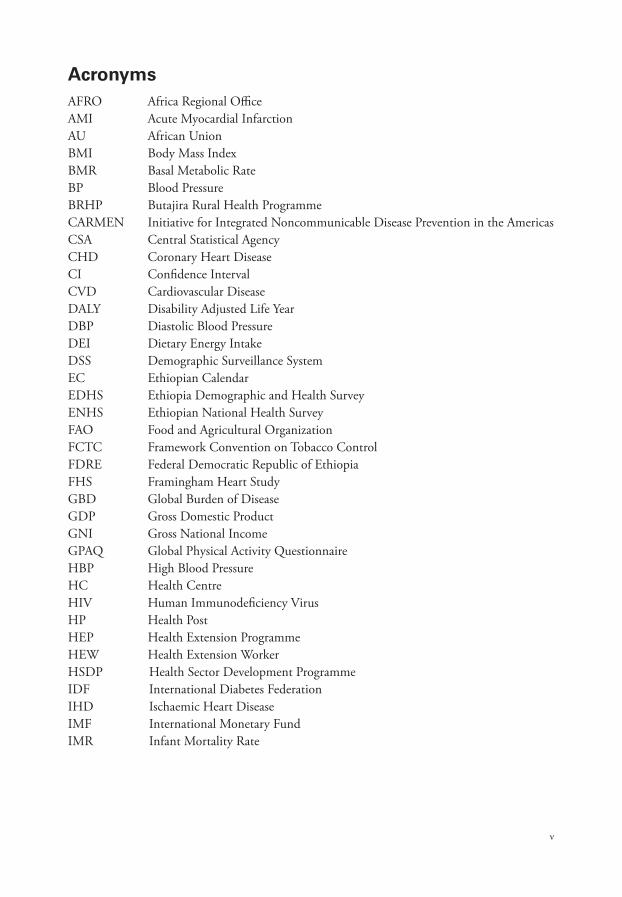
AcronymsAFRO Africa Regional OfficeAMI Acute Myocardial InfarctionAU African UnionBMI Body Mass IndexBMR Basal Metabolic RateBP Blood PressureBRHP Butajira Rural Health ProgrammeCARMEN Initiative for Integrated Noncommunicable Disease Prevention in the Americas CSA Central Statistical AgencyCHD Coronary Heart DiseaseCI Confidence IntervalCVD Cardiovascular DiseaseDALY Disability Adjusted Life YearDBP Diastolic Blood PressureDEI Dietary Energy IntakeDSS Demographic Surveillance SystemEC Ethiopian CalendarEDHS Ethiopia Demographic and Health SurveyENHS Ethiopian National Health Survey FAO Food and Agricultural OrganizationFCTC Framework Convention on Tobacco Control FDRE Federal Democratic Republic of EthiopiaFHS Framingham Heart StudyGBD Global Burden of Disease GDP Gross Domestic ProductGNI Gross National IncomeGPAQ Global Physical Activity QuestionnaireHBP High Blood PressureHC Health CentreHIV Human Immunodeficiency VirusHP Health PostHEP Health Extension ProgrammeHEW Health Extension WorkerHSDP Health Sector Development ProgrammeIDF International Diabetes FederationIHD Ischaemic Heart DiseaseIMF International Monetary FundIMR Infant Mortality Rate
vi
INDEPTH An International Network for the Continuous Demographic Evaluation of Populations and Their Health in Developing CountriesINTERHEART A Global Case-Control Study of Risk Factors for Acute Myocardial InfarctionKebele Smallest level of (government) administrationLEB Life Expectancy at BirthMDG Millennium Development GoalmmHg Millimetres of MercuryMOFED Ministry of Finance and Economic DevelopmentMOH Ministry of HealthMONICA Multinational MONItoring of trends and determinants in CArdiovascular diseaseNCD Noncommunicable DiseaseNGO Nongovernmental OrganizationNHS Nurses’ Health StudyOAU Organization for African UnityOR Odds RatioPA Physical ActivityPAL Physical Activity LevelPAR Population Attributable RiskPASDEP Plan for Accelerated and Sustained Development to End PovertyPHCU Primary Health Care UnitPHS Physician Health StudyPPS Probability Proportionate to SizeSBP Systolic Blood PressureSD Standard DeviationSDPRP Sustainable Development and Poverty Reduction ProgrammeSES Socioeconomic StatusSNNPRG Southern Nations, Nationalities and Peoples Regional Government SSA Sub-Saharan AfricaSTEPS STEPwise Surveillance (of chronic disease risk factors)TEE Total Energy ExpenditureTFR Total Fertility RateTGE Transitional Government of EthiopiaU5MR Under-five Mortality RateUnicef United Nations’ Children’s Emergency FundVIP Västerbotten Intervention ProgramWHO World Health OrganizationWHR World Health Report
•
vii
GLOSSARY
Demographic surveillanceThe continuous registration of all demographic events, including cause of death by verbal autopsy, in a geographically defined population.
Demographic surveillance system (DSS)DSS is a set of field sites and computing operations which longitudinally relate demographic information to health outcomes within a defined geographic area.
Demographic transitionThe shift from a pattern of high fertility and high mortality to one of low fertility and low mortality.
Disability-adjusted life years (DALY)A measure of disease burden that combines years of life lost and years lived with disability due to injury or illness. It is a common currency for reporting the burden of disease in a population.
EpidemiologyEpidemiology is the study of the distribution and determinants of health-related states or events in specified populations, and the application of this study to the prevention and control of health problems.
Epidemiological transitionThe shift from a pattern of high prevalence of infectious diseases associated with malnutrition, and periodic famine and poor environmental sanitation, to a pattern of high prevalence of chronic diseases associated with urban–industrial lifestyles.
Nutrition transitionThe shift away from traditional diets toward an industrialized diet that usually includes more preprocessed food, more food of animal origin, more added sugar and fat, and often more al-cohol.
Odds ratioThe odds of a particular exposure among persons with a specific disease divided by the corre-sponding odds of exposure among persons without the disease of interest.
Population attributable risk (PAR): The proportion of disease in a population that results from a particular risk to health. It is the incidence of a disease in the population that would be eliminated if exposure were elimi-nated.
RiskThe probability of an adverse health outcome, or a factor that raises this probability.

viii
Sample registration systemThe longitudinal registration of demographic events, including cause of death by verbal autopsy, in a nationally representative sample of clusters.
SurveillanceHealth surveillance is the ongoing systematic collection, analysis and interpretation of health data essential to the planning, implementation, and evaluation of public health practice, closely integrated with the timely dissemination of these data to users.
Verbal autopsyA structured interview with caregivers or family members of households after a death occurs; used to establish probable cause of death in places where most deaths take place outside of health facilities and direct medical certification is rare.
Vital eventAs defined by the UN is the occurrence of a livebirth, death, fetal death, marriage, divorce, adop-tion, legitimation, recognition of parenthood, dissolution of marriage, or legal separation.
Vital registrationAll sanctioned modes of registering individuals and reporting on vital events. These modes can include registration activities through complementary systems that are not done as part of the civil formal registration system and do not produce legal birth or death certificates.
•
ix
Preface
The problem of chronic diseases is gaining increasing attention in many developing countries. The World Health Organization (WHO) has led the development of appropriate methods and techniques for surveillance of chronic disease risk factors, and assisted countries through training, and provision of financial and technical support, among others. These efforts are yielding crucial information on the burden of risk factors, such as overweight and obesity, high blood pressure, smoking, and physical inactivity. While many African countries have joined the force, Ethiopia lagged behind the regional initiative – a reflection of the low priority it has until recently accorded to the problem of chronic diseases.
The present study was motivated by the development and validation of the WHO STEPwise approach to surveillance of chronic disease risk factors. The former Department of Community Health, at the Faculty of Medicine, Addis Ababa University took part in field-testing and valida-tion of various modules of the STEPS instrument and subsequently implemented the survey in different populations in the country. An effective cross-country collaboration with researchers in Indonesia and Vietnam has also emerged in the process, which created an opportunity for multi-site research and experience sharing. This international collaboration continues to be fostered and mentored by visionary leadership at the Umeå International School of Public Health and the World Health Organization.
The first STEPS survey in Ethiopia was conducted under the Butajira Rural Health Program, which is a demographic surveillance site in Butajira District of Central Ethiopia. The site offered many advantages, including a sampling frame and the possibility of monitoring progression of risk factors over time, as the population under surveillance could be traced. The findings revealed various behavioural and physiological risk factors of chronic diseases, as well as differences between the rural and urban segments of the population, which prompted extension of the STEPS to the largest urban centre in the country – Addis Ababa City. Subsequently, widespread prevalence of high blood pressure, overweigh, physical inactivity, and other risk factors of chronic diseases were uncovered among the adult population in the city.
The present work focuses on diet and lifestyle related risk factors of cardiovascular diseases (CVD), which are also common to a number of other chronic diseases including diabetes and cancers. The Findings should help to bring cardiovascular diseases and other chronic diseases, to the agenda of public health policy makers, researchers, and the public at large, so that appropri-ate prevention and control strategies are implemented along with a population wide surveillance intervention.
The dissertation illustrates the rural-urban gradient in the distribution of cardiovascular disease risk factors across the predominantly rural population of Butajira District and the urban population of Addis Ababa. By so doing, it lays the foundation for understanding and tracking the course of the epidemiologic transition in Ethiopia and other developing countries.

x
•
xi
Abstract
BackgroundChanges in the population structure and the main causes of death result in the growing burden of chronic diseases, which characterize the epidemiological transition. The transition takes place at different paces in different parts of the world. The developed world has taken over a century to complete the transition, and the rapidly developing countries of Asia and Latin America are undergoing a swift transition. In contrast, many sub-Saharan African countries are said to be experiencing a delayed transition.
In Ethiopia, routine health care reports are incomplete and erratic. Lack of nationwide data on causes of death clouds understanding of the burden of disease or its composition. Consequently, there is limited knowledge on the course of the epidemiological transition, which has left room for widespread scepticism concerning the importance of chronic diseases in the country. Hence, the health system continues to be heavily reliant on the conventional “infectious disease paradigm”, and fails to be responsive to emerging health problems.
Assessing the pattern and causes of disease burden enables meeting the health care needs of vulnerable population segments and devising cost-effective interventions that avert the impact of emerging diseases on the health and well-being of the nation. However, in countries without a functional system for registration of vital events, such as births and deaths, complete and reliable data on the burden of chronic diseases will not be available. Data on their risk factors, which are valuable for prevention and control programmes, can be generated through population-based surveillance, and serve as a practical alternative.
ObjectivesThis research project was implemented in order to illustrate the distribution of risk factors for cardiovascular diseases (CVD), and examine the gradient across urban and rural populations in Ethiopia, thereby contributing to national and global efforts of tracking the course of the epidemiological transition.
MethodsThe WHO STEPS instrument was employed in two populations of central Ethiopia, representing a predominantly rural district (Butajira) and the national capital – Addis Ababa. Over 8000 adults in the age group 25-64 years, from the two populations, participated in interview and physical measurements, which were conducted in a standard manner. Ethical clearance for the project was obtained from appropriate national bodies and ethical conduct was maintained throughout the research process.
ResultsThe findings revealed wide disparities, between urban and rural populations, in the distribu-tion of the main risk factors of CVD. Elevated blood pressure, obesity, and physical inactivity were more concentrated in urban populations, while the rural-urban gap was narrower with the
xii
distribution of cigarette smoking and binge drinking of alcohol. The use of substances like khat (Catha edulis Forsk), which may increase the risk of acute myocardial infarction, is expanding from rural areas that grow the plant to urban populations, partly due to improved transportation and market forces.
The gap in the distribution of risk factors between the sexes is wider in rural populations and narrows down in urban areas. Thus, men in rural areas have a markedly higher prevalence of hypertension than women, while the level is similar between men and women in urban areas. Urban women carry more risk of CVD due to higher prevalence of physical inactivity, overweigh and obesity. Intake of fruits and vegetables is not consistent with optimal cardiovascular health in both rural and urban populations, but comparatively better in rural areas.
Conclusion and recommendationsThe prevalence of high blood pressure in urban Ethiopia is similar to other sub-Saharan Afri-can countries, and closely comparable to the situation in the developed world. Owing to the established contribution of high blood pressure to CVD morbidity and mortality, it (elevated blood pressure) may represent the principal risk factor for CVD in the Ethiopian population, particularly in urban areas.
Programmes for the prevention and control of CVD in Ethiopia should give due priority to the prevention of high blood pressure and its precursors, such as physical inactivity, overweight and obesity. Population wide strategies should be implemented to promote healthy dietary behaviour and physical activity, and to prevent smoking and substance use behaviours. Programmes should also aim to improve awareness, detection and appropriate clinical management of high blood pressure among health care providers and the public at large.
The stepwise surveillance of chronic disease risk factors (STEPS) should be implemented on a sentinel nationwide basis in Ethiopia, in order to inform policy and guide strategies and programmes for the prevention and control of CVD and other chronic diseases. The national health extension program offers an opportunity to establish a system for registration of birth, death, and similar vital events at a population level, which provides a more reliable foundation for estimating vital indicators and disease burdens.
•
1
inTroDUCTion
1. IntroductionDeveloping countries are encountering a growing burden of chronic diseases, which constitute a “double burden” alongside infectious diseases and nutritional problems.
Although chronic diseases represent a considerable proportion of the disease burden in the African Region(1), adequate efforts are not devoted to their prevention and control(2,3).
The main chronic diseases – cardiovascular disease, diabetes, and cancers – share a few common risk factors that are related to diet and lifestyle behaviours. These include high blood pressure, high cholesterol, tobacco use, excessive alcohol use, inadequate intake of fruit and vegetables, and being overweight, obese or physically inactive, all of which are on the rise in many African countries. The contribution of these risk factors to CVD is consistent in Africa and other parts of the world(4,5). Thus, just five risk factors account for about 90 % of the risk of first myocardial infarction in African populations(4).
Although the effect of risk factors on CVD in Africa is similar to that in other populations, the risk of CVD morbidity and mortality associated with hypertension may even be higher in Africans(5). Twice as many deaths from cardiovascular diseases now occur in developing countries as in developed countries. These diseases affect younger populations and lead to premature mortal-ity in developing countries(6,7) due to lack of prevention or effective management of CVD risk factors(4,5). Stroke and cervical cancer occur at younger ages and in larger numbers in the African region than in developed countries(2). Age-specific death rates for chronic diseases are higher in many low-income and middle-income countries than in high-income countries(8).
Various studies have reported changing patterns of CVD risk factors, especially in urban areas in Africa, due to unhealthy lifestyle behaviours(9–13). The growing burden of chronic diseases and their risk factors represents an epidemiologic transition that is mainly characterized by changes in the population structure and the principal causes of death. The transition occurs at different paces in different places, depending on the rate of fertility changes, the distribution of risk factors, and the health system’s ability to respond to the changing epidemiological profile(14).
The epidemiological transition has reached maturity in the western world, where it has taken place over a century. In contrast, many of the rapidly developing countries in Africa, Asia, and Latin America are experiencing swift changes in the health and disease of their populations that are accompanied or driven by socioeconomic development, industrialization and urbanization(14). The CVD risk profile of African populations is said to be consistent with early stages of the epidemiological transition(4). However, there are no comprehensive studies that have adequately described the transition in the African continent.
In Ethiopia, as in many developing countries(15-17), there are no complete or reliable records of births and deaths at the national level. Institution-based data are grossly deficient and biased due to limited access to or utilization of health services. In the absence of reliable data, national health and development policies and strategies lack a firm ground for the design and implementation of effective programmes. Instead, they are bound to rely on conventional views about disease control priorities. Such policies and strategies fail to respond to emerging and re-emerging health problems across different sections of the population.
inTroDUCTion
2
The prevention and control of chronic diseases has not surfaced in the health care agenda in Ethiopia. Thus, the Health Sector Development Programme (HSDP) and its implementation to date have paid little attention to the problem of chronic diseases. The HSDP places priority on the prevention of “poverty related diseases”. However, the notion of poverty related health problems in Ethiopia seems to be devoted to communicable diseases in a narrow sense. Although infectious diseases and malnutrition are closely related to poverty, restricting the use of the ex-pression to communicable diseases only reinforces the misconception that chronic diseases are “diseases of affluence”.
In contrary to widespread belief, the epidemiology of diseases in poor and rich populations is converging rapidly, such that CVD, diabetes, and cancers are widely prevalent among the rich and poor alike(6,7). As a country develops economically, chronic disease risks may first increase among the wealthy but soon concentrate among the poor(6). Chronic diseases and poverty are interconnected in a vicious cycle. In many countries, it is the poorest people who are most at risk of developing chronic diseases and dying prematurely from them, as they are least able to cope with the resulting financial burden. Chronic diseases can cause poverty in individuals and families, and draw them into a downward spiral of worsening disease and poverty(6,7,18).
Health institution-based data compiled by the Federal Ministry of Health of Ethiopia (FMoH) indicate the leading causes of outpatient visits, admissions and deaths(19). Although these data fail to cover all health facilities or regions of the country, hypertension is emerging in the list of causes of hospital deaths in recent years(19). Owing to the lack of diagnostic skills and facilities to detect ischaemic heart disease, cerebrovascular disease, and other chronic diseases at peripheral health institutions in the country, and the associated poor recording and reporting system, the emergence of hypertension as a cause of hospital death may represent the “tip of the iceberg”.
Population-based data on cause of death from a few isolated studies, in predominantly rural populations, in Ethiopia also demonstrate that a considerable proportion of the disease burden in these populations is due to CVD and other chronic diseases(20). Despite widespread scepti-cism about the public health importance of chronic disease in the country, the available data, although scanty, suggest that about one in four lives or DALYs in rural Ethiopia may be lost due to chronic diseases. This proportion gets even bigger when looking at the causes of DALYs lost among adults or in urban populations separately.
Effective prevention and control of CVD needs understanding of their contribution to the overall disease burden, and adequate information on the distribution of risk factors in different geographic and socioeconomic groups of the population. However, lack of reliable data on the burden of diseases or their risk factor in developing countries continues to cloud understanding of the epidemiologic transition and the formulation of appropriate policies.
Recently, notable efforts have been initiated in many developing countries to describe the pattern of risk factors for chronic diseases using the WHO approach for stepwise surveillance of risk factors, also known as STEPS. Our work represents one such initiative in Ethiopia.
Assessment of the epidemiological transition at the national level will not be complete in the absence of reliable and representative data on disease burden. However, findings of this study will be valuable for raising awareness, among policy makers and the public at large, on the current magnitude of CVD risk factors and the need for surveillance undertakings. This work sets the foundation for future efforts of prevention and control of CVD and related chronic diseases.
•
3
BaCkgroUnD rEviEw
2. Background review
PopulationThe population of Ethiopia was estimated to be about 75 million in 2005. The median age of the population, which has remained between 17 and 18 years since 1950, is estimated to grow to 27.8 by 2050. Population projections also reveal that the proportion of those under age 15 years declines steadily beyond 2005, while that of adults and elderly increases constantly. Thus the proportion of adults 60 years and older will grow from 5% in 2005 to 10% by 2050(21).
The Ethiopian population has been growing at an annual rate of 2.7% during 1970–1990 and 2.8% during 1990–2005. The average annual growth rate of the urban population has been 4.6% during 1970–1990 and 4.4% during 1990–2005(22). Currently, about 84% of the population lives in rural areas with poor access to health care and other social services. In 1950, only about 4.6% of the population resided in urban areas, which doubled to 10% by 1980, and reached 16% in 2005. In 2030, this proportion is estimated to grow to 27%(21).
Ethiopia is not spared from population aging and increasing urbanization that will modify the demographic structure and disease profile, resulting in a shift from child health problems towards that of adults and elderly people.
EconomyEthiopia is one of the least developed countries in the world, with a per capita gross national income (GNI) in 2004 of US$110(23). Agriculture accounts for 54 % of the gross domestic product (GDP) and about 90 % of the exports. About 80 % of the population is engaged in agriculture and related activities(24).
The Ethiopian economy has been growing steadily during the past few years, resulting in real per capita income increasing at 7 % per annum – the fastest in Ethiopia’s recent history. This strong economic growth is expected to continue in subsequent years(25). At the current rate of annual economic growth, Ethiopia may be able to attain the first millennium development goal (MDG) of halving the proportion of the population that lives with under a dollar a day(26).
The Ethiopian government envisages transforming the country into one with a middle-income economy in the next two decades(27). However, numerous social, demographic, and epidemio-logical changes are likely to accompany such a rapid economic transformation. Under the forces of globalization, unregulated markets facilitate the import of processed foodstuffs and drinks, which often have added salt, sugar, oil and fats that increase the energy density of the diet. The accompanying socioeconomic changes will also increase exposure to imported substances and behaviours, such as cigarette smoking, alcohol drinking, and the use of addictive drugs.
Urbanization and industrialization influences will also reflect in reduction of manual labour and decreased physical activity. The use of motorized vehicles will dominate as a means of trans-portation. Unregulated and shortsighted urban development planning may result in shrinking of pedestrian pavements, green areas, city parks, and school playgrounds, due to construction of buildings and motor-vehicle ways. These forces will eventually diminish opportunities for ex-
BaCkgroUnD rEviEw
4
ercising, walking and cycling in towns and cities. In the long run, such influences unfavourably modify the lifestyle of the population.
Although rapid economic transformation is to be desired, there is an apparent need to plan in advance on ways of dealing with the accompanying social and cultural changes that may negatively impact on the health and wellbeing of the population, and subsequently on national development. Preventing chronic disease risk factors, such as poor dietary and lifestyle behaviours, which may be more effective than reacting after perceiving their consequences, should get due attention during economic growth and urbanization(28). Prevention of the CVD epidemic depends on adequate understanding and promotion of healthy dietary and lifestyle behaviours(4,5).
Health SystemThe health status of the Ethiopian population is extremely poor, even by sub-Saharan African standards. The widespread poverty, low education, inadequate access to safe water and sanitation facilities, low health care resources, and consequently, limited access to and quality of health services, have all contributed to the prevailing poor health status in the country(29).
A national health policy and health sector strategy have been developed in order to address the health problems of the population and guide the health system(29). The Health Policy of the Transitional Government of Ethiopia(29) aims at achieving access, for all segments of the popula-tion, to a basic package of primary health care services, through a decentralized state system of governance. The service package includes basic curative services, disease prevention, and health promotion services.
The national health policy and health sector strategy are executed through the Health Sector Development Programme (HSDP) which constitutes part of the national strategy for sustainable development and poverty reduction programme (SDPRP). The HSDP spans over 20 years, in cycles of five years each. The first two cycles (HSDP I and II) have been completed and the third round is underway(30,31).
The overall goal of the HSDP is to improve the health status of the Ethiopian population. The HSDP I(30) was designed explicitly to respond to the health care needs of the rural popula-tion, who constitute 85% of the total population. Disease prevention was at the centre of its priority. HSDP II(31) also aimed to contribute to poverty reduction and national socio-economic development through improving the health of the poor. It was reoriented towards poverty related diseases and the design and implementation of the “Health Extension Package”, which aimed at an effective prevention and control of communicable diseases through active community participation(31). Priority was given to health service coverage (expansion and maintenance), preventive health services, and quality of health care in the implementation of HSDP II. The HSDP III(32) continues the thrust on primary health care, and focuses at strategies and activities needed to attain the MDGs(32).
The HSDP III(32) is part of a new five-year poverty reduction paper known as a Plan for Ac-celerated and Sustained Development to End Poverty (PASDEP) for 2005/06–2009/10(27), which puts health as one of the priority sectors. The PASDEP document clearly states that the focus of the programme’s health component will be on “poverty related health problems in the country such as communicable diseases like malaria and diarrhoea, and those health problems affecting children and mothers.” It further indicates that efforts would be concentrated on rural areas(27).
•
5
BaCkgroUnD rEviEw
Health Indicators and Health Service CoverageRecent estimates of infant mortality rate (IMR), under-five mortality rate (U5MR), total fertil-ity rate (TFR), and life expectancy at birth (LEB), revealed marked regional disparities with an overall urban-rural divide. Thus, IMR varied between 45 in the national capital- Addis Ababa and 92 in Gambella, which is one of the peripheral regions in the country. U5MR varied from the lowest 72 in Addis to over 150 in Amhara, SNNPR, and Gambella regions. The CBR and TFR, respectively, were 25 and 2.4 in urban areas and 57.5 and 6 in rural areas. The LEB was highest in Addis Ababa, at 60.3 for males and 64.1 for females, compared to the national average of 53.4 for males and 55.4 for females(22). The LEB, for the two sexes combined, is projected to reach 67.3 years by 2050(21).
The national coverage with primary health care services has recently grown (more than doubled) to about 75% from under 45% in 1998 (start of HSDP I). The rate of utilization of formal health services was estimated at 27% per person per year in 2000 EC, and 36% in 2005 EC. Access to and utilization of health services is much lower in rural populations in general and pastoralist populations (about 10% of total), in particular. Only 37% of the population had access to safe drinking water and 29% to excreta disposal facilities(19).
A Health Extension Programme (HEP) is currently underway so as to expand access to health services in rural areas. The HEP focuses on the prevention and control of communicable disease with active community participation. The main objective of HEP is to improve equitable ac-cess to sustained preventive health interventions and increased health awareness at village and household levels. The HEP is also intended to serve as a mechanism for redistributing health care resources from the current urban dominance to the rural areas where the majority of the country’s population lives(26).
The programme involves training and deployment of over 33,200 health extension workers (HEW) in more than 15,000 health posts (HP) and the construction or upgrading of 3153 health centres (HC) by 2009. The HEW undergo a one year training course which includes 16 major packages under four components; hygiene and environmental sanitation, family health services, disease prevention and control, and health education and communication(26).
The HEP offers a unique opportunity for establishing a system for vital registration on major demographic events such as births and deaths thereby contributing to more reliable estimates of crude birth and death rates nationwide.
Burden of Diseases in EthiopiaTo date, there is no national vital registration system in Ethiopia. Data on causes of outpatient visits, admissions or deaths at health facilities are not consistently available for all parts of the country. From the limited (incomplete) health facility based data, hypertension has been cited among the leading causes of death at health facilities over the past few years(19).
A few observational studies from the largest teaching hospital in Addis (Tikur Anbessa Hos-pital) have reported a steady increase in the proportion of admissions due to stroke, myocardial infarction, and diabetes mellitus. AMI was the third commonest cause of admission to the medical intensive care unit at Tikur Anbessa Teaching Hospital during the period 1988 1997, account-ing for 8.8% admissions(10,33–35). Hypertension was the most common risk factor of stroke and myocardial infarctions(10,34,35).
BaCkgroUnD rEviEw
6
There are only a few demographic surveillance sites that are monitoring vital events in popula-tions, the most notable one being the Butajira Rural Health Programme (BRHP), which has been operational since 1987. Estimates of the burden of disease within the BRHP in 1998 indicated that chronic diseases contributed to about 24% of the DALYs lost in this predominantly rural population. Whereas, communicable, maternal, perinatal and nutritional causes accounted for 72% of the DALYs(20).
According to the data made available by the Global Burden of Disease study(1) NCDs ac-counted for 23% of deaths and 20% of DALYs lost in Ethiopia, with the corresponding estimates for communicable, maternal, perinatal, and nutritional causes being 71% of deaths and 73% of DALYs. However, these causes of death were predicted using cause-of-death models due to lack of information on level of adult mortality or cause of death at the country level(36). According to the same estimate for Ethiopia(36), among the NCDs, cardiovascular diseases accounted for the major proportion of deaths 42% and 24% of the DALYs lost. Other important causes of death, among NCDs, include malignant neoplasms (16%) and respiratory diseases (12%).
In many developing countries, including Ethiopia, most deaths take place out of conventional health facilities, often at home, unattended by health workers. Thus, cause-of-death data either do not exist or are unreliable(14,16,38) as cause of death is undetermined and unrecorded(15–17). Worldwide, an estimated 48 million unregistered births take place every year. Developing countries account for 99% of the unregistered births, with sub-Saharan Africa and South Asia together accounting for 79% of all unregistered births(15).
The potentials of linking surveillance of risk factors and mortality with existing demographic surveillance systems (DSS) in developing countries, such as Ethiopia, has been illustrated earlier(37). The DSS infrastructure as in the BRHP offers unique operational and methodological advantages for surveillance of chronic disease risk factors. It provides the demographic structure of the source population and can serve as a sampling frame. Surveillance of risk factors and mortality at DSS will enable tracking changes in both exposure and health outcomes, primarily mortality, and thus characterizing the epidemiological transition alongside the demographic transition(37).
In developing countries that lack a system for vital registration, medical certification of death, or post mortem examination, use of the verbal autopsy method enables to assess the cause-specific mortality attributable to chronic diseases. Quantifying and characterizing the link between risk factors and mortality provides a basis for designing effective interventions, whereas the ongoing surveillance will permit evaluations of interventions.
Linking risk factor surveillance with demographic surveillance may potentially be a lever for hypothesis-driven research, with varying research designs, aimed at addressing specific and more detailed research questions. Thus, the DSS provide sampling frames for analytical studies, such as for selecting cases for case-control studies(37).
Global Burden of Cardiovascular DiseaseThe burden of chronic diseases is increasing in low- and middle-income countries, while it remains stable in high-income countries. Almost 50 % of the adult disease burden in low- and middle-income countries is now attributable to chronic diseases, and about 30 % of all deaths in these countries occur at ages 15 to 59, compared with 15 % in high-income countries(39).
•
7
BaCkgroUnD rEviEw
CVD is the leading cause of death worldwide except in SSA, where it is surpassed by HIV/AIDS. About 80 % of the global burden of CVD deaths occurs in low- and middle-income countries, and CVD is predicted to be the leading cause of death and disability worldwide by 2020 mainly because it will increase in low- and middle-income countries(1,40).
CVD accounted for 13 % of disease burden among adults 15 and older in 2001. IHD and cerebrovascular disease are among the top ten causes of death in all low- and middle-income regions(39).
Population aging and changes in the distribution of risk factors have accelerated the epidemic of chronic disease in many developing countries. In low- and middle-income countries, risk fac-tors for chronic diseases, such as high blood pressure, smoking, and alcohol use, are important causes of the burden of disease next to childhood underweight and unsafe sex. In SSA, the lead-ing risk factors contribute to 54% of the mortality and 49% of the burden of disease (DALYs) in 2001(1,40).
Cardiovascular Disease Risk FactorsThe major risk factors for CVD include tobacco use, high blood pressure, high blood glucose, lipid abnormalities, obesity, and physical inactivity. The global variations in CVD rates are related to temporal and regional variations in these known risk factors. Although some risk factors, such as age, ethnicity, and gender, obviously cannot be modified, most of the risk is attributable to lifestyle and behavioural patterns, which can be changed. The hazards of alcohol use, smoking, high blood pressure, high cholesterol, and overweight and obesity are globally widespread and have large health effects. A small number of risks account for large contributions to the global loss of healthy life(41,4,5).
Approximately 16 % of the global disease burden was attributable to risk factors that have substantial dietary determinants (high blood pressure, high cholesterol, overweight and obesity, and low fruit and vegetable intake) and to physical inactivity. These patterns are not uniform within regions(42–44). For major cardiovascular risk factors (blood pressure, cholesterol, tobacco use, fruit and vegetable intake, body mass index, and physical inactivity) 43%–61% of the attribut-able disease burden occurs between the ages of 15–59 years, and 87% of the alcohol-attributable burden occurred in this age group(42-44).
Studies have reported that about 83.1% of the AMI in African populations can be attributed to just four risk factors that can be assessed through interview and selected physical measurements; (history of diabetes, self-reported hypertension, current/former tobacco smoking, and abdominal obesity (measured as waist to hip ratio)(4) indicating that exposure to the known CVD risk factors in Africa could have substantial contribution to the risk of AMI. Most of these risk factors have higher odds ratios and PAR values in Africans than in other populations(5). History of diabetes and hypertension has the strongest association to AMI in African populations(4). The odds of AMI due to hypertension (OR=3.44; 95% CI=2.64 to 4.48) are higher in Africa than in other populations. As a result, the PAR for history of hypertension in black Africans (PAR=41.9%; 95% CI 32.5 to 52.0) is markedly higher than similar estimates for the rest of the world.
Studies have also demonstrated that the major CVD risk factors were consistently adverse in all regions of the world and in all ethnic groups. In particular, the odds ratios for these risk
BaCkgroUnD rEviEw
8
factors were qualitatively similar (directionally similar) despite variations in prevalence. These findings suggest that the overall approach to prevention of CVD could be similar worldwide, but with varying emphasis in different subgroups (e.g. sex and geographic region) on the basis of the prevalence of individual risk factors and economic and cultural factors.
The importance of modifying risk factors is supported by data from randomized trials – e.g. blood pressure lowering(45) lipid lowering(46), dietary modification(47), or persuasive evidence of causality from observational studies(48) (e.g. smoking cessation)(49).
Globally, smoking is one of the most important risk factor for AMI, which accounts for about 36% of the PAR of AMI (about 44% in men). Regular consumption of fruit and vegetables was associated with a 30% relative reduction. Thus, eating fruit and vegetables, taking exercise, and avoiding smoking could lead to about 80% lower relative risk for myocardial infarction worldwide(5).
Findings of the US Nurses Health Study(50) also indicated than lifestyle modification could potentially avoid more than three-quarters of the risks of coronary heart disease and strokes in women. The Lyon Heart Study(47) suggested that dietary modification alone reduced the risk of coronary heart disease by about half in patients with coronary disease.
The INTERHEART study findings(5) suggest that lifestyle modification is of substantial im-portance in both men and women, at all ages, in individuals from all geographic regions of the world, and in those belonging to all major ethnic groups. Therefore, smoking avoidance, increased consumption of fruit and vegetables, and moderate activity (along with lipid lowering) should be the cornerstone of prevention of coronary heart disease in all populations worldwide.
Diabetes MellitusType 2 diabetes mellitus is an important chronic disease on its own, and a frequent risk factor CVD morbidity and mortality(51).
An estimated 246 million people (6% of adults) worldwide had diabetes in 2007. The pro-portion is expected to rise to 7% by 2025. About 80% of the 246 million people with diabetes live in developing countries. An additional 7.5% of the adult population worldwide is estimated to have impaired glucose tolerance, which significantly increases the risk of developing type 2 diabetes(52).
About 7 million people develop diabetes every year and three million deaths are attributable directly to diabetes. A much higher proportion of people die due to cardiovascular disease that is complicated by diabetes-related lipid disorders and hypertension(52).
The rapidly increasing prevalence of type 2 diabetes is attributed to increased urbanization, high prevalence of obesity, sedentary lifestyles and stress, among other factors. Accordingly, up to 80% of type 2 diabetes is preventable by adopting a healthy diet and increasing physical activity. Cardiovascular disease is the major cause of death in diabetes, accounting for about 50% of all diabetes fatalities, and much disability. People with type 2 diabetes are over twice as likely to have a heart attack or stroke as people who do not have diabetes(52).
Type 2 diabetes is responsible for loss of 5–10 years of life expectancy, most of which occurs due to excess cardiovascular mortality. It also increases the risk of retinopathy and blindness, lower limb amputations, as well as morbidity and mortality from renal diseases. An estimated
•
9
BaCkgroUnD rEviEw
10 to 20% of people with diabetes die of renal failure. It is the largest cause of kidney failure in developed countries and is responsible for huge dialysis costs(52).
According to the International Diabetes Federation (IDF)(52), the prevalence of type 2 diabetes mellitus among adults (20–79 years of age) in Ethiopia in 2003 was 1.9 %, which is estimated to rise to 2.4 % by 2025. The prevalence in 2003 was higher in males (2%) and urban areas (1.1%) compared to females (1.7%) or rural residents (0.7%). The prevalence ranged between 0.1 to 5% in most African countries with the exception of Mauritius and Seychelles (12 –13%). The overall prevalence for the Africa Region was estimated at 2.4% in 2003 and 2.8% in 2025(52).
Some information on diabetes among Ethiopians come from studies conducted on Ethiopian (Jewish) immigrants to Israel. The immigrants moved to Israel in two operations during 1984–85 in Operation Moses (OM), and 1991 in Operation Solomon (OS)(53–55).
The prevalence of diabetes mellitus among 445 new immigrants (OM) was studied immediately after their arrival to Israel, and found to be 0.4%. It was explained that the low prevalence could have been due to the long trek accompanied by severe malnutrition which caused death to the old, weak and sick, leaving a selectively young and health population group.
In the second group of 254 immigrants (OS) studied immediately after their arrival in Israel in 1991, no case of diabetes was found. Although the BMI of this population was higher than those obtained in the earlier group (OM), the serum glucose levels in almost all age groups were significantly lower(54,56).
In a study of young adult Ethiopian immigrants to Israel(55) 14 (8.9%) of the study participants had diabetes, and another 14 (8.9%) had impaired glucose tolerance. The immigrants had lived in Israel for about four years during which time they experienced a profound change in dietary habits, with consumption of large amounts of refined carbohydrate in place of the largely cereal based foods that had constituted their staple diets at their country of origin.
A longitudinal study of 53 young male Ethiopian immigrants who resided in a relatively controlled environment (agricultural boarding school) for two years after immigration indicated a significant increase of both the systolic and diastolic blood pressures. At two years, 11 of the 53 subjects (20.7%) had hypertension. Total, high-density lipoprotein (HDL) cholesterol and triglyceride levels also increased significantly. However, the mean BMI was not different from the baseline value(57). Relatively high glucose intolerance was found among both Ethiopian group of immigrants, but there was no deterioration in glucose tolerance after 2–3 years of Israeli life-style(53).
The higher prevalence of type 2 diabetes mellitus among Ethiopian Jewish immigrants was at-tributed to the radical changes in food consumption and lifestyle between their current residence and country of origin(53,54,57).
Prevention and Control of CVD Although the epidemiological transition is underway in all countries, national response to dis-ease prevention and control is still based on the infectious disease paradigm. Consequently, the global and national capacity to respond to chronic disease epidemics is underdeveloped, and few countries have implemented comprehensive prevention and control policies(58).
In recent years, the need to address the chronic disease epidemic in SSA has become more evident(59). The 1993 “minimal cost public health package” for low-income countries, including
BaCkgroUnD rEviEw
10
most of sub-Saharan Africa, already recommended actions against obesity and tobacco and alcohol consumption – major potentially modifiable risk factors for CVD(60). Modification of diet and lifestyle related risk factors at the population level is the most cost-effective approach towards reducing the CVD burden especially in African populations(4,61). Given the limits of resources, the challenge in developing countries would be to plan and implement complementary cost-effective prevention and control programmes for a wide and diverse range of prevalent diseases(62).
Few developing countries have national policies and strategies for the prevention and control of chronic diseases. To a large extent this is due to competing priorities from infectious diseases such as malaria, tuberculosis, HIV/AIDS and nutritional problems. This is further compounded by the lack of reliable data on the burden of chronic disease and their risk factors, and lack of understanding (appreciation) of the importance and cost- effectiveness of prevention. Vested interests within governments and private companies may also negatively influence researchers, policy makers and the media. In this regard, the economic interest of governments in employ-ment, and revenue generation, from production and export of items, such as tobacco, alcohol, and khat, are among the factors that may hinder the development of national policies and their implementation.
CVD prevention and control programmes should be based on a firm foundation of epide-miological surveillance on the burden of disease and their risk factors. Without a reliable system of measuring burden and trend of diseases or their risk factors, a programme is unlikely to be effective. The design and implementation of successful programmes necessitates that policy makers, planners and other stakeholders, and the public at large, be presented with convincing evidence of the current and future burden of diseases(60). Raising awareness and evidence-based commitment among policy makers is the first step necessary for establishment of a multi-sectoral chronic disease unit at the national level(61).
Research has identified the relative contributions of various preventive strategies to the declines in CVD mortality(63). Improvement of dietary behaviours and reductions in smoking prevalence, especially for men, are believed to have made remarkable contribution to the decline in CVD mortality(64). On the other hand, the high-risk approach to CHD primary and secondary preven-tion has been expensive and only moderately successful(65). The greatest contribution to the CHD decline in some of the MONICA populations has come from the population-wide approach to primary prevention(66). The reduction of population blood pressure levels through reduction of salt intake and, to a lesser extent, the better management of hypertension have been major factors in the decline in stroke mortality(67). Modest reductions in blood pressure, obesity, cholesterol and tobacco use would more than halve cardiovascular disease incidence, if these reductions were population-wide and simultaneous.
The value of integrating population-based measures to modify risk factors and cost-effective strategies for the treatment of individuals who have clinically manifest disease or are at increased risk of developing disease is also gaining more popularity(60,68). A comprehensive CVD programme will be more effective if it combines prevention with clinical care, as this would be necessary to generate and sustain public support, and thereby avoid a “population-paradox”(69).
Many major global risks are widely spread in a population, rather than restricted to a minority. Most of the disease burden for continuous risks occur in those with only moderately raised levels, not among those with levels about commonly used cut-points, such as those with hypertension
•
11
BaCkgroUnD rEviEw
or obesity(70). It has been well established that “a large number of people exposed to a small risk may generate many more cases than a small number exposed to high risk”(69). Managing individual, high-risk crises, while appropriate for individuals, can only have a limited preventive effect at the population level(70). Population-based strategies that seek to shift the whole distribution of risk factors often have the potential to produce substantial reductions in disease burden(70).
Systematic assessment of multiple risks within any given population can provide the basis for selecting packages of interventions that include population-wide measures as well as highly targeted interventions provided to much smaller subsections of he population with constellations of major risks(70-72).
Cardiovascular Disease ResearchA number of population-based studies carried out in the developed world have contributed to the growing understanding of the epidemiology of CVD and their risk factors. The earliest and most notable in this regard is the Framingham Heart Study (FHS) that was established in 1948 in Framingham, Massachusetts, USA(73). In subsequent years, the Nurses’ Health Study(74) and the Physicians’ Health Study (PHS)(75) in the USA, and the North Karelia project in Finland(76), the MONICA (Multinational MONItoring of trends and determinants in CArdiovascular dis-ease)(77) and CARMEN (Initiative for Integrated NCD Prevention in the Americas)(78) studies in other parts of the world generated a wealth of knowledge in the area.
The FHS identified high cholesterol, high blood pressure, smoking, obesity and diabetes as “risk factors” of cardiovascular diseases. The term “risk factors” was also coined for the first time in this study referring to cardiovascular diseases. It was thus learnt that the risk factors of cardio-vascular diseases could be modified.
The PHS has also served as an important avenue for evaluation of risk factors for cardiovascular disease and cancer. The role of aspirin, beta-carotene, vitamin E, vitamin C, and a multivitamin in the primary prevention of cardiovascular disease and cancer have been evaluated in the PHS.
The MONICA project(77) was initiated in the early 1980s in many centres around the world to monitor trends in CVD, and to relate these to risk factor changes in the population over a ten-year period. There were a total of 32 MONICA Collaborating Centres in 21 countries, monitoring over ten million men and women aged 25–64 years.
A number of population-based interventions were also implemented in high-income countries in the 1970s and 1980s in order to reduce risk factors for chronic diseases. One of the earliest and most commonly cited interventions was the North Karelia project, which began in Finland in 1972(76). The interventions included health education, screening, a hypertension control pro-gramme, and treatment. Significant reduction in the risk factors and decline in mortality due to coronary heart disease were demonstrated as a result of these interventions(76).
Another community intervention programme for the prevention of CVD was designed and implemented in the Västerbotten Province of Sweden, drawing experiences from the North Karelia project in Finland. The Västerbotten Intervention Program (VIP) was a long term CVD prevention program started in 1985 in Sweden(68).
One unique emphasis of the VIP was to combine a population strategy with efforts to identify high-risk individuals. The VIP carried out a systematic risk factor screening and counselling at the same time as the community intervention program that aimed to raise public awareness. It
BaCkgroUnD rEviEw
12
compared risk factor changes in individuals exposed to health provider surveys and population based activities against those exposed to population based activates alone. Thus, the VIP concluded that a long-term community based CVD prevention programme that combines population and individual strategies can substantially promote a health shift in CVD risk in a high risk rural population(68).
More recently, the INTERHEART study enrolled hospitalised patients and matched popula-tion controls to determine the associations between a wide array of risk factors and AMI, and to assess the relative importance of these risk factors across populations from different ethnic and/or geographic origins. The INTERHEART was a standardized case-control study of 15 152 cases of first AMI and 14820 age-matched and sex-matched controls who were recruited from 262 centres in 52 countries in Asia, Europe, Middle East Crescent, Africa, Australia, North and South America(4,5).
The INTERHEART study established that the mean age for the first presentation of AMI was 8–10 years lower in men than women worldwide and 10 years younger in Africa, the Mid-dle East, and South Asia compared with other regions of the world(5). It has also demonstrated that just a few risk factors account for most of the AMI in populations(4,5), which was against the conventional wisdom that taken together, the known risk factors would explain only about 50% of the cases of heart disease.
The STEPS ApproachIt is worth noting that most of the population-based studies cited above were conducted in USA, Europe, and Latin America. There were no similar efforts involving Africa or Asia until recently, when the WHO initiated the STEPwise approach to surveillance of chronic disease risk factors (STEPS). The STEPS is intended to help generate surveillance data in low- and middle-income countries(67,79).
The STEPS approach is built on the understanding that the key to controlling the global epidemics of chronic diseases is primary prevention based on comprehensive population-wide programmes. The basis of chronic diseases prevention is the identification of the major common risk factors and their prevention and control(67).
Access to reliable and timely information on morbidity, mortality, risk factors, and their socioeconomic determinants is a necessary prerequisite for effective planning, implementation, and evaluation of NCD prevention programmes(80). The limited scope of most demographic and health statistics makes it difficult to assess the incidence or prevalence of diseases in most of SSA. In developing countries, surveillance of chronic disease risk factors offers a practical and strategic alternative to disease surveillance. Evaluation of the impact of prevention and control strategies requires monitoring of CVD changes; the most-cost effective method is by proxy through surveys of well-defined cardiovascular risk factors. Risk factor surveillance data are required to highlight the need for action, to inform policy and to monitor the progress of prevention programmes(67).
•
13
BaCkgroUnD rEviEw
Theoretical Framework
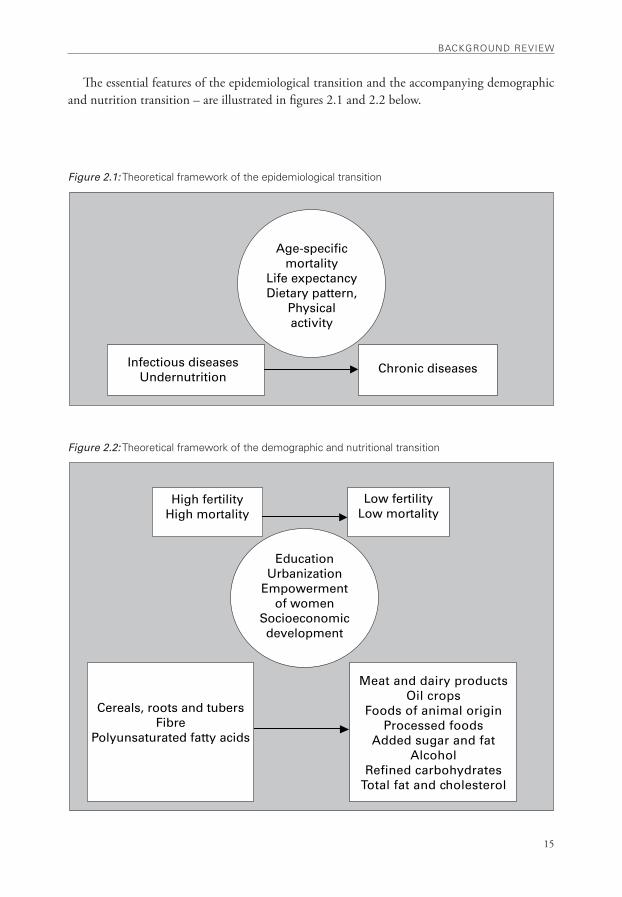
Epidemiological TransitionThe health and environmental conditions in developing countries are gradually changing. En-vironmental exposure to infectious diseases (poor water and food quality, unhygienic sanitation practices) is being superseded by increased exposure to risk factors for chronic diseases, such as unhealthy dietary and lifestyle behaviours(14).
Following a decline in infant and child mortality, and an increase in life expectancy in develop-ing countries, the major causes of death and disability shift from communicable, maternal and perinatal causes to chronic, non-communicable diseases. The overall health status increasingly reflects the diseases and health problems of adults rather than of children. This shift in demographic and disease profiles, often referred to as the epidemiological transition, is currently underway in most developing countries(14).
The transition occurs at different paces in different places, with different patterns and deter-minants across populations. Thus, theories of epidemiologic transition have outlined different modes to distinguish the pattern in different settings. These are the Classical or Western Model, the Accelerated Transition Model, and the Contemporary or Delayed Model(81).
The classical transition is represented by England and Wales where a steady decline of infectious diseases (including tuberculosis and diarrhoea) and a moderate increase in cancer and cardiovas-cular diseases was observed before 1920. In contrast, the shift from infectious to degenerative disease predominance was accelerated in Japan where it took place in only a few decades. In currently developing countries, on the other hand, the transition from infectious to degenerative disease is still underway(81).
The pace of socioeconomic and demographic transition is also variable across developing coun-tries, with some experiencing a much rapid transition than others. The most recent advances in health care, information and communication technology (ICT), and the rapid globalization might result in a wide polarization of socioeconomic and health states between and within developing countries. The effect of medical care (imported medical technology) is said to be more direct and salient in developing countries that are still undergoing the transition, while in general, the transition in the now developed countries has been largely socially determined(81).
The shift in disease patterns and principal causes of mortality are characterized by gradual displacement of pandemics by degenerative and man-made diseases. Three major successive stages of the epidemiologic transition have been outlined by Omran: a) the age of pestilence and famine, when mortality is high and fluctuating, thus precluding sustained population growth; b) the age of receding pandemics, when mortality declines progressively; and the rate of decline accelerates as epidemic peaks become less frequent or disappear; c) the age of degenerative and man-made diseases, when mortality continues to decline and eventually approaches stability at a relatively low level(81).
Abdel Omran’s theory of the epidemiological transition(81) is considered as one of the ground-breaking contributions to public health. However, critics(82) challenge some of the basic assump-tions and propositions of the theory.
Omran proposed that the shifts in health and disease patterns, that characterize the epide-miologic transition, are largely due to socioeconomic factors and modernization. He ascribed

BaCkgroUnD rEviEw
14
the “19th-century Western mortality decline”, the long-term shift that occurred in mortality and disease patterns, to ecobiological and socioeconomic factors and argued that the ‘‘the influence of medical factors was largely inadvertent’’. Critics, on the other hand, argue that Omran’s proposi-tions undermine the specific contributions made by public health interventions and especially by breakthroughs in medical science.
According to Caldwell, Omran’s conclusions on the shift in mortality and disease patterns were largely drawn from the mortality statistics of Sweden and England and Wales, where much (66%) of the decline in mortality between 1800 and 1971 in England and Wales and 54% in Sweden, can probably be attributed to the reduction in infectious diseases. He argues that the major portion of mortality decline occurred during the period when advances were made in the treatment of water, the provision of sanitary services, the removal of waste, and the enforce-ment of laws against overcrowding. During the same period antiseptics began to be used, and pasteurization has been introduced, in the form of home boiling of milk for babies, towards the end of the century. Although doctors had only limited curative powers, they appear to have given leadership in improving hygiene, midwifery training and childcare(82).
Demographic transitionDemographic transition represents the shift from high mortality and fertility towards low mortality and fertility rates that accompanies a process of overall modernization resulting from industrialization, urbanization, education, empowerment of women, as well as substantial overall socio-economic development. Such a shift leads initially to a drop in mortality through progress in hygiene and medicine and, subsequently, to a decline in fertility occasioned by economic growth. The demographic transition stats that that mortality decline, is a precondition for fertility decline, a concept that is widely criticized by many writers(83).
Africa has experienced a mortality decline sustained for more than half a century, which ac-companied socioeconomic development, advances in medical care, improvements in hygiene and reduction of infant mortality. However, fertility has not decreased significantly in most African countries. The high rate of population growth observed in Africa is, therefore, the result of a con-tinuing decline in mortality and relatively high fertility. In the absence of a significant decline in fertility, Africa is the last region of the world to have embarked on demographic transition(83).
Although the theory of demographic transition has experienced a great deal of critical analysis, it remains a useful framework for discussing the dynamics of fertility and mortality changes(83).
Nutrition transitionA diet high in total fat, cholesterol, sugar and other refined carbohydrates, and low in polyun-saturated fatty acids and fibre, and often accompanied by an increasingly sedentary life, which characterize the nutrition transition, result in increased prevalence of obesity and contribute to the epidemiological transition(84).
The nutrition transition is marked by a shift away from relatively monotonous diets of vary-ing nutritional quality toward an industrialized diet that is usually more varied, includes more preprocessed food, more food of animal origin, more added sugar and fat, and often more al-cohol. This is accompanied by shift in the structure of occupations and leisure toward reduced physical activity(84).
•
15
BaCkgroUnD rEviEw
Infectious diseasesUndernutrition
Age-specificmortality
Life expectancyDietary pattern,
Physicalactivity
Chronic diseases
High fertilityHigh mortality
Low fertilityLow mortality
Meat and dairy productsOil crops
Foods of animal originProcessed foods
Added sugar and fatAlcohol
Refined carbohydratesTotal fat and cholesterol
EducationUrbanization
Empowermentof women
Socioeconomicdevelopment
Cereals, roots and tubersFibre
Polyunsaturated fatty acids
The essential features of the epidemiological transition and the accompanying demographic and nutrition transition – are illustrated in figures 2.1 and 2.2 below.
Figure 2.1: Theoretical framework of the epidemiological transition
Figure 2.2: Theoretical framework of the demographic and nutritional transition

16
•
17
oBjECTivES
3. Objectives
General ObjectiveTo illustrate and analyse the epidemiology of cardiovascular disease risk factors in Ethiopia across the gradient of urbanization.
Specific ObjectivesTo determine the distribution of blood pressure among adult populations in a background of chronic energy deficiency (undernutrition)... (Papers I, II).
To examine the validity of questionnaire-based assessment of dietary energy intake and level of physical activity in a population setting... (Paper II).
To determine and compare the prevalence of cardiovascular disease risk factors across rural and urban populations of Ethiopia... (Papers I, III, IV).

18
•
19
METHoDS
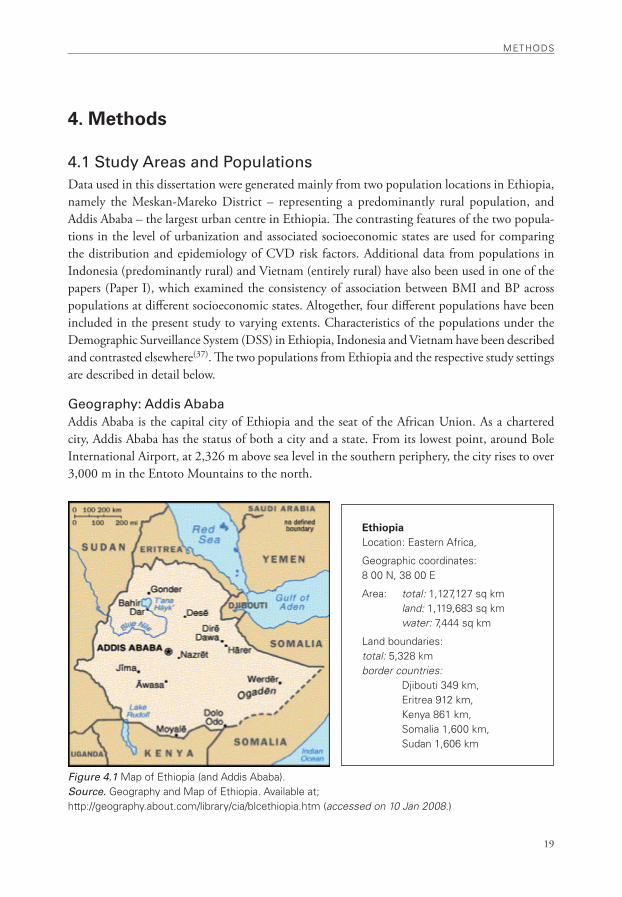
EthiopiaLocation: Eastern africa,
geographic coordinates: 8 00 n, 38 00 E
area: total: 1,127,127 sq km land: 1,119,683 sq km water: 7,444 sq km
Land boundaries: total: 5,328 km border countries: Djibouti 349 km, Eritrea 912 km, kenya 861 km, Somalia 1,600 km, Sudan 1,606 km
4. Methods
4.1 Study Areas and Populations Data used in this dissertation were generated mainly from two population locations in Ethiopia, namely the Meskan-Mareko District – representing a predominantly rural population, and Addis Ababa – the largest urban centre in Ethiopia. The contrasting features of the two popula-tions in the level of urbanization and associated socioeconomic states are used for comparing the distribution and epidemiology of CVD risk factors. Additional data from populations in Indonesia (predominantly rural) and Vietnam (entirely rural) have also been used in one of the papers (Paper I), which examined the consistency of association between BMI and BP across populations at different socioeconomic states. Altogether, four different populations have been included in the present study to varying extents. Characteristics of the populations under the Demographic Surveillance System (DSS) in Ethiopia, Indonesia and Vietnam have been described and contrasted elsewhere(37). The two populations from Ethiopia and the respective study settings are described in detail below.
Geography: Addis AbabaAddis Ababa is the capital city of Ethiopia and the seat of the African Union. As a chartered city, Addis Ababa has the status of both a city and a state. From its lowest point, around Bole International Airport, at 2,326 m above sea level in the southern periphery, the city rises to over 3,000 m in the Entoto Mountains to the north.
Figure 4.1 Map of Ethiopia (and addis ababa).Source. geography and Map of Ethiopia. available at; http://geography.about.com/library/cia/blcethiopia.htm (accessed on 10 Jan 2008.)
METHoDS
20
Based on figures from the Central Statistical Agency of Ethiopia(85) published in 2006, Ad-dis Ababa has an estimated total population of 3,059,000, consisting of 1,469,001 men and 1,589,999 women. The CSA states that presently there are no rural parts to the city, so 100% of the inhabitants are considered urban dwellers. Addis Ababa hosts over 25% of all urban dwell-ers in Ethiopia. With an estimated area of 530 km2, the city has an estimated density of 5,770 people km-2 (85).
Population Characteristics: Addis AbabaThese estimates are based on the 1994 census, in which the population of Addis Ababa was reported to be 2.3 million of which about 1.2% lived in the rural parts of the city.
A large number of ethnic groups are represented in Addis Ababa due to its position as capital of the country. The major ethnic groups, however, are the Amhara (48.3%), Oromo (19.2%), Guraghe (17.5%), and Tigray (7.6%), while others constitute 7.4% of the population. About 82% of the population are Orthodox Christians, 12.7% Muslims, 3.9% Protestants, 0.8% Catholics, and 0.6% followers of other religions(85).
Economic activities in Addis Ababa are diverse. According to an official statistics from the Federal Government of Ethiopia(85), trade and commerce, and manufacturing and industry employ about 23% and 22% of the working force, respectively. Homemakers of different types (15.3%) and transport and communication (13.5%) are the next most numerous categories of employment. The city dwellers also participate in animal husbandry and cultivation of gardens. Currently 677 hectares of land is irrigated annually, on which 129,880 quintals of vegetables are cultivated.
Health Services: Addis AbabaAddis Ababa has a disproportionately high concentration of health facilities and health workers in the country. Health services are provided by various levels of facilities, including government owned (run by the city administration health bureau or the federal government), private clinics and hospitals, as well as different levels of health facilities operated by non-governmental organiza-tions. Likewise, the city has the best health indicators by the country’s standard. The total fertility rate (1.4 child per woman), infant mortality rate (45 per 1000 live births), and child mortality rate (28 per 1000) are all the lowest in the whole country, and on the other hand, life expectancy at birth is highest at 60.3 years for males and 64.1 years for females(86).
Geography: Meskan-Mareko District (Butajira) The Meskan-Mareko District is located in Guraghe Zone of the Southern Nations, Nationalities and Peoples Regional Government (SNNPRG), central Ethiopia (Figure 4.1). Butajira town, the district capital, is 130 km south of Addis Ababa. The area of the district is 797 km2. The topography ranges between dry lowlands at altitudes around 1,500 m (tropical climate) to cool mountainous areas up to 3,500 m above mean sea level (temperate climate). Daytime temperatures are typically between 20–30 degrees Celsius, with nighttime temperatures falling close to freezing at higher altitudes. The lowland areas are drought prone and have been frequently affected during the main droughts in the country(87,88).
•
21
METHoDS
Population Characteristics: Meskan-Mareko District (Butajira)In 1984, the Meskan-Mareko District population was 182,000(89). Based on the 1994 national census, population of the Meskan-Mareko District was projected to be 257,000 in 1999 and 341,698 in 2007, which corresponds to an annual growth rate of 3.8%(84,90). The total area of the district is 872.5 km2 and the corresponding population density is 391.6 persons km-2.
Five clans, namely Meskan, Mareko, Sodo, Siliti and Dobi – collectively known as the Gur-aghe – make up the predominant ethnic group in the district. The different clans speak different dialects of Guragigna with marked commonalities. Amharic, the national language, is widely spoken in the area, particularly by the younger age group. Two-thirds of the population are fol-lowers of Islam, and about one quarter are Orthodox Christians.
About 77% of the population have not attended any formal education, and are unable to read or write. Illiteracy is widely prevalent among the rural population and females.
Most houses in rural areas are round huts built with wood and mud, with thatched roofs. About 84% of the district population lives in rural areas, while the remainder lives in the small town of Butajira. In the town, housing is typically dense and crowded, usually with roofs made of corrugated iron sheets. The main water sources in rural areas are rivers and unprotected wells, while most of the town population uses tap water. Coverage with safe waste disposal facilities is extremely low(87,88).
The former all-weather gravel road connecting Butajira town to the capital, Addis Ababa, has recently been upgraded into an asphalt road. The rural villages in the district are connected to the town by dry-weather roads. The town has 24-hour electricity and telephone services(87,88).
Health Services: Meskan-Mareko District (Butajira)Health services are provided by two hospitals, one health centre, and a few health posts. For many years, the government-run health centre was the main source of health services in the district, with the next higher level of referral being 100 km away. Recently, however, a district hospital was built in the town through collaborative efforts of the public, the regional government and local NGOs. This district hospital has been functional since 2001, and it is managed within the local government health system. Another non-governmental hospital has also been built in one of the rural villages about 10 km from Butajira town, which became operational in 2002. The hospital is operated by an NGO under a fee-for-service scheme.
A growing number of private clinics and dispensaries are also operating in the district.Health problems have predominantly been associated with infectious diseases and malnutrition,
often exacerbated by the recurrent drought and poor access to health services in the rural areas.
The Butajira Rural Health Programme (BRHP)Since 1987, a demographic surveillance system (DSS) has been in place in Meskan-Mareko District. The DSS covers a sample of the district population in nine rural and one urban kebe-les (smallest administrative unit). The ten communities were initially selected from the entire district using a probability- proportionate-to-size (PPS) sampling technique. The population under continuous demographic surveillance grew from 28,616 in 1987 to 37,323 in 1997, at an annual rate of 2.7%. In 2007 the population under surveillance is estimated to exceed 48,000. In the present study, the Butajira DSS setting and its database have been used for the design and conduct of data collection in the district(87,88).
METHoDS
22
The Butajira town population grew from about 13,000 in 1984 to 25,000 by 1999, implying an annual growth rate of 5-6%. The population structure shows a typical developing country pattern, outweighed by younger age groups. The proportion of children under 14 years was 46% and that of people 65 years and older was 1.3%(89,90).
The organization and methodological background of the Butajira Rural Health Programme have been described in detail elsewhere(87,88).
Figure 4.2 Butajira Demographic Surveillance System (DSS) Site in Ethiopia.
Source: ref 87.
During the first ten years of demographic surveillance (1987-1997), the structure of the popula-tion pyramid demonstrated a typical developing country pattern with 4.3% of person-time in the first year of life, 14.4% in the next four years, 29.9% in the 5-14 age group, 48.6% in the 15-64 age group and only 2.8% in the over 65 years group. The age dependency ratio was 106%, and the male-to-female ratio was 0.94(87,88).
During the same period, under-five mortality varied markedly between 80 per 1,000 person-years in urban areas and 219 per 1,000 person-years in rural lowlands. The life expectancy at birth was estimated to be 50.8 years, varying between 49.3 years for males and 52.3 years for females(87,88).
4.2 Study design and samplingA cross-sectional, community based survey design was employed in all the study sites to generate data on the various CVD risk factors. In Paper II cross-sectional comparison was made between two survey instruments. Cluster sampling methods were employed for selecting study participants as it offers better feasibility than would be possible in simple random sampling techniques in large population settings. In the three DSS settings, the respective databases provided a randomly selected set of households that served as a starting point at each of the clusters. In the Addis population, multi-stage sampling strategies were involved in the selection of clusters from the 99 kebeles in the city. Thus, ten kebeles were selected at random which were further subdivided into smaller sub-units (clusters) that were then subjected to another stage of random selection. Within each cluster, subsequent households were visited until the required number of eligible individuals was enrolled (Figure 4.3).
•
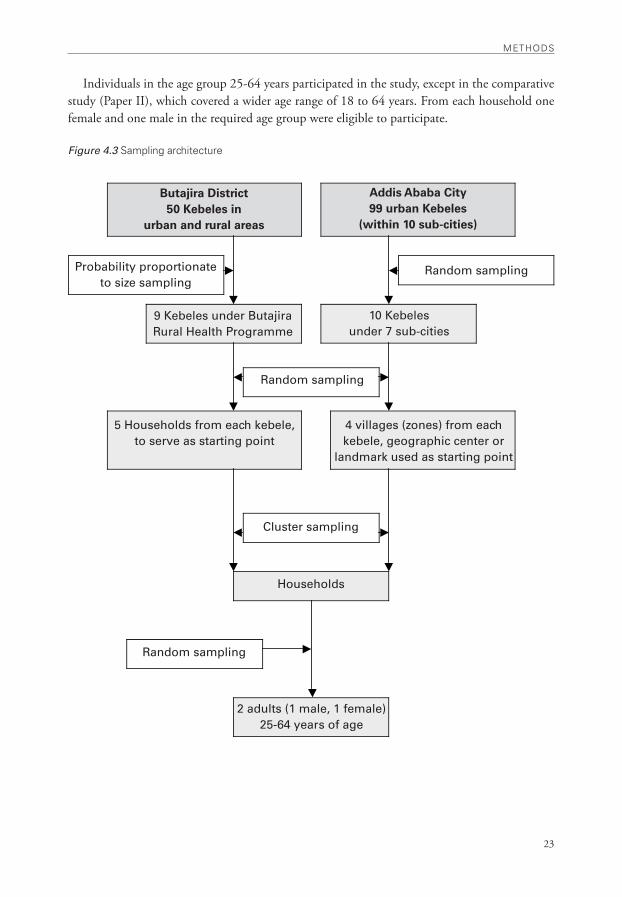
23
METHoDS
Butajira District50 Kebeles in
urban and rural areas
Addis Ababa City99 urban Kebeles
(within 10 sub-cities)
Probability proportionate to size sampling
Random sampling
9 Kebeles under Butajira Rural Health Programme
10 Kebeles under 7 sub-cities
Random sampling
5 Households from each kebele, to serve as starting point
4 villages (zones) from each kebele, geographic center or
landmark used as starting point
Cluster sampling
Households
Random sampling
2 adults (1 male, 1 female)25-64 years of age
Individuals in the age group 25-64 years participated in the study, except in the comparative study (Paper II), which covered a wider age range of 18 to 64 years. From each household one female and one male in the required age group were eligible to participate.
Figure 4.3 Sampling architecture
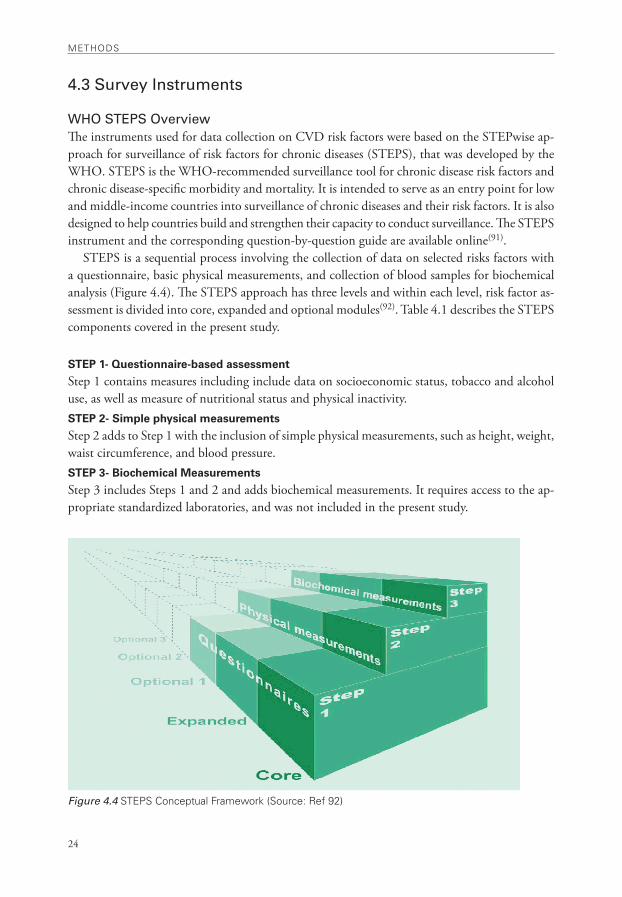
METHoDS
24
4.3 Survey Instruments
WHO STEPS Overview The instruments used for data collection on CVD risk factors were based on the STEPwise ap-proach for surveillance of risk factors for chronic diseases (STEPS), that was developed by the WHO. STEPS is the WHO-recommended surveillance tool for chronic disease risk factors and chronic disease-specific morbidity and mortality. It is intended to serve as an entry point for low and middle-income countries into surveillance of chronic diseases and their risk factors. It is also designed to help countries build and strengthen their capacity to conduct surveillance. The STEPS instrument and the corresponding question-by-question guide are available online(91).
STEPS is a sequential process involving the collection of data on selected risks factors with a questionnaire, basic physical measurements, and collection of blood samples for biochemical analysis (Figure 4.4). The STEPS approach has three levels and within each level, risk factor as-sessment is divided into core, expanded and optional modules(92). Table 4.1 describes the STEPS components covered in the present study.
STEP 1- Questionnaire-based assessment
Step 1 contains measures including include data on socioeconomic status, tobacco and alcohol use, as well as measure of nutritional status and physical inactivity. STEP 2- Simple physical measurements
Step 2 adds to Step 1 with the inclusion of simple physical measurements, such as height, weight, waist circumference, and blood pressure. STEP 3- Biochemical Measurements
Step 3 includes Steps 1 and 2 and adds biochemical measurements. It requires access to the ap-propriate standardized laboratories, and was not included in the present study.
Figure 4.4 STEPS Conceptual Framework (Source: ref 92)
•
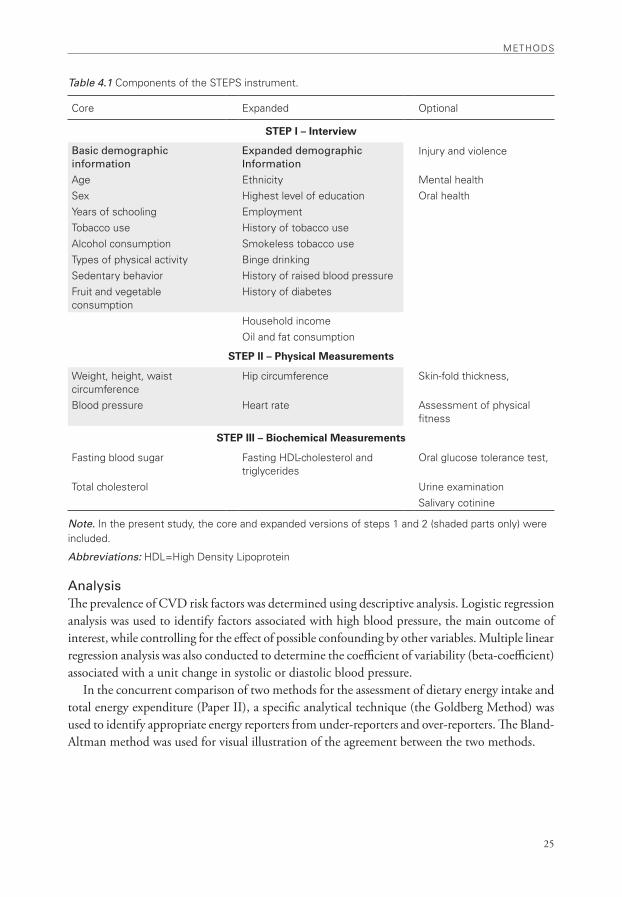
25
METHoDS
Table 4.1 Components of the STEPS instrument.
Core Expanded optional
STEP I – Interview
Basic demographic information
Expanded demographic Information
injury and violence
age Ethnicity Mental healthSex Highest level of education oral healthYears of schooling EmploymentTobacco use History of tobacco usealcohol consumption Smokeless tobacco useTypes of physical activity Binge drinkingSedentary behavior History of raised blood pressureFruit and vegetable consumption
History of diabetes
Household incomeoil and fat consumption
STEP II – Physical Measurements
weight, height, waist circumference
Hip circumference Skin-fold thickness,
Blood pressure Heart rate assessment of physical fitness
STEP III – Biochemical Measurements
Fasting blood sugar Fasting HDL-cholesterol and triglycerides
oral glucose tolerance test,
Total cholesterol Urine examination Salivary cotinine
Note. in the present study, the core and expanded versions of steps 1 and 2 (shaded parts only) were included.
Abbreviations: HDL=High Density Lipoprotein
AnalysisThe prevalence of CVD risk factors was determined using descriptive analysis. Logistic regression analysis was used to identify factors associated with high blood pressure, the main outcome of interest, while controlling for the effect of possible confounding by other variables. Multiple linear regression analysis was also conducted to determine the coefficient of variability (beta-coefficient) associated with a unit change in systolic or diastolic blood pressure.
In the concurrent comparison of two methods for the assessment of dietary energy intake and total energy expenditure (Paper II), a specific analytical technique (the Goldberg Method) was used to identify appropriate energy reporters from under-reporters and over-reporters. The Bland-Altman method was used for visual illustration of the agreement between the two methods.

26
•

27
rESULTS
5. RESULTSIn this section, main findings from the four papers are outlined (Table 5.1) and reviewed. Fur-thermore, data generated from the study populations in Butajira and Addis Ababa are combined and analyzed in order to explore socio-demographic differentials of the distribution of CVD risk factors, focusing on the urban-rural divide.
Table 5.1 Summary of Findings
Paper Objectives/ Research Question Main Findings
I Could hypertension occur in lean popula-tions in developing countries?
Hypertension constitutes an important health problem in low and middle-income countries, in a background of under-nutrition and poverty.
is BMi associated with blood pressure the same way in all populations?
BMi is a significant determinant of blood pres-sure, mainly in urban populations, in countries at varying stages of socioeconomic development and epidemiologic transition.
II Can we measure dietary energy intake and total expenditure in population set-tings using questionnaires?
Dietary energy intake and total energy ex-penditure can be estimated adequately through population-based surveys using questionnaires.
Could the measurement of dietary ener-gy intake and expenditure using question-naires give comparable estimates?
Parallel measurement of dietary energy intake and total energy expenditure using a question-naire yields comparable estimates, and could be used for cross-validation.
III what is the extent of behavioural risk factors of CvD in the urban population of Ethiopia?
Cigarette smoking, khat chewing and binge drink-ing are widely prevalent among males in urban populations in Ethiopia.
are cigarette smoking and khat chewing associated with elevated blood pressure?
Current daily smoking and regular khat chew-ing are associated with elevated blood pressure among males. khat chewing may constitute an emerging risk factor for CvD in males.
IV what is the magnitude of intermediate risk factors of CvD in the urban popula-tion of Ethiopia?
High blood pressure, overweight/obesity, and physical inactivity are widely prevalent among adults in urban Ethiopia.
what is the predominant or primary risk factor of CvD in Ethiopia?
Elevated blood pressure constitutes the funda-mental risk factor for CvD in the urban population of Ethiopia. inadequate intake of fruit/vegetables is universal in Ethiopia.
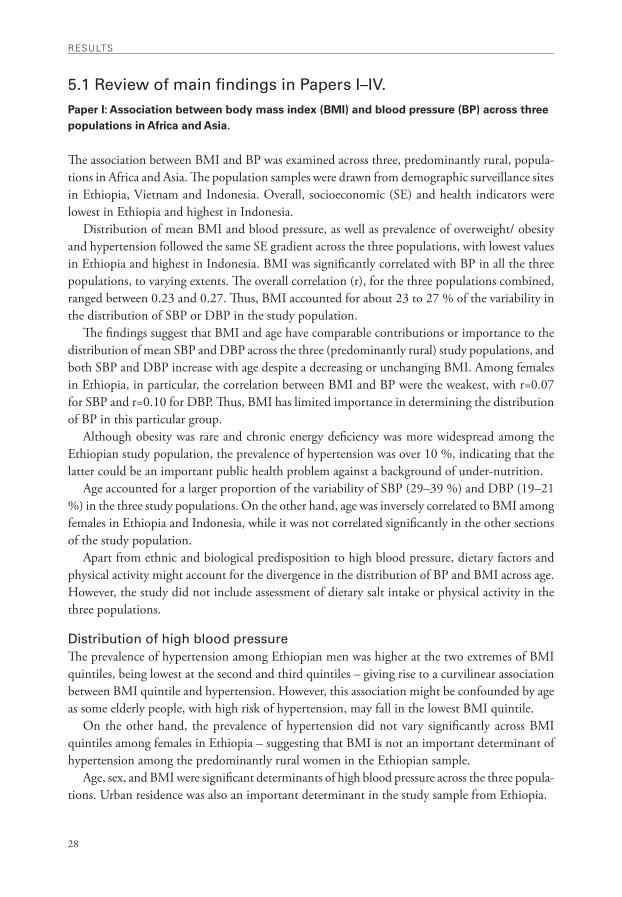
rESULTS
28
5.1 Review of main findings in Papers I–IV.Paper I: Association between body mass index (BMI) and blood pressure (BP) across three populations in Africa and Asia.
The association between BMI and BP was examined across three, predominantly rural, popula-tions in Africa and Asia. The population samples were drawn from demographic surveillance sites in Ethiopia, Vietnam and Indonesia. Overall, socioeconomic (SE) and health indicators were lowest in Ethiopia and highest in Indonesia.
Distribution of mean BMI and blood pressure, as well as prevalence of overweight/ obesity and hypertension followed the same SE gradient across the three populations, with lowest values in Ethiopia and highest in Indonesia. BMI was significantly correlated with BP in all the three populations, to varying extents. The overall correlation (r), for the three populations combined, ranged between 0.23 and 0.27. Thus, BMI accounted for about 23 to 27 % of the variability in the distribution of SBP or DBP in the study population.
The findings suggest that BMI and age have comparable contributions or importance to the distribution of mean SBP and DBP across the three (predominantly rural) study populations, and both SBP and DBP increase with age despite a decreasing or unchanging BMI. Among females in Ethiopia, in particular, the correlation between BMI and BP were the weakest, with r=0.07 for SBP and r=0.10 for DBP. Thus, BMI has limited importance in determining the distribution of BP in this particular group.
Although obesity was rare and chronic energy deficiency was more widespread among the Ethiopian study population, the prevalence of hypertension was over 10 %, indicating that the latter could be an important public health problem against a background of under-nutrition.
Age accounted for a larger proportion of the variability of SBP (29–39 %) and DBP (19–21 %) in the three study populations. On the other hand, age was inversely correlated to BMI among females in Ethiopia and Indonesia, while it was not correlated significantly in the other sections of the study population.
Apart from ethnic and biological predisposition to high blood pressure, dietary factors and physical activity might account for the divergence in the distribution of BP and BMI across age. However, the study did not include assessment of dietary salt intake or physical activity in the three populations.
Distribution of high blood pressureThe prevalence of hypertension among Ethiopian men was higher at the two extremes of BMI quintiles, being lowest at the second and third quintiles – giving rise to a curvilinear association between BMI quintile and hypertension. However, this association might be confounded by age as some elderly people, with high risk of hypertension, may fall in the lowest BMI quintile.
On the other hand, the prevalence of hypertension did not vary significantly across BMI quintiles among females in Ethiopia – suggesting that BMI is not an important determinant of hypertension among the predominantly rural women in the Ethiopian sample.
Age, sex, and BMI were significant determinants of high blood pressure across the three popula-tions. Urban residence was also an important determinant in the study sample from Ethiopia.
•
29
rESULTS
Determinants of mean SBP and DBP Multiple linear regression analysis of data pooled from the three populations indicated that coun-try of origin, sex, age and BMI were significant determinants of both SBP and DBP. Moreover, urban residence and abdominal circumference were significantly associated with higher DBP. Sex and country of origin accounted for the largest coefficients of variability in SBP and DBP. BMI and age were the next important determinants of the distribution of mean SBP and DBP in the three populations (Table 5.2).
Paper II: Concurrent comparison of energy intake and expenditure
Dietary energy intake (DEI) and total energy expenditure (TEE)A cross sectional comparative study was conducted among 619 adults, 18-64 years of age, to estimate the dietary energy intake (DEI) and total energy expenditure (TEE) levels using a ques-tionnaire, and compare the estimates. The reported DEI was evaluated at the population level by using the mean DEI:TEE ratio, and at the population level using the Goldberg method.
About 57 % of the study participants were identified as acceptable reporters of DEI by apply-ing the Goldberg cut-off points at three levels of physical activity level (PAL). The questionnaire method provided comparable estimates of DEI and TEE among acceptable reporters. Thus, mean (95% CI) DEI was 1944 kcal (1895, 1993), mean TEE was 1963 kcal (1914, 2012), and the corresponding ratio between TEE and DEI was 1.01.
Among the acceptable reporters, males had a mean (sd) DEI of 2126 (456) kcal and mean TEE of 2086 (426) kcal. The corresponding values of mean (sd) DEI and TEE for females were 1841 (442) kcal and 1892 (474) kcal, respectively.
The estimated values of DEI (2126 in males, 1841 in females) are close to the recommended daily energy intake (2100 kcal) in the males but were much lower in the females. Estimates of per capita calorie intake among the general population were 2073 kcal in urban and 2397 in rural populations of Ethiopia during 2005(93). The corresponding estimates for the year 2000 were 1,738 kcal and 2191 kcal(94). Both the daily per capita calorie intake and our estimate of DEI indicate higher intake among the rural populations, in both males and females. However, the corresponding TEE was not significantly different between the two populations.
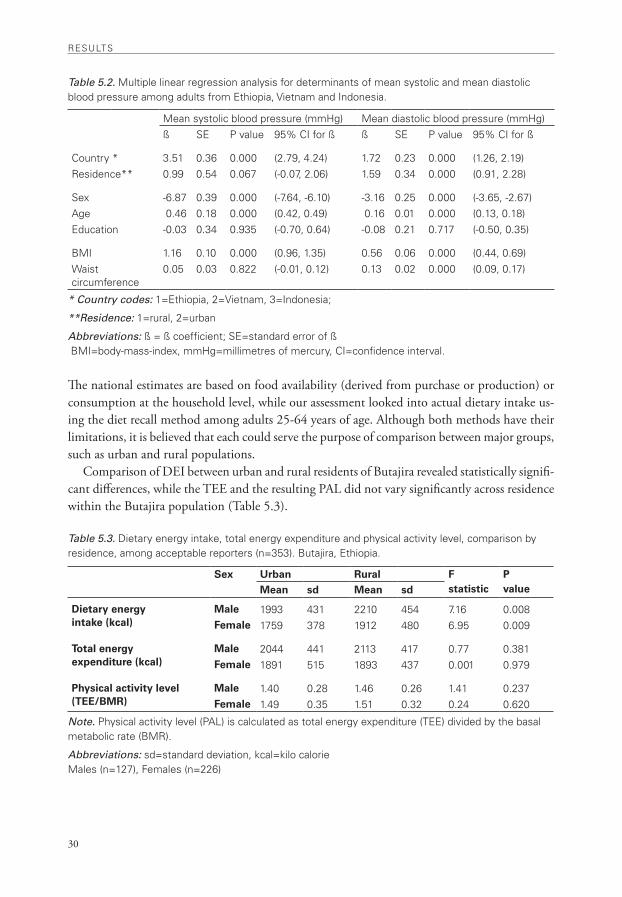
rESULTS
30
Table 5.2. Multiple linear regression analysis for determinants of mean systolic and mean diastolic blood pressure among adults from Ethiopia, vietnam and indonesia.
Mean systolic blood pressure (mmHg) Mean diastolic blood pressure (mmHg)ß SE P value 95% Ci for ß ß SE P value 95% Ci for ß
Country * 3.51 0.36 0.000 (2.79, 4.24) 1.72 0.23 0.000 (1.26, 2.19)residence** 0.99 0.54 0.067 (-0.07, 2.06) 1.59 0.34 0.000 (0.91, 2.28)
Sex -6.87 0.39 0.000 (-7.64, -6.10) -3.16 0.25 0.000 (-3.65, -2.67)age 0.46 0.18 0.000 (0.42, 0.49) 0.16 0.01 0.000 (0.13, 0.18)Education -0.03 0.34 0.935 (-0.70, 0.64) -0.08 0.21 0.717 (-0.50, 0.35)
BMi 1.16 0.10 0.000 (0.96, 1.35) 0.56 0.06 0.000 (0.44, 0.69)waist circumference
0.05 0.03 0.822 (-0.01, 0.12) 0.13 0.02 0.000 (0.09, 0.17)
* Country codes: 1=Ethiopia, 2=vietnam, 3=indonesia;
**Residence: 1=rural, 2=urban
Abbreviations: ß = ß coefficient; SE=standard error of ß BMi=body-mass-index, mmHg=millimetres of mercury, Ci=confidence interval.
The national estimates are based on food availability (derived from purchase or production) or consumption at the household level, while our assessment looked into actual dietary intake us-ing the diet recall method among adults 25-64 years of age. Although both methods have their limitations, it is believed that each could serve the purpose of comparison between major groups, such as urban and rural populations.
Comparison of DEI between urban and rural residents of Butajira revealed statistically signifi-cant differences, while the TEE and the resulting PAL did not vary significantly across residence within the Butajira population (Table 5.3).
Table 5.3. Dietary energy intake, total energy expenditure and physical activity level, comparison by residence, among acceptable reporters (n=353). Butajira, Ethiopia.
Sex Urban Rural Fstatistic
PvalueMean sd Mean sd
Dietary energy intake (kcal)
Male 1993 431 2210 454 7.16 0.008Female 1759 378 1912 480 6.95 0.009
Total energy expenditure (kcal)
Male 2044 441 2113 417 0.77 0.381Female 1891 515 1893 437 0.001 0.979
Physical activity level (TEE/BMR)
Male 1.40 0.28 1.46 0.26 1.41 0.237Female 1.49 0.35 1.51 0.32 0.24 0.620
Note. Physical activity level (PaL) is calculated as total energy expenditure (TEE) divided by the basal metabolic rate (BMr).
Abbreviations: sd=standard deviation, kcal=kilo calorieMales (n=127), Females (n=226)
•
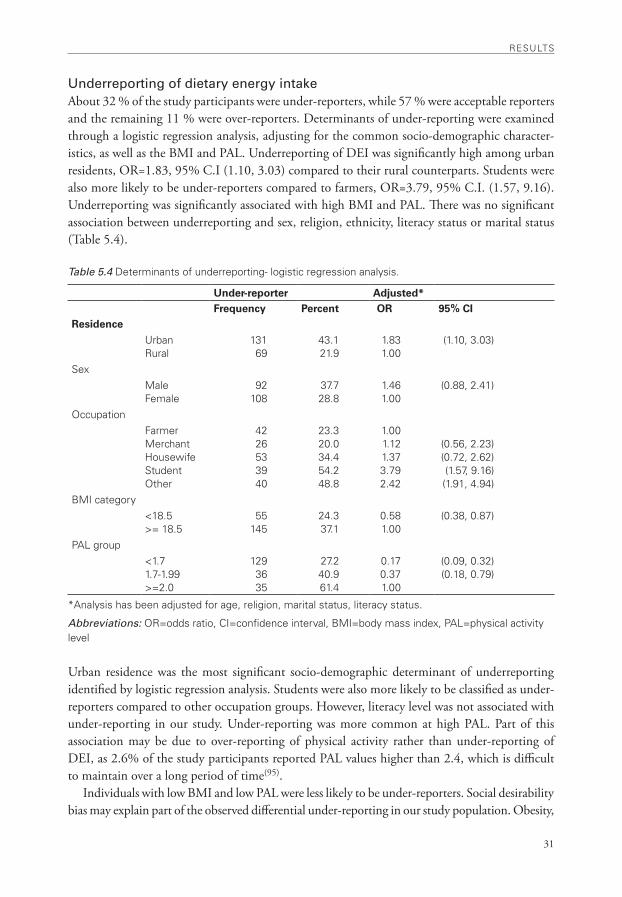
31
rESULTS
Underreporting of dietary energy intakeAbout 32 % of the study participants were under-reporters, while 57 % were acceptable reporters and the remaining 11 % were over-reporters. Determinants of under-reporting were examined through a logistic regression analysis, adjusting for the common socio-demographic character-istics, as well as the BMI and PAL. Underreporting of DEI was significantly high among urban residents, OR=1.83, 95% C.I (1.10, 3.03) compared to their rural counterparts. Students were also more likely to be under-reporters compared to farmers, OR=3.79, 95% C.I. (1.57, 9.16). Underreporting was significantly associated with high BMI and PAL. There was no significant association between underreporting and sex, religion, ethnicity, literacy status or marital status (Table 5.4).
Table 5.4 Determinants of underreporting- logistic regression analysis.
Under-reporter Adjusted* Frequency Percent OR 95% CI
Residence
Urban rural
13169
43.121.9
1.831.00
(1.10, 3.03)
SexMaleFemale
92108
37.728.8
1.461.00
(0.88, 2.41)
occupationFarmerMerchantHousewifeStudentother
4226533940
23.320.034.454.248.8
1.001.121.373.792.42
(0.56, 2.23)(0.72, 2.62)(1.57, 9.16)(1.91, 4.94)
BMi category<18.5>= 18.5
55145
24.337.1
0.581.00
(0.38, 0.87)
PaL group<1.71.7-1.99>=2.0
1293635
27.240.961.4
0.170.371.00
(0.09, 0.32)(0.18, 0.79)
*analysis has been adjusted for age, religion, marital status, literacy status.
Abbreviations: or=odds ratio, Ci=confidence interval, BMi=body mass index, PaL=physical activity level
Urban residence was the most significant socio-demographic determinant of underreporting identified by logistic regression analysis. Students were also more likely to be classified as under-reporters compared to other occupation groups. However, literacy level was not associated with under-reporting in our study. Under-reporting was more common at high PAL. Part of this association may be due to over-reporting of physical activity rather than under-reporting of DEI, as 2.6% of the study participants reported PAL values higher than 2.4, which is difficult to maintain over a long period of time(95).
Individuals with low BMI and low PAL were less likely to be under-reporters. Social desirability bias may explain part of the observed differential under-reporting in our study population. Obesity,
rESULTS
32
weight loss and dieting are not popular concepts among this lean population, and therefore, are less likely to be related to under-reporting. On the contrary, weight gain symbolizes good health, wealth and comfortable living conditions. As such, social desirability bias with regards to weight gain may instead be related to over-reporting rather than under-reporting of dietary energy intake.
In low-income populations, under-reporting of food intake may also be related to food inse-curity such that people associate their reported intake with eligibility for food aid. However, the limited food aid and nutrition rehabilitation interventions that were in place during the study period targeted children in rural parts of the district rather than the urban areas where under-reporting is significantly higher.
Under-reporting of energy intake is a very common behaviour reported in numerous other studies. In a review of 25 adult studies that have examined the characteristics of under-reporters, high BMI was associated with under-reporting in 22 out of 25 studies, the probability of under-reporting increased with increasing BMI of subjects, and a higher proportion of under-reporting was found among women and older subjects(96). Another study that employed a repeated 24-hour recall method among adults in Sweden identified BMI as the main predictor of under-reporting, while old age and smoking also contributed to under-reporting(97).
Findings concerning the effect of education or socioeconomic status on reporting accuracy are inconsistent. Poor literacy might be expected to result in under-reporting, while on the other hand, health or diet consciousness in the better educated or those at higher socioeconomic status might prompt the same response(96).
Papers III and IV: Risk factors of CVD in the urban population of Ethiopia.
The WHO STEPS instrument was employed on a probabilistic sample of 4001 adults in Addis Ababa, the largest urban centre in the country, to determine the magnitude and distribution of selected CVD risk factors. The findings revealed widespread prevalence of various biological, behavioural (reported), and intermediate (measured) risk factors in the study population. The prevalence of high blood pressure (31.0%), overweight (20.5% in males and 37.4% in females), and physical inactivity (17.2% in males and 32 % in females) were of particular concern. Moreo-ver, current daily smoking, regular khat chewing, and binge drinking of alcohol were prevalent among males, and significantly associated with higher mean blood pressure.
Distribution of CVD risk factorsCVD risk factor scores were computed by assigning a score of +1 to each of the following seven variables: current daily smoking, regular khat chewing, binge drinking, obesity (BMI>=30 kg/m²), abdominal obesity (waist-to-hip ratio >1), physical inactivity (sedentary), and high blood pressure (SBP>=140 mmHg or DBP>=90 mmHg or current anti-hypertensive treatment). Inad-equate intake of fruit and vegetables were universal in the study population (100 % prevalence), and were not included while computing CVD risk score as their role in ranking risk scores would be limited.
Overall, 68 % of adults in Addis have one or more of the seven CVD risk factors included in the assessment. The distribution of number of CVD risk factors in males and females is grossly similar (Figure 5.1).
•
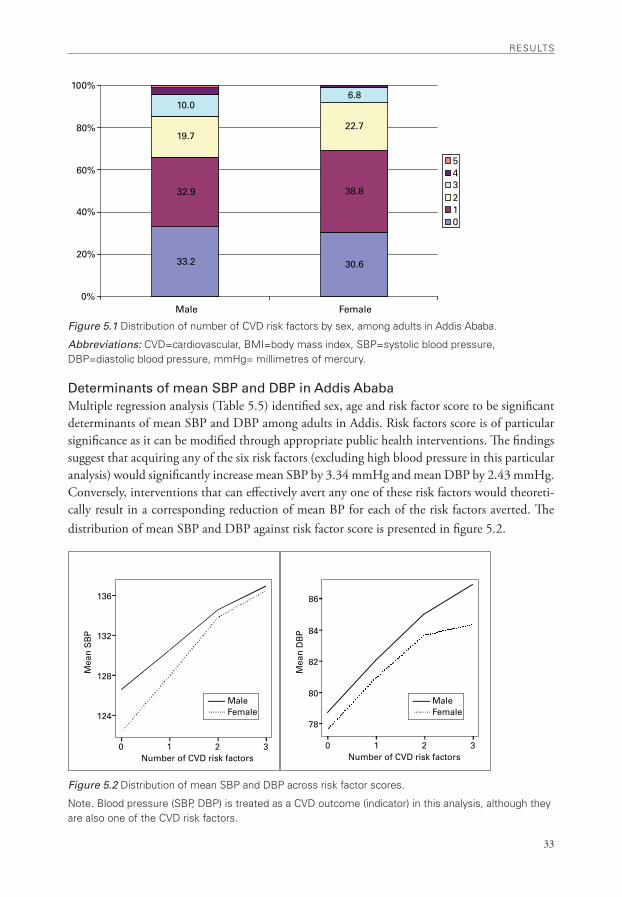
33
rESULTS
33.2 30.6
32.9 38.8
19.722.7
10.06.8
0%
20%
40%
60%
80%
100%
Male Female
543210
MaleFemale
0 1 2 3Number of CVD risk factors
Mea
n S
BP
Mea
n D
BP
124
128
132
136
0 1 2 3Number of CVD risk factors
78
80
82
84
86
MaleFemale
Figure 5.1 Distribution of number of CvD risk factors by sex, among adults in addis ababa.
Abbreviations: CvD=cardiovascular, BMi=body mass index, SBP=systolic blood pressure, DBP=diastolic blood pressure, mmHg= millimetres of mercury.
Determinants of mean SBP and DBP in Addis AbabaMultiple regression analysis (Table 5.5) identified sex, age and risk factor score to be significant determinants of mean SBP and DBP among adults in Addis. Risk factors score is of particular significance as it can be modified through appropriate public health interventions. The findings suggest that acquiring any of the six risk factors (excluding high blood pressure in this particular analysis) would significantly increase mean SBP by 3.34 mmHg and mean DBP by 2.43 mmHg. Conversely, interventions that can effectively avert any one of these risk factors would theoreti-cally result in a corresponding reduction of mean BP for each of the risk factors averted. The distribution of mean SBP and DBP against risk factor score is presented in figure 5.2.
Figure 5.2 Distribution of mean SBP and DBP across risk factor scores.
note. Blood pressure (SBP, DBP) is treated as a CvD outcome (indicator) in this analysis, although they are also one of the CvD risk factors.
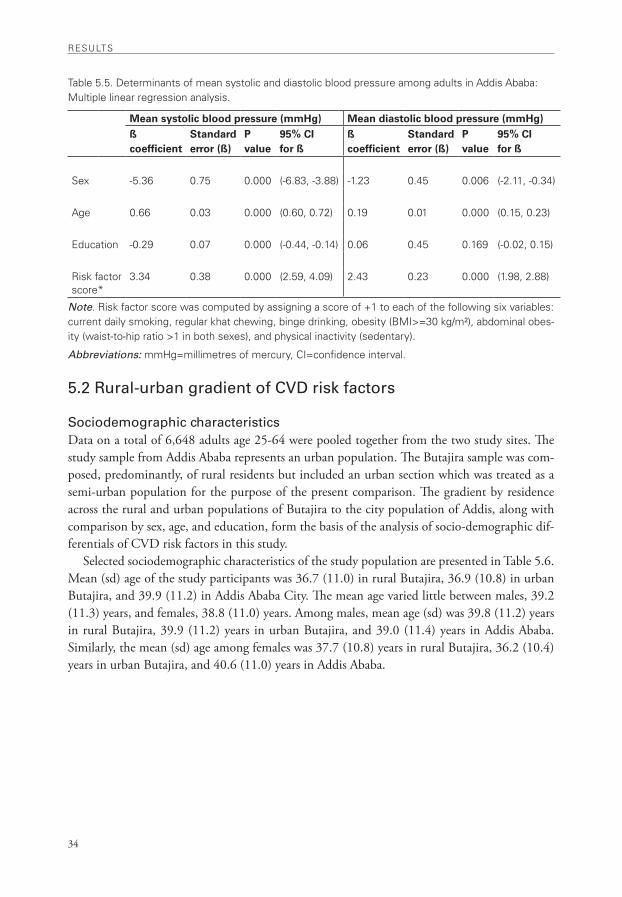
rESULTS
34
Table 5.5. Determinants of mean systolic and diastolic blood pressure among adults in addis ababa: Multiple linear regression analysis.
Mean systolic blood pressure (mmHg) Mean diastolic blood pressure (mmHg)ß coefficient
Standard error (ß)
P value
95% CI for ß
ß coefficient
Standard error (ß)
P value
95% CI for ß
Sex -5.36 0.75 0.000 (-6.83, -3.88) -1.23 0.45 0.006 (-2.11, -0.34)
age 0.66 0.03 0.000 (0.60, 0.72) 0.19 0.01 0.000 (0.15, 0.23)
Education -0.29 0.07 0.000 (-0.44, -0.14) 0.06 0.45 0.169 (-0.02, 0.15)
risk factor score*
3.34 0.38 0.000 (2.59, 4.09) 2.43 0.23 0.000 (1.98, 2.88)
Note. risk factor score was computed by assigning a score of +1 to each of the following six variables: current daily smoking, regular khat chewing, binge drinking, obesity (BMi>=30 kg/m²), abdominal obes-ity (waist-to-hip ratio >1 in both sexes), and physical inactivity (sedentary).
Abbreviations: mmHg=millimetres of mercury, Ci=confidence interval.
5.2 Rural-urban gradient of CVD risk factors
Sociodemographic characteristicsData on a total of 6,648 adults age 25-64 were pooled together from the two study sites. The study sample from Addis Ababa represents an urban population. The Butajira sample was com-posed, predominantly, of rural residents but included an urban section which was treated as a semi-urban population for the purpose of the present comparison. The gradient by residence across the rural and urban populations of Butajira to the city population of Addis, along with comparison by sex, age, and education, form the basis of the analysis of socio-demographic dif-ferentials of CVD risk factors in this study.
Selected sociodemographic characteristics of the study population are presented in Table 5.6. Mean (sd) age of the study participants was 36.7 (11.0) in rural Butajira, 36.9 (10.8) in urban Butajira, and 39.9 (11.2) in Addis Ababa City. The mean age varied little between males, 39.2 (11.3) years, and females, 38.8 (11.0) years. Among males, mean age (sd) was 39.8 (11.2) years in rural Butajira, 39.9 (11.2) years in urban Butajira, and 39.0 (11.4) years in Addis Ababa. Similarly, the mean (sd) age among females was 37.7 (10.8) years in rural Butajira, 36.2 (10.4) years in urban Butajira, and 40.6 (11.0) years in Addis Ababa.
•
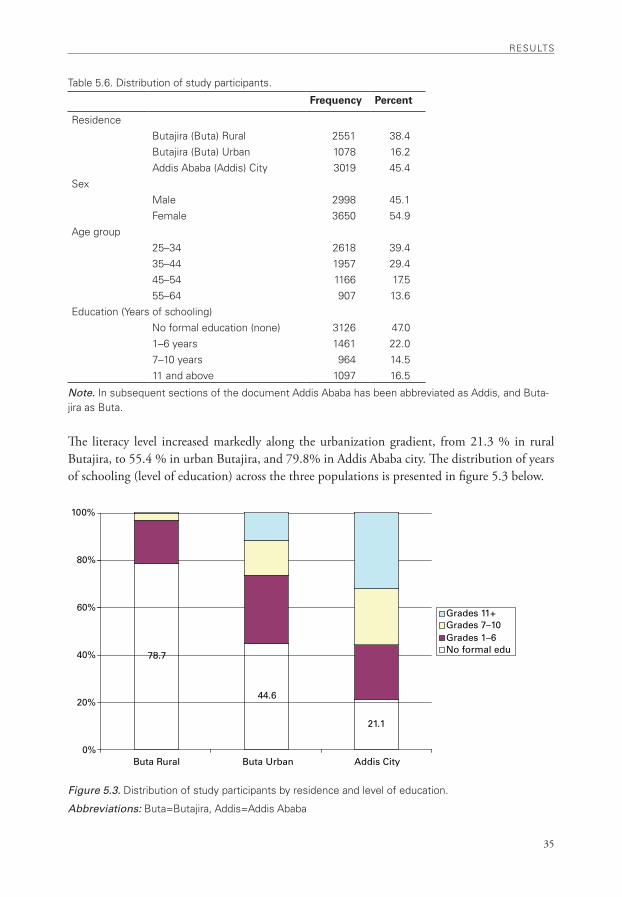
35
rESULTS
78.7
44.6
21.1
0%
20%
40%
60%
80%
100%
Buta Rural Buta Urban Addis City
Grades 11+Grades 7–10Grades 1–6No formal edu
Table 5.6. Distribution of study participants.
Frequency Percent
residenceButajira (Buta) rural 2551 38.4Butajira (Buta) Urban 1078 16.2addis ababa (addis) City 3019 45.4
SexMale 2998 45.1Female 3650 54.9
age group25–34 2618 39.435–44 1957 29.445–54 1166 17.555–64 907 13.6
Education (Years of schooling)no formal education (none) 3126 47.01–6 years 1461 22.07–10 years 964 14.511 and above 1097 16.5
Note. in subsequent sections of the document addis ababa has been abbreviated as addis, and Buta-jira as Buta.
The literacy level increased markedly along the urbanization gradient, from 21.3 % in rural Butajira, to 55.4 % in urban Butajira, and 79.8% in Addis Ababa city. The distribution of years of schooling (level of education) across the three populations is presented in figure 5.3 below.
Figure 5.3. Distribution of study participants by residence and level of education.
Abbreviations: Buta=Butajira, addis=addis ababa
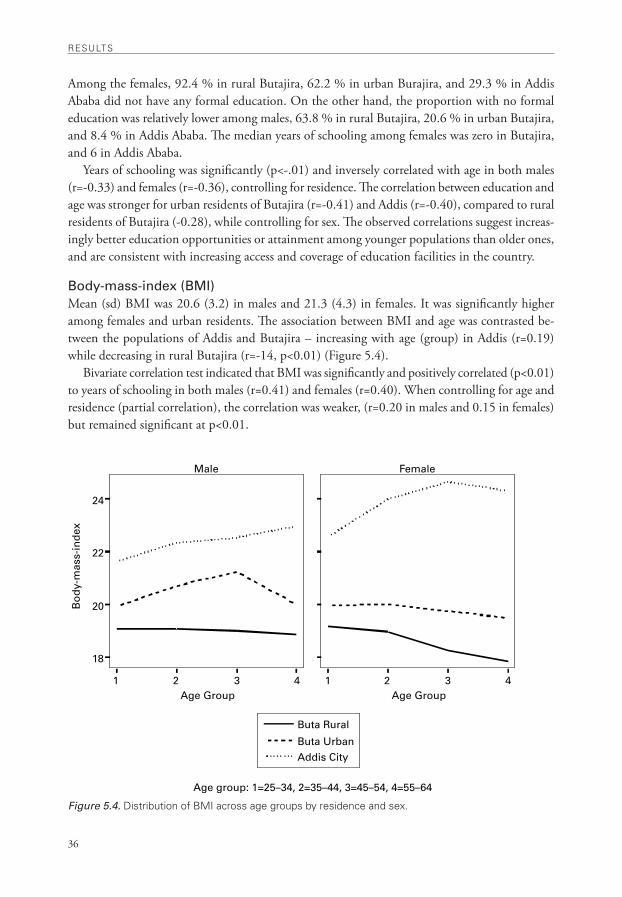
rESULTS
36
Male Female
Buta Rural
Buta UrbanAddis City
Age group: 1=25–34, 2=35–44, 3=45–54, 4=55–64
1 2 3 4Age Group
18
20
22
24
Bo
dy-
mas
s-in
dex
1 2 3 4Age Group
Among the females, 92.4 % in rural Butajira, 62.2 % in urban Burajira, and 29.3 % in Addis Ababa did not have any formal education. On the other hand, the proportion with no formal education was relatively lower among males, 63.8 % in rural Butajira, 20.6 % in urban Butajira, and 8.4 % in Addis Ababa. The median years of schooling among females was zero in Butajira, and 6 in Addis Ababa.
Years of schooling was significantly (p<-.01) and inversely correlated with age in both males (r=-0.33) and females (r=-0.36), controlling for residence. The correlation between education and age was stronger for urban residents of Butajira (r=-0.41) and Addis (r=-0.40), compared to rural residents of Butajira (-0.28), while controlling for sex. The observed correlations suggest increas-ingly better education opportunities or attainment among younger populations than older ones, and are consistent with increasing access and coverage of education facilities in the country.
Body-mass-index (BMI)Mean (sd) BMI was 20.6 (3.2) in males and 21.3 (4.3) in females. It was significantly higher among females and urban residents. The association between BMI and age was contrasted be-tween the populations of Addis and Butajira – increasing with age (group) in Addis (r=0.19) while decreasing in rural Butajira (r=-14, p<0.01) (Figure 5.4).
Bivariate correlation test indicated that BMI was significantly and positively correlated (p<0.01) to years of schooling in both males (r=0.41) and females (r=0.40). When controlling for age and residence (partial correlation), the correlation was weaker, (r=0.20 in males and 0.15 in females) but remained significant at p<0.01.
Figure 5.4. Distribution of BMi across age groups by residence and sex.
•
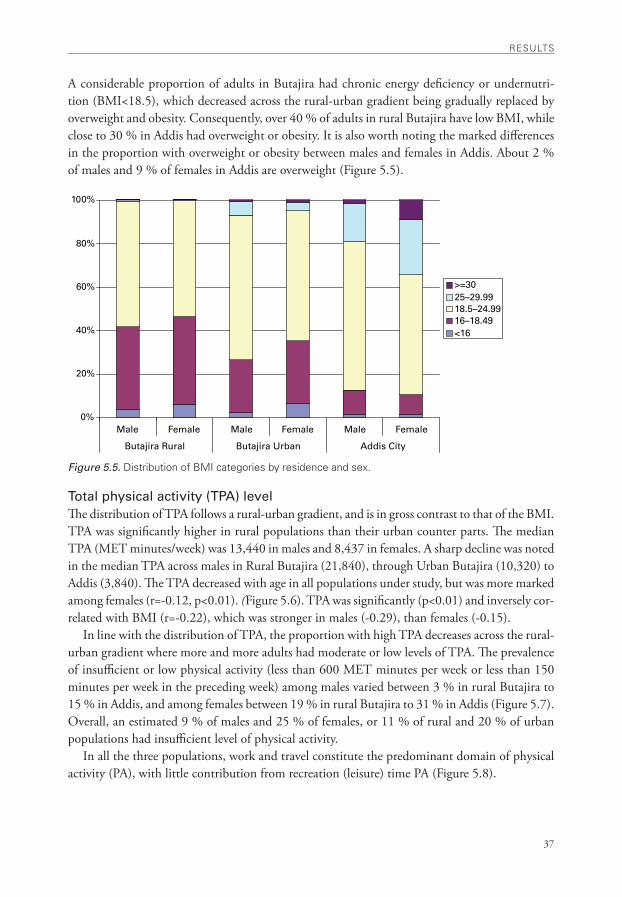
37
rESULTS
0%
20%
40%
60%
80%
100%
Male Female Male Female Male Female
Butajira Rural Butajira Urban Addis City
>=3025–29.9918.5–24.9916–18.49<16
A considerable proportion of adults in Butajira had chronic energy deficiency or undernutri-tion (BMI<18.5), which decreased across the rural-urban gradient being gradually replaced by overweight and obesity. Consequently, over 40 % of adults in rural Butajira have low BMI, while close to 30 % in Addis had overweight or obesity. It is also worth noting the marked differences in the proportion with overweight or obesity between males and females in Addis. About 2 % of males and 9 % of females in Addis are overweight (Figure 5.5).
Figure 5.5. Distribution of BMi categories by residence and sex.
Total physical activity (TPA) levelThe distribution of TPA follows a rural-urban gradient, and is in gross contrast to that of the BMI. TPA was significantly higher in rural populations than their urban counter parts. The median TPA (MET minutes/week) was 13,440 in males and 8,437 in females. A sharp decline was noted in the median TPA across males in Rural Butajira (21,840), through Urban Butajira (10,320) to Addis (3,840). The TPA decreased with age in all populations under study, but was more marked among females (r=-0.12, p<0.01). (Figure 5.6). TPA was significantly (p<0.01) and inversely cor-related with BMI (r=-0.22), which was stronger in males (-0.29), than females (-0.15).
In line with the distribution of TPA, the proportion with high TPA decreases across the rural-urban gradient where more and more adults had moderate or low levels of TPA. The prevalence of insufficient or low physical activity (less than 600 MET minutes per week or less than 150 minutes per week in the preceding week) among males varied between 3 % in rural Butajira to 15 % in Addis, and among females between 19 % in rural Butajira to 31 % in Addis (Figure 5.7). Overall, an estimated 9 % of males and 25 % of females, or 11 % of rural and 20 % of urban populations had insufficient level of physical activity.
In all the three populations, work and travel constitute the predominant domain of physical activity (PA), with little contribution from recreation (leisure) time PA (Figure 5.8).
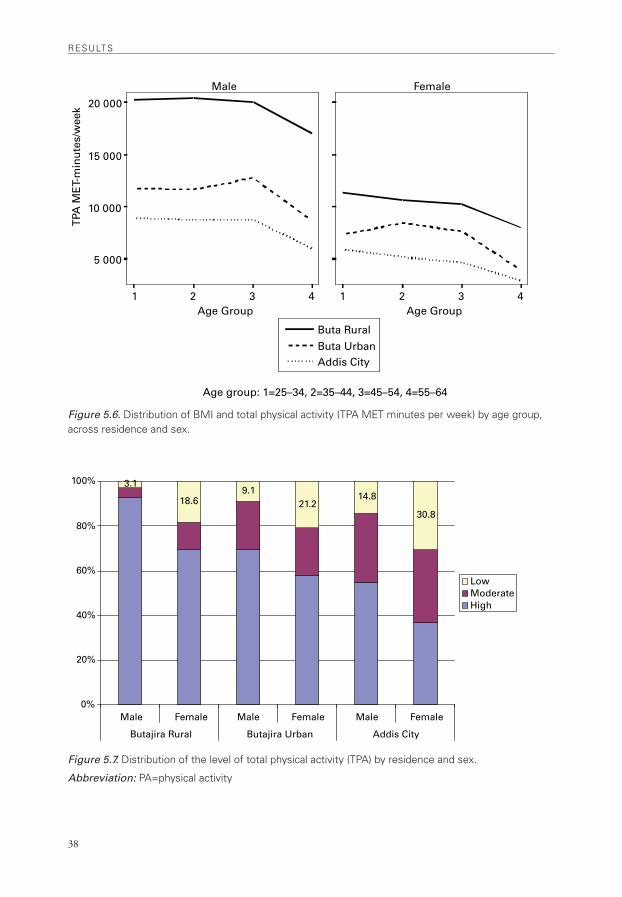
rESULTS
38
Buta Rural
Buta UrbanAddis City
1 2 3 4Age Group
5 000
10 000
15 000
20 000
TPA
ME
T-m
inu
tes/
wee
kMale Female
1 2 3 4Age Group
Age group: 1=25–34, 2=35–44, 3=45–54, 4=55–64
3.1
18.69.1
21.214.8
30.8
0%
20%
40%
60%
80%
100%
Male Female Male Female Male Female
Butajira Rural Butajira Urban Addis City
LowModerateHigh
Figure 5.6. Distribution of BMi and total physical activity (TPa MET minutes per week) by age group, across residence and sex.
Figure 5.7. Distribution of the level of total physical activity (TPa) by residence and sex.
Abbreviation: Pa=physical activity
•
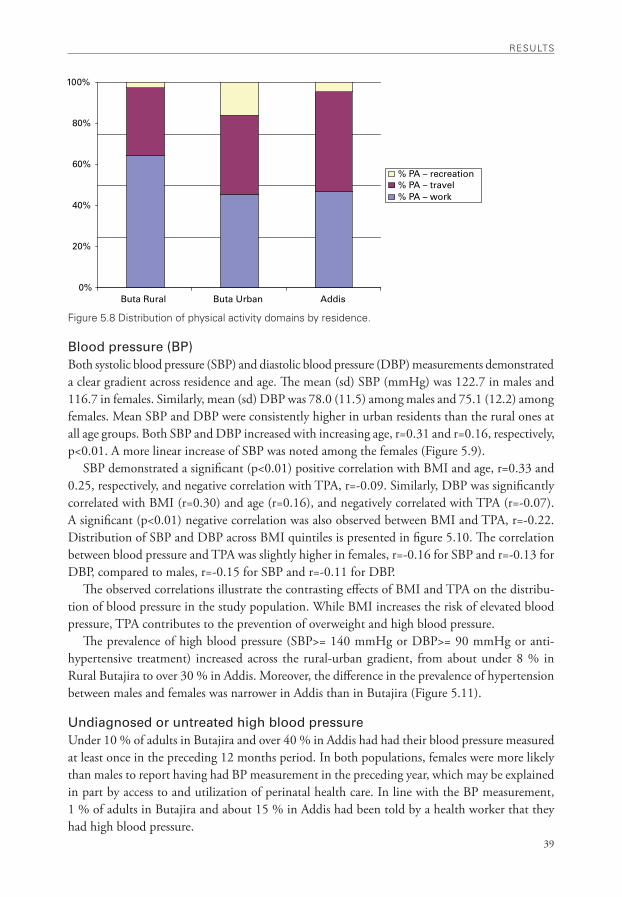
39
rESULTS
0%
20%
40%
60%
80%
100%
Buta Rural Buta Urban Addis
% PA – recreation% PA – travel% PA – work
Figure 5.8 Distribution of physical activity domains by residence.
Blood pressure (BP)Both systolic blood pressure (SBP) and diastolic blood pressure (DBP) measurements demonstrated a clear gradient across residence and age. The mean (sd) SBP (mmHg) was 122.7 in males and 116.7 in females. Similarly, mean (sd) DBP was 78.0 (11.5) among males and 75.1 (12.2) among females. Mean SBP and DBP were consistently higher in urban residents than the rural ones at all age groups. Both SBP and DBP increased with increasing age, r=0.31 and r=0.16, respectively, p<0.01. A more linear increase of SBP was noted among the females (Figure 5.9).
SBP demonstrated a significant (p<0.01) positive correlation with BMI and age, r=0.33 and 0.25, respectively, and negative correlation with TPA, r=-0.09. Similarly, DBP was significantly correlated with BMI (r=0.30) and age (r=0.16), and negatively correlated with TPA (r=-0.07). A significant (p<0.01) negative correlation was also observed between BMI and TPA, r=-0.22. Distribution of SBP and DBP across BMI quintiles is presented in figure 5.10. The correlation between blood pressure and TPA was slightly higher in females, r=-0.16 for SBP and r=-0.13 for DBP, compared to males, r=-0.15 for SBP and r=-0.11 for DBP.
The observed correlations illustrate the contrasting effects of BMI and TPA on the distribu-tion of blood pressure in the study population. While BMI increases the risk of elevated blood pressure, TPA contributes to the prevention of overweight and high blood pressure.
The prevalence of high blood pressure (SBP>= 140 mmHg or DBP>= 90 mmHg or anti-hypertensive treatment) increased across the rural-urban gradient, from about under 8 % in Rural Butajira to over 30 % in Addis. Moreover, the difference in the prevalence of hypertension between males and females was narrower in Addis than in Butajira (Figure 5.11).
Undiagnosed or untreated high blood pressureUnder 10 % of adults in Butajira and over 40 % in Addis had had their blood pressure measured at least once in the preceding 12 months period. In both populations, females were more likely than males to report having had BP measurement in the preceding year, which may be explained in part by access to and utilization of perinatal health care. In line with the BP measurement, 1 % of adults in Butajira and about 15 % in Addis had been told by a health worker that they had high blood pressure.
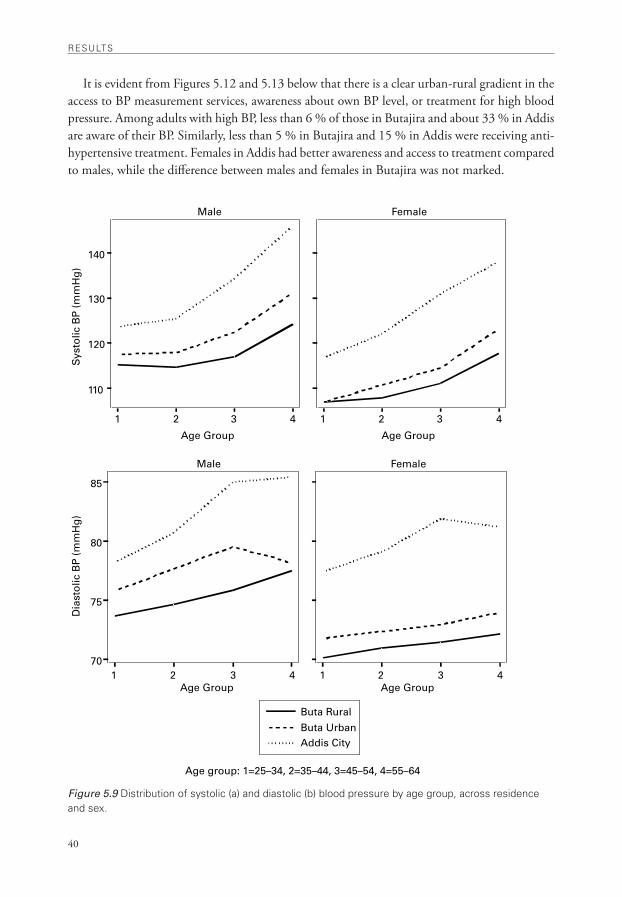
rESULTS
40
1 2 3 4
110
120
130
140
Sys
tolic
BP
(m
mH
g)
1 2 3 4
Age Group
Male Female
Age Group
1 2 3 470
75
80
85
Dia
sto
lic B
P (
mm
Hg
)
1 2 3 4
Buta Rural
Buta UrbanAddis City
Age Group
Male Female
Age Group
Age group: 1=25–34, 2=35–44, 3=45–54, 4=55–64
It is evident from Figures 5.12 and 5.13 below that there is a clear urban-rural gradient in the access to BP measurement services, awareness about own BP level, or treatment for high blood pressure. Among adults with high BP, less than 6 % of those in Butajira and about 33 % in Addis are aware of their BP. Similarly, less than 5 % in Butajira and 15 % in Addis were receiving anti-hypertensive treatment. Females in Addis had better awareness and access to treatment compared to males, while the difference between males and females in Butajira was not marked.
Figure 5.9 Distribution of systolic (a) and diastolic (b) blood pressure by age group, across residence and sex.
•
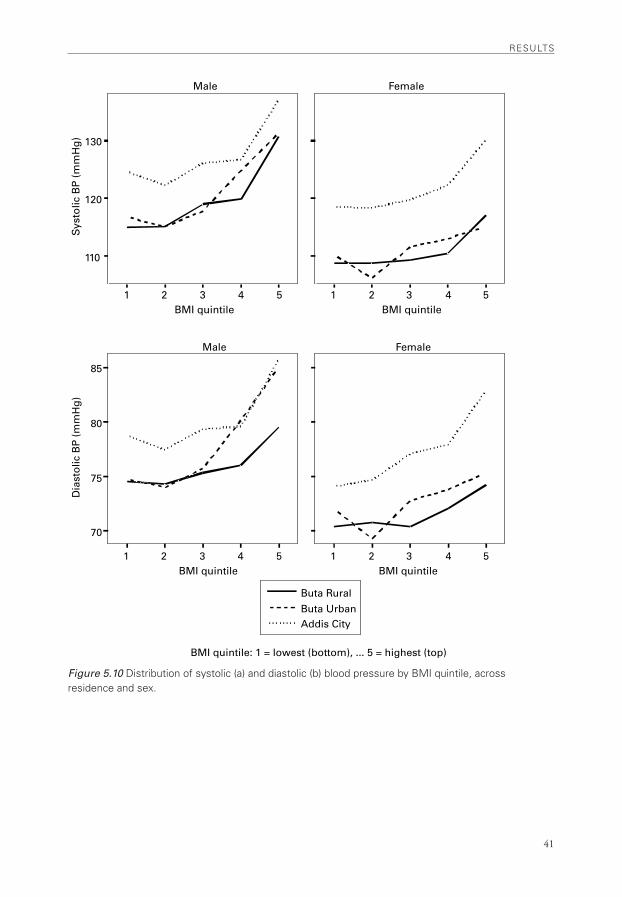
41
rESULTS
1 2 3 4 5BMI quintile
110
120
130
Sys
tolic
BP
(m
mH
g)
1 2 3 4 5BMI quintile
Male Female
1 2 3 4 5
70
75
80
85
Dia
sto
lic B
P (
mm
Hg
)
1 2 3 4 5
Buta Rural
Buta UrbanAddis City
BMI quintile
Male Female
BMI quintile
BMI quintile: 1 = lowest (bottom), ... 5 = highest (top)
Figure 5.10 Distribution of systolic (a) and diastolic (b) blood pressure by BMi quintile, across residence and sex.
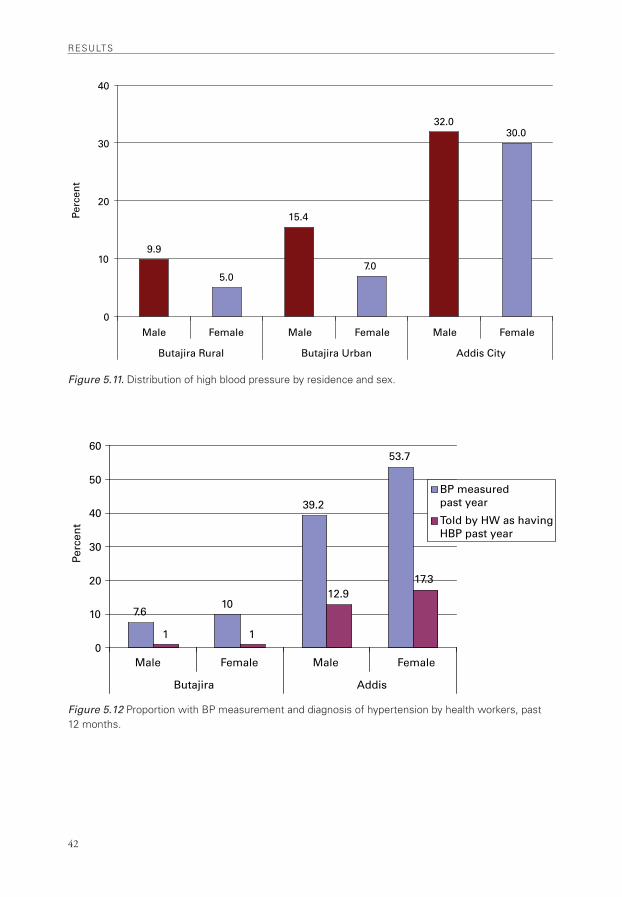
rESULTS
42
9.9
5.0
15.4
7.0
32.030.0
0
10
20
30
40
Male Female Male Female Male Female
Butajira Rural Butajira Urban Addis City
Perc
ent
7.610
39.2
53.7
1 1
12.917.3
0
10
20
30
40
50
60
BP measured past year
Told by HW as havingHBP past year
Male Female Male Female
Butajira Addis
Perc
ent
Figure 5.11. Distribution of high blood pressure by residence and sex.
Figure 5.12 Proportion with BP measurement and diagnosis of hypertension by health workers, past 12 months.
•
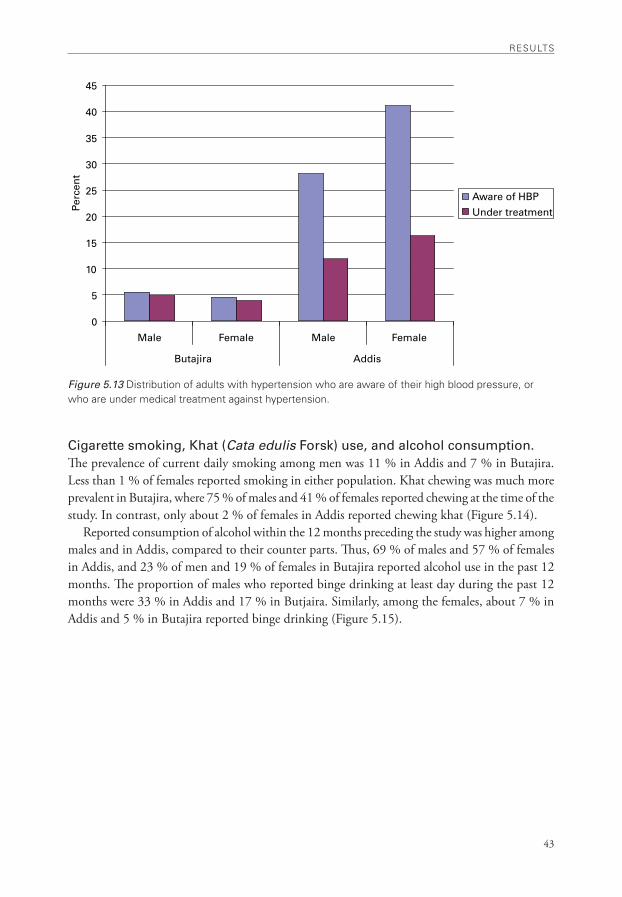
43
rESULTS
0
5
10
15
20
25
30
35
40
45
Male Female Male Female
Butajira Addis
Perc
ent
Aware of HBP
Under treatment
Figure 5.13 Distribution of adults with hypertension who are aware of their high blood pressure, or who are under medical treatment against hypertension.
Cigarette smoking, Khat (Cata edulis Forsk) use, and alcohol consumption.The prevalence of current daily smoking among men was 11 % in Addis and 7 % in Butajira. Less than 1 % of females reported smoking in either population. Khat chewing was much more prevalent in Butajira, where 75 % of males and 41 % of females reported chewing at the time of the study. In contrast, only about 2 % of females in Addis reported chewing khat (Figure 5.14).
Reported consumption of alcohol within the 12 months preceding the study was higher among males and in Addis, compared to their counter parts. Thus, 69 % of males and 57 % of females in Addis, and 23 % of men and 19 % of females in Butajira reported alcohol use in the past 12 months. The proportion of males who reported binge drinking at least day during the past 12 months were 33 % in Addis and 17 % in Butjaira. Similarly, among the females, about 7 % in Addis and 5 % in Butajira reported binge drinking (Figure 5.15).
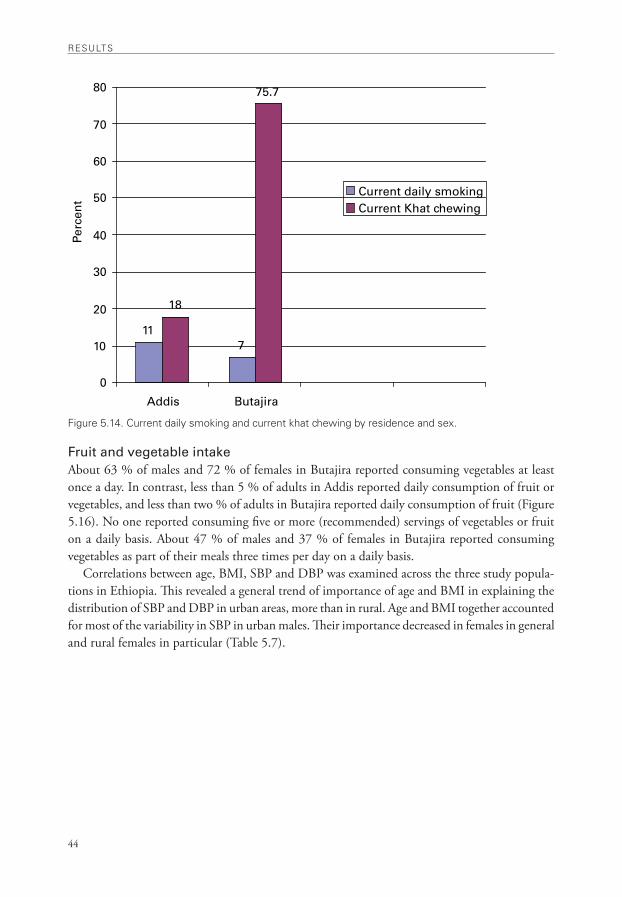
rESULTS
44
117
18
75.7
0
10
20
30
40
50
60
70
80
Addis Butajira
Perc
ent
Current daily smokingCurrent Khat chewing
Figure 5.14. Current daily smoking and current khat chewing by residence and sex.
Fruit and vegetable intakeAbout 63 % of males and 72 % of females in Butajira reported consuming vegetables at least once a day. In contrast, less than 5 % of adults in Addis reported daily consumption of fruit or vegetables, and less than two % of adults in Butajira reported daily consumption of fruit (Figure 5.16). No one reported consuming five or more (recommended) servings of vegetables or fruit on a daily basis. About 47 % of males and 37 % of females in Butajira reported consuming vegetables as part of their meals three times per day on a daily basis.
Correlations between age, BMI, SBP and DBP was examined across the three study popula-tions in Ethiopia. This revealed a general trend of importance of age and BMI in explaining the distribution of SBP and DBP in urban areas, more than in rural. Age and BMI together accounted for most of the variability in SBP in urban males. Their importance decreased in females in general and rural females in particular (Table 5.7).
•
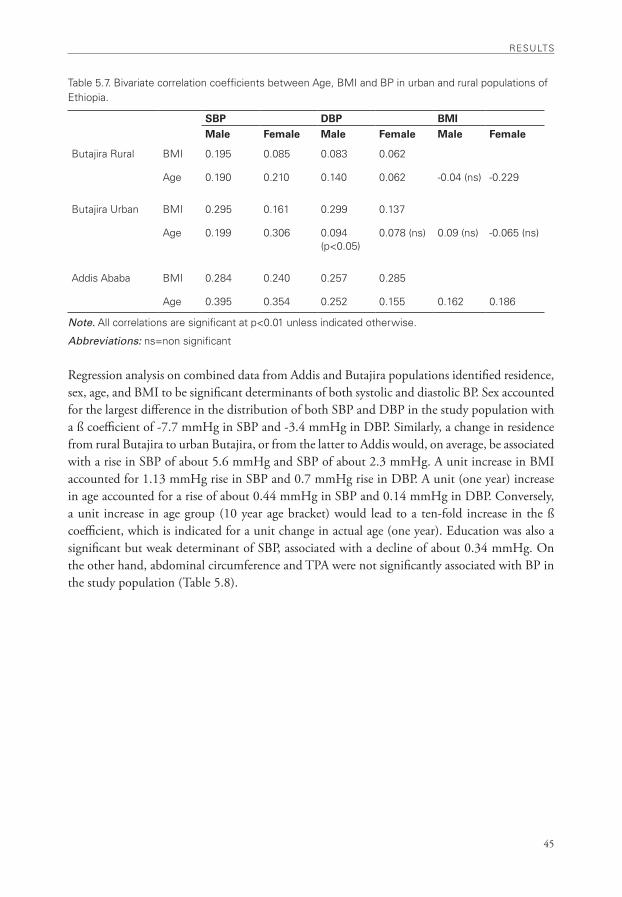
45
rESULTS
Table 5.7. Bivariate correlation coefficients between age, BMi and BP in urban and rural populations of Ethiopia.
SBP DBP BMIMale Female Male Female Male Female
Butajira rural BMi 0.195 0.085 0.083 0.062
age 0.190 0.210 0.140 0.062 -0.04 (ns) -0.229
Butajira Urban BMi 0.295 0.161 0.299 0.137
age 0.199 0.306 0.094 (p<0.05)
0.078 (ns) 0.09 (ns) -0.065 (ns)
addis ababa BMi 0.284 0.240 0.257 0.285
age 0.395 0.354 0.252 0.155 0.162 0.186
Note. all correlations are significant at p<0.01 unless indicated otherwise.
Abbreviations: ns=non significant
Regression analysis on combined data from Addis and Butajira populations identified residence, sex, age, and BMI to be significant determinants of both systolic and diastolic BP. Sex accounted for the largest difference in the distribution of both SBP and DBP in the study population with a ß coefficient of -7.7 mmHg in SBP and -3.4 mmHg in DBP. Similarly, a change in residence from rural Butajira to urban Butajira, or from the latter to Addis would, on average, be associated with a rise in SBP of about 5.6 mmHg and SBP of about 2.3 mmHg. A unit increase in BMI accounted for 1.13 mmHg rise in SBP and 0.7 mmHg rise in DBP. A unit (one year) increase in age accounted for a rise of about 0.44 mmHg in SBP and 0.14 mmHg in DBP. Conversely, a unit increase in age group (10 year age bracket) would lead to a ten-fold increase in the ß coefficient, which is indicated for a unit change in actual age (one year). Education was also a significant but weak determinant of SBP, associated with a decline of about 0.34 mmHg. On the other hand, abdominal circumference and TPA were not significantly associated with BP in the study population (Table 5.8).
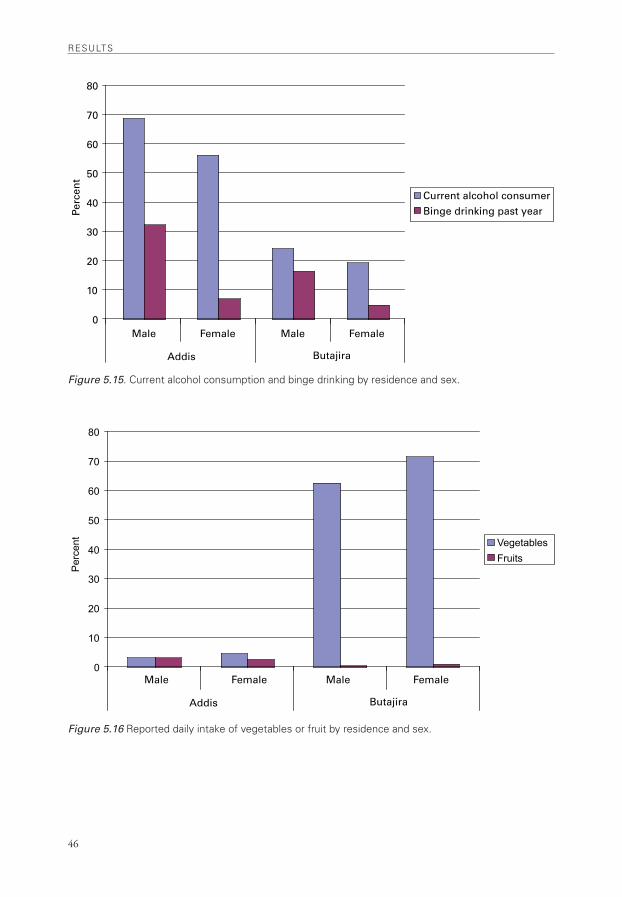
rESULTS
46
0
10
20
30
40
50
60
70
80Pe
rcen
t
Current alcohol consumerBinge drinking past year
Male Female Male Female
ButajiraAddis
0
10
20
30
40
50
60
70
80
Per
cent Vegetables
Fruits
Male Female Male Female
ButajiraAddis
Figure 5.15. Current alcohol consumption and binge drinking by residence and sex.
Figure 5.16 reported daily intake of vegetables or fruit by residence and sex.
•
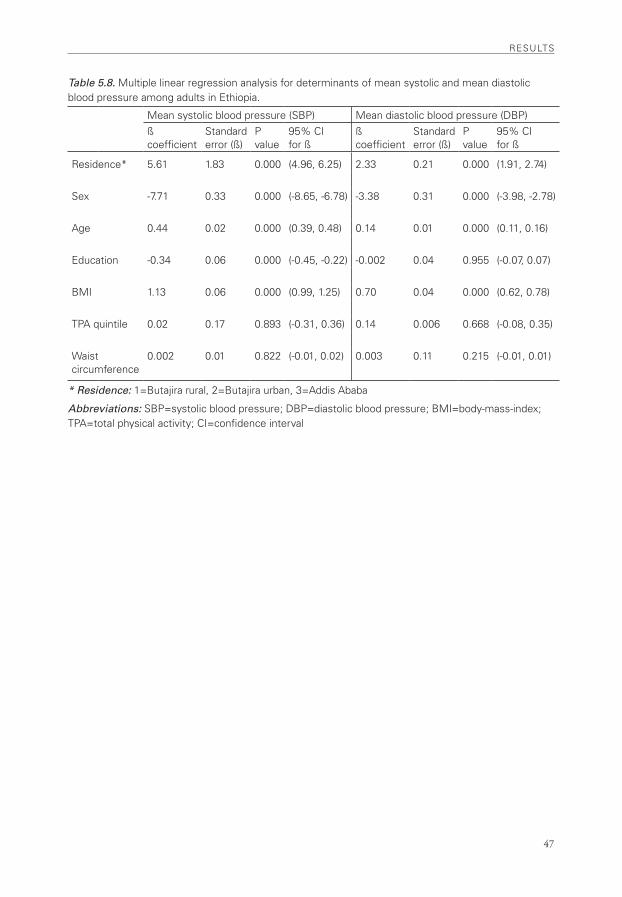
47
rESULTS
Table 5.8. Multiple linear regression analysis for determinants of mean systolic and mean diastolic blood pressure among adults in Ethiopia.
Mean systolic blood pressure (SBP) Mean diastolic blood pressure (DBP)ß coefficient
Standard error (ß)
P value
95% Ci for ß
ß coefficient
Standard error (ß)
P value
95% Ci for ß
residence* 5.61 1.83 0.000 (4.96, 6.25) 2.33 0.21 0.000 (1.91, 2.74)
Sex -7.71 0.33 0.000 (-8.65, -6.78) -3.38 0.31 0.000 (-3.98, -2.78)
age 0.44 0.02 0.000 (0.39, 0.48) 0.14 0.01 0.000 (0.11, 0.16)
Education -0.34 0.06 0.000 (-0.45, -0.22) -0.002 0.04 0.955 (-0.07, 0.07)
BMi 1.13 0.06 0.000 (0.99, 1.25) 0.70 0.04 0.000 (0.62, 0.78)
TPa quintile 0.02 0.17 0.893 (-0.31, 0.36) 0.14 0.006 0.668 (-0.08, 0.35)
waist circumference
0.002 0.01 0.822 (-0.01, 0.02) 0.003 0.11 0.215 (-0.01, 0.01)
* Residence: 1=Butajira rural, 2=Butajira urban, 3=addis ababa
Abbreviations: SBP=systolic blood pressure; DBP=diastolic blood pressure; BMi=body-mass-index; TPa=total physical activity; Ci=confidence interval

48
•
49
DiSCUSSion
6. Discussion
Conventional risk factors associated with CVD, such as elevated blood pressure, physical inactivity, and overweight/obesity are widely prevalent in the urban population of Ethiopia. The urban-rural difference accounts for the largest variability in the distribution of these risk factors. Behavioural risk factors such as cigarette smoking, binge drinking of alcohol, and habitual chewing of khat appear to be emerging problems, particularly among males. Consequently, about 68 % of adults in urban areas have one or more of the CVD risk factors covered in this study, excluding inadequate intake of fruit or vegetables, which is universal among the study population.
In rural areas, obesity and physical inactivity are not generally a concern at the moment. However, with about 10 % of the males having elevated blood pressure, largely undiagnosed or untreated, and 7 % (of males) smoking cigarettes daily, the public health importance of the two risk factors among the rural population should not be understated. The difference in the prevalence of current daily smoking between urban and rural populations is narrower than the difference in the other CVD risk factors.
Among rural populations of Ethiopia, khat chewing has long been limited to areas where it is grown – the eastern and central parts of the country, until recently, when farmers in the northern part of the country have also begun to cultivate khat as a cash crop. In Butajira district, where khat is widely grown and consumed,(98) its health consequences should receive due attention. Studies elsewhere have suggested associations between khat chewing and the risk of CVD(99-102).
Comparison between urban and rural populations in Ethiopia revealed that females in Addis have the highest mean BMI coupled with the lowest mean TPA, within any given age group. Consequently, the age specific distribution of mean SBP and DBP reveals much higher values among females in Addis. Urbanization influences are evident with sedentary lifestyle among this group of population, where possibly high dietary energy and fat intake are contributing to overweight and high blood pressure.
The existing level of TPA in this population group is largely composed of work and travel related domains with little contribution from recreation related (leisure time) activities such as sports.
6.1 Blood pressureHigh blood pressure is the most important risk factor for CVD among adults(3) and forms the basis for the CVD epidemic in SSA(103). Hypertension is consistently and independently associ-ated with the risk of morbidity and mortality from CVD(104,105). Globally, sub-optimal blood pressure (SBP>=115 mmHg) was estimated to account for 62% of cerebrovascular disease and 49% of ischemic heart disease(1).
Recent studies have described a growing prevalence of hypertension and other CVD in SSA, where they have long been considered rare(106-108). The prevalence of hypertension in many urban populations of SSA countries is comparable with that of developed countries in Europe, USA, and Canada(109). Hypertension is a public health problem in sub-Saharan Africa, particularly
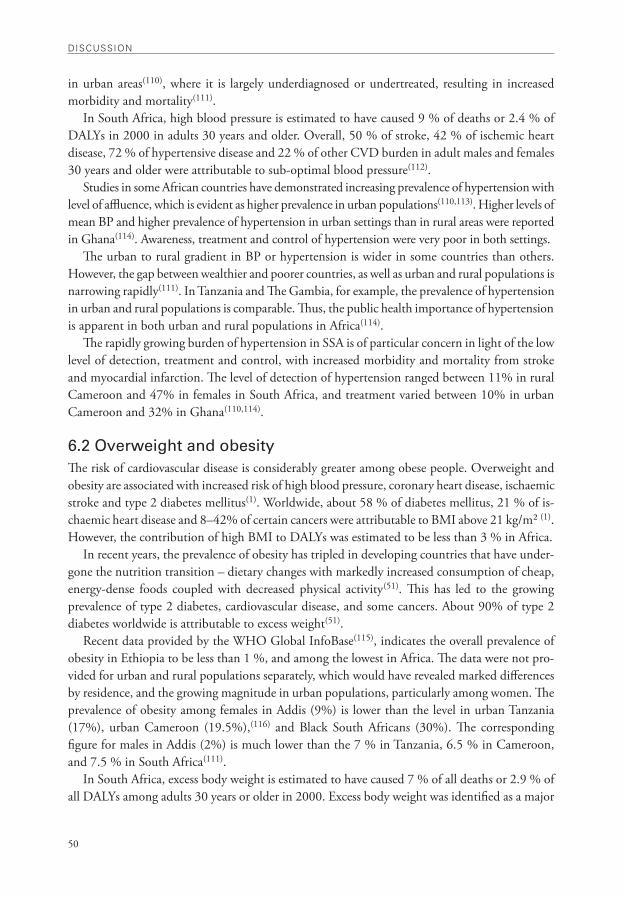
DiSCUSSion
50
in urban areas(110), where it is largely underdiagnosed or undertreated, resulting in increased morbidity and mortality(111).
In South Africa, high blood pressure is estimated to have caused 9 % of deaths or 2.4 % of DALYs in 2000 in adults 30 years and older. Overall, 50 % of stroke, 42 % of ischemic heart disease, 72 % of hypertensive disease and 22 % of other CVD burden in adult males and females 30 years and older were attributable to sub-optimal blood pressure(112).
Studies in some African countries have demonstrated increasing prevalence of hypertension with level of affluence, which is evident as higher prevalence in urban populations(110,113). Higher levels of mean BP and higher prevalence of hypertension in urban settings than in rural areas were reported in Ghana(114). Awareness, treatment and control of hypertension were very poor in both settings.
The urban to rural gradient in BP or hypertension is wider in some countries than others. However, the gap between wealthier and poorer countries, as well as urban and rural populations is narrowing rapidly(111). In Tanzania and The Gambia, for example, the prevalence of hypertension in urban and rural populations is comparable. Thus, the public health importance of hypertension is apparent in both urban and rural populations in Africa(114).
The rapidly growing burden of hypertension in SSA is of particular concern in light of the low level of detection, treatment and control, with increased morbidity and mortality from stroke and myocardial infarction. The level of detection of hypertension ranged between 11% in rural Cameroon and 47% in females in South Africa, and treatment varied between 10% in urban Cameroon and 32% in Ghana(110,114).
6.2 Overweight and obesityThe risk of cardiovascular disease is considerably greater among obese people. Overweight and obesity are associated with increased risk of high blood pressure, coronary heart disease, ischaemic stroke and type 2 diabetes mellitus(1). Worldwide, about 58 % of diabetes mellitus, 21 % of is-chaemic heart disease and 8–42% of certain cancers were attributable to BMI above 21 kg/m² (1). However, the contribution of high BMI to DALYs was estimated to be less than 3 % in Africa.
In recent years, the prevalence of obesity has tripled in developing countries that have under-gone the nutrition transition – dietary changes with markedly increased consumption of cheap, energy-dense foods coupled with decreased physical activity(51). This has led to the growing prevalence of type 2 diabetes, cardiovascular disease, and some cancers. About 90% of type 2 diabetes worldwide is attributable to excess weight(51).
Recent data provided by the WHO Global InfoBase(115), indicates the overall prevalence of obesity in Ethiopia to be less than 1 %, and among the lowest in Africa. The data were not pro-vided for urban and rural populations separately, which would have revealed marked differences by residence, and the growing magnitude in urban populations, particularly among women. The prevalence of obesity among females in Addis (9%) is lower than the level in urban Tanzania (17%), urban Cameroon (19.5%),(116) and Black South Africans (30%). The corresponding figure for males in Addis (2%) is much lower than the 7 % in Tanzania, 6.5 % in Cameroon, and 7.5 % in South Africa(111).
In South Africa, excess body weight is estimated to have caused 7 % of all deaths or 2.9 % of all DALYs among adults 30 years or older in 2000. Excess body weight was identified as a major
•
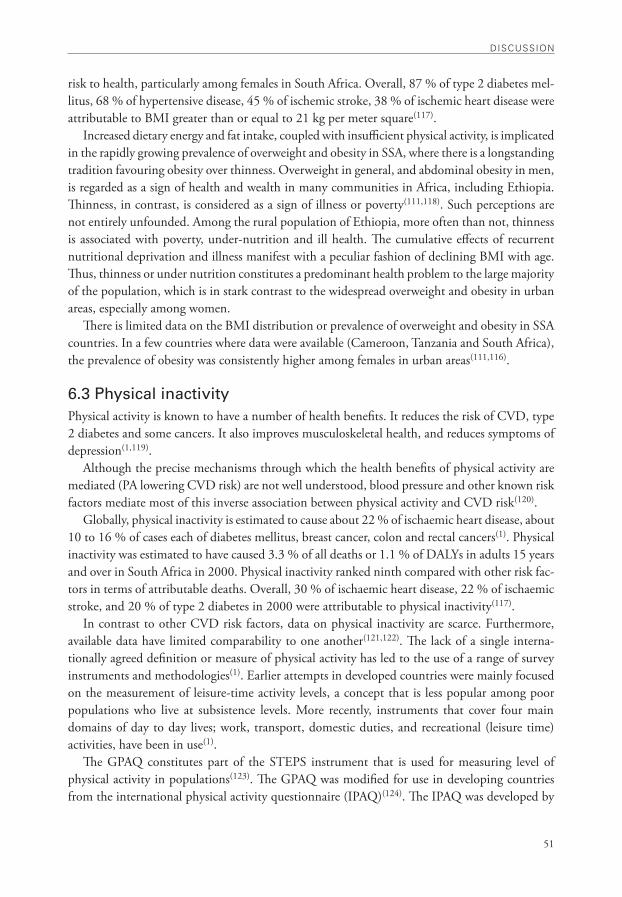
51
DiSCUSSion
risk to health, particularly among females in South Africa. Overall, 87 % of type 2 diabetes mel-litus, 68 % of hypertensive disease, 45 % of ischemic stroke, 38 % of ischemic heart disease were attributable to BMI greater than or equal to 21 kg per meter square(117).
Increased dietary energy and fat intake, coupled with insufficient physical activity, is implicated in the rapidly growing prevalence of overweight and obesity in SSA, where there is a longstanding tradition favouring obesity over thinness. Overweight in general, and abdominal obesity in men, is regarded as a sign of health and wealth in many communities in Africa, including Ethiopia. Thinness, in contrast, is considered as a sign of illness or poverty(111,118). Such perceptions are not entirely unfounded. Among the rural population of Ethiopia, more often than not, thinness is associated with poverty, under-nutrition and ill health. The cumulative effects of recurrent nutritional deprivation and illness manifest with a peculiar fashion of declining BMI with age. Thus, thinness or under nutrition constitutes a predominant health problem to the large majority of the population, which is in stark contrast to the widespread overweight and obesity in urban areas, especially among women.
There is limited data on the BMI distribution or prevalence of overweight and obesity in SSA countries. In a few countries where data were available (Cameroon, Tanzania and South Africa), the prevalence of obesity was consistently higher among females in urban areas(111,116).
6.3 Physical inactivityPhysical activity is known to have a number of health benefits. It reduces the risk of CVD, type 2 diabetes and some cancers. It also improves musculoskeletal health, and reduces symptoms of depression(1,119).
Although the precise mechanisms through which the health benefits of physical activity are mediated (PA lowering CVD risk) are not well understood, blood pressure and other known risk factors mediate most of this inverse association between physical activity and CVD risk(120).
Globally, physical inactivity is estimated to cause about 22 % of ischaemic heart disease, about 10 to 16 % of cases each of diabetes mellitus, breast cancer, colon and rectal cancers(1). Physical inactivity was estimated to have caused 3.3 % of all deaths or 1.1 % of DALYs in adults 15 years and over in South Africa in 2000. Physical inactivity ranked ninth compared with other risk fac-tors in terms of attributable deaths. Overall, 30 % of ischaemic heart disease, 22 % of ischaemic stroke, and 20 % of type 2 diabetes in 2000 were attributable to physical inactivity(117).
In contrast to other CVD risk factors, data on physical inactivity are scarce. Furthermore, available data have limited comparability to one another(121,122). The lack of a single interna-tionally agreed definition or measure of physical activity has led to the use of a range of survey instruments and methodologies(1). Earlier attempts in developed countries were mainly focused on the measurement of leisure-time activity levels, a concept that is less popular among poor populations who live at subsistence levels. More recently, instruments that cover four main domains of day to day lives; work, transport, domestic duties, and recreational (leisure time) activities, have been in use(1).
The GPAQ constitutes part of the STEPS instrument that is used for measuring level of physical activity in populations(123). The GPAQ was modified for use in developing countries from the international physical activity questionnaire (IPAQ)(124). The IPAQ was developed by
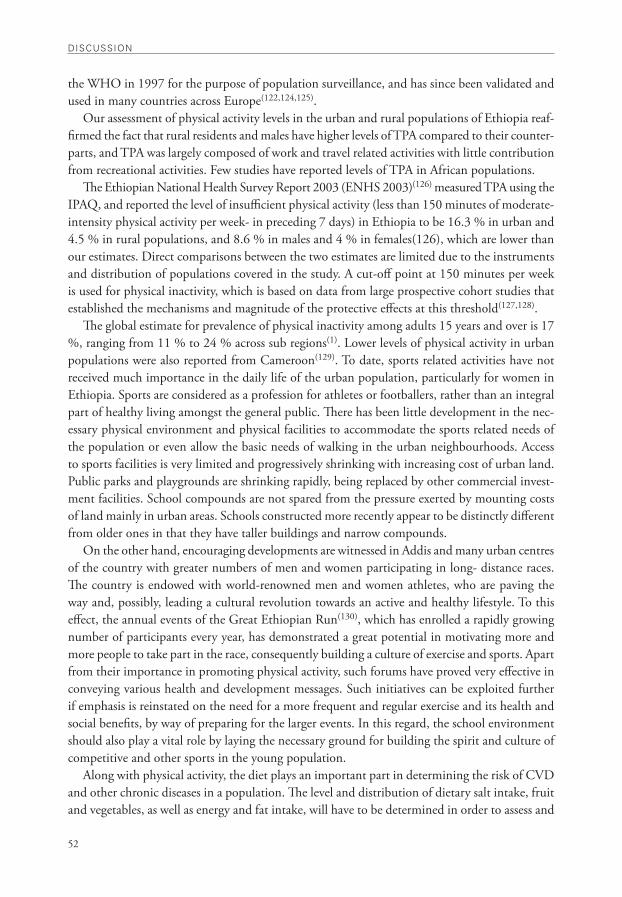
DiSCUSSion
52
the WHO in 1997 for the purpose of population surveillance, and has since been validated and used in many countries across Europe(122,124,125).
Our assessment of physical activity levels in the urban and rural populations of Ethiopia reaf-firmed the fact that rural residents and males have higher levels of TPA compared to their counter-parts, and TPA was largely composed of work and travel related activities with little contribution from recreational activities. Few studies have reported levels of TPA in African populations.
The Ethiopian National Health Survey Report 2003 (ENHS 2003)(126) measured TPA using the IPAQ, and reported the level of insufficient physical activity (less than 150 minutes of moderate-intensity physical activity per week- in preceding 7 days) in Ethiopia to be 16.3 % in urban and 4.5 % in rural populations, and 8.6 % in males and 4 % in females(126), which are lower than our estimates. Direct comparisons between the two estimates are limited due to the instruments and distribution of populations covered in the study. A cut-off point at 150 minutes per week is used for physical inactivity, which is based on data from large prospective cohort studies that established the mechanisms and magnitude of the protective effects at this threshold(127,128).
The global estimate for prevalence of physical inactivity among adults 15 years and over is 17 %, ranging from 11 % to 24 % across sub regions(1). Lower levels of physical activity in urban populations were also reported from Cameroon(129). To date, sports related activities have not received much importance in the daily life of the urban population, particularly for women in Ethiopia. Sports are considered as a profession for athletes or footballers, rather than an integral part of healthy living amongst the general public. There has been little development in the nec-essary physical environment and physical facilities to accommodate the sports related needs of the population or even allow the basic needs of walking in the urban neighbourhoods. Access to sports facilities is very limited and progressively shrinking with increasing cost of urban land. Public parks and playgrounds are shrinking rapidly, being replaced by other commercial invest-ment facilities. School compounds are not spared from the pressure exerted by mounting costs of land mainly in urban areas. Schools constructed more recently appear to be distinctly different from older ones in that they have taller buildings and narrow compounds.
On the other hand, encouraging developments are witnessed in Addis and many urban centres of the country with greater numbers of men and women participating in long- distance races. The country is endowed with world-renowned men and women athletes, who are paving the way and, possibly, leading a cultural revolution towards an active and healthy lifestyle. To this effect, the annual events of the Great Ethiopian Run(130), which has enrolled a rapidly growing number of participants every year, has demonstrated a great potential in motivating more and more people to take part in the race, consequently building a culture of exercise and sports. Apart from their importance in promoting physical activity, such forums have proved very effective in conveying various health and development messages. Such initiatives can be exploited further if emphasis is reinstated on the need for a more frequent and regular exercise and its health and social benefits, by way of preparing for the larger events. In this regard, the school environment should also play a vital role by laying the necessary ground for building the spirit and culture of competitive and other sports in the young population.
Along with physical activity, the diet plays an important part in determining the risk of CVD and other chronic diseases in a population. The level and distribution of dietary salt intake, fruit and vegetables, as well as energy and fat intake, will have to be determined in order to assess and
•
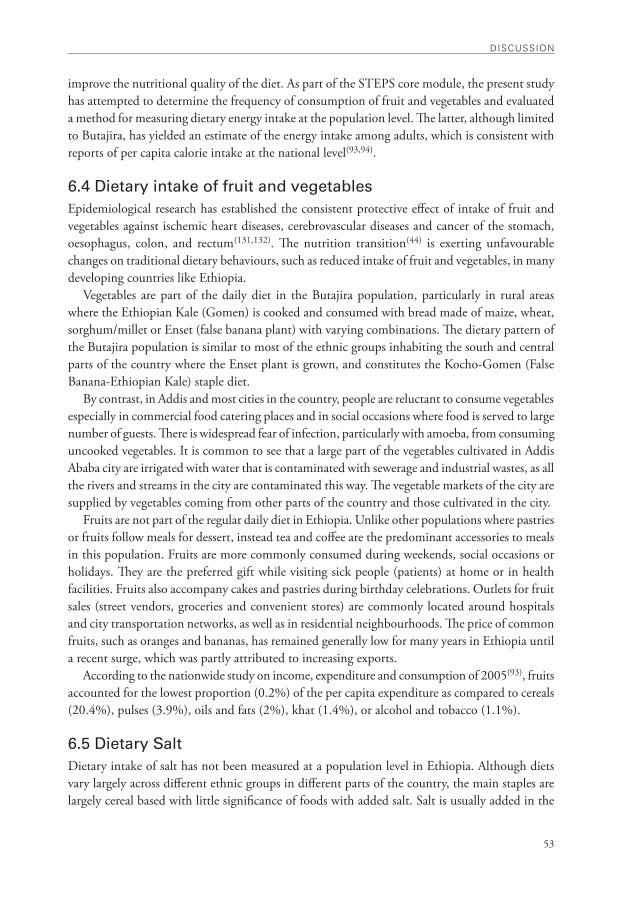
53
DiSCUSSion
improve the nutritional quality of the diet. As part of the STEPS core module, the present study has attempted to determine the frequency of consumption of fruit and vegetables and evaluated a method for measuring dietary energy intake at the population level. The latter, although limited to Butajira, has yielded an estimate of the energy intake among adults, which is consistent with reports of per capita calorie intake at the national level(93,94).
6.4 Dietary intake of fruit and vegetablesEpidemiological research has established the consistent protective effect of intake of fruit and vegetables against ischemic heart diseases, cerebrovascular diseases and cancer of the stomach, oesophagus, colon, and rectum(131,132). The nutrition transition(44) is exerting unfavourable changes on traditional dietary behaviours, such as reduced intake of fruit and vegetables, in many developing countries like Ethiopia.
Vegetables are part of the daily diet in the Butajira population, particularly in rural areas where the Ethiopian Kale (Gomen) is cooked and consumed with bread made of maize, wheat, sorghum/millet or Enset (false banana plant) with varying combinations. The dietary pattern of the Butajira population is similar to most of the ethnic groups inhabiting the south and central parts of the country where the Enset plant is grown, and constitutes the Kocho-Gomen (False Banana-Ethiopian Kale) staple diet.
By contrast, in Addis and most cities in the country, people are reluctant to consume vegetables especially in commercial food catering places and in social occasions where food is served to large number of guests. There is widespread fear of infection, particularly with amoeba, from consuming uncooked vegetables. It is common to see that a large part of the vegetables cultivated in Addis Ababa city are irrigated with water that is contaminated with sewerage and industrial wastes, as all the rivers and streams in the city are contaminated this way. The vegetable markets of the city are supplied by vegetables coming from other parts of the country and those cultivated in the city.
Fruits are not part of the regular daily diet in Ethiopia. Unlike other populations where pastries or fruits follow meals for dessert, instead tea and coffee are the predominant accessories to meals in this population. Fruits are more commonly consumed during weekends, social occasions or holidays. They are the preferred gift while visiting sick people (patients) at home or in health facilities. Fruits also accompany cakes and pastries during birthday celebrations. Outlets for fruit sales (street vendors, groceries and convenient stores) are commonly located around hospitals and city transportation networks, as well as in residential neighbourhoods. The price of common fruits, such as oranges and bananas, has remained generally low for many years in Ethiopia until a recent surge, which was partly attributed to increasing exports.
According to the nationwide study on income, expenditure and consumption of 2005(93), fruits accounted for the lowest proportion (0.2%) of the per capita expenditure as compared to cereals (20.4%), pulses (3.9%), oils and fats (2%), khat (1.4%), or alcohol and tobacco (1.1%).
6.5 Dietary Salt Dietary intake of salt has not been measured at a population level in Ethiopia. Although diets vary largely across different ethnic groups in different parts of the country, the main staples are largely cereal based with little significance of foods with added salt. Salt is usually added in the
DiSCUSSion
54
process of cooking foods, rather than on the plate. In parts of the country where coffee is tradition-ally consumed with salt instead of sugar, frequent intake of coffee may constitute an important source of dietary salt. In some costal populations in Africa where sea foods, fish in particular, are frequently consumed, the dietary salt intake may be considerably high due to the salt added in the process of preservation.
Higher dietary intake of salt among urban populations compared to rural ones has been demonstrated in studies from Nigeria that compared sodium and potassium excretions between urban and rural populations(133).
6.6 Dietary Energy IntakeConsumption of cereal grains forms the basis of a healthy diet. The dietary intake of wholegrain cereals is associated with health benefits, such as reduced risk of heart disease and stroke although the exact mechanism is not clear. Studies have demonstrated the protective effects of wholegrain consumption against coronary heart disease (CHD) and CVD(134-136). The habitual intake of wholegrain food is associated with a 20 to 40% reduction in risk CHD compared to those who eat them rarely(137). On the other hand, refined grains have reduced nutrient content compared to whole grains because the milling process results in the loss of dietary fibre, vitamins, and minerals other elements(138).
Consumption of refined (processed or packed) foods is not very widespread in Ethiopia, although pastas and white bread are commonly consumed in urban areas. While the extent of consumption of animal products, energy dense foods, or wholegrain cereals may vary along economic lines and urbanization, the diets of the Ethiopian people are largely based on cereals. Maize, wheat, teff, barley, sorghum, millet and other cereals and legumes constitute an important part of the staple diet in most parts of the country(139).
According to the national estimate by the Central Statistical Agency (CSA) in Ethiopia(93), cereal grains contributed to 52 % and 63 % of the daily per capita calorie intake in urban and rural populations, respectively, during 2005. Potatoes, other tubers and stems (4% urban, 15.3% rural), pulses (6.2% urban, 7% rural), and bread, injera (9.3% urban, 0.8% rural) were also im-portant sources of daily per capita calorie intake. Oils and fats contributed to 8.1% (urban) and 1.5% (rural) of the daily per capita calorie intake. Consumption of meat contributed to 2.5 % of the calorie intake in urban populations and 0.6 % in rural populations. The contribution of fish intake in the diet was less than 1 %. Alcoholic beverages had similar contributions in urban (1.2%) and rural (1.5%) populations to the daily per capita calorie intake(93).
However, in the absence of a systematic assessment of the production, import and marketing of processed foods, and the associated dietary pattern of the population it would be unwise to undermine their importance in the nutrition and health of the population. In recent years, the pace at which such items are being introduced into the country has increased. Public media are more and more occupied with advertisements for various foods and drinks that are imported from abroad. Most of these industrial products are made of refined flours, rather than whole grains, prepared with added sugar and salt, and have little contribution to micronutrient intake in the diet. Unless the import and local production of such items is monitored promptly, it could be difficult to reverse their effect on dietary behaviour once the markets are established and the
•
55
DiSCUSSion
demands are deep-rooted. In this regard, the roles of public media and the western entertainment industry are huge in modifying the dietary and lifestyle behaviours of the urban population in general, and young people in particular.
6.7 Cigarette SmokingWorldwide, it is estimated that tobacco causes about 8.8% of deaths and 4.1% of DALYs. In industrialized countries, smoking is estimated to cause 22% of cardiovascular disease, about 70-90% of lung cancer, and 56–80% of chronic respiratory disease(1).
Globally, about 30 % of adults were estimated to be smokers in 1998. Men were four times as likely to smoke as women. However, about 23% of females in the Regions of Europe and America were smokers. Among women, smoking prevalence was highest in the European Region(140,141). Smoking prevalence has increased markedly in developing countries, especially among males, over the past few decades(140–142), while it has been decreasing steadily, mostly among men, in many industrialized countries(1).
Only 23 of the Sub-Saharan Africa countries had any data on cigarette-use prevalence rates available in 2000, and only a few had data on rates based on adequate national surveys(141,142). Among adults in SSA, the prevalence of current cigarette smoking varied between 1 % in Lesotho to 44 % in Guinea. Highest prevalence levels were reported for males in Kenya (67%), Guinea (60%), Namibia (65%), Guinea (60%), Uganda (52%), and Tanzania (50%). An overall preva-lence of 16 % was reported for Ethiopia for 1995(111).
In a review of tobacco use among adults 15 years and older in sub-Saharan Africa, data on current smoking could be found for only 14 of 48 SSA countries. The finding revealed variations in the prevalence of current smoking across countries, which were however, consistently higher among males compared to females. The pattern across residence could not be determined from the available data as few studies presented data stratified by residence(143).
Adolescent tobacco smoking in Addis Ababa was determined using data from the Global Youth Tobacco Survey 2003, where 4.5 % of males and 1 % of females reported current smoking. The prevalence in Addis Ababa was lower than that in many other countries in Africa(144). The Glo-bal Youth Tobacco Survey(145) also reported prevalence of cigarette smoking among participants 13–15 years of age for 7 SSA countries (not including Ethiopia) in 1999–2001. The figures varied between 2.4 % in Blantyre, Malawi to 18 % in South Africa. Higher prevalence figures were also reported for Harare, Zimbabwe (10.7%), Manicaland, Zimbabwe (10%), Cross River State, Nigeria (7%), and Lilongwe, Malawi (6.1%)(145).
The prevalence figures for adults males in Addis Ababa (11%) and Butajira (7%) are com-parable to other reports throughout the country. In a cross sectional survey of college students in Addis Ababa, the prevalence of current cigarette smoking was 9.5% in males and 3.4% in females(146). In 1998, about 12 % of males and 1 % of females, 15-24 years of age, in Addis Ababa were reported to be smoking. On the other hand, the ENHS 2003(126) reported current daily smoking to be more common in rural areas (3.1%) than in urban (2.4%). The differences in the populations sampled might account for the marked variations in the prevalence levels between our study and the ENHS 2003.
The Tobacco Enterprise is one of the oldest industries in Ethiopia which is engaged in the production, import and distribution of tobacco. Currently, the enterprise is running four to-
DiSCUSSion
56
bacco plantation farms, and one tobacco processing (production) factory, and it employs a total of 1160 permanent farm and industry workers and officers. The enterprise is owned and run by the government and enjoys a monopoly concerning the production, import, export or distribu-tion of cigarettes in the country. In addition to the local production, it imports cigarette brands produced abroad and regulates (prevents or controls) illegal smuggling and distribution in the country (personal communication).
The enterprise is not aware of any regulations concerning restriction of advertising, distribution or sale of cigarettes, and there are not any groups opposing smoking in the country. However, there are reports(148) indicating that tobacco advertising or smoking in public places are banned through legislation and/or regulations. The Tobacco Enterprise contributes about 1 % of the total government revenue (personal communication). In 1977 the total revenue from the tobacco industry was reported to be about 1.6%(147).
The Tobacco Enterprise claims that it has no competition and does not need to engage in massive advertising, as it does not even meet the demands. However, it advertises tobacco using billboards, and on plastic bags, pens, etc. It does not carry out advertising on television or radio, or in connection with sports events or around the football stadiums.
Ethiopia signed the Framework Convention on Tobacco Control (FCTC) in 2004 but has not ratified the convention. There are no regulations prohibiting tobacco advertising or sales to minors, other than the unofficial (informal) norms that prohibit smoking in some public enclosed places and during official meetings(148).
6.8 Khat UseThe khat plant was identified and named Catha edulis by the botanist Peter Forskal, in Yemen in the eighteenth century. His findings were edited later in 1775 by Niebuhr(149) who added an extension “Forsk” into the scientific name of the plant in honour of Peter Forskal. Historical records of the origin and use of khat often cite Ethiopia and Yemen(150,151).
Chewing khat predates the use of coffee and is used in a similar social context(152). The small fresh leaves and buds of khat are habitually chewed to attain a state of stimulation, energy, alert-ness, and to facilitate social interaction(152–155).
The fresh leaves, twigs, and shoots of the khat shrub are chewed intermittently, and retained in the cheek to release the active drug. The leaves contain a number of chemicals, among which cathinone and cathine are responsible for the main pharmacological effects of khat. As the leaves mature or dry, cathinone is converted to cathine, which significantly reduces its stimulatory properties(152).
Extraction of the khat alkaloids by chewing is very efficient, with only less than 10% remain-ing as a residue(156). The absorption of cathinone and cathine takes place mainly in the mouth (by the buccal mucosa). The absorption continues in the stomach or small intestine, where the alkaloids are absorbed from the swallowed juice(156).
The habit of khat chewing has prevailed for centuries among populations in the horn of Africa and the Arabian Peninsula, where the plant is cultivated(152). Until recently, however, it has re-mained mostly confined to the regions where the plant is grown, since only fresh leaves have the potency to produce the desired effects. In recent years, modern transportation and the movement of people have facilitated the expansion of its markets, distribution and use(157–160).
•
57
DiSCUSSion
The use of khat is moving from traditional areas of consumption, which are close to the produc-tion areas, into new markets(157). In Ethiopia, the behaviour is cutting across socio-demographic and geographic boundaries and becoming popular in the cities and towns, as well in environments of higher education(158). The unfavourable global coffee market in recent years has also lead to a considerable upsurge of khat production among traditional coffee growers in Ethiopia. Thus, it has been reported that an estimated 75 % of all coffee farmers in the highlands of Hararghe have either uprooted coffee trees to plant khat or are growing both(159). During 1999–2004, khat export accounted for up to 15 % of the total value of exports and become the second largest earner of foreign exchange. During the same period, earnings from coffee, pulses, and cereals dropped considerably, while those from fruit and vegetables have remained low(158).
A distinct rural-urban divide has been described with regard to the khat use behaviour in Ethiopia. While farmers chew khat mainly to enhance their energy and for concentration in agricultural labour, city dwellers chew increasingly for recreation or pleasure. Farmers in khat growing areas chew khat more often in the morning, in preparation for work, while urban dwell-ers typically start chewing after lunchtime(160).
The expansion of khat markets and use has led to rising concerns of its ill effects on health and economy of the society. Increasing occurrence of motor vehicle accidents (particularly along the main highway to the eastern part of the country) is often attributed to impaired judgment of drivers following the use of khat. Drivers commonly use khat to postpone fatigue and sleep while at work. However, elevated mood during khat use or extended sleep deprivation may both lead to poor judgment and predispose to accidents.
Use of khat in non-traditional (urban) settings is often followed by alcohol consumption, which is meant to break the prolonged insomnia and depressive effects. Cigarette smoking is also a common accessory of the khat chewing ceremony when the latter is practiced in groups, for recreational purposes mainly in urban settings. Increased desire to smoke has been documented to be more common in khat chewing sessions(161).
The prevalence of khat chewing in many populations in Ethiopia exceeds that of cigarette smoking, and khat use is often an entry point to smoking. Increased desire to smoke and con-sume alcohol, as well as increased tolerance to these substances, are commonly observed among habitual khat chewers.
The habitual use of khat is associated with adverse effects on the central nervous system(162), gastrointestinal tract(163), and the cardiovascular system(163). Cardiovascular effects of khat chew-ing in humans include elevated blood pressure and increases in heart rate, the latter increasing myocardial oxygen consumption(99,163–165).
The rise in blood pressure has immediate onset and lasts 3–4 hours after the khat chewing session ends(165,156). However, the effect can last up to 24 hours. A significant and progressive increase of systolic and diastolic blood pressure has been demonstrated in an experimental study on healthy volunteers(99).
Cathinone increases blood pressure and heart rate through noradrenaline (norepinephrine) release from peripheral neurons similar to amphetamine(154). Controlled studies in human vol-unteers have shown increases in blood pressure after chewing khat corresponding with raised plasma cathinone concentrations(165).
DiSCUSSion
58
Studies in Yemen have suggested that heavy khat chewing is a major and independent risk factor for the development of AMI(161,166). The amphetamine like action of cathinone together with its peripheral catecholamine releasing effects(164,165,167) increase the oxygen demand of the heart, promote catecholamine mediated platelet aggregation and cause coronary vasospasm, which are also the potential mechanisms for AMI after amphetamine abuse(168).
Khat chewing carries a potential cardiovascular risk especially in patients with hypertension and heart disease, and might precipitate the occurrence of cerebrovascular accidents (stroke) and myocardial infarction (heart attack) in susceptible individuals.(169). Thus the potential cardio-vascular effects of khat could be crucial in urban populations of Ethiopia where a considerable proportion of adults have elevated blood pressure and consume khat regularly. Studies have yet to find out whether or not chronic use of khat leads to sustained high blood pressure in popula-tions where the behaviour is prevalent.
6.9 Strengths and LimitationsThis work represents the largest population based survey, to date, that involves anthropometric and blood pressure measurements among adults in Ethiopia. We employed a standardized method and instrument – the WHO STEPS – that allows comparison across populations and over time, thereby contributing to tracking the course of the epidemiological transition in Ethiopia and other developing countries. The use of standard methods and instruments, as well as the large sample size and the probability sampling technique, will have contributed to optimum internal validity and reliability of our measurements.
The population of Addis Ababa constituted the urban sample in our study while the rural sample comes from Butajira District. Although an estimated 25 % of the urban population of Ethiopia lives in Addis Ababa, it is difficult to conclude that the Addis population will be representative of all urban populations in the country. The representativeness of the urban and rural popula-tion samples to the corresponding strata in the whole country is limited due to possibly marked diversity in socioeconomic and cultural background of different populations in the country. Thus, generalizability of our findings may be limited on the basis of socio cultural characteristics.
Data used in the present study were generated in two different time points; 2003/04 in Butajira and 2006 in Addis Ababa. However, we believe that the time lapse of two to three years between the two surveys will have little effect on comparison of the main variables of interest- prevalence of risk factors across the two populations.
The scope of this study is limited to dietary and lifestyle related risk factors of CVD, which excludes the disease entities, although some of the risk factors, such as hypertension and obesity, are also disease entities. Measuring the distribution of CVD, such as ischaemic and cerebrovas-cular heart diseases, at a population level presents considerable diagnostic difficulties and would be resource intensive. Such efforts will be constrained by poor feasibility and cost-effectiveness, and the information will have little relevance for public health interventions once diseases are established. Therefore, population based surveillance efforts related to CVD and other chronic diseases are bound to rely on practical and cost-effective methods of assessment of common risk factors rather than disease entities.
As the present work represents an initial attempt to implement STEPS in Ethiopia, only the first two STEPS, behavioural and physical measurements, have been conducted. Biochemical
•
59
DiSCUSSion
methods for assessment of serum glucose and lipids would enable to draw a more comprehensive picture on the epidemiology of the classical CVD risk factors. It is believed that measurement of these biomarkers will be included in future surveillance undertakings.
The present study does not address heart diseases with infectious aetiology, such as rheumatic heart disease, or their sequelae, which may be important in the epidemiology of CVD in devel-oping countries like Ethiopia.
6.10 Implications for policyThe burden of CVD and their risk factors is growing in Ethiopia as in other parts of the world. However, the current system of health information in the country does not allow making a direct estimate of the disease burden in quantitative terms. On the other hand, the magnitude of CVD risk factors in urban populations, such as sub-optimal blood pressure, overweight/obesity and physical inactivity suggest that CVD could be an important and growing cause of morbidity, mortality or disability in this population.
The burden of CVD is not well recognized or addressed due to lack of reliable data on disease burden, and as the health system is geared largely towards dealing with communicable diseases. CVD and other chronic diseases present a double burden to the health system that is already overstretched by communicable diseases and malnutrition. Policies that aim to improve the health and wellbeing of the population will have to deal with the double burden of diseases in equitable and cost-effective manner.
Understanding of the chronic disease burden would be valuable for policy and planning, which consequently guide priority setting and resource allocation. Featuring chronic diseases in the health and development agenda should not be considered as a threat to current disease control priorities or violate equitable distribution of resources. There is a need for evidence based, rational resource allocation that takes into account the current and future burden of diseases. The experience from developed countries demonstrates that prevention and control of chronic disease risk factors today will have significant health and economic returns in reducing future burden of disease.
The level of CVD risk factors, such as high blood pressure in Addis presents challenge to health authorities and policy makers for an immediate intervention. In parallel, there is also a need to build the empirical evidence base to characterize the distribution of disease burden. This involves, among others, setting up a system for registration of vital events at a population level, surveillance of CVD risk factors using the STEPS approach, and producing “verbal autopsy” data from demographic surveillance (sentinel) sites. Integrating risk factor and mortality surveillance on existing demographic surveillance, such as in BRHP offers a practical option in Ethiopia until a vital registration system becomes operational at a nationwide scale.
The burden of high blood pressure and other CVD risk factors also presents a challenge on the choice or appropriate balance between primary and secondary prevention strategies, or between population-wide and individual-based targets of intervention. The high-risk approach for the primary prevention of CVD aims to identify individuals at high risk of disease and target them for intervention, while the population approach aims to reduce the level of risk factors in the population(69).
Focusing on high-risk individuals may reduce costs at the population level as the interven-tion targets fewer people, while on the other hand, it might incur an additional cost of screening
DiSCUSSion
60
to identify individuals at high risk(1). The cost effectiveness of a given strategy depends on the prevalence of individuals at high risk in the population and the cost of identifying them, compared with the cost of strategies available for reducing or preventing high blood pressure(1).
The high-risk approach is the conventional approach in clinical practice where individuals are the targets of treatment. In contrast, the population approach is built on the premise that most CVD cases occur among larger number of individuals at lower levels of absolute risk rather than among the small number of individuals at greater risk(69).
A balanced mix of both the high-risk and population-based strategies may offer a more cost-effective alternative. Comprehensive approaches to controlling CVD that combine population-based and individual-based interventions have proved successful in many countries. Experiences in Finland have shown that a comprehensive national strategy that combines population-based primary prevention with health promotion and improved access to treatment was associated wit a 60% reduction in mortality rates from CVD over a 25-year period(170). A long-term commu-nity based CVD prevention programme that combines population and individual strategies in Sweden has proved effective in shifting the distribution of CVD risk favourably in a high-risk population(68).
In light of limited access to health services and the poor socioeconomic status in Ethiopia, the high-risk strategy may not be a feasible option at present. Instead, targeting a set of risk fac-tors at the population level may offer an opportunity to address the main chronic diseases in a cost-effective manner. Thus, population-based primary prevention interventions should receive priority attention.
In urban settings, where CVD risk factors are more concentrated and access to health care is better, it would be vital to integrate primary and secondary prevention of CVD. Individuals may be evaluated for their overall risk of CVD morbidity and mortality based on their risk factor profile, and provided with clinical care, which may involve drug treatment along with dietary and lifestyle modifications. Improving the level of awareness, detection and clinical care for high blood pressure should constitute an important strategy in the secondary prevention and control of high blood pressure, particularly among the urban population of Ethiopia.
•
61
ConCLUSion anD rECoMMEnDaTionS
7. Conclusions and Recommendations
Elevated blood pressure is a crucial precursor of cerebrovascular disease and ischaemic heart disease (stroke and myocardial infarctions) in Africa and other parts of the world. Available epidemiological evidence in Ethiopia and many parts of Africa indicate that a quarter or more of the adult population has high blood pressure. The magnitude is even larger when considering sub-optimal blood pressure levels in populations (SBP >= 115 mmHg), and the fact that most of the high blood pressure is under-diagnosed or under-treated.
The prevalence of elevated blood pressure and its antecedent risk factors (overweight and obes-ity, physical inactivity and poor dietary behaviours) are generally more concentrated in urban populations compared to their rural counterparts in Ethiopia. In light of the disproportionate access to diagnostic and treatment facilities among females and rural populations, prevention and control interventions should not be limited to urban populations alone. However, immediate priority needs to be given to urban populations with higher burdens of disease and risk factors. In the long term, these interventions ought to be expanded and adapted to rural populations. As primary prevention strategies will have to target the main modifiable risk factors for elevated blood pressure, they are bound to focus on populations where these risk factors are more con-centrated, in urban settings.
The distribution of behavioural risk factors of CVD, such as cigarette smoking, binge drink-ing of alcohol and khat chewing, vary depending on socioeconomic and agro ecological context, without distinct gradient between rural and urban populations. On the other hand there is an apparent concern that these variations are narrowing down due to the rapid spread of these behaviours across traditional barriers. Thus, there is a need to implement context-specific as well as cross-cutting interventions against the spread of these risk behaviours. Populations with higher concentrations of one or the other behavioural risk factor may benefit from appropriate reorientation of priorities and redistribution of resources.
In general however, the urban population could be regarded as the epicentre of the growing epidemic of CVD and associated risk factors, as most of the physiological risk factors are dispro-portionately concentrated among this section of the population. Rapid exposure to influences of urbanization and globalization means that the brunt of the problem falls on this segment of the population before it gradually diffuses to the wider rural population. The urban population is also more accessible and receptive to public health interventions, thereby serving as a suitable ground for development of effective interventions and accumulation of experiences. Lessons learned could then be adapted and transferred to rural populations more effectively.
Public awareness on the burden of high blood pressure in the population and its significance to health and national development has to be promoted in order to attain the necessary level of commitment and resources for effective interventions. Alongside primary prevention, disease control efforts should aim to improve the awareness, detection and treatment of elevated blood pressure at every health care contact.
ConCLUSion anD rECoMMEnDaTionS
62
Efforts have to be made to curtail proliferation of unhealthy changes in dietary and lifestyle behaviours, such as the consumption of processed (fast) foods, alcohol, tobacco and khat, which may accompany the rapid socioeconomic growth that Ethiopia has envisaged over the next two decades. There is an urgent need to ratify and implement the global framework convention on tobacco control (FCTC) that the country has already signed. Strategies that proved to be effective in other parts of the world, such as increased taxation, bans on advertising, the introduction of smoke-free public environments, and smoking cessation programmes should be implemented as applicable.
There is a need to establish a firm evidence base on the magnitude and distribution of high blood pressure and related risk factors from a nationwide representative sample of urban and rural populations. Strong empirical evidence is needed to draw attention of policy makers, and the public at large, to the problem of CVD in general, and hypertension in particular. Such data could be generated through surveillance processes using the STEPS approach. Surveillance data will guide policy and programme interventions and help to monitor and evaluate progress towards the prevention and control goals.
Registration of vital events, such as birth and death, through a nationwide system of civil registration is essential to generate and update information on the population structure. Simi-larly, recording and reporting of causes of death at health facilities need to be improved and be complemented with selected population-based “verbal autopsy” data. Data on age at death and causes of death will be useful for estimating age- and cause-specific rates of mortality, which in turn will be vital for planning interventions and tracking the course of the epidemiological transi-tion. The recent national health strategy, which involves the training and deployment of health extension workers at each rural kebele, offers a great opportunity for implementing registration of births and deaths at the population level.
Until such time that the STEPS instrument could be applied in full (including the third step of biochemical measurements), secondary data on blood glucose and lipids may be generated from selected health institutions, in order to supplement the behavioural, physiological, and dietary information from STEPS.
Future studies also need to assess the level of awareness, treatment, and control of high blood pressure, as well as its economic costs on the individual and the health system. The economic and social consequences of diabetes mellitus and other chronic diseases should also receive due attention in future research, as these diseases involve lifelong medical care and social support with significant socioeconomic burden to the individual and the society at large.
•

63
rEFErEnCES
8. References
1. World Health Organization. The World Health Report 2002: Reducing Risks, Promoting Healthy Life. Geneva: WHO 2002.
2. The Health of the People: the Africa regional health report. WHO Africa Regional Health Office. 2007. 3. WHO AFRO. Cardiovascular diseases in the African Region: Current Situation and Perspectives. Report
of the Regional Director. Fifty-fifth session. Maputo, Mozambique, 22-26 august 2005. AFR/RC55/12. 17 June 2005. Available at: http://www.afro.who.int/rc55/documents/afr_rc55_12_cardiovascular.pdf (ac-cessed on 16 July 2007).
4. Steyn K, Sliwa K, Hawken S, Commerford P, Onen C, Damasceno A, Ounpuu S, Yusuf S. for the INTERHEART Investigators in Africa. Risk factors associated with myocardial infarction in Africa. The INTERHEART Africa Study. Circulation 2005;112:3554-3561.
5. Yusuf S, Hawken S, Ounpuu S, Dans T, Avezum A, Lanas F, McQueen M, Budaj A, Pais P, Varigos J, Lisheng L. On behalf of the INTERHEART Study Investigators. Effects of potentially modifiable risk factors associated with myocardial infarction in 52 countries (the INTERHEART study): case-control study. Lancet 2004;364:937-952.
6. World Health Organization. Preventing Chronic Diseases: a vital investment. 2005. http://www.who.int/chp/chronic_disease_report/full_report.pdf (accessed on Dec 24, 2007).
7. Stevens P. Diseases of Poverty and the 10/90 Gap. International Policy Network, London, 2004.
8. Abegunde D, Mathers C, Adam T, Ortegon M, Strong K. The burden and costs of chronic disease in low-income and middle-income countries. Lancet 2007;370:1929-1938.
9. Steyn K, Jooste PL, Bourne L, Fourie J, Badenhorst CJ, Bourne DE, et al. Risk factors for coronary ar-tery disease in the black population of the Cape Peninsula: the BRISK study. S Afr Med J. 1991;79:480-485.
10. Mamo Y, Oli K. Trends of acute myocardial infarction admissions over a decade in Tikur Anbessa Hospi-tal. Ethiop Med J. 2001;39:193-202.
11. Hakim JG, Odwee MG, Siziya S, Ternouth I, Matenga J. Acute myocardial infarction in Zimbabwe: the changing scene of coronary artery disease. Cent Afr J Med. 1995;41:303-308.
12. Muna WF. Cardiovascular disorders in Africa. World Health Stat Q. 1993;46:125-133.
13. Akinboboye O, Idris O, Akinkugbe O. Trends in coronary artery disease and associated risk factors in sub-Saharan Africans. J Hum Hypertens. 2003;17:381-387.
14. Gribble JN (eds). The Epidemiological Transition: Policy and Planning Implications for Developing Countries. National Research Council. Workshop Proceedings. National Academy Press. Washington D.C. 1993.
rEFErEnCES
64
15. Setel P, Macfarlane S, Szreter S, Mikkelsen L, Jha P, Stout S, AbouZahr C, on behalf of the Monitoring of Vital Events (MoVE) writing group. A scandal of invisibility: making everyone count by counting everyone. Lancet 2007;370:1569-77.
16. Mathers CD, Ma Fat D, Inoue M, Rao C, Lopez AD. Counting the dead and what they died from: an assessment of the global status of cause of death data. Bull World Health Organ 2005;83: 171–177.
17. Lopez AD: Causes of death: an assessment of global patterns of mortality around 1985. World Health Stat Q 1990; 43:91-104.
18. Suhrcke M, Nugent R A, Stuckler D, Rocco L. Chronic disease: an economic perspective. London: The Oxford Health Alliance, 2006.
19. Federal Ministry of Health, Ethiopia. Health and Health Related Indicators 2005/6. Planning and Pro-gramming Department. Addis Ababa, 2006.
20. Abdulahi H, Mariam DH, Kebede D. Burden of disease analysis in rural Ethiopia. Ethiop Med J. 2001;39:271-81.
21. Population Division of the Department of Economic and Social Affairs of the United Nations Secre-tariat, World Population Prospects: The 2006 Revision and World Urbanization Prospects: The 2005 Revision. Available at; http://www.un.org/esa/population/publications/wpp2006/wpp2006.ht (accessed on Dec 31, 2007).
22. Unicef. Information by country. Basic Indicators- Ethiopia. http://www.unicef.org/infobycountry/ethiopia_statistics.html (accessed on 31 December 2007)
23. World Bank. World development indicators 2006. Washington DC: World Bank. 2006.
24. Central Statistical Authority (CSA) [Ethiopia]. Statistical abstract of Ethiopia. Addis Ababa, Ethiopia: Central Statistical Authority. 2000.
25. International Monetary Fund. Public Information Notice (PIN) No. 07/68. June 15, 2007.
26. The Earth Institute at Columbia University. Program for National Health Development in Ethiopia. Mil-lennium Development Goals. Available at; http://cnhde.ei.columbia.edu/ethmdg/health/ (accessed on 31 Dec 2007).
27. Ministry of Finance and Economic Development (MoFED) [Ethiopia]. Ethiopia: Building on progress: A plan for accelerated and sustained development to end poverty (PASDEP), 2005/06-2009/10. Addis Ababa, Ethiopia: Ministry of Finance and Economic Development. 2005
28. Ezzati M, Vander Hoorn S, Lawes CMM, Leach R, James WPT, Lopez AD, Rodgers A, Murray CJ. Rethinking the “Diseases of Affluence” Paradigm: Global Patterns of Nutritional Risks in Relation to Economic Development. PLoS Med 2005;2(5): e133.
29. Transitional Government of Ethiopia (TGE). Health policy of the transitional Government of Ethiopia. Ad-dis Ababa, Ethiopia: Transitional Government of Ethiopia. 1993.
30. Federal Ministry of Health, Ethiopia. Health Sector Development Programme (HSDP) I, 1997/8 - 2001/02. 1997.
•
65
rEFErEnCES
31. Federal Ministry of Health, Ethiopia. Health Sector Development Programme (HSDP) II, 2002/03-2004/05. 2002.
32. Federal Ministry of Health, Ethiopia. Health Sector Development Programme (HSDP) III, 2005/06- 2009/10. June 2005.
33. Melaku Z, Alemayehu M, Oli K, Tizazu G. Pattern of admissions to the medical intensive care unit of Addis Ababa University Teaching Hospital. Ethiop Med J. 2006;44:33-42.
34. Zenebe G, Alemayehu M, Asmera J. Characteristics and outcomes of stroke at Tikur Anbessa Teaching Hospital, Ethiopia. Ethiop Med J. 2005;43:251-9.
35. Fikreyesus Y, Bahta Y. Myocardial infarction in the Tikur Anbessa Teaching Hospital. A five-year review. Ethiop Med J. 1989;27:55-61.
36. World Health Organization. Global Burden of Deaths and DALYs. http://www.who.int/healthinfo/statistics/bodgbddeathdalyestimates.xls
37. Ng N, Minh HV, Tesfaye F, Bonita R, Byass P, Stenlund H, Weinehall L, Wall S. Combining risk factors and demographic surveillance: Potentials of WHO STEPS and INDEPTH methodologies for assessing epidemiological transition. Scand J Public Health 2006; 34:199-208.
38. Sen K, Bonita R. Global health status: two steps forward, one step back. Lancet 2000;356:577–82.
39. Mathers CD, Lopez AD, Murray CJL. The burden of disease and mortality by condition: data, methods and results for 2001. In: Lopez AD, Mathers CD, Ezzati M, Jamison DT, Murray CJL, eds. Global burden of disease and risk factors. New York: Oxford University Press, 2006: 45–240.
40. Murray CJL, Lopez AD, eds. The global burden of disease: a comprehensive assessment of mortality and disability from diseases, injuries and risk factors in 1990 and projected to 2020. Cambridge: Harvard University Press, 1996.
41. Lopez AD, Mathers CD, Ezzati M, Jamison DT, Murray CJL. Global and regional burden of disease and risk factors, 2001: systematic analysis of population health data. Lancet 2006;367:1747-1757
42. Lee M-J, Popkin BM, Kim S. The unique aspects of the nutrition transition in South Korea: the reten-tion of healthful elements in their traditional diet. Public Health Nutr 2000; 5:197-203.
43. Popkin BM. An overview on the nutrition transition and its health implications: the Bellagio meeting. Public Health Nutrition 2002; 5:93-103.
44. Popkin BM, Horton S, Kim S, Mahal A, Shuigao J. Trends in diet, nutritional status and diet-related noncommunicable diseases in China and India: The economic costs of the nutrition transition. Nutrition Reviews 2001; 59: 379-90.
45. Blood Pressure Lowering Treatment Trialists’ Collaboration. Effects of different blood-pressure-lowering regimens on major cardiovascular events: results of prospectively-designed overviews of randomised trials. Lancet 2003;362:1527-35.
rEFErEnCES
66
46. Heart Protection Study Collaborative Group. MRC/BHF Heart protection Study of cholesterol-lowering with simvastatin in 5963 people with diabetes: a randomised placebo-controlled trial. Lancet 2003;361:2005-16.
47. de Lorgeril M, Salen P, Martin JL, Monjaud I, Delaye J, Mamelle N. Mediterranean diet, traditional risk factors, and the rate of cardiovascular complications after myocardial infarction: final report of the Lyon Diet Heart Study. Circulation 1999;99:779-85.
48. Parish S, Collins R, Peto R, Youngman L, Barton J, Jayne K, Clarke R, Appleby P, Lyon V, Cederholm-Williams S, et al. Cigarette smoking, tar yields, and non-fatal myocardial infarction: 14000 cases and 32000 controls in the United Kingdom. BMJ 1995; 311:471-77.
49. Doll R, Peto R, Boreham J, Sutherland I. Mortality in relation to smoking: 50 years’ observations on male Brithish doctors. BMJ 2004;328:1519-28.
50. Stampfer MJ, Hu FB, Manson JE, Rimm EB, Willett WC. Primary prevention of coronary heart disease in women through diet and lifestyle. N Engl J Med 2000;343:16-22.
51. Hossain P, Kawar B, El Nahas M. Obesity and Diabetes in the Developing World – A Growing Chal-lenge. N Engl J Med 2007 356:213-15
52. Diabetes Atlas, third edition. International Diabetes Federation 2006. Available at: www.eatlas.idf.org/ (accessed on 31 December 2007).
53. Raz I, Levinger S, Maravi Y, Sigelmann N, Shananas M, Bursztyn M. Prevalence of glucose intolerance in young male Ethiopian immigrants. Isr J Med Sci 1993;29:347-50
54. Rubinstein A, Graf E, Villa Y. Prevalence of diabetes mellitus in Ethiopian immigrants: comparison of Moses and Solomon immigrations. Isr J Med Sci 1993;29:344-6.
55. Cohen MP, Stern E, Rusecki Y, Zeidler A. High prevalence of diabetes in young adult Ethiopian immi-grants to Israel. Diabetes 1998;37:824-828
56. Rubinstein A, Grosskop I, Charach G, Levtov O, Geter R, Villa Y, Goldbourt U. Lipids and lipo-proteins among Ethiopian immigrants: comparison of operations Solomon and Moses. Isr J Med Sci 1993;29:354-9.
57. Bursztyn M, Raz I. Blood pressure and insulin in Ethiopian immigrants: longitudinal study. J Hypertens 1993;11:455-9
58. Beaglehole R, Yach D. Globalization and the prevention and control of non-communicable disease: the neglected chronic diseases of adults. Lancet 2003;362: 903-908.
59. World Bank. World Development Report 1993: Investing in Health. New York: Oxford University Press for the World Bank, 1993.
60. Seedat YK. Hypertension in developing countries in sub-Saharan Africa. J Hum Hypertension 2000; 14:739−747.
•
67
rEFErEnCES
61. van der Sande MA, Coleman RL, Schim van der Loeff MF, McAdam KP, Nyan OA, Thien T, Dolmans WM, Walraven GE. A template for improved prevention and control of CVD in sub-Saharan Africa. Health Pol Plann 2001;16:345-350.
62. Gwatkin DR, Gullot M, Heuveline P. The burden of disease among the global poor. Lancet 1999; 354: 586-89.
63. Rosamond WD, Folsom AR, Chambless LE, Wang CH; ARIC Investigators. Atherosclerosis Risk in Communities. Coronary heart disease trends in four United States communities. Int J Epidemiol 2001; 30(Suppl.):S17-S22.
64. Beaglehole R, Saracci R, Panico S. Cardiovascular diseases: causes, surveillance and prevention. Int J Epidemiol 2001; 30:S1-S4.
65. Hunink MG, Goldman L, Tosteson AN, Mittleman MA, Goldman PA, Williams LW, Tsevat J, Wein-stein MC. The recent decline in mortality from coronary heart disease, 1980-1990. The effect of secular trends in risk factors and treatment. JAMA 1997;277:535-42.
66. Kuulasmaa K, Tunstall-Pedoe H, Dobson A, Fortmann S, Sans S, Tolonen H, Evans A, Ferrario M, Tuomilehto J. Estimation of contribution of changes in classic risk factors to trends in coronary-event rates across the WHO MONICA Project populations. Lancet 2000; 355:675-87.
67. Bonita R, de Courten M, Dwyer T, Jamrozik K, Winkelmann R. Surveillance of risk factors for noncom-municable diseases: The WHO STEPwise approach. Summary. World Health Organization: Geneva, 2001 ( http://www.who.int/chp/steps).
68. Weinehall L, Westman G, Hellsten G, Boman K, Hallmans G, Pearson TA, Wall S. Shifting the distribu-tion of risk: results of a community intervention in a Swedish programme for the prevention of cardio-vascular disease. J Epidemiol Community Health 1999;53:243-250.
69. Rose G. The strategy of preventive medicine. Oxford: Oxford University Press; 1992.
70. Rodgers A, Ezzati M, Vander Hoorn S, Lopez AD, Lin RB, Murray CJ; Comparative Risk Assessment Collaborating Group. Distribution of major risks: Findings from the global burden of disease study. PLoS Med 2004;1(1):e27.
71. World Health Organization. The World Health Report 2003- Shaping the future. Geneva: WHO;2003.
72. Murray CJ, Lauer JA, Hutubessy RC, Niessen L, Tomijima N, Rodgers A, Lawes CM, Evans DB. Effec-tiveness and costs of interventions to reduce systolic blood pressure and cholesterol: A global and regional analysis on reduction of cardiovascular-disease risk. Lancet 2003; 361: 717-725.
73. Framingham Heart Study. Available at; http://www.nhlbi.nih.gov/about/framingham/index.html. (accessed on 31 Dec 2007).
74. Nurses’ Health Study. Available at; http://www.channing.harvard.edu/nhs/ (accessed on 31 Dec 2007).
75. Physicians’ Health Study. Available at; http://phs.bwh.harvard.edu/ (accessed on 31 Dec 2007)
rEFErEnCES
68
76. Puska P. The North Karelia project: 20 year results and experiences. Helsinki: National Public Health Institute, 1995.
77. World Health Organization- MONICA (Multinational MONItoring of trends and determinants in CArdiovascular disease) Project. Available at; http://www.ktl.fi/monica/ (accessed on 31 Dec 2007).
78. CARMEN (Conjunto de Acciones para la Reducción Multifactorial de Enfermedades Notransmissibles) Initiative. An Initiative for Integrated Noncommunicable Disease Prevention in the Americas. Available at; http://ncd.bvsalud.org/carmen/en/ (accessed on 31 Dec 2007)
79. Armstrong T, Bonita R. Capacity building for an integrated noncommunicable disease risk factor surveil-lance system in developing countries. Ethn Dis. 2003;13 (Suppl 2):S13-8.
80. Nishtar S, Bile KM, Ahmed A, Amjad S, Iqbal A. Integrated population-based surveillance of noncom-municable diseases: the Pakistan model. Am J Prev Med. 2005; 29 (Suppl 1):102-6.
81. Omran A. The Epidemiologic Transition: A Theory of the Epidemiology of Population Change. The Milbank Memorial Fund Quarterly 1971; 49,509–38.
82. Caldwell JC. Population health in transition. Bull World Health Organ 2001;79: 159-160.
83. Economic Commission for Africa. The State of Demographic Transition in Africa. Food Security and Sustainable Development Division (FSSDD). ECA/FSSDD/01/10. 2001. Available at; www.uneca.org.
84. An overview on the nutrition transition and its health implications: the Bellagio meeting. Public Health Nutrition 2002; 5(1A), 93–103. DOI: 10.1079/PHN2001280.
85. Central Statistical Agency of Ethiopia. The 2006 National Statistics. http://www.csa.gov.et/text_files/2006_national_statistics.htm (accessed on 31 Dec 2007)
86. Central Statistical Agency [Ethiopia] and ORC Macro. Ethiopia Demographic and Health Survey 2005. Addis Ababa, Ethiopia and Calverton, Maryland, USA: Central Statistical Agency and ORC Macro 2006.
87. Berhane Y, Byass P. Butajira DSS Ethiopia. In: INDEPTH Network (eds). Population and health in de-veloping countries. 2002; Volume 1. Part III. INDEPTH DSS Site Profiles. International Development Research Centre (http://www.idrc.ca)
88. Berhane Y, Wall S, Kebede D, Emmelin A, Enquselassie F, Byass P, et al. Establishing an epidemiological field laboratory in rural areas – potentials for public health research and interventions. The Butajira Rural Health Programme 1987-1999. Ethiop J Health Dev 1999; 13 (Special Issue) 1-47.
89. Central Statistical Authority (CSA) [Ethiopia]. The 1984 Population and Housing Census of Ethiopia. Analytical Report at National Level. Addis Ababa, Ethiopia: Central Statistical Authority. 1991.
90. Central Statistical Authority (CSA) [Ethiopia]. The 1994 Population and Housing Census of Ethiopia. Results at Country Level. Vol. 1. Statistical Report. Addis Ababa, Ethiopia: Central Statistical Authority. 1998.
•
69
rEFErEnCES
91. World Health Organization. Chronic diseases and health promotion. STEPwise approach to surveillance (STEPS). STEPS Manual. Available at; http://www.who.int/chp/steps/manual/en/index5.html (accessed on 31 Dec 2007).
92. World Health Organization. Chronic diseases and health promotion. STEPwise approach to surveillance (STEPS). Available at; http://www.who.int/chp/steps (accessed on 31 Dec 2007).
93. Central Statistical Agency, Federal Democratic Republic of Ethiopia. Household Income, Consumption, and Expenditure Survey 2004/5. Analytical Report. Volume I. Statistical Bulletin 394. Addis Ababa 2007.
94. Central Statistical Authority, Federal Democratic Republic of Ethiopia. Report on the 1999/2000 house-hold income, consumption and expenditure survey. Statistical Bulletin 2001; 258. Addis Ababa 2001.
95. FAO/WHO/UNU. Human energy requirements. Report of a joint FAO/WHO/UNU expert consulta-tion. FAO Food Nutr Tech Rep Ser 2004; 1: 92–96.
96. Livingstone MBE, Black AE. Markers of the validity of reported energy intake. J. Nutr. 2003;133:895S-920S.
97. Johansson G, Wikman A, Ahren AM, Hallmans G and Johansson I. Underreporting of energy intake in repeated 24-hour recalls related to gender, age, weight status, day of interview, educational level, reported food intake, smoking habits and area of living. Public Health Nutr. 2001. 4(4), 919-927.
98. Alem A, Kebede D, Kullgren G. The epidemiology of problem drinking in Butajira, Ethiopia. Acta Psy-chiatri Scand Suppl. 1999;397:77-83.
99. Hassan NA, Gunaid AA, Abdo-Rabbo AA, Abdel-Kader ZY, alMansoob MA, Awad AY, Murray-Lyon IM: The effect of Qat chewing on blood pressure and heart rate in healthy volunteers. Trop Doct 2000;30:107-8.
100. Mion G, Oberti M, Ali AW. Hypertensive effects of qat. Med Trop (Mars). 1998;58:266-8 .
101. Al-Motarreb A, Briancon S, Al-Jaber N, Al-Adhi B, Al-Jailani F, Salek MS and Broadley KJ. Khat chewing is a risk factor for acute myocardial infarction: a case-control study. Br J Clin Pharmacol 2004;59:574-581.
102. Al-Motarreb A, Baker K, Broadley KJ. Khat: Pharmacological and medical aspects and its social use in Yemen. Phytother Res 2002;16:403–13.
103. Cooper RS, Amoah AG, Mensah GA. High blood pressure: the foundation for epidemic cardiovascular disease in African populations. Ethn Dis 2003;13: S48-52.
104. Lewington S, Clarke R, Qizilbash NF, Peto R, Collins R. Age specific relevance of usual blood pressure to vascular mortality: a meta-analysis of individual data for one million adults in 61 prospective studies. Lancet 2002;360:1903–13.
105. Chobanian AV, Bakris GL, Black HR, Cushman WC, Green L, Izzo JL, et al. Seventh report of the Joint National Committee on Prevention, Detection, Evaluation, and Treatment of High Blood Pressure. Hypertension 2003;42:1206–52.
rEFErEnCES
70
106. Seedat YK. Recommendations for hypertension in sub-Saharan Africa. Cardiovasc J S Afr. 2004;15:157–158.
107. Edwards R, Unwin N, Mugusi F, Whiting D, Rashid S, Kissima J, Aspray TJ, Alberti KG. Hypertension prevalence and care in an urban and rural area of Tanzania. J Hypertens 2000;18:145–52.
108. van der Sande MA, Milligan PJ, Nyan OA, Rowley JT, Banya WA, Ceesay SM, Dolmans WM, Thien T, McAdam KP, Walraven GE. Blood pressure patterns and cardiovascular risk factors in rural and urban Gambian communities. J Hum Hypertens 2000;14:489–96.
109. Kearney PM, Whelton M, Reynolds K, Muntner P, Whelton PK, He J. Global burden of hypertension: analysis of worldwide data. Lancet. 2005; 365:217–223.
110. Addo J, Smeeth L, Leon DA. Hypertension In Sub-Saharan Africa: A Systematic Review. Hypertension published online Oct 22, 2007; DOI: 10.1161/HYPERTENSIONAHA.107.093336.
111. Steyn K, Damasceno A. Lifestyle and Related Risk Factors for Chronic Diseases. In Disease and Mortal-ity in Sub-Saharan Africa (eds). Second edition. 2006 The World Bank.
112. Norman R, Gaziano T, Laubscher R, Steyn K, Bradshaw D; South African Comparative Risk Assess-ment Collaborating Group. Estimating the burden of disease attributable to high blood pressure in South Africa in 2000. S Afr Med J. 2007;97:692-8.
113. Nissinen A, Bothig S, Granroth H, Lopez AD. “Hypertension in Developing Countries.” World Health Statistics Quarterly 1988;41:141–54.
114. Agyemang C. Rural and urban differences in blood pressure and hypertension in Ghana, West Africa. Public Health 2006;120:525–533.
115. World Health Organization Global InfoBase online. Available at; http://www.who.int/ncd_surveillance/infobase/ (accessed on 31 Dec 2007).
116. Kamadjeu RM, Edwards R, Atanga JS, Kiawi EC, Unwin N .Mbanya J-C. Anthropometry measures and prevalence of obesity in the urban adult population of Cameroon: an update from the Cameroon Burden of Diabetes Baseline Survey. BMC Public Health 2006;6:228 doi:10.1186/1471-2458-6-228.
117. Joubert J, Norman R, Bradshaw D, Goedecke JH, Steyn NP, Puoane T; South African Comparative Risk Assessment Collaborating Group. Estimating the burden of disease attributable to excess body weight in South Africa in 2000. S Afr Med J. 2007;97:683-90.
118. Treloar C, Porteous J, Hassan F, Kasniyah N, Lakshmanudu M, Sama M, Sha’bani M, Heller F. “The Cross Cultural Context of Obesity: An INCLEN Multicentre Collaborative Study.” Health and Place 1999;5:279–86.
119. Physical activity and health: a report of the Surgeon General. Altanta (GA): US Department of Health and Human Services, Centers for Disease Control and Prevention; 1996.
120. Mora S, Cook N, Buring JE, Ridker PM, Lee IM. Physical Activity and Reduced Risk of Cardiovascular Events Potential Mediating Mechanisms. Circulation 2007;116:2110-2118.
•
71
rEFErEnCES
121. Ainsworth BE, Macera CA, Jones DA, Reis JP, Addy CL, Bowles HR, Kohl HW 3rd. Comparison of the 2001 BRFSS and the IPAQ Physical Activity Questionnaires. Med Sci Sports Exerc. 2006;38:1584-92.
122. Rutten A, Abu-Omar K. Prevalence of physical activity in the European Union. Soz Praventivmed 2004;49:281–289.
123. World Health Organization. Chronic Diseases and Health Promotion. Global Physical Activity Surveil-lance. Available at: http://www.who.int/chp/steps/GPAQ/en/index.html (accessed on 31 Dec 2007).
124. Craig CL, Marshall AL, Sjostrom M, Bauman AE, Booth ML, Ainsworth BE, Pratt M, Ekelund U, Yn-gve A, Sallis JF, Oja P. . International Physical Activity Questionnaire: 12-country reliability and validity. Med Sc Sports Exerc 2003;35:1381–1395.
125. Rutten A, Vuillemin A, Ooijendijk WT, Schena F, Sjöström M, Stahl T, Vanden Auweele Y, Welshman J, Ziemainz H. . Physical activity monitoring in Europe. The European Physical Activity Surveillance System (EUPASS) approach and indicator testing. Public Health Nutrition 2003;6:377–384.
126. Asefa M, Tessema F. Ethiopian National Health Survey Report 2003. A collaborative study. Jimma Uni-versity and World Health Organization. Jimma, Ethiopia 2006.
127. Kesaniemi YA, Danforth EJ, Jensen MD, et al. Dose-response issues concerning physical activity and health: an evidence-based symposium. Med Sci Sports Exercise 2001; 33: S351–58.
128. Pate RR, Pratt M, Blair SN, et al. Physical activity and public health: a recommendation from the Cent-ers for Disease Control and Prevention and the American College of Sports Medicine. J Am Med Assoc 1995; 273: 402–07.
129. Sobngwi E, Mbanya JC, Unwin NC, Kengne AP, Fezeu L, Minkoulou EM, Aspray TJ, Alberti KG. Physical activity and its relationship with obesity, hypertension and diabetes in urban and rural Cam-eroon. International Journal of Obesity 2002;26:1009–1016.
130. Great Ethiopian Run. Available at http://www.ethiopiarun.org/ (accessed on 31 December 2007).
131. World Cancer Research Fund. American Institute for Cancer Research 1997, WHO 2003. Tech Report Series 916.
132. Ribioli E, Norat T. Epidemiologic evidence of the protective effect of fruit and vegetables on cancer risk. American Journal of Clinical Nutrition 2003;78 Suppl:559S-69S.
133. Kaufman JS, Owoaje EE, Rotimi CN, Cooper RS. Blood Pressure Change in Africa: Case Study from Nigeria. Human Biology 1999;71: 641–57.
134. Anderson JW. Dietary fibre, complex carbohydrate and coronary artery disease. Can J Cardiol 1995;11:55G–62G.
135. Kushi LH, Meyer KA, Jacobs DR. Cereals, legumes, and chronic disease risk reduction: evidence from epidemiologic studies. Am J Clin Nutr 1999;70(Suppl): 451S–458S.
136. Slavin J, Martini MC, Jacobs DR, Marquart L. Plausible mechanisms for the protectiveness of whole grains. Am J Clin Nutr 1999;70 (Suppl):459S–463S.
rEFErEnCES
72
137. Flight I, Clifton P. Cereal grains and legumes in the prevention of coronary heart disease and stroke: a review of the literature. Eur J Clin Nut 2006;60: 1145–1159.
138. Slavin J. Whole grains and human health. Nutr Res Rev 2004;17:99–110.
139. Gebriel AH. The Supply Responsiveness of Peasant Agriculture in Ethiopia: Some Macro-econometric Results from Cereal Production. Ethiop J Econ 1998;7:67-76.
140. Corrao MA, Guindon GE, Sharma N, Shokoohi DF (eds). Tobacco Control Country Profiles. America Cancer Society, Atlanta, GA, 2000.
141. Corrao M, Guindon G, Cokkinides V, Sharma N. Building the evidence base for global tobacco control. Bull World Health Organ. 2000;78:884-90.
142. World Health Organization. Tobacco or health: a global status report. Geneva: World Health Organization; 1997.
143. Townsend L, Flisher AJ, Gilreath T, King G. A systematic literature review of tobacco use among adults 15 years and older in sub-Saharan Africa. Drug and Alcohol Dependence 2006; 84:14–27.
144. Rudatsikira E, Adbo A, Muula AS. Prevalence and determinants of adolescent tobacco smoking in Addis Ababa, Ethiopia. BMC Public Health 2007;7:176 (doi:10.1186/1471-2458-7-176.)
145. Global Youth Tobacco Survey Collaborative Group. Tobacco Use among Youth: A Cross-Country Com-parison. Tobacco Control 2002;11:252–70.
146. Lemma S, Tesfaye F. Cardiovascular disease risk factors among college students in Addis Ababa. Masters Thesis. School of Public Health, Addis Ababa University 2007. (Unpublished).
147. Kitaw Y. Socioeconomic and cultural implications of health interventions: the case of smoking in Ethio-pia. J Public Health Policy 1986;7:198-204.
148. National Tobacco Control Provisions in Ethiopia. WHO/TOH/CLH/90.3. Available at: http://www1.worldbank.org/tobacco/book/pdf/African%20Region.pdf
149. Niebuhr M. Travels through Arabia and other countries in the East. Vol. II, Edinburgh; 1792, p. 224.
150. Peters DWA. Khat: Its history, botany, chemistry and toxicology. Pharm J 1952;196: 16–18 & 36–7.
151. Radt C. Contribution à l’histoire ethnobotanique d’une plante stimulante. Le Khat au Yemen. J d’Agric Trop et de Bot Appliquée 1969;2: 215–43.
152. Khat. From Wikipedia, the free encyclopedia. Available at; http://en.wikipedia.org/wiki/Khat (accessed on 01 Jan 08).
153. Kalix P. Catha edulis, a plant that has amphetamine effects. Pharm World Sci. 1996;18:69-73.
154. Kalix P. Cathinone a natural amphetamine. Pharmacol Toxicol 1992;70:77–86.
155. Al-Motarreb A, Al-Kebsi M, Al-Adhi B, Broadley K. Khat chewing and acute myocardial infarction. Heart 2002;87:279-280.
•
73
rEFErEnCES
156. Toennes S, Kauert G. Excretion and detection of cathinone, cathine, and phenylpropanolamine in urine after khat chewing. Clinical Chemistry. 2002;48:1715-1719.
157. Anderson D, Klein A, Becherleg S, Carrier N, Hailu D. The Khat Nexus: transnational consumption in a global economy. Oxford. 2005.
158. Degol H. Should khat be banned? The development impact. International Policy Center. Number 40. July, 2007.
159. Ridder K. Some of Ethiopia’s Farmers Give Up on Coffee, Turn to Leafy Narcotic. Available at World Bank Intranet; http://go.worldbank.org/93WGLZ44E1. (Accessed on 31 Dec 2007)
160. Gebissa E. Leaf of Allah: Khat and Agricultural Transformation in Harerge, Ethiopia, 1875-1991. Inter-national Journal of African Historical studies 2005;38:177-180.
161. Al-Motarreb A, Briancon S. Al-Jaber N, Al-Adhi B, Al-jailani F, Salek MS, Broadley KJ. Khat chewing is a risk factor for acute myocardial infarction: a case-control study Br J Clin Pharmacol. 2005;59:574-581.
162. Alem A, Shibre T. Khat induced psychosis and its medico-legal implication: a case report. Ethiop Med J. 1997;35:137-139.
163. Heymann, TD, Bhupulon, A, Zureikal, NE Giles, P, Murray-Lyon, TM. Khat chewing delays gastric emptying of a semisolid meal. Alimentary and Pharmacological Therapy 1995;9:81–83.
164. Brenneisen R, Fisch HU, Koelbing U, Geisshüsler S, Kalix P. Amphetamine-like effects in humans of the khat alkaloid cathinone. Br J Clin Pharmacol. 1990;30:825-8.
165. Widler P, Mathys K, Brenneisen R, et al. Pharmacodynamics and pharmacokinetics of khat: a controlled study. Clin. Pharmacol Ther 1994;55:556–62.
166. Al-Habori M. The potential adverse effects of habitual use of Catha edulis (khat). Expert Opinion on Drug Safety. 2005;4:1145-1154.
167. Kohli J, Goldberg L. Cardiovascular effect of (–)-cathinone in the anaesthetized dog: comparison with (+)-amphetamine. J Pharm Pharmacol 1982;34: 338–40.
168. Bashour TT. Acute myocardial infarction resulting from amphetamine abuse: a spasm-thrombus inter-play? Am Heart J 1994;128:1237–9.
169. British-Yemeni Society: The impact of khat chewing on health: a re-evaluation, www.al-bab.com/bys/articles/hassan05.htm, accessed 31 Dec 07
170. World Health Organization. Innovative care for chronic conditions: building blocks for action. Geneva, World Health Organization, 2002 (unpublished document WHO/MNC/CCH/02.01).

74
•
75
aCknowLEDgMEnTS
Acknowledgements
This study would not have been realized without the foresight and enthusiastic support of Prof Stig Wall of the International School of Public Health, Umeå University. Stig has been there through the inception and development of the Surveillance of Risk Factors project for Patterning of the Epidemiologic Transition in Ethiopia and our international collaborators in Indonesia and Vietnam. Stig is a diligent mentor and a friend without border. Stig deserves my deepest gratitude and admiration.
Prof Peter Byass, my principal supervisor, has been instrumental in supporting and facilitat-ing my studies and research undertakings. I am very grateful to Peter for his valuable technical inputs to my research and for his continued encouragement- trying to build my self-reliance. I am also indebted to Prof Yemane Berhane for his valuable advice and inputs to my initial research proposal, manuscripts and dissertation.
Dr. Ruth Bonita (formerly at WHO Geneva) paved the way for my participation in the development and validation of the STEPS instrument, which subsequently evolved into the current research project. Ruth has been instrumental in the development and maturation of our multi-country project which paralleled the development of the STEPS instrument. Ruth made it possible that training and financial support was made available from the WHO to my research project. I am very grateful to the unreserved technical and financial support and encouragement Ruth provided me over the years.
Pilot testing of the STEPS instrument and the initial survey in Butajira District of Ethiopia were financially and technically supported by the WHO Geneva and the Regional Office for Africa (AFRO). The WHO has also provided me opportunities for training in Epidemiology of Chronic Diseases, and in the STEPS methodology – for which I am extremely indebted. The trainings have helped me to broaden my outlook in cardiovascular disease epidemiology and created inspiring encounters to many prominent professionals in the field- notably Prof Robert Beaglehole.
Financial support to the initial study in Butajira (in part) and the second STEPS survey in Addis Ababa City (in full) was made available by the special grant from the Swedish Council for Social and Work Life Research (FAS), No. 2003-0075. I am extremely grateful to Umeå Interna-tional School of Public Health, Epidemiology and Public Health Sciences, for providing me the Doctoral training opportunity, and for funding my research and studies. In this regard, I would also like to thank Stig Wall and Lars Weinehall, the former and current heads of Epidemiology, Umeå International School of Public Health, Epidemiology and Public Health Sciences, Umeå University.
I am very grateful to Anna-Lena Johansson, Birgitta Åström and Suzan Walter at Epidemiology, Umeå International School of Public Health, for their proficient facilitation and support in all administrative matters pertaining to my travels, accommodation and research fund. I am grateful

aCknowLEDgMEnTS
76
to Jerzy Pilch for his assistance in regards to softwares and connectivity in Umeå. I am also indebted to all the staff at Epidemiology, Umeå International School of Public Health,
and in particular, Stig and his family, and Anders and Maria Emmelin, for their friendship and for comforting me during my stay in Umeå.
The Ethiopian families in Umeå have extended their Ethiopian Hospitality, opening their homes and making me feel at home away from home. I am deeply indebted to Ato Abebe Asres and Ato Michael Mammo and their respective families for their warm friendship in a cold climate.
I would like to acknowledge my international collaborators- NG Nawi in Indonesia and H Van Minh in Vietnam- for hosting our experience sharing visits, for the fruitful partnership and the friendship.
I am very grateful to my home institution, the School of Public Health, Addis Ababa Univer-sity (formerly the Department of Community Health) and its staff for allowing and supporting me through my research and studies. I greatly appreciate the academic staff of the School of Public Health who had to bear the extra burden due to my absence from regular duties. I would also like to acknowledge the school for allowing me to use the Butajira Rural Health Program research infrastructure and database. The former Department of Community Health along with the Faculty of Medicine have kindly provided me with transportation services and administered my research fund during the field data collection in Butajira.
I am very grateful to The Ethiopian Public Health Association for administering my research funds promptly during the second survey in Addis Ababa.
I would like to thank the field research team members- data collectors, supervisors, and drivers for their tireless contributions during the fieldwork. I would like to express my sincere appreciations to the study participants in Butajira and Addis Ababa who willingly replied to our questionnaires and cooperated for physical measurements.
Last but not least, I am indebted to my family for being there and enduring my eccentric lifestyle.
•


![Cardiovascular disease [autosaved]](https://img.pdfslide.us/doc/110x75/554b2ab7b4c905d3088b4ab0/cardiovascular-disease-autosaved.jpg)