Embed Size (px)
Citation preview

ISSN 1123-3117 Rapporti ISTISAN
06/12
ISTITUTO SUPERIORE DI SANITÀ
Epidemiology of acute viral hepatitis: twenty years of surveillance through SEIEVA in Italy
and a review of the literature
Alfonso Mele, Maria Elena Tosti, Enea Spada
Andrea Mariano, Elvira Bianco and SEIEVA Collaborative Group
Centro Nazionale di Epidemiologia, Sorveglianza e Promozione della Salute

Presidente dell’Istituto Superiore di Sanità e Direttore responsabile: Enrico Garaci Registro della Stampa - Tribunale di Roma n. 131/88 del 1° marzo 1988 Redazione: Paola De Castro, Sara Modigliani e Sandra Salinetti La responsabilità dei dati scientifici e tecnici è dei singoli autori. © Istituto Superiore di Sanità 2006
Istituto Superiore di Sanità Epidemiology of acute viral hepatitis: twenty years of surveillance through SEIEVA in Italy and a review of the literature. Alfonso Mele, Maria Elena Tosti, Enea Spada, Andrea Mariano, Elvira Bianco and SEIEVA Collaborative Group 2006, v, 30 p. Rapporti ISTISAN 06/12
SEIEVA (Sistema Epidemiologico Integrato dell’Epatite Virale Acuta: Integrated Epidemiological System of Acute Viral Hepatitis) was created in 1985 at the Istituto Superiore di Sanità and started its full activity in 1986. This report is published on the occasion of twenty years of surveillance. The report deals with SEIEVA methods and the epidemiology of viral hepatitis in Italy and worldwide. The Hepatitis A Virus (HAV) circulation progressively decreased in Italy and nowadays most of people younger than 40 years lack anti-HAV immunity. In Southern regions, the ingestion of contaminated seafood still causes large outbreaks. Voyagers to endemic countries and drug addicted are also at increased risk of infection. The incidence of symptomatic hepatitis A is ~2-3/100,000/year in interepidemic periods. The impact of Hepatitis B Virus (HBV), Hepatitis Delta Virus (HDV), and Hepatitis C Virus (HCV) in Italy is on the decline. Currently, the incidence of symptomatic acute hepatitis B is <2/100,000/year, the prevalence of HBsAg is <2%, and the estimated incidence and prevalence of HCV chronic infection are ~4-5/100,000/year and ~3%, respectively. Drug abuse, promiscuous sexual activity, invasive medical procedures, and beauty treatments are the major causes of HBV and HCV spread.
Key words: Italy, Epidemiology, Viral hepatitis, Hepatitis A, Hepatitis B, Hepatitis Delta, Hepatitis C, Surveillance, Risk factors, Incidence, Prevalence Istituto Superiore di Sanità Epidemiologia dell’epatite virale acuta: venti anni di sorveglianza del SEIEVA in Italia e rassegna della letteratura. Alfonso Mele, Maria Elena Tosti, Enea Spada, Andrea Mariano, Elvira Bianco e il Gruppo collaborativo SEIEVA 2006, v, 30 p. Rapporti ISTISAN 06/12 (in inglese)
Il SEIEVA (Sistema Epidemiologico Integrato dell’Epatite Virale Acuta) è stato ideato nel 1985 ed ha iniziato la sua piena attività nel 1986. Questo rapporto viene pubblicato in occasione dei venti anni di sorveglianza. Nel rapporto vengono descritti i metodi SEIEVA e l’epidemiologia delle epatiti virali in Italia e nel mondo. La circolazione di HAV in Italia è progressivamente diminuita e oggi buona parte dei soggetti <40 anni è sprovvista di immunità anti-HAV. Nel Meridione il consumo di frutti di mare contaminati causa ancora ampie epidemie. Anche i viaggiatori in Paesi endemici ed i tossicodipendenti hanno un rischio di infezione aumentato. Nei periodi interepidemici l’incidenza di epatite A sintomatica è ~2-3/100,000/anno. L’impatto del virus B (Hepatitis B Virus, HBV), del virus Delta (Hepatitis Delta Virus, HDV), e del virus C (Hepatitis C Virus, HCV) dell’epatite in Italia è in riduzione. Attualmente l’incidenza di epatite acuta B sintomatica è <2/100,000/anno, la prevalenza di HBsAg è <2% e le stime di incidenza e prevalenza di epatite cronica C sono rispettivamente ~4-5/100,000/anno e ~3%. Le principali cause di diffusione di HBV e HCV sono l’uso di droghe e.v., l’attività sessuale promiscua, le procedure mediche invasive ed i trattamenti estetici.
Parole chiave: Italia, Epidemiologia, Epatite virale, Epatite A, Epatite B, Epatite Delta, Epatite C, Sorveglianza, Fattori di rischio, Incidenza, Prevalenza Per informazioni su questo documento scrivere a: [email protected] For information on this paper write to: [email protected] Il rapporto è accessibile online dal sito di questo Istituto: www.iss.it.

i
SEIEVA Collaborative Group (by geographic area and Local Health Units (Azienda Sanitaria Locale, ASL) Istituto Superiore di Sanità
Centro Nazionale di Epidemiologia, Sorveglianza e Promozione della Salute Crateri S, Marzolini F
Valle d’Aosta ASL 1 Sudano L
Provincia autonoma Bolzano ASL 1 Simeoni J, Fischer M
Provincia autonoma Trento ASL 1 Carraro V, Gentilini L
Piemonte University of Torino Zotti C, Lanci GL ASL 1 Meda M ASL 5 Gallone A, Muratori L ASL 7 Galati MT, Signorile L ASL 8 Valenza G, Scala, Castagno P ASL 9 Alibrandi MP, Bresaz E ASL 10 Incarbona A, De Luca E ASL 11 Silano V, De Simone A. ASL 12 Ara G ASL 13 Cipelletti A
ASL 14 Iodice S ASL 15 Costantino A, Boscardo M ASL 16 Bertorello A ASL 17 Barberis R ASL 18 Giovanetti F ASL 19 Marchisio MA ASL 20 Rizzi B ASL 22 Prosperi R, Fossati F
Lombardy ASL 3 Crippa S, Altomonte G
Friuli-Venezia Giulia ASL 1 Zorzut F ASL 2 Donatoni L
ASL 4 Gallo T, Brianti G ASL 6 Zamparo E
Veneto Regional Health Authority Gallo G, Ferro A, Niero G, Bressani F ASL 1 Mel R ASL 2 Soppelsa M ASL 3 Sforzi M ASL 4 Russo F ASL 5 De Stefani E ASL 6 Todescato A ASL 7 Paludetti P ASL 8 Rizzato ASL 9 Pupo A ASL 10 Nicolardi L ASL 12 Marchese G
ASL 13 Marchionni G ASL 14 Boscolonata M ASL 15 D’Ettore G ASL 16 Gottardello L ASL 17 Bisi R ASL 18 Gallo L ASL 19 Caffara L ASL 20 Zivelonghi G ASL 21 Soffritti S ASL 22 Foroni M
Emilia Romagna Regional Health Authority Ragni P, Rangoni R, Borrini B, Cappelletti A, Furini A, Ancarani C ASL 1 Capra A

ii
ASL 2 Borrini B.M, Zilioli F, Copelli S, Alessandrini A, Morelli A
ASL 3 Camerlengo P, Greci M, Monici L, Bertazzoni A, Bigliardi M, Santacroce S
ASL 4 Gardenghi L,Casaletti G, Cagarelli R, Errani F, Lambertini A, Bulgarelli A, Vaccina D, Casolari E, Pezzi A.M
ASL 5 Todeschini R, Andalò C, Domeniconi G, Calzolari A,
Dalle Donne E, Dimaggio M.L, Fabbri M
ASL 6 Savoia N ASL 9 Taddia F, Cova M, Califano A ASL 10 Savelli G., Casadio GP, Calderoni
B ASL 11 Fiumana E ASL 12 Franceschini M ASL 13 Pecci A
Liguria ASL 1 Mela M ASL 2 Briata MP, Carloni R ASL 3 Turello W
ASL 4 Zoppi G ASL 5 Bertone A
Tuscany Regional Health Authority Ballocchini E, Mazzotta F, Graziani G ASL 1 Barani L, Ghiselli G ASL 2 Di Vito A ASL 3 Mazzoli F, Wanderlingh V ASL 4 Epifani AC ASL 5 Galletti N, Sbrana F ASL 6 Battaglini M, Marinari G,
Lombardi A, Genghi L ASL 7 Lezzi J
ASL 8 Verdelli F, Bindi R, De Sanctis E, Beltrano A, Conti R
ASL 9 Boncompagni G, Piacentini P, Di Cunto M, Papalini T, Incandela L
ASL 10 Baretti S, Cecconi R, Staderini C, Ciampi G
ASL 11 Filidei P ASL 12 Raffaelli C
Marche Regional Health Authority Carducci E ASL 1 Pelliccioni A ASL 2 Peccerillo AR ASL 3 Agostini M ASL 4 Rossini R ASL 5 Agostinelli L ASL 6 Burattini N ASL 7 Marcolini P
ASL 8 Passatempo R ASL 9 Migliozzi F ASL 10 Moretti G ASL 11 Ciarrocchi G ASL 12 Impulliti S ASL 13 Angelini C
Umbria Regional Health Authority Guaitini G, Tosti A ASL 1 Pasquale A, Rossi M, Buscosi A ASL 2 Penza OC, Ciani C
ASL 3 Santocchia F ASL 4 Proietti ML, Romizi A
Latium Regional Health Authority Curtale F ASL FR Corbo A ASL LT Corpolongo D, Porcelli P, Ruta
A, Ciarlo G ASL RI Dionette P, Guadagnoli R ASL RM/A Ercole A, Esterni G, Piccoli A,
Boggi R ASL RM/B Russo P, Napoli P, Catacchio MG ASL RM/C Cerocchi C, Linari D, Grillo P,
Tedeschi MT
ASL RM/D Gnesivo C, Loffredo M, Labriola V ASL RM/E Pendenza A, Tanzariello E,
Santarelli E ASL RM/F Bueti P,Ferrucci, Ursino S,
Torchia ASL RM/G Santucci L, Alicata F, Viafora S,
Cecere R, Pepe F ASL RM/H Patti P, Pesoli M, Aiello C, Ruiu
M, Beato F, Mathis M

iii
ASL VT/1 Vilecco P ASL VT/2 De Santis D ASL VT/3 Aquilani S
ASL VT/4 Passini A ASL VT/5 Micali O
Abruzzo ASL 106 Taccaliti G
Campania Regional Health Authority Pizzuti R, Pagano V ASL AV/1 Minichiello N ASL AV/2 Ferrara MA ASL BN Citarella A, Fossi E ASL CE/1 Bove C ASL CE/2 Trabucco M, D’Argenzio A ASL NA/1 Simonetti A ASL NA/2 Parlato A, Alfieri R
ASL NA/3 Peluso F ASL NA/4 Palombino R ASL NA/5 Giugliano F ASL SA/1 Caiazzo AL ASL SA/2 Panico MG ASL SA/3 Della Greca V, Trani AM
Apulia Regional Health Authority Barbuti S, Quarto M, Lo Palco P ASL BA/1 Matera R ASL BA/2 Colamaria R ASL BA/3 Madaro A ASL BA/4 Scalzo G ASL BA/5 Avella F ASL BR/1 Bellino E
ASL FG/1 Masullo M ASL FG/2 Pagano I ASL FG/3 Di Martino V ASL LE/1 Fedele A ASL LE/2 Turco G ASL TA/1 Minerba S
Basilicata ASL 2 Negrone FS, Maldini M, Colasurdo A, De Lisa M, Polani E, La Vecchia R ASL 5 Mauri F, Russo T
Calabria ASL 2 Aloia F ASL 11 Giuffrida S
Sicily ASL 1 Peritore G, Mangione R ASL 3 Cuccia M, Rinnone S
Sardinia ASL 1 Cau S, Angius M ASL 2 Saba A ASL 3 Fracasso D ASL 5 Musa G, Frongia O ASL 8 Mereu G

iv

v
TABLE OF CONTENTS
SEIEVA: twenty years of experience ....................................................................................... 1 Background...................................................................................................................................... 1 Aims................................................................................................................................................. 1 Method: case-reporting .................................................................................................................... 1 Results of the system of surveillance ............................................................................................... 2 Internet web-site............................................................................................................................... 6
Epidemiology of hepatitis A ........................................................................................................ 7 Hepatitis A in Italy........................................................................................................................... 7
References .................................................................................................................................. 9
Epidemiology of hepatitis B ........................................................................................................ 11 Hepatitis B in Italy ........................................................................................................................... 12
References .................................................................................................................................. 14
Epidemiolgy of Delta hepatitis ................................................................................................... 17
Epidemiology of hepatitis C ........................................................................................................ 19 Prevalence........................................................................................................................................ 19 Incidence.......................................................................................................................................... 20 Risk factors ...................................................................................................................................... 22 Conclusion ....................................................................................................................................... 24
References .................................................................................................................................. 24
Epidemiology of non-A,non-Delta hepatitis ......................................................................... 28 References .................................................................................................................................. 29
Epidemiology of hepatitis of unspecified aetiology ......................................................... 30

vi

Rapporti ISTISAN 06/12
1
SEIEVA: TWENTY YEARS OF EXPERIENCE
Background
SEIEVA (Sistema Epidemiologico Integrato dell’Epatite Virale Acuta), a national surveillance system for acute viral hepatitis infection, was created in 1985, and is coordinated by the Centro Nazionale di Epidemiologia, Sorveglianza e Promozione della Salute (the National Centre for Epidemiology, Surveillance and Health Promotion) of the Istituto Superiore di Sanità∗. The surveillance system started its full activity in 1986.
The main goal of SEIEVA is to promote the monitoring and control of acute viral hepatitis infection at both the local and national level. Epidemiological data are combined with laboratory data to estimate the impact of various risk factors, allowing prevention programmes to be defined and evaluated.
Aims
Specific goals of the surveillance are: a. to determine the number of cases of acute viral hepatitis infection, by specific type of
infection; b. to calculate the incidence of acute viral hepatitis infection, by type of infection, date and
place of disease onset, age, and gender; c. to identify, in a timely manner, outbreaks; d. to calculate the proportion of cases exposed to specific risk factors, by type of infection; e. to study variations over time in the relative and attributable risks associated with specific
types of exposure, by type of infection; f. to develop control strategies based on the identification of risk factors at the local level.
Method: case-reporting
The general methods of SEIEVA are: – to interview infected persons using an individual questionnaire (SEIEVA form) which
includes socio-demographic and risk factors information; questionnaire is administered before results of serological tests are obtained;
– to provide information on the results of serological tests; – to contact the transfusion centre and record information obtained on a specific form if the
infected person reports that he/she had received blood transfusion in the six months prior to disease onset;
– to conduct, when applicable (mainly when outbreaks are identified), case control and cohort studies.
∗ Mele A, Rosmini F, Zampieri A, Gill ON. Integrated Epidemiological System for Acute Viral Hepatitis
in Italy (SEIEVA): description and preliminary results. Eur J Epidemiol 1986;2:300-304.

Rapporti ISTISAN 06/12
2
In particular, the case-reporting method is based on a system consisting of a network of Local Health Units (Aziende Sanitarie Locali, ASL) located throughout Italy. Participation is voluntary. When a case of acute viral hepatitis is diagnosed, the treating physician or hospital is contacted by ASL in order to provide information on the results of serological tests, specifically: HBsAg, IgM anti-HBc, IgM anti-HAV, anti-HCV, and anti-Delta. The ASL records the case on a weekly case-report form, which is sent to SEIEVA’s Coordinating Centre at the National Centre for Epidemiology, Surveillance and Health Promotion. This form includes the identification number of the infected person, his/her age and gender, the data of disease onset, and the results of serological tests.
Moreover, for each case, a healthcare worker or physician from the ASL interviews the infected person using an individual questionnaire, which includes information on parenteral risk factors in the six months prior to disease onset, oral-faecal risk factors in the previous six weeks. Results of serological tests are also recorded after questionnaire is administered. If the infected person reports that he/she had received a blood transfusion, the ASL contacts the transfusion centre and records the information obtained on a specific form. All forms are sent to the Coordinating Centre, where the data are entered in a computerised database. When applicable (mainly when outbreaks are identified), the Coordinating Centre conducts ad hoc investigations to identify the mode of transmission and also studies designed to test hypothesis on transmission.
The diagnostic criteria used for calculating incidence are reported in Table 1. For the distribution of risk factors, a case definition that takes into account IgM anti-HBc and positivity for anti-HCV is used. The denominator used for calculating incidence consists of the sum of the populations of the single participating ASLs; age-specific population figures are provided by the ASLs at the time of enrolment in SEIEVA.
Table 1. Diagnostic criteria used to identify acute viral hepatitis by type
Hepatitis type HBsAg IgM anti-HBc IgM anti-HAV Anti-HCV Anti-Delta
A + - NR - NR + + - NR - NR B + - NR + - NR + - NR - NR C + - NR - - + - NR Delta Coinfection + + - NR + - NR + Delta Superinfection + - - - NR + - NR + NonA-NonC + - NR - - - - Unspecified NR NR NR NR NR Unspecified + NR - NR + NR
“+” = positive, “-“ = negative, “NR” = Not Reported
Results of the system of surveillance
On 31st December 2004 140 ASL participate to SEIEVA (on a total of 189 ASL in Italy). The participating ASL are distributed over the whole Country.
The percentage of ASLs participating to the surveillance progressively increased from 5% in 1986 (about 3 million people) and currently represents 59% of total population (about 33.7 million people) (Figure 1).
Figure 2 shows the geographical distribution of the 140 ASL.

Rapporti ISTISAN 06/12
3
1/6
13/13
1/52/6
2/55/8
22/22
12/12
1/15
12/12
4/4
1/11
13/13
5/5
22/22
1/1
13/13
0/5
1/6
11/11
2/24/6
2/55/8
12/12
21/21
12/12
1/15
12/12
4/4
2/11
2/92/9
13/13
5/5
17/18
1/1
13/13
0/5
1/6
13/13
1/52/6
2/55/8
22/22
12/12
1/15
12/12
4/4
1/11
13/13
5/5
22/22
1/1
13/13
0/5
1/6
13/13
1/52/6
2/55/8
22/22
12/12
1/15
12/12
4/4
1/11
13/13
5/5
22/22
1/1
13/13
0/5
1/6
11/11
2/24/6
2/55/8
12/12
21/21
12/12
1/15
12/12
4/4
2/11
2/92/9
13/13
5/5
17/18
1/1
13/13
0/5
0.0
10.0
20.0
30.0
40.0
50.0
60.0
70.0
1986 1988 1990 1992 1994 1996 1998 2000 2002 2004Years
Perc
enta
ge
0.0
10.0
20.0
30.0
40.0
50.0
60.0
70.0
1986 1988 1990 1992 1994 1996 1998 2000 2002 2004Years
Perc
enta
ge
Figure 1. Percentage of Italian population covered by surveillance in Italy. SEIEVA 1986-2004
Figure 2. ASL participating to SEIEVA (December 2004)
Rapporti ISTISAN 06/12
4
In this report data on incidence of the different type of hepatitis are presented from the beginning of the surveillance (1986).
The SEIEVA questionnaire was progressively modified and reached its almost definite form in 1991; for this reason the trend in frequencies of reported risk factors is shown since 1991.
As regard the other data not describing temporal trends, the time period 1997-2004 was analysed to give a picture of the current situation; during this period, the population under surveillance was quite stable (57 to 59% of the Italian population) and scattered all over the country to be representative of all geographical areas.
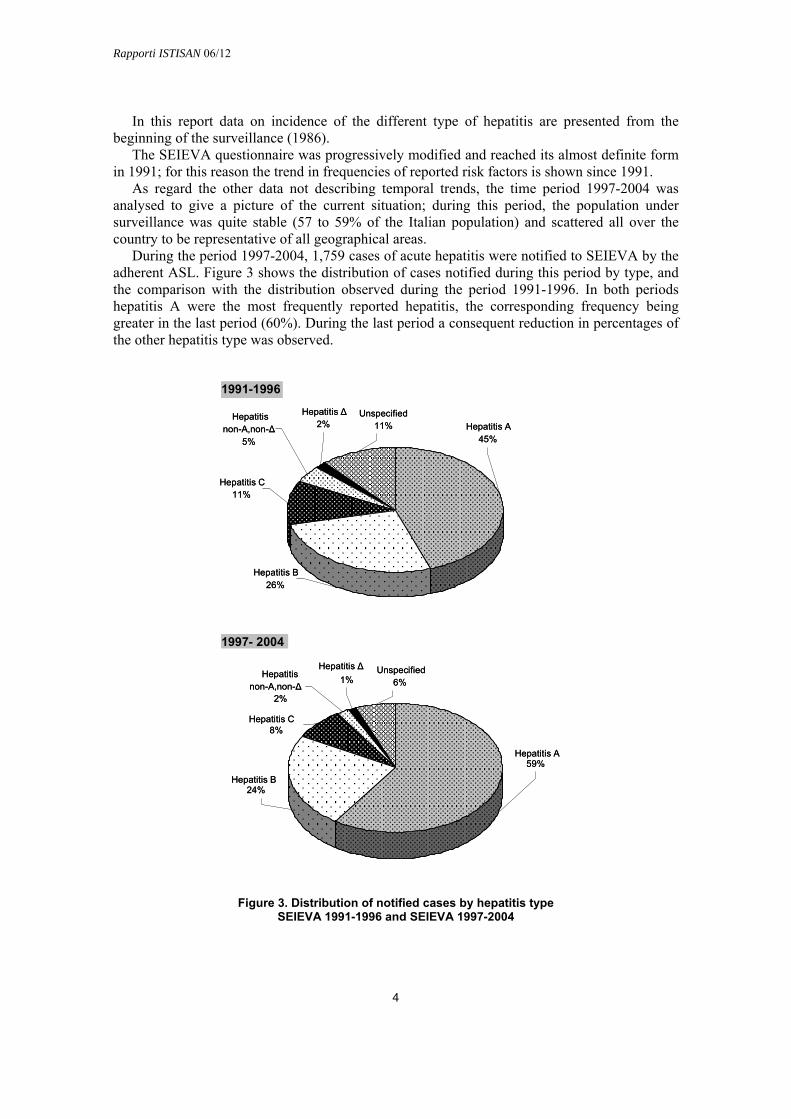
During the period 1997-2004, 1,759 cases of acute hepatitis were notified to SEIEVA by the adherent ASL. Figure 3 shows the distribution of cases notified during this period by type, and the comparison with the distribution observed during the period 1991-1996. In both periods hepatitis A were the most frequently reported hepatitis, the corresponding frequency being greater in the last period (60%). During the last period a consequent reduction in percentages of the other hepatitis type was observed.
Figure 3. Distribution of notified cases by hepatitis type SEIEVA 1991-1996 and SEIEVA 1997-2004
Hepatitis C11%
Hepatitis B26%
Hepatitis A45%
Hepatitis non-A,non-Δ
5%
Unspecified11%
Hepatitis Δ2%
1997- 2004
Hepatitis Δ1%
Unspecified6%
Hepatitis non-A,non-Δ
2%
Hepatitis C
Hepatitis B24%
Hepatitis A59%
1991-1996
8%
Hepatitis C11%
Hepatitis B26%
Hepatitis A45%
Hepatitis non-A,non-Δ
5%
Unspecified11%
Hepatitis Δ2%
1997- 2004
Hepatitis Δ1%
Unspecified6%
Hepatitis non-A,non-Δ
2%
Hepatitis C
Hepatitis B24%
Hepatitis A59%
1991-1996
8%

Rapporti ISTISAN 06/12
5
Table 2 describes temporal trend in incidence for the different type of hepatitis.
Table 2. Incidence rates (x 100,000) of reported acute viral hepatitis cases, by age and year. SEIEVA 1986-2004
Age ’86 ’87 ’88 ’89 ’90 ’91 ’92 ’93 ’94 ’95 ’96 ’97 ’98 ’99 ’00 ’01 ’02 ’03 ’04
Hepatitis A 0-14 4 6 4 2 3 8 11 7 11 5 10 31 8 3 3 5 2 3 4.115-24 7 6 5 4 5 7 15 9 14 6 18 57 15 5 5 5 3 4 5.525 e + 3 1 1 2 2 2 2 3 2 1 3 6 4 2 2 2 2 3 3 Total 4 2 2 2 2 4 6 5 6 3 7 19 6 3 3 3 2 3.1 3.6
Hepatitis B 0-14 3 2 2 2 1 1 1 1 1 1 1 0.5 0.4 0.3 0.1 0.5 0.2 0.1 0.115-24 35 31 22 19 17 12 10 10 6 6 5 5 4 3 2 1.5 1.3 0.9 0.725 e + 9 8 5 5 4 4 3 4 4 3 3 4 3 3 2 2.5 2 2.3 2.3Total 12 10 7 6 5 5 4 4 3 3 3 3 3 2 2 2 1.5 2 1.6
Hepatitis non-A,non-B 0-14 1 0.5 1 0 0 1 0 0 0 0 0 0 0 0.2 0.1 0.4 0.1 0.1 0.115-24 10 8 9 8 6 5 4 3 3 2 2 1 1 1 0.7 1 1 0.6 0.425 e + 4 3 2 2 2 2 2 1 2 2 1 1 1 1 0.7 1 1 0.9 0.7Total 4 3 3 3 3 2.5 2 2 2 2 1 1 1 1 0.7 0.7 0.7 0.7 0.6
Hepatitis non-A,non-B – HCV positive 0-14 - - - - - - - 0.02 0.05 0.00 0.06 0.02 0.05 0.02 0.00 0.03 0.06 0.05 0.0615-24 - - - - - - - 3.5 2.9 2.4 1.8 1.3 1.3 1.4 0.7 0.6 0.8 0.5 0.325 e + - - - - - - - 1.6 1.6 1.5 1.0 1.1 1.0 0.7 0.7 0.7 0.7 0.7 0.6Total - - - - - - - 1.6 1.5 1.4 0.9 0.9 0.9 0.7 0.6 0.6 0.6 0.6 0.5
Hepatitis non-A,non-B – HCV negative – Δ negative 0-14 - - - - - - - 0.3 0.3 0.2 0.2 0.1 0.1 0.1 0.03 0.1 0.06 0.02 0.0215-24 - - - - - - - 0.8 0.6 0.5 0.7 0.5 0.3 0.3 0.2 0.1 0.04 0.1 0.125 e + - - - - - - - 0.5 0.4 0.6 0.4 0.4 0.2 0.3 0.2 0.1 0.1 0.2 0.1Total - - - - - - - 0.5 0.4 0.5 0.4 0.3 0.2 0.3 0.1 0.1 0.1 0.1 0.1
Table 3 shows the fatality rate observed among notified cases, by hepatitis type.
Table 3. Fatality rate of acute hepatitis by type, with distribution of age at death. SEIEVA 1997-2004
Dead age Hepatitis type Dead/cases Fatality rate median range
A 4/12,925 0.03% 39.5 37-59 B 25/5,139 0.49% 59.5 23-90 C 4/1,689 0.23% 61.5 41-89
non-A,non-Δ 2/452 0.44% 65 50-80 Delta 1/197 0.51% 62 -
Unspecified 4/1,357 0.29% 61 58-81
Total 40/21,759 0.18% 59 23-90
Tables 2 and 3 will be described in details in the sections dedicated to the different types of hepatitis.
The following sections describe in detail the epidemiology of the different types of hepatitis.

Rapporti ISTISAN 06/12
6
Internet web-site
The web-site www.iss.it/seie contains all the information on SEIEVA: referents at the Coordinating Centre (National Centre for Epidemiology, Surveillance and Health Promotion of the Istituto Superiore di Sanità), participating Local Health Units, and used methodology. Some tables with processing of data taken from surveillance are also present on the web-site, among these: incidences trend and frequencies of reported risk factors by hepatitis type. Publications edited by the Istituto Superiore di Sanità (“Rapporti SEIEVA”) can be downloaded.
An English version of the SEIEVA web-site is also available.
Rapporti ISTISAN 06/12
7
EPIDEMIOLOGY OF HEPATITIS A
Hepatitis A is an acute usually self-limiting infection caused by Hepatitis A Virus (HAV). The virus has a worldwide distribution and causes about 1,5 million cases of clinical hepatitis each year (1).
The infection is mainly transmitted by the faecal-oral route either through contaminated food and water or through direct contact with an infected person.
In recent decades the epidemiological pattern of hepatitis A has changed dramatically. In the past, poor environmental and sanitary conditions made the contact with faecal-infected material extremely frequent and most children were infected with HAV, although the disease was clinically evident only in few cases. With the improvement in sanitation in developed countries, the infection rate has decreased and the epidemiological situation is characterized by an overall reduction of the incidence. In those areas where the viral circulation is lower, there are many susceptible children and young adults. The downside of the reduction in new infections with HAV has been a declining prevalence of antibodies to hepatitis A in the population, and the emergence of an adult population with limited immunity to infection (2). Epidemiological conditions in the world vary from country to country, and even from region to region within the same country, depending on the degree of social development. There are, in fact, areas/countries with high, intermediate or low endemicity for HAV infection (3-5). In high endemicity areas (Africa, Middle Eastern nations, South East Asia, Latin American nations:), the lifetime risk of infection is greater than 90% and most infections occur in early childhood and are asymptomatic. In areas with intermediate endemicity (Eastern Europe, Russia) transmission occurs primarily from person to person in the general community, often with periodic outbreaks. In areas with low endemicity (Japan, Australia, New Zealand, Canada, United States, Southern and Northern Europe) the disease occurs mainly in adolescent in high risk groups (e.g. homosexual men (6), injection drugs users (6-14), persons travelling to countries with intermediate or high HAV endemicity (6,15-16). Some of these groups may also experience periodic outbreaks of hepatitis. In areas of low endemicity, occasional food and waterborne outbreaks of hepatitis A occur (2).
Hepatitis A in Italy
Italy was considered to be an area with low/intermediate endemicity for hepatitis A. In recent decades the epidemiological pattern of hepatitis A has changed relating to improved health and sanitary conditions which have caused a progressive fall of the infection in children and a major shift towards the highest incidence in young adult (17). Seroepidemiological investigations showed that in Italy, during the 1980s, the rate of immune subjects was from 6% to 27% in the children living in the north and from 39% to 63% in the ones living in the south (18). Anti-HAV prevalence in army recruits, was 66% in 1981, 30% in 1990, 5% in 2003 (from 2% in the north to 8% in the south) (19).
SEIEVA surveillance data suggest that the incidence has declined from 10/100,000 in 1985 (data not shown) to 3,5/1,000,000 in 2004 (see Table 2), with an increase during 1996-1997 corresponding to a large outbreak occurred in two regions in the south of Italy, Puglia and Campania (20). In 2004 a smaller outbreak occurred in Campania (21) (Figure 4).
The reduction in hepatitis cases is not uniform in Italy, depending on the region: in fact central-northern regions should be considered low endemicity, while southern and insular

Rapporti ISTISAN 06/12
8
regions intermediate endemicity. Therefore the risk of epidemic period must be considered in general population and in particular risk groups.
Figure 4. Incidence rates of reported A acute hepatitis cases by geographic area in Italy. SEIEVA 1986-2004
The risk factor more frequently reported to SEIEVA was the consumption of shellfish, especially mussels eaten raw or partially cooked, and it is the most relevant exposure for acquiring the infection in the endemic and epidemic period. A number of secondary cases can be linked to direct contact with infected persons (Table 4).
Table 4. Frequency (%) per age groups of not mutually exclusive risk factors reported by hepatitis A cases during the six weeks before disease onset, in Italy. SEIEVA 1997-2004
0-14 15-24 25-39 ≥ 40 Total Risk factors
(n. 3,287) (n. 4,468) (n. 3,815) (n. 1,082) (n. 12,350)
Shellfish consumption 57.1 77.2 72.5 60.6 69.2 Contact with a jaundice case 21.2 8.1 8.3 6.9 11.4 Travel to high-medium endemic area 13.5 9.8 23.8 28.7 16.5 Household of day care child 27.5 7.4 12.3 6.6 14.0 Intravenous drug use (last six months) 0.0 1.1 3.3 1.1 1.5
Sometimes, in areas where the viral circulation is lower and the young adults are more
susceptible to infection of hepatitis A, epidemic can occur in particular risk groups such as intravenous drugs users (7) or in travellers going to high endemic countries for hepatitis A.
0
5
10
15
20
25
30
35
40
45
50
1986 1987 1988 1989 1990 1991 1992 1993 1994 1995 1996 1997 1998 1999 2000 2001 2002 2003 2004
North-Center
South-Islands
0
5
10
15
20
25
30
35
40
45
50
1986 1987 1988 1989 1990 1991 1992 1993 1994 1995 1996 1997 1998 1999 2000 2001 2002 2003 2004
North-Center
South-Islands

Rapporti ISTISAN 06/12
9
Surveillance data showed in fact that the risk for voyagers of acquiring hepatitis A increases travelling to high endemicity areas (22).
The trend in frequencies of reported risk factors between 1991 and 2004 is reported in Figure 4. All the risk factors present frequencies stable upon the whole period.
Figure 4. Frequency (%) of not mutually exclusive risk factors reported by hepatitis A cases during the six weeks before disease onset, in Italy, by year. SEIEVA 1991-2004
References
1. World Health Organization. Hepatitis A. Wkly Epidemiol Rec 2000;75:38-44.
2. Centers for Disease Control and Prevention. Prevention of hepatitis A through active or passive immunization: recommendations of the Advisory Committee on Immunization Practices (ACIP). MMWR Recomm Rep 1999;48 (RR-12):1-39.
3. Centers for Disease Control and Prevention. Health Information for International Travel, 2005-2006. Atlanta, GA: US Department of Health and Human Services, Public Health Service; 2005.
4. World Health Organization. International Travel and Health. Geneva, Switzerland: World Health Organization, 2005.
5. Jacobsen KH, Koopman JS. Declining hepatitis A seroprevalence: a global review and analysis. Epidemiol Infect 2004;132:1005-22.
6. Franco E, Giambi C, Ialacci R, Coppola RC, Zanetti AR. Risk groups for hepatitis A virus infection. Vaccine 2003;21:2224-33.
7. Spada E, Genovese D, Tosti ME et al. An outbreak of hepatitis A virus infection with a high case-fatality rate among injecting drug users. J Hepatol 2005;43:958-64.
8. Quaglio G, Lugoboni F, Mezzelani P, Des Jarlais DC, Lechi A. Hepatitis vaccination among drug users. Vaccine 2006 (in press).
0
10
20
30
40
50
60
70
80
1991 1992 1993 1994 1995 1996 1997 1998 1999 2000 2001 2002 2003 2004
%
joundice contact shellfish consump. travel (endemic area) hous. day care child
0
10
20
30
40
50
60
70
80
1991 1992 1993 1994 1995 1996 1997 1998 1999 2000 2001 2002 2003 2004
%
joundice contact shellfish consump. travel (endemic area) hous. day care child
Rapporti ISTISAN 06/12
10
9. Roy K, Howie H, Sweeney C, Parry J et al. Hepatitis A virus and injecting drug misuse in Aberdeen, Scotland: a case-control study. J Viral Hepatol 2004;11:277-82.
10. Crowcroft NS. Hepatitis A virus infections in injecting drug users. Commun Dis Public Health 2003;6:82-4.
11. Kuusi M, Nuorti P, Rostila T, Jokinen C. Hepatitis A infections in intravenous drug users Finland. Euro Surveillance 2003:5.
12. Sundkvist A, Smith A, Mahgoub H et al. Outbreak of hepatitis A infection among intravenous drug users in Suffolk and suspected risk factors Commun Dis Public Health 2003;6:101–05.
13. Syed NA, Hearing SD, Shaw IS et al. Outbreak of hepatitis A in the injecting drug user and homeless populations in Bristol: control by a targeted vaccination programme and possible parenteral transmission. Eur J Gastroenterol Hepatol 2003;15:901-6.
14. O’Donovan D, Cooke RP, Joce R, Eastbury A, Waite J, Stene-Johansen K. An outbreak of hepatitis A amongst injecting drug users Epidemiol Infect 2001;127:469-73.
15. Steffen R. Changing travel-related global epidemiology of hepatitis A Am J Med 2005;118:46S-49S.
16. Freedman DO, Weld LH, Kozarsky PE et al. Spectrum of disease and relation to place of exposure among ill returned travellers. N Engl J Med 2006 Jan 12;354(2):119-30.
17. Stroffolini T, Mele A, Sagliocca L. Vaccination policy against hepatitis A in Italy. Vaccine 2001;19:2404-6.
18. Mele A, Pasquini P, Panà A. Hepatitis in Italy: epidemiology and suggestion for control. Ital J Gastrenterol 1991;23:341-3.
19. D'Amelio R, Mele A, Mariano A, et al. Hepatitis A, Italy. Emerg Infect Dis 2005;11:1155-6.
20. Lopalco PL, Malfait P, Menniti-Ippolito F, et al. Determinants of acquiring hepatitis A virus disease in a large Italian region in endemic and epidemic periods. J Viral Hepat 2005;12:315-21.
21. Boccia D, Pontrelli G, di Renzi M, et al. Epidemia di epatite virale A in Campania (Gennaio-Agosto 2004). Rapporto conclusivo. 2005,iii, 39 p. (Rapporti ISTISAN 05/31)
22. Ciccozzi M, Tosti ME, Gallo G, et al. Risk of hepatitis A infection following travel. J Viral Hepatitis 2002;9:460-5.

Rapporti ISTISAN 06/12
11
EPIDEMIOLOGY OF HEPATITIS B
It is estimated that approximately 2 billions people have been infected worldwide with the hepatitis B virus (HBV), 350 millions have a chronic infection (25-30% of them are Chinese), 4 millions new acute infections occur each year. HBV causes 60-80% of all hepatocellular carcinomas and 500,000-1 million death each year (1-4).
An effective vaccine against HBV is available since 1981-1982. According to WHO-UNICEF estimates for 2004, 153 countries have introduced HBV vaccine in their national infant immunization schedule and approximately 50% of children worldwide have received 3 doses of vaccine within their first year of life. Unfortunately, areas with unsufficient or non existent vaccine coverage are often those highly needing the vaccine, i.e. those with a higher HBV endemicity.
In fact, HBV prevalence is not uniform worldwide and geographical areas are classified as follows:
– Areas at high endemicity (HBsAg ≥8%; anti-HBc: 70-90%): Sub-Saharan Africa; central Asian Republics; China and Mongolia; South-East Asia; South Pacific Island region; Amazon Basin; parts of Greenland; Western Alaska and Northern Canada (native populations).
– Areas at intermediate endemicity (HBsAg: 2-7%; anti-HBc: 20-55%): Middle East; Southern Europe and other Mediterranean countries; Russia – Eastern Europe; India –Southwest Asia; areas of South America surrounding the Amazon Basin and parts of Central America (Haiti, Dominican Republic, Honduras).
– Areas at low endemicity (HBsAg <2%; anti-HBc <20%): Northern, Western and Central Europe; most of North America; parts of Latin America; Australia and New Zealand.
In highly endemic areas, infection rates during infancy and early childhood (at higher risk to hesitate in a chronic infection) are very high, so that HBsAg prevalence can even exceed 20% in some populations. The vertical transmission (mother-to-child) and the horizontal transmission during childhood (enhanced by promiscuous living conditions) play a major role in perpetuating HBV endemicity. Vertical transmission is thought to have a higher impact in Asia than in Africa, probably due to higher rate of HBeAg positivity in HBsAg-positive Asian women of childbearing age. The implementation of vaccination programmes with a high coverage rate as well as social changes are progressively shifting many populations (such as Natives of Alaska and Canada and some Asian countries), towards an intermediate level of endemicity. In Taiwan, which started the anti-HBV vaccination campaign in the eighties, a reduction of hepatocellular carcinomas and fulminant hepatitis in children covered by the vaccination programme has been observed as well. Unfortunately, a good vaccination coverage is still lacking in most of Sub-Saharian Africa.
Countries at intermediate endemicity may show different trends and some European countries are illustrative on this respect (5). HBV prevalence is on the decline in Southern Europe which is progressively becoming at low endemicity; socio-economic improvements contributed to the reduction of intrafamiliar virus spread and vaccination further enhanced this trend, so that nowadays HBV incidence is usually comparable to that of lowly endemic areas. Other countries, such as Romania and Bulgaria, also had a decrease of HBV incidence during the 1990s (from 35-40 to 10-15 reported cases per 100,000), but HBsAg prevalence is still higher than in more affluent countries (4-7%). At the opposite, other countries, such as Estonia,

Rapporti ISTISAN 06/12
12
Latvia, and Lituania, showing borderline prevalences (2-3%), had even an increase of HBV incidence during the 1990s, mainly in teenagers and young adults.
In most of lowly endemic countries, nowadays 1-3 cases of acute hepatitis B per 100,000 are yearly reported (5-8). Notified cases are usually expected to underestimate the true incidence due to underreporting and asymptomatic infections (>90% of cases in children, 50-70% in adults). For instance, it is estimated that in the United States the real HBV incidence is almost ten times that of notified cases (6). However, in these countries HBV transmission is rare in infants and children, thanks to the implementation of effective preventive measures for perinatal transmission (screening and prophylaxis), the vaccination during infancy, and the low probability of virus contact during childhood; as a consequence the HBsAg prevalence is usually 1% or lower. Most of infections occur after 15 years of age (or at even older age if a vaccination programme for adolescents is implemented) (6-7) and are mainly due to sexual contacts and intravenous drug abuse, so that incidence is usually higher in males than in females.
Hepatitis B in Italy
Italy was a country at intermediate endemicity at the end of the 1970s, with children and young people showing HBsAg and anti-HBc prevalences of 2-5% and 12-18%, respectively, and intrafamiliar transmission having a major role in virus spread (9-1). Since then, there has been a progressive reduction of virus transmission due to the general improvement of hygienic standards and living conditions of the population, the reduction of mean family size, the abandon of non disposable syringes to administer parenteral drugs, the implementation of HBsAg screening during pregnancy and prophylaxis for the newborn of positive mothers, the vaccination of high risk groups, and the anti-AIDS campaign. So, at the end of the 1980s, HBsAg and anti-HBc prevalences in children and young people had reduced to <2% and 1-7%, respectively (9-13).
The introduction in 1991 of compulsory vaccination for all infants (starting at 3 months of age) and for all 12-years-old children, further enhanced this trend. The impact of vaccination on HBV incidence has been more evident in the age-group 15-24 years (see Table 2). In 2003, the routine vaccination of adolescents has been stopped and nowadays most of Italians born after 1979 are already vaccinated.
Several surveys conducted during the 1990s-2000s in samples of the general population of different Italian areas repeatedly found a HBsAg prevalence <2% (range: 0.2-1.3%) and a virtual absence of chronic infection in children (14-20). Anti-HBc prevalence was usually <20% in these studies and increased with age. These data are further corroborated by studies conducted in pregnant women, which showed a HBsAg prevalence of 1.1-2.4% during the 1980s (21-23) and of 0.6-1.7% during the 1990s and the early 2000s (from 0.7-1.4% in Italian parturients to 3-6% in inmigrants from non-EU countries) (24-27). Inmigrants are at higher risk to be missed for HBsAg screening during pregnancy (26), showing a need for further improvement in their access to appropriate medical care.
Nowadays, in Italy the yearly number of reported acute HBV infections is <2 per 100,000, incidence rates are higher in males than in females and in North-Centre than in South-Islands (Figure 5) and most of infections occur in people older than 24 years (see Table 2).

Rapporti ISTISAN 06/12
13
Figure 5. Incidence rates of reported B acute hepatitis cases by geographic area in Italy. SEIEVA 1986-2004
Promiscuous sexual activity play a major role in virus spread, while the impact of intravenous drug use is decreasing (Table 5; Figure 6). Both these factors are susceptible of targeted vaccination programmes and of risk reduction through education; as a matter of fact, they mainly act in people younger than 40 years, which will be completely covered by the routine vaccination campaign by the 2020.
Table 5. Frequency (%)per age groups of not mutually exclusive risk factors reported by hepatitis B cases during the six months before disease onset, in Italy. SEIEVA 1997-2004
0-14 15-24 25-39 ≥ 40 Total Risk factors
(n. 64) (n. 813) (n. 2,713) (n. 1,623) (n. 5,213)
Blood transfusion 7.4 0.4 0.6 6.7 2.6 Surgical intervention 5.4 9.3 11.6 20.1 13.9 Endoscopy 4.2 1.6 2.0 8.2 4.0 Hemodialysis 0.0 0.4 0.1 0.5 0.3 Hospitalization 20.7 10.4 9.8 24.4 14.7 Beauty treatment* 15.2 32.6 33.4 27.0 31.0 Dental therapy 14.6 28.4 33.0 27.8 30.4 Intravenous drug use 0.0 23.8 17.1 1.4 13.0 Household of IV drug users 4.6 6.2 3.5 0.7 3.0 ≥ 2 sexual partners (last year) 0.0 35.6 41.3 24.7 34.9 Household of HBsAg+ carrier 18.6 17.1 9.4 9.4 10.6
* Piercing, tattooing, attendance to manicurist/chiropodist, barber shop shaving
0
5
10
15
20
25
30
35
40
45
50
1986 1987 1988 1989 1990 1991 1992 1993 1994 1995 1996 1997 1998 1999 2000 2001 2002 2003 2004
North-Center
South-Islands
0
5
10
15
20
25
30
35
40
45
50
1986 1987 1988 1989 1990 1991 1992 1993 1994 1995 1996 1997 1998 1999 2000 2001 2002 2003 2004
North-Center
South-Islands
Rapporti ISTISAN 06/12
14
0
5
10
15
20
25
30
35
40
45
50
1991 1992 1993 1994 1995 1996 1997 1998 1999 2000 2001 2002 2003 2004
i.v.d. use blood trans. surgery endoscopyhaemodialisishous. HBsAg+ beauty treat. ≥2 sex. part.
0
5
10
15
20
25
30
35
40
45
50
1991 1992 1993 1994 1995 1996 1997 1998 1999 2000 2001 2002 2003 2004
i.v.d. use blood trans. surgery endoscopyhaemodialisishous. HBsAg+ beauty treat. ≥2 sex. part.
i.v.d. use blood trans. surgery endoscopyhaemodialisishous. HBsAg+ beauty treat. ≥2 sex. part.
i.v.d. use blood trans. surgery endoscopyhaemodialisishous. HBsAg+ beauty treat. ≥2 sex. part.
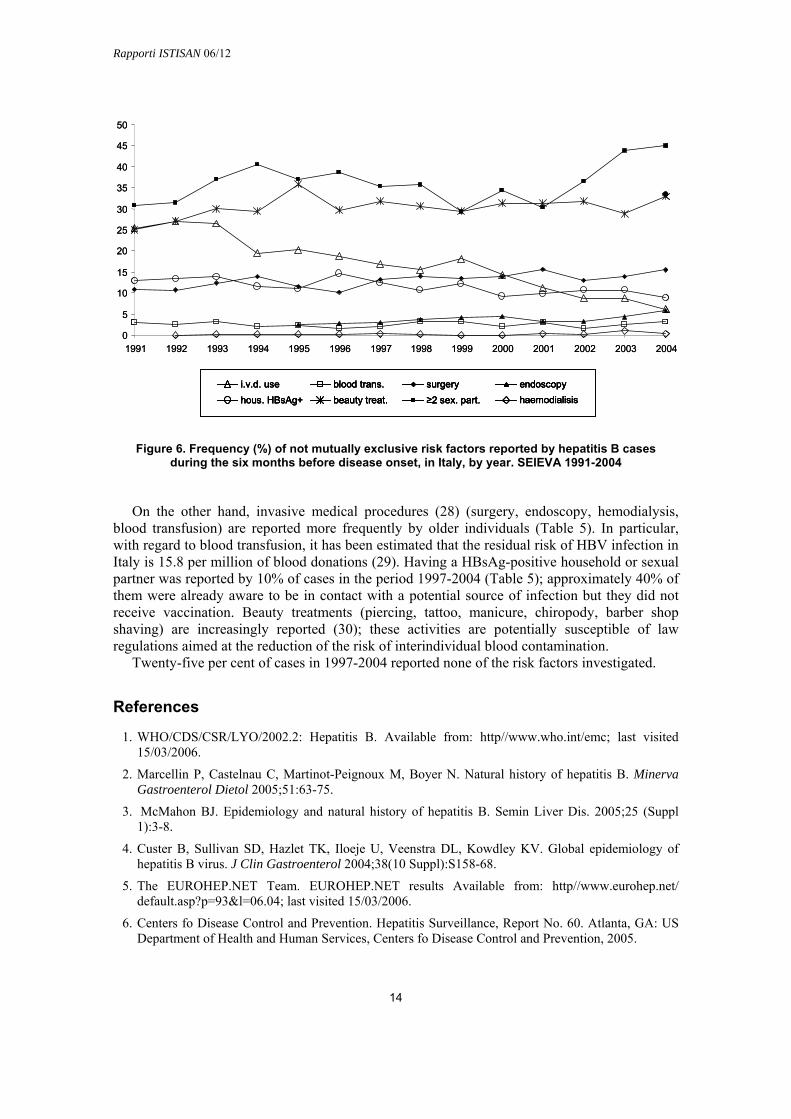
Figure 6. Frequency (%) of not mutually exclusive risk factors reported by hepatitis B cases during the six months before disease onset, in Italy, by year. SEIEVA 1991-2004
On the other hand, invasive medical procedures (28) (surgery, endoscopy, hemodialysis, blood transfusion) are reported more frequently by older individuals (Table 5). In particular, with regard to blood transfusion, it has been estimated that the residual risk of HBV infection in Italy is 15.8 per million of blood donations (29). Having a HBsAg-positive household or sexual partner was reported by 10% of cases in the period 1997-2004 (Table 5); approximately 40% of them were already aware to be in contact with a potential source of infection but they did not receive vaccination. Beauty treatments (piercing, tattoo, manicure, chiropody, barber shop shaving) are increasingly reported (30); these activities are potentially susceptible of law regulations aimed at the reduction of the risk of interindividual blood contamination.
Twenty-five per cent of cases in 1997-2004 reported none of the risk factors investigated.
References
1. WHO/CDS/CSR/LYO/2002.2: Hepatitis B. Available from: http//www.who.int/emc; last visited 15/03/2006.
2. Marcellin P, Castelnau C, Martinot-Peignoux M, Boyer N. Natural history of hepatitis B. Minerva Gastroenterol Dietol 2005;51:63-75.
3. McMahon BJ. Epidemiology and natural history of hepatitis B. Semin Liver Dis. 2005;25 (Suppl 1):3-8.
4. Custer B, Sullivan SD, Hazlet TK, Iloeje U, Veenstra DL, Kowdley KV. Global epidemiology of hepatitis B virus. J Clin Gastroenterol 2004;38(10 Suppl):S158-68.
5. The EUROHEP.NET Team. EUROHEP.NET results Available from: http//www.eurohep.net/ default.asp?p=93&l=06.04; last visited 15/03/2006.
6. Centers fo Disease Control and Prevention. Hepatitis Surveillance, Report No. 60. Atlanta, GA: US Department of Health and Human Services, Centers fo Disease Control and Prevention, 2005.

Rapporti ISTISAN 06/12
15
7. Sistema Epidemiologico Integrato Epatite Virale Acuta (SEIEVA, Integrated Epidemiological System for Acute Viral Hepatitis). Available from: http//www.iss.it/seie/; last visited 15/03/2006.
8. Roure C. Overview of epidemiology and disease burden of hepatitis B in the European region. Vaccine 1995;13 (Suppl 1):S18-21.
9. Stroffolini T. The changing pattern of hepatitis B virus infection over the past three decadesin Italy. Dig Liver Dis 2005;37:622-7.
10. D’Argenio P, Esposito D, Mele A, Ortolani G, Adamo B, Rapicetta M, Forte P, Pisani A, Soldo L, Sarrecchia B, et al. Decline in the exposure to hepatitis A and B infections in children in Naples, Italy. Public Health 1989;103:385-9.
11. Chiaramonte M, Trivello R, Stroffolini T, Moschen ME, Rapicetta M, Bertin T, Renzulli G, Chionne P, Ciccaglione A, Naccarato R. Changing pattern of hepatitis B infection in children: a comparative seroepidemiological study (1979 vs 1989) in north-east Italy. Ital J Gastroenterol 1991; 23:347-50.
12. D’Amelio R, Matricardi PM, Biselli R, Stroffolini T, Mele A, Spada E, Chionne P, Rapicetta M, Ferrigno L, Pasquini P. Changing epidemiology of hepatitis B in Italy: public health implications. Am J Epidemiol 1992;135:1012-8.
13. Stroffolini T, Chiaramonte M, Craxi A, Franco E, Rapicetta M, Trivello R, De Mattia D, Mura I, Giammanco A, et al. Baseline sero-epidemiology of hepatitis B virus infection in children and teenagers in Italy. A survey before mass hepatitis B vaccination. J Infect 1991;22:191-9.
14. Bellentani S, Tiribelli C, Saccoccio G, et al. Prevalence of chronic liver disease in the general population of Northern Italy: the Dionysos Study. Hepatology 1994;20:1442-9.
15. Stroffolini T, Guadagnino V, Chionne P, et al. A population based survey of hepatitis B virus infection in a Southern Italian town. Ital J Gastroenterol Hepatol 1997; 29:415-9.
16. Stroffolini T, Menchinelli M, Taliani G, et al. High prevalence of hepatitis C virus infection in a small central Italian town: lack of evidence of parenteral exposure. Ital J Gastroenterol 1995;27:235-8.
17. Maio G, D’Argenio P, Stroffolini T, et al. Hepatitis C virus infection and alanine transaminase levels in the general population: a survey in a Southern Italian town. J Hepatol 2000;33:116-120.
18. Di Stefano R., Stroffolini T, Ferraro D, et al. Endemic hepatitis C virus infection in a Sicilian town: further evidence for iatrogenic trasmission. J Med Virol 2002;67:339-344.
19. Pendino GM, Mariano A, Surace P, et al. Prevalence and etiology of altered liver tests: a population-based survey in a Mediterranean town. Hepatology 2005;41:1151-59.
20. Raffaele A, Valenti M, Iovenitti M, Metani A, Bruno ML, Altobelli E, et al. High prevalence of HCV infection among the general population in a rural area of central Italy. Eur J Epidemiol 2001;17:41-6.
21. Stroffolini T, Pasquini P, Mele A. HBsAg carriers among pregnant women in Italy: results from the screening during a vaccination campaign against hepatitis B. Public Health 1988;102:329-33.
22. Bonanno Conti MI, Critti AF, La Rocca S, Rappa AR. HBsAg-positive mothers and neonatal immunization: experience at the USL No. 1 in Trapani. Minerva Pediatr 1990;42:233-5.
23. Ricci C, Alunni C, Urbanetti S, Valli E, Valli P. Prevalence of HBV markers in pregnant women at 3 national health units in Tivoli. Minerva Ginecol 1989;41:299-300.
24. Marranconi F, Fabris P, Stecca C, Zampieri L, Bettini MC, Di Fabrizio N, et al. Prevalence of anti-HCV and risk factors for hepatitis C virus infection in healthy pregnant women. Infection 1994;22:33-7.
25. Baldo V, Floreani A, Menegon T, Grella P, Paternoster DM, Trivello R. Hepatitis C virus, hepatitis B virus and human immunodeficiency virus infection in pregnant women in North-East Italy: a seroepidemiological study. Eur J Epidemiol 2000;16:87-91.

Rapporti ISTISAN 06/12
16
26. Stroffolini T, Bianco E, Szklo A, et al. Factors affecting the compliance of the antenatal hepatitis B screening programme in Italy. Vaccine 2003;21:1246-9.
27. Bonura F, Sorgi M, Perna AM, Puccio G, Tramuto F, Cajozzo C, Romano N, Vitale F. Pregnant women as a sentinel population to target and implement hepatitis B virus (HBV) vaccine coverage: a three-year survey in Palermo, Sicily. Vaccine 2005;23:3243-6.
28. Mele A, Spada E, Sagliocca L, et al. Risk of parenterally transmitted hepatitis following exposure to surgery or other invasive procedures: results from the hepatitis surveillance system in Italy. J Hepatol 2001;35:284-9.
29. Tosti ME, Solinas S, Prati D, et al. An estimate of the current risk of transmitting blood-borne infections through blood transfusion in Italy. Br J Haematol 2002;117:215-9.
30. Mariano A, Mele A, Tosti ME, et al. Role of beauty treatment in the spread of parenterally transmitted hepatitis viruses in Italy. J Med Virol 2004;74:216-20.

Rapporti ISTISAN 06/12
17
EPIDEMIOLGY OF DELTA HEPATITIS
Delta hepatitis virus (HDV) infection is endemic in countries of Sub-Saharan Africa, central Asia, Mediterranean Basin and Amazon Basin.
This agent requires for infection the helper function of hepatitis B virus and can infect people together with HBV (coinfection) or HBsAg chronic carriers (superinfection).
During the period 1987-2004, the observed incidence varies from 3.2 to 0.5 per million (Figure 7).
Figure 7. Incidence rates per 1 million of acute hepatits Delta infection. SEIEVA 1987-2004
Two peaks of incidence were observed in 1990 and 1993 respectively. The peak in 1993 was mainly due to an outbreak among intravenous drug users in North-Eastern Italy.
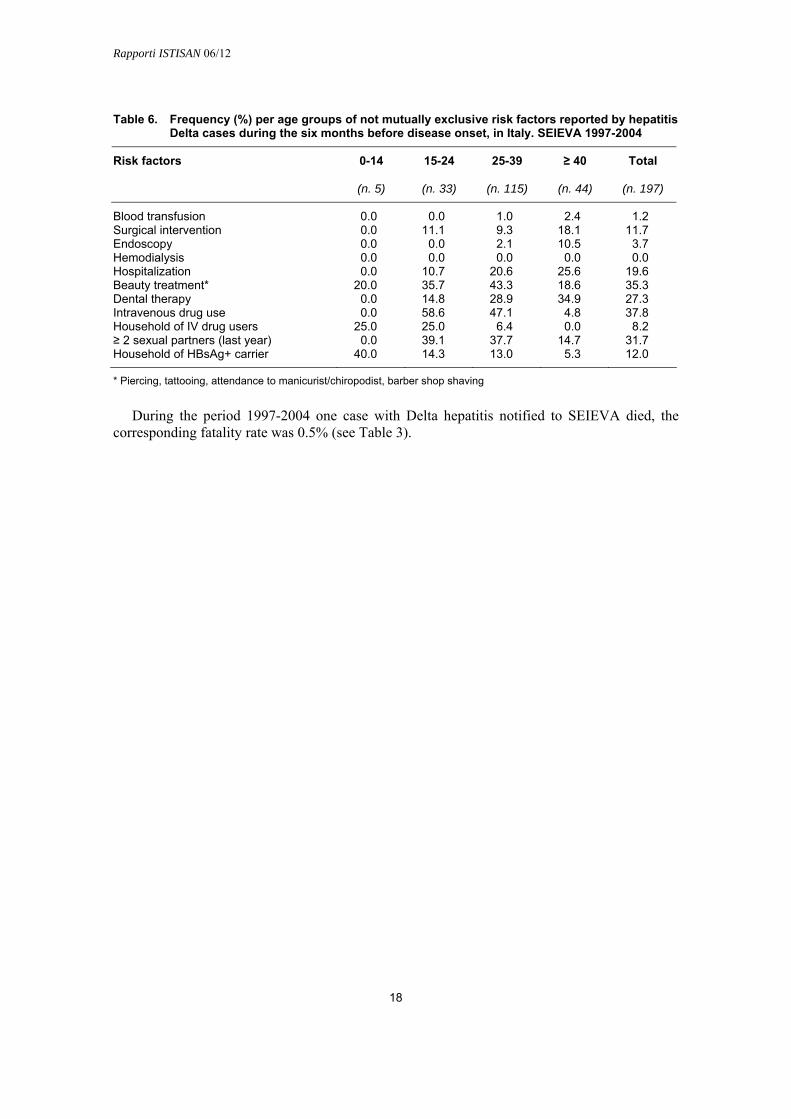
The analysis based on the period from 1997 to 2004 showed that 63.5% of notified Delta cases where coinfections (125/197); 38% where associated with intravenous drug use, this percentage being higher in subjects 15-24 year-old (59%) and 25-39 (47%) (Table 6).
0
0,5
1
1,5
2
2,5
3
3,5
4
4,5
1987 1988 1989 1990 1991 1992 1993 1994 1995 1996 1997 1998 1999 2000 2001 2002 2003 20040
0,5
1
1,5
2
2,5
3
3,5
4
4,5
1987 1988 1989 1990 1991 1992 1993 1994 1995 1996 1997 1998 1999 2000 2001 2002 2003 2004
Rapporti ISTISAN 06/12
18
Table 6. Frequency (%) per age groups of not mutually exclusive risk factors reported by hepatitis Delta cases during the six months before disease onset, in Italy. SEIEVA 1997-2004
0-14 15-24 25-39 ≥ 40 Total Risk factors
(n. 5) (n. 33) (n. 115) (n. 44) (n. 197)
Blood transfusion 0.0 0.0 1.0 2.4 1.2 Surgical intervention 0.0 11.1 9.3 18.1 11.7 Endoscopy 0.0 0.0 2.1 10.5 3.7 Hemodialysis 0.0 0.0 0.0 0.0 0.0 Hospitalization 0.0 10.7 20.6 25.6 19.6 Beauty treatment* 20.0 35.7 43.3 18.6 35.3 Dental therapy 0.0 14.8 28.9 34.9 27.3 Intravenous drug use 0.0 58.6 47.1 4.8 37.8 Household of IV drug users 25.0 25.0 6.4 0.0 8.2 ≥ 2 sexual partners (last year) 0.0 39.1 37.7 14.7 31.7 Household of HBsAg+ carrier 40.0 14.3 13.0 5.3 12.0
* Piercing, tattooing, attendance to manicurist/chiropodist, barber shop shaving
During the period 1997-2004 one case with Delta hepatitis notified to SEIEVA died, the corresponding fatality rate was 0.5% (see Table 3).

Rapporti ISTISAN 06/12
19
EPIDEMIOLOGY OF HEPATITIS C
Hepatitis C virus is a major cause of chronic liver disease, including cirrhosis and hepatocellular carcinoma, worldwide and it is the leading cause of liver transplantation in developed countries. Although the incidence of HCV infection has markedly declined in the last two decades in most of developed countries, the prevalence of HCV-related health consequences is on the rise. This is due to the lag, often more than 20 years, between the onset of infection and the clinical manifestation of chronic liver disease and to the past great diffusion of the virus. The lack of a prophylactic vaccine and quite efficacious antiviral therapy has made a better understanding of HCV infection epidemiology and its primary prevention extremely important.
Prevalence
The most recent WHO estimate of the global prevalence of HCV infection is 2.2%, representing 140 million people (1). The majority of these infected people are, in decreasing order, located in the WHO regions of western Pacific, south-east Asia, Africa and eastern Mediterranean countries. Countries with the highest reported prevalence in general population are located in Africa and Asia. In Africa, Egypt has the highest reported seroprevalence rate, >20% (2); in sub-Saharan Africa, high seroprevalence rates have been found in Cameroon (mean, 13.8%) Burundi (mean, 11.3%) and Gabon (mean, 9.2%) (3). In Asia, high HCV seroprevalence rates among the general population have been found in Taiwan (17%) (4), Mongolia (16%) (5), Pakistan (4.6-15%) (6-7). In China and India, the two Asian countries which hold one-fifth of the world population each, seroprevalences of 3.2% and 0.9% were reported (8), respectively. In Japan, a seroprevalence rate of about 2% has been reported in the general population, although there are hyperendemic communities with rates higher than 15% (9). Overall HCV prevalence rates of 1.6%, 0.8% and 1.1% have been detected in USA (10), Canada (8) and Australia (8), respectively. In Eastern Europe, the prevalence of HCV has been studied in blood donors, with values ranging between 0.7% and 4.9% (11).
In Western Europe, HCV prevalence in the general population varies in the different countries. The overall HCV prevalence rate has been estimated to be 0.6% in Germany (8) and Norway (12), 0.7% in UK (13), 1.1% in France (8), between 0.5% and 1.2% in Greece (14-15), 1-2% in Spain (16-19), and 0.5% in Portugal (20).
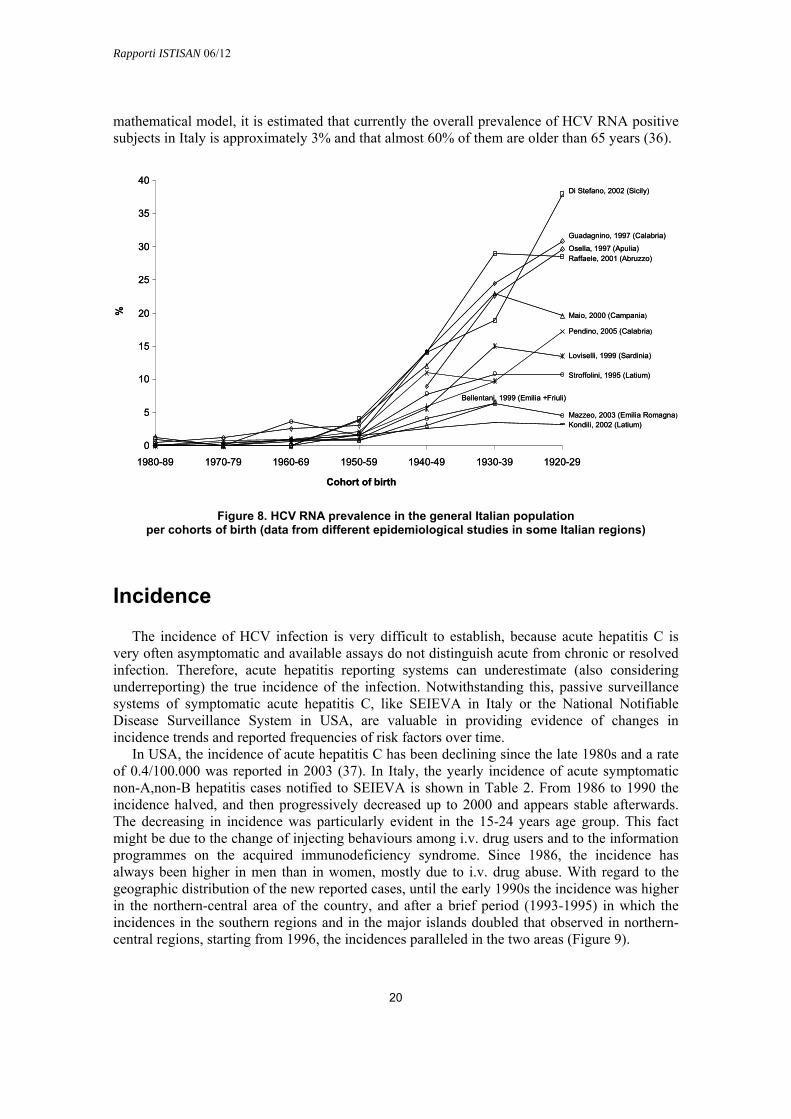
In Italy, no study has been performed in a sample representative of the whole Italian population. HCV prevalence estimates in the general population have been obtained through seroprevalence studies conducted in different areas of the country. According to these studies, the anti HCV prevalence ranges from 3% to 26% (21-32), showing a progressive increase with age (marked increase in subjects born before 1950) and a trend towards higher rates in southern regions and major Islands (Sicily and Sardinia) than in central and northern regions (Figure 8). Thus, in Italy the infection shows a different epidemiological pattern compared to other western countries, because in these latter the prevalence of HCV infection is higher in young adults than in older ones, while the opposite is true in Italy (33-34), suggesting a cohort effect. In fact, it is estimated that in Italy the incidence peaked in the 1950s and the 1960s, principally due to the large use of unsafe therapeutic injection with glass syringes, while, for example, in USA the peak in incidence occurred in 1980s, mainly due to intravenous (i.v.) drug use (35). Through a
Rapporti ISTISAN 06/12
20
mathematical model, it is estimated that currently the overall prevalence of HCV RNA positive subjects in Italy is approximately 3% and that almost 60% of them are older than 65 years (36).
Figure 8. HCV RNA prevalence in the general Italian population per cohorts of birth (data from different epidemiological studies in some Italian regions)
Incidence
The incidence of HCV infection is very difficult to establish, because acute hepatitis C is very often asymptomatic and available assays do not distinguish acute from chronic or resolved infection. Therefore, acute hepatitis reporting systems can underestimate (also considering underreporting) the true incidence of the infection. Notwithstanding this, passive surveillance systems of symptomatic acute hepatitis C, like SEIEVA in Italy or the National Notifiable Disease Surveillance System in USA, are valuable in providing evidence of changes in incidence trends and reported frequencies of risk factors over time.
In USA, the incidence of acute hepatitis C has been declining since the late 1980s and a rate of 0.4/100.000 was reported in 2003 (37). In Italy, the yearly incidence of acute symptomatic non-A,non-B hepatitis cases notified to SEIEVA is shown in Table 2. From 1986 to 1990 the incidence halved, and then progressively decreased up to 2000 and appears stable afterwards. The decreasing in incidence was particularly evident in the 15-24 years age group. This fact might be due to the change of injecting behaviours among i.v. drug users and to the information programmes on the acquired immunodeficiency syndrome. Since 1986, the incidence has always been higher in men than in women, mostly due to i.v. drug abuse. With regard to the geographic distribution of the new reported cases, until the early 1990s the incidence was higher in the northern-central area of the country, and after a brief period (1993-1995) in which the incidences in the southern regions and in the major islands doubled that observed in northern-central regions, starting from 1996, the incidences paralleled in the two areas (Figure 9).
Pendino, 2005 (Calabria)
Raffaele, 2001 (Abruzzo)
Mazzeo, 2003 (Emilia Romagna)Kondili, 2002 (Latium)
Stroffolini, 1995 (Latium)
Maio, 2000 (Campania)
Guadagnino, 1997 (Calabria)
Di Stefano, 2002 (Sicily)
Loviselli, 1999 (Sardinia)
Osella, 1997 (Apulia)
Bellentani, 1999 (Emilia +Friuli)
0
5
10
15
20
25
30
35
40
1980-89 1970-79 1960-69 1950-59 1940-49 1930-39 1920-29
Cohort of birth
%

Rapporti ISTISAN 06/12
21
Figure 9. Incidence rates of reported non-A,non-B acute hepatitis cases by geographic area in Italy. SEIEVA 1986-2004
Since 1993, on average 98% of notified non-A non-B hepatitis cases are tested for anti-HCV, with a mean positivity rate of 77%. In 2004, the incidence rate of HCV positive non-A,non-B hepatitis was 0.5/100.000 (see Table 2).The estimated cases-fatality rate of acute hepatitis C reported in the period 1997-2004, has been 0.23% (see Table 3).
Because the direct measurement of acute symptomatic hepatitis C cases underestimate the true incidence of the infection, researchers have relied upon mathematical model to infer trends in incidence with the aim of estimate the past and future burden of disease in their countries. In the USA, the Centers for Disease Control and Prevention (CDC) has modelled trends in incidence by using a mathematical “catalytic model”. This model showed a large increase in the incidence from the late 1960s to the early 1980s, a peak during the 1980s and an important decrease in the 1990s. In 2000s about 9-11/100.000 new infection per year are estimated to occur in USA (37) Other mathematical models to infer hepatitis C incidence trends have been used in France (38), Switzerland (39) and Australia (40). In France a similar trend of increasing incidence through the 1980s was estimated. In Switzerland a peak in incidence of new infection has been estimate to occur in 1980s, followed by a decrease since 1990. In Australia the modelling showed a steady increase of new HCV infection from 1961 to 2001. We also evaluated the past incidence and the future burden of disease in Italy (36) by using a mathematical model that showed, as stated before, a marked increase in incidence in the 1950s and the 1960s, and a progressive decreasing in the following years. Since 2000 about 6-8/100.000 new infections per year are estimated to occur in Italy.
0
1
2
3
4
5
6
7
1986 1987 1988 1989 1990 1991 1992 1993 1994 1995 1996 1997 1998 1999 2000 2001 2002 2003 2004
North-Centre
South-Islands
0
1
2
3
4
5
6
7
1986 1987 1988 1989 1990 1991 1992 1993 1994 1995 1996 1997 1998 1999 2000 2001 2002 2003 2004
North-Centre
South-Islands

Rapporti ISTISAN 06/12
22
Risk factors
HCV infection is a blood-born infection that can be transmitted by a variety of routes. It is most efficiently transmitted by large or repeated percutaneous exposure to contaminated blood, such as through transfusion, organ transplantation from an infected donor or intravenous drug use. Transmission may also occur from parenteral exposure in health care setting (particularly during medical or surgical invasive procedures), exposure to infected household contacts, perinatal exposure, sexual intercourse with infected partners and parenteral exposure during beauty treatment (41-42). The impact of specific modalities of HCV spread may vary over time and among different countries. After the introduction of anti-HCV screening of blood and organ donations there has been a marked reduction in the incidence of transfusion-associated hepatitis C at least in developed countries (41-42), and in these countries, characterized by low or moderate prevalence rates of infection, nowadays intravenous drug use and diagnostic or therapeutic procedures in healthcare setting, having sexual intercourse with multiple partners, and other parenteral exposure such as tattooing or piercing, seems to be the most frequent modes of transmission. Many countries in the developing world do not screen blood donations and it is estimated that in the developing world 43% of blood donations is not adequately screened for blood-borne virus, including HCV (41). In these countries blood transfusion and unsafe therapeutic injection or other medical procedures are currently the most important risk factors for the acquisition of HCV infection.
The frequency of not mutually exclusive risk factors reported by cases of acute hepatitis C notified to SEIEVA from 1997 to 2004 is shown in Table 7. Intravenous drug use, beauty treatment, hospitalization, surgical intervention, dental therapy and having more than 2 sexual partners were in decreasing order, the most frequently reported risk factors.
Table 7. Frequency (%) per age groups of not mutually exclusive risk factors reported by hepatitis C cases during the six months before disease onset, in Italy. SEIEVA 1997-2004
0-14 15-24 25-39 ≥ 40 Total Risk factors
(n. 18) (n. 349) (n. 646) (n. 668) (n. 1,681)
Blood transfusion 18.7 1.3 1.1 12.5 5.9 Surgical intervention 31.3 13.8 17.0 35.2 23.8 Endoscopy 14.3 2.6 4.7 16.6 9.0 Hemodialysis 6.2 0.9 0.3 6.3 2.9 Hospitalization 43.8 14.4 16.0 42.7 26.4 Beauty treatment* 12.5 36.4 30.5 20.5 27.6 Dental therapy 6.7 28.7 25.8 19.6 23.8 Intravenous drug use 13.3 60.9 46.0 3.0 31.9 Household of IV drug users 6.2 10.3 10.8 0.8 6.6 ≥ 2 sexual partners (last year) 11.1 35.2 26.7 6.7 20.9 Household of HBsAg+ carrier 28.6 15.6 18.1 8.3 13.5
* Piercing, tattooing, attendance to manicurist/chiropodist, barber shop shaving
In recent years, we investigated in detail, through case-control studies, the role of some of these risk factors in the spread of HCV infection in Italy. Certain beauty treatments, such as tattooing and piercing, have been found to be significantly associated with acute HCV infection; a strong association was found in particular for tattooing (43). For most of surgical or medical invasive procedures a significant association with acute HCV infection has been found. The strongest associations were found, in decreasing order, with obstetric/gynaecological,

Rapporti ISTISAN 06/12
23
0
5
10
15
20
25
30
35
40
45
1991 1992 1993 1994 1995 1996 1997 1998 1999 2000 2001 2002 2003 2004
%
i.v.d. use blood trans. surgery endoscopyhaemodialisis beauty treat. ≥2 sex. part.
0
5
10
15
20
25
30
35
40
45
1991 1992 1993 1994 1995 1996 1997 1998 1999 2000 2001 2002 2003 2004
%
i.v.d. use blood trans. surgery endoscopyhaemodialisis beauty treat. ≥2 sex. part.i.v.d. use blood trans. surgery endoscopyhaemodialisis beauty treat. ≥2 sex. part.
abdominal and ophtalmological interventions (44). As far as having sex with 2 or more sexual partners is concerned, we found that this sexual behavior is an independent predictor of the likelihood of acquiring hepatitis C. The risk of acute hepatitis C was found to be 2.0 times higher for subjects with 2 sexual partners during the six months before disease onset and 2.8 times higher for subjects with 3 or more sexual partners, as compared to subjects with less than 2 sexual partners (45).
As regard the frequency of reported risk factors by age-groups, it is to note that of the notified cases aged 15-24 years and 25-39 years more than half were intravenous drug users and more than a third of the cases aged less than 15 years or more than 39 years reported surgery or hospitalization.
The trend over time of the reported frequency of some of major risk factors is shown in Figure 10.
Figure 10. Frequency (%) of not mutually exclusive risk factors reported by hepatitis C cases during the six months before disease onset, in Italy, by year. SEIEVA 1991-2004
It is possible to appreciate a progressive increase over time of the cases reporting surgery, and endoscopy, while intravenous drug use shows a steadily trend, with the exception of a brief progressive increase during 1998-2000. The increasing trends in frequency of cases who report endoscopy, might merely be due to the increasing number of people who overtime undergo diagnostic or therapeutic endoscopy (especially gastrointestinal) in Italy. It is worthy of note that starting from 1999 the frequency of acute cases reporting blood transfusion is increased, as well as the absolute incidence of the cases associated with blood transfusion. It is difficult to explain this trend. Of the 139 cases who reported blood transfusion between 1997 and 2004, only 20 had this risk factor as the unique exposure at risk of infection. In all but three cases in which look-back analysis of blood donations was available the results were negative. In the three cases, all detected in 1998, in which the look back analysis gave a positive result, a blood donor with asymptomatic acute infection, not yet seroconverted at the time of his donation, was
Rapporti ISTISAN 06/12
24
identified. In Italy, the residual risk of transfusion-transmitted hepatitis C has been estimated in two studies to be 4.35/1.000.000 donations and 7.9/1.000.000 donations, respectively (46-47). The introduction of NAT, which became mandatory in 2002, for detecting HCV RNA in blood donations should account an 80% reduction in the estimated residual risk. Thus, it seems unlikely that in the cases reporting transfusion as risk factors the infection has been actually caused by a contaminated blood donation. A possible explanation of the increasing frequency of cases who report transfusion as risk factor, is that blood transfusion are always performed in hospital setting, very often in occasion of major surgery intervention, so that this increasing trend probably mirrors the increasing trend of cases reporting surgery or hospitalization, which represent more likely frequent possible ways of transmission. It is worthy to note that 22.5% of the notified cases do not report any recognized risk factor for the acquisition of the infection. This finding makes we think that other unidentified or underestimated routes of transmission might be important. However, we can not exclude that many of these patients who did not report risk factors might be cases of misclassified chronic hepatitis or persons who voluntarily denied risky behaviors (e.g. drug abuse).
Conclusion
The incidence of hepatitis C is decreasing in Italy. Unlike other developed countries, we also estimate a decreasing in HCV-related health consequences in the next future. Intravenous drug use, diagnostic or therapeutic procedures, having sex with multiple partners, and beauty treatments seem nowadays to be the most frequent modes of transmission in our country. Since the lack of an effective HCV vaccine, educational programs concerning safe injection practices among drug users, information programs concerning at risk sexual behaviors among the general population, and the carefully observance of infection control measures in hospital setting need to be further implemented.
References
1. The Global Burden of Hepatitis C Working Group. Global burden of disease (GBD) for hepatitis C. J Clin Pharmacol 2004;44:20-9.
2. Frank C, Mohamed MK, Strickland GT, Lavanchy D, Arthur RR, Magder LS, El Khoby T, Abdel-Wahab Y, Aly Ohn ES, Anwar W, Sallam I. The role of parenteral antischistosomal therapy in the spread of hepatitis C virus in Egypt. Lancet 2000;355(9207):887-91.
3. Madhava V, Burgess C, Drucker E. Epidemiology of chronic hepatitis C virus infection in sub-Saharan Africa. Lancet Infect Dis 2002;2:293-302.
4. Wang CS, Chang TT, Yao WJ, Chou P. Comparison of hepatitis B virus and hepatitis C virus prevalence and risk factors in a community-based study. Am J Trop Med Hyg 2002;66(4):389-93.
5. Takahashi M, Nishizawa T, Gotanda Y, Tsuda F, Komatsu F, Kawabata T, Hasegawa K, Altankhuu M, Chimedregzen U, Narantuya L, Hoshino H, Hino K, Kagawa Y, Okamoto H. High prevalence of antibodies to hepatitis A and E viruses and viremia of hepatitis B, C, and D viruses among apparently healthy populations in Mongolia. Clin Diagn Lab Immunol 2004;11(2):392-8.
6. Muhammad N, Jan MA. Frequency of hepatitis C in Buner, NWFP. J Coll Physicians Surg Pak 2005;15:11-4.

Rapporti ISTISAN 06/12
25
7. Aslam M, Aslam J, Mitchell BD, Munir KM. Association between smallpox vaccination and hepatitis C antibody positive serology in Pakistani volunteers. J Clin Gastroenterol. 2005;39(3):243-6.
8. Shepard CW, Finelli L, Alter MJ. Global epidemiology of hepatitis C virus infection. Lancet Infect Dis 2005; 5:558-567.
9. Higuchi M, Tanaka E, Kiyosawa K. Epidemiology and clinical aspects on hepatitis C. Jpn J Infect Dis 2002; 55:69-77.
10. Armstron E, Simard P, Wasley A, et al. The prevalence of hepatitis C virus (HCV) infection in the United States. 54th annual meeting of the American Association of the Society for Liver Diseases (AASLD). Boston, MA, October 24-28, 2003.
11. Naumov NV. Hepatitis C virus infection in Eastern Euorpe. J Hepatol 1999;31(Sippl 1):84-7.
12. Dalgard O, Jeansson S, Skaug K, Raknerud N, Bell H. Hepatitis C in the general adult population of Oslo: prevalence and clinical spectrum. Scand J Gastroenterol. 2003 Aug;38(8):864-70.
13. Balogun MA, Ramsey ME, Hesketh LM et al. The prevalence of hepatitis C in England and Wales. J Infection 2002;45:219-26.
14. Gogos CA, Fouka KP, Nikiforidis G, Avgeridis K, Sakellaropoulos G, Bassaris H, Maniatis A, Skoutelis A. Prevalence of hepatitis B and C virus infection in the general population and selected groups in South-Western Greece. Eur J Epidemiol 2003;18(6):551-7.
15. Goritsas C, Plerou I, Agaliotis S, Spinthaki R, Mimidis K, Velissaris D, Lazarou N, Labropoulou-Karatza C. HCV infection in the general population of a Greek island: prevalence and risk factors. Hepatogastroenterology 2000;47(33):782-5.
16. Garcia-Fulgueiras A, Tormo MJ, Rodriguez T, Perez-Flores D, Chirlaque D, Navarro C. Prevalence of hepatitis B and C markers in the south-east of Spain: an unlinked community-based serosurvey of 2,203 adults. Scand J Infect Dis 1996;28(1):17-20.
17. Sacristan B, Gastanares MI, Elena A, Sacristan M, Barcenilla J, Garcia JC, Yanguela J. Seroepidemiologic study of hepatitis C virus infection in a general population from the region of La Rioja, Spain. Med Clin (Barc) 1996;107(9):331-5.
18. Suarez A, Viejo G, Navascues CA, Garcia R, Diaz G, Saro C, Roman FJ. The prevalence of hepatitis A, B and C viral markers in the population of Gijon between 26 and 65 years old Gastroenterol Hepatol. 1997 Aug-Sep;20(7):347-52.
19. Riestra S, Fernandez E, Leiva P et al. Prevalence of hepatitis Cvirus infection in the general population of northern Spain. Eur J Gastroenterol Hepatol 2001;13:477-81.
20. Santos A, Carvalho A, Bento D, Sa R, Tomaz J, Rodrigues V, Pais L, Porto A. Epidemiology of hepatitis C in central Portugal. Prevalence of anti-HCV in the population of the Coimbra District. Acta Med Port 1994;7 Suppl 1:S3-8.
21. Stroffolini T, Menchinelli M, Taliani G, Dambruoso V, Poliandri G, Bozza A, et al. High prevalence of hepatitis C virus infection in a small central Italian town: lack of evidence of parenteral exposure. Ital J Gastroenterol 1995;27:235-8.
22. Bellentani S, Pozzato G, Saccoccio G, Crovatto M, Crocè LS, Mazzoran L, et al. Clinical course and risk factors of hepatitis C virus related liver disease in the general population: report from the Dionysos study. Gut 1999;44:874-880.
23. Maggi G, Armitano S, Brambilla L, Brenna M, Cairo M, Galvani G, et al. Hepatitis C infection in an Italian population not selected for risk factors. Liver 1999;19:427-31.
24. Mazzeo C, Azzaroli F, Giovanelli S, Dormi A, Festi D, Colecchia A, et al. Ten year incidence of HCV infection in northern Italy and frequency of spontaneous viral clearance. Gut 2003;52:1030-4.

Rapporti ISTISAN 06/12
26
25. Osella AR, Misciagna G, Leone A, Di Leo A, Fiore G. Epidemiology of hepatitis C virus infection in an area of Southern Italy. J Hepatol 1997;27:30-5.
26. Raffaele A, Valenti M, Iovenitti M, Metani A, Bruno ML, Altobelli E, et al. High prevalence of HCV infection among the general population in a rural area of central Italy. Eur J Epidemiol 2001;17:41-6.
27. Guadagnino V, Stroffolini T, Rapicetta M, Costantino A, Kondili LA, Menniti-Ippolito F, et al. Prevalence, risk factors and genotype distribution of hepatitis C virus infection in the general population: a community-based survey in Southern Italy. Hepatology 1997;26:1006-11.
28. Kondili LA, Chionne P, Costantino A, Villano U, Lo Noce C, Pannozzo F, et al. Infection rate and spontaneous seroreversion of anti-hepatitis C virus during the natural course of hepatitis C virus infection in the general population. Gut 2002;50:693-6.
29. Maio G, D’Argenio P, Stroffolini T, Bozza A, Sacco L, Tosti ME, et al. Hepatitis C virus infection and alanine transaminase levels in the general population: a survey in a Southern Italian town. J Hepatol 2000;33:116-20.
30. Di Stefano R., Stroffolini T, Ferraro D, Usticano A, Valenza LM, Montalbano L, et al. Endemic hepatitis C virus infection in a Sicilian town: further evidence for iatrogenic trasmission. J Med Virol 2002;67:339-44.
31. Pendino GM, Mariano A, Surace P, Caserta CA, Fiorillo MT, Amante A, et al. Prevalence and etiology of altered liver tests: a population-based survey in a Mediterranean town. Hepatology 2005;41:1151-9.
32. Loviselli A, Oppo A, Velluzzi F et al. Independent expression of serological markers of thyroid autoimmunity and hepatitis virus C infection in the general population: results of a community-based study in north-western Sardinia. J Endocrinol Invest 1999;22:660-5.
33. Alter MJ, Kruszon-Moran D, Nainan OV, McQuillan GM, Gao F, Moyer LA, et al. The prevalence of hepatitis C virus infection in the United States, 1988 though 1994. N Engl J Med 1999;341:556-62.
34. Stroffolini T, D’Argenio P, Mele A. Prevalence of hepatitis C virus infection in the United States. N Engl J Med 1999;341:2094.
35. Armstrong GL, Alter MJ, McQuillan GM, Margolis HS. The past incidence of hepatitis C virus infection: implications for the future burden of chronic liver disease in the United States. Hepatology 2000;31(3):777-82.
36. Mariano A, Tomba G, Tosti ME, Spada E, Mele A. Future burden of hepatitis C virus infection: the case of Italy. In: 41st Annual Meeting of the European Association for the Study of the Liver (EASL). Vienna, Austria, April 26-30, 2006.
37. Centers of Disease Control and Prevention. Hepatitis surveillance. Atlanta, GA: US Department of Health and Human Services, Centers of Disease Control and Prevention; 2005. (Report No. 60)
38. Deuffic S, Buffat L, Poynard T, Valleron AJ. Modeling the hepatitis C virus epidemic in France. Hepatology 1999;29(5):1596-601.
39. Sagmeister M, Renner EL, Mullhaupt B, Wong JB. Simulation of hepatitis C based on a mandatory reporting system. Eur J Gastroenterol Hepatol 2002;14:25-34.
40. Law MG, Dore GJ, Bath N, Thompson S, Crofts N, Dolan K, Giles W, Gow P, Kaldor J, Loveday S, Powell E, Spencer J, Wodak A. Modelling hepatitis C virus incidence, prevalence and long-term sequelae in Australia, 2001. Int J Epidemiol 2003;32(5):717-24.
41. Shepard CW, Finelli L, Alter MJ. Global epidemiology of hepatitis C virus infection. Lancet Infect Dis 2005;5(9):558-67.
42. Pellicano R, Mladenova I, Dimitrova SM, Bruno CM, Sciacca C, Rizzetto M. The epidemiology of hepatitis C virus infection. An update for clinicians. Minerva Gastroenterol Dietol 2004;50(1):1-7.
Rapporti ISTISAN 06/12
27
43. Mariano A, Mele A, Tosti ME, Parlato A, Gallo G, Ragni P, Zotti C, Lopalco P, Pompa MG, Graziani G, Stroffolini T. Role of beauty treatment in the spread of parenterally transmitted hepatitis viruses in Italy. J Med Virol 2004;74(2):216-20.
44. Mele A, Spada E, Sagliocca L, Ragni P, Tosti ME, Gallo G, Moiraghi A, Balocchini E, Sangalli M, Lopalco PL, Stroffoli T. Risk of parenterally transmitted hepatitis following exposure to surgery or other invasive procedures: results from the hepatitis surveillance system in Italy. J Hepatol 2001;35(2):284-9.
45. Mele A, Stroffolini T, Tosti ME, et al. Heterosexual transmission of hepatitis C in Italy. J Med Virol 1999;57:111-3.
46. Tosti ME, Solinas S, Prati D et al. An estimate of the current risk of transmitting blood-borne infections through blood transfusion in Italy. Brit J Haematol 2002;117:215-9.
47. Velati C, Romano L, Baruffi L, Pappalettera M, Carreri V, Zanetti AR. Residual risk of transfusion-transmitted HCV and HIV infections by antibody-screened blood in Italy. Transfusion 2002;42(8):989-93.

Rapporti ISTISAN 06/12
28
EPIDEMIOLOGY OF NON-A,NON-DELTA HEPATITIS
There are cases of notified acute hepatitis that, on the basis of the diagnostic criteria adopted by SEIEVA (see Table 1), cannot be included in any of the known classical type of acute viral hepatitis specifically surveilled by SEIEVA (i.e. hepatitis A, B, C, Delta). We therefore defined them as non-A,non-Delta hepatitis.
These cases, clinically indistinguishable from other classical type of acute viral hepatitis, are characterized by having negative serological test for IgM anti-HBc, IgM anti-HAV, anti-HCV antibodies, and anti-HDV regardless of HBsAg status. Indeed, part of these cases might be represented by individuals with acute hepatitis C, who have not yet seroconverted or by individuals infected with Hepatitis E Virus (HEV), that seems to be responsible of nearly 10% of the acute hepatitis cases diagnosed in infectious disease unit in Italy and France (1). Another minimal part of these non-A,non-Delta cases might be probably due to the so called minor hepatitis-related virus, particularly Epstein-Barr Virus (EBV) and CytoMegaloVirus (CMV), which are estimated to be responsible of about 2% each of the diagnosed acute hepatitis, respectively (1).
We are unable to quantify the contribution of these events to the total number of the cases notified to SEIEVA, since this system do not provide the collection of data on anti-HEV, HCV RNA, anti-EBV and CMV test’s results. Other possible known etiological agents responsible of these non-A,non-Delta cases might be autoimmune diseases, Wilson disease, alcohol, mushroom intoxication, chemical agents and drugs. The drugs which can cause acute hepatitis include not only some largely used medical remedies, such as NSAIDs, isoniazid, methotrexate, ketoconazole, antidepressant, antiretroviral, etc., but also illegal compounds, such as cocaine and ecstasy (2).
At present non-A,non-Delta hepatitis represents nearly 2% of the cases notified to SEIEVA (Figure 3). In Table 2 non-A,non-Delta hepatitis yearly incidence rates are reported since 1993. Starting from this year more reliable data were available for this type of hepatitis. In fact, in 1993 the more sensitive II generation anti-HCV assays became widely available and used. Furthermore, since 1993, on average 98% of notified non-A,non-B hepatitis cases are tested for anti-HCV, with a mean positivity rate of 77%. It is possible to appreciate a slow decreasing trend in incidence from 1993 to 2000 and a stable incidence around 0.1/100.000 afterwards. The case-fatality rate estimated in the period 1997-2004, has resulted to be 0.44% (see Table 3).
Table 8 shows the reported frequency of risk factors among non-A,non-Delta hepatitis cases.
Overall, the most frequently reported risk factors were shellfish consumption and drug consumption (more than one-third each). Interestingly, more than half of the cases aged ≥ 40 years reported drug consumption, even if one has to take into account that the intake of drugs in the general population usually increases by age.
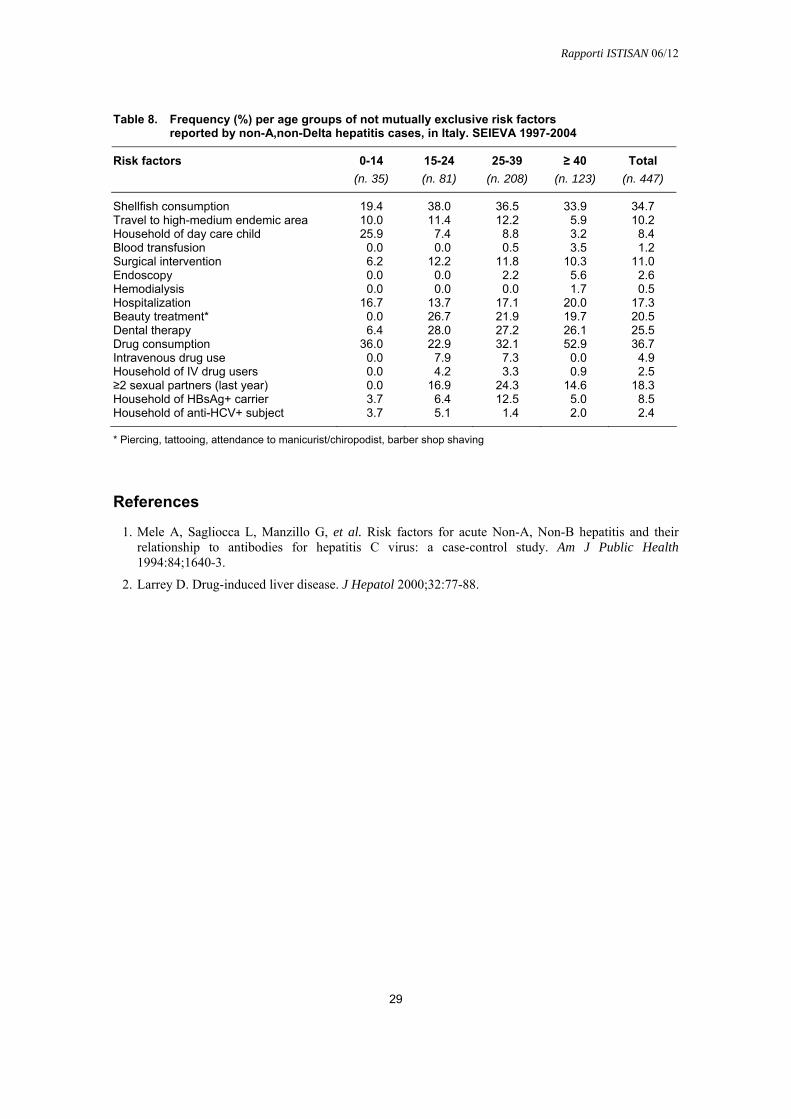
Rapporti ISTISAN 06/12
29
Table 8. Frequency (%) per age groups of not mutually exclusive risk factors reported by non-A,non-Delta hepatitis cases, in Italy. SEIEVA 1997-2004
0-14 15-24 25-39 ≥ 40 Total Risk factors (n. 35) (n. 81) (n. 208) (n. 123) (n. 447)
Shellfish consumption 19.4 38.0 36.5 33.9 34.7 Travel to high-medium endemic area 10.0 11.4 12.2 5.9 10.2 Household of day care child 25.9 7.4 8.8 3.2 8.4 Blood transfusion 0.0 0.0 0.5 3.5 1.2 Surgical intervention 6.2 12.2 11.8 10.3 11.0 Endoscopy 0.0 0.0 2.2 5.6 2.6 Hemodialysis 0.0 0.0 0.0 1.7 0.5 Hospitalization 16.7 13.7 17.1 20.0 17.3 Beauty treatment* 0.0 26.7 21.9 19.7 20.5 Dental therapy 6.4 28.0 27.2 26.1 25.5 Drug consumption 36.0 22.9 32.1 52.9 36.7 Intravenous drug use 0.0 7.9 7.3 0.0 4.9 Household of IV drug users 0.0 4.2 3.3 0.9 2.5 ≥2 sexual partners (last year) 0.0 16.9 24.3 14.6 18.3 Household of HBsAg+ carrier 3.7 6.4 12.5 5.0 8.5 Household of anti-HCV+ subject 3.7 5.1 1.4 2.0 2.4
* Piercing, tattooing, attendance to manicurist/chiropodist, barber shop shaving
References
1. Mele A, Sagliocca L, Manzillo G, et al. Risk factors for acute Non-A, Non-B hepatitis and their relationship to antibodies for hepatitis C virus: a case-control study. Am J Public Health 1994:84;1640-3.
2. Larrey D. Drug-induced liver disease. J Hepatol 2000;32:77-88.

Rapporti ISTISAN 06/12
30
EPIDEMIOLOGY OF HEPATITIS OF UNSPECIFIED AETIOLOGY
There are case of acute hepatitis notified to SEIEVA for which the results of the serological tests, that from the clinical records have to be carried over into the epidemiological questionnaire (SEIEVA form), do not allow, on the basis of the diagnostic criteria adopted (see Table 1), any possible classification of a specific type of hepatitis. Since 1997, on average 2% of the cases notified cannot be classified and are indicated as cases of hepatitis of unspecified aetiology. The percentage of these cases was higher in the years before 1997, and the subsequent decreasing in percentage (see Figure 3) has to be interpreted as a result of the surveillance system’s reinforcement over time. Similarly, the incidence of cases of unspecified aetiology has been slowly decreasing over time. The case-fatality rate in the period 1997-2004 has been 0.29% (see Table 3). Overall, in the period 1997-2004, the most frequently reported risk factors among the cases of hepatitis of unspecified aetiology were shellfish consumption and drug consumption (Table 9).
Table 9. Frequency (%) per age groups of not mutually exclusive risk factors reported by hepatitis cases of unspecified etiology, in Italy. SEIEVA 1997-2004
0-14 15-24 25-39 ≥ 40 Total Risk factors
(n. 142) (n. 256) (n. 596) (n. 341) (n. 1,335)
Shellfish consumption 48.3 57.7 52.1 35.0 48.2 Travel to high-medium endemic area 16.7 11.7 17.2 9.5 14.1 Household of day care child 24.4 4.4 13.5 6.5 11.1 Blood transfusion 0.8 0.0 0.8 8.8 2.7 Surgical intervention 3.4 7.9 13.6 24.4 14.3 Endoscopy 0.0 1.0 3.2 9.2 4.0 Hemodialysis 0.0 0.0 0.2 2.1 0.6 Hospitalization 4.7 12.8 10.6 25.8 14.5 Beauty treatment* 3.5 33.0 27.8 24.7 25.5 Dental therapy 4.6 27.1 26.3 26.6 24.4 Drug consumption 29.5 41.2 37.4 56.2 42.2 Intravenous drug use 0.0 24.5 16.3 1.0 12.2 Household of IV drug users 1.2 7.0 5.9 0.0 4.2 ≥ 2 sexual partners (last year) 0.0 29.1 30.0 11.6 21.7 Household of HBsAg+ carrier 14.6 13.9 10.8 9.1 11.3 Household of anti-HCV+ subject 4.9 5.3 3.6 0.9 3.4
* Piercing, tattooing, attendance to manicurist/chiropodist, barber shop shaving
It is impossible to infer anything about the actual viral aetiology of these unknown hepatitis, however looking at the distribution by age of some reported risk factors, particularly shellfish consumption, to be household of a HBsAg carrier and intravenous drug use, it seems likely that most of them might be cases of A or B hepatitis, rather than cases of hepatitis C (see Table 9 in comparison with Tables 4, 5 and 7).

La riproduzione parziale o totale dei Rapporti e Congressi ISTISAN deve essere preventivamente autorizzata.
Le richieste possono essere inviate a: [email protected].
Stampato da Tipografia Facciotti srl Vicolo Pian Due Torri 74, 00146 Roma
Roma, marzo 2006 (n. 1) 13° Suppl.


![N. Calzolari [FLaReNet]NEERI Workshop, Helsinki, September 20091 e Content plus Standards: strength and limitations … LMF Nicoletta Calzolari glottolo@ilc.cnr.it](https://img.pdfslide.us/doc/110x75/5518d33955034638098b51a1/n-calzolari-flarenetneeri-workshop-helsinki-september-20091-e-content-plus-standards-strength-and-limitations-lmf-nicoletta-calzolari-glottoloilccnrit.jpg)


![[Domeniconi] Koyunbaba (Guitare, 19p)](https://img.pdfslide.us/doc/110x75/55cf8fac550346703b9eb03c/domeniconi-koyunbaba-guitare-19p.jpg)