Embed Size (px)
Citation preview
ANNEX A
Epidemiological studies of radiation and cancer
Contents
Page
INTRODUCTION . . . . . . . . . . . . . . . . . . . . . . . . . . . . . . . . . . . . . . . . . . . . . . . . . . . . . . . . . . . . . . . . . . . . . . . . . . . . 17
I. FEATURES OF EPIDEMIOLOGICAL STUDIES . . . . . . . . . . . . . . . . . . . . . . . . . . . . . . . . . . . . . . . . . . . . . . . . . . 19A. Criteria for good-quality epidemiological studies . . . . . . . . . . . . . . . . . . . . . . . . . . . . . . . . . . . . . . . . . . 19B. Impact of dose level on statistical power and sample size . . . . . . . . . . . . . . . . . . . . . . . . . . . . . . . . . 21C. Impact of dose levels on the precision of risk estimates . . . . . . . . . . . . . . . . . . . . . . . . . . . . . . . . . . . 24D. Impact of dose measurement error and other uncertainties on study associations . . . . . . . . . . . . . . . 25E. Use of biodosimetry for epidemiological studies of radiation risk . . . . . . . . . . . . . . . . . . . . . . . . . . . . . 26F. Problem of multiple comparisons in epidemiological studies of radiation risk . . . . . . . . . . . . . . . . . . . 28G. Measures of radiation risk, including lifetime risk . . . . . . . . . . . . . . . . . . . . . . . . . . . . . . . . . . . . . . . . . 29H. Transfer of radiation risk estimates between populations, and interactions of carcinogens . . . . . . . . 29I. Impact of human genetic susceptibility on radiation risk . . . . . . . . . . . . . . . . . . . . . . . . . . . . . . . . . . . 32J. Effects of dose protraction or fractionation and radiation quality . . . . . . . . . . . . . . . . . . . . . . . . . . . . . 33K. Thresholds and other departures from linear–quadratic curvature . . . . . . . . . . . . . . . . . . . . . . . . . . . . 37L. Effect of age at exposure, latency and time since exposure . . . . . . . . . . . . . . . . . . . . . . . . . . . . . . . . 40
II. NEW OR UPDATED STUDIES . . . . . . . . . . . . . . . . . . . . . . . . . . . . . . . . . . . . . . . . . . . . . . . . . . . . . . . . . . . . . 45A. Survivors of the atomic bombings in Japan (LSS) . . . . . . . . . . . . . . . . . . . . . . . . . . . . . . . . . . . . . . . . 45B. Mayak worker study . . . . . . . . . . . . . . . . . . . . . . . . . . . . . . . . . . . . . . . . . . . . . . . . . . . . . . . . . . . . . . . . 47C. Techa River study . . . . . . . . . . . . . . . . . . . . . . . . . . . . . . . . . . . . . . . . . . . . . . . . . . . . . . . . . . . . . . . . . . 48D. Semipalatinsk weapons test site fallout . . . . . . . . . . . . . . . . . . . . . . . . . . . . . . . . . . . . . . . . . . . . . . . . . 49E. International worker study . . . . . . . . . . . . . . . . . . . . . . . . . . . . . . . . . . . . . . . . . . . . . . . . . . . . . . . . . . . 49F United States medical radiologic technologists . . . . . . . . . . . . . . . . . . . . . . . . . . . . . . . . . . . . . . . . . . . 50G. Chinese radiologists and technologists . . . . . . . . . . . . . . . . . . . . . . . . . . . . . . . . . . . . . . . . . . . . . . . . . . 51H. Studies of aircrew . . . . . . . . . . . . . . . . . . . . . . . . . . . . . . . . . . . . . . . . . . . . . . . . . . . . . . . . . . . . . . . . . . 51I. Patients treated with radiation . . . . . . . . . . . . . . . . . . . . . . . . . . . . . . . . . . . . . . . . . . . . . . . . . . . . . . . . 52J. Worker and public exposure to uranium . . . . . . . . . . . . . . . . . . . . . . . . . . . . . . . . . . . . . . . . . . . . . . . . 53
III. SITE-SPECIFIC CANCERS . . . . . . . . . . . . . . . . . . . . . . . . . . . . . . . . . . . . . . . . . . . . . . . . . . . . . . . . . . . . . . . . . 55A. Total solid cancers . . . . . . . . . . . . . . . . . . . . . . . . . . . . . . . . . . . . . . . . . . . . . . . . . . . . . . . . . . . . . . . . . 56B. Salivary gland cancer . . . . . . . . . . . . . . . . . . . . . . . . . . . . . . . . . . . . . . . . . . . . . . . . . . . . . . . . . . . . . . . 56
1. General background . . . . . . . . . . . . . . . . . . . . . . . . . . . . . . . . . . . . . . . . . . . . . . . . . . . . . . . . . . . . 562. Summary of UNSCEAR 2000 . . . . . . . . . . . . . . . . . . . . . . . . . . . . . . . . . . . . . . . . . . . . . . . . . . . . . 563. New or updated studies . . . . . . . . . . . . . . . . . . . . . . . . . . . . . . . . . . . . . . . . . . . . . . . . . . . . . . . . 564. Summary . . . . . . . . . . . . . . . . . . . . . . . . . . . . . . . . . . . . . . . . . . . . . . . . . . . . . . . . . . . . . . . . . . . . 57
C. Oesophageal cancer . . . . . . . . . . . . . . . . . . . . . . . . . . . . . . . . . . . . . . . . . . . . . . . . . . . . . . . . . . . . . . . . 581. General background . . . . . . . . . . . . . . . . . . . . . . . . . . . . . . . . . . . . . . . . . . . . . . . . . . . . . . . . . . . . 582. Summary of UNSCEAR 2000 . . . . . . . . . . . . . . . . . . . . . . . . . . . . . . . . . . . . . . . . . . . . . . . . . . . . . 58
13
UNSCEAR REPORT-PART 1.qxp 10/7/08 2:57 pm Page 13
14 UNSCEAR 2006 REPORT: VOLUME I
Page
3. New or updated studies . . . . . . . . . . . . . . . . . . . . . . . . . . . . . . . . . . . . . . . . . . . . . . . . . . . . . . . . 584. Summary . . . . . . . . . . . . . . . . . . . . . . . . . . . . . . . . . . . . . . . . . . . . . . . . . . . . . . . . . . . . . . . . . . . . 59
D. Stomach cancer . . . . . . . . . . . . . . . . . . . . . . . . . . . . . . . . . . . . . . . . . . . . . . . . . . . . . . . . . . . . . . . . . . . 591. General background . . . . . . . . . . . . . . . . . . . . . . . . . . . . . . . . . . . . . . . . . . . . . . . . . . . . . . . . . . . . 592. Summary of UNSCEAR 2000 . . . . . . . . . . . . . . . . . . . . . . . . . . . . . . . . . . . . . . . . . . . . . . . . . . . . . 593. New or updated studies . . . . . . . . . . . . . . . . . . . . . . . . . . . . . . . . . . . . . . . . . . . . . . . . . . . . . . . . 604. Transfer of risk estimates across populations . . . . . . . . . . . . . . . . . . . . . . . . . . . . . . . . . . . . . . . . 615. Summary . . . . . . . . . . . . . . . . . . . . . . . . . . . . . . . . . . . . . . . . . . . . . . . . . . . . . . . . . . . . . . . . . . . . 61
E. Cancer of the small intestine, including the duodenum . . . . . . . . . . . . . . . . . . . . . . . . . . . . . . . . . . . . . 621. General background . . . . . . . . . . . . . . . . . . . . . . . . . . . . . . . . . . . . . . . . . . . . . . . . . . . . . . . . . . . . 622. Summary of UNSCEAR 2000 . . . . . . . . . . . . . . . . . . . . . . . . . . . . . . . . . . . . . . . . . . . . . . . . . . . . . 623. Summary . . . . . . . . . . . . . . . . . . . . . . . . . . . . . . . . . . . . . . . . . . . . . . . . . . . . . . . . . . . . . . . . . . . . 62
F. Colon cancer . . . . . . . . . . . . . . . . . . . . . . . . . . . . . . . . . . . . . . . . . . . . . . . . . . . . . . . . . . . . . . . . . . . . . . 621. General background . . . . . . . . . . . . . . . . . . . . . . . . . . . . . . . . . . . . . . . . . . . . . . . . . . . . . . . . . . . . 622. Summary of UNSCEAR 2000 . . . . . . . . . . . . . . . . . . . . . . . . . . . . . . . . . . . . . . . . . . . . . . . . . . . . . 633. New or updated studies . . . . . . . . . . . . . . . . . . . . . . . . . . . . . . . . . . . . . . . . . . . . . . . . . . . . . . . . 634. Summary . . . . . . . . . . . . . . . . . . . . . . . . . . . . . . . . . . . . . . . . . . . . . . . . . . . . . . . . . . . . . . . . . . . . 64
G. Rectal cancer . . . . . . . . . . . . . . . . . . . . . . . . . . . . . . . . . . . . . . . . . . . . . . . . . . . . . . . . . . . . . . . . . . . . . 641. General background . . . . . . . . . . . . . . . . . . . . . . . . . . . . . . . . . . . . . . . . . . . . . . . . . . . . . . . . . . . . 642. Summary of UNSCEAR 2000 . . . . . . . . . . . . . . . . . . . . . . . . . . . . . . . . . . . . . . . . . . . . . . . . . . . . . 653. Summary . . . . . . . . . . . . . . . . . . . . . . . . . . . . . . . . . . . . . . . . . . . . . . . . . . . . . . . . . . . . . . . . . . . . 66
H. Liver cancer . . . . . . . . . . . . . . . . . . . . . . . . . . . . . . . . . . . . . . . . . . . . . . . . . . . . . . . . . . . . . . . . . . . . . . . 661. General background . . . . . . . . . . . . . . . . . . . . . . . . . . . . . . . . . . . . . . . . . . . . . . . . . . . . . . . . . . . . 662. Summary of UNSCEAR 2000 . . . . . . . . . . . . . . . . . . . . . . . . . . . . . . . . . . . . . . . . . . . . . . . . . . . . . 663. New or updated studies . . . . . . . . . . . . . . . . . . . . . . . . . . . . . . . . . . . . . . . . . . . . . . . . . . . . . . . . 664. Summary . . . . . . . . . . . . . . . . . . . . . . . . . . . . . . . . . . . . . . . . . . . . . . . . . . . . . . . . . . . . . . . . . . . . 68
I. Pancreatic cancer . . . . . . . . . . . . . . . . . . . . . . . . . . . . . . . . . . . . . . . . . . . . . . . . . . . . . . . . . . . . . . . . . . 681. General background . . . . . . . . . . . . . . . . . . . . . . . . . . . . . . . . . . . . . . . . . . . . . . . . . . . . . . . . . . . . 682. Summary of UNSCEAR 2000 . . . . . . . . . . . . . . . . . . . . . . . . . . . . . . . . . . . . . . . . . . . . . . . . . . . . . 683. New or updated studies . . . . . . . . . . . . . . . . . . . . . . . . . . . . . . . . . . . . . . . . . . . . . . . . . . . . . . . . 694. Summary . . . . . . . . . . . . . . . . . . . . . . . . . . . . . . . . . . . . . . . . . . . . . . . . . . . . . . . . . . . . . . . . . . . . 70
J. Cancers of the trachea, bronchus and lung . . . . . . . . . . . . . . . . . . . . . . . . . . . . . . . . . . . . . . . . . . . . . . 701. General background . . . . . . . . . . . . . . . . . . . . . . . . . . . . . . . . . . . . . . . . . . . . . . . . . . . . . . . . . . . . 702. External low-LET exposures . . . . . . . . . . . . . . . . . . . . . . . . . . . . . . . . . . . . . . . . . . . . . . . . . . . . . . 703. Internal low-LET exposures . . . . . . . . . . . . . . . . . . . . . . . . . . . . . . . . . . . . . . . . . . . . . . . . . . . . . . 734. Internal high-LET exposures (plutonium) . . . . . . . . . . . . . . . . . . . . . . . . . . . . . . . . . . . . . . . . . . . . 735. Internal high-LET exposures (Thorotrast and radium) . . . . . . . . . . . . . . . . . . . . . . . . . . . . . . . . . . 746. Internal high-LET exposures (radon) . . . . . . . . . . . . . . . . . . . . . . . . . . . . . . . . . . . . . . . . . . . . . . . . 747. Transfer of risk estimates . . . . . . . . . . . . . . . . . . . . . . . . . . . . . . . . . . . . . . . . . . . . . . . . . . . . . . . 808. Summary . . . . . . . . . . . . . . . . . . . . . . . . . . . . . . . . . . . . . . . . . . . . . . . . . . . . . . . . . . . . . . . . . . . . 80
K. Malignant tumours of the bone and connective tissue . . . . . . . . . . . . . . . . . . . . . . . . . . . . . . . . . . . . . 811. General background . . . . . . . . . . . . . . . . . . . . . . . . . . . . . . . . . . . . . . . . . . . . . . . . . . . . . . . . . . . . 812. Summary of UNSCEAR 2000 . . . . . . . . . . . . . . . . . . . . . . . . . . . . . . . . . . . . . . . . . . . . . . . . . . . . . 813. New or updated studies . . . . . . . . . . . . . . . . . . . . . . . . . . . . . . . . . . . . . . . . . . . . . . . . . . . . . . . . 814. Summary . . . . . . . . . . . . . . . . . . . . . . . . . . . . . . . . . . . . . . . . . . . . . . . . . . . . . . . . . . . . . . . . . . . . 83
L. Cutaneous malignant melanoma . . . . . . . . . . . . . . . . . . . . . . . . . . . . . . . . . . . . . . . . . . . . . . . . . . . . . . . 831. General background . . . . . . . . . . . . . . . . . . . . . . . . . . . . . . . . . . . . . . . . . . . . . . . . . . . . . . . . . . . . 832. Summary of UNSCEAR 2000 . . . . . . . . . . . . . . . . . . . . . . . . . . . . . . . . . . . . . . . . . . . . . . . . . . . . . 833. New or updated studies . . . . . . . . . . . . . . . . . . . . . . . . . . . . . . . . . . . . . . . . . . . . . . . . . . . . . . . . 844. Summary . . . . . . . . . . . . . . . . . . . . . . . . . . . . . . . . . . . . . . . . . . . . . . . . . . . . . . . . . . . . . . . . . . . . 84
UNSCEAR REPORT-PART 1.qxp 10/7/08 2:57 pm Page 14
Page
M. Non-melanoma skin cancer . . . . . . . . . . . . . . . . . . . . . . . . . . . . . . . . . . . . . . . . . . . . . . . . . . . . . . . . . . 851. General background . . . . . . . . . . . . . . . . . . . . . . . . . . . . . . . . . . . . . . . . . . . . . . . . . . . . . . . . . . . . 852. Summary of UNSCEAR 2000 . . . . . . . . . . . . . . . . . . . . . . . . . . . . . . . . . . . . . . . . . . . . . . . . . . . . . 853. New or updated studies . . . . . . . . . . . . . . . . . . . . . . . . . . . . . . . . . . . . . . . . . . . . . . . . . . . . . . . . 864. Summary . . . . . . . . . . . . . . . . . . . . . . . . . . . . . . . . . . . . . . . . . . . . . . . . . . . . . . . . . . . . . . . . . . . . 87
N. Breast cancer . . . . . . . . . . . . . . . . . . . . . . . . . . . . . . . . . . . . . . . . . . . . . . . . . . . . . . . . . . . . . . . . . . . . . 871. General background . . . . . . . . . . . . . . . . . . . . . . . . . . . . . . . . . . . . . . . . . . . . . . . . . . . . . . . . . . . . 872. Summary of UNSCEAR 2000 . . . . . . . . . . . . . . . . . . . . . . . . . . . . . . . . . . . . . . . . . . . . . . . . . . . . . 883. New or updated studies . . . . . . . . . . . . . . . . . . . . . . . . . . . . . . . . . . . . . . . . . . . . . . . . . . . . . . . . 884. Summary . . . . . . . . . . . . . . . . . . . . . . . . . . . . . . . . . . . . . . . . . . . . . . . . . . . . . . . . . . . . . . . . . . . . 91
O. Uterine cancer . . . . . . . . . . . . . . . . . . . . . . . . . . . . . . . . . . . . . . . . . . . . . . . . . . . . . . . . . . . . . . . . . . . . . 911. General background . . . . . . . . . . . . . . . . . . . . . . . . . . . . . . . . . . . . . . . . . . . . . . . . . . . . . . . . . . . . 912. Summary of UNSCEAR 2000 . . . . . . . . . . . . . . . . . . . . . . . . . . . . . . . . . . . . . . . . . . . . . . . . . . . . . 913. New or updated studies . . . . . . . . . . . . . . . . . . . . . . . . . . . . . . . . . . . . . . . . . . . . . . . . . . . . . . . . 914. Summary . . . . . . . . . . . . . . . . . . . . . . . . . . . . . . . . . . . . . . . . . . . . . . . . . . . . . . . . . . . . . . . . . . . . 93
P. Ovarian cancer . . . . . . . . . . . . . . . . . . . . . . . . . . . . . . . . . . . . . . . . . . . . . . . . . . . . . . . . . . . . . . . . . . . . 931. General background . . . . . . . . . . . . . . . . . . . . . . . . . . . . . . . . . . . . . . . . . . . . . . . . . . . . . . . . . . . . 932. Summary of UNSCEAR 2000 . . . . . . . . . . . . . . . . . . . . . . . . . . . . . . . . . . . . . . . . . . . . . . . . . . . . . 933. New or updated studies . . . . . . . . . . . . . . . . . . . . . . . . . . . . . . . . . . . . . . . . . . . . . . . . . . . . . . . . 934. Summary . . . . . . . . . . . . . . . . . . . . . . . . . . . . . . . . . . . . . . . . . . . . . . . . . . . . . . . . . . . . . . . . . . . . 94
Q. Prostate cancer . . . . . . . . . . . . . . . . . . . . . . . . . . . . . . . . . . . . . . . . . . . . . . . . . . . . . . . . . . . . . . . . . . . . 941. General background . . . . . . . . . . . . . . . . . . . . . . . . . . . . . . . . . . . . . . . . . . . . . . . . . . . . . . . . . . . . 942. Summary of UNSCEAR 2000 . . . . . . . . . . . . . . . . . . . . . . . . . . . . . . . . . . . . . . . . . . . . . . . . . . . . . 943. New or updated studies . . . . . . . . . . . . . . . . . . . . . . . . . . . . . . . . . . . . . . . . . . . . . . . . . . . . . . . . 944. Summary . . . . . . . . . . . . . . . . . . . . . . . . . . . . . . . . . . . . . . . . . . . . . . . . . . . . . . . . . . . . . . . . . . . . 95
R. Cancer of the urinary bladder . . . . . . . . . . . . . . . . . . . . . . . . . . . . . . . . . . . . . . . . . . . . . . . . . . . . . . . . . 961. General background . . . . . . . . . . . . . . . . . . . . . . . . . . . . . . . . . . . . . . . . . . . . . . . . . . . . . . . . . . . . 962. Summary of UNSCEAR 2000 . . . . . . . . . . . . . . . . . . . . . . . . . . . . . . . . . . . . . . . . . . . . . . . . . . . . . 963. New or updated studies . . . . . . . . . . . . . . . . . . . . . . . . . . . . . . . . . . . . . . . . . . . . . . . . . . . . . . . . 964. Summary . . . . . . . . . . . . . . . . . . . . . . . . . . . . . . . . . . . . . . . . . . . . . . . . . . . . . . . . . . . . . . . . . . . . 97
S. Kidney cancer . . . . . . . . . . . . . . . . . . . . . . . . . . . . . . . . . . . . . . . . . . . . . . . . . . . . . . . . . . . . . . . . . . . . . 971. General background . . . . . . . . . . . . . . . . . . . . . . . . . . . . . . . . . . . . . . . . . . . . . . . . . . . . . . . . . . . . 972. Summary of UNSCEAR 2000 . . . . . . . . . . . . . . . . . . . . . . . . . . . . . . . . . . . . . . . . . . . . . . . . . . . . . 973. New or updated studies . . . . . . . . . . . . . . . . . . . . . . . . . . . . . . . . . . . . . . . . . . . . . . . . . . . . . . . . 984. Summary . . . . . . . . . . . . . . . . . . . . . . . . . . . . . . . . . . . . . . . . . . . . . . . . . . . . . . . . . . . . . . . . . . . . 98
T. Brain and central nervous system tumours . . . . . . . . . . . . . . . . . . . . . . . . . . . . . . . . . . . . . . . . . . . . . . 991. General background . . . . . . . . . . . . . . . . . . . . . . . . . . . . . . . . . . . . . . . . . . . . . . . . . . . . . . . . . . . . 992. Summary of UNSCEAR 2000 . . . . . . . . . . . . . . . . . . . . . . . . . . . . . . . . . . . . . . . . . . . . . . . . . . . . . 993. New or updated studies . . . . . . . . . . . . . . . . . . . . . . . . . . . . . . . . . . . . . . . . . . . . . . . . . . . . . . . 1004. Summary . . . . . . . . . . . . . . . . . . . . . . . . . . . . . . . . . . . . . . . . . . . . . . . . . . . . . . . . . . . . . . . . . . . 101
U. Thyroid cancer . . . . . . . . . . . . . . . . . . . . . . . . . . . . . . . . . . . . . . . . . . . . . . . . . . . . . . . . . . . . . . . . . . . . 1011. General background . . . . . . . . . . . . . . . . . . . . . . . . . . . . . . . . . . . . . . . . . . . . . . . . . . . . . . . . . . . 1012. Summary of UNSCEAR 2000 . . . . . . . . . . . . . . . . . . . . . . . . . . . . . . . . . . . . . . . . . . . . . . . . . . . . 1023. New or updated studies . . . . . . . . . . . . . . . . . . . . . . . . . . . . . . . . . . . . . . . . . . . . . . . . . . . . . . . 1034. Summary . . . . . . . . . . . . . . . . . . . . . . . . . . . . . . . . . . . . . . . . . . . . . . . . . . . . . . . . . . . . . . . . . . . 108
V. Non-Hodgkin’s lymphoma . . . . . . . . . . . . . . . . . . . . . . . . . . . . . . . . . . . . . . . . . . . . . . . . . . . . . . . . . . . 1081. General background . . . . . . . . . . . . . . . . . . . . . . . . . . . . . . . . . . . . . . . . . . . . . . . . . . . . . . . . . . . 1082. Summary of UNSCEAR 2000 . . . . . . . . . . . . . . . . . . . . . . . . . . . . . . . . . . . . . . . . . . . . . . . . . . . . 1093. New or updated studies . . . . . . . . . . . . . . . . . . . . . . . . . . . . . . . . . . . . . . . . . . . . . . . . . . . . . . . 1094. Summary . . . . . . . . . . . . . . . . . . . . . . . . . . . . . . . . . . . . . . . . . . . . . . . . . . . . . . . . . . . . . . . . . . . 110
ANNEX A: EPIDEMIOLOGICAL STUDIES OF RADIATION AND CANCER 15
UNSCEAR REPORT-PART 1.qxp 10/7/08 2:57 pm Page 15
16 UNSCEAR 2006 REPORT: VOLUME I
Page
W. Hodgkin’s disease . . . . . . . . . . . . . . . . . . . . . . . . . . . . . . . . . . . . . . . . . . . . . . . . . . . . . . . . . . . . . . . . . 1101. General background . . . . . . . . . . . . . . . . . . . . . . . . . . . . . . . . . . . . . . . . . . . . . . . . . . . . . . . . . . . 1102. Summary of UNSCEAR 2000 . . . . . . . . . . . . . . . . . . . . . . . . . . . . . . . . . . . . . . . . . . . . . . . . . . . . 1113. New or updated studies . . . . . . . . . . . . . . . . . . . . . . . . . . . . . . . . . . . . . . . . . . . . . . . . . . . . . . . 1114. Summary . . . . . . . . . . . . . . . . . . . . . . . . . . . . . . . . . . . . . . . . . . . . . . . . . . . . . . . . . . . . . . . . . . . 111
X. Multiple myeloma . . . . . . . . . . . . . . . . . . . . . . . . . . . . . . . . . . . . . . . . . . . . . . . . . . . . . . . . . . . . . . . . . 1111. General background . . . . . . . . . . . . . . . . . . . . . . . . . . . . . . . . . . . . . . . . . . . . . . . . . . . . . . . . . . . 1112. Summary of UNSCEAR 2000 . . . . . . . . . . . . . . . . . . . . . . . . . . . . . . . . . . . . . . . . . . . . . . . . . . . . 1123. New or updated studies . . . . . . . . . . . . . . . . . . . . . . . . . . . . . . . . . . . . . . . . . . . . . . . . . . . . . . . 1124. Summary . . . . . . . . . . . . . . . . . . . . . . . . . . . . . . . . . . . . . . . . . . . . . . . . . . . . . . . . . . . . . . . . . . . 113
Y. Leukaemia . . . . . . . . . . . . . . . . . . . . . . . . . . . . . . . . . . . . . . . . . . . . . . . . . . . . . . . . . . . . . . . . . . . . . . . 1131. General background . . . . . . . . . . . . . . . . . . . . . . . . . . . . . . . . . . . . . . . . . . . . . . . . . . . . . . . . . . . 1132. Summary of UNSCEAR 2000 . . . . . . . . . . . . . . . . . . . . . . . . . . . . . . . . . . . . . . . . . . . . . . . . . . . . 1143. New or updated studies . . . . . . . . . . . . . . . . . . . . . . . . . . . . . . . . . . . . . . . . . . . . . . . . . . . . . . . 1144. Summary . . . . . . . . . . . . . . . . . . . . . . . . . . . . . . . . . . . . . . . . . . . . . . . . . . . . . . . . . . . . . . . . . . . 120
IV. LIFETIME RISK FOR TOTAL CANCER . . . . . . . . . . . . . . . . . . . . . . . . . . . . . . . . . . . . . . . . . . . . . . . . . . . . . . . 123A. Methods and assumptions of calculations . . . . . . . . . . . . . . . . . . . . . . . . . . . . . . . . . . . . . . . . . . . . . . 123
1. Risk models . . . . . . . . . . . . . . . . . . . . . . . . . . . . . . . . . . . . . . . . . . . . . . . . . . . . . . . . . . . . . . . . . 1232. Low-dose response, fractionation and dose-rate effects . . . . . . . . . . . . . . . . . . . . . . . . . . . . . . 1263. Projection methods . . . . . . . . . . . . . . . . . . . . . . . . . . . . . . . . . . . . . . . . . . . . . . . . . . . . . . . . . . . . 1284. Populations, mortality rates and cancer incidence . . . . . . . . . . . . . . . . . . . . . . . . . . . . . . . . . . . 1295. Transfer of risk estimates between populations . . . . . . . . . . . . . . . . . . . . . . . . . . . . . . . . . . . . . 129
B. Lifetime risk estimates . . . . . . . . . . . . . . . . . . . . . . . . . . . . . . . . . . . . . . . . . . . . . . . . . . . . . . . . . . . . . 129
CONCLUSIONS . . . . . . . . . . . . . . . . . . . . . . . . . . . . . . . . . . . . . . . . . . . . . . . . . . . . . . . . . . . . . . . . . . . . . . . . . . . 137
ACKNOWLEDGEMENTS . . . . . . . . . . . . . . . . . . . . . . . . . . . . . . . . . . . . . . . . . . . . . . . . . . . . . . . . . . . . . . . . . . . . . . 139
TABLES . . . . . . . . . . . . . . . . . . . . . . . . . . . . . . . . . . . . . . . . . . . . . . . . . . . . . . . . . . . . . . . . . . . . . . . . . . . . . . . . . . 141
APPENDIX A. SCORE TESTS AND STATISTICAL POWER . . . . . . . . . . . . . . . . . . . . . . . . . . . . . . . . . . . . . . . . . . . . . . . . . . 259
APPENDIX B. MEASURES OF RADIATION RISK, INCLUDING LIFETIME RISK . . . . . . . . . . . . . . . . . . . . . . . . . . . . . . . . . . . 262
APPENDIX C. MODELLING OF DOSIMETRIC ERROR FOR THE DATA ON THE ATOMIC BOMBING SURVIVORS . . . . . . . . 264
APPENDIX D. RISK MODELS FITTED TO THE ATOMIC BOMBING SURVIVOR DATA BY CLASSICAL, LIKELIHOOD-BASED METHODS . . . . . . . . . . . . . . . . . . . . . . . . . . . . . . . . . . . . . . . . . . . . . . . . . . . . . . . . . . . 265
APPENDIX E. RISK MODELS FITTED TO THE ATOMIC BOMBING SURVIVOR DATA BY BAYESIAN MARKOV CHAIN MONTE CARLO METHODS, AND THEIR USE TO OBTAIN UNCERTAINTY BOUNDS ON POPULATION RISK . . . . . . . . . . . . . . . . . . . . . . . . . . . . . . . . . . . . . . . . . . . . . . . . . . . . . . . . . . . . . . . . . . . . . 286
REFERENCES . . . . . . . . . . . . . . . . . . . . . . . . . . . . . . . . . . . . . . . . . . . . . . . . . . . . . . . . . . . . . . . . . . . . . . . . . . . 290
UNSCEAR REPORT-PART 1.qxp 10/7/08 2:57 pm Page 16
INTRODUCTION
1. Epidemiological studies of cancer risks associated withinternal and external exposure to ionizing radiation werereviewed extensively in the UNSCEAR 1994 and 2000Reports [U4, U2]. The UNSCEAR 2000 Report assesseddata on cancer incidence and mortality up to 1990 amongthe Life Span Study (LSS) cohort of survivors of the atomicbombings in Japan [P1, P4, T1], as well as many studiesrelating to other persons exposed occupationally, therapeu-tically or diagnostically.
2. The UNSCEAR 2000 Report presented cancer riskestimates based on the LSS data and using the set of sur-vivor dose estimates produced in the mid-1980s, the “DS86dosimetry” [R20]. For some time it was thought that theDS86 neutron doses for the survivors of the Hiroshimabombing were systematically underestimated, particularlyfor survivors beyond 1,000 m from the hypocentre [R20,S39]. This perception was largely based on the results ofmeasurements of thermal neutron activation products insamples taken from the city [S39]. The DS86 estimates forthe gamma doses at both Hiroshima and Nagasaki, as wellas the estimates for the neutron doses at Nagasaki [S40],were thought to be more reliable than the estimates for theneutron doses at Hiroshima [R20]. Recent analysis of allthe information, including that on fast-neutron activationproducts, suggests that there are no appreciable systematicerrors in the DS86 neutron dose estimates for Hiroshima[C13, R12, S41]. The latest set of dose estimates for thesurvivors of the atomic bombings, the “DS02 dosimetry”,differs slightly from the DS86 system, for both neutronand gamma doses. The difference is generally no more than20% for distances of up to 1,500 m from the two hypocen-tres, where the doses were greatest [C13, R12]. The DS02estimates of colon doses due to neutrons were lower forboth cities but by no more than about 20% compared withthe DS86 estimates. The DS02 estimates were progres-sively lower relative to the DS86 estimates with increas-ing distance from the hypocentre; this was particularlymarked for Nagasaki [P10]. For Hiroshima survivors, theDS02 estimates for colon dose due to gamma radiationwere lower by about 10% compared with the DS86 esti-mates at all distances; for Nagasaki survivors, the estimatesfor colon dose within 1,800 m from the hypocentre wereabout 10% higher, but were somewhat less than 10%higher for greater distances [P10]. Analyses of the LSSepidemiological data using the DS02 dosimetry indicatethat cancer risk factors might be lower by about 8% as aresult, but with no appreciable change in the shape of thedose response or in the patterns of excess risk with age ortime [P10].
3. Although resolving inconsistencies in the dosimetry forthe survivors of the atomic bombings has reduced onesource of uncertainty in estimating cancer risks to a popu-lation from low doses of radiation, a considerable numberof other sources of uncertainty remain. A major one relatesto extrapolating risks from the moderate-dose but high-dose-rate exposures received by survivors of the atomicbombings to low doses and dose rates. This is also true forinterpreting data on many therapeutically exposed groups.The topic has long been controversial, and was discussed inannex G, “Biological effects at low radiation doses”, of theUNSCEAR 2000 Report [U2]. There is also uncertaintyrelated to extrapolating cancer risk to the end of lifetime.In particular, about half of the LSS cohort is at present stillalive [P10]. In estimating lifetime risk factors from the dataon this cohort, it is vital to determine the pattern betweenradiation dose and expression of cancer risk for those whowere exposed in childhood and who are now reaching theage at which larger numbers of cancers would be expectedto arise spontaneously. Another source of uncertainty relatesto the transfer of radiation-induced cancer risk estimatesbetween populations with different underlying rates ofcancer. For example, the rates of lung and breast cancer forthe Japanese population tend to be lower than for manyNorth American and Western European populations,whereas rates of stomach cancer tend to be much higher[P19]. The available evidence, most recently reviewed in theUNSCEAR 1994 Report [U4], did not suggest that there isan easy resolution of this problem.
4. This annex presents the Committee’s reassessment of theLSS data for the estimation of the risks of cancer and cancermortality due to radiation exposure, wherever possiblemaking use of the latest DS02 dosimetry and follow-up. Thisannex also contains assessments of all the evidence from stud-ies of groups exposed therapeutically, diagnostically or occu-pationally. The Committee has made assessments of the risksfor cancer in a variety of organs, including the salivary gland,oesophagus, stomach, small intestine (including duodenum),colon, rectum, liver, pancreas, lung, bone and connectivetissue, female breast, uterus, ovary, prostate, urinary bladder,kidney, brain and central nervous system, and thyroid, andfor cutaneous melanoma, non-melanoma skin cancer, non-Hodgkin’s lymphoma, Hodgkin’s disease, multiple myelomaand leukaemia. This somewhat extends the list of organ sitesfrom those considered in the UNSCEAR 2000 Report [U2].The Committee has attempted to consider separately theuncertainties associated with estimation of cancer risks arising from the sources listed above. As for the UNSCEAR2000 Report, the Committee has assessed separately the risks
17
UNSCEAR REPORT-PART 1.qxp 10/7/08 2:57 pm Page 17
18 UNSCEAR 2006 REPORT: VOLUME I
arising from internal and external exposure, and from low-and high-linear-energy-transfer (LET) radiation. It has madeestimates of the population-averaged risks of cancer andcancer mortality for a variety of current populations. Theseestimates have been made using risk models fitted to the latestmortality and cancer incidence data from the follow-up ofthe survivors of the atomic bombings [P10, P48]; both sets
of data use the latest DS02 dosimetry. The term incidencehas two uses in this annex: in a general sense, often to contrast cancer incidence with cancer mortality, and in a specific sense, where the incidence of a disease is the numberof cases of the disease that occur during a specified periodof time (usually a year). The incidence rate is this numberdivided by a specified unit of population.
UNSCEAR REPORT-PART 1.qxp 10/7/08 2:57 pm Page 18
I. FEATURES OF EPIDEMIOLOGICAL STUDIES
A. Criteria for good-quality epidemiological studies
5. Epidemiology is the study of the distribution and deter-minants of disease in human populations [M26]. It is by itsnature observational rather than experimental. In contrast torandomized controlled trials (which are largely experimen-tal in design), in epidemiological studies there is always thepossibility that biases or confounding factors of various sortsmay give rise to spurious results, as discussed in more detailbelow. A well-designed study should attempt to minimizethese. A good investigator will design a study to have ade-quate statistical power, and this is discussed in greater detailin section I.B below. Epidemiological studies are commonlyof two types: the cohort study and the case-control study. Ina “cohort study”, a defined population (preferably with awide range of radiation exposures) is followed forward intime to examine the occurrence of many possible health endpoints. Such a study can be performed either prospectively,by following a current cohort into the future, or retrospec-tively, by using registers to construct a cohort of personsalive at some time in the past, and then following it for-ward, possibly to the current time and beyond. The LSS ofthe survivors of the atomic bombings in Japan is an exam-ple of a cohort study, partly retrospective and partly prospec-tive in nature. The LSS data were assembled in the late1950s using questions posed in the Japanese national censusof October 1950 to ascertain those persons who were ineither Hiroshima or Nagasaki at the time of the atomicbombings. This cohort and other related cohorts were thenfollowed forward in time, and are still being followed up,for mortality due to all causes [P1, P9, P10], cancer inci-dence [P4, P48, T1] and various other end points [O3, O4,W17, Y3]. A “correlation study” is a particular type ofcohort study that is based on data averaged over groups, andin particular uses data grouped on exposure. In a “random-ized controlled trial (RCT)”, people are assigned at randomto various groups before planned exposure to radiation (e.g.radiotherapy treatment [F10]), and these groups are then fol-lowed up to assess their response to the treatment over somedefined period. An RCT may be regarded as a special formof cohort study; however, its essentially experimental design,as opposed to the more observational design of most cohortstudies, should be noted. In a “case-control study”, data onpersons with some specified disease (e.g. some class of can-cers) are assembled (the “cases”) together with data on asuitably matched (e.g. by age and sex) set of persons otherwise similar to these cases but without the disease (the “controls”). These two groups are then compared toassess differences in the distribution of a number of exposurevariables. The advantage of a case-control study is that
detailed histories of radiation exposure and other information(e.g. history of smoking), which may be difficult to collectfor a cohort, can be collected relatively easily for the specificcases and controls. The International Radiation Study ofCervical Cancer Patients (IRSCCP) is an example of a seriesof nested case-control studies of the occurrence of a secondprimary cancer in a cohort of women followed after treatmentfor a first primary cancer of the cervix [B5, B7, B8]. Anotherform of study, not so frequently used, is the “case-cohort” or“case-base” study [P13], in which information is collected onall cases with a certain disease status (e.g. cancer) as well ason a sample of persons from the underlying cohort, sampledwithout regard to their disease status. This type of study isparticularly useful when one is interested in a number of different end points, because one can reuse the cohort samplefor each disease end point under consideration. This studydesign was used in an early analysis of the IRSCCP [H31].Other, more novel designs, which generalize the above, haverecently been proposed [L38]. An RCT, if the randomizationis conducted properly, should not be subject to any bias, andis generally regarded as the epidemiological “gold standard”.The case-control study is prone to more biases (e.g. recallbias and investigation bias—see below) than the cohort study,and for this reason cohort studies are regarded as the nextmost reliable type of study after the RCT.
6. “Bias” in a study may be defined as any process at anystage in the conduct of the study that tends to produce resultsor conclusions that differ systematically from the truth [S34].One sort of bias is “follow-up bias”, which arises when thereis a lack of follow-up information, for example if personshave, unknown to the investigator, migrated outside of thestudy area, so that their health status cannot be reported. Inthis instance, they still apparently contribute to the numberof person-years (PY) of follow-up in the study, but in real-ity there is no chance of observing any detrimental effect totheir health, making them appear “effectively immortal”.Unless corrected for, by censoring members of the studycohort (i.e. stopping their contribution to the total number ofperson-years) when they are lost to follow-up, estimates ofdisease risks will generally be biased downwards and there-fore be underestimates of the true risk. This form of biasapplies equally to cohort studies and case-control studies. Itis sometimes supposed that case-control studies are immuneto this bias, but this is not so; case and control selection willbe biased if certain members of the full cohort are not avail-able to be selected. Related to follow-up bias is “ascertain-ment bias”, also sometimes known as “selection bias”, whicharises when there is variation in ascertainment of diseasestatus, perhaps correlated with exposure variables. For this
19
UNSCEAR REPORT-PART 1.qxp 10/7/08 2:57 pm Page 19
20 UNSCEAR 2006 REPORT: VOLUME I
reason, much the strongest studies are those that rely on inde-pendently maintained registers of disease and health status,e.g. the mortality and cancer incidence registers maintainedin many developed countries. As an example, certaintumours, such as those of the thyroid, are notoriously diffi-cult to detect, so that the recorded incidence of thyroidcancer in a cohort will very much depend on the diligencewith which clinical examinations have been conducted in theunderlying cohort. In the LSS cohort of the survivors of theatomic bombings, the detection of thyroid tumours is betterin the higher-dose groups, because many people in thesegroups are subject to biennial screening [T1], as they arealso members of the Adult Health Study (AHS), a subco-hort of the LSS. Unless corrected for, this ascertainment bias,which is correlated with dose, would bias the slope of thedose–response curve upwards; however, in this case theascertainment bias can be corrected for by stratification ofthe cohort according to membership in the AHS, and con-ducting a suitably adjusted analysis [T1]. Another exampleof such bias occurred in a study of workers involved in therecovery from the Chernobyl accident, for whom a statisti-cally significant increase in the incidence rate of leukaemiawas reported compared with the incidence rate for the gen-eral population [I5]. However, the workers received frequentmedical examinations, so that the accuracy and complete-ness of their leukaemia diagnoses are likely to differ fromthose for the general population. Indications that ascertain-ment biases may have produced this result come from a case-control study nested within the Chernobyl recovery operationworker cohort, which found no evidence of an increase inthe incidence of leukaemia [I6]. Again, it should be pointedout that ascertainment bias applies equally to both cohortand case-control studies. In the context of case-control stud-ies, ascertainment bias can arise if the selection of cases orcontrols is influenced by exposure status. In such studies itis therefore important that there be comparable ascertainmentfor cases and controls, and in particular that ascertainmentbe as complete as possible for both groups. For example,when it is necessary to approach potential study subjects, ortheir relatives, for interviews, it is important that the refusalrate for both cases and controls be as low as possible.
7. It is sometimes necessary to approach cohort members,or their relatives, to recall exposures. This is very likely tobe the situation when studies, in particular case-control stud-ies, are organized retrospectively. “Recall bias” arises wheninformation, for example on exposure, is collected retro-spectively, and patients, or their relatives, are subject to dif-ferential recall of this information, depending on theirdisease status. For this reason, much the strongest studiesare those that rely on independently maintained registers ofexposure, for example the registers of radiation dose thatare maintained for regulatory purposes for many cohorts ofnuclear workers [M12]. Related to recall bias is “investi-gation bias”, which results if investigators scrutinize expo-sures more thoroughly for cases than for controls. Althoughregister-based studies are not prone to recall or investiga-tion bias, they are subject to errors due, for example, toinaccurate diagnostic information. To the extent that such
studies should not be biased by knowledge of radiationexposures, one would expect that random misclassificationdue to inaccurate diagnosis would not affect values of theratio of the excess disease rate to the underlying diseaserate in the absence of radiation exposure, that is to say theexcess relative risk (ERR), although values of the excessdisease rate itself, or excess absolute risk (EAR), might bebiased, either positively or negatively.
8. A “confounding factor” is one that is correlated bothwith the disease under study and with an exposure of inter-est. Confounding factors can lead to bias. In many studiesthere is no reason to expect correlations between most factors and the radiation exposure, so that confoundingought not to be a problem. In studies of medical exposures,confounding may arise if the clinical indications that leadto the exposures are related to a subsequent diagnosis ofthe relevant disease; this is sometimes referred to as “confounding by indication”. For example, in a study ofpatients administered 131I for diagnostic purposes, a slightlyelevated risk of thyroid cancer was observed [H14].However, this risk was not related to dose and was con-centrated among patients referred because of a suspectedthyroid cancer [H14], indicating that the apparent elevatedrisk was probably due to the underlying condition. Thereare known to be correlations between smoking rate and theDS86 radiation dose among female survivors of the atomicbombing of Hiroshima, although there are no such correla-tions for the male survivors in this city, or for either malesor females in Nagasaki [P14]. This may be connected withthe (statistically non-significant) indications that the radiation-associated excess relative risk (ERR) of lungcancer increases with increasing age at exposure and attainedage in this data set [L39], findings at odds with the cus-tomary reduction of ERR with increasing values of thesevariables [U2, U4]. Cigarette smoking is one of the mostserious confounding factors that have to be dealt with in epi-demiological studies. As shown in table 1 (reproduced fromreference [P17]), the ratio of the disease rate to the under-lying disease rate in the absence of the relevant exposure(in this case to cigarette smoke), i.e. the relative risk (RR),of lung cancer associated with cigarette smoking (which formoderate to heavy smokers generally exceeds 10 [P8, P17])is much greater than the RR associated with exposure tohigh doses of radiation (which rarely exceeds 2). Thereforeeven slight confounding by factors related to cigarette smoking can seriously bias studies of lung cancer or othersmoking-related cancers. Confounding factors can usually bedealt with at the analysis stage, either by incorporation ofsuch factors into the regression model, or by stratifying thedata according to levels of the confounding factor.
9. RCTs, cohort and case-control studies all use indi-vidual-related data, in particular data on individual exposures. By contrast, correlation studies are based ondata averaged over groups, as noted above. A particularform of this type of study is the “geographical correlationstudy” (often referred to as an “ecological study”), inwhich disease rates based on data aggregated over
UNSCEAR REPORT-PART 1.qxp 10/7/08 2:57 pm Page 20
geographical areas are compared with aggregated data onlevels of exposure, for example to natural radiation or toman-made increases in environmental radiation levels. Thepossibilities for bias in such studies are well known. Theprincipal cause of bias (sometimes termed “ecologicalbias”) is the failure to take account of correlations withineach area between multiple risk factors (e.g. radiation andsmoking) [G13, P15]. Examples of such studies includeones of leukaemia [H32] and lung cancer [C14] in rela-tion to environmental radon daughter exposure. The pos-sibilities for bias in such studies are illustrated by a studyof lung cancer in relation to environmental radon daugh-ter exposure in Sweden, which when analysed as a case-control study yielded a positive slope for lung cancer riskversus radon daughter concentration, but when analysed asa correlation study, with grouped exposure estimates,yielded a negative slope [L40].
B. Impact of dose level on statistical power and sample size
10. The concept of statistical power and various factorsthat affect it were summarized in the UNSCEAR 2000Report [U2] and have also been addressed in a recent report [B26]. However, a few points merit further elaboration and
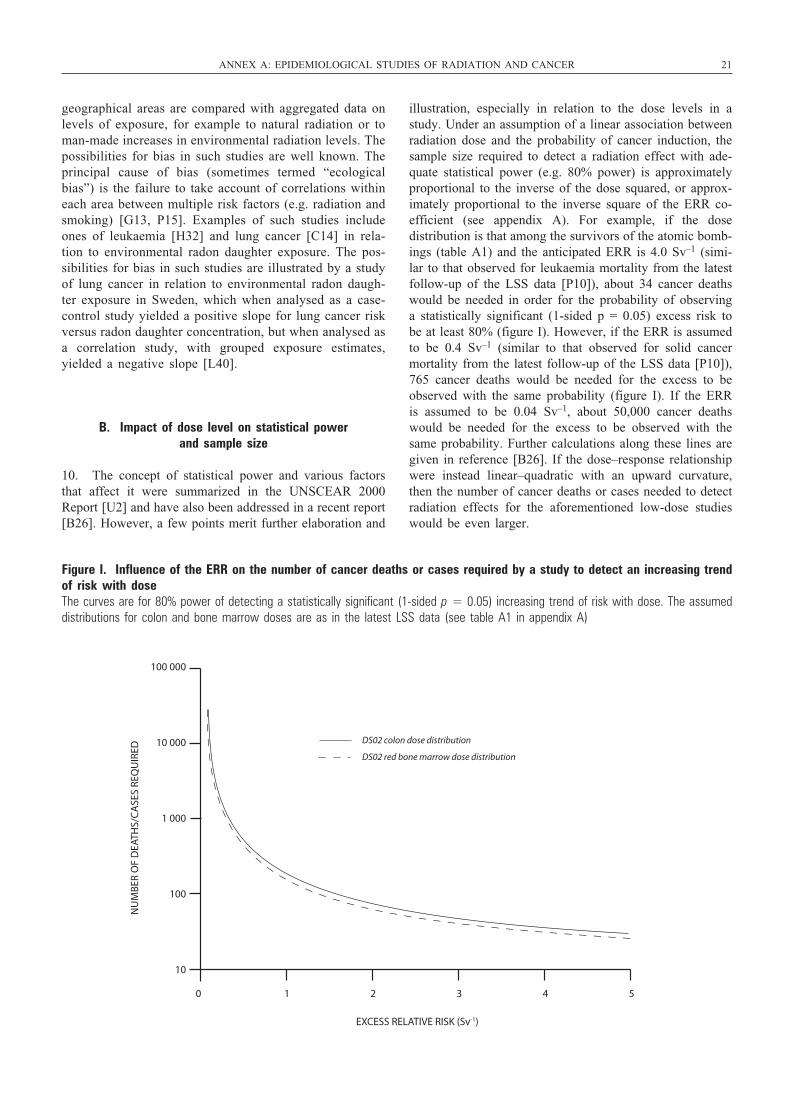
illustration, especially in relation to the dose levels in astudy. Under an assumption of a linear association betweenradiation dose and the probability of cancer induction, thesample size required to detect a radiation effect with ade-quate statistical power (e.g. 80% power) is approximatelyproportional to the inverse of the dose squared, or approx-imately proportional to the inverse square of the ERR co-efficient (see appendix A). For example, if the dosedistribution is that among the survivors of the atomic bomb-ings (table A1) and the anticipated ERR is 4.0 Sv–1 (simi-lar to that observed for leukaemia mortality from the latestfollow-up of the LSS data [P10]), about 34 cancer deathswould be needed in order for the probability of observinga statistically significant (1-sided p = 0.05) excess risk tobe at least 80% (figure I). However, if the ERR is assumedto be 0.4 Sv–1 (similar to that observed for solid cancermortality from the latest follow-up of the LSS data [P10]),765 cancer deaths would be needed for the excess to beobserved with the same probability (figure I). If the ERRis assumed to be 0.04 Sv–1, about 50,000 cancer deathswould be needed for the excess to be observed with thesame probability. Further calculations along these lines aregiven in reference [B26]. If the dose–response relationshipwere instead linear–quadratic with an upward curvature,then the number of cancer deaths or cases needed to detectradiation effects for the aforementioned low-dose studieswould be even larger.
ANNEX A: EPIDEMIOLOGICAL STUDIES OF RADIATION AND CANCER 21
100 000
10 000
1 000
100
10
0 1 2 3 4 5
DS02 colon dose distribution
DS02 red bone marrow dose distribution
EXCESS RELATIVE RISK (Sv-1)
NU
MB
ER O
F D
EATH
S/C
ASE
S RE
QU
IRED
Figure I. Influence of the ERR on the number of cancer deaths or cases required by a study to detect an increasing trendof risk with dose The curves are for 80% power of detecting a statistically significant (1-sided p = 0.05) increasing trend of risk with dose. The assumeddistributions for colon and bone marrow doses are as in the latest LSS data (see table A1 in appendix A)
UNSCEAR REPORT-PART 1.qxp 10/7/08 2:57 pm Page 21
22 UNSCEAR 2006 REPORT: VOLUME I
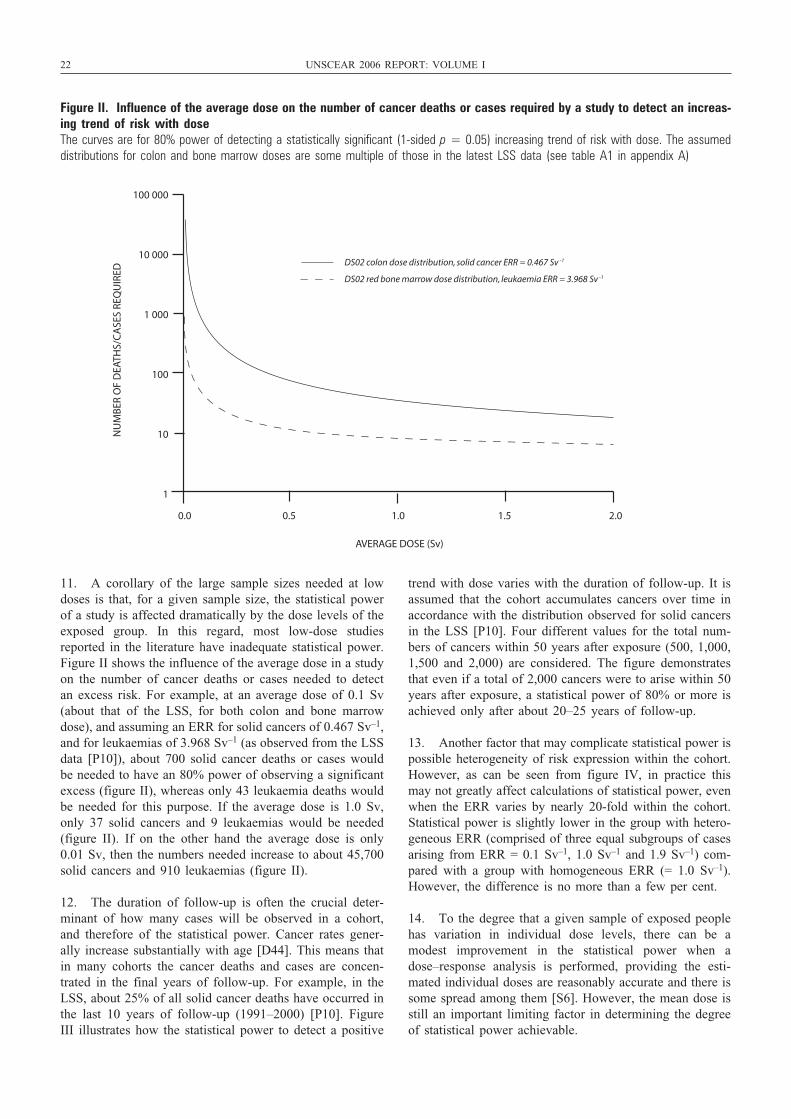
11. A corollary of the large sample sizes needed at lowdoses is that, for a given sample size, the statistical powerof a study is affected dramatically by the dose levels of theexposed group. In this regard, most low-dose studiesreported in the literature have inadequate statistical power.Figure II shows the influence of the average dose in a studyon the number of cancer deaths or cases needed to detectan excess risk. For example, at an average dose of 0.1 Sv(about that of the LSS, for both colon and bone marrowdose), and assuming an ERR for solid cancers of 0.467 Sv–1,and for leukaemias of 3.968 Sv–1 (as observed from the LSSdata [P10]), about 700 solid cancer deaths or cases wouldbe needed to have an 80% power of observing a significantexcess (figure II), whereas only 43 leukaemia deaths wouldbe needed for this purpose. If the average dose is 1.0 Sv,only 37 solid cancers and 9 leukaemias would be needed(figure II). If on the other hand the average dose is only0.01 Sv, then the numbers needed increase to about 45,700solid cancers and 910 leukaemias (figure II).
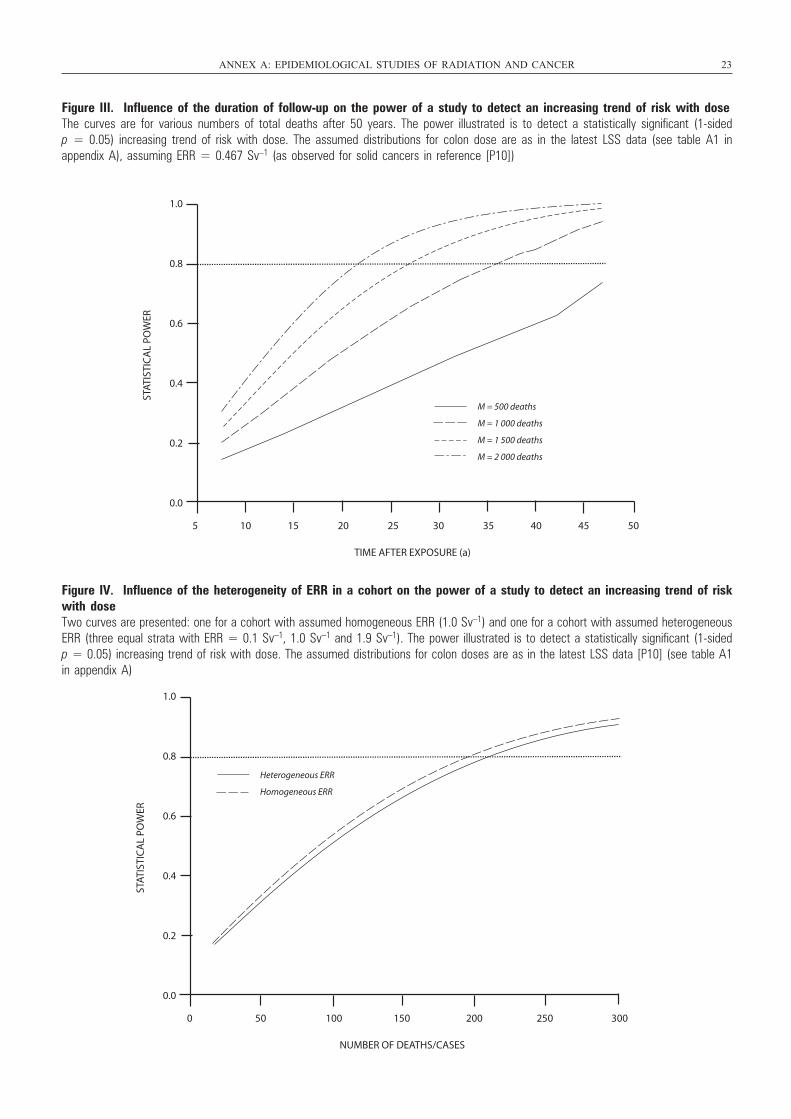
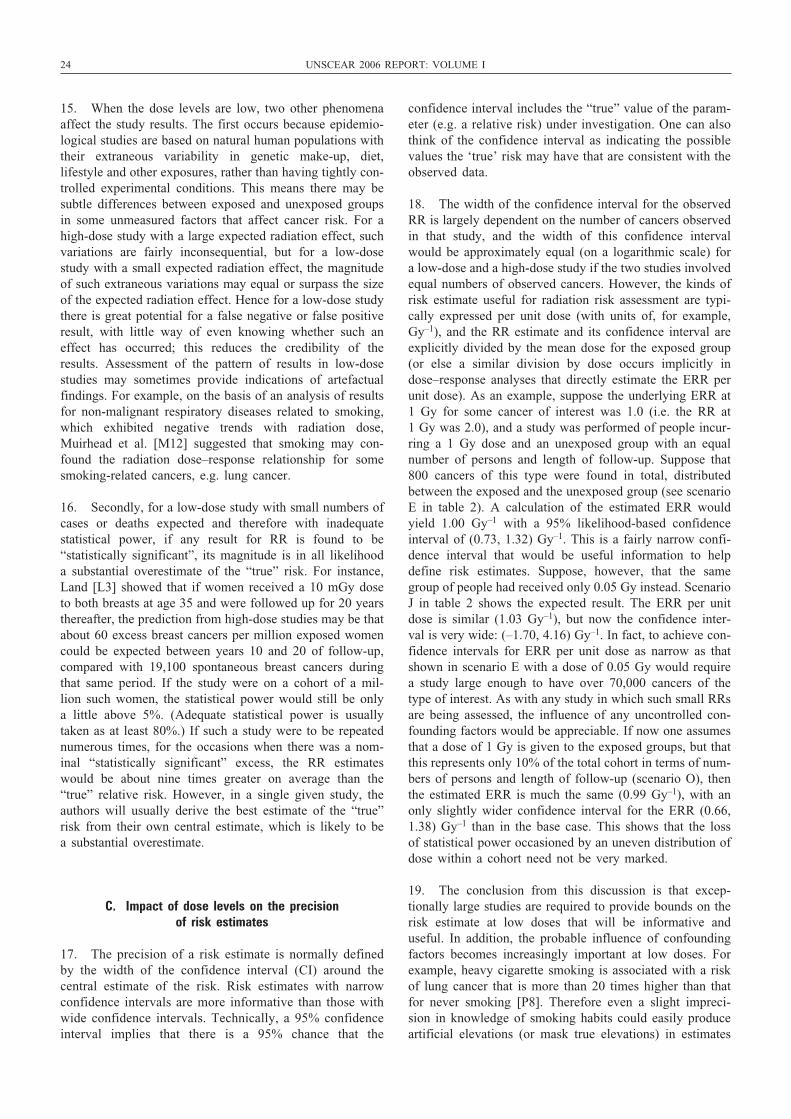
12. The duration of follow-up is often the crucial deter-minant of how many cases will be observed in a cohort,and therefore of the statistical power. Cancer rates gener-ally increase substantially with age [D44]. This means thatin many cohorts the cancer deaths and cases are concen-trated in the final years of follow-up. For example, in theLSS, about 25% of all solid cancer deaths have occurred inthe last 10 years of follow-up (1991–2000) [P10]. FigureIII illustrates how the statistical power to detect a positive
trend with dose varies with the duration of follow-up. It isassumed that the cohort accumulates cancers over time inaccordance with the distribution observed for solid cancersin the LSS [P10]. Four different values for the total num-bers of cancers within 50 years after exposure (500, 1,000,1,500 and 2,000) are considered. The figure demonstratesthat even if a total of 2,000 cancers were to arise within 50years after exposure, a statistical power of 80% or more isachieved only after about 20–25 years of follow-up.
13. Another factor that may complicate statistical power ispossible heterogeneity of risk expression within the cohort.However, as can be seen from figure IV, in practice thismay not greatly affect calculations of statistical power, evenwhen the ERR varies by nearly 20-fold within the cohort.Statistical power is slightly lower in the group with hetero-geneous ERR (comprised of three equal subgroups of casesarising from ERR = 0.1 Sv–1, 1.0 Sv–1 and 1.9 Sv–1) com-pared with a group with homogeneous ERR (= 1.0 Sv–1).However, the difference is no more than a few per cent.
14. To the degree that a given sample of exposed peoplehas variation in individual dose levels, there can be amodest improvement in the statistical power when adose–response analysis is performed, providing the esti-mated individual doses are reasonably accurate and there issome spread among them [S6]. However, the mean dose isstill an important limiting factor in determining the degreeof statistical power achievable.
100 000
10 000
1 000
100
10
1
0.0 0.5 1.0 1.5 2.0
DS02 colon dose distribution, solid cancer ERR = 0.467 Sv -1
DS02 red bone marrow dose distribution, leukaemia ERR = 3.968 Sv -1
AVERAGE DOSE (Sv)
NU
MB
ER O
F D
EATH
S/C
ASE
S RE
QU
IRED
Figure II. Influence of the average dose on the number of cancer deaths or cases required by a study to detect an increas-ing trend of risk with dose The curves are for 80% power of detecting a statistically significant (1-sided p = 0.05) increasing trend of risk with dose. The assumeddistributions for colon and bone marrow doses are some multiple of those in the latest LSS data (see table A1 in appendix A)
UNSCEAR REPORT-PART 1.qxp 10/7/08 2:57 pm Page 22
ANNEX A: EPIDEMIOLOGICAL STUDIES OF RADIATION AND CANCER 23
1.0
0.8
0.6
0.4
0.2
0.0
5 10 15 20 25 30 35 40 45 50
TIME AFTER EXPOSURE (a)
STAT
ISTI
CA
L PO
WER
M = 500 deaths
M = 1 000 deaths
M = 1 500 deaths
M = 2 000 deaths
Figure III. Influence of the duration of follow-up on the power of a study to detect an increasing trend of risk with doseThe curves are for various numbers of total deaths after 50 years. The power illustrated is to detect a statistically significant (1-sided p = 0.05) increasing trend of risk with dose. The assumed distributions for colon dose are as in the latest LSS data (see table A1 inappendix A), assuming ERR = 0.467 Sv–1 (as observed for solid cancers in reference [P10])
1.0
0.8
0.6
0.4
0.2
0.0
0 50 100 150 200 250 300
NUMBER OF DEATHS/CASES
STAT
ISTI
CA
L PO
WER
Heterogeneous ERR
Homogeneous ERR
Figure IV. Influence of the heterogeneity of ERR in a cohort on the power of a study to detect an increasing trend of riskwith dose Two curves are presented: one for a cohort with assumed homogeneous ERR (1.0 Sv–1) and one for a cohort with assumed heterogeneousERR (three equal strata with ERR = 0.1 Sv–1, 1.0 Sv–1 and 1.9 Sv–1). The power illustrated is to detect a statistically significant (1-sidedp = 0.05) increasing trend of risk with dose. The assumed distributions for colon doses are as in the latest LSS data [P10] (see table A1in appendix A)
UNSCEAR REPORT-PART 1.qxp 10/7/08 2:57 pm Page 23
24 UNSCEAR 2006 REPORT: VOLUME I
15. When the dose levels are low, two other phenomenaaffect the study results. The first occurs because epidemio-logical studies are based on natural human populations withtheir extraneous variability in genetic make-up, diet,lifestyle and other exposures, rather than having tightly con-trolled experimental conditions. This means there may besubtle differences between exposed and unexposed groupsin some unmeasured factors that affect cancer risk. For ahigh-dose study with a large expected radiation effect, suchvariations are fairly inconsequential, but for a low-dosestudy with a small expected radiation effect, the magnitudeof such extraneous variations may equal or surpass the sizeof the expected radiation effect. Hence for a low-dose studythere is great potential for a false negative or false positiveresult, with little way of even knowing whether such aneffect has occurred; this reduces the credibility of theresults. Assessment of the pattern of results in low-dosestudies may sometimes provide indications of artefactualfindings. For example, on the basis of an analysis of resultsfor non-malignant respiratory diseases related to smoking,which exhibited negative trends with radiation dose,Muirhead et al. [M12] suggested that smoking may con-found the radiation dose–response relationship for somesmoking-related cancers, e.g. lung cancer.
16. Secondly, for a low-dose study with small numbers ofcases or deaths expected and therefore with inadequate statistical power, if any result for RR is found to be “statistically significant”, its magnitude is in all likelihooda substantial overestimate of the “true” risk. For instance,Land [L3] showed that if women received a 10 mGy doseto both breasts at age 35 and were followed up for 20 yearsthereafter, the prediction from high-dose studies may be thatabout 60 excess breast cancers per million exposed womencould be expected between years 10 and 20 of follow-up,compared with 19,100 spontaneous breast cancers duringthat same period. If the study were on a cohort of a mil-lion such women, the statistical power would still be onlya little above 5%. (Adequate statistical power is usuallytaken as at least 80%.) If such a study were to be repeatednumerous times, for the occasions when there was a nom-inal “statistically significant” excess, the RR estimateswould be about nine times greater on average than the“true” relative risk. However, in a single given study, theauthors will usually derive the best estimate of the “true”risk from their own central estimate, which is likely to bea substantial overestimate.
C. Impact of dose levels on the precision of risk estimates
17. The precision of a risk estimate is normally definedby the width of the confidence interval (CI) around thecentral estimate of the risk. Risk estimates with narrowconfidence intervals are more informative than those withwide confidence intervals. Technically, a 95% confidenceinterval implies that there is a 95% chance that the
confidence interval includes the “true” value of the param-eter (e.g. a relative risk) under investigation. One can alsothink of the confidence interval as indicating the possiblevalues the ‘true’ risk may have that are consistent with theobserved data.
18. The width of the confidence interval for the observedRR is largely dependent on the number of cancers observedin that study, and the width of this confidence intervalwould be approximately equal (on a logarithmic scale) fora low-dose and a high-dose study if the two studies involvedequal numbers of observed cancers. However, the kinds ofrisk estimate useful for radiation risk assessment are typi-cally expressed per unit dose (with units of, for example,Gy–1), and the RR estimate and its confidence interval areexplicitly divided by the mean dose for the exposed group(or else a similar division by dose occurs implicitly indose–response analyses that directly estimate the ERR perunit dose). As an example, suppose the underlying ERR at1 Gy for some cancer of interest was 1.0 (i.e. the RR at 1 Gy was 2.0), and a study was performed of people incur-ring a 1 Gy dose and an unexposed group with an equalnumber of persons and length of follow-up. Suppose that800 cancers of this type were found in total, distributedbetween the exposed and the unexposed group (see scenarioE in table 2). A calculation of the estimated ERR wouldyield 1.00 Gy–1 with a 95% likelihood-based confidenceinterval of (0.73, 1.32) Gy–1. This is a fairly narrow confi-dence interval that would be useful information to helpdefine risk estimates. Suppose, however, that the samegroup of people had received only 0.05 Gy instead. ScenarioJ in table 2 shows the expected result. The ERR per unitdose is similar (1.03 Gy–1), but now the confidence inter-val is very wide: (–1.70, 4.16) Gy–1. In fact, to achieve con-fidence intervals for ERR per unit dose as narrow as thatshown in scenario E with a dose of 0.05 Gy would requirea study large enough to have over 70,000 cancers of thetype of interest. As with any study in which such small RRsare being assessed, the influence of any uncontrolled con-founding factors would be appreciable. If now one assumesthat a dose of 1 Gy is given to the exposed groups, but thatthis represents only 10% of the total cohort in terms of num-bers of persons and length of follow-up (scenario O), thenthe estimated ERR is much the same (0.99 Gy–1), with anonly slightly wider confidence interval for the ERR (0.66,1.38) Gy–1 than in the base case. This shows that the lossof statistical power occasioned by an uneven distribution ofdose within a cohort need not be very marked.
19. The conclusion from this discussion is that excep-tionally large studies are required to provide bounds on therisk estimate at low doses that will be informative anduseful. In addition, the probable influence of confoundingfactors becomes increasingly important at low doses. Forexample, heavy cigarette smoking is associated with a riskof lung cancer that is more than 20 times higher than thatfor never smoking [P8]. Therefore even a slight impreci-sion in knowledge of smoking habits could easily produceartificial elevations (or mask true elevations) in estimates
UNSCEAR REPORT-PART 1.qxp 10/7/08 2:57 pm Page 24
of the lung cancer risk anticipated from very low doses ofradiation. These are important considerations to bear inmind when proposing or evaluating low-dose studies.
D. Impact of dose measurement error and other uncertainties on study associations
20. In recent years there has been much development ofmethods for evaluating the impact of uncertainties in indi-vidual dose estimates upon the associations between doseand cancer risk [C12, F9]. A primary distinction is betweenrandom errors and systematic ones. Systematic errors indose measurement could result, for example, from incorrectcalibration of a dosimetry badge reader or from incorrectassumptions or coefficients in an algorithm to reconstructdoses. Such errors would be specific to a particular caseand might bias the dose–response association in a positiveor negative direction, depending on the particular error.Systematic and random errors are either differential, whenthey are statistically dependent on the disease end pointbeing considered, or non-differential, when the errors arestatistically independent of the disease. More precisely, ifthe “true” (unobserved) dose is D, the “nominal” or meas-ured dose is d and outcome for the disease end points meas-ured by the binary variable Y, then the measurement errorsare non-differential if P[d | D,Y = P[d | D,Y = 1], or equiv-alently if P[Y | d,D] = P[Y | D]; otherwise they are differ-ential. Differential measurement errors can arise, forexample, if a pathologist codes a death certificate beingaware of the subject’s exposure history. These errors canintroduce serious and unpredictable bias into the analysis ofa study [T17]. Fortunately such errors can usually be elim-inated by careful study design, for example by a blindassessment of the study variables.
21. However, even when the errors are non-differential,random measurement error affects virtually all quantitativeradiation epidemiological studies to one degree or another,and can introduce bias. Two types of measurement errormodel have been customarily assumed, classical andBerksonian. Classical measurement error arises when the“nominal” (assigned) dose, d, is assumed to vary around the“true” (usually unknown) dose, D. For example, in the datafor the survivors of the atomic bombings in Japan, the errorsare assumed to be of classical form [J3]. This is becausethe “nominal” dose, derived as a result of survivors’ recall,a few years after the event, of where they were and theirorientation with respect to the bomb detonation, will con-tain errors, probably random and non-differential. There areother (random, non-differential) errors associated withshielding uncertainties, and with the radiation energy spec-trum and magnitude of the source term, which result in thelogarithm of the “nominal” dose, 1n[d], being distributedapproximately normally around the logarithm of the “true”dose, 1n[D] [J3, R20]. Berkson error, on the other hand,arises when classification of individuals into groups resultsin the distribution of individual “true” doses, D, around the
“nominal” mean dose, d. A Berkson error structure is oftenassumed for occupational studies, because the classificationof individuals into groups results in the distribution of indi-vidual “true” doses around a “nominal” film badge meandose [T17]. There may be a variety of sources and types ofrandom measurement error in a given study. When the dosemeasurement error in a study is Berksonian, and a linearmodel is fitted, failing to account for it means the varianceof the slope of a linear dose–response regression line willbe underestimated but the slope itself will be unaffected (i.e.the risk estimate will be unbiased). However, this may notbe the case for non-linear models [T17]. When classicalmeasurement error occurs, failure to take it into accountgenerally means that not only will the variance of the slopebe underestimated but the slope estimate itself will also bebiased towards the null (i.e. closer to zero than it shouldbe). The direction of the slope, however, would not beexpected to change [A1]. Error models combining classicaland Berkson error have been developed [R19].
22. Classical measurement error generally reduces the statistical power of a study because it increases the varianceof the risk estimate while simultaneously biasing the esti-mate itself towards the null [M7]. This can be understoodintuitively: random measurement error will tend to blur thedose differences among people. This reduces the correla-tion with the “true” doses (where ideally the correlationshould be 1.0) and thereby tends to reduce any correlationbetween the nominal doses and a disease outcome.
23. There are typically other uncertainties in evaluatingthe association between radiation exposure and cancer risk.To name a few, there may be uncertainties associated withthe completeness of cancer case or mortality ascertainment,uncertainties in the accuracy of diagnoses, uncertaintiesassociated with instrument error in making radiation meas-urements, uncertainties in the degree to which a radiationfilm badge measurement estimates dose to some organ,uncertainties in estimating various parameters in perform-ing a dose reconstruction, uncertainties in the “transfer” ofrisk estimates from one population to another, uncertaintiesin behavioural factors that affect exposure to radioactivedeposits after an accident or residential radon exposure, anduncertainties in the uptake and metabolism of specificradionuclides. In theory, a complete model to correct foruncertainties would need to take into account all the appli-cable sources of uncertainty in a given study. However, frequently only limited information is available on the magnitude of these uncertainties, so the researcher has touse whatever information is available to make judgementsabout the distributions of the relevant uncertainties. Thisrequires that the researcher make use of information avail-able in the literature. Ideally it would require cooperationbetween experts from a variety of disciplines, for examplebetween statisticians, epidemiologists and dosimetrists, inorder to correctly identify the forms and magnitudes of the uncertainty distributions. Statistical estimates of thecomposite “credibility interval” that take into account the various measured and judged uncertainties can then be made.
ANNEX A: EPIDEMIOLOGICAL STUDIES OF RADIATION AND CANCER 25
UNSCEAR REPORT-PART 1.qxp 10/7/08 2:57 pm Page 25
26 UNSCEAR 2006 REPORT: VOLUME I
There can be serious systematic error (or bias) in studiesthat can produce spurious or misleading results and that maybe difficult or impossible to properly account for in analy-ses. For example, if persons who developed thyroid canceryears after exposure to fallout had better recall of pastevents and habits, such as of their milk consumption at thetime, than similar persons who are disease-free, or if per-sons living in high-dose areas were screened for thyroidcancer but persons living in low-dose areas were not, thiscan lead to serious bias.
24. Methods to deal with the complexities of measurementerror corrections are still evolving. Estimating the combina-tion of various sources of measurement error and their mag-nitude with respect to individual dose estimates oftenrequires sophisticated Monte Carlo simulations [H4].Nevertheless, the new generation of epidemiological studieshas begun to provide estimates of radiation risk correctedfor dose uncertainties (e.g. [G1, L1, L93, P2, S1]), and cor-rections for other uncertainties are beginning to be made. Amethod of wide applicability is first-order regression cali-bration, in which one substitutes for the “true” dose, D, infitted models the expectation of the “true” dose given the“nominal” (measured) one, E[D] | [d] [C12]. As emphasizedby Carroll et al. [C12], this is an approximate method innon-linear dose–effect relationships. It leads to reasonableadjusted point estimates of the model parameters but doesnot fully take account of all the variability induced by themeasurement errors. Within many contexts, for example thatof the LSS data, the extra variability not taken into accountis relatively small [P2, P16]. It is well known that whendosimetric errors are not too large, the first-order regressioncalibration parameter estimates are a good approximation tothe full likelihood-based estimates [C12, K26, R21]. ABayesian approach to the measurement error problem hasrecently been developed [R22, R23, R24] that rests on theformulation of conditional independence relationshipsbetween different model components, following the generalstructure outlined by Clayton [C15]. In this approach, threebasic submodels are distinguished and linked: the diseasemodel, the measurement model and the exposure model. Thepower of this Bayesian approach is that the dosimetric uncer-tainty is reflected in the variability of the model parameters.An adapted Bayesian method of correction for measurementerror, the two-stage Bayesian method, has already beenapplied to the fitting of generalized relative and absolute riskmodels to the LSS data on cancer mortality and incidence;estimates of population cancer risk and associated uncer-tainties have been derived from the posterior distribution ofthe risk parameters [B18, L17]. The Committee outlines inAppendix E how this method has been used to fit modelsto the latest LSS cancer mortality data [P10], and thereby toevaluate uncertainties in population cancer risks.
25. Dosimetric uncertainty analyses do not correct formethodological biases that distort observations and producespurious results. Statistical methods to deal with multiplesources of bias, such as those arising from methodologicalissues, have recently been developed [G11, G14]. However,
these are still controversial, as they tend to produce verylarge uncertainties in risks, are not perhaps completelytransparent, and avoid reliance on a full probability modelby using a series of more or less ad hoc “adjustments” (see the remarks of Copas, Spiegelhalter and de Stavola inreference [G11]).
26. Another type of dose measurement error that mayhave an impact on studies involving occupational exposureto radiation, but that has received limited attention, occursin the assigning of a value for a dose when the dosimeterreading is below the limit of detection. Designating suchdoses as zero will tend to overestimate the risk per unitdose and distort the dose–response relationship. Statisticalmethods to assign values for such doses in an unbiasedmanner have recently been proposed [M9, X1].
27. Very few studies attempt to take account of naturalbackground exposure simultaneously with the effect of theother radiation exposures being considered. Low-LET nat-ural background radiation might be expected to contributea dose of about 70–80 mSv over a lifetime. These levelsof dose are small in relation to radiotherapeutic doses,although not in relation to the average doses received inoccupational settings, or to those received by the survivorsof the atomic bombings. In most cohorts, such doses shouldnot be correlated with the other doses received, or withother modifying factors, so that they should not materiallyaffect inferences on radiation risk. For those cancers thatare extremely radiogenic, such as thyroid cancer orleukaemia, natural background exposure may contributematerially to the risk, particularly in cohorts, such as theLSS, in which the average doses approach backgroundlevels [L96]. A recent analysis of thyroid cancer incidenceamong the survivors of the atomic bombings demonstratedthat a substantial proportion (up to 32%) of thyroid cancerappearing at young age in this cohort might be attributedto natural background exposure [L96]. Doses from radio-logical examinations or from radiation therapy are also gen-erally not considered. Surveys of both exposure types havebeen conducted in the LSS [K60, K61], although as yet noaccount has been taken of these doses in any analysis ofhealth end points. Cumulative doses to specific organs (e.g.colon, stomach) due to radiological examinations in somepersons in the AHS are of the order of 100 mSv or more,which is comparable to the average dose to this cohort dueto the atomic bombings [K60]. However, the doses due toradiological examination are not generally expected to becorrelated with those due to the bombings, thus bias in riskestimates is unlikely to be appreciable.
E. Use of biodosimetry for epidemiological studies of radiation risk
28. When individual dose measurements are unavailableor incomplete, a biodosimetric measure of radiation expo-sure would be desirable. Ideally the biodosimeter would:
UNSCEAR REPORT-PART 1.qxp 10/7/08 2:57 pm Page 26
register uniformly low values in the absence of a radiationexposure; be sensitive, precise and unbiased in estimatingradiation exposure; and use a biological indicator that hasa long half-life, so that dose estimates could be made someyears after exposure. There are currently no biodosimetricmethods that fulfil all these criteria, although the methodemploying electron paramagnetic resonance (EPR) tomeasure doses to teeth (see below) arguably comes clos-est. The measurement of chromosome aberrations inperipheral lymphocytes, whether stable (balanced translo-cations) or unstable (dicentrics, ring chromosomes), hasbeen much used, for example in studies of the survivorsof the atomic bombings in Japan [K22, S81], in a studyof women irradiated for treatment of benign and malignantgynaecological disease [K21] and in Chernobyl recoveryoperation workers [N23, S27]. G-banding of chromosomesto detect such aberrations has been performed for a numberof groups, including those of patients receiving radiother-apy [T20]. The technique, developed relatively recently, offluorescence in situ hybridization (FISH) is particularlyuseful for assessment of stable chromosome aberrations,and has been used in various studies of nuclear workers[M20, T19], of persons exposed as a result of nuclearweapons tests [S26] and of Chernobyl recovery operationsworker populations [J4, L18]. The hypoxanthine phospho-ribosyltransferase (HPRT) gene mutation frequency inlymphocytes is also sometimes used in an assay of radia-tion damage [J4]. The glycophorin A (GPA) assay meas-ures somatic radiation inactivation of the GPA gene inerythroid progenitor cells in the bone marrow and has beenused in studies of Chernobyl recovery operation workers[B19, J4]. It has the weakness that it can only be usedamong those (about 50%) of the general population withthe M/N blood type, and it has wide variability in sensi-tivity between individuals. EPR, also known as electronspin resonance (ESR), can be used to measure cumulativeradiation doses to tooth enamel. Under experimental con-ditions and using the latest refinements [H54, H55], thetechnique has a minimum detectable dose of approximately10 mGy. EPR/ESR has been used in assessing radiationdoses in the LSS cohort [I22, I23], in groups exposed toradiation due to the Chernobyl accident [I24, S82] and inworkers at the Mayak nuclear complex in the RussianFederation [R44, R45]. All these techniques and theirapplications to biodosimetry are discussed in a recentreport of the International Commission on Radiation Unitsand Measurements (ICRU) [I21].
29. Biodosimetric data pose at least five particular prob-lems. First, most such measurements show some variabil-ity in background levels. The most important source ofvariability for stable chromosome translocations is age. Inparticular, a recent collaborative analysis involving anumber of laboratories using the FISH technique demon-strated that age is the main determinant of translocationyield; other variables, such as smoking and sex, had littleif any influence on aberration yield [E5, L44, W19]. Acomparison of measurement results among some laborato-ries has been reported [L44] as part of the follow-up to
the 1994 accident in Estonia involving the exposure of afamily to radiation from a powerful 137Cs source. Aftercorrection to full genome, yields from the participatinglaboratories were in reasonable agreement [L44]. A simi-lar comparison of results for blood samples taken fromnon-irradiated populations has likewise demonstrated alarge measure of agreement among laboratories [W19]. Asecond problem with biodosimeters is that they integratedose from all sources. While in certain circumstances thismight be thought advantageous, the lack of information onthe temporal distribution of exposure can cause difficul-ties, particularly as for most sites the probability of canceroccurring varies substantially as a function of age at expo-sure [U2]. Moreover, the dose under study (for examplethat received occupationally) may be similar in magnitudeto the cumulative dose that individuals have received dueto background radiation. Since the dose from external penetrating background radiation averages about 1 mGyin a year, by age 50, study subjects have received about 50 mGy on average from background radiation, with per-haps a twofold variation around that value. If the extradose under study (e.g. that resulting from occupationalexposure to radiation) is of a similar magnitude, itbecomes difficult to discriminate between the two com-ponents. A third problem with biodosimeters is that, compared with physical dosimeters such as film badges,collection, storage and analysis of the biological materialare relatively expensive. At present it is not practicable tostore and analyse samples for more than a small propor-tion of most cohorts. Storing samples and then analysingdata from the cases and from a suitably structured set ofcontrols from within the same cohort could alleviate some-what the problem of expense of analysis. However, it isimportant that samples be taken and stored in comparableconditions, and if possible at a comparable time. It is alsoimportant that subsequent modifying exposures to radia-tion or other agents be avoided. This implies that samplesshould be taken from all members of an exposed cohortas soon after the relevant exposure as possible, before dis-ease status is known. A fourth problem with biodosime-ters is the difficulty in estimating organ doses followingpartial body irradiation. This can be a problem also forphysical dosimeters, unless multiple dosimeters are used.A fifth problem, but only for certain end points, in particular unstable chromosome aberrations [L19], is thatthe signal decays over time. Knowledge of when the dosewas received is needed to reliably infer dose. Some earlystudies of HPRT mutations also suggested that the signal decayed over time [D26, U18], but later studies didnot show this [J4].
30. This last point is very much linked with the lowestdetectable dose, as is also the intrinsic variability in aber-ration yield. In general, cytogenetic dosimetry based onthe assay of chromosome aberrations in peripheral lymphocytes cannot reliably detect doses below about 100 mGy [L14]. For example, in spite of more than 258,000 painted metaphases being analysed, there was noassociation between aberration yield and recorded dose
ANNEX A: EPIDEMIOLOGICAL STUDIES OF RADIATION AND CANCER 27
UNSCEAR REPORT-PART 1.qxp 10/7/08 2:57 pm Page 27
28 UNSCEAR 2006 REPORT: VOLUME I
among a population of 118 Estonian workers performingrecovery operations after the Chernobyl accident, who hadan average dose of about 103 mSv, although there was asignificant increase in aberration yield among older recov-ery operation workers and among smokers [L18]. A recentacute dose of about 100 mGy can be fairly easily meas-ured by counting dicentric chromosomes, because such adose would treble the background level of ~1 dicentricamong 1,000 cells. Dicentrics have a half-life of about 3 years, but this can be much shorter following high doses.Therefore, any doses received more than about 5 yearsbefore blood sampling cannot be measured using this indicator.
31. When translocation yields are measured many yearsafter an accident, the lymphocytes drawn in the bloodsample will have been derived from stem cells, which atthe time of irradiation are presumed to have been in thebone marrow. This raises two questions. If there is a dif-ference in sensitivity between mature lymphocytes and pre-cursor cells in the bone marrow, it would not be appropriateto derive in vitro calibration curves using mature lympho-cytes. Secondly, the irradiated cells have passed through anunknown number of divisions to become mature lympho-cytes. This means that unstable cells will have beenremoved and, if some of these also contained translocations,the yield of translocations might have changed. The workthat has been done on persistence in vivo, particularly whenstable cells only have been scored, shows that neither ofthese problems is of great practical importance [L19, T20].As indicated above, the major confounding factor for control levels is age, but there is still some extra variationunaccounted for.
32. The minimum detectable dose is to some extentrelated to the number of cells the investigator is preparedto score. If one is prepared to score translocations in alarge number of cells (for example on a group basis), thenone might detect an average dose of 200 mGy, although500 mGy is a more realistic lower limit. Scoring 1,000genome equivalents (3,000 cells with 3 pairs of the largestchromosomes painted, giving 33% efficiency in detectingtranslocations [I36]), one would expect to see a controllevel of about 10 translocations (in a 60-year-old) and afurther 10 from an added dose of 500 mGy; these are justabout measurable, bearing in mind the Poissonian vari-ability. However, increasing the number of cells scoredwill reduce only the Poissonian variability in counts, andwill do nothing to eliminate the intrinsic variability in control levels.
33. In summary, the biodosimetric methods available atpresent seem useful to estimate only moderate to high indi-vidual historical doses (doses of perhaps 0.2 Gy or above),although their use to estimate group-averaged doses ofabove 0.1 Gy may be meaningful. Perhaps the most usefulmeasure, which is stable over time and between laborato-ries, is the assay of chromosome translocations using theFISH technique.
F. Problem of multiple comparisons in epidemiologicalstudies of radiation risk
34. For a study that makes numerous comparisons (e.g. astudy of radiation exposure and cancer mortality that pro-vides results for many types of cancer), it is popularly sup-posed that 1 statistical test out of 20 will be statisticallysignificant (at the 5% level) by chance. This is not strictlytrue. Not so widely known are the probabilities of obtain-ing 1, 2, 3,…n statistically significant results by chancewhen there is no real effect at all. If the comparisons areindependent of each other (as appropriately calculated estimates of excess mortality or incidence due to varioustypes of cancer approximately are), then table 3 gives illustrative results.
35. Table 3 shows, for example, that the probabilities ofobtaining one or more statistically significant results purelyby chance are about 40.1%, 64.2%, 78.5%, 87.1%, 92.3%and 99.4% with 10, 20, 30, 40, 50 or 100 comparisons,respectively. The corresponding probabilities of obtainingtwo or more statistically significant results by chance are8.6%, 26.4%, 44.6%, 60.1%, 72.1% and 96.3%, respec-tively, and so forth. There is no simple way to distinguishwith certainty real effects from chance effects. Other crite-ria must be used to assess whether a particular associationis likely to be causal or due to chance.
36. In assessing the results of analyses, in particular thosethat may have come from multiple testing of a variety ofend points, the Bradford Hill criteria for assessing whetheran association is plausibly causal should always be consid-ered [B20]. Specifically these are as follows: (a) consis-tency and unbiasedness of findings: confirmation of theassociation by different investigators, in different popula-tions, using different methods; (b) strength of association,and in particular two aspects: the frequency with which thefactor (in this case radiation) is found in association withthe disease, and the frequency with which it is found in theabsence of the disease; the larger the relative risk, the morethe hypothesis is strengthened; (c) temporal sequence: obvi-ously, exposure to the factor (in this case radiation) mustoccur before onset of the disease; in addition, if it is pos-sible to show a temporal relationship, as between exposureto the factor in the population and the frequency of the dis-ease, the case is strengthened; (d) biological gradient(dose–response relationship): finding a quantitative rela-tionship between exposure to radiation and the frequencyof the disease; the intensity or the duration of exposure maybe measured; (e) specificity: if the factor being studied canbe isolated from others and shown to produce changes inthe incidence of the disease, for example if thyroid cancercan be shown to have a higher incidence specifically asso-ciated with radiation exposure, this is convincing evidenceof causation; (f) coherence with biological background andprevious knowledge: the evidence must fit the facts that arethought to be related, e.g. the rising incidence of dental fluorosis and the rising consumption of fluoride are coher-ent; (g) biological plausibility: the statistically significant
UNSCEAR REPORT-PART 1.qxp 10/7/08 2:57 pm Page 28
association fits well with previously existing knowledge; (h) reasoning by analogy: sometimes a commonly acceptedphenomenon in one area can be applied to another area; (i) experimental evidence: are similar effects observed incarefully controlled experiments in a variety of model sys-tems? Criteria (a), (d) and (i) are critical in evaluatingwhether a putative radiation effect is likely to represent acausal association. Sometimes a Bayesian analysis will alsohelp give a better indication of the meaningfulness of par-ticular results, in that it can present a more realistic pictureof relative risk [G5, W1].
37. Statistical approaches are available to address theproblem of multiple comparisons (e.g. the highly conserva-tive Bonferroni criterion [T2] or the improved approach ofBenjamini and Hochberg [B1]) but have seldom been used,for a number of reasons. One reason is that they reduce sta-tistical power for any given comparison. Epidemiologicalstudies commonly have limited statistical power for manycancer end points, and using such approaches to address theproblem of multiple comparisons would reduce it further.The assumption of independence of the various tests is alsooften questionable. Although such methods facilitate theadjustment of tests of statistical significance, they provideno way to adjust the corresponding confidence intervals.Notwithstanding these problems, attempts should generallybe made to account for this in assessing the significance ofclaimed findings.
G. Measures of radiation risk, including lifetime risk
38. Appendix B details the six commonly used measuresof population cancer risk, and their relation to the instanta-neous cancer mortality rate, µc(s,t | a,D), expressed as cancerdeaths per year that result for a given cancer type c at aget for persons of sex s following some instantaneously admin-istered radiation dose D given at age a. This quantity is typ-ically evaluated by fitting a model for radiation risk to datacorresponding to some exposed cohort. As outlined in appen-dix B, fundamental to the assessment of cancer risk for apopulation, one must assume certain underlying mortalityrates that the population would experience in the absence ofradiation exposure, both overall and for each cancer type.For calculations of population risk for cancer incidence,cancer incidence rates must also be specified. These under-lying rates are generally estimated from national morbidityand mortality rates. It is usual to calculate the consequenceof an instantaneous exposure to a “test” dose, Dt, that isassumed to be administered at some age, a. However, other,more general patterns of exposure are possible. By far themost commonly used population risk measure is the risk ofexposure-induced death (REID) per unit dose; this has beenemployed by many scientific committees [I11, U2, U4] andothers [L15, L16, L17]. As discussed in appendix B, thisand the other five measures of risk considered there are non-constant as a function of the test dose Dt.
H. Transfer of radiation risk estimates between populations, and interactions of carcinogens
39. Despite the relatively large number of data on radiationrisk, the question of how to transfer risk estimates derivedfrom one population to a different population remains un-answered. The available data suggest that there is no simplesolution to the problem [M23, U4], as indicated below.
40. There does not appear to be an obvious, consistentrelationship between underlying and radiation-relatedcancer risk, either across cancer sites within a single pop-ulation or across populations for a single cancer site. In thefemale Japanese population generally, age-standardized(world) incidence is similar for stomach cancer and breastcancer, about 31 and 34, respectively, per 100 000 per yearwhereas in the United States of America the incidence isabout 3 and 90, respectively [P19]. Among survivors of theatomic bombings, the radiation-related ERR at exposure age30 at 1 Gy (ERR1 Gy) is 0.34 for stomach cancer incidenceand 0.87 for breast cancer incidence [P48]. Stomach cancercontributes a substantial proportion of the total radiation-related risk (about 18%), but that proportion is considerablyless than the proportion of underlying stomach cancer inci-dence to total underlying cancer incidence (about 27%)among survivors of the atomic bombings [P48] and amongJapanese people generally [P19]. In the United States, theratio is 2% for males and 1% for females [P19]. For femalebreast cancer the opposite is true. The underlying rate inJapan is among the lowest in the world for developed coun-tries, whereas the total cancer rate is not much differentfrom that in most other countries [P19], while among sur-vivors of the atomic bombings, breast cancer contributes adisproportionately large fraction (about 17%) of the totalradiation-related cancer burden [P48]. In the United Statesand many Western European populations, by contrast,underlying breast cancer rates are high [P19], but the radi-ation-related excess risk (in absolute terms) per unit doseamong medically exposed women is similar to that amongthe survivors of the atomic bombings [L5, P3] (see alsotable 10). That is, the dose-specific, radiation-related com-ponent of the total breast cancer risk is likely to be similarin absolute magnitude for exposed Japanese and Westernpopulations but, in Western populations, smaller as a pro-portion of the total breast cancer risk. For stomach cancer,on the other hand, the United States underlying rate is anorder of magnitude lower than that in Japan [P19], whereasthe limited information on dose-specific, radiation-relatedexcess risk suggests that, as a multiple of the underlyingrisk, it may be comparable to that in the survivors of theatomic bombings [C4, G6].
41. The above information suggests that, for breast cancer,the radiation-related ERR per unit dose (i.e. the excess riskper unit dose expressed as a multiple of the underlying riskfor the Japanese population) based on the data from the sur-vivors of the atomic bombings in Japan would overestimatethe risk for an exposed United States population. On theother hand, for stomach cancer, the radiation-related EAR
ANNEX A: EPIDEMIOLOGICAL STUDIES OF RADIATION AND CANCER 29
UNSCEAR REPORT-PART 1.qxp 10/7/08 2:57 pm Page 29
30 UNSCEAR 2006 REPORT: VOLUME I
(i.e. the difference between the risk following exposure andthe Japanese underlying risk) would result in an over-estimate for the United States population. For most othercancers there is almost no information of a similar nature.This is not a trivial matter, because any transfer of a riskestimate from one population to another requires an assumption, explicit or implicit, about the relation betweenthe excess and the underlying risk. Moreover, for some sites(e.g. stomach, liver and oesophagus) the underlying ratescan differ markedly between populations [P19].
42. The available information suggests that, depending oncircumstances, relative or absolute transfer of risk betweenpopulations, or indeed the use of some sort of hybridapproach, such as that employed by Muirhead and Darby[M24] and Little et al. [L21], may be appropriate. Manyregulatory bodies implicitly assume that risk transfer isintermediate between additive and multiplicative [I11,M23]. In the updated United States National Institutes ofHealth (NIH) radioepidemiological tables report [L45], formost cancer sites population cancer risk was calculated byweighting equally all possible linear combinations of themultiplicative (M) and additive (A) transfer model estimates,p × M + (1 – p) × A, by assuming p to be a random vari-able distributed approximately uniformly between 0 and 1.This subjective approach was motivated by: (a) the consid-eration that differences in underlying rates might reflect dif-ferential exposure to both cancer initiators (consistent withadditive transfer) and cancer promoters (consistent withmultiplicative transfer), and (b) an almost complete lack ofrelevant epidemiological information for most cancer sites.The general United States Environmental Protection Agency(EPA) approach for site-specific cancer risk was similar, buton a logarithmic scale, i.e. the logarithm of the excess riskwas assumed to be a linear mixture between the logarithmsof the multiplicative and additive transfer model estimates[E6], where the value of the uncertain mixture parameter pwas assumed to be uniformly distributed between 0 and 1.The EPA approach tends to yield somewhat lower risk esti-mates than the approach of the National Cancer Institute(NCI)/Center for Disease Control (CDC) [L45]. For the fewsites where information on population transfer was avail-able, the NCI/CDC approach was to favour one simpletransfer model over the other. For example, for breastcancer, 0.5 probability was placed on additive transfer and0.5 on the uniform model; for stomach cancer, 0.33 prob-ability was placed on multiplicative transfer and 0.67 on theuniform model.
43. It should not be surprising that the relationshipbetween radiation-related and underlying risk in differentpopulations is not consistent for different cancer sites. Thereare reasons, as yet poorly understood, why underlying breastcancer rates are high in the United States, and why under-lying stomach cancer rates are high in Japan. These reasonsare almost certainly related to differences in lifestyle.Haenszel et al. [H35] found that migrants to Hawaii fromJapan continued to have high levels of stomach cancer risk,but their children, especially those who had adopted
Western-style diets, did not; this suggests that exposuresearly in life are critical determinants for this disease. Onthe other hand, colon cancer rates among migrants to theUnited States and Australia from countries with low under-lying levels have tended, within their lifetimes, to convergeto the higher levels characteristic of the country [H36, T39].Similar findings have been reported for breast cancer riskamong women migrating to the United States fromEuropean countries with low underlying rates, but forJapanese migrants to Hawaii and California the convergencewas much slower [H34, Z5]. Generally breast cancer ratesfrom non-white migrants to the United States remain belowUnited States rates both in the migrants and in their descen-dants [T39]. In contrast, breast cancer rates in whitemigrants to the United States approximate those of UnitedStates whites in the first generation, except for rates inmigrants from the former Yugoslavia [T39]. On the otherhand, the breast cancer incidence rate in the SanFrancisco–Oakland metropolitan region among American-born women of Japanese descent was, by 1969–1971,approaching that for the Caucasian population [B24]. Thelifestyle factors affecting the rates for breast and stomachcancer are probably different, at least in part, and probablyinteract differently with the radiation dose factor.
44. Related to this question is the issue of how one shouldmodel interactions between radiation and other agents inrelation to cancer risk. This was the subject of an extensivereview issued in annex H of the UNSCEAR 2000 Report[U2], which encompassed biological and epidemiologicalevidence for interactions and discussed in detail the impli-cations for statistical modelling. Undoubtedly the most stud-ied of these interactions is that between radiation andcigarette smoking in relation to lung cancer. Analysis bythe BEIR (Biological Effects of Ionizing Radiation) VICommittee and others of the effects of cigarette smokingand radon progeny on lung cancer risk in 11 miner cohortssuggested an interaction that was intermediate betweenadditive and multiplicative [C36, L39]. The preferred modelof the BEIR VI Committee was submultiplicative [C36]. Infits to the data on Colorado Plateau uranium miners, modelswith multiplicative interaction between the effects of expo-sures to radon progeny and cigarette smoke were preferredto models with additive interactions, although it was notpossible to rule out either submultiplicative or supramulti-plicative models [L39]. Lung cancer mortality amongMayak workers could be better described with a model ofcarcinogenesis that was submultiplicative in relative risksof smoking and radiation than with a model that was mul-tiplicative [J10]. Studies on domestic radon daughter expo-sure also suggest that the relationship between the effectsof smoking and exposure to radon progeny in relation tolung cancer risk may be closer to multiplicative than addi-tive [D24, P18]. Analysis of lung cancer in persons treatedfor Hodgkin’s disease demonstrated a multiplicative inter-action (on the logistic scale, i.e. where the disease proba-bility, p, is transformed via the expression log[p /(1 – p)])between radiotherapy dose and cigarette smoke in relationto lung cancer risk; an additive interaction fitted statistically
UNSCEAR REPORT-PART 1.qxp 10/7/08 2:57 pm Page 30
significantly worse. Interactions between radiation andchemotherapy were more nearly additive (on the logisticscale); a model assuming a multiplicative interaction fittedstatistically significantly worse [G23]. In contrast, analysisof the effects of radiation and smoking on lung cancer inci-dence in the survivors of the atomic bombings suggestedthat the interaction was approximately additive, although itwas also consistent with a multiplicative interaction [P17].However, with only a few tens of radiation-induced excesslung cancers, the LSS data at present lack the statisticalpower of the miner data to discriminate between multi-plicative and additive models of interaction. The BEIR VIIreport [C37] also assessed interactions between radiationand a variety of other factors, including tobacco smoke,chemotherapy, heritable genetic risk factors, iodine insuffi-ciency and ultraviolet radiation; in general, interactionsranged between additive and multiplicative effects. TheBEIR VII Committee also adduced from consideration ofstochastic quasi-mechanistic models why this should be so[C37]. However, as this analysis was based on an approx-imate (deterministic) version of the two-mutation model,which is known to poorly approximate the cancer risk fromthe exact (stochastic) model [H57], these inferences maynot be correct. The arguments used by BEIR VII [C37] tojustify invariance of relative risk break down when the exacthazard function is used instead of the approximate (deter-ministic) hazard function, although the arguments in favourof additive invariance of risk still hold (although not for thereasons given). Caution should be exercised in the applica-tion of such inferences to this model, and also to more general multistage cancer models [L25, L26].
45. In general it is not clear in terms of mechanisms orbiology how data on excess risks for one population shouldbe transferred to another population. If one supposes thatradiation acts as the initiating mutation in generalized multi-stage models of the sort recently developed [L25, L26], theninvariance of EAR would correspond to similar radiation-induced mutation rates between populations [L25, L26,L27]. Invariance of ERR would correspond to the ratiobetween the radiation-induced mutation rates and the under-lying mutation rates being invariant [L25, L26, L27].Mechanistic considerations imply that the interactionsbetween radiation and the various other factors that modu-late the multistage process of carcinogenesis may be com-plex [C35, L22], so that in general one would expect neitherrelative nor absolute risks to be invariant across populations.In fits of quasi-mechanistic multistage models to the dataon the Colorado Plateau uranium miners, the model fittingbest was one with three rate-limiting stages, with radondaughter exposure acting to vary the first and second muta-tion rates, and with cigarette smoking acting on the firstmutation rate [L41]. This mixture of radon progeny andsmoking actions on different stages implies that the inter-actions between these agents will not conform to a simplemultiplicative or additive pattern. If this model is true, itwould imply that the observed interaction between theeffects of radiation and cigarette smoking will depend ontheir relative timing. This might explain why there are
indications (admittedly not statistically significant) of dif-ferences between the forms of interaction in the LSS data,where an instantaneous radiation exposure was in generalfollowed by cigarette smoke exposure, and in the minerdata, where cigarette smoke exposure was concurrent with,but also preceded and followed, radiation exposure.
46. Much of environmental, nutritional and occupationalcancer epidemiology is concerned with identifying risk fac-tors that might account for some part of the variation ofsite-specific underlying cancer rates among populations.While there has been much progress, the problem is vastand there is only limited information on the interactionbetween radiation dose and lifestyle, or constitutional fac-tors, in terms of cancer risk. The interactions between radi-ation exposure and cigarette smoking in relation to lungcancer risk discussed above are among the most well stud-ied of such interactions, although other risk factors, in par-ticular diet, have been studied in relation to radiationexposure [S42]. Interactions of radiation exposure with con-stitutional factors are discussed at greater length in sectionI.I and also in sections III.L and III.M (on cutaneousmelanoma and non-melanoma skin cancer) below. Thus itis likely that, for the foreseeable future, the most usefulinformation relevant to transferring radiation-related riskcoefficients from one population to another will come frommultinational comparisons of site-specific radiation-relatedrisk, rather than from investigations of underlying cancerrisk factors and their interactions with radiation dose.
47. In studies assessing the possible interaction of otherfactors with radiation risk, it can be useful to combine stud-ies with similar designs to attempt to increase statisticalpower, for example by having a wider range of exposuresto some other factor between populations than is availablewithin any given population. Sometimes a “meta-analysis”,based on published findings from several studies, may beperformed. Where feasible, as noted below, it is preferableto combine the original data and analyse them using acommon format, in other words to perform a “pooled analy-sis”. Pooled analyses have been conducted of variouscohorts of radiation workers [C3, C41], to assess the effectsof radon daughter exposure in relation to lung cancer riskin underground miners [C36], to assess thyroid cancer riskin various (mainly medically exposed) cohorts [R6] and toassess breast cancer risk in various populations [H9, L5,P3]. Less commonly, analyses combining cohort and case-control data, for example in relation to leukaemia risk[L31], have been conducted.
48. The possible influence of confounding and residualbias needs to be considered. The greater power and there-fore apparently greater precision of combined studies maybe offset by increased bias resulting from uncontrolled con-founding, for example inter-study confounding. Perhaps themost extreme instances of this are correlation studies, whichas discussed in section I.A are prone to “ecological bias”.For example, this sort of bias is likely to explain the elevated risks, which are large and highly statistically
ANNEX A: EPIDEMIOLOGICAL STUDIES OF RADIATION AND CANCER 31
UNSCEAR REPORT-PART 1.qxp 10/7/08 2:57 pm Page 31
32 UNSCEAR 2006 REPORT: VOLUME I
significant, in a meta-analysis of leukaemia in relation toradon daughter exposure [H32, M45]. Even where there isno inter-study confounding, if the individual studies arebiased, meta-analysis based on their results can result inseriously biased and misleading results [B56, B57, L87].One of the main problems in joint analysis can result froma lack of comparability of the component studies owing, forexample, to differences in data collected on exposures andpotential confounders. This is likely to be a particular prob-lem for meta-analysis, or retrospectively assembled cohortscombined in a pooled analysis. Pooled analyses, in whichthe component cohorts are assembled using a common pro-tocol and prospectively followed up, are therefore to be pre-ferred. Another potential problem with retrospective poolingor meta-analysis is publication bias, i.e. selective reportingof results depending on whether the outcome was statisti-cally significant. As noted in section I.B, this arises partic-ularly in small, ad hoc cohorts. This is less likely to be aproblem in a pooled analysis of large cohorts prospectivelyfollowed up.
I. Impact of human genetic susceptibility on radiation risk
49. The International Commission on RadiologicalProtection (ICRP) [I12] and others [L9, L20, L23] haverecently reviewed the issue of interaction between humangenetic susceptibility and radiation risk. Little and col-leagues [L9, L20, L23] paid particular attention to risksobserved in medically exposed populations, where there isoften (particularly in persons treated for cancer) a higherproportion of persons with heritable cancer syndromes thanin the general population.
50. Only three of the studies considered by Little and col-leagues [L9, L20, L23] contained adequate information toassess interactions between radiotherapy and cancer-proneconditions, all three studies relating to populations treatedin childhood [L24, T10, W11]. The cancer incidence studyof Wong et al. [W11] is an update of an earlier mortalitystudy of Eng et al. [E7]. Tables 4 and 5 provide details onRRs of radiation-associated cancer in these studies in rela-tion to whether the patients had a cancer-prone disorder(defined slightly differently in each study).
51. There were no indications in the studies of Little etal. [L24] or Tucker et al. [T10] that the RR of a secondcancer is higher among those patients with a familial cancersyndrome. Indeed, in the study of Little et al. [L24], braintumour RRs were markedly lower among the patients withcancer-prone disorders compared with those in the non-susceptible population, at borderline levels of statistical sig-nificance (2-sided p = 0.06) (table 4). In the study of Tuckeret al. [T10] there were non-significant indications (2-sidedp = 0.67) of a lower ERR of a bone tumour among patientswith retinoblastoma (RB) than among those patients with-out, although, as is clear from table 5, EARs in the RB
group were higher than among patients without RB. In thatstudy, the RB group included both those patients treated forbilateral RB, which is presumed to be heritable, and thosetreated for unilateral RB, of which most cases are presumedto be non-heritable [W11]. About half of the RBs in thisgroup would be expected to be bilateral [W11].
52. More limited information is available on the interac-tion between radiotherapy and heritable RB in the study ofWong et al. [W11]; unfortunately there is insufficient infor-mation on radiation dose in the published report. Moreinformation is given in a subsequent report [K43], althoughradiation dosimetry has still not been assessed. To assessthe effects of heritable RB on RRs of a second cancer afterradiotherapy for RB, Little et al. [L9] assumed that theexpected numbers of second cancers in this cohort [W11]are given by:
Ei in the non-irradiated, non-heritable-RB group;Ei ⋅ exp[β] in the irradiated, non-heritable-RB group;Ei ⋅ exp[δ] in the non-irradiated, heritable-RB group;Ei ⋅ exp[δ + θ ⋅ β] in the irradiated, heritable-RB group;
where Ei is the (population) expected number of second can-cers in group i. Here exp[β] is the ratio of the risk in theirradiated group to that in the non-irradiated group amongthe non-heritable-RB patients, exp[δ] is the ratio of the riskin the heritable-RB patients to that in the non-heritable-RBpatients, and exp[θ ⋅ β] is the ratio of the risk in the irradi-ated group to that in the non-irradiated group among theheritable-RB patients. The parameter of interest is the mul-tiplier of radiosensitivity in the heritable-RB group, θ, themaximum-likelihood estimate of which is 1.62 (95% CI:0.70, >10,000) (table 5); i.e. there is weak evidence that theradiosensitivity of heritable-RB patients is higher than thatof non-heritable-RB patients. The weakness of this evidencemay in part be a consequence of the small number (nine)of cancers in the non-heritable-RB group. It should beemphasized that no account has been taken of radiotherapydose in this analysis, reflecting the limitations of the pub-lished data. Consequently the conclusions drawn must bequalified. It is likely that similar conclusions would bedrawn from the updated follow-up [K43]; unfortunately notenough information is given in the published report even to duplicate what has been attempted here for the more limited follow-up.
53. Although not shown in tables 4 and 5, additional infor-mation on the interaction between the risk of a radiation-related second cancer and cancer-prone conditions is givenin a study of survivors of childhood cancer by Kony et al.[K25], in which there is weak evidence that RRs of radiation-associated second tumours in patients whose close relativesdevelop cancer more frequently than average (i.e. whobelong to cancer-prone families) are lower than those inpatients who are not from cancer-prone families [K25]. Theratio of RRs for second tumours between groups receiving≥0.5 Gy and <0.5 Gy in the cancer-prone families is 1.9,whereas in the non-cancer-prone families it is 4.1 [K25].
UNSCEAR REPORT-PART 1.qxp 10/7/08 2:57 pm Page 32
54. Although there are indications of rather lower radi-ogenic ERRs among people with cancer-prone disorders[L9], the radiogenic EAR can be higher. For example, inthe study of Tucker et al. [T10], the ERR can be calculatedas 0.08 Gy–1 among patients with a first cancer other thanRB and as 0.05 Gy–1 among those with RB as their firstcancer [L9]; thus the ratio of ERRs for RB versus non-RBpatients is 0.05/0.08 = 0.6. On the assumption that theunderlying cancer risk in RB patients is 5.6 times that innon-RB patients (taken from the ratio of risk in heritable-RB patients to that in non-heritable-RB patients in the studyof Wong et al. [W11]), this calculation implies that the ratioof EARs for RB versus non-RB patients is roughly (5.6 ×0.05)/0.08 = 3.5. As discussed in section I.H above, the factthat ERRs are lower in people with cancer-prone disordersis consistent with a more general pattern observed in epi-demiological data, whereby higher underlying cancer risksare to some extent offset by lower ERRs of radiogeniccancer [U2, U4]. The ICRP [I12] has recently reviewedradiogenic cancer risks among genetically susceptible indi-viduals, and suggests that EARs of radiogenic cancers inpeople with familial cancer syndromes may be higher by afactor of 5–100 than those in non-susceptible individuals,with the most appropriate value for this factor being about10. The ICRP [I12] points out the serious implications ofthe higher EAR for such people receiving large doses ofradiation, for example during radiotherapy. This elevatedrisk has to be balanced against the generally high underly-ing cancer risk in these individuals and the benefits accruing from radiotherapy.
J. Effects of dose protraction or fractionation and radiation quality
55. The derivation of cancer risks after exposure to ion-izing radiation at low doses and dose rates is critical to thesetting of standards for radiological protection. In annex Gof the UNSCEAR 2000 Report [U2], there was a detaileddiscussion of what constitutes “low dose” and “low doserate”, in part derived from previous UNSCEAR reports [U5,U7]. Curvature in the dose response to any end point canbe measured by the ratio of quadratic to linear coefficients,β /α, which defines the curvature, in fits of the equation:
(It should be noted that in annex G of the UNSCEAR 2000Report [U2], curvature was defined as the inverse of thisquantity, i.e. α / β.)
56. For chromosome aberrations in peripheral blood lym-phocytes exposed to 60Co gamma rays, typically β / α ≈5 Gy–1 [L88], implying that at doses of up to 40 mGy thequadratic term, β ⋅ D2, contributes less than 20% of theexcess. For this reason, the UNSCEAR 2000 Report indi-cated that 20–40 mGy of low-LET radiation would be con-sidered a low dose [U2]. Pierce and Vaeth [P11] analysed
F(D) = α ⋅ D + β ⋅ D2
curvature in the LSS cohort adjusting for random dosimet-ric errors and obtained, for solid cancers, a value for β / αof 0.3 (95% CI: <0, 1.7) Gy–1, and for leukaemia, a cur-vature of 0.6 (95% CI: 0.1, 3.3) Gy–1. Little and Muirhead[L37] fitted a somewhat different model, arguably moreplausible radiobiologically, to the LSS incidence data, alsotaking account of random dosimetric errors, and taking sep-arate account of the effects of neutron dose, Dn, and gammadose, Dγ , using:
Assuming a neutron relative biological effectiveness (RBE)of 10 and dose errors expressed as 35% geometric standarddeviation (GSD) (similar to assumptions made by Pierceand Vaeth [P11]) Gy–1, Little and Muirhead [L37] obtained,for solid cancers, curvatures of 0.10 (95% CI: –0.18, 0.70)and, for leukaemia, curvatures of 1.95 (95% CI: 0.31,>1000) Gy–1. It has been shown that the curvature forleukaemia in the LSS is consistent with that seen in anumber of data sets of chromosome aberrations in periph-eral blood lymphocytes exposed to 60Co gamma rays,although this is not the case for solid cancers [L100]. Thesefigures suggest that at a dose of 100 mGy the quadraticterms contribute 3–20% of the total excess, so that a lowdose might consist of any value up to 100 mGy.
57. In the UNSCEAR 2000 Report [U2], microdosimetricanalysis demonstrated that for 60Co gamma rays hitting a 4 µm diameter cell nucleus, doses of 0.8 mGy or less wouldensure that on average no more than about 0.2 radiationtracks hit the nucleus, resulting in no more than 2% of cellnuclei having more than one radiation track. On this basis alow dose would correspond to no more than 0.8 mGy. TheBEIR VII report [C37] defined (without justification) a lowdose as 100 mGy or less. The principal definitions to dateas to what constitutes a low dose are summarized in table 6.
58. The UNSCEAR 2000 Report [U2] employed micro-dosimetric analysis of the number of radiation track co-incidences within a cell nucleus to estimate that, in thepresence of DNA repair, dose rates of up to 10–3 mGy/minwould be considered low dose rates, and in order to ensureonly one track per cell in 60 years, dose rates of up to 10–8 mGy/min would be considered low dose rates.However, it was noted that these considerations onlyapplied to end points such as chromosome aberrations,mutation or cell killing. For the multistage induction ofcancer, where the probability of an effect might be influ-enced by a subsequent radiation track, these calculationsbreak down. Assessment of fractionation effects for induc-tion of leukaemia and solid tumours in animal studies wasused in the UNSCEAR 1986 Report [U7] to suggest that0.05 Gy/min of low-LET radiation can be considered a lowdose rate. Comprehensive assessment of fractionationeffects in experimental tumour systems and other data wereused in the 1993 UNSCEAR Report [U5] to conclude that0.1 mGy/min of low-LET radiation averaged over about anhour can be considered a low dose rate. The BEIR VII
F(Dγ , Dn ) = α ⋅[Dγ + RBE ⋅ Dn ] + β ⋅ Dγ2
ANNEX A: EPIDEMIOLOGICAL STUDIES OF RADIATION AND CANCER 33
UNSCEAR REPORT-PART 1.qxp 10/7/08 2:57 pm Page 33
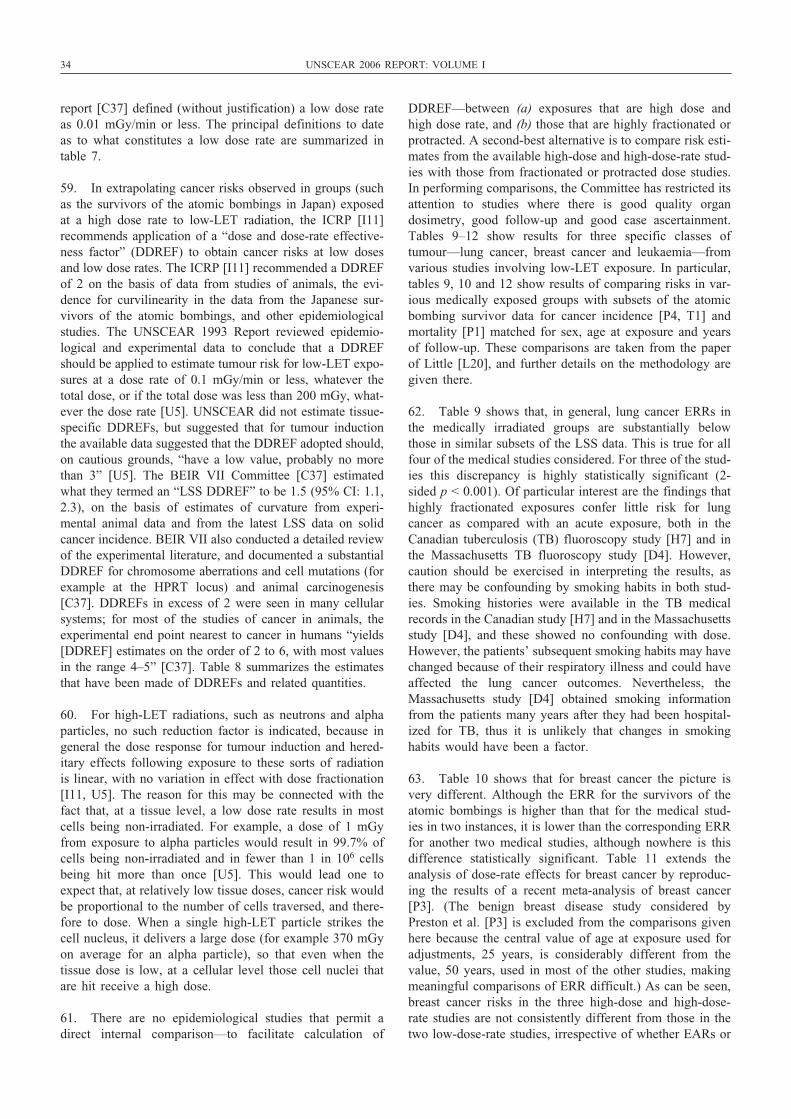
34 UNSCEAR 2006 REPORT: VOLUME I
report [C37] defined (without justification) a low dose rateas 0.01 mGy/min or less. The principal definitions to dateas to what constitutes a low dose rate are summarized intable 7.
59. In extrapolating cancer risks observed in groups (suchas the survivors of the atomic bombings in Japan) exposedat a high dose rate to low-LET radiation, the ICRP [I11]recommends application of a “dose and dose-rate effective-ness factor” (DDREF) to obtain cancer risks at low dosesand low dose rates. The ICRP [I11] recommended a DDREFof 2 on the basis of data from studies of animals, the evi-dence for curvilinearity in the data from the Japanese sur-vivors of the atomic bombings, and other epidemiologicalstudies. The UNSCEAR 1993 Report reviewed epidemio-logical and experimental data to conclude that a DDREFshould be applied to estimate tumour risk for low-LET expo-sures at a dose rate of 0.1 mGy/min or less, whatever thetotal dose, or if the total dose was less than 200 mGy, what-ever the dose rate [U5]. UNSCEAR did not estimate tissue-specific DDREFs, but suggested that for tumour inductionthe available data suggested that the DDREF adopted should,on cautious grounds, “have a low value, probably no morethan 3” [U5]. The BEIR VII Committee [C37] estimatedwhat they termed an “LSS DDREF” to be 1.5 (95% CI: 1.1,2.3), on the basis of estimates of curvature from experi-mental animal data and from the latest LSS data on solidcancer incidence. BEIR VII also conducted a detailed reviewof the experimental literature, and documented a substantialDDREF for chromosome aberrations and cell mutations (forexample at the HPRT locus) and animal carcinogenesis[C37]. DDREFs in excess of 2 were seen in many cellularsystems; for most of the studies of cancer in animals, theexperimental end point nearest to cancer in humans “yields[DDREF] estimates on the order of 2 to 6, with most valuesin the range 4–5” [C37]. Table 8 summarizes the estimatesthat have been made of DDREFs and related quantities.
60. For high-LET radiations, such as neutrons and alphaparticles, no such reduction factor is indicated, because ingeneral the dose response for tumour induction and hered-itary effects following exposure to these sorts of radiationis linear, with no variation in effect with dose fractionation[I11, U5]. The reason for this may be connected with thefact that, at a tissue level, a low dose rate results in mostcells being non-irradiated. For example, a dose of 1 mGyfrom exposure to alpha particles would result in 99.7% ofcells being non-irradiated and in fewer than 1 in 106 cellsbeing hit more than once [U5]. This would lead one toexpect that, at relatively low tissue doses, cancer risk wouldbe proportional to the number of cells traversed, and there-fore to dose. When a single high-LET particle strikes thecell nucleus, it delivers a large dose (for example 370 mGyon average for an alpha particle), so that even when thetissue dose is low, at a cellular level those cell nuclei thatare hit receive a high dose.
61. There are no epidemiological studies that permit adirect internal comparison—to facilitate calculation of
DDREF—between (a) exposures that are high dose andhigh dose rate, and (b) those that are highly fractionated orprotracted. A second-best alternative is to compare risk esti-mates from the available high-dose and high-dose-rate stud-ies with those from fractionated or protracted dose studies.In performing comparisons, the Committee has restricted itsattention to studies where there is good quality organdosimetry, good follow-up and good case ascertainment.Tables 9–12 show results for three specific classes oftumour—lung cancer, breast cancer and leukaemia—fromvarious studies involving low-LET exposure. In particular,tables 9, 10 and 12 show results of comparing risks in var-ious medically exposed groups with subsets of the atomicbombing survivor data for cancer incidence [P4, T1] andmortality [P1] matched for sex, age at exposure and yearsof follow-up. These comparisons are taken from the paperof Little [L20], and further details on the methodology aregiven there.
62. Table 9 shows that, in general, lung cancer ERRs inthe medically irradiated groups are substantially belowthose in similar subsets of the LSS data. This is true for allfour of the medical studies considered. For three of the stud-ies this discrepancy is highly statistically significant (2-sided p < 0.001). Of particular interest are the findings thathighly fractionated exposures confer little risk for lungcancer as compared with an acute exposure, both in theCanadian tuberculosis (TB) fluoroscopy study [H7] and inthe Massachusetts TB fluoroscopy study [D4]. However,caution should be exercised in interpreting the results, asthere may be confounding by smoking habits in both stud-ies. Smoking histories were available in the TB medicalrecords in the Canadian study [H7] and in the Massachusettsstudy [D4], and these showed no confounding with dose.However, the patients’ subsequent smoking habits may havechanged because of their respiratory illness and could haveaffected the lung cancer outcomes. Nevertheless, theMassachusetts study [D4] obtained smoking informationfrom the patients many years after they had been hospital-ized for TB, thus it is unlikely that changes in smokinghabits would have been a factor.
63. Table 10 shows that for breast cancer the picture isvery different. Although the ERR for the survivors of theatomic bombings is higher than that for the medical stud-ies in two instances, it is lower than the corresponding ERRfor another two medical studies, although nowhere is thisdifference statistically significant. Table 11 extends theanalysis of dose-rate effects for breast cancer by reproduc-ing the results of a recent meta-analysis of breast cancer[P3]. (The benign breast disease study considered byPreston et al. [P3] is excluded from the comparisons givenhere because the central value of age at exposure used foradjustments, 25 years, is considerably different from thevalue, 50 years, used in most of the other studies, makingmeaningful comparisons of ERR difficult.) As can be seen,breast cancer risks in the three high-dose and high-dose-rate studies are not consistently different from those in thetwo low-dose-rate studies, irrespective of whether EARs or
UNSCEAR REPORT-PART 1.qxp 10/7/08 2:57 pm Page 34
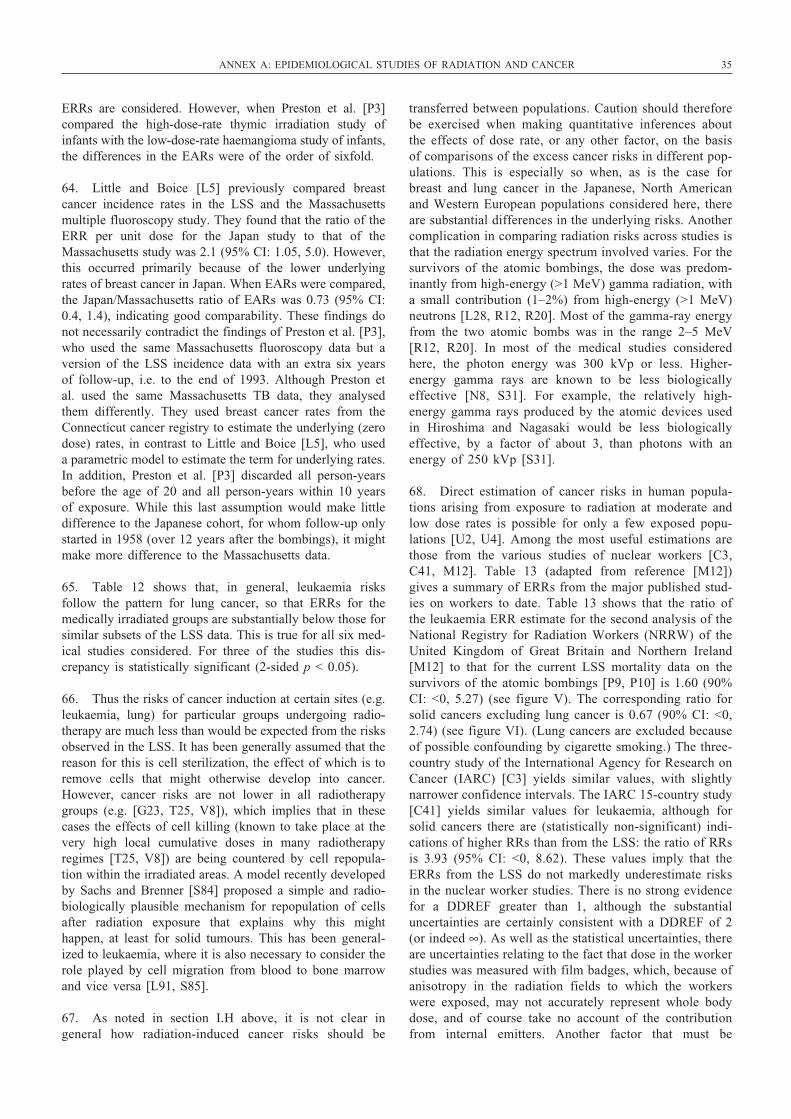
ERRs are considered. However, when Preston et al. [P3]compared the high-dose-rate thymic irradiation study ofinfants with the low-dose-rate haemangioma study of infants,the differences in the EARs were of the order of sixfold.
64. Little and Boice [L5] previously compared breastcancer incidence rates in the LSS and the Massachusettsmultiple fluoroscopy study. They found that the ratio of theERR per unit dose for the Japan study to that of theMassachusetts study was 2.1 (95% CI: 1.05, 5.0). However,this occurred primarily because of the lower underlyingrates of breast cancer in Japan. When EARs were compared,the Japan/Massachusetts ratio of EARs was 0.73 (95% CI:0.4, 1.4), indicating good comparability. These findings donot necessarily contradict the findings of Preston et al. [P3],who used the same Massachusetts fluoroscopy data but aversion of the LSS incidence data with an extra six yearsof follow-up, i.e. to the end of 1993. Although Preston etal. used the same Massachusetts TB data, they analysedthem differently. They used breast cancer rates from theConnecticut cancer registry to estimate the underlying (zerodose) rates, in contrast to Little and Boice [L5], who useda parametric model to estimate the term for underlying rates.In addition, Preston et al. [P3] discarded all person-yearsbefore the age of 20 and all person-years within 10 yearsof exposure. While this last assumption would make littledifference to the Japanese cohort, for whom follow-up onlystarted in 1958 (over 12 years after the bombings), it mightmake more difference to the Massachusetts data.
65. Table 12 shows that, in general, leukaemia risksfollow the pattern for lung cancer, so that ERRs for themedically irradiated groups are substantially below those forsimilar subsets of the LSS data. This is true for all six med-ical studies considered. For three of the studies this dis-crepancy is statistically significant (2-sided p < 0.05).
66. Thus the risks of cancer induction at certain sites (e.g.leukaemia, lung) for particular groups undergoing radio-therapy are much less than would be expected from the risksobserved in the LSS. It has been generally assumed that thereason for this is cell sterilization, the effect of which is toremove cells that might otherwise develop into cancer.However, cancer risks are not lower in all radiotherapygroups (e.g. [G23, T25, V8]), which implies that in thesecases the effects of cell killing (known to take place at thevery high local cumulative doses in many radiotherapyregimes [T25, V8]) are being countered by cell repopula-tion within the irradiated areas. A model recently developedby Sachs and Brenner [S84] proposed a simple and radio-biologically plausible mechanism for repopulation of cellsafter radiation exposure that explains why this mighthappen, at least for solid tumours. This has been general-ized to leukaemia, where it is also necessary to consider therole played by cell migration from blood to bone marrowand vice versa [L91, S85].
67. As noted in section I.H above, it is not clear in general how radiation-induced cancer risks should be
transferred between populations. Caution should thereforebe exercised when making quantitative inferences aboutthe effects of dose rate, or any other factor, on the basisof comparisons of the excess cancer risks in different pop-ulations. This is especially so when, as is the case forbreast and lung cancer in the Japanese, North Americanand Western European populations considered here, thereare substantial differences in the underlying risks. Anothercomplication in comparing radiation risks across studies isthat the radiation energy spectrum involved varies. For thesurvivors of the atomic bombings, the dose was predom-inantly from high-energy (>1 MeV) gamma radiation, witha small contribution (1–2%) from high-energy (>1 MeV)neutrons [L28, R12, R20]. Most of the gamma-ray energyfrom the two atomic bombs was in the range 2–5 MeV[R12, R20]. In most of the medical studies consideredhere, the photon energy was 300 kVp or less. Higher-energy gamma rays are known to be less biologicallyeffective [N8, S31]. For example, the relatively high-energy gamma rays produced by the atomic devices usedin Hiroshima and Nagasaki would be less biologicallyeffective, by a factor of about 3, than photons with anenergy of 250 kVp [S31].
68. Direct estimation of cancer risks in human popula-tions arising from exposure to radiation at moderate andlow dose rates is possible for only a few exposed popu-lations [U2, U4]. Among the most useful estimations arethose from the various studies of nuclear workers [C3,C41, M12]. Table 13 (adapted from reference [M12])gives a summary of ERRs from the major published stud-ies on workers to date. Table 13 shows that the ratio ofthe leukaemia ERR estimate for the second analysis of theNational Registry for Radiation Workers (NRRW) of theUnited Kingdom of Great Britain and Northern Ireland[M12] to that for the current LSS mortality data on thesurvivors of the atomic bombings [P9, P10] is 1.60 (90%CI: <0, 5.27) (see figure V). The corresponding ratio forsolid cancers excluding lung cancer is 0.67 (90% CI: <0,2.74) (see figure VI). (Lung cancers are excluded becauseof possible confounding by cigarette smoking.) The three-country study of the International Agency for Research onCancer (IARC) [C3] yields similar values, with slightlynarrower confidence intervals. The IARC 15-country study[C41] yields similar values for leukaemia, although forsolid cancers there are (statistically non-significant) indi-cations of higher RRs than from the LSS: the ratio of RRsis 3.93 (95% CI: <0, 8.62). These values imply that theERRs from the LSS do not markedly underestimate risksin the nuclear worker studies. There is no strong evidencefor a DDREF greater than 1, although the substantialuncertainties are certainly consistent with a DDREF of 2(or indeed ∞). As well as the statistical uncertainties, thereare uncertainties relating to the fact that dose in the workerstudies was measured with film badges, which, because ofanisotropy in the radiation fields to which the workerswere exposed, may not accurately represent whole bodydose, and of course take no account of the contributionfrom internal emitters. Another factor that must be
ANNEX A: EPIDEMIOLOGICAL STUDIES OF RADIATION AND CANCER 35
UNSCEAR REPORT-PART 1.qxp 10/7/08 2:57 pm Page 35
36 UNSCEAR 2006 REPORT: VOLUME I
considered in comparing the worker studies and the LSSdata is the radiation energy spectrum. As noted above,most of the gamma-ray energy from the two atomic bomb-ings was in the range 2–5 MeV [R12, R20]. There is con-siderable variation in the radiation energy spectrum amongthe nuclear workforces. Even at the Sellafield site therewas substantial variation in radiation energy, with someworkers exposed to high-energy gamma radiation, with anenergy of up to 7 MeV, although for the majority of work-ers most of the dose was delivered by photons with anenergy in the range 0.1–1 MeV [K28]. As noted above,higher-energy gamma rays are known to be less biologi-cally effective [N8, S31]. For example, the relatively high-energy gamma rays produced by the atomic devices usedin Hiroshima and Nagasaki would be less biologicallyeffective by a factor of about 2 than photons with anenergy of 0.5 MeV [S31].
69. As an alternative to deriving values for DDREF bycomparing cancer risks in groups exposed at high dose rates(such as the survivors of the atomic bombings) with thosein groups exposed at lower dose rates, attempts have beenmade at assessing the curvature in the dose–response rela-tionship for cancer derived from the LSS data in order toassess cancer risks at low doses [C35, L37, P1, P11, V5].Most of these attempts use various versions of the LSS dataon cancer mortality.
70. Pierce and colleagues [P11, V5] and Little andMuirhead [L37] fitted linear–quadratic and linear modelsto the LSS data and derived estimates of a quantity calledthe low-dose extrapolation factor (LDEF), which is theamount by which the low-dose (linear) slope of thelinear–quadratic model is overestimated by the slope ofthe linear model, and so is somewhat analogous toDDREF. Pierce and Vaeth [P11] analysed the LSS Report11 mortality data and derived values for LDEF of about1.8 (95% CI: 1.0, 6.0) for leukaemia and about 1.2 (95%CI: <1, 3.4) for solid cancers. Vaeth et al. [V5] analyseda preliminary version of the older cancer incidence data[P4, T1] and derived values for LDEF of about 2.5 (95%CI: 1.3, 8.4) for leukaemia and about 1 (95% CI: <1, 1.4)for solid cancers. Little and Muirhead [L37] analysed theolder version of the cancer incidence data [P4, T1] andderived values for LDEF of 2.47 (95% CI: 1.24, >1000)for leukaemia and 1.06 (95% CI: <1, 1.62) for solid can-cers. When attention was restricted to the 0–2 Gy doserange, Little and Muirhead derived values for LDEF of1.73 (95% CI: <1, 147.67) for leukaemia and 1.21 (95%CI: <1, 2.45) for solid cancers. The value of 2 for DDREFrecommended by the ICRP is consistent with these values[I11]. For solid cancers, values of DDREF much greaterthan 2 would not be consistent with the LSS data.Moreover, a value for DDREF of 1 would also be con-sistent with these data.
6
5
4
3
2
1
0
0.0 0.1 0.2 0.3 0.4 0.5 0.6
DOSE (Sv)
RELA
TIV
E RI
SK
Atomic bombing
survivors
NRRW
trend
CI
trend
CI
Figure V. Trends with dose in relative risk (and 90% CI) for leukaemia excluding chronic lymphocytic leukaemia in theNRRW [M12] and among the survivors of the atomic bombings in Japan [P10] The results for the atomic bombing survivors are based on the linear component of a linear–quadratic dose response (adapted from Muirhead et al. [M12]). The points represent estimated RRs for certain dose intervals, and the regression line is based on a fit tothese data
UNSCEAR REPORT-PART 1.qxp 10/7/08 2:57 pm Page 36
K. Thresholds and other departures from linear–quadratic curvature
71. It has been customary to model the dose–responsefunction, F(D), in fits to biological data [U5] and epidemi-ological data [U2, U4] by the linear–quadratic expression:
(1)
It should be noted that this is a model for cancer inductionwhose parameters bear no relation to the α and β valuescommonly used in radiotherapy to describe cell killing byfractionated radiotherapy. While the linear–quadratic doseresponse (with upward curvature) that is found forleukaemia is perhaps the most often employed departurefrom linearity in analyses of the shape of the dose–responsecurve for cancer in radiation-exposed groups [C35, P1, P11,S3], there are various other possible shapes for thedose–response curve. Some use has been made of expo-nential adjustments to the linear–quadratic term in thedose–response function, described by:
(2)
72. This form has been employed in fits to biological data[U5] and epidemiological data [B5, L29, L30, L31, S32, T21,W2]. In particular, there is evidence of cell sterilization
F(D) = [α ⋅ D + β ⋅ D2 ] ⋅ exp(γ ⋅ D)
F(D) = α ⋅ D + β ⋅ D2
effects in the dose response for non-melanoma skin canceramong the survivors of the atomic bombings [L30] and forleukaemia in a pooled analysis of the survivors and twomedically exposed cohorts [L31]. The α ⋅ D + β ⋅ D2 com-ponent represents the effect of (carcinogenic) mutationinduction, while the exp(γ ⋅ D) term represents the effect ofcell sterilization. In general, the cell sterilization coefficientis <0. Variant forms of the cell sterilization term, exp(γ ⋅ D),incorporating higher powers of dose, D, i.e. exp(γ ⋅ Dk) fork>1, are sometimes employed [L30, U5].
73. Evidence has been presented for possible hormetic orbeneficial effects of low doses of ionizing radiation, whetherin respect to cancer [D23, H29, M2] or other end points[M25], although these interpretations of the data have beenchallenged [U5]. For the class of deterministic effectsdefined by the ICRP [I11], it is assumed that there is athreshold dose below which there is no effect, so that, gen-eralizing the above, the dose–response function could takethe form:
(3)
74. This form of dose response assumes that the radia-tion-induced excess risk will be zero up until dose Dt, after
F(D) = [α ⋅[D − Dt ] + β ⋅[D − Dt ]2 ] ⋅
exp(γ ⋅[D − Dt ]) ⋅1D> Dt
ANNEX A: EPIDEMIOLOGICAL STUDIES OF RADIATION AND CANCER 37
1.5
1.25
1.00
0.75
0.50
0.0 0.1 0.2 0.3 0.4 0.5 0.6
DOSE (Sv)
RELA
TIV
E RI
SK
Atomic bombing
survivors
NRRW
trend
CI
trend
CI
Figure VI. Trends with dose in relative risk (and 90% CI) for all malignant neoplasms other than leukaemia and lung cancerin the NRRW [M12] and among the survivors of the atomic bombings in Japan [P9]The results for the atomic bombing survivors are based on a linear dose response, without adjustment for dose rate (adapted from Muirheadet al. [M12]). The points represent estimated RRs for certain dose intervals, and the regression line is based on a fit to these data
UNSCEAR REPORT-PART 1.qxp 10/7/08 2:57 pm Page 37
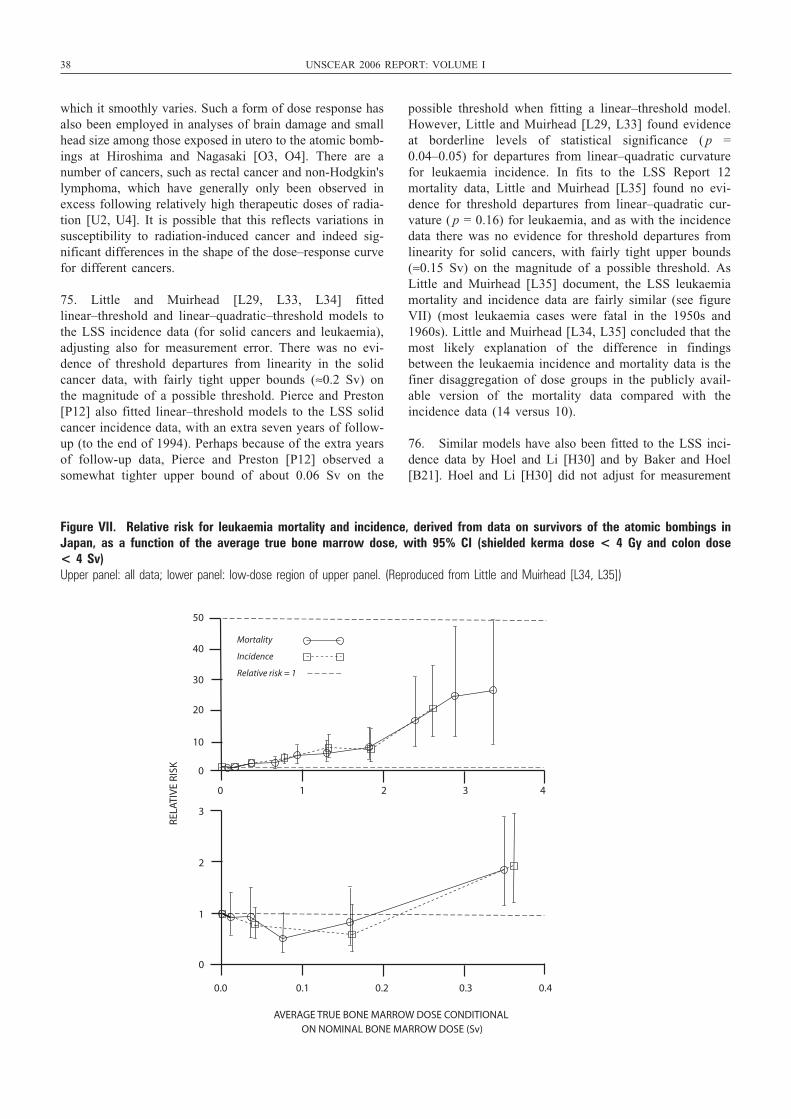
38 UNSCEAR 2006 REPORT: VOLUME I
which it smoothly varies. Such a form of dose response hasalso been employed in analyses of brain damage and smallhead size among those exposed in utero to the atomic bomb-ings at Hiroshima and Nagasaki [O3, O4]. There are anumber of cancers, such as rectal cancer and non-Hodgkin'slymphoma, which have generally only been observed inexcess following relatively high therapeutic doses of radia-tion [U2, U4]. It is possible that this reflects variations insusceptibility to radiation-induced cancer and indeed sig-nificant differences in the shape of the dose–response curvefor different cancers.
75. Little and Muirhead [L29, L33, L34] fittedlinear–threshold and linear–quadratic–threshold models tothe LSS incidence data (for solid cancers and leukaemia),adjusting also for measurement error. There was no evi-dence of threshold departures from linearity in the solidcancer data, with fairly tight upper bounds (≈0.2 Sv) onthe magnitude of a possible threshold. Pierce and Preston[P12] also fitted linear–threshold models to the LSS solidcancer incidence data, with an extra seven years of follow-up (to the end of 1994). Perhaps because of the extra yearsof follow-up data, Pierce and Preston [P12] observed asomewhat tighter upper bound of about 0.06 Sv on the
possible threshold when fitting a linear–threshold model.However, Little and Muirhead [L29, L33] found evidenceat borderline levels of statistical significance ( p =0.04–0.05) for departures from linear–quadratic curvaturefor leukaemia incidence. In fits to the LSS Report 12 mortality data, Little and Muirhead [L35] found no evi-dence for threshold departures from linear–quadratic cur-vature ( p = 0.16) for leukaemia, and as with the incidencedata there was no evidence for threshold departures fromlinearity for solid cancers, with fairly tight upper bounds(≈0.15 Sv) on the magnitude of a possible threshold. AsLittle and Muirhead [L35] document, the LSS leukaemiamortality and incidence data are fairly similar (see figureVII) (most leukaemia cases were fatal in the 1950s and1960s). Little and Muirhead [L34, L35] concluded that themost likely explanation of the difference in findingsbetween the leukaemia incidence and mortality data is thefiner disaggregation of dose groups in the publicly avail-able version of the mortality data compared with the incidence data (14 versus 10).
76. Similar models have also been fitted to the LSS inci-dence data by Hoel and Li [H30] and by Baker and Hoel[B21]. Hoel and Li [H30] did not adjust for measurement
3
2
1
0
0.0 0.1 0.2 0.3 0.4
AVERAGE TRUE BONE MARROW DOSE CONDITIONAL ON NOMINAL BONE MARROW DOSE (Sv)
RELA
TIV
E RI
SK
Mortality
Incidence
Relative risk = 1
50
40
30
20
10
0
0 1 2 3 4
Figure VII. Relative risk for leukaemia mortality and incidence, derived from data on survivors of the atomic bombings inJapan, as a function of the average true bone marrow dose, with 95% CI (shielded kerma dose < 4 Gy and colon dose < 4 Sv)Upper panel: all data; lower panel: low-dose region of upper panel. (Reproduced from Little and Muirhead [L34, L35])
UNSCEAR REPORT-PART 1.qxp 10/7/08 2:57 pm Page 38
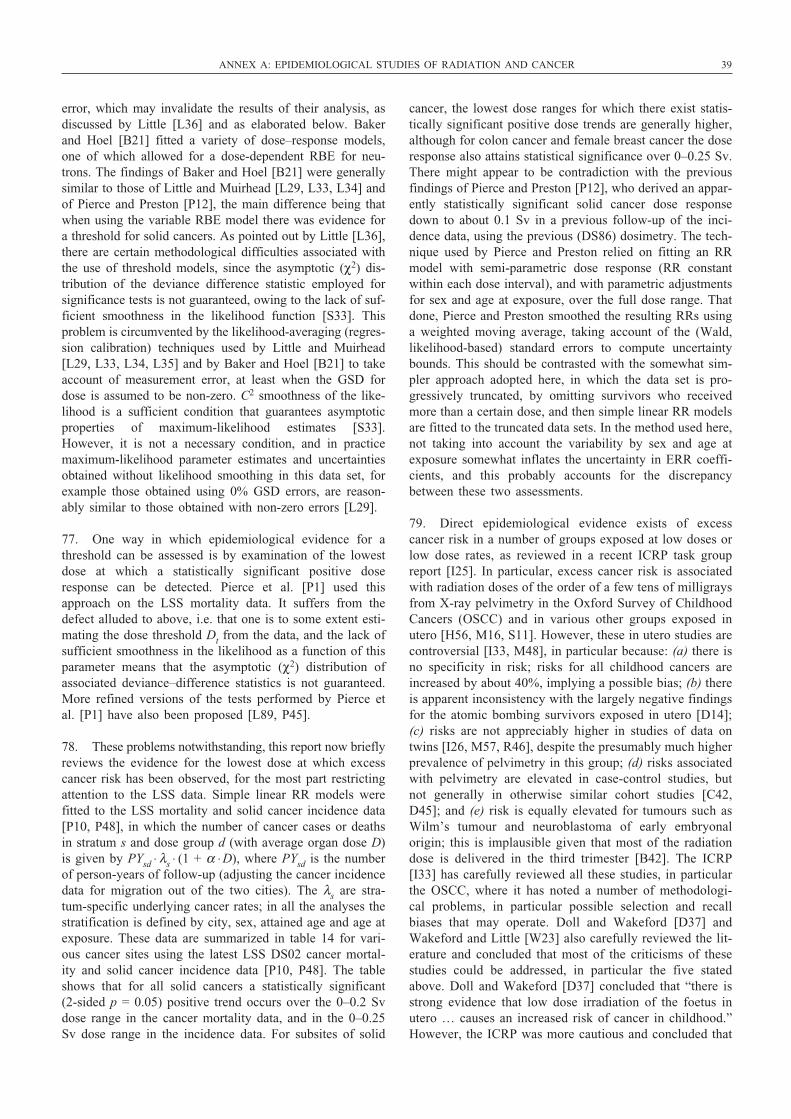
error, which may invalidate the results of their analysis, asdiscussed by Little [L36] and as elaborated below. Bakerand Hoel [B21] fitted a variety of dose–response models,one of which allowed for a dose-dependent RBE for neu-trons. The findings of Baker and Hoel [B21] were generallysimilar to those of Little and Muirhead [L29, L33, L34] andof Pierce and Preston [P12], the main difference being thatwhen using the variable RBE model there was evidence fora threshold for solid cancers. As pointed out by Little [L36],there are certain methodological difficulties associated withthe use of threshold models, since the asymptotic (χ2) dis-tribution of the deviance difference statistic employed forsignificance tests is not guaranteed, owing to the lack of suf-ficient smoothness in the likelihood function [S33]. Thisproblem is circumvented by the likelihood-averaging (regres-sion calibration) techniques used by Little and Muirhead[L29, L33, L34, L35] and by Baker and Hoel [B21] to takeaccount of measurement error, at least when the GSD fordose is assumed to be non-zero. C2 smoothness of the like-lihood is a sufficient condition that guarantees asymptoticproperties of maximum-likelihood estimates [S33].However, it is not a necessary condition, and in practicemaximum-likelihood parameter estimates and uncertaintiesobtained without likelihood smoothing in this data set, forexample those obtained using 0% GSD errors, are reason-ably similar to those obtained with non-zero errors [L29].
77. One way in which epidemiological evidence for athreshold can be assessed is by examination of the lowestdose at which a statistically significant positive doseresponse can be detected. Pierce et al. [P1] used thisapproach on the LSS mortality data. It suffers from thedefect alluded to above, i.e. that one is to some extent esti-mating the dose threshold Dt from the data, and the lack ofsufficient smoothness in the likelihood as a function of thisparameter means that the asymptotic (χ2) distribution ofassociated deviance–difference statistics is not guaranteed.More refined versions of the tests performed by Pierce etal. [P1] have also been proposed [L89, P45].
78. These problems notwithstanding, this report now brieflyreviews the evidence for the lowest dose at which excesscancer risk has been observed, for the most part restrictingattention to the LSS data. Simple linear RR models werefitted to the LSS mortality and solid cancer incidence data[P10, P48], in which the number of cancer cases or deathsin stratum s and dose group d (with average organ dose D)is given by PYsd ⋅ λs ⋅ (1 + α ⋅ D), where PYsd is the numberof person-years of follow-up (adjusting the cancer incidencedata for migration out of the two cities). The λs are stra-tum-specific underlying cancer rates; in all the analyses thestratification is defined by city, sex, attained age and age atexposure. These data are summarized in table 14 for vari-ous cancer sites using the latest LSS DS02 cancer mortal-ity and solid cancer incidence data [P10, P48]. The tableshows that for all solid cancers a statistically significant (2-sided p = 0.05) positive trend occurs over the 0–0.2 Svdose range in the cancer mortality data, and in the 0–0.25Sv dose range in the incidence data. For subsites of solid
cancer, the lowest dose ranges for which there exist statis-tically significant positive dose trends are generally higher,although for colon cancer and female breast cancer the doseresponse also attains statistical significance over 0–0.25 Sv.There might appear to be contradiction with the previousfindings of Pierce and Preston [P12], who derived an appar-ently statistically significant solid cancer dose responsedown to about 0.1 Sv in a previous follow-up of the inci-dence data, using the previous (DS86) dosimetry. The tech-nique used by Pierce and Preston relied on fitting an RRmodel with semi-parametric dose response (RR constantwithin each dose interval), and with parametric adjustmentsfor sex and age at exposure, over the full dose range. Thatdone, Pierce and Preston smoothed the resulting RRs usinga weighted moving average, taking account of the (Wald,likelihood-based) standard errors to compute uncertaintybounds. This should be contrasted with the somewhat sim-pler approach adopted here, in which the data set is pro-gressively truncated, by omitting survivors who receivedmore than a certain dose, and then simple linear RR modelsare fitted to the truncated data sets. In the method used here,not taking into account the variability by sex and age atexposure somewhat inflates the uncertainty in ERR coeffi-cients, and this probably accounts for the discrepancybetween these two assessments.
79. Direct epidemiological evidence exists of excesscancer risk in a number of groups exposed at low doses orlow dose rates, as reviewed in a recent ICRP task groupreport [I25]. In particular, excess cancer risk is associatedwith radiation doses of the order of a few tens of milligraysfrom X-ray pelvimetry in the Oxford Survey of ChildhoodCancers (OSCC) and in various other groups exposed inutero [H56, M16, S11]. However, these in utero studies arecontroversial [I33, M48], in particular because: (a) there isno specificity in risk; risks for all childhood cancers areincreased by about 40%, implying a possible bias; (b) thereis apparent inconsistency with the largely negative findingsfor the atomic bombing survivors exposed in utero [D14];(c) risks are not appreciably higher in studies of data ontwins [I26, M57, R46], despite the presumably much higherprevalence of pelvimetry in this group; (d) risks associatedwith pelvimetry are elevated in case-control studies, butnot generally in otherwise similar cohort studies [C42,D45]; and (e) risk is equally elevated for tumours such asWilm’s tumour and neuroblastoma of early embryonalorigin; this is implausible given that most of the radiationdose is delivered in the third trimester [B42]. The ICRP[I33] has carefully reviewed all these studies, in particularthe OSCC, where it has noted a number of methodologi-cal problems, in particular possible selection and recallbiases that may operate. Doll and Wakeford [D37] andWakeford and Little [W23] also carefully reviewed the lit-erature and concluded that most of the criticisms of thesestudies could be addressed, in particular the five statedabove. Doll and Wakeford [D37] concluded that “there isstrong evidence that low dose irradiation of the foetus inutero … causes an increased risk of cancer in childhood.”However, the ICRP was more cautious and concluded that
ANNEX A: EPIDEMIOLOGICAL STUDIES OF RADIATION AND CANCER 39
UNSCEAR REPORT-PART 1.qxp 10/7/08 2:57 pm Page 39
40 UNSCEAR 2006 REPORT: VOLUME I
“although the arguments fall short of being definitivebecause of the combination of biological and statisticaluncertainties involved, they raise a serious question ofwhether the great consistency in elevated RRs, includingembryonal tumours and lymphomas, may be due to biasesin the OSCC study rather than a causal association” [I33].Wakeford and Little estimated the ERR coefficient forchildhood (<15 years of age) cancer obtained from theOSCC to be around 50 Gy–1, leading to a risk coefficientfor total incidence of about 8% Gy–1; however, the statis-tical, dosimetric and modelling uncertainties in these riskestimates are considerable [W23].
80. Increased breast cancer risk has been observed amongyoung women exposed to high cumulative doses from mul-tiple thoracic fluoroscopic X-ray exposures, delivered infractions that were, on average, of the order of 10 mGy [B3,H9, L5]. Increased breast cancer risk has also been observedin a study of patients given multiple X-rays as part of thediagnosis of scoliosis; doses in this study were due to con-ventional X-rays rather than fluoroscopic X-ray exposures[D17]. A typical chest fluoroscopic exposure given in theperiod between 1930 and 1950 would last about 15 s, andpatients would receive 0.01–0.10 Gy [L5]. These fluoro-scopic exposures were not low-dose-rate exposures (see section I.J above), although as the fluoroscopic exposureswould be every two weeks for three to five years, the widetemporal separation of such fractionated low-dose exposureshould theoretically result in a linear dose–response rela-tionship directly applicable to the estimation of low-doseeffects [N16, U5], as discussed in section I.J above. Excess(absolute) breast cancer risks per unit of total dose in thesegroups are comparable to those among survivors of theatomic bombings [L5, P3]. However, there is no compara-ble excess risk of lung cancer among fluoroscopy patients,even though lung doses were comparable to breast doses[D4, D6, H7]. This difference between the findings forbreast and lung cancer among fluoroscopy patients suggeststhat there may be variation in results among cancer sites interms of fractionation effects. However, it should be keptin mind that exposure to tobacco smoke is by far the dom-inant risk factor for lung cancer. It is possible that amongTB patients who underwent lengthy courses of lung col-lapse therapy associated with high cumulative radiation dosefrom fluoroscopic examinations, below-average exposure totobacco smoke might mask a radiation-related increase inlung cancer risk. As discussed in section I.J, attempts weremade to control for smoking in some of the analyses, butthese were based on fairly crude measures such as“ever/never” smoking [D4, H7], so that residual confound-ing cannot be ruled out. Nonetheless, the mean doses forsmokers and non-smokers, for both men and women, wereremarkably similar, and there was no difference in the per-centage of smokers by lung dose over six categories of doseup to and greater than 3 Sv [H7].
81. As discussed above, there are a number of studies ofoccupationally exposed persons, who generally receive lowdoses of ionizing radiation at low dose rates [C3, C36, C41,
M12]. For example, in the IARC 15-country study [C41],average cumulative doses were 19.4 mSv, and fewer than5% of workers received cumulative doses exceeding 100mSv. As noted above, risks observed in these studies aregenerally consistent with those seen in the LSS, as well asbeing consistent with much lower risks.
82. Recently the ICRP has carefully reviewed the issue ofpossible thresholds and their effect on risk estimates ([I25],but see also [L99]). A survey of the epidemiological dataindicates that, as discussed above, there are a number ofgroups exposed to low doses and dose rates that exhibitexcess risk compatible with extrapolations from risksobserved at high doses and dose rates (such as in the LSS[I25]). They present an illustrative exercise in quantitativeuncertainty analysis, in which the various uncertain com-ponents of estimated cancer risk associated with low-dose,low-LET radiation exposure are combined. Attention is paidto the resulting uncertainty distribution for ERR per unitdose, with and without allowing for the uncertain possibil-ity of a universal low-dose threshold below which therewould be no radiation-related risk. Illustrative calculationsdemonstrate that assuming various subjective probabilitiesof a low-dose threshold of between 20% and 80% makesvery little difference to the upper 95% confidence limit ofcancer risk. Even when a low-dose threshold is assumedwith 80% subjective probability, the upper 95% confidencelimit of cancer risk is about 5% Sv–1, compared with the95% upper confidence limit of about 9% Sv–1 if no low-dose threshold is assumed [L99] (see figure VIII). In theexample used, which considers risk from all cancers com-bined, including leukaemia but not non-melanoma skincancer, the major contributors to uncertainty in the overallrisk factor are: statistical variation in the estimated ERR at1 Gy for the population of survivors of the atomic bomb-ings; subjective uncertainty with respect to the DDREF tobe applied at low doses and dose rates; and the postulateduncertainty concerning the existence of a universal thresh-old at some dose above that for which the calculation wasbeing made. The ICRP concluded that, unless the existenceof a threshold was assumed to be virtually certain, the effectof introducing the uncertain possibility of a threshold wasequivalent to that of an uncertain increase in the value ofDDREF, i.e. a variation on the result obtained by ignoringthe possibility of a threshold [I25].
L. Effect of age at exposure, latency and time since exposure
83. When estimating population cancer risks from epi-demiological data, one of the principal uncertainties is dueto the fact that few radiation-exposed cohorts have been fol-lowed up to the end of life of all study subjects. For exam-ple, 55 years after the atomic bombings of Hiroshima andNagasaki, 45% of the survivors were still alive [P10]. Inattempting to estimate lifetime population cancer risks, it istherefore important to predict how risks might vary as a
UNSCEAR REPORT-PART 1.qxp 10/7/08 2:57 pm Page 40
function of time after radiation exposure, in particular for thatgroup of people for whom the uncertainties in projecting riskto the end of life are most uncertain, namely those who wereexposed in childhood.
84. Analyses of solid cancers in the LSS and otherexposed groups have found that the radiation-inducedexcess risk can be approximately described by a constantRR model [I11, U2]. The time-constant ERR model assumesthat if a population is irradiated, then, after some latentperiod, there is an increase in the cancer rate, the excessrate being proportional to the underlying cancer rate in anon-irradiated population. For leukaemia, this model pro-vides an unsatisfactory fit to observations, and conse-quently, for a group of similar malignancies, a number ofother models have been used, including one in which theexcess cancer rate resulting from exposure is assumed to beconstant rather than proportional to the underlying rate, i.e.the time-constant EAR model [U6].
85. For solid cancers there is a large body of evidencethat ERRs diminish with increasing age at exposure [L51,L52, U2]. In particular, this pattern of risk is observed inthe LSS data for both solid cancer incidence and mortality,
for many solid cancer sites and for all solid cancers as awhole [P1, P10, P48, T1] (see also figure X in section IIbelow), and in a variety of other groups (e.g. radiotherapypatients) [L51, L52]. The pattern of variation of EARs withage at exposure is generally the reverse of this. For con-stant attained age the EAR for solid cancers or solid cancermortality increases with increasing age at exposure, as seenin the LSS [P10, P48] (see also figure X).
86. For leukaemia, ERRs also generally diminish withincreasing age at exposure [L51, U2]. In particular, this pat-tern of risk is observed in the LSS data for both solid cancerincidence and mortality [P1, P4, P10], as well as in a vari-ety of other groups (e.g. radiotherapy patients) [L51, L52,U2]. The pattern of variation of EARs with age at expo-sure is generally the reverse of this. EAR increases withincreasing age at exposure, whether for constant attainedage or constant time since exposure, in both the incidenceand the mortality data sets of the LSS [P4, P10]. Patternsof variation of risk by leukaemia subtypes are not so wellunderstood, in part because of a lack of statistical power.In a combined analysis of three cohorts—the LSS cohort(using incidence data) [P4], the United Kingdom ankylos-ing spondylitis patients [W2] and a group of women treated
ANNEX A: EPIDEMIOLOGICAL STUDIES OF RADIATION AND CANCER 41
1.0
0.8
0.6
0.4
0.2
0
2 4 6 8 10 12 14
ESTIMATED LOW-DOSE MORTALITY RISK (% Sv–1)
CU
MU
LATI
VE
PRO
BA
BIL
ITY
95% upper limit
Figure VIII. Effect on the probability distribution of excess lifetime risk per unit dose of assuming the possible existenceof a low-dose threshold, with probability p = 0.2, 0.5 or 0.8 (reproduced from Land [L99])
UNSCEAR REPORT-PART 1.qxp 10/7/08 2:57 pm Page 41
42 UNSCEAR 2006 REPORT: VOLUME I
for cervical cancer [B5]—different patterns of variation ofrisk were seen for the three main radiogenic subtypes [L31].For acute myeloid leukaemia (AML) and chronic myeloidleukaemia (CML), the ERR was described by negativepowers of years since exposure (–0.9 and –2.7, respec-tively), implying no extra variation with age at exposure.However, for acute lymphoblastic leukaemia (ALL), theERR was described by a negative power (–6.3) of attainedage, implying a reduction of risk with increasing age atexposure [L31].
87. To some extent related to these issues is that of the“latency period”. This may be defined as the minimumperiod following exposure after which an excess risk isdetectable, but is often taken to be the minimum period fol-lowing exposure after which a statistically significant excessrisk is detected. As such, it will obviously depend on themagnitude of the dose administered and on other factors,e.g. the magnitude of the ERR and the underlying cancerrate. For this reason, the latency period may not be a veryuseful quantity. Bearing this out, certain groups exposed toradiation due to the Chernobyl accident [K52] and other(medically exposed) cohorts [L98] provide evidence ofshorter latency periods when exposures are higher. Excesssolid cancer mortality is statistically significant for the LSScohort already in the period 5–10 years after exposure[P10]. For example, for the period 1950–1952, the ERR perunit colon dose (with 35% GSD errors), calculated using astratified linear RR model, is 0.41 (90% CI: –0.01, 0.99)Sv–1; for 1950–1955, the ERR is 0.38 (90% CI: 0.07, 0.75)Sv–1; and for 1950–1960, the ERR is 0.24 (90% CI: 0.05,0.45) Sv–1. In other words, there is evidence of excess riskwithin 10 years of exposure, and a suggestion of an excess(i.e. not quite statistically significant) within 7 years. Anexcess of thyroid cancer about 5 years after the Chernobylaccident has been observed among residents of heavily con-taminated areas of the Ukraine [S90]. Given that thyroiddoses due to the Chernobyl accident averaged 1 Gy or moreto some groups (e.g. the 1986 evacuees in Belarus andUkraine [C50, U2]) compared with the much lower doses(e.g. about 0.2 Sv) in the LSS [P48], the apparent discrep-ancy in latency period is easily explained. Latency periodsof much longer than 10 years are statistically inconsistentwith the LSS breast cancer data [L78]. For solid cancers,excess risk is manifest between 5 and 10 years after expo-sure in a number of therapeutically irradiated groups [L51,W8]. However, BEIR VII [C37] presents evidence fromvarious studies that indicate shorter latency periods for solidcancers, and it assumes a latency period of 5 years for solidcancers when estimating cancer risks for the United Statespopulation.
88. Excess leukaemia risks within 5 years of exposure havebeen observed in the ankylosing spondylitis cohort in theUnited Kingdom [D53], and there are suggestions of excessleukaemia risks in Hiroshima and Nagasaki within 5 yearsof the bombings, albeit based on an open city sample thatincludes some people not resident in the cities at the timeof the bombings and with no estimates of dose [F18].
89. For those exposed in childhood, there is evidence thatsolid cancer ERRs may eventually decrease with increasingtime after exposure [L16, L53, L90], although this has notbeen seen in all such groups [S7]. For those exposed inadulthood, risks are more approximately constant over time[L51], although again exceptions have been seen [W8]. Aswill be seen later (in table 45), the optimal generalized RRmodels for solid cancers, fitted to the latest LSS mortalitydata [P10], are ones assuming that—as a function of dose,D, age at exposure, e, and years since exposure, t—the ERR = α ⋅ D ⋅ t1.0 ⋅ [t + e]–2.6, or that the ERR = (α ⋅ D + β ⋅D2) ⋅ t1.0 ⋅ [t + e]–2.6. This implies in either case that the ERRincreases up until approximately 0.6 ⋅ e years after exposure,after which it decreases. In particular, this means that theRR decreases sooner for those exposed in childhood thanfor those exposed in adulthood, which is consistent withobservations from the LSS and studies of other irradiatedgroups.
90. Solid cancer EARs generally show marked increasesover time for all ages at exposure. For example, this patternis observed in the latest LSS mortality data [P10] (see table45 and figure X), and also for many solid cancer sites inthe incidence data [P48] (see tables 47–58). As can be seenfrom table 45, the optimal generalized EAR models for solidcancers, fitted to the latest LSS mortality data [P10], areones assuming that—as a function of dose, D, age at expo-sure, e, and years since exposure, t—the EAR = α ⋅ D ⋅ t 0.7 ⋅[t + e]2.4, or that the EAR = (α ⋅ D + β ⋅ D2) ⋅ t 0.7 ⋅ [t + e]2.3.
91. The ERRs for leukaemia generally peak very shortlyafter exposure, consistent with the short latency period forthis cancer, and then decrease with increasing time afterexposure. This pattern is observed in the LSS incidence andmortality data [L29, P4, P10], in the United Kingdomankyosing spondylitis mortality data [W2], in the interna-tional cervical cancer case-control study [B5] and in a vari-ety of other groups (generally radiotherapy patients) [L51,L52, U2]. Patterns of variation of risk over time byleukaemia subtype are not so well understood, in partbecause of a lack of statistical power. The combined analy-sis of the three (LSS, United Kingdom ankylosing spondyli-tis and international cervical cancer) cohorts discussedabove documented different patterns of variation of riskover time for the three main radiogenic subtypes (AML,CML and ALL) [L31]. For AML and CML, the ERR wasdescribed by a negative power of years since exposure, witha more strongly negative exponent (–2.7) for CML than forAML (–0.9). For ALL, the ERR was described by a nega-tive power (–6.3) of attained age, implying a very markedreduction of risk with increasing time after exposure [L31].As can be seen from table 46, the optimal generalized RRmodels for leukaemia, fitted to the latest LSS mortality data[P10], are ones assuming that—as a function of dose, D,age at exposure, e, and years since exposure, t—the ERR =α ⋅ D2 ⋅ [t + e]–1.6, or that the ERR = (α ⋅ D + β ⋅ D2) ⋅ [t + e]–1.6. This implies in either case that the ERR decreaseswith increasing time after exposure. In interpreting this itshould be noted that the first 5.1 years of follow-up are
UNSCEAR REPORT-PART 1.qxp 10/7/08 2:57 pm Page 42
missing in the LSS data set [P4, P10], so that the early rapidincrease in leukaemia ERR is probably missing.
92. The pattern of variation of leukaemia EAR is gener-ally similar, with a pronounced decrease in EAR withincreasing time after exposure. This pattern is observed inthe LSS incidence and mortality data [P4, P10], at least forall leukaemia subtypes together. Patterns of variation ofEAR over time by leukaemia subtype are more complex. Inthe LSS incidence data there are indications that the EARfor AML increases over time in the group with the oldest
(>40) age at exposure, although the EAR decreases withtime in groups with younger ages at exposure [P4]. As canbe seen from table 46, the optimal generalized EAR modelsfor leukaemia, fitted to the latest LSS mortality data [P10],are ones assuming that—as a function of dose, D, and yearssince exposure, t—the EAR = α ⋅ D2 ⋅ t –0.7, or that the EAR = (α ⋅ D + β ⋅ D2) ⋅ t –0.6. This implies in either case thatthe EAR decreases with increasing time after exposure, butas mentioned above, the problems that result from the miss-ing first 5.1 years of follow-up in the LSS data set [P4,P10] should be noted.
ANNEX A: EPIDEMIOLOGICAL STUDIES OF RADIATION AND CANCER 43
UNSCEAR REPORT-PART 1.qxp 10/7/08 2:57 pm Page 43

UNSCEAR REPORT-PART 1.qxp 10/7/08 2:57 pm Page 44
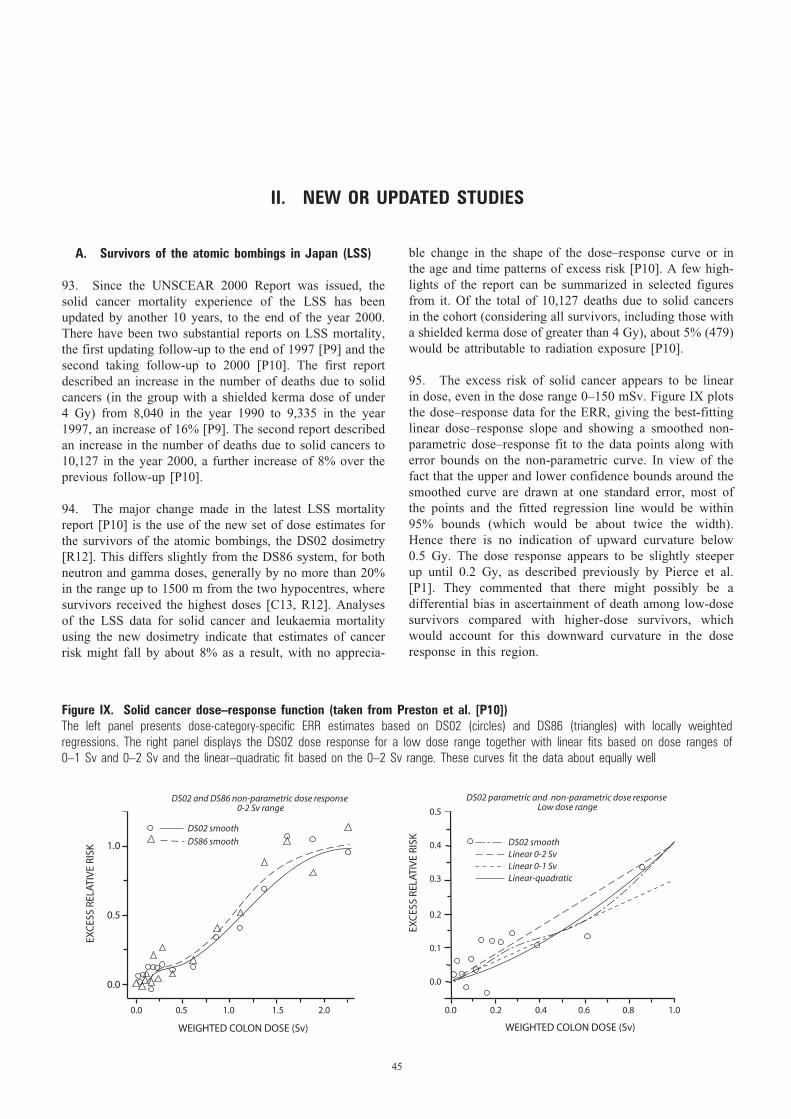
II. NEW OR UPDATED STUDIES
A. Survivors of the atomic bombings in Japan (LSS)
93. Since the UNSCEAR 2000 Report was issued, thesolid cancer mortality experience of the LSS has beenupdated by another 10 years, to the end of the year 2000.There have been two substantial reports on LSS mortality,the first updating follow-up to the end of 1997 [P9] and thesecond taking follow-up to 2000 [P10]. The first reportdescribed an increase in the number of deaths due to solidcancers (in the group with a shielded kerma dose of under4 Gy) from 8,040 in the year 1990 to 9,335 in the year1997, an increase of 16% [P9]. The second report describedan increase in the number of deaths due to solid cancers to10,127 in the year 2000, a further increase of 8% over theprevious follow-up [P10].
94. The major change made in the latest LSS mortalityreport [P10] is the use of the new set of dose estimates forthe survivors of the atomic bombings, the DS02 dosimetry[R12]. This differs slightly from the DS86 system, for bothneutron and gamma doses, generally by no more than 20%in the range up to 1500 m from the two hypocentres, wheresurvivors received the highest doses [C13, R12]. Analysesof the LSS data for solid cancer and leukaemia mortalityusing the new dosimetry indicate that estimates of cancerrisk might fall by about 8% as a result, with no apprecia-
ble change in the shape of the dose–response curve or inthe age and time patterns of excess risk [P10]. A few high-lights of the report can be summarized in selected figuresfrom it. Of the total of 10,127 deaths due to solid cancersin the cohort (considering all survivors, including those witha shielded kerma dose of greater than 4 Gy), about 5% (479)would be attributable to radiation exposure [P10].
95. The excess risk of solid cancer appears to be linearin dose, even in the dose range 0–150 mSv. Figure IX plotsthe dose–response data for the ERR, giving the best-fittinglinear dose–response slope and showing a smoothed non-parametric dose–response fit to the data points along witherror bounds on the non-parametric curve. In view of thefact that the upper and lower confidence bounds around thesmoothed curve are drawn at one standard error, most ofthe points and the fitted regression line would be within95% bounds (which would be about twice the width).Hence there is no indication of upward curvature below 0.5 Gy. The dose response appears to be slightly steeperup until 0.2 Gy, as described previously by Pierce et al.[P1]. They commented that there might possibly be a differential bias in ascertainment of death among low-dosesurvivors compared with higher-dose survivors, whichwould account for this downward curvature in the doseresponse in this region.
45
1.0
0.5
0.0
0.0 0.2 0.4 0.6 0.8 1.0
WEIGHTED COLON DOSE (Sv)
EXC
ESS
RELA
TIV
E RI
SK
EXC
ESS
RELA
TIV
E RI
SK
0.5
0.4
0.3
0.2
0.1
0.0
0.0 0.5 1.0 1.5 2.0
WEIGHTED COLON DOSE (Sv)
DS02 smooth
DS86 smooth
DS02 and DS86 non-parametric dose response 0-2 Sv range
DS02 parametric and non-parametric dose response Low dose range
DS02 smoothLinear 0-2 SvLinear 0-1 SvLinear-quadratic
Figure IX. Solid cancer dose–response function (taken from Preston et al. [P10]) The left panel presents dose-category-specific ERR estimates based on DS02 (circles) and DS86 (triangles) with locally weighted regressions. The right panel displays the DS02 dose response for a low dose range together with linear fits based on dose ranges of 0–1 Sv and 0–2 Sv and the linear–quadratic fit based on the 0–2 Sv range. These curves fit the data about equally well
UNSCEAR REPORT-PART 1.qxp 10/7/08 2:57 pm Page 45
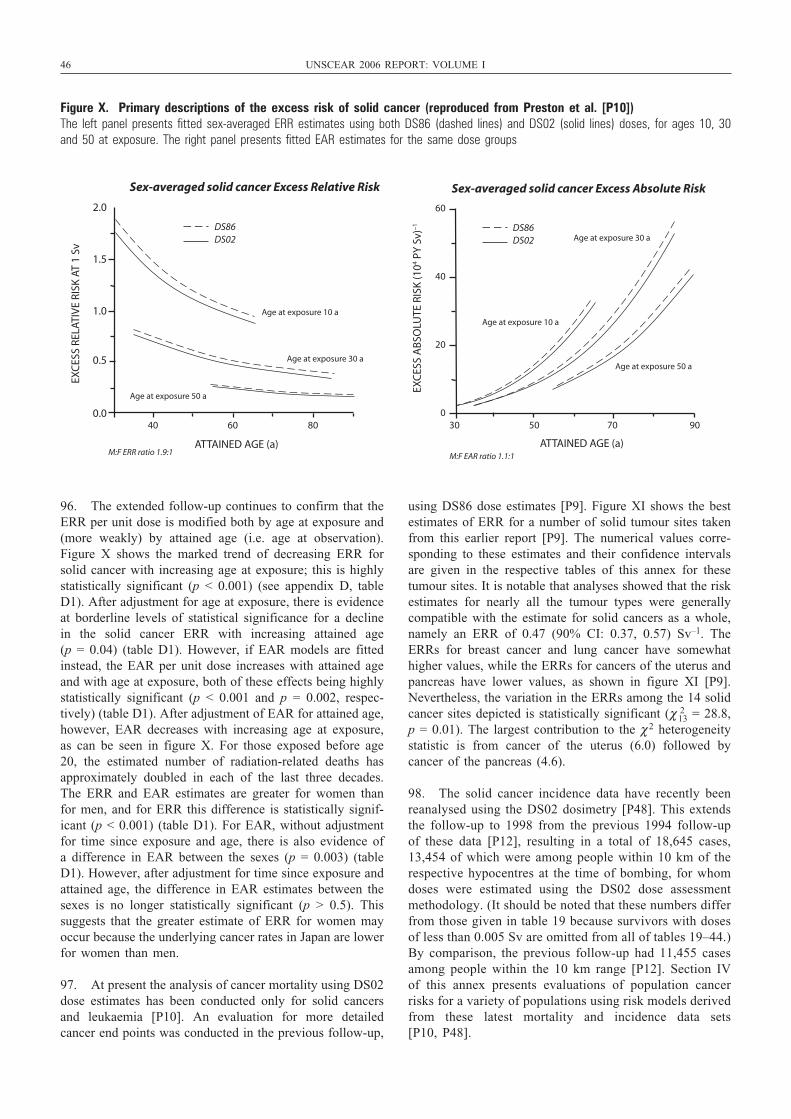
46 UNSCEAR 2006 REPORT: VOLUME I
96. The extended follow-up continues to confirm that theERR per unit dose is modified both by age at exposure and(more weakly) by attained age (i.e. age at observation).Figure X shows the marked trend of decreasing ERR forsolid cancer with increasing age at exposure; this is highlystatistically significant (p < 0.001) (see appendix D, tableD1). After adjustment for age at exposure, there is evidenceat borderline levels of statistical significance for a declinein the solid cancer ERR with increasing attained age (p = 0.04) (table D1). However, if EAR models are fittedinstead, the EAR per unit dose increases with attained ageand with age at exposure, both of these effects being highlystatistically significant (p < 0.001 and p = 0.002, respec-tively) (table D1). After adjustment of EAR for attained age,however, EAR decreases with increasing age at exposure,as can be seen in figure X. For those exposed before age20, the estimated number of radiation-related deaths hasapproximately doubled in each of the last three decades.The ERR and EAR estimates are greater for women thanfor men, and for ERR this difference is statistically signif-icant (p < 0.001) (table D1). For EAR, without adjustmentfor time since exposure and age, there is also evidence ofa difference in EAR between the sexes (p = 0.003) (tableD1). However, after adjustment for time since exposure andattained age, the difference in EAR estimates between thesexes is no longer statistically significant (p > 0.5). Thissuggests that the greater estimate of ERR for women mayoccur because the underlying cancer rates in Japan are lowerfor women than men.
97. At present the analysis of cancer mortality using DS02dose estimates has been conducted only for solid cancersand leukaemia [P10]. An evaluation for more detailedcancer end points was conducted in the previous follow-up,
using DS86 dose estimates [P9]. Figure XI shows the bestestimates of ERR for a number of solid tumour sites takenfrom this earlier report [P9]. The numerical values corre-sponding to these estimates and their confidence intervalsare given in the respective tables of this annex for thesetumour sites. It is notable that analyses showed that the riskestimates for nearly all the tumour types were generallycompatible with the estimate for solid cancers as a whole,namely an ERR of 0.47 (90% CI: 0.37, 0.57) Sv–1. TheERRs for breast cancer and lung cancer have somewhathigher values, while the ERRs for cancers of the uterus andpancreas have lower values, as shown in figure XI [P9].Nevertheless, the variation in the ERRs among the 14 solidcancer sites depicted is statistically significant (χ 2
13 = 28.8,p = 0.01). The largest contribution to the χ 2 heterogeneitystatistic is from cancer of the uterus (6.0) followed bycancer of the pancreas (4.6).
98. The solid cancer incidence data have recently beenreanalysed using the DS02 dosimetry [P48]. This extendsthe follow-up to 1998 from the previous 1994 follow-upof these data [P12], resulting in a total of 18,645 cases,13,454 of which were among people within 10 km of therespective hypocentres at the time of bombing, for whomdoses were estimated using the DS02 dose assessmentmethodology. (It should be noted that these numbers differfrom those given in table 19 because survivors with dosesof less than 0.005 Sv are omitted from all of tables 19–44.)By comparison, the previous follow-up had 11,455 casesamong people within the 10 km range [P12]. Section IVof this annex presents evaluations of population cancerrisks for a variety of populations using risk models derivedfrom these latest mortality and incidence data sets [P10, P48].
2.0
1.5
1.0
0.5
0.0 30 50 70 90
ATTAINED AGE (a)
EXC
ESS
RELA
TIV
E RI
SK A
T 1
Sv
EXC
ESS
AB
SOLU
TE R
ISK
(104 P
Y S
v)–1
60
40
20
0 40 60 80
ATTAINED AGE (a)
Sex-averaged solid cancer Excess Relative Risk Sex-averaged solid cancer Excess Absolute Risk
Age at exposure 10 a
Age at exposure 30 a
Age at exposure 50 a
M:F ERR ratio 1.9:1
DS86DS02
Age at exposure 10 a
Age at exposure 30 a
Age at exposure 50 a
M:F EAR ratio 1.1:1
DS86DS02
Figure X. Primary descriptions of the excess risk of solid cancer (reproduced from Preston et al. [P10]) The left panel presents fitted sex-averaged ERR estimates using both DS86 (dashed lines) and DS02 (solid lines) doses, for ages 10, 30and 50 at exposure. The right panel presents fitted EAR estimates for the same dose groups
UNSCEAR REPORT-PART 1.qxp 10/7/08 2:57 pm Page 46
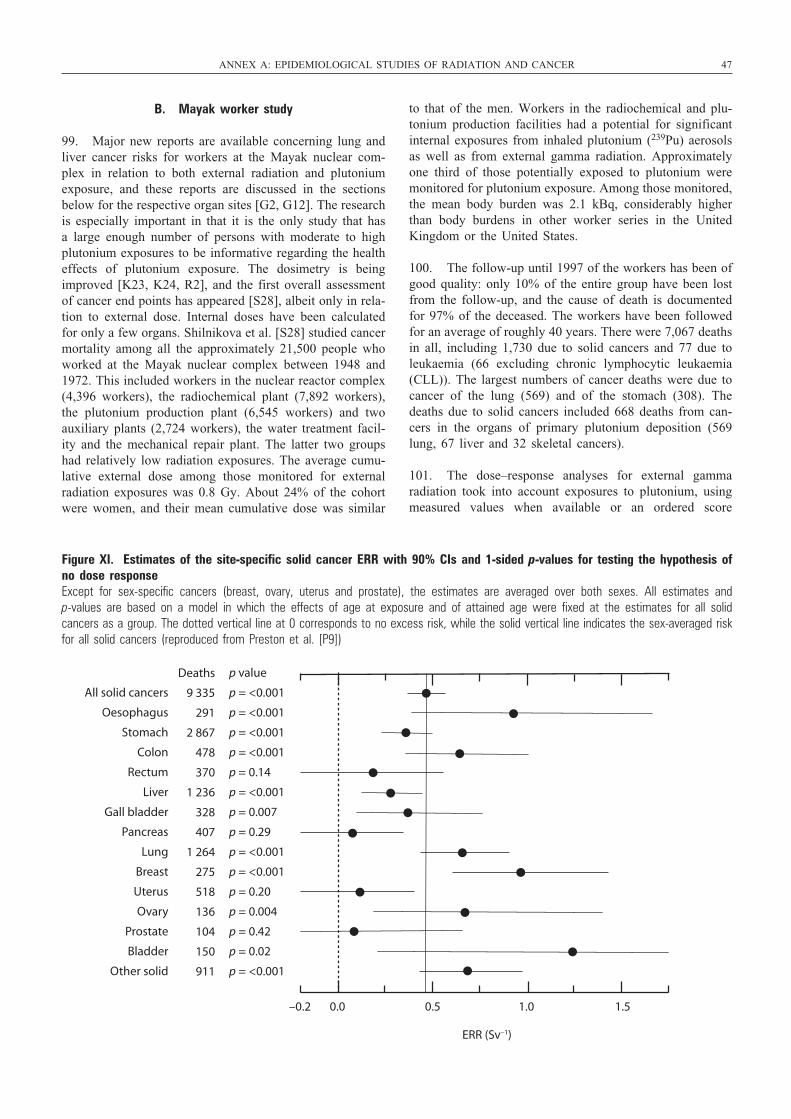
B. Mayak worker study
99. Major new reports are available concerning lung andliver cancer risks for workers at the Mayak nuclear com-plex in relation to both external radiation and plutoniumexposure, and these reports are discussed in the sectionsbelow for the respective organ sites [G2, G12]. The researchis especially important in that it is the only study that hasa large enough number of persons with moderate to highplutonium exposures to be informative regarding the healtheffects of plutonium exposure. The dosimetry is beingimproved [K23, K24, R2], and the first overall assessmentof cancer end points has appeared [S28], albeit only in rela-tion to external dose. Internal doses have been calculatedfor only a few organs. Shilnikova et al. [S28] studied cancermortality among all the approximately 21,500 people whoworked at the Mayak nuclear complex between 1948 and1972. This included workers in the nuclear reactor complex(4,396 workers), the radiochemical plant (7,892 workers),the plutonium production plant (6,545 workers) and twoauxiliary plants (2,724 workers), the water treatment facil-ity and the mechanical repair plant. The latter two groupshad relatively low radiation exposures. The average cumu-lative external dose among those monitored for externalradiation exposures was 0.8 Gy. About 24% of the cohortwere women, and their mean cumulative dose was similar
to that of the men. Workers in the radiochemical and plu-tonium production facilities had a potential for significantinternal exposures from inhaled plutonium (239Pu) aerosolsas well as from external gamma radiation. Approximatelyone third of those potentially exposed to plutonium weremonitored for plutonium exposure. Among those monitored,the mean body burden was 2.1 kBq, considerably higherthan body burdens in other worker series in the UnitedKingdom or the United States.
100. The follow-up until 1997 of the workers has been ofgood quality: only 10% of the entire group have been lostfrom the follow-up, and the cause of death is documentedfor 97% of the deceased. The workers have been followedfor an average of roughly 40 years. There were 7,067 deathsin all, including 1,730 due to solid cancers and 77 due toleukaemia (66 excluding chronic lymphocytic leukaemia(CLL)). The largest numbers of cancer deaths were due tocancer of the lung (569) and of the stomach (308). Thedeaths due to solid cancers included 668 deaths from can-cers in the organs of primary plutonium deposition (569lung, 67 liver and 32 skeletal cancers).
101. The dose–response analyses for external gammaradiation took into account exposures to plutonium, usingmeasured values when available or an ordered score
ANNEX A: EPIDEMIOLOGICAL STUDIES OF RADIATION AND CANCER 47
–0.2 0.0 0.5 1.0 1.5
ERR (Sv–1)
All solid cancers
Oesophagus
Stomach
Colon
Rectum
Liver
Gall bladder
Pancreas
Lung
Breast
Uterus
Ovary
Prostate
Bladder
Other solid
Deaths
9 335
291
2 867
478
370
1 236
328
407
1 264
275
518
136
104
150
911
p value
p = <0.001
p = <0.001
p = <0.001
p = <0.001
p = 0.14
p = <0.001
p = 0.007
p = 0.29
p = <0.001
p = <0.001
p = 0.20
p = 0.004
p = 0.42
p = 0.02
p = <0.001
Figure XI. Estimates of the site-specific solid cancer ERR with 90% CIs and 1-sided p-values for testing the hypothesis ofno dose responseExcept for sex-specific cancers (breast, ovary, uterus and prostate), the estimates are averaged over both sexes. All estimates and p-values are based on a model in which the effects of age at exposure and of attained age were fixed at the estimates for all solid cancers as a group. The dotted vertical line at 0 corresponds to no excess risk, while the solid vertical line indicates the sex-averaged riskfor all solid cancers (reproduced from Preston et al. [P9])
UNSCEAR REPORT-PART 1.qxp 10/7/08 2:57 pm Page 47
48 UNSCEAR 2006 REPORT: VOLUME I
judging the potential for plutonium exposure when meas-urements were not available. For total solid cancers, theERR estimate for external exposure (adjusted for plutoniumexposure) was 0.15 (90% CI: 0.09, 0.20) Gy–1. However, itshowed a downturn at higher doses (concave upward curve).The addition of a quadratic component to the fit producedan estimate for the linear component of the ERR of 0.30(90% CI: 0.18, 0.43) Gy–1, twice the simple linear estimateof 0.15 (90% CI: 0.09, 0.20) Gy–1 [S28].
102. Even after adjusting for plutonium exposure, theexternal gamma risk estimate for lung, liver and skeletalcancers combined was greater than that for other cancers.This may be because plutonium deposition could only par-tially be adjusted for by using the surrogate exposure meas-ure. The linear ERR estimates were 0.30 (90% CI: 0.18,0.46) Gy–1 for lung, liver and skeletal cancers, and 0.08(90% CI: 0.03, 0.14) Gy–1 for other solid cancers. For bothgroups of cancers, there were suggestions of concaveupward curvature, such that the linear terms in linear–quad-ratic models of dose response were approximately twicethose from the simple linear models [S28]. An evaluationof effect modifiers on radiation risk showed no differenceby age or by time since exposure, but did show a signifi-cant decline in risk with older age at hire. The limited dataavailable suggested that smoking was not a major con-founding factor for the radiation effect in this study.
103. There was an approximately 40% excess mortalityfor leukaemia excluding CLL. The estimated ERR was 0.99(90% CI: 0.45, 2.12) Gy–1. There was a suggestion of con-cave upward curvature, but it was not statistically signifi-cant (p = 0.1). There was a strong temporal effect, such thatthe risk from doses received in the most recent 3–5 yearswas observed to be more than 10 times that from dosesreceived more than 5 years earlier.
104. The risk estimates are somewhat lower than thosefrom the LSS cohort, but the authors cautioned that anycomparison should be regarded as tentative in view of thedosimetric uncertainties for the Mayak cohort. Lung dosesdue to plutonium are extremely high for this cohort, so highthat in some cases fibroses developed. It appears that sub-jects receiving higher doses were more often autopsied thanthose receiving lower doses; therefore this group may havehad better ascertainment of causes of death. Given thesefactors, it is difficult at present to compare the results ofthis study with others.
C. Techa River study
105. The dosimetry and epidemiological procedures arebeing improved for the study of persons exposed to efflu-ents of the Techa River in the Russian Federation [D8, D22,K5, K6]. Internal doses have been estimated from autopsysamples collected from 1951 onwards (i.e. from very closeto the time of maximum exposure in the early 1950s), from
in vivo beta measurements in teeth from 1959 onwards, andfrom a large number of whole-body-counter (WBC) meas-urements of 90Sr based on bremsstrahlung from the decayof 90Y [D22]. About half the original Techa River cohorthas such individual measurements [D22]. Internal doses forthis cohort were estimated by scaling 90Sr intakes for a ref-erence village (Muslyumova) by the average WBC-estimated 90Sr skeletal body burdens in other settlements,and similarly for other shorter-lived radionuclides, givingwhat are fundamentally age-specific village-level internaldose estimates. External doses were computed on the basisof measurements made near the shoreline and in individualvillages, and on the basis of estimates of radionuclide trans-port from the site of release [D22]. Estimates of annual vil-lage-level mean doses were computed on the basis of detailson the distribution of distances of houses from the shore-line within each village. Dose estimates for cohort mem-bers were individualized by taking into account factors suchas their residence history, length of follow-up and age. Anupdated dosimetry system, TRDS-2000 [D22], was devel-oped several years ago. Internal doses from 90Sr, whichaccounts for most of the red bone marrow dose received bythis cohort, do not change markedly using the TRDS-2000dosimetry system [D22, K6]. There is much more changein the external dose estimates, which are generally lowerusing TRDS-2000 [D22]. While some questions have beenraised about the external dose component of TRDS-2000[J5, M22], dose estimates have been validated on a villagelevel using physical measurements on bricks [J5]. A recentreview of the system [B66] suggested that the basic method-ology was sound, although the reviewers indicated that thevalues of risk estimates using the system should be con-sidered preliminary.
106. The first reports on health effects using TRDS-2000have appeared [K49, K50, O2], and the preliminary riskestimates provide evidence of increased solid cancer andleukaemia risks following protracted low-dose exposures.There are, however, likely to be changes to the risk esti-mates from this cohort associated with the fact that, as indi-cated above, the dose estimates are based on individualizedvillage-level mean radionuclide intake and external expo-sure estimates. While genuine individual doses are clearlypreferred, using the individualized dose estimates probablyresults in Berkson errors. In general, Berkson errors resultin little, if any, bias in the dose–response estimates, butrather lead to a reduction in the statistical power to detectan effect if it exists.
107. The patterns of variation of risk for solid cancer inthis cohort are unusual, with indications that ERR increasesboth with age at first exposure (2-sided p = 0.08) and withattained age (2-sided p = 0.03) [K50]. These patterns arenot observed for leukaemia, although there is a suggestionof an increase in ERR with increasing age at first exposure(2-sided p = 0.10). Such patterns are the reverse of what isobserved in the cancer mortality data for the survivors of the atomic bombings [P9, P10] and in many other radiation-exposed groups [U2]. The efforts currently under
UNSCEAR REPORT-PART 1.qxp 10/7/08 2:57 pm Page 48
way to provide increasingly individualized dose estimatesand to improve mortality and morbidity ascertainmentshould make this cohort more informative regarding cancerrisks at low dose rates.
108. A nested case-control study of leukaemia risk hasbeen performed using incidence data for this cohort, basedon the older TRDS96 dosimetry system [O13]. There are asomewhat larger number of cases (83) than from the recentmortality data [K50] (49 non-CLL, 12 CLL), although only50 of these cases are of known cell type, and 20 of these50 cases are CLL. The results confirmed an increase in riskwith red bone marrow dose, for both internal and externalexposure. No increase in risk was observed with age at thetime of maximum releases.
D. Semipalatinsk weapons test site fallout
109. To date there have been a number of publicationsabout dosimetry [G4, S10] and health follow-up [G7, S9]in populations in Altai (Russian Federation) and Kazakhstanexposed to radioactive fallout from the nuclear weaponstests at Semipalatinsk, although only the recent report ofBauer et al. [B58] assesses health effects in relation toreceived dose. The cohort consists of inhabitants of 10exposed villages near the Semipalatinsk test site (STS) andof six comparison villages some hundreds of kilometres dis-tant from the STS. For both exposed and comparisongroups, persons had to have been born before 1961 and tohave been permanently resident in one of the villages. Dosereconstruction for the exposed subcohort is based on his-torical data for levels of radionuclides in food and the envi-ronment and on semi-empirical models for radionuclideaccumulation and metabolism. Doses due to radionuclideingestion and inhalation were estimated for the thyroid (dueto 131I), the whole body (due to 137Cs) and bone marrow(due to 90Sr). Most internal dose was due to 131I. For thecomparison group, settlement-specific dose estimates couldnot be obtained, so a per caput cumulative dose of 20 mSvdue to fallout was assigned to all persons. Even within theexposed group the doses were estimated for subgroupsaccording to their age at main exposure and settlement, sothat, as constituted at present, the study is fundamentally an“ecological” one. The possibilities of bias in such studiesare well known [G13, P15]. The extent of variation of dosewithin each settlement is not clear, although there is certainly substantial variation (by at least three orders ofmagnitude) of, for example, thyroid dose over time [G4].Hence substantial “ecological bias” cannot be discounted.
110. Bauer et al. present two sets of analyses: those inter-nal to the 10 exposed villages, and those for both exposedand comparison villages [B58]. Results are similar for bothsets, although excess risks tend to be higher if the full cohortis used rather than only the exposed group. Because of deficiencies in the dosimetry for the comparison group, the Committee has concentrated on results internal to
the exposed group. Bauer et al. observed elevated risks thatwere statistically significant for all solid cancers (ERR = 0.81 (95% CI: 0.46, 1.33) Sv–1), stomach cancer(ERR = 0.95 (95% CI: 0.17, 3.49) Sv–1) and lung cancer(ERR = 1.76 (95% CI: 0.48, 8.83) Sv–1) [B58]. The ERRwas statistically significantly increased with increasing ageat exposure (p < 0.0001). Such patterns are the reverse ofwhat is observed in the cancer mortality data of the sur-vivors of the atomic bombings [P9, P10] and of many otherradiation-exposed groups [U2]. Taken together with thegenerally higher ERR for solid cancers in this cohort com-pared with that observed in the atomic bombing survivordata, again the reverse of what might be expected follow-ing protracted exposure, this suggests that “ecological bias”may be operating preferentially in groups with older agesat exposure.
E. International worker study
111. Following an earlier pooled analysis of data on radi-ation workers at selected sites in three countries [C3, I2],a larger international collaborative study has been con-ducted based on workforces from 15 countries working inany of 154 nuclear facilities, numbering 407,391 workersmonitored for external photon (X and gamma) radiationwith personal dosimeters [C41]. This study, which includedmost of the cohorts included in the earlier three-countrystudy [C3, I2], has attracted considerable attention, includ-ing a substantial editorial by Wakeford [W37]. The studyexcluded 190,677 workers because they had not beenemployed in one or more of the facilities for at least oneyear, or because they had not been monitored for externalexposure, or because they had potential for substantial expo-sure from internal emitters or neutrons (amounting to morethan 10% of the effective dose). The study followed mortality in the cohort, and accumulated 5.2 million person-years of follow-up. The average individual effective dosewas 19.4 mSv, with 90% of the workers receiving cumu-lative doses of less than 50 mSv and with fewer than 0.1%of the workers receiving doses of more than 500 mSv. Therewere 6,519 deaths from cancer excluding leukaemia, and196 from leukaemia excluding CLL.
112. Cardis et al. estimate the ERR for cancers excludingleukaemia to be 0.97 (95% CI: 0.14, 1.97) Sv–1, for all solidcancers to be 0.87 (95% CI: 0.03, 1.88) Sv–1 and forleukaemia excluding CLL to be 1.93 (95% CI: <0, 8.47)Sv–1 [C41]. As noted in table 13, while the difference fromthe LSS risks in a comparable group (male, age at expo-sure 20–60 years) is not statistically significant, there areindications that the solid cancer risks observed are 4 timeshigher than those in the LSS. As pointed out by Wakeford[W37], since the worker risks relate to exposure at low doserates, a DDREF of 2 might be indicated [I11] (see sectionI.J above), so that the true discrepancy with LSS solidcancer risks may be about a factor of 8, but with very wideconfidence limits. The ERR for solid cancer is strongly
ANNEX A: EPIDEMIOLOGICAL STUDIES OF RADIATION AND CANCER 49
UNSCEAR REPORT-PART 1.qxp 10/7/08 2:57 pm Page 49
50 UNSCEAR 2006 REPORT: VOLUME I
influenced by that for lung cancer, 1.86 (95% CI: 0.26, 4.01)Sv–1. The ERR for cancers excluding leukaemia, lung andpleural cancers is 0.59 (95% CI: –0.29, 1.70) Sv–1 [C41].However, smoking-related cancers other than lung cancerexhibit an ERR of 0.21 (95% CI: <0, 2.01) Sv–1. Set againstthis, the ERR for non-malignant respiratory disease is 1.16(95% CI: –0.53, 3.84) Sv–1 and that associated with chronicobstructive bronchitis and emphysema is 2.12 (95% CI: –0.57, 7.46) Sv–1, both of these groupings of diseases thatare related to smoking. As Cardis et al. indicate, “Takentogether, these findings indicate that a confounding effectby smoking may be partly, but not entirely, responsible forthe estimated increased risk for mortality from all cancersother than leukaemia” [C41]. Therefore caution is suggestedin interpreting the study results.
113. As noted by Wakeford [W37], the Canadian datahave “a surprisingly large influence on the ERR for all can-cers other than leukaemia”. Indeed, although the Canadiandata contribute 400 deaths from cancers other thanleukaemia (6% of the total deaths from this cause), andnotwithstanding the fact that the Canadian workers have anaverage individual effective dose (19.5 mSv) that is virtu-ally the same as the full cohort (19.4 mSv), removing theCanadian cohort results from the estimation of solid cancerERR produces a value of 0.58 (95% CI: –0.22, 1.55) Sv–1,i.e. a reduction of 40% from the overall central estimatevalue. This estimate is still larger than the correspondingestimate from the LSS data, although it is no longer statis-tically significant [C41]. The fact that this study has sucha large influence on the results, given the small size (interms of relative numbers of deaths, person-years of follow-up, person-dose (that is to say, the sum of the cumulativedose per person over the cohort)) of the Canadian cohort,appears to reflect the low precision in the findings from theother cohorts. Figure 2 in the paper [C41] shows that theCanadian cohort has a solid cancer ERR of >6 Sv–1 with alower 97.5% centile confidence limit of >2 Sv–1. A previ-ously published study of Canadian nuclear workers [Z6]gave a lower risk estimate for solid cancers (ERR = 2.80(95% CI: –0.038, 7.13) Sv–1), of only borderline statisticalsignificance (p = 0.054). Detailed analyses have been con-ducted aimed at understanding the apparent differences inrisk estimates for the Canadian nuclear worker cohortbetween Zablotska et al. [Z6] and the 15-country study[C41]. These analyses show that the difference is related tothe exclusion of Ontario Hydro workers from analyses ofsolid cancers in the latter study, owing to the lack of infor-mation on socio-economic status (SES) for this group ofworkers. Several studies of radiation workers (e.g. [C3,M12]) have shown that both solid cancer risk and occupa-tional radiation dose are related to SES, and hence SES isa confounding factor. All other differences between refer-ences [Z6] and [C41] in analytical approaches, dosimetricquantities and definition of study populations had very littleimpact on the results [E12]. In the Canadian National DoseRegistry, which includes a large number of other personnel(e.g. medical and dental radiographers) not included in the15-country study, the ERR for cancers other than leukaemia
among males was also large, 2.5 (90% CI: 1.1, 4.2) Sv–1
[S8], as was that for mortality from all cancers amongmales, 3.0 (90% CI: 1.1, 4.9) Sv–1 [A8]. However, whereasmany non-cancer causes of death (including infectious andparasitic diseases, and accidents) were correlated with dosein analyses of the Canadian National Dose Registry, sug-gesting the possibility of bias in vital status ascertainment,this was not the case for the Canadian component of the15-country nuclear worker study [E12]. The ERR forCanadian workers in the latter study appears to be unusu-ally high and the lower confidence bound does not includethe combined estimate. Reviews of historical dose recordshave raised possible concerns about the completeness ofrecords in one Canadian facility (Atomic Energy of CanadaLimited) that may have biased the Canadian ERR. This iscurrently being evaluated. It should be stressed that thereare substantial uncertainties in the risk estimates derivedfrom the 15-country study. Consequently, not too muchshould be made of the apparent discrepancies with risksobserved in other studies, such as the LSS.
F. United States medical radiologic technologists
114. The cohort of 146,022 United States “radiologictechnologists”, of whom 106,884 (73.2%) are female, wasdrawn from those certified by the American Registry ofRadiologic Technologists (ARRT) during 1926–1982 [M10,M31, S29]. The vital status at the end of 1997 of 99.3% ofthe technologists was established and includes 12,624deaths [M31]. A study of cancer incidence based on indi-viduals who responded to two questionnaire surveys in theperiods 1983–1989 and 1995–1998 (or who died betweenthe first and second surveys) identified 2,651 cancer cases[S29] among the respondent subcohort of 90,305 persons.Individual dose reconstructions are being conducted but arenot yet available, so year of entry to the ARRT is used asa crude surrogate for dose, since exposure levels were con-siderably higher in earlier years. About 1.6% of the cohortwas first certified before 1940, 3.9% in 1940–1949, 13.1%in 1950–1959, 28.1% in 1960–1969, 48.3% in 1970–1979and 5.1% in 1980 or later [M31]. About half had workedas radiologic technologists for 10 or more years [M31, S29].As with most working populations, the rates of death fromall cancers were lower than expected in the general popu-lation, for both sexes [D3, M31]. No specific cancer typeshowed an overall excess risk.
115. Mortality from all cancers combined, and separatelyfrom breast cancer, lung cancer and leukaemia excludingCLL, was examined in more detail among those who hadcompleted the initial questionnaire survey, which permittedcontrol for other disease risk factors [M31]. The resultsshowed that the cumulative number of years of work as aradiologic technologist was not associated with the risk ofany of these cancer categories, nor was there any associa-tion between year of first certification as a radiologic technologist and lung cancer or leukaemia excluding CLL
UNSCEAR REPORT-PART 1.qxp 10/7/08 2:57 pm Page 50
[M31]. Mortality risks of all cancers combined showed amodest but statistically significant increase (2-sided p =0.04) with earliest calendar year first employed, as also didbreast cancer mortality (2-sided p = 0.002). In addition, thenumber of years worked before 1950, when exposures werelikely to have been higher, was positively associated withboth breast cancer risk (2-sided p = 0.018) and risk ofleukaemia excluding CLL (2-sided p = 0.05) [M31].
116. There are substantial methodological concerns withthese related data sets. The year of first entry into the pro-fession (entry to the ARRT) is largely confounded by yearof birth. Substantial birth cohort effects would be expected,for example effects associated with changes in reproductivepatterns over this period, although some of these lifestylefactors (age at first childbirth, age at menopause, family his-tory of breast cancer) were adjusted for in the breast cancermortality study [M10]. There being as yet no radiation doseestimates for this cohort, the putative radiation effect isimplicitly derived from comparisons of persons entering theARRT prior to 1940 with those entering later, and so maybe difficult to separate out from the effect of year of birth.In addition, because there are relatively few persons in theolder age groups among those entering the profession later(for example after 1960), there will be little overlap in theseolder age groups with those entering before 1940, so thatage-specific adjustment (for example by comparison ofcancer rates at similar ages in the post-1960 versus pre-1940birth cohorts) is not possible. Cancer incidence rates wereestimated from a combination of death certificates, ques-tionnaire responses and medical records from physicians andhospitals [S29]. These were compared with Surveillance,Epidemiology and End Results (SEER) population-basedincidence rates. As these incidence rates were calculated forvarious metropolitan regions that may not reflect the geo-graphical distribution of the ARRT cohort, but in any casehave much more uniform (and higher quality) ascertainmentof cases, it is possible that biases would be introduced inthe calculation of standardized incidence rates (SIRs).
G. Chinese radiologists and technologists
117. Wang et al. [W3] have updated their study of cancerincidence among medical X-ray workers in China to includethe years 1950–1995. An important aspect of the new updateis that group doses are now available, which should permitrisk estimates to be calculated, although these have yet tobe taken into account in the analyses of cancer risk [W3].The study group consisted of 27,011 medical diagnosticworkers, including both radiologists and technicians,employed between 1950 and 1980 in 24 provinces of China.A control group consisted of 25,782 workers from othermedical specialties who did not use X-ray equipment intheir work. Eighty per cent of X-ray workers and 69% ofcontrols were males. Seventy per cent of the diagnosed cancers had histological confirmation; most of the otherdiagnoses were made by X-ray examination.
118. Since there was no systematic individual dose mon-itoring before 1985, a retrospective dose reconstruction wasperformed [Z1] by measuring exposures to a dose phantomat 608 X-ray machines and 1,632 workplaces with simu-lated historical working conditions. In addition, 3,805 X-ray workers were randomly chosen to be interviewedconcerning details of their occupational exposure histories.To assess the validity of their dose reconstruction, stablechromosome analysis was performed for 96 workers usingG banding and fluorescence in situ hybridization (FISH)techniques [W4]. A correlation between the biodosimetryand physical dose estimates was found, although the physical dose estimates were consistently about 50% higher.The estimated mean cumulative doses for those who beganpractising radiology prior to 1960, in 1960–1969 and in1970–1980 were 758, 279 and 83 mGy, respectively.
119. An excess of total cancers (RR = 1.19; 95% CI: 1.1,1.3, n = 836) was found. There was also a significant excessof leukaemia among X-ray workers, with 44 cases versus25 in the control group (RR = 2.17; approximate 95% CI:1.6, 2.9) [W3]. The RR for leukaemia was greatest amongthose employed as X-ray workers before age 20 anddeclined progressively for those first employed at olderages. The RR for leukaemia was greater (RR = 2.4) forthose employed before 1970 than for those first employedin 1970–1980 (RR = 1.7). The excess leukaemia incidencerate in the irradiated group was not attributable to a deficitin the control group, as the leukaemia rate in the controlgroup was at least as high as in the general population.
120. Significant excess risks were also reported for femalebreast cancer (RR = 1.34, n = 46), non-melanoma skincancer (RR = 4.05, n = 18), oesophageal cancer (RR = 2.65,n = 39), liver cancer (RR = 1.20, n = 155), lung cancer(RR = 1.20, n = 151) and bladder cancer (RR = 1.84, n =21). Age at exposure appeared to be an effect modifier forthyroid and lung cancer, as those first employed at theyoungest ages had nominally higher RRs. The RRs for totalsolid cancers and for cancers of the liver, skin, bladder andthyroid were somewhat higher in the earlier cohort (firstemployed before 1970) of X-ray workers. However, can-cers of the stomach were very much higher in the youngercohort (first employed in 1970–1980). The reported statis-tical significance of the results in this study, however,should be treated cautiously, as it appears that calculationswere performed without taking into account the variancecontributed by the control group. The inconsistent trends inrisk in the later compared with the earlier groups implysome problems with this study, perhaps in relation to thecomparison group.
H. Studies of aircrew
121. Because aircrew receive elevated doses, which canrange up to 6 mSv per year, with a substantial neutron com-ponent (representing 25–50% of the absorbed dose) [B22,
ANNEX A: EPIDEMIOLOGICAL STUDIES OF RADIATION AND CANCER 51
UNSCEAR REPORT-PART 1.qxp 10/7/08 2:57 pm Page 51
52 UNSCEAR 2006 REPORT: VOLUME I
G15], there has been much interest in studies of this group.To date there have been various, generally small, studies ofaircrew, whether pilots or flight attendants. The largest stud-ies to date are three large pan-European studies, the first offlight attendants [Z4], the second and third of male cockpitcrew [B23, L48]. The two studies of male cockpit crew differprincipally in that the first [B23] used length of employmentas a relatively crude analogue for exposure, whereas thesecond [L48] used total flying time and radiation dose,although these measures were only available for a subset ofthe full cohort (excluding cohorts from Greece and the UnitedKingdom for which insufficient information was available).Radiation dose was estimated on the basis of “block hours”,a measure of time spent on the aircraft (including time onthe runway), the type of aircraft a pilot was licensed to flyin a particular year, and a job–exposure matrix based on typ-ical routes of each national airline for each type of aircraftin a specific year and at typical flight altitudes [L48]. Thefirst study, of flight attendants, found a statistically non-significant increase in mortality from melanoma (standardizedmortality ratio (SMR) = 1.93; 95% CI: 0.70, 4.44) amongmale crew, but no suggestion of increased risk among femalestaff (SMR = 0.36; 95% CI: 0.04, 1.37) [Z4]. The secondstudy, of male cockpit crew, found a statistically significantincrease in mortality from melanoma (SMR = 1.78; 95% CI:1.15, 2.67) [B23]. No consistent association between employ-ment period or duration and cancer mortality was observed,whether for melanoma or any other end point, in either study[B23, Z4]. In the third study, none of the SMRs were sig-nificantly elevated, nor were there any trends of mortalitywith dose for any cancer site [L48]. If anything, there wereindications of a negative trend in the risk of all cancers com-bined with increasing radiation dose (p = 0.101), so that, forexample, the RR associated with doses of greater than 25mSv was 0.74 (95% CI: 0.51, 1.06) [L48]. In some of thestudies of groups nested within this cohort, the dosimetrybased on hours spent in certain types of flight (i.e. low-altitude, intermediate-distance, long-distance) has been evaluated [P21]. There is in general no assessment of solarexposure or constitutional factors, a serious problem in eval-uating skin cancer risk. The aircrew studies have recentlybeen reviewed, and evidence has been found of consistentexcess risk of melanoma, non-melanoma skin cancer andbreast cancer [S35]. However, as with the three large studies discussed above, there is generally no relation withduration of employment. In the absence of individual infor-mation on radiation dose and solar exposure in most of thestudies, as well as reproductive histories, it would be diffi-cult to ascribe the excess risks observed in these studies toionizing radiation exposure [S35].
I. Patients treated with radiation
122. Patients treated with radiation are providing oppor-tunities to learn about the mechanisms of carcinogenesis aswell as providing opportunities to estimate risks of asecond cancer following both high and low doses [A37,
B67, C51, I34, T49, T50, V6]. Radiation doses to specificorgans can be estimated with precision, scatter doses toorgans outside the treatment beams are low, the numbersof exposed patients are large, and the relatively high sur-vival rates of children and young adults provide opportu-nities to study the patterns of risk expression over longperiods of time. Large-scale international studies ofpatients treated with radiation exhibit risk estimates thatare generally lower than those from the studies of the sur-vivors of the atomic bombings in Japan; these lower riskshave been attributed in large part to cell killing and fractionation effects [L20, L23].
123. A new study of cervical cancer patients showed anincreased rate of leukaemia, other than CLL, that occurswithin a few years after treatment [K57]. This study of over16,000 women treated with radiation in the United States andfollowed within the SEER cancer registration system alsofound no evidence that CLL was increased at any time afterexposure, similar to the absence of excess risk reported inprevious studies of leukaemia after cervical cancer [B5, K1].Also consistent with previous studies [B8, B11], radiother-apy for cervical cancer has contributed to the increased riskamong long-term survivors for subsequent primary cancersof the stomach, rectum, urinary bladder, and bone and joints.
124. Recent studies of patients receiving radiation treat-ment for Hodgkin’s disease (HD) continue to provide newinformation on risks for second cancers. The risks of breastcancer are elevated in a dose-dependent manner followingradiotherapy, and ovarian ablation associated with radio-therapy and chemotherapy substantially reduces the risk[T25, V8]. A family history of breast cancer does not appearto influence radiation risk [H59]. Estimates of cumulativeabsolute breast cancer risk have been developed to assistphysicians in counselling patients [T51]. Lung cancer inci-dence rates have also been found to be elevated in long-term survivors of HD, even after very high therapeutic doses,although estimates of excess risk per unit dose are muchlower than reported in lower-dose studies [T3]. Cigarettesmoking and high lung dose enhanced the risk of lung cancerin a near-multiplicative fashion [G23]. Leukaemia is also apotential consequence of treatments for HD, although therisk from chemotherapy was generally much greater thanthat associated with radiotherapy [S46, T7].
125. Children and young adults treated for cancer are sur-viving much longer than in years past; this allows time forincreasing numbers of late effects to be detected [G32,M58]. High-dose radiotherapy for childhood cancerincreases the risk of thyroid cancer, but a downturn in riskis observed above about 30 Gy, attributable in all likeli-hood to cell killing [S88], consistent with previous studies[T5]. Significant increases in the incidence rate of secondtumours that occur in the brain are associated with treat-ment for cancer, with children showing higher risks thanadults [I20, N14, N20, W35]. Treatment for childhood HDcan result in higher risks of breast cancer occurring in laterlife [G29, V8]. Treatment for retinoblastoma results in
UNSCEAR REPORT-PART 1.qxp 10/7/08 2:57 pm Page 52
increased rates of sarcoma and other malignancies, whichsuggests a possible interaction with an underlying geneticsusceptibility [K43, W11]. Long-term survivors of child-hood cancer are showing increased risks of second cancersthat are now persisting late into life; continued follow-upand study has been recommended to quantify risks andlearn about patterns of risk expression over long periodsof time [G30, M59, N21, S47].
J. Worker and public exposure to uranium
126. Many workers employed during the early years ofuranium processing, manufacturing and milling potentiallyinhaled or ingested relatively large amounts of uranium butwith minimal exposure to radon gas. Because of recent con-cern about the possible health effects of exposure to depleteduranium, studies of uranium workers (excluding under-ground miners) have been carefully evaluated in variousmeta-analyses [H60, I35, T32]. Fourteen epidemiologicalstudies were conducted of more than 120,000 workers at uranium processing, enrichment, metal fabrication andmilling facilities [T32]. These studies, overall, did not findthe rate of any cancer to be significantly increased. The totalrisk for all cancers taken together was close to that expected;that is, 7,442 cancers were observed compared with 8,178expected (SMR = 0.91) [T32]. There was reasonable con-sistency among the findings from the 14 epidemiologicalstudies of workers employed throughout the world [T32].Although there were weaknesses in these studies because oflimited dosimetry, the absence of time response analyses andthe inherent difficulties associated with accounting for thehealthy worker effect, the results were consistent with alarge-scale case-control study of 787 lung cancer casesamong workers at four uranium processing operations, whichfound no association with estimated lung dose [D43]. Arecent study of workers in the early days of nuclear energydevelopment incorporating comprehensive dosimetry forinternal emitters also revealed no statistical evidence forincreased cancer risks, although the numbers were not espe-cially large [B68, B69]. In contrast to the negative findingsfrom studies of uranium workers other than miners, studiesof underground uranium and other hard rock miners haverevealed consistent and substantial increases in lung cancerattributable to radon and its decay products [C36, L8].
127. The primary occupational exposures in uranium millswere to uranium, silica and vanadium. A recent study ofColorado Plateau millers was conducted by the National
Institute of Occupational Safety and Health (NIOSH) of1,484 men who worked at one of seven uranium mills onor after 1 January 1940 [P25]. Increased numbers of deathswere found for non-malignant respiratory diseases, lungcancer, lymphoma and kidney disease. The authors wereunable to show conclusively whether these deaths resultedfrom working in the mills, because increased risk was notassociated with length of employment.
128. The extraction of uranium from ore produces solidand liquid wastes, called tailings. The wastes contain theradionuclides present in the ore, including thorium, radiumand other decay products. Tailings ponds, runoff collectionponds, ore transport and mills (extraction facilities) presentthe potential environmental exposure pathways to humans[N22]. Concerns surrounding mill activities include possi-ble increased exposure to ionizing radiation from uraniumand its decay products, possible contamination of ground-water and vegetation, and possible increased levels ofindoor radon. Descriptive correlation studies, however, findno excess cancers among populations residing near uraniummilling, mining or processing facilities [B29, B30, B31,M60]. Studies of populations with increased levels of ura-nium and other radionuclides in drinking water also havenot found associations with any cancers or overt kidney dis-ease [A25, A26, K56, K58, K59].
129. There has been much controversy surrounding theuse of depleted uranium, especially on the battlefield. Thistopic has been comprehensively reviewed by the RoyalSociety [T32, T52] (see also [H60, I35]). The Royal Societyconcluded that doses from depleted uranium are unlikely tobe high, even in the most unfavourable (battlefield) condi-tions, so that lung cancer risks are unlikely to be more thandoubled [T32]. There is potential non-radiological risk associated with exposure to depleted uranium, in particularassociated with its nephrotoxicity, although there is little orno evidence of this in practice [T52].
130. There appear to be several possible reasons why ura-nium is not conclusively found to cause cancer in humansand why it is not considered a human carcinogen [I35]: uranium is not very radioactive (having such a long half-life of billions of years, 238U decays very slowly), and itschemical properties are often such that any inhaled oringested uranium is excreted rather quickly from the body[H60]. Some compounds of uranium are relatively insolu-ble and can be retained in the body. Nonetheless, there islittle or no epidemiological evidence for an associationbetween uranium and any cancer.
ANNEX A: EPIDEMIOLOGICAL STUDIES OF RADIATION AND CANCER 53
UNSCEAR REPORT-PART 1.qxp 10/7/08 2:57 pm Page 53

UNSCEAR REPORT-PART 1.qxp 10/7/08 2:57 pm Page 54
III. SITE-SPECIFIC CANCERS
131. Table 15 summarizes the principal features of cohortand case-control epidemiological studies of the carcinogeniceffects of exposure to low-LET radiation. Table 16 providesa similar summary of the studies for high-LET exposure.The sections below on specific cancer sites consider thesestudies in greater detail. table 17 summarizes the strengthsand weaknesses of cohort and case-control studies for low-LET exposure, and table 18 provides a similar summary ofthe strengths and weaknesses of studies for high-LET expo-sure. Most of these studies were considered in theUNSCEAR 2000 Report [U2].
132. As much as possible in tables 19–44, estimates ofcancer risk per unit dose (in Gy–1 or Sv–1) are those givenin the original publications, but for publications that did notcalculate risk estimates, the methods described in SectionI.C of Annex A of the UNSCEAR 1994 Report [U4] havebeen employed. In particular, if O denotes the observednumber of deaths or cancer cases in the exposed popula-tion, E denotes the corresponding expected number basedon age- and sex-specific rates in the reference population(typically the general population), D denotes the averagedose and PY denotes the number of person-years of follow-up, then the ERR at 1 Sv is estimated by (O – E)/(E · D),and the EAR per unit dose and per unit time at risk is esti-mated by (O – E)/(PY · D). Instances where this approachhas been implemented are indicated by a footnote in tables19–44. It should be noted that the results based on thismethodology might differ from those based on adose–response analysis if those data were available. A par-ticular problem with this approach occurs when exposedpopulations are explicitly or implicitly selected for goodhealth (e.g. working populations or higher-social-statusgroups, respectively) and the expected values are derivedfrom the general population. In such cases, the risk esti-mates will tend to be biased in a downward direction andtherefore the true risks may be masked. Risk estimation thatused the general population statistics to derive the expectedvalues is therefore indicated by a footnote.
133. Risk estimates have been made from the LSS mor-tality and incidence data in tables 19–44, wherever possi-ble using the latest DS02 dosimetry and follow-up (i.e.1950–2000 for the mortality data [P10] and 1958–1998 forthe solid cancer incidence data [P48]). For site-specific solidcancers, mortality risks were estimated using the previous(DS86) dosimetry and the 1950–1997 follow-up [P9]. Fora few cancers (e.g. non-Hodgkin’s lymphoma, Hodgkin’sdisease, multiple myeloma and leukaemia), older incidence[P4] and mortality [P1] data are employed. In calculating
summary ERR and EAR measures, the following simplelinear models were fitted to each data set in which theexpected disease rate (i.e. numbers of cases or deaths perperson-year of follow-up) in the stratum with age a, city cand sex s is given by:
(4)
when assessing ERR, and by:
(5)
when assessing EAR. In both cases, in general h0(a,c,s) hasthe form:
(6)
When fitting to the mortality and incidence data for boneand salivary cancers and for melanoma, because of the smallnumber of cases and deaths for these end points, slightlysimplified versions of the model for underlying rates,h0(a,c,s), were assumed, in which κ1 = κ2 = κ3 = κ6 = κ7= 0, i.e. in which h0(a,c,s) = exp[κ0 + κ4 ·1n[a] + κ5·1n[a]2].The same was done for thyroid cancer mortality data. Forbone cancer the models fitted were of purely quadratic form,so that the bone cancer rate for the ERR model (4) is, givenby h0(a,c,s) ·[1 + α ·D2] and for the EAR model (5) is givenby h0(a,c,s) + α ·D2. The tables also provide 90% profile-likelihood confidence intervals [M21] on the fitted ERR andEAR (the parameter α). It should be noted that in derivingthese simple summary measures (ERR and EAR), there isno implication that the corresponding models (4) and (5) fitthe various data sets well. As discussed in Section I.L, ingeneral the sex, age at exposure and time since exposuresubstantially modify both ERR and EAR for most of thedata presented.
134. In fitting to the latest mortality and incidence data[P10, P48], as also to the previous (pre-DS02) mortality data[P9], the doses used were adjusted truncated doses, calcu-lated using the methodology described by Pierce et al. [P2].In particular, the adjustment factors used in this processwere derived from the previous (DS86) dosimetry [P2].Prior to models being fitted to the latest incidence data[P48], as also to the previous (pre-DS02) mortality data[P9], the respective data sets were collapsed over stratadefined by age, sex, attained age, age at exposure and years
h0(a,c, s) = exp[κ 0 +κ1 ⋅ s +κ2 ⋅ c +κ 3 ⋅ s ⋅ c +κ 4 ⋅ln[a] +κ5 ⋅ ln[a]2 +κ 6 ⋅ s ⋅ ln[a] +κ 7 ⋅ s ⋅ ln[a]2 ]
h0 (a,c, s) +α ⋅ D
h0(a,c, s) ⋅[1 +α ⋅ D]
55
UNSCEAR REPORT-PART 1.qxp 10/7/08 2:57 pm Page 55
56 UNSCEAR 2006 REPORT: VOLUME I
of follow-up. In other words, person-years and cases ordeaths were summed over these strata, and doses in eachstratum were replaced by person-year weighted averagesover the stratum. To estimate the “expected” LSS cases ordeaths for these two data sets [P9, P48], in these tables theRR model (4) was fitted, and the sum
evaluated, corresponding to the cases predicted at zero dose.In all tables this sum, and also the sums of cases or deathsand person-years of follow-up, are over those survivors withrespective organ doses of greater than 0.005 Sv. Throughouttables 19–44, the LSS cohort is assigned to the category of“external low-LET exposures”. Of the dose received by sur-vivors, 1–2% is due to neutrons, most of the rest being dueto high-energy (mostly 2–5 MeV) gamma radiation [R12].Even after application of a neutron RBE of 10 (as is donein most of the analysis presented here), the dose in thiscohort results predominantly from external low–LET expo-sures. Similar simplifications are made for various otherstudies. It should be noted that, while the above procedureswere used to estimate risks for the LSS given in tables19–44, results given in the main text are in general basedon the published reports [P2, P9, P10, P48] wherever pos-sible. These may be slightly different. Many of the slightdifferences relate to the 0.005 Sv cut-off used in the tables,which because of the grouped nature of the publicly avail-able data file will result in groups that do not always cor-respond precisely to the set of survivors with this dose. Itshould also be noted that, for solid cancers (table 19), theTecha River cohort [K50] is assigned to the category of“external low-LET exposures”, since 75% of the stomachdose is thought to be from this source (with most of therest from 137Cs). For leukaemia (table 44), the Techa cohortit is assigned to the category of “internal low-LET expo-sures”, since 92% of the bone marrow dose is thought tobe from internal beta emitters [K50].
A. Total solid cancers
135. The solid cancer mortality experience of the LSS ofsurvivors of the atomic bombings up until the end of 2000has been reported [P10]. This represents an additional threeyears (1998–2000) of follow-up since the previous report[P9]. There are 10,127 deaths from solid cancer and 296deaths from leukaemia. If attention is restricted to survivorswho received a shielded kerma dose of less than 4 Gy, thereare 10,071 solid cancer deaths and 284 leukaemia deaths.Preston et al. [P10] estimate that about 479 (~5%) of the10,127 solid cancer deaths would be attributable to radia-tion exposure. Among survivors with (DS02 or DS86) colondoses of greater than 5 mSv, about 8% of solid cancerdeaths would be attributable to exposure, a figure very sim-ilar to that of the previous follow-up [P9]. In general,although risk estimates are somewhat lower than before, for both solid cancers and leukaemia the patterns of the
h0 (a,c, s)∑
distribution of excess risk by age and time are very simi-lar to those of the previous follow-up [P9]. A striking fea-ture of the solid cancer data is that, in a lower-dose (lessthan 2 Sv) group, there is statistically significant upwardcurvature [P10]. This is not an artefact of the new dosime-try: the same finding had been observed in the previousfollow-up of the LSS mortality data, using the DS86dosimetry [W20]. As noted in the previous report [P9], thesolid cancer radiation risks are highest among those exposedas children, and as before there is a steep decline in ERRwith increasing time after exposure in this group (figure X).
136. As noted in table 19, both the ERR and the EAR fortotal solid cancers are somewhat higher (by about a factorof 2) for women than for men.
B. Salivary gland cancer
1. General background
137. Cancers of the salivary gland are rare. Annual age-standardized world rates are fewer than 1.5 and 1.3 casesper 105 persons for men and women, respectively, in thevast majority of tumour registries represented in Parkin etal. [P19]. Rates tend to be slightly higher in developedcountries. Among the highest rates are in parts of Australia,where annual age-standardized rates of 1.9 per 105 personsare recorded for men, and in parts of Canada, where ratesof 3.8 per 105 persons are recorded for women [P19]. Ratesare somewhat lower for developing countries. For example,in Martinique, age-standardized rates of 0.4 and 0.2 per 105
persons are recorded for men and women, respectively[P19]. Benign tumour rates are 2–3 times higher, withtumours appearing at somewhat younger ages [B48]. Apartfrom ionizing radiation, causes of salivary gland cancer arenot clear. There have been suggestions of associations withthe use of hair dyes or mouthwash and with certain occu-pational factors, but few suggestions of associations withdietary factors, tobacco or alcohol use [B27].
2. Summary of UNSCEAR 2000
138. Salivary gland cancer was not considered in theUNSCEAR 2000 Report [U2].
3. New or updated studies
(a) External low-LET exposures
139. A number of early studies, mostly based on smallnumbers of cases, have suggested an association betweensalivary gland tumours and radiation exposure at youngages [H41, J6, M54, M55, S53, S71, S72]. These publishedresults were the basis for: (a) a meta-analysis that resulted
UNSCEAR REPORT-PART 1.qxp 10/7/08 2:57 pm Page 56
in estimates of 0.26 ± 0.06 excess malignant tumours and0.44 ± 0.11 excess benign tumours following childhoodexposures of 104 PY Gy [L82]; and (b) estimation of theprobability of causation for radiation-related salivary glandcancer following childhood exposure [N11]. Concurrentlyand more recently, Hildreth et al. [H26] estimated an RRof 5.5 for benign salivary gland tumours associated withtherapeutic X-ray treatment in infancy for enlarged thymus.Preston-Martin et al. [P7] compared reported histories ofdental X-ray examinations in patients with benign andmalignant parotid gland tumours and matched controls, esti-mating RRs of 5.6 and 1.5 for malignant and benigntumours, respectively, associated with exposures of greaterthan 0.5 Gy. No dose–response analyses were presented ineither study. In a study of occupational exposures and mor-tality due to salivary gland cancer among African-Americanand white workers in the United States, Wilson et al. [W34]found a positive trend (p = 0.08) among white workers withprobability of exposure to ionizing radiation, as measuredby a job–exposure matrix.
140. Results from an incidence and pathology study ofbenign and malignant salivary gland neoplasms in the LSSpopulation are presented in table 20 [L83, S73]. Informationfrom the LSS Tumor Registry was supplemented by addi-tional case findings, with pathology review, from autopsy,from biopsy and from surgical specimens maintained at theRadiation Effects Research Foundation and elsewhere. Theincidence of malignant tumours (ERR = 3.5 (90% CI: 1.5,7.5) Gy–1; based on 31 cases with estimates of radiationexposure) and of benign tumours (ERR = 0.7 (90% CI: 0.1,1.7) Gy–1; based on 64 cases) both increased significantlywith radiation dose, and no modifying effects of exposureage, attained age, sex or time since exposure were observed.Remarkably, most of the evidence for a malignant tumourdose response pertained to mucoepidermoid carcinoma(ERR = 8.3 (90% CI: 2.6, 29.6) Gy–1; based on 11 cases),and most of the evidence for a benign tumour response per-tained to Warthin’s tumour (ERR = 3.1 (90% CI: 0.6, 10.3)Gy–1; based on 12 cases). Both of these tumours occur onlyin the parotid glands. Dose response for residual malignanttumours was of only suggestive significance (ERR = 1.4(90% CI: 0, 4.7) Gy–1; based on 20 cases; p = 0.11), whilethat for residual benign tumours (ERR = 0.3 (90% CI: –0.1,1.2) Gy–1; based on 52 cases; p = 0.29) was positive butnot statistically significant.
141. Schneider et al. [S74] studied radiation doseresponse for incidence of salivary gland tumours in a cohortof 2,945 persons medically irradiated as children between1939 and 1962, mainly for treatment of enlarged tonsilsand adenoids. Twenty-two patients developed malignantsalivary gland tumours that were verified by pathologyafter surgery, including 9 cases of mucoepidermoid carci-noma, and 66 developed benign salivary tumours (includ-ing only 2 cases of Warthin’s tumour). The incidence ofmalignant tumours was not significantly associated withradiation dose (ERR = –0.06 (95% CI: undetermined, 4.0)Gy–1), even though 22 cases were observed versus 0.39
expected according to age- and sex-specific populationrates. Conversely, the incidence of benign tumours was sig-nificantly associated with dose (ERR = 19.6 (95% CI: 0.16,undetermined) Gy–1). The very large numbers of malignantand benign tumours observed relative to the expectationbased on population rates were partly ascribed by theauthors to notification and screening programmes for thestudy population. These began in 1974 and resulted in athreefold increase in the numbers of cases diagnosed after1974. In a group irradiated in childhood for treatment oftinea capitis, there was no statistically significant elevationin the RR for salivary gland tumours (6 tumours amongthose irradiated versus 2 tumours in the control group (RR= 1.8; 95% CI: 0.4, 8.9)) [S68].
142. In comparing the results from the LSS and frommedically irradiated populations discussed in the previoustwo paragraphs, it is illuminating to consider the distribu-tion of dose within the two populations. As generally forthe LSS cohort [P9, P10, R20], the distribution of salivarygland doses among the exposed population is highlyskewed, and the mean doses and inter-quartile ranges fordifferent types of tumour differ markedly from those ofthe population as a whole. By contrast, in the medicallyirradiated population, doses are much higher than in theLSS population, and they are more closely and more sym-metrically concentrated around the mean value. Thus, asstated by Schneider et al. [S74], the LSS results are notdirectly comparable to theirs, and extrapolation of theirresults to lower doses may not be justified. One possibleexplanation offered for the difference, that the LSS dosesare partially due to neutrons, seems less tenable in viewof the reduced role assigned to neutrons in the most recentrefinement of that dose reconstruction system [P10]. Thereremains a possibility, however, that the small neutroncomponent might be of some importance, since thegamma-ray estimates are influenced by the choice of theRBE for neutrons [W20].
143. Salivary gland tumours have been studied for anumber of nuclear worker cohorts. In particular, a statisti-cally significant excess risk (2 cases versus 0.19 expected)has been observed in a group of workers at the LawrenceLivermore National Laboratory in the United States [W39].There is no analysis of dose response in relation to salivarygland tumour risk. However, in three other United Kingdomcohorts, there were no statistically significant elevations inrisk (2 cases versus 2.23 expected [M4], 1 case versus 2.97expected [M5] and 2 cases versus 0.38 expected [M6]).
4. Summary
144. The available evidence indicates that the salivarygland is susceptible to the induction of cancer by ionizingradiation; the evidence for this comes almost entirely fromstudies of external low-LET exposure. There is little evi-dence for the modifying effects of sex, age at exposure ortime since exposure.
ANNEX A: EPIDEMIOLOGICAL STUDIES OF RADIATION AND CANCER 57
UNSCEAR REPORT-PART 1.qxp 10/7/08 2:57 pm Page 57
58 UNSCEAR 2006 REPORT: VOLUME I
C. Oesophageal cancer
1. General background
145. Rates of oesophageal cancer vary widely by coun-try and ethnic group [M32], with low rates in many coun-tries but extremely high rates among Chinese and certainCentral Asian groups, and intermediate rates in black pop-ulations [M32]. For example, age-standardized world ratesof 183.8 and 123.1 cases per 105 persons for men andwomen, respectively, have been observed in parts of China[P19], whereas the rates are fewer than 10 cases per 105
persons [P19] in many European countries. Sinceoesophageal cancer is generally fatal, mortality rate is agood surrogate for incidence rate. The major known riskfactors for oesophageal cancer are heavy alcohol con-sumption, tobacco use and chewing of betel nut [M32].Other possible risk factors, but where the weight of evi-dence is less strong, are consumption of pickled foods andnutritional deficiency [M32].
2. Summary of UNSCEAR 2000
146. The UNSCEAR 2000 Report stated that the LSS datadid not provide convincing evidence of a link betweenoesophageal cancer and radiation, although a significantexcess in oesophageal cancer mortality occurred in the earlyyears of follow-up, i.e. from 5 to 12 years after exposure.Cancer incidence data from the LSS, which began 12 yearsafter exposure, do not show a significant excess risk ofoesophageal cancer [T1]. The LSS mortality data alsoshowed a higher ERR for this cancer in females than inmales, although not significantly so.
147. The United Kingdom ankylosing spondylitis studywas the only study of medically exposed populations toreport a significant risk of radiation-associatedoesophageal cancer [W8]. Regarding internal low-LETexposures, little epidemiological information was avail-able. The data from patients treated with 131I for adulthyperthyroidism [R3] showed no increased risk of this cancer, but the doses received by the oesophagus were small.
148. Oesophageal cancer data were available from severalworker studies following high-LET exposures. In a study ofthree groups of workers exposed to plutonium in threeUnited Kingdom nuclear industry workforces, no clearexcess of oesophageal cancer was seen (23 observed versus21.3 expected deaths), nor was any excess seen amongworkers monitored for exposures to uranium, polonium,actinium and other radionuclides (apart from tritium) (9 observed versus 16.1 expected deaths), although dosesto the oesophagus were probably small [C40].
3. New or updated studies
(a) External low-LET exposures
149. The updated LSS [P9] identified 171 oesophagealcancer deaths among those with at least 5 mSv of expo-sure. Since the underlying mortality rates of oesophagealcancer are considerably higher for males than females, theestimates of ERR were lower among males (0.55 Sv–1) thanfemales (1.40 Sv–1) (table 21).
150. Several studies of workers exposed to external radi-ation have reported data on the risks of oesophageal cancer(table 21). Although these were reported before 2000, insome cases, they were not discussed in the UNSCEAR 2000Report, so the Committee considers them here. Of these,three studies reported data based on “internaldose”–response comparisons. The NRRW [M12] reported adose–response association non-significant in the negativedirection that was based on 120 cases of oesophageal cancerin informative strata (strata defined by age group, sex, inter-val of follow-up, etc., with at least one cancer death and atleast two dose groups with persons contributing to thefollow-up) and a mean dose of 0.03 Sv. A smaller UnitedStates study of workers at Los Alamos National Laboratory[W6] reported a marginally positive dose response (p < 0.1)but a deficit compared with the United States population (22observed and 27.4 expected cases). A study of oesophagealcancer incidence among workers in the Canadian NationalDose Registry [S8] reported a null dose–response associa-tion based on 22 observed cancers, and an update of the seg-ment of the Registry concerning nuclear power industryworkers also produced a null result [Z6]. Other studies ofworkers (workers at Oak Ridge National Laboratory in theUnited States [F2], radiation workers at Électricité de France[R54], Japanese nuclear workers [I14], and radiologic tech-nologists in Japan and the United States [M31, Y5]) reporteddeficits in oesophageal cancer mortality rates based on com-parisons with reference general populations. Only the studyof Chinese medical X-ray workers reported an excess ofoesophageal cancer among both early workers (mean dose0.55 Sv) and more recent workers (0.08 Sv) [W3]. It isnotable that the workers in this study had higher radiationexposures than those in the other studies, and hence therewas a greater potential to observe excess cases. In a UnitedKingdom study of Springfields uranium workers [M5], noexcess of oesophageal cancer was seen (25 observed versus34.54 expected cases) (table 21).
151. A United States study of women treated with radia-tion for primary breast cancer documented RRs of 2.83 (95%CI: 1.35, 5.92) and 2.17 (95% CI: 1.67, 4.02) for squamouscell oesophageal cancer occurring between 5 and 9 years andat 10 or more years, respectively, following radiation ther-apy [Z11]. This increase was mainly due to tumours locatedin the upper and middle thirds of the oesophagus. No assess-ment of radiation doses has been carried out for this cohort.
UNSCEAR REPORT-PART 1.qxp 10/7/08 2:57 pm Page 58
(b) Internal low-LET exposures
152. The only new data on internal exposures andoesophageal cancer are those from the study of personsexposed to weapons test fallout in the Semipalatinsk areaof Kazakhstan [B58], which reported a highly statisticallysignificant trend of increasing risk with dose in women (p = 0.003), although not for men (p = 0.46). The aggre-gate ERR based on an internal analysis was 2.37 (95% CI:1.47, 3.63) Sv–1; however, when analysis was restricted tothe exposed group, based on individual dose estimates, thetrend estimate was much reduced and no longer statisticallysignificant: 0.18 (95% CI: –0.09, 0.66) Sv–1. As noted insection II.D, “ecological bias” may operate in this study, sothese findings should be treated with caution.
4. Summary
153. The new or updated data are broadly supportive ofthe conclusions in the UNSCEAR 2000 Report. There is anassociation of radiation exposure and oesophageal cancer inthe LSS, although since oesophageal cancer is relativelyrare, there was insufficient statistical power to detect anexcess in the several low-dose occupational exposure studies. There are insufficient data to characterize the shapeof the dose–response curve or to establish a dose-rate effectiveness factor. Virtually no human data are availableon the magnitude of effects following exposure to high-LET radiation.
D. Stomach cancer
1. General background
154. Stomach cancer is the fourth most common malig-nancy worldwide and appears to be the second leadingcause of cancer mortality [N10, S59]. Rates are higheramong men than women and show a sharp increase withage. The incidence rate of stomach cancer varies consid-erably with geographical location and among differentethnic groups within the same locality [S59].Approximately 60% of all stomach cancers occur in devel-oping countries. The highest rates are found in EasternAsia, the Andean regions of South America, and EasternEurope, while low rates are found in North America,Northern Europe and most countries in Africa and South-East Asia [P19, S59]. For example, annual age-standardizedworld rates of 145.0 and 34.5 cases per 105 persons formen and women, respectively, have been observed in partsof China [P19], whereas in many European countries therates are fewer than 30 cases per 105 persons [P19]. Studiesof migrants suggest that environmental factors may belargely responsible for the variation in rates [N10]. Of par-ticular interest is the fact that the Japanese people have had
much higher rates of stomach cancer than people inWestern countries. In most countries, including Japan,stomach cancer incidence and mortality rates have declinedmarkedly over the past 50 years [N10, S59]. These changesare likely to reflect changes in diet, including increasedconsumption of fresh vegetables and fruits and decreasedsalt intake (which case-control studies have shown to belinked to reduced stomach cancer risks [K36]). Dietary fac-tors are important, and infection with Helicobacter pylori[S69], especially with certain genetic or physiologicalcofactors, has been associated with elevated risks of stomach cancer [C18, K36].
2. Summary of UNSCEAR 2000
155. The Committee reported in 2000 that the doseresponse seen in the LSS incidence data up to 1987 wasconsistent with linearity, and that the ERR per unit dosewas higher for females than for males, decreased withincreasing age at exposure, and did not vary significantlywith the time since exposure [T1]. The findings for mortality rates up to 1990 were very similar [P1].
156. The major studies of patients whose stomachs wereirradiated with moderately high doses—particularly thestudies of patients treated for cervical cancer [B8], anky-losing spondylitis [W8] and peptic ulcer [G6]—producedestimates for EAR per unit dose that were appreciably lowerthan those from the LSS, but the ERR estimates of thesestudies and of the LSS were statistically compatible.
157. The Committee also reported in 2000 that there wasa suggestive excess of stomach cancer among Mayak work-ers with external doses exceeding 3Gy [Z3]. However, studies of workers exposed to lower doses have not pro-vided evidence of a dose–response relationship for stomachcancer [C3].
158. The Swedish study of patients treated with 131I forhyperthyroidism reported increased incidence [H6] andmortality rates [H24] from stomach cancer, with some indi-cation of a dose–response trend. In general, however, theepidemiological data were too sparse to quantify a dose ordose-rate effectiveness factor or to characterize risks frominternal low-LET or high-LET exposures.
159. Studies of persons exposed to 224Ra [N2, W15] andthe diagnostic contrast medium Thorotrast [A5, V3, V4]provide little evidence of elevated risks of stomach cancer.A study of 11 cohorts of underground miners found excessmortality rates from stomach cancer in comparison withnational and local rates, but no evidence of an increase inmortality rates with increasing cumulative radon exposure[D10]. Because doses to the stomach from radon are estimated to be very low, it seems likely that the excess isdue to other factors, such as other exposures in mining environments or smoking.
ANNEX A: EPIDEMIOLOGICAL STUDIES OF RADIATION AND CANCER 59
UNSCEAR REPORT-PART 1.qxp 10/7/08 2:57 pm Page 59
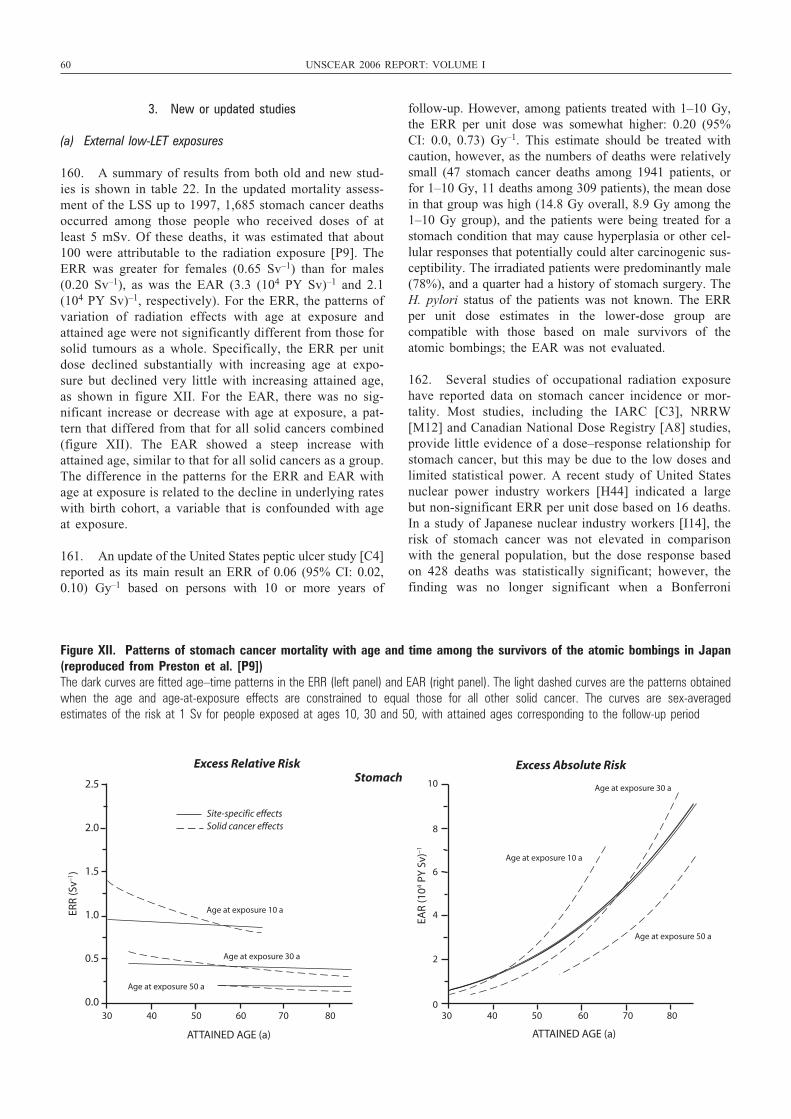
60 UNSCEAR 2006 REPORT: VOLUME I
3. New or updated studies
(a) External low-LET exposures
160. A summary of results from both old and new stud-ies is shown in table 22. In the updated mortality assess-ment of the LSS up to 1997, 1,685 stomach cancer deathsoccurred among those people who received doses of atleast 5 mSv. Of these deaths, it was estimated that about100 were attributable to the radiation exposure [P9]. TheERR was greater for females (0.65 Sv–1) than for males(0.20 Sv–1), as was the EAR (3.3 (104 PY Sv)–1 and 2.1(104 PY Sv)–1, respectively). For the ERR, the patterns ofvariation of radiation effects with age at exposure andattained age were not significantly different from those forsolid tumours as a whole. Specifically, the ERR per unitdose declined substantially with increasing age at expo-sure but declined very little with increasing attained age,as shown in figure XII. For the EAR, there was no sig-nificant increase or decrease with age at exposure, a pat-tern that differed from that for all solid cancers combined(figure XII). The EAR showed a steep increase withattained age, similar to that for all solid cancers as a group.The difference in the patterns for the ERR and EAR withage at exposure is related to the decline in underlying rateswith birth cohort, a variable that is confounded with ageat exposure.
161. An update of the United States peptic ulcer study [C4]reported as its main result an ERR of 0.06 (95% CI: 0.02,0.10) Gy–1 based on persons with 10 or more years of
follow-up. However, among patients treated with 1–10 Gy,the ERR per unit dose was somewhat higher: 0.20 (95%CI: 0.0, 0.73) Gy–1. This estimate should be treated withcaution, however, as the numbers of deaths were relativelysmall (47 stomach cancer deaths among 1941 patients, orfor 1–10 Gy, 11 deaths among 309 patients), the mean dosein that group was high (14.8 Gy overall, 8.9 Gy among the1–10 Gy group), and the patients were being treated for astomach condition that may cause hyperplasia or other cel-lular responses that potentially could alter carcinogenic sus-ceptibility. The irradiated patients were predominantly male(78%), and a quarter had a history of stomach surgery. TheH. pylori status of the patients was not known. The ERRper unit dose estimates in the lower-dose group are compatible with those based on male survivors of theatomic bombings; the EAR was not evaluated.
162. Several studies of occupational radiation exposurehave reported data on stomach cancer incidence or mor-tality. Most studies, including the IARC [C3], NRRW[M12] and Canadian National Dose Registry [A8] studies,provide little evidence of a dose–response relationship forstomach cancer, but this may be due to the low doses andlimited statistical power. A recent study of United Statesnuclear power industry workers [H44] indicated a largebut non-significant ERR per unit dose based on 16 deaths.In a study of Japanese nuclear industry workers [I14], therisk of stomach cancer was not elevated in comparisonwith the general population, but the dose response basedon 428 deaths was statistically significant; however, thefinding was no longer significant when a Bonferroni
2.5
2.0
1.5
1.0
0.5
0.0 30 40 50 60 70 80
ATTAINED AGE (a)
ERR
(Sv–1
)
EAR
(104 P
Y S
v)–1
10
8
6
4
2
030 40 50 60 70 80
ATTAINED AGE (a)
Excess Relative Risk Excess Absolute Risk
Age at exposure 10 a
Age at exposure 30 a
Age at exposure 50 a
Site-specific effectsSolid cancer effects
Age at exposure 10 a
Age at exposure 30 a
Age at exposure 50 a
Stomach
Figure XII. Patterns of stomach cancer mortality with age and time among the survivors of the atomic bombings in Japan(reproduced from Preston et al. [P9]) The dark curves are fitted age–time patterns in the ERR (left panel) and EAR (right panel). The light dashed curves are the patterns obtainedwhen the age and age-at-exposure effects are constrained to equal those for all other solid cancer. The curves are sex-averaged estimates of the risk at 1 Sv for people exposed at ages 10, 30 and 50, with attained ages corresponding to the follow-up period
UNSCEAR REPORT-PART 1.qxp 10/7/08 2:57 pm Page 60
procedure was applied to take account of the multiple sta-tistical tests that were performed. The authors note the pos-sibility of confounding by dietary and socio-economicfactors. Although not reported in the UNSCEAR 2000Report [U2], the 1997 study of Artalejo et al. [A32]reported a slight deficit of stomach cancer mortality amongworkers for the Spanish Nuclear Energy Board. The SMRwas 0.81 (95% CI: 0.49, 1.26) but was based on only 19cancer deaths, of which 7 were among the 27% of thecohort who had been miners and may have been exposedto alpha radiation [A32].
163. Two relevant studies of occupational exposure inmedicine have recently been reported, in the United States[M10, S29] and in China [W3]; in neither study have indi-vidual dose estimates been derived, so their utility for quan-titatively understanding radiation risks is questionable. TheChinese study of medical X-ray workers showed no excessamong those employed before 1970, when exposures werehigh (estimated mean cumulative dose of 0.55 Gy), but anexcess was reported among those first employed during1970–1980 (estimated mean cumulative dose of 0.08 Gy)[W3]. Among United States radiologic technologists, bothmales and females had lower stomach cancer incidence[S29] and mortality [M10] rates than the general popula-tion. Rogel et al. [R54] reported a deficit (at borderlinelevels of statistical significance) of stomach cancer mortal-ity compared with French national rates among radiationworkers of Électricité de France (3 observed versus 7.2expected deaths; SMR = 0.41; 90% CI: 0.11, 1.07).
(b) Internal low-LET exposures
164. The only new data on internal exposures and stom-ach cancer are those from the study of persons exposed toweapons test fallout in the Semipalatinsk area of Kazakhstan[B58], which reported a highly statistically significant trendof increasing risk with dose in women (p = 0.0016),although not for men (p = 0.36). The aggregate ERR basedon an internal analysis was 1.68 (95% CI: 0.83, 2.99) Sv–1;however, when analysis was restricted to the exposed group,based on individual dose estimates, the trend estimate wassomewhat lower at 0.95 (95% CI: 0.17, 3.49) Sv–1. As notedin section II.D, “ecological bias” may operate in this study,so these findings should be treated with caution.
(c) Internal high-LET exposures
165. Travis et al. [T30] studied patients injected withThorotrast during radiographic procedures in Denmark,Sweden and the United States. The stomach cancer inci-dence rate in a group of Thorotrast-exposed patients inDenmark and Sweden was significantly elevated comparedwith a control group, but there was no evidence of a trendof increasing stomach cancer incidence with a surrogatemeasure of cumulative radiation dose. Stomach cancer wasnot evaluated with respect to the mortality rate data thatwere available for the United States.
166. Auvinen et al. [A36] studied cancer epidemiology inrelation to radon, uranium and other radionuclides in drink-ing water in a cohort of persons who used water from wellsdrilled into bedrock in Finland. Activity concentrations of226Ra, radon and uranium were assessed by radiometricanalysis of samples from each well. There was no rela-tionship seen between stomach cancer incidence and levelsof any of the three radionuclides. If anything, there was aninverse relationship: the hazard ratio in the group exposedto 130–299 Bq/L radon relative to the group exposed to lessthan 130 Bq/L was 0.54 (95% CI: 0.25, 1.18), and thehazard ratio in the group exposed to 300–15,000 Bq/L radonrelative to that exposed to less than 130 Bq/L was 0.48(95% CI: 0.25, 0.94). Similar inverse relationships betweenexposure and stomach cancer risk were observed for 226Raand uranium.
4. Transfer of risk estimates across populations
167. Although the appropriate way to generalize or“transfer” risk estimates from one population to another isa general issue, it is especially important when there is amajor discrepancy between the underlying cancer rates inthe two populations. Stomach cancer is a prime exampleof such a situation. For example, lifetime risk estimatesfor stomach cancer based on transfer of absolute risks aspresented in the UNSCEAR 2000 Report for the UnitedStates and the United Kingdom were several times higherthan those based on transfer of RRs. The UNSCEAR 2000Report observed that the attributable risk estimates in thestudies conducted in Western populations were apprecia-bly lower on average than those in the LSS, suggestingthat using the ERR model may be a better way to “trans-fer” stomach cancer risk than using the EAR model.Updated data from the peptic ulcer study [C4] confirm thatERR estimates are very similar to those based on survivorsof the atomic bombings. However, although RRs appearto be more comparable than absolute risks, other differences in the study populations may confound thiscomparison, particularly the much higher doses in somemedical studies.
5. Summary
168. Updated data from the LSS [P9] and the peptic ulcerstudy [C4] continue to provide evidence of a positive doseresponse. Within the LSS, the ERR decreases with increas-ing age at exposure, but the EAR does not. Past studies ofcervical cancer patients [B8] also provide evidence ofexcess stomach cancer risk from radiation exposure. Moststudies of nuclear workers do not show an association ofexcess stomach cancer with low-dose protracted exposure,but this may be due to the limited statistical power of thesestudies. Weak associations are suggested by new studies ofUnited States [H44] and Japanese [I14] nuclear powerworkers.
ANNEX A: EPIDEMIOLOGICAL STUDIES OF RADIATION AND CANCER 61
UNSCEAR REPORT-PART 1.qxp 10/7/08 2:57 pm Page 61
62 UNSCEAR 2006 REPORT: VOLUME I
E. Cancer of the small intestine, including the duodenum
1. General background
169. Cancer of the small intestine is only slightly less rarethan cancer of the salivary gland, with annual age-standardized world rates of less than 4.0 and 2.0 cases per105 persons for men and women, respectively, in the tumourregistries represented in Parkin et al. [P19]. The cancer canbe induced in experimental animals by high-dose irradia-tion of exteriorized intestinal loops [O11], and the smallintestine therefore is an organ susceptible to radiogeniccancer. However, the small intestine appears to have char-acteristics involving selective retention of template DNAstrands and providing protection of the stem cell genome inintestinal crypts, which render it highly resistant to car-cinogenesis at low to moderate levels of exposure to radi-ation and other environmental carcinogens [C31, P41]. Asecond line of defence, in which mutated stem cells areeliminated by radiation-induced apoptosis in the stem cellzone of intestinal crypts, may also come into effect [P42].There are well known hereditary risk factors, in particularfamilial adenomatous polyposis (FAP), and certain otherchronic diseases, in particular Crohn’s disease [S57].
2. Summary of UNSCEAR 2000
170. Cancer of the small intestine was not considered inthe UNSCEAR 2000 Report [U2].
(a) External low-LET exposures
171. In an international cancer registry study of secondprimary cancer incidence in a group of very-long-term sur-vivors of cervical cancer [K1], the incidence of second can-cers was evaluated in a group of 86,000 cervical cancerpatients reported to 13 population-based cancer registries infive countries. Of these patients, 49,800 had received radio-therapy, with typical average organ doses of between 10and 20 Gy to the small intestine; 16,700 had not been givenradiotherapy; and 19,700 had missing treatment data. Forthe small intestine, 22 cases of second cancer were observedamong radiotherapy patients, versus 12.3 expected frompopulation rates (ratio of observed to expected (O/E) = 1.8;90% CI: 1.3, 2.6), and 2 cases versus 2.7 expected wereseen among women who had not been given radiotherapy[K1]. Among the radiotherapy patients, virtually the sameO/E ratios were obtained for the period within 9 years aftercervical cancer diagnosis (O = 9, E = 4.9, O/E = 1.8; 90%CI: 0.96, 3.2) as after 9 years (O = 13, E = 7.5, O/E = 1.7;90% CI: 1.03, 2.8). In the parallel case-control study [B8],there is no evidence of increased risk. The RR is 1.0 (90%CI: 0.3, 2.9) among the 22 cases, despite the very high dosesreceived (estimated to be several hundred grays on aver-age). There is no evidence of a dose response (p = 0.47 for trend among all survivors, or 10-year survivors); if
anything, there are indications of a negative trend with dose.An earlier study by Smith and Doll [S75] of 2,068 womentreated with radiation for benign gynaecological disordersfound 3 deaths from cancer of the small intestine versus 0.4expected. Cancer of the small intestine was not discussedin the most recently published follow-up study of this irra-diated group [D7].
172. Despite the experimental evidence for induction byradiation of cancer of the small intestine, the weak epi-demiological evidence, in particular the lack of any trendwith dose in the international cervical cancer case-controlstudy [B8], and the lack of the expected increase in riskwith time in the cohort study, indicates that the smallintestine is not susceptible to radiogenic cancer induction,even at high doses. It is possible that the very high dosesin the cervical cancer study resulted in cell sterilization,which might partially explain the negative trend in thecase-control study, although the trend was not statisticallysignificant.
3. Summary
173. The available evidence indicates that cancer of thesmall intestine is not strongly inducible by ionizing radia-tion. However, the available evidence comes almost entirelyfrom studies of external low-LET exposure at relativelyhigh doses, and it is possible that cell sterilization may partially account for the largely negative findings.
F. Colon cancer
1. General background
174. The colon resembles the small intestine in that stemcells deep in the intestinal crypts produce a continuous flowof new and relatively short-lived crypt cells that migratetowards the top of the crypt. However, survival and repairof DNA damage in the crucial stem cells is the rule ratherthan apoptosis and replacement (regeneration) as in thesmall intestine. This is perhaps because the latter strategywould be more error-prone in the colonic environment,which includes a much higher concentration of genotoxicmolecules [P41]. In any case, cancer of the colon is muchmore frequent than cancer of the small intestine, and ion-izing radiation exposure is an established risk factor.Underlying rates tend to be higher in developed countries(whether in North America, Europe, Oceania or Japan), with age-standardized world rates lying generally between 20 and 40 cases per 105 PY, whereas rates are generallylower—fewer than 5 cases per 105 PY—in Africa andSouthern Asia [P19]. As with cancers of the small intes-tine, there are well established hereditary risk factors, inparticular familial adenomatous polyposis (FAP) [S58].There are also well-known dietary risk factors, in particular
UNSCEAR REPORT-PART 1.qxp 10/7/08 2:57 pm Page 62
high-fat and low-fibre diets and diets deficient in fruit andvegetables, and also risk factors associated with certainother chronic diseases, in particular ulcerative colitis andCrohn’s disease [S58].
2. Summary of UNSCEAR 2000
175. The UNSCEAR 2000 Report stated that the LSSfound a dose response consistent with linearity for bothcolon cancer incidence [T1] and mortality [P1]. However,the cervical cancer [B8] and peptic ulcer [G6] studies withcolon doses of several grays showed little evidence of ele-vated risk, possibly owing to a cell-killing effect. There wasno clear pattern in the variation of ERR per unit dose bysex, age at exposure or time since exposure among the sur-vivors of the atomic bombings. However, the EAR per unitdose for mortality increased with time since exposure.Changes over time in underlying rates in Japan make it dif-ficult to determine how to transfer risks across populations.
176. The LSS Tumor Registry incidence analysis for1958–1987 [T1] gave an estimated ERR of 0.72 (95% CI:0.29, 1.28) Sv–1 (p < 0.001), with no significant variationbetween the sexes. The ERR per unit dose declined withincreasing age at exposure and with attained age, but thedecrease with attained age was statistically significant whilethat with age at exposure was not. The estimated ERR atage 50, after exposure at age 30, was 1.88 (90% CI: 0.69,3.86) Sv–1. The EAR per unit dose increases with time inthe LSS mortality study [P1]. Nakatsuka et al. [N12]analysed colon cancer incidence for 1950–1980, obtainingresults similar to those of Thompson et al. [T1] when thedata were restricted to the period 1959–1980, but with asignificant decrease in ERR per unit dose with age at expo-sure. An interesting finding was that very similar lineardose–response coefficients were obtained for cancerslocated in the caecum and ascending colon (ERR = 0.80Sv–1; 90% CI: 0.07, 1.96; p = 0.06 for trend), transverseand descending colon (ERR = 1.09 (90% CI: 0.17, 2.59)Sv–1; p = 0.04) and sigmoid colon (ERR = 0.96 (90% CI:0.33, 1.87) Sv–1; p = 0.003).
177. Indications of radiation-related colon cancer riskwere obtained from studies of patients irradiated for treat-ment of benign pelvic disease, including 267 patients fol-lowed for an average of 16 years, in which 4 intestinalcancer deaths were observed versus 1 expected [B49]. Moreconvincing evidence came from a follow-up of patientstreated for metropathia haemorrhagica [S75], which foundno excess rates of mortality due to colon cancer within 5years after treatment, but observed 21 colon cancer deathsversus 13.5 expected 5 or more years after treatment. Themost recent follow-up of this series [D7] found 2 coloncancer deaths versus 1.7 expected within 5 years after treat-ment, and 45 versus 31.2 expected 5 or more years aftertreatment (O/E = 1.44; 90% CI: 1.1, 1.8). The estimatedaverage colon dose was 3.2 Gy, with an 80% mid-range of2.4–3.7. In other studies, only 32 colon cancers were
observed compared with 29 expected among 1,893 womentreated with radium implants or X-rays for benign gynae-cological disorders [W30], and an incomplete follow-up ofwomen treated with radium for benign uterine haemorrhagefound no excess rates of mortality due to colon cancer[D41].
178. The UNSCEAR 2000 Report [U2] concluded thatthere was strong evidence of an effect on colon cancer riskdue to ionizing radiation exposure that was consistent witha linear dose response. The effects of sex, age at exposureand time since exposure on the ERR per unit dose are notclear. The UNSCEAR 2000 Report [U2] considered the evi-dence for colon cancer risk by radiation type and concludedthat there was little precision in the low-dose studies ofexternal exposure to low-LET radiation and of internalexposure to low-LET and high-LET radiation, which limitsthe conclusions that can be drawn with respect to thesemodes of exposure.
3. New or updated studies
179. This section considers several studies (table 23) pub-lished well before the UNSCEAR 2000 Report [U2],although these studies were not considered there.
(a) External low-LET exposures
180. In the latest follow-up of the LSS cohort, coloncancer mortality rates during the period 1950–1997increased with neutron-weighted (weight = 10) radiationdose (p < 0.001), with negligible difference between thesexes [P9]. The estimate for ERR per unit dose based on alinear model, for exposure at age 30 with no assumed vari-ation with attained age, was 0.54 (90% CI: 0.13, 1.2) Sv–1
for males and 0.49 (90% CI: 0.11, 1.1) Sv–1 for females,with a 25% decrease per decade of age at exposure.
181. In their tumour registry study of benign gastroin-testinal tumour incidence among survivors of the atomicbombings, Ron et al. [R35] observed 215 histologically con-firmed cases of benign colon tumour diagnosed between1958 and 1989. There was little evidence of a radiation doseresponse (ERR = 0.14 (95% CI: –0.20, 0.76) Gy–1).However, 74% of the tumours were diagnosed between1985 and 1989, presumably reflecting a more frequent useof colonoscopy. The dose response was positive for theperiod 1958–1984 (ERR = 0.64 (95% CI: –0.11, 2.46)Gy–1), whereas that for the period 1985–1989 was negative(ERR = –0.20 (95% CI: undetermined, 0.47) Gy–1.
182. In their reports of cancer mortality among ankylos-ing spondylitis patients, for whom the estimated averagecolon dose [W8] was 4.1 Gy, Court Brown and Doll [C32]and Smith and Doll [S32] tended to discount their consis-tent observation of excess colon cancer mortality, becauseof known associations between spondylitis and ulcerativecolitis and between ulcerative colitis and colon cancer.
ANNEX A: EPIDEMIOLOGICAL STUDIES OF RADIATION AND CANCER 63
UNSCEAR REPORT-PART 1.qxp 10/7/08 2:57 pm Page 63
64 UNSCEAR 2006 REPORT: VOLUME I
Smith and Doll [S32] observed 16 colon cancer deaths 9 ormore years after treatment, as opposed to 10.4 expected, anon-significant excess. However, 12 deaths in contrast to6.9 expected were seen within the first 8 years after treat-ment, of which 6 occurred within the first 2 years after treat-ment, when 2.5 would have been expected. The most recentfollow-up [W8] estimated RRs of 1.30 (95% CI: 1.07, 1.55),or ERR = 0.08 (95% CI: 0.02, 0.14) Gy–1, 5 or more yearsafter treatment, with a significant decrease in RR over timefollowing treatment.
183. With an estimated typical average organ dose of 24 Gy, the colon was one of the heavily irradiated sites inan international cancer registry study of the risk of secondprimary cancer occurring among very-long-term survivorsof cervical cancer [K1], although as generally in this study,no organ dose estimates were used in the analysis. Amongpatients treated with radiation, 178 colon cancers were diag-nosed within 9 years following cervical cancer diagnosis,as opposed to 162.7 expected (O/E = 1.09; 90% CI: 0.96,1.2), and 296 were observed versus 267.7 expected 10 ormore years after cervical cancer diagnosis (O/E = 1.12; 90%CI: 1.01, 1.2). Among the smaller number of cervical cancerpatients not given radiotherapy, the findings were very sim-ilar: 39 observed versus 37.3 expected within 9 years aftercervical cancer diagnosis (O/E = 1.05; 90% CI: 0.77, 1.32),and 56 observed versus 53.1 expected 10 or more yearsafter diagnosis (O/E = 1.05; 90% CI: 0.82, 1.29). Thus thisstudy suggests that, at very high colon doses, there is littleor no excess risk of colon cancer. The parallel case-controlstudy assessed 409 cases and 759 controls but reported noincrease in risk (RR = 1.02; 90% CI: 0.7, 1.6), despite thefact that sizeable numbers of cases were exposed at veryhigh doses (e.g. 44 cases received doses of greater than 40 Gy). There was no observed trend of risk with dose (p = 0.22); if anything, the risk of colon cancer appearedto decrease with increasing dose [B8].
184. Although not considered in the UNSCEAR 2000Report [U2], the study of Artalejo et al. [A32] reported aslight deficit of colon cancer mortality among workers forthe Spanish Nuclear Energy Board; the SMR was 0.83 (95%CI: 0.33, 1.72) but was based on only 7 cancer deaths, ofwhich 1 was among the 27% of the cohort who had beenminers and may have been exposed to alpha radiation[A32]. Rogel et al. [R54] reported no significant differencesin colon cancer mortality rates compared with Frenchnational rates among radiation workers of Électricité deFrance (8 observed versus 8.3 expected deaths; SMR = 0.97;90% CI: 0.48, 1.75).
(b) Internal low-LET exposures
185. A study of 6,841 Swedish, French and Italian patientstreated with a combination of conventional (external beam)radiotherapy and 131I for thyroid cancer documented amodest, but not statistically significant, increase in col-orectal cancer incidence (SIR = 1.3; 95% CI: 0.9, 1.6; 69cases) [R38]. However, there was a statistically significant
trend of increasing colorectal cancer risk with administeredquantity of 131I. Adjusted for external radiotherapy, the ERRper activity of 131I administered was 0.10 (95% CI: 0.08,0.27) per gigabecquerel. There was a statistically signifi-cant trend also among those who received no external radio-therapy, for whom the ERR per activity of 131I administeredwas 0.15 (95% CI: 0.02, 0.38) per gigabecquerel [R38].Unfortunately there was no breakdown of the values forcolorectal cancers into those for colon and rectal cancersseparately for this cohort, but it is likely that the vast majority of these cancers were colon cancers.
(c) Internal high-LET exposures
186. The International Thorotrast Study [T30] did not findany elevation in colon cancer mortality risk. There were 16cases in both the Thorotrast-exposed and the comparisongroup in the Denmark–Sweden part of this study, resultingin an RR of 1.5 (95% CI: 0.7, 3.0) [T30]. There were 5 deaths in the Thorotrast-exposed group and none in thecomparison group for the United States part of this study,resulting in an undefined RR with a lower 95% CI of 0.5[T30]. No colon (or other organ) dose estimates have beenmade for this study, and no trend with administeredThorotrast volume was reported.
4. Summary
187. The available evidence continues to indicate thatcolon cancer is inducible by ionizing radiation, compati-ble with a linear dose response. The evidence for thiscomes almost entirely from studies of external low-LETexposure, in particular from the LSS mortality data on thesurvivors of the atomic bombings. The LSS data suggestthat the ERR per unit dose decreases with increasing ageat exposure.
G. Rectal cancer
1. General background
188. Cancer of the rectum occurs about half as fre-quently as cancer of the colon. Risks tend to be higher indeveloped countries (whether in North America, Europe,Oceania or Japan), with age-standardized world rates gen-erally lying between 5 and 25 cases per 105 PY, whereasrates are generally lower—less than 5 cases per 105 PY—in Africa and Southern Asia [P19]. Many of the risk fac-tors for colon cancer apply also for rectal cancer. Inparticular, there are well-known hereditary risk factors(e.g. familial adenomatous polyposis (FAP)), dietary riskfactors (high-fat and low-fibre diets, diets deficient in fruitand vegetables) and risk factors associated with certainother chronic diseases (e.g. ulcerative colitis and Crohn’sdisease) [S58].
UNSCEAR REPORT-PART 1.qxp 10/7/08 2:57 pm Page 64
2. Summary of UNSCEAR 2000
189. Rectal cancer was not considered in the UNSCEAR2000 Report [U2]. The Committee has therefore considereda number of earlier studies, which are reported in table 24and discussed in the text.
(a) External low-LET exposures
190. Although statistical data on cancers of the colon andrectum are often presented together as “colorectal cancer”,the radiation dose–response behaviours of the two cancersdiffer considerably. In the most recent analysis of cancermortality among the survivors of the atomic bombings [P9],rectal cancer mortality was not associated with radiationdose among men. Based on 172 deaths during the period1950–1997, a linear model estimate for ERR was –0.25(90% CI: <–0.3, 0.15) Gy–1 for exposure at age 30 in amodel with no dependence upon attained age. However, itwas positively and significantly associated with dose amongwomen. Based on 198 deaths, the ERR was 0.75 (90% CI:0.16, 1.6) Gy–1, again for exposure at age 30. The tumourregistry analysis covering the period 1958–1987 [T1] foundno significant dose response based on 351 cases of coloncancer arising evenly between the two sexes, with no dif-ference between the sexes, and no significant trends withage at exposure or attained age.
191. In sharp contrast to the data on the survivors of theatomic bombings, there was a highly significant excess ofrectal cancer among cervical cancer patients treated withradiation [K1]: the typical average organ dose was 30–60Gy, and 340 cases were observed versus 205.5 expected(O/E = 1.7; 90% CI: 1.5, 1.8); whereas, among patients notgiven radiotherapy, there were 58 cases versus 43.1expected (O/E = 1.3; 90% CI: 1.1, 1.6). No excess was seenamong the radiotherapy patients 1–9 years after cervicalcancer diagnosis (66 observed versus 81.5 expected), butthere were 274 observed versus 124 expected 10 or moreyears after diagnosis (O/E = 2.2; 90% CI: 2.0, 2.4) (90%intervals calculated from table 5 of reference [K1]). In theparallel case-control study, individual organ doses could notbe estimated, because small changes in the position of theradium inserts would lead to large changes in rectal dose[B8]. Doses are likely to be very high, of the order of hun-dreds of grays. Nevertheless, rectal doses could be groupedinto broad ranges, and using these there is a trend with doseof high statistical significance (p = 0.002 for 10-year survivors) [B8].
192. Increased incidence of rectal cancer has beenobserved in two studies of prostate cancer patients givenradiotherapy, based on data from the SEER cancer registry[B50, B51]. Brenner et al. [B50], using SEER data for theperiod 1973–1993, found an increase that was not statisti-cally significant in rectal cancer risk more than 5 years afterprostate cancer diagnosis for patients given radiotherapy(O/E = 73/77 = 0.95) compared with those receiving sur-gery only (O/E = 86/121 = 0.75). The RR at 5 years after
diagnosis of prostate cancer patients given radiotherapy com-pared with those receiving only surgery was 1.35 (95% CI:–0.01, 1.86), but at 10 years after prostate cancer diagnosis,the RR became 2.05 (95% CI: 1.09, 3.92) [B50]. A morerecent analysis by Baxter et al. [B51] used SEER registrydata from the nine SEER registries that contributed data inor before 1991 to identify prostate cancer cases diagnosedduring the period 1973–1994 who were alive 5 or more yearsafter their diagnosis, who had not been diagnosed with acolorectal cancer during the first 5 years after prostate cancerdiagnosis, and who had undergone radiotherapy or surgicaltreatment not limited to orchidectomy. Kaplan–Meier curvesrepresenting the time from prostate cancer diagnosis untildevelopment of colorectal cancer were compared betweenthe patients undergoing surgery and those receiving radio-therapy. The observed hazard ratio for rectal cancer follow-ing radiation therapy compared with surgery only was 1.7(95% CI: 1.4, 2.2). The corresponding hazard ratios for“potentially irradiated” colorectal sites (rectosigmoid junc-tion, sigmoid colon and caecum) and non-irradiated sites (therest of the colon) were 1.08 (95% CI: 0.92, 1.26) and 0.95(95% CI: 0.78, 1.15), respectively. The radiation dose to therectum would be highly non-uniform, but at the point ofhighest exposure would approximate that to the prostategland [B52]. In a “conventional” 70 Gy prostate treatmentplan of around 1990, perhaps 40% of the rectum receivedmore than 60 Gy, and 80% more than 40 Gy [P43].Currently, with a 75 Gy intensity-modulated radiation treat-ment (IMRT) plan, perhaps 20% of the rectum receives morethan 60 Gy, and 50% more than 40 Gy [L84].
193. In a group of Scottish women treated with X-raysfor metropathia haemorrhagica (uterine bleeding), 14 deathsfrom rectal cancer were observed compared with 12.36expected (SMR = 1.13; 95% CI: 0.62, 1.90). The averagedoses to the rectum were high: 4.9 Gy. There was a sug-gestive, though not statistically significant, trend of increas-ing mortality with dose: the ERR is 0.04 (95% CI: –0.09,0.16) Gy–1. A group of United States women treated withintrauterine radium to control uterine bleeding also had gen-erally high rectal doses: mean = 3.0 Gy. This group exhib-ited little or no excess rectal cancer risk (15 observeddeaths, SMR = 1.0), and there was no trend of excess riskwith time since exposure or with radiation dose: the ERRis 0.03 (95% CI: –0.14, 0.19) Gy–1 (1-sided p = 0.45). Agroup treated for ankylosing spondylitis probably also hadfairly high rectal doses (mean colon dose = 2.58 Gy) [W8].There was no evidence of excess risk of rectal cancer mor-tality: there were 62 deaths compared with 56.9 expected(SMR = 1.09; 95% CI: 0.83, 1.39). There was no trend ofexcess risk with time in this group, but no dose–responseanalysis has been reported [W8].
194. In a cohort of United Kingdom radiation workers,there was no suggestion of increased rectal cancer risk incomparison with the national population: there were 123deaths compared with 155.58 expected (SMR = 0.79; 95%CI: 0.66, 0.94) [M12]. However, there was a trend (at bor-derline levels of statistical significance) of increasing rectal
ANNEX A: EPIDEMIOLOGICAL STUDIES OF RADIATION AND CANCER 65
UNSCEAR REPORT-PART 1.qxp 10/7/08 2:57 pm Page 65
66 UNSCEAR 2006 REPORT: VOLUME I
cancer mortality with dose in this cohort: the ERR is 1.69(95% CI: –0.12, 5.01) Gy–1 (1-sided p = 0.067) [M12].There was no suggestion of excess cancer incidence rate incomparison with national rates in a group of Canadian radi-ation workers (145 cases observed compared with 199.0expected, SIR = 0.73; 90% CI: 0.63, 0.84), but as for otherend points in this study, there was a very strong trend ofincreasing rectal cancer incidence with external dose: theERR is 13.8 (95% CI: 3.7, 33.6) Sv–1 [S8]. As with the parallel analysis of the mortality data associated with thiscohort [A8], concerns have been expressed about the relia-bility of record linkage, a possible source of bias [G16].
(b) Internal high-LET exposures
195. The International Thorotrast Study [T30] did not findany elevation in rectal cancer mortality risk. There were 8cases in the Thorotrast-exposed group and 7 in the com-parison groups in the Denmark–Sweden part of this study,resulting in an RR estimate of 1.8 (95% CI: 0.6, 5.3) [T30].No rectal (or other organ) dose estimates have been madefor this study, and no trend with administered Thorotrastvolume was reported.
3. Summary
196. There is little or no information on radiation-relatedrisk of rectal cancer at doses of less than about 1 Gy, butit is reasonably clear that there is a radiation-related excessrisk for rectal doses of tens of grays. It is also clear thatthe small intestine, colon and rectum vary greatly in theircarcinogenic responses to ionizing radiation. There are fewdata on risks in relation to anything other than external low-LET exposure.
H. Liver cancer
1. General background
197. There is wide geographical variation in liver cancerincidence rates. The disease is very common in many partsof Asia and Africa, but is infrequent in Western Europe andthe United States [P31]. For example, in parts of Thailand,annual age-standardized world rates are as high as 88.0 and35.4 cases per 105 persons for men and women, respec-tively, but in most of the United States, age-standardizedworld rates are fewer than 5 cases per 105 persons [P19].Overall, primary liver cancer is the fifth most commoncancer worldwide [L72]. Accurate data on primary livercancer are difficult to obtain. Mortality data are unreliablebecause the liver is one of the most frequent sites formetastatic cancer. Up to 50% of liver cancers reported ondeath certificates are metastatic rather than primary livercancers, and tumour registries vary in their success in dis-tinguishing primary and metastatic liver cancers.
198. The great majority of primary liver cancers in adultsare hepatocellular carcinomas (HCCs); about 75–80% ofHCCs are aetiologically associated with chronic infectionwith the hepatitis B virus (HBV) [L72]. Infection with thehepatitis C virus (HCV) is responsible for about 10–20%of viral-associated HCCs, and plays an important role insome countries, notably in Japan. Other aetiological factorsinclude heavy alcohol consumption, liver cirrhosis, the pres-ence of liver flukes and exposure to aflatoxins. HCC is 4–5times more frequent in men than in women.
2. Summary of UNSCEAR 2000
199. The UNSCEAR 2000 Report [U2] had limited dataon liver cancer from external exposures to low-LET radia-tion, but far more information was available on internalhigh-LET exposures from Thorotrast. None of the studieson medically or occupationally exposed populations sug-gested an association between radiation exposure and livercancer once dose–response relationships were examined,although the difficulty in distinguishing primary frommetastatic liver cancers may have obscured any association.
200. The UNSCEAR 2000 Report [U2] stated that theLSS provided the most convincing evidence for excess livercancers following exposure to low-LET radiation. The LSSshowed that liver cancer was the third largest cancer riskdue to radiation, after stomach and lung cancer. A signifi-cant dose response was found for liver cancer, with an ERRof 0.52 Sv–1 for males and 0.11 Sv–1 for females. The rela-tionship was strengthened by the analysis of incidence databased on histologically and clinically verified primary livercancer cases, mostly HCCs [C25]. In the latter study, thedose response was linear and the ERR was estimated to be0.81 Sv–1 (liver dose). Males and females had a similar RRso that, given a threefold higher underlying incidence ratefor males, the radiation-induced excess incidence rate wassubstantially higher for males. The excess risk peaked forthose exposed in their early 20s, with essentially no excessrisk for those exposed before age 10 or after age 45.
201. Studies of Thorotrast-exposed patients consistentlyshowed increased risks of liver cancer due to exposure toalpha radiation, but in contrast to the LSS, the liver cancers associated with Thorotrast exposure were mostcommonly cholangiocarcinoma, followed by angiosarcomaand HCC. There was also an indication that Mayak workers exposed to plutonium had an excess of liver cancer,although the numbers were small and the doses were notwell characterized [G2].
3. New or updated studies
(a) External low-LET exposures
202. Epidemiological data on liver cancer associated withexternal exposure to low-LET radiation continue to be
UNSCEAR REPORT-PART 1.qxp 10/7/08 2:57 pm Page 66
limited. The data available up to the 1990s were presentedin table 9 of the UNSCEAR 2000 Report [U2].
203. Liver cancers following external radiation exposurewere primarily HCCs in the LSS [S70], but in the Thorotraststudies they have consisted mainly of angiosarcomas andcholangiocarcinomas [D36, T30]. The high prevalence ofHBV or HCV infections found in Japan may act as con-founding factors for the radiation effects in the LSS [F13].HCC arises from liver parenchymal cells, while intrahepaticcholangiocarcinomas arise from epithelial cells of the bileduct. It is also likely that the differing histological distri-butions, with a predominance of cholangiocarcinomas,reflect the fact that for Thorotrast patients, areas of the livercontaining bile ducts, from which cholangiocarcinomasarise, receive a daily dose of alpha particle radiation about15 times higher than that received by hepatic cord tissue[D35].
204. In the latest LSS report on cancer mortality [P9],there were 1236 deaths from liver cancer, the leading causeof cancer death after cancers of the stomach and lung. Asignificant dose response is found for liver cancer, with anERR of 0.39 Sv–1 for males and 0.35 Sv–1 for females, bothexposed at age 30 years. Data on risk stratified by sex andspecific age categories, or by specific latency periods, werenot presented.
205. A detailed study of HBV and HCV infections in theLSS showed that both types of viral infection conferred alarge risk for HCC: odds ratio (OR) = 5.5 (95% CI: 2.6,12) and OR = 6.2 (95% CI: 2.8, 14), respectively. Evenwith the strong main effect of HCV infection, among thosewithout cirrhosis there was a statistically significant inter-action with radiation dose such that HCV-infected subjectswere at a 58-fold (95% CI: 2.0, ∞; p = 0.017) higher riskof HCC for a sievert of radiation dose [S70]; such an inter-action was not found for patients with cirrhosis. Regardlessof the presence of cirrhosis, there was little evidence of aninteraction between HBV infection and radiation exposurefor HCC.
206. Also compatible with an interaction between radia-tion and hepatitis infection are data relating clearance ofHBV and radiation exposure [F13]. The presence of bothhepatitis B surface antigen (HBsAg) (indicating currentinfection) and of anti-hepatitis-B core antibody (a markerfor both cured and current infections) increased with radi-ation dose, whereas that of anti-hepatitis-B surface antibody(indicating cured infection) did not. Although these datasuggest that radiation exposure may reduce the likelihoodof clearing a subsequent HBV infection, the authors urgedfurther study.
207. Although not considered in the UNSCEAR 2000Report [U2], the study of Artalejo et al. [A32] reported aslight excess of mortality from liver cancer among workersfor the Spanish Nuclear Energy Board; the SMR was 1.51(95% CI: 0.86, 2.46), but this was based on only 16 cancer
deaths, of which 4 were among the 27% of the cohort whohad been miners and may have been exposed to alpha radi-ation [A32]. Rogel et al. [R54] reported a statistically non-significant deficit of mortality due to liver cancer comparedwith French national mortality rates among radiation work-ers of Électricité de France (3 observed versus 5.0 expecteddeaths; SMR = 0.60; 90% CI: 0.16, 1.54).
(b) Internal low-LET exposures
208. Epidemiological data with regard to liver cancer andinternal low-LET exposures continue to be rare. As sum-marized in the UNSCEAR 2000 Report, in the United Statesthyrotoxicosis study, 21,000 hyperthyroid patients treatedwith 131I were followed up for 45 years; 39 liver cancerdeaths were observed, with an SMR of 0.87 [R3, U2]. Thedoses received by the liver were not estimated but were pre-sumably very low. An increasing, albeit not statistically sig-nificant (p = 0.78), trend in liver cancer mortality with dosewas observed in the study of persons exposed to weaponstest fallout in the Semipalatinsk area of Kazakhstan [B58].The aggregate ERR based on an internal analysis was 0.45(95% CI: –0.18, 1.71) Sv–1; however, when analysis wasrestricted to the exposed group, based on individual doseestimates, the trend estimate was negative, –0.08 (95% CI:–0.41, 1.00) Sv–1. As noted in section II.D, “ecological bias”may operate in this study, so these findings should betreated with caution.
(c) Internal high-LET exposures
209. As noted previously [U2], 232Th is a primordial,alpha-emitting radionuclide with a physical half-life ofmore than 10 billion years. Thorotrast—colloidal (232Th)thorium dioxide—was used widely as an intravascularcontrast agent for angiography in Europe, the UnitedStates and Japan from the late 1920s to 1955. Thorotrastaggregates injected intravascularly tend to be incorporatedinto the tissues of the reticuloendothelial system, mainlythe liver, bone marrow and lymph nodes. Depositionresults in continuous alpha particle irradiation throughoutlife at a low dose rate. The radiation dosimetry is com-plex because of the non-uniform distribution of thoriumdioxide in the liver, bone marrow and lymph nodes [C34].It has been estimated that the typical annual dose fromalpha radiation following an injection of 25 mL ofThorotrast is 0.25 Gy to the liver [K41, M46], but a re-evaluation of liver organ mass has indicated that theannual dose is 0.40 Gy [K42]. A revised whole-body organpartition of 232Th has shown a small reduction in the rel-ative partition to the liver, but the estimated liver doseremains essentially the same [I19]. Patients from the late1920s to 1955 who were administered Thorotrast havebeen followed in Germany, Portugal, Denmark, Sweden,Japan and the United States. The results of studies con-ducted in Germany [V3, V4, V7], Portugal [D15],Denmark [A5, A28, A29] and Japan [M14, M19, M47]were reviewed in detail in the UNSCEAR 2000 Report[U2], and are summarized in table 25.
ANNEX A: EPIDEMIOLOGICAL STUDIES OF RADIATION AND CANCER 67
UNSCEAR REPORT-PART 1.qxp 10/7/08 2:57 pm Page 67
68 UNSCEAR 2006 REPORT: VOLUME I
210. Results describing cancer incidence in the SwedishThorotrast study were recently published [N1], and wereincorporated in a later combined analysis of the Danish,Swedish and United States patients [T30]. The combinedcohort consisted of 3,042 patients who had been injectedduring cerebral angiography with either Thorotrast (n =1,650) or a non-radioactive agent (n = 1,392) and who sur-vived two or more years. SIRs for Thorotrast-exposed (n =1,204) and 1,180 comparison patients (Denmark andSweden) were estimated, and RRs, adjusted for population,age and sex, were calculated with multivariate statisticalmodels. For United States patients (n = 446 exposed, 212not exposed), comparable procedures were used to estimateSMR and RR. In Denmark and Sweden, 136 primary livercancers were diagnosed in the Thorotrast-exposed group andnone in the comparison group (SIR = 108.9; p < 0.05; RR = ∞; 95% CI: 44.2, ∞). RRs were similar for all cancersites for males (RR = 3.6; 95% CI: 2.8, 4.8) and females(RR = 3.3; 95% CI: 2.6, 4.2), but for liver cancer they werenot presented separately for each sex. In the United States,22 deaths due to primary liver cancer were reported amongthe Thorotrast-exposed patients and none in the comparisongroup (SMR = 22.5; 95% CI: 1.8, 464.3). The RR of primaryliver cancers (Sweden and Denmark) increased with timeafter angiography (p < 0.001 for trend), and significantexcesses (SIR = 4.0) persisted for 50 years. The actuarialrisk for all liver cancers after 50 years of follow-upincreased with the amount of Thorotrast injected (68.8%after >20 mL, 68.5% after 11–20 mL and 33.8% after 3–10 mL) (p for non-homogeneity in dose category < 0.0001).Increasing cumulative radiation dose (expressed as volumeof injected Thorotrast in millilitres × max[0, time sinceinjection in years—5 years] × 102) was associated with anincreasing risk of primary liver cancer (p trend = 0.001).
211. As summarized earlier [U2], liver cancer mortality wasstudied among about 11,000 workers exposed to both inter-nally deposited plutonium and to external gamma radiation atthe Mayak nuclear plant in the Russian Federation [G2]. Livercancer risks were elevated among workers with plutoniumbody burdens estimated to exceed 7.4 kBq, compared withworkers with burdens of below 1.48 kBq (RR = 17; 95% CI:8.0, 36), based on 16 deaths in the former group. In addition,trend analyses using plutonium body burden as a continuousvariable indicated an increasing risk with increasing burden(p < 0.001). However, because of limitations in the currentmethodology for plutonium dosimetry, it was possible neitherto quantify liver cancer risks from plutonium exposure interms of organ dose, nor to make a reliable evaluation of therisk from external radiation in this cohort [G2].
4. Summary
212. An association of liver cancer with radiation expo-sure has not been demonstrated in studies of groups ofpeople medically or occupationally exposed to external orinternal doses of low-LET radiation. However, the updatedmortality data from the LSS of survivors of the atomic
bombings continue to indicate a strong dose response (p < 0.001). Studies of Thorotrast-exposed patients consis-tently show increased risks of liver cancer that persist for50 years due to alpha particle radiation exposure.
213. While the most frequent type of liver cancer associ-ated with Thorotrast exposure is typically cholangiocarci-noma, followed by angiosarcoma and hepatocellularcarcinoma, the excess risk associated with low-LET radia-tion exposure among the survivors of the atomic bombingsis primarily expressed as HCC. Underlying rates of livercancer are high in Japan, especially among males, and thehigh rates have been attributed to hepatitis viral infection,particularly infection with HCV. In transferring liver cancerrisk estimates from one population to another, differencesin the underlying liver cancer rates, as affected by the preva-lence of hepatitis viral infection, should be considered. Thesignificant interaction between radiation dose and HCVinfection in the development of liver cancer among patientswithout cirrhosis merits further study.
I. Pancreatic cancer
1. General background
214. The pancreas consists of two separate functional enti-ties—an endocrine portion that produces (most importantly)insulin and glucagon, and an exocrine organ that is an inte-gral part of the digestive system, producing enzymes suchas trypsin, chymotrypsin, amylase and lipase [A33]. Cancerof the pancreas can be considered virtually synonymous withexocrine adenocarcinoma of the pancreas, since endocrineneoplasms are relatively rare [A33]. Pancreatic cancer is oneof the most rapidly fatal cancers, and its presentation andcourse are marked by severe pain. There is less than a 20%chance of surviving one year from diagnosis [A21, A33].However, pancreatic cancer is relatively rare, with annualage-standardized world rates generally fewer than 10 casesper 105 persons for both men and women [P19]. There isrelatively small variation in incidence rates between coun-tries, or between men and women, with age-standardizedworld rates ranging from about 1 case per 105 persons inparts of Africa and Asia to about 15 cases per 105 personsamong some male United States black populations [P19].Pancreatic cancer incidence and mortality rates increased inthe United States between 1920 and 1965 [K51], but rateshave been largely stable since then [A21]. The most con-sistent risk factor for pancreatic cancer is smoking, but diet,and in particular dietary fat, coffee and alcohol consump-tion, has also been indicated as a risk factor [A33].
2. Summary of UNSCEAR 2000
215. Pancreatic cancer was not considered in theUNSCEAR 2000 Report [U2].
UNSCEAR REPORT-PART 1.qxp 10/7/08 2:57 pm Page 68
3. New or updated studies
(a) External low-LET exposures
216. As shown in table 26, there is no statistically sig-nificant excess pancreatic cancer mortality or incidence inthe LSS [P9, P48]. For example, 163 deaths from pancre-atic cancer were recorded in the LSS up to 1997 [P9].Preston et al. [P9] report an ERR for pancreatic cancer inmales of –0.11 (90% CI: <–0.3, 0.44) Sv–1, and an ERR forfemales of –0.01 (90% CI: –0.28, 0.45) Sv–1. The same istrue for many other groups. In a case-control study ofwomen receiving radiation treatment for cervical cancer,there was an OR for radiation exposure of 1.39 (90% CI:0.7, 2.7), equivalent to an ERR of 0.21 (90% CI: –0.16,0.89) Gy–1 (table 26) [B8]. There was no statistically sig-nificant (p = 0.37) trend of OR with dose in this study [B8].In a cohort of British radiologists, there was a statisticallysignificant SMR among the “earliest entrance group” (thosefirst registered in the period 1897–1920), when presumablydoses would have been highest (5 deaths versus 1.29expected, SMR = 3.88) (2-sided p < 0.05); there was nostatistically significant excess among the radiologists regis-tering after 1920 [B2]. The United States peptic ulcer studydemonstrated a strong exposure-related increase in pancre-atic cancer mortality; the ERR was 0.04 (95% CI: 0.0, 0.08)Gy–1 [C4]. However, when attention was restricted toexposed patients only, there was no evidence of a positivetrend: the ERR was –0.03 (95% CI: –0.10, 0.05) Gy–1 [C4].This lack of dose response is possibly a consequence of thehigh doses and generally narrow spread of doses receivedby the exposed group of patients [C4]. Inskip et al. analysedcancer mortality in a group of women treated with intrauter-ine 226Ra capsules for uterine bleeding, and did not observeany statistically significant excess risk of pancreatic cancerwith dose: the ERR was 0.14 (90% CI: –2.76, 28.84) Gy–1
[I4]. A large and highly statistically significant trend ofincreasing pancreatic cancer incidence with radiation dosewas observed in a Swedish group treated for haemangiomain infancy: the ERR was 25.1 (95% CI: 5.5, 57.7) Gy–1
[L10]. However, this finding was based on only 9 tumours,and as the authors note, might well be due to chance. Astudy of benign breast disease among Swedish womenobserved a negative trend of pancreatic cancer mortalitywith dose, based on 30 deaths (14 in the exposed group, 16 in the unexposed group): the ERR was –0.37 (95% CI:<–0.37, 0.8) Gy–1 [M3].
217. There was a trend of increasing pancreatic cancermortality risk with cumulative film badge dose thatapproached conventional levels of statistical significance (1-sided p = 0.07) among workers at the Hanford site in theUnited States [G10]. The authors were inclined to treat theassociation as spurious, in view of the large number of endpoints studied and the lack of any prior basis for assuminga risk of pancreatic cancer [G10]. Combined analysis of thedata on the Hanford, Oak Ridge National Laboratory andRocky Flats weapons plant workforces in the United Statesdid not indicate any statistically significant excess risk of
pancreatic cancer mortality, and in particular no statisticallysignificant trend in risk with dose [G8].
218. A large and (for males) statistically significantexcess pancreatic cancer incidence has been seen in theCanadian National Dose Registry [S8]. The ERR for maleswas 9.2 (90% CI: 0.10, 36.8) Sv–1, based on 58 cases; formales and females combined, the ERR was 6.9 (90% CI:<0, 27.1) Sv–1, based on 76 cases. An increase of similarmagnitude, although not statistically significant, wasobserved for males in the parallel mortality data, fromwhich the ERR was 7.3 (90% CI: –4.4, 19.0) Sv–1, basedon 72 deaths [A8]. There was no suggestion of an increasedrisk for females from these data: the ERR was –0.2 (90%CI: –18.7, 18.3) Sv–1, based on 15 deaths [A8]. As notedin section II.E above, similarly elevated ERRs per unit dosewere found for many other cancer end points and for causesof death that included infectious diseases and accidentaldeaths, thus raising the question of bias in this study.
219. There was no statistically significant trend in pan-creatic cancer mortality with cumulative film badge dose ina stratified cohort of United Kingdom radiation workers:the ERR was –0.003 (90% CI: –1.12, 2.31) Sv–1, based on129 deaths [M12].
220. There was a positive, but not statistically significant(1-sided p = 0.115), trend in pancreatic cancer mortalitywith radiation dose for the IARC three-country nuclearworker study [C3], based on 191 deaths from pancreaticcancer.
221. There was excess mortality due to pancreatic cancerat borderline levels of statistical significance compared withFrench national mortality rates among radiation workers ofÉlectricité de France (11 observed versus 6.6 expecteddeaths; SMR =1.66; 90% CI: 0.93, 2.74) [R54].
(b) Internal low-LET exposures
222. There was no statistically significant excess of pan-creatic cancer mortality in the United States thyrotoxicosisstudy, with 161 deaths versus 153.13 expected [R3]. Therewere no statistically significant trends in pancreatic cancerwith administered 131I in this study [R3].
(c) Internal high-LET exposures
223. There was a statistically significant increasing riskof pancreatic cancer mortality with increasing cumulativeradon daughter exposure in a combined cohort of 11 groupsof underground miners (p < 0.05); the ERR was 0.07% perworking level month (WLM) (95% CI: 0.01, 0.12) [D10].However, as there is little previous epidemiological basisfor an association of pancreatic cancer with radon daugh-ter exposure, and as this was the only one of 28 examinedcancer sites to yield a statistically significant increased risk, the authors were inclined to view this as a chance finding [D10].
ANNEX A: EPIDEMIOLOGICAL STUDIES OF RADIATION AND CANCER 69
UNSCEAR REPORT-PART 1.qxp 10/7/08 2:57 pm Page 69
70 UNSCEAR 2006 REPORT: VOLUME I
224. A statistically significant increase in pancreatic cancermortality was observed among workers at a thorium pro-cessing plant (5 cancers observed, 1.21 expected; SMR =4.13; 95% CI: 1.34, 9.63) [P37]. However, as with all stud-ies involving occupational exposure to radiation, compar-isons with cancer rates for the general population (whichincludes both workers and non-workers) may be misleading.Given the absence of information about risk in relation tocumulative exposure, it is difficult to interpret this finding.
225. Cancer incidences in a combined cohort of Danish,Swedish and United States patients given the diagnosticcontrast medium Thorotrast have recently been published[T30]. The combined cohort consisted of 3,042 patients whohad been injected during cerebral angiography with eitherThorotrast (n = 1,650) or a non-radioactive agent (n =1,392)and who survived two or more years. A total of 14 pan-creatic cancer cases were observed in the Thorotrast-exposed group, and 8 in the comparable control group.There were marginally statistically significant (p = 0.07)trends of increasing pancreatic cancer incidence with timeafter injection of Thorotrast, and (p = 0.05) with [injectedThorotrast volume] × [time since injection] [T30].
4. Summary
226. There is little, if any, evidence for associationsbetween pancreatic cancer and radiation dose, whether inrelation to external or internal low-LET radiation, or tointernal high-LET radiation.
J. Cancers of the trachea, bronchus and lung
1. General background
227. Lung cancer is both the most common malignant dis-ease and the leading cause of cancer mortality worldwide.Rates tend to be higher in developed countries and lowerin developing countries. For example, in parts of the UnitedStates, annual age-standardized world rates are as high as107.0 and 40.8 cases per 105 persons for men and women,respectively, but in most of Africa and South Asia, ratesare fewer than 15 cases per 105 persons [P19]. The widerange of geographical, temporal and sex differences in lungcancer mortality largely reflect variations in patterns of cig-arette smoking, the main cause of the disease. Lung cancerincidence has increased rapidly since the beginning of the20th century, but lung cancer mortality in males has begunto decline in several countries, including the United States,the United Kingdom and Finland. In most countries, lungcancer incidence rates are higher among people of lowersocio-economic classes, probably because of differences insmoking prevalence. Lung cancer has also been linked withexposure to asbestos, with air pollution and with low consumption of vegetables and fruits [B34, S59].
228. Ionizing radiation has been linked with cancers ofthe trachea, bronchus and lung in numerous epidemiologi-cal studies. Dose–response relationships have been demon-strated for exposure to low-LET radiation, and also forexposure to inhaled high-LET alpha emitters, includingradon (and its progeny) and plutonium.
2. External low-LET exposures
(a) Summary of UNSCEAR 2000
229. Lung cancer has been strongly linked with radiationexposure in several studies, including those of the LSScohort of survivors of the atomic bombings in Japan. Cancerincidence data from the LSS cohort for the period1958–1987 indicated that the dose response was consistentwith linearity, that the ERR (Sv–1) for females was nearlyfour times that for males, and that there was little evidencethat the ERR depended on either age at exposure or attainedage [T1]. Results based on mortality data [P1] were simi-lar, although the ratio of risk for females compared withthat for males was not as striking. The analyses noted abovedid not take account of smoking habits. Efforts to do so[K35, P26, U2] suggested that the effect of the interactionof smoking and radiation was better described by an addi-tive model than a multiplicative one, but could not defini-tively distinguish between the two models.
230. Lung cancer risk has been linked with radiation instudies of patients treated with radiation for ankylosingspondylitis and in patients receiving radiotherapy forHodgkin’s lymphoma. A noteworthy finding from the anky-losing spondylitis study was the decline in the RR 25 yearsafter the first treatment [W8]. A limitation of this study isthat data on smoking habits were not available. In a case-control study of lung cancer among Hodgkin’s lymphomapatients, van Leeuwen et al. [V2] found a statistically sig-nificant supramultiplicative effect of radiation and smokingbased on small numbers (30 cases, of whom 8 were eithernon-smokers or light smokers).
231. The UNSCEAR 2000 Report [U2] provided adetailed discussion of studies of lung cancer mortalityamong patients who received multiple fluoroscopies in thecourse of treatment for tuberculosis in Canada [H7] and theUnited States (Massachusetts) [D4]. The lung doses, meanage at exposure and follow-up were similar to those in theLSS cohort. Neither study found evidence of an associationbetween lung cancer mortality and radiation dose. TheCanadian study was large enough (25,000 subjects withlung doses in excess of 10 mSv) to demonstrate that esti-mates of the ERRs per unit dose were incompatible withthose based on LSS data. These studies are importantbecause, in contrast to the LSS cohort, in these cases theexposure was protracted. Howe [H7] explored severalsources of potential bias, including dose measurement error,misclassification of lung cancer deaths as deaths from tuber-culosis, smoking habits, differences in underlying rates, and
UNSCEAR REPORT-PART 1.qxp 10/7/08 2:57 pm Page 70
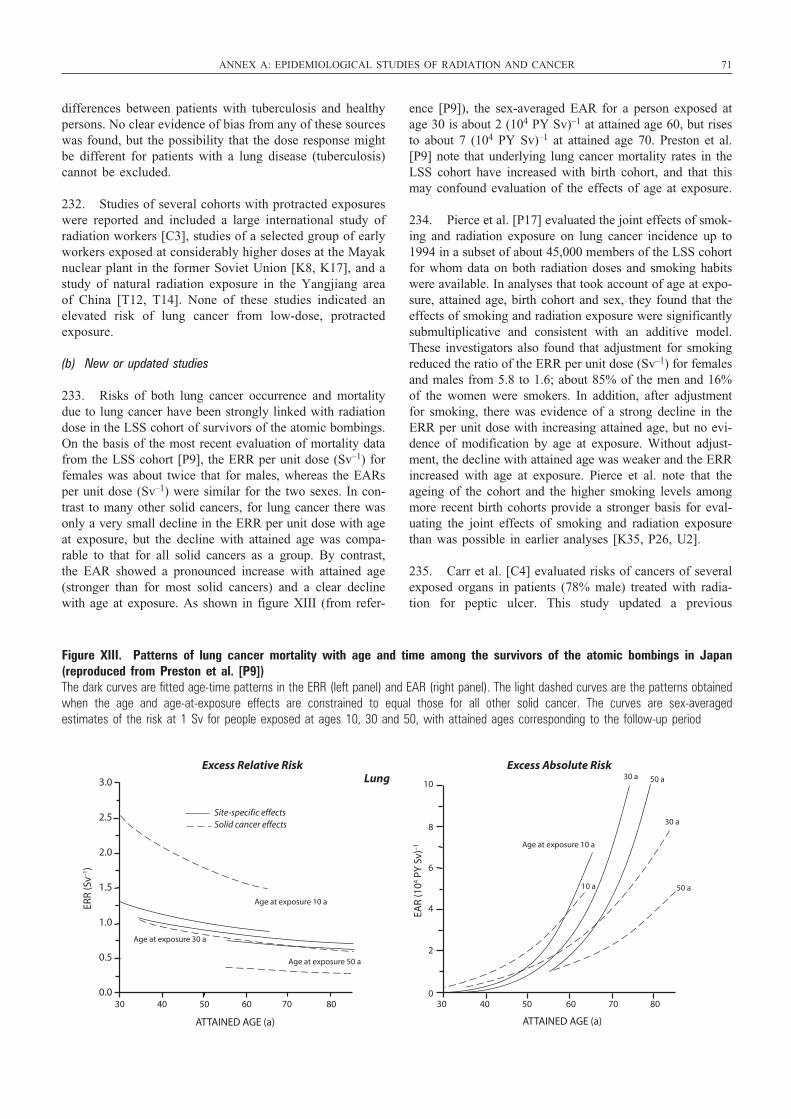
differences between patients with tuberculosis and healthypersons. No clear evidence of bias from any of these sourceswas found, but the possibility that the dose response mightbe different for patients with a lung disease (tuberculosis)cannot be excluded.
232. Studies of several cohorts with protracted exposureswere reported and included a large international study ofradiation workers [C3], studies of a selected group of earlyworkers exposed at considerably higher doses at the Mayaknuclear plant in the former Soviet Union [K8, K17], and astudy of natural radiation exposure in the Yangjiang areaof China [T12, T14]. None of these studies indicated anelevated risk of lung cancer from low-dose, protractedexposure.
(b) New or updated studies
233. Risks of both lung cancer occurrence and mortalitydue to lung cancer have been strongly linked with radiationdose in the LSS cohort of survivors of the atomic bombings.On the basis of the most recent evaluation of mortality datafrom the LSS cohort [P9], the ERR per unit dose (Sv–1) forfemales was about twice that for males, whereas the EARsper unit dose (Sv–1) were similar for the two sexes. In con-trast to many other solid cancers, for lung cancer there wasonly a very small decline in the ERR per unit dose with ageat exposure, but the decline with attained age was compa-rable to that for all solid cancers as a group. By contrast,the EAR showed a pronounced increase with attained age(stronger than for most solid cancers) and a clear declinewith age at exposure. As shown in figure XIII (from refer-
ence [P9]), the sex-averaged EAR for a person exposed atage 30 is about 2 (104 PY Sv)–1 at attained age 60, but risesto about 7 (104 PY Sv)–1 at attained age 70. Preston et al.[P9] note that underlying lung cancer mortality rates in theLSS cohort have increased with birth cohort, and that thismay confound evaluation of the effects of age at exposure.
234. Pierce et al. [P17] evaluated the joint effects of smok-ing and radiation exposure on lung cancer incidence up to1994 in a subset of about 45,000 members of the LSS cohortfor whom data on both radiation doses and smoking habitswere available. In analyses that took account of age at expo-sure, attained age, birth cohort and sex, they found that theeffects of smoking and radiation exposure were significantlysubmultiplicative and consistent with an additive model.These investigators also found that adjustment for smokingreduced the ratio of the ERR per unit dose (Sv–1) for femalesand males from 5.8 to 1.6; about 85% of the men and 16%of the women were smokers. In addition, after adjustmentfor smoking, there was evidence of a strong decline in theERR per unit dose with increasing attained age, but no evi-dence of modification by age at exposure. Without adjust-ment, the decline with attained age was weaker and the ERRincreased with age at exposure. Pierce et al. note that theageing of the cohort and the higher smoking levels amongmore recent birth cohorts provide a stronger basis for eval-uating the joint effects of smoking and radiation exposurethan was possible in earlier analyses [K35, P26, U2].
235. Carr et al. [C4] evaluated risks of cancers of severalexposed organs in patients (78% male) treated with radia-tion for peptic ulcer. This study updated a previous
ANNEX A: EPIDEMIOLOGICAL STUDIES OF RADIATION AND CANCER 71
3.0
2.5
2.0
1.5
1.0
0.5
0.0 30 40 50 60 70 80
ATTAINED AGE (a)
ERR
(Sv–1
)
EAR
(104 P
Y S
v)–1
10
8
6
4
2
0 30 40 50 60 70 80
ATTAINED AGE (a)
Excess Relative Risk Excess Absolute Risk
Age at exposure 10 a
Age at exposure 30 a
Age at exposure 50 a
Site-specific effectsSolid cancer effects
Age at exposure 10 a
30 a
50 aLung 30 a
50 a10 a
Figure XIII. Patterns of lung cancer mortality with age and time among the survivors of the atomic bombings in Japan(reproduced from Preston et al. [P9]) The dark curves are fitted age-time patterns in the ERR (left panel) and EAR (right panel). The light dashed curves are the patterns obtainedwhen the age and age-at-exposure effects are constrained to equal those for all other solid cancer. The curves are sex-averaged estimates of the risk at 1 Sv for people exposed at ages 10, 30 and 50, with attained ages corresponding to the follow-up period
UNSCEAR REPORT-PART 1.qxp 10/7/08 2:57 pm Page 71
72 UNSCEAR 2006 REPORT: VOLUME I
analysis by Griem et al. [G6], and the number of lung cancerdeaths increased from 99 to 125. Lung cancer mortality riskwas significantly elevated compared with the risk amongpatients who were not treated with radiation, but there wasno evidence of a dose response from analyses that wererestricted to exposed subjects. Evaluation of the interactionof smoking and radiation exposure indicated that the datawere compatible with a multiplicative interaction model.
236. Lung cancer risks were addressed in two recent case-control studies of Hodgkin’s lymphoma patients and onesuch study of breast cancer patients. Swerdlow et al. [S60]conducted a case-control study that included 88 lung cancercases and 176 matched control subjects with Hodgkin’slymphoma treated in the United Kingdom. No estimates ofradiation doses were made, and data on smoking habits wereavailable for only 39% of the subjects. There was no sig-nificant relation between risk and “radiation volume”, usedas a surrogate for radiation dose.
237. Travis et al. [T3] conducted an international population-based lung cancer case-control study thatincluded 222 cases and 444 matched controls. Strengths ofthis study were the existence of dose estimates for the spe-cific site of the lung tumour (or comparable location inmatched controls), and of detailed data on both chemother-apy and tobacco use. The study showed a clear increase inrisk with increasing dose after adjustment for chemother-apy and smoking habits, and suggested a multiplicativeinteraction of radiation exposure and smoking.
238. Gilbert et al. [G23] conducted additional analysesaddressing the radiation effect on the basis of the 199 casesand 393 controls from the study by Travis et al. [T3] withadequate radiation dosimetric data and an additional 28cases and 62 controls from a previous case-control study byvan Leeuwen et al. [V2] (summarized in reference [U2]).There was little evidence of a departure from linearity orof modification in the ERR per unit dose (Gy–1) with sex,time since exposure (after an initial 5-year latency period),age at Hodgkin’s lymphoma diagnosis, or age at lung cancerdiagnosis. There was evidence of a significant radiationdose response for all histopathological types of lung cancerevaluated (squamous cell, small cell, adenocarcinoma andlarge cell), and little evidence that the ERR per unit dosevaried with type. The interaction of radiation exposure andsmoking was consistent with a multiplicative relationship,but not with an additive one (p < 0.001). In contrast, theinteraction of radiation exposure and chemotherapy wasfound to be well described by an additive relationship. Theauthors caution that the relevance of these findings for otherpopulations may be limited owing to the very high doses(mean dose of 25 Gy) and the immunodeficiency inherentto Hodgkin’s lymphoma and associated with chemotherapy.
239. Ford et al. [F15] conducted a case-control study (280cases and 300 controls) of patients treated for breast cancerat the M.D. Anderson Cancer Center at the University ofTexas in the United States. Their analyses suggest a
supramultiplicative interaction between radiotherapy treat-ment and smoking. The study did not include quantitativeinformation on either radiation exposure or smoking habits,and also did not consider possible modification of the risksby the length of period between breast and lung cancer diagnosis (latency), which was 0.5 to 10 years for 55% ofthe cases.
240. Zablotska and Neugut [Z8] conducted a cohort studyusing data from the SEER registry in the United States toinvestigate lung cancer incidence in groups of womentreated for breast cancer with radiotherapy. After 10 yearsof follow-up, risk to the ipsilateral lung was significantlyelevated for women treated after mastectomy (table 27), butnot for women treated after lumpectomy, where doses tothe lung are likely to have been much lower.
241. Several investigators have evaluated lung cancermortality in a cohort of Russian workers at the Mayaknuclear facility. A difficulty in estimating the effects of theprotracted external doses for this cohort is that many work-ers also received large doses from internal plutonium expo-sure, and only 40% of these workers were monitored forthis exposure. Early analyses reviewed in reference [U2]showed little evidence of a relationship between lung cancerrisks and external dose [K8, K17]. More recently,Kreisheimer et al. [K34] analysed data on 4,212 male work-ers in the main plants at the Mayak facility who were hiredin the early period of operations (1948–1958) and for whomdoses to the lung from exposure to plutonium could be esti-mated either because they had been monitored or becausethey had no potential for plutonium exposure. Using analy-ses that were adjusted for the lung dose due to plutonium,these authors found no significant association between lungcancer mortality and external dose.
242. Gilbert et al. [G12] evaluated lung cancer risk for agroup of 21,790 Mayak workers, expanding the group eval-uated in reference [K34] by adding females, persons hiredin the period 1959–1972, auxiliary plant workers (with littlepotential for exposure) and workers potentially exposed toplutonium who were not monitored for this exposure. Toadjust for plutonium exposure in the last group, a surrogatemeasure based on occupational histories was developed.These investigators found a highly significant dose responsefor external dose (p < 0.001). There was no evidence thatthe ERR per unit dose (Gy–1) depended on sex, age at hireor attained age, although the power to address this was lim-ited. An estimate for ERR per unit dose based only onworkers whose doses due to plutonium could be estimatedwas 0.10 (<0, 0.29), similar to that obtained by Kreisheimeret al. [K34]. The authors note the possibility of bias due toinadequate adjustment for plutonium exposure, which mightresult from uncertainties in estimating doses due to pluto-nium as well as from using the surrogate measure. Parallelanalyses of Mayak workers (external dose) and the LSScohort indicated that both the level of risk and the patternsof risk for the ERR and EAR with sex and attained agewere remarkably similar in the two cohorts.
UNSCEAR REPORT-PART 1.qxp 10/7/08 2:57 pm Page 72
243. Studies of nuclear workers exposed to low radiationdoses generally provide little evidence of a dose responsefor lung cancer; this may be due to limited statistical power.In addition to the large international [C3, C41] and NRRW(United Kingdom) [M12] studies, recent studies of nuclearpower industry workers in the United States [H44] andJapan [I14] showed no evidence either of excess risk incomparison with the general population or of dose responsefor lung cancer. Although the estimates of ERRs per unitdose (Sv–1) for lung cancer [S8] and lung cancer mortality[A8] from the Canadian National Dose Registry were large,as noted in section II.E above, similarly elevated ERRs perunit dose (Sv–1) were found for many other causes of death,which included infectious diseases and accidental deaths,thus raising the question of serious bias in this study.
244. Although not reported in the UNSCEAR 2000Report [U2], the study of Artalejo et al. [A32] reported aslight deficit of lung cancer mortality among workers forthe Spanish Nuclear Energy Board; the SMR was 0.98 (95%CI: 0.71, 1.31), based on 45 cancer deaths, of which 24were among the 27% of the cohort who had been minersand may have been exposed to alpha radiation [A32]. Rogelet al. [R54] reported a statistically significant deficit of mor-tality due to lung cancer compared with French nationalmortality rates among radiation workers of Électricité deFrance (23 observed deaths versus 47.5 expected; SMR =0.48; 90% CI: 0.33, 0.69); there was no statistically signif-icant trend in respiratory cancer mortality with dose (ERR= 0.1 (90% CI: –7.5, 17.4) Sv–1).
245. In a study of United States medical radiologic tech-nologists, lung cancer mortality risk was not elevated com-pared with that of the general population, and there was noevidence of trends with either the length of radiation workor the year of first employment [M31]. The analyses werecontrolled for smoking habits as well as attained age, calen-dar year, race and sex. Lung cancer incidence was not ele-vated [S29]. Doses were not available for this study. A recentupdate of a study of cancer incidence among medical X-rayworkers in China found elevated lung cancer risks in com-parison with a control population of surgeons, physicians andotolaryngologists [W3]. However, the excess was largest forthose workers who began their employment after 1970, whendoses would have been smaller than in the earlier period. Theauthors note that their findings may be due to factors otherthan radiation exposure, such as smoking. The latest updateof the mortality study of radiologists in the United Kingdomfound excess lung cancer mortality among radiologists whohad first registered before 1920 (based on 7 deaths), but noexcess among those first registered in later years [B2].
3. Internal low-LET exposures
(a) Summary of UNSCEAR 2000
246. Studies of persons treated with 131I were reviewed.Little evidence of excess risk was found, possibly because
doses to the lung were low. Studies of cancer incidence nearthe Three Mile Island nuclear plant in the United Stateswere also reviewed, with the conclusion that such studieswere uninformative regarding radiation and lung cancer, andfailed to provide convincing evidence that radionuclidesreleased as a result of the accident contributed to lungcancer risk.
(b) New or updated studies
247. An increasing and highly statistically significant (p = 0.0001) trend of lung cancer mortality with dose wasobserved in the study of persons exposed to weapons testfallout in the Semipalatinsk area of Kazakhstan [B58]. Theaggregate ERR based on an internal analysis was 2.60 (95%CI: 1.38, 4.63) Sv–1; when analysis was restricted to theexposed group, based on individual dose estimates, the trendestimate was somewhat reduced, 1.76 (95% CI: 0.48, 8.83)Sv–1. As noted in section II.D, “ecological bias” may operate in this study, so these findings should be treatedwith caution.
4. Internal high-LET exposures (plutonium)
(a) Summary of UNSCEAR 2000
248. Studies of workers at the Mayak nuclear plantdemonstrated clear evidence of a dose response for expo-sure to plutonium [K8, K17]. Studies of workers exposedto plutonium at the Sellafield plant in the United Kingdom[O1] and at Los Alamos National Laboratory in the UnitedStates [W6] failed to provide evidence of plutonium-relatedlung cancer risk, a finding that may be due to the relativelylow doses and limited statistical power in these studies. Theinternal doses due to plutonium for workers in the UnitedKingdom and the United States were far lower than forworkers at Mayak.
(b) New or updated studies
249. Three new analyses of data on workers at the Mayaknuclear plant quantify lung cancer mortality risk as a func-tion of dose to the lung, and make use of improved inter-nal dose estimates that became available in the year 2000.As noted above, Kreisheimer et al. [K34] evaluated lungcancer risks for a subcohort of Mayak workers whose plu-tonium doses could be estimated and who were hired in theperiod 1948–1958. In analyses that were adjusted for bothexternal dose and smoking habits (i.e. yes or no), a lineardose–response relationship was found to describe the datawell. Gilbert et al. [G12] evaluated a larger group of work-ers (see above), although the evaluation of the plutoniumdose response was necessarily based on those workers whoseplutonium doses could be estimated. These investigatorsconfirmed the good fit of the linear model, and the estimatedERR per unit dose was similar to that obtained byKreisheimer et al. They also fitted EAR models, and eval-uated the modifying effects of sex, age at hire, attained age
ANNEX A: EPIDEMIOLOGICAL STUDIES OF RADIATION AND CANCER 73
UNSCEAR REPORT-PART 1.qxp 10/7/08 2:58 pm Page 73
74 UNSCEAR 2006 REPORT: VOLUME I
and time since exposure on both the ERR and the EAR. TheERR per unit dose for females was about 4 times higherthan that for males, whereas the EAR (expressed as excessdeaths for 104 PY Gy) for females was less than half thatfor males. The ERR per unit dose showed a strong declinewith attained age, whereas the EAR increased with attainedage until about age 65 and then decreased. Neither the ERRnor the EAR depended on age at hire. The ratio of coeffi-cients for the effects of the internal dose due to plutoniumand the external dose (i.e. the RBE) was estimated to be 33(95% CI: 14, 98). Parallel analyses of Mayak workers, forwhom plutonium dose estimates were adjusted by the qual-ity factor of 20 recommended by the ICRP, and the LSScohort indicated that the ERRs were reasonably similar inthe two cohorts, although the decline with attained age wasnot observed in the LSS cohort. However, the pattern of theEAR with attained age was markedly different in the twocohorts. At younger ages (under 65 years), the EAR washigher for the Mayak workers, whereas at older ages, theEAR was higher for the LSS cohort. Comparisons were alsomade with risks observed for 11 cohorts of undergroundminers exposed to radon [C36]. The overall level of risk wascompatible for the two types of exposure, and the decline inthe ERR with attained age was very similar. After account-ing for the effect of attained age, there was no evidence fromthe Mayak workers of the decline with time since exposurethat was observed in the study of underground miners.However, this may have been because it was not possibleto measure the pattern of lung dose accumulation due to plu-tonium in individual workers. Jacob et al. [J10] analysed thedata using a two-stage “clonal expansion” model. In contrastto the other two analyses, the preferred model in this analy-sis was submultiplicative in the RRs due to smoking and toplutonium radiation dose, and resulted in a markedly lowerestimate of the ERR per unit dose.
250. Wing et al. [W22] examined cancer risks in relationto work involving potential exposure to plutonium at theHanford site in the United States. They used information onwork location and job title to assess the likelihood of plu-tonium exposure. For most end points evaluated, includinglung cancer, risks were significantly lower for workersjudged to have potential plutonium exposure than for work-ers with no such potential. However, at ages 50 and above,the duration of employment in jobs with potential for plu-tonium exposure was found to be associated with mortalitydue to several other disease categories, with that due to lungcancer showing the largest increase. Because Wing et al.considered several alternative age cut-offs, this finding maybe due to chance. Since workers with potential for exposureto plutonium were supposed to be monitored for this expo-sure, it is not clear whether the surrogate measure of pluto-nium exposure used was meaningful. No analyses of lungcancer risks in relation to plutonium monitoring data werereported, and no data on smoking habits were available.
251. Brown et al. [B35] conducted a case-control studyfor lung cancer among plutonium workers at the RockyFlats plant in the United States. Annual doses to the lung
due to plutonium, americium and uranium were estimatedfor the 180 cases and 720 matched controls included in thisstudy, with most plutonium doses in the range 0–1 Sv.There was no evidence of increased risks from exposure toamericium or uranium. Analyses of the cumulative dose dueto plutonium using lag periods of 5, 10 and 15 yearsresulted in elevated (usually non-significantly) odds ratiosfor several dose categories, but did not show a consistentincrease in risk with increasing dose. Because of concernregarding a differential healthy worker effect depending onduration of employment, analyses for three separate cate-gories of employment duration were performed. Analysesrestricted to those employed for 15–25 years produced asignificant dose response, but analyses based on thoseemployed for shorter or longer periods indicated no evi-dence of a dose response (the direction of the trend wasnegative). The results of trend tests were occasionally noted,but risk estimates per unit dose were not presented.Although Brown et al. allude to supplementary analyses thatwere adjusted for smoking, analyses presented in the paperwere not so adjusted.
5. Internal high-LET exposures (Thorotrast and radium)
(a) Summary of UNSCEAR 2000
252. Studies of persons exposed to Thorotrast and 224Rawere summarized and found to provide little evidence ofelevated risks of lung cancer. The statistical precision inthese studies was limited by the small numbers of lung cancers.
(b) New or updated studies
253. Travis et al. [T30] studied patients injected withThorotrast during radiographic procedures in Denmark,Sweden and the United States. The lung cancer incidencerate among Thorotrast-exposed patients in Denmark andSweden was significantly elevated compared with incidencerates among the general population, but not in comparisonwith that in a control group. Lung cancer mortality rates inUnited States patients were non-significantly elevated inrelation to both the general population and the controlgroup. There was also no evidence of a trend of increasinglung cancer risk with a surrogate measure of cumulativeradiation dose.
6. Internal high-LET exposures (radon)
(a) Summary of UNSCEAR 2000
254. The UNSCEAR 2000 Report [U2] summarized theresults of various epidemiological studies of undergroundminers and of people exposed in residences, as well as manyrelevant biological data, and concluded that there was strongevidence for an association between lung cancer risk andexposure to radon daughters.
UNSCEAR REPORT-PART 1.qxp 10/7/08 2:58 pm Page 74
255. In particular, the results of a comprehensive analy-sis of miners conducted by the BEIR VI Committee [C36]were reviewed in the UNSCEAR 2000 Report [U2].Summary data are given in table 28. The BEIR VICommittee re-examined the pooled data from 11 cohortstudies of radon-exposed miners by Lubin et al. [L8],including updated data from China, the Czech Republic,France and the United States (Colorado Plateau) (see table10 in reference [U2]). The BEIR VI models were based ona linear ERR model, but incorporated adjustments foreffects of the time since exposure by differentially weight-ing exposures to radon received 5–14 years, 15–24 yearsand 25 or more years earlier. The models also allowed forvariation in the exposure–response effects with attained age,with duration of exposure or with average radon concen-tration. The BEIR VI Committee derived two separatemodels, designated the “exposure–age–duration” model andthe “exposure–age–concentration” model, but proffered nopreference [C36]. The pooled data included nearly 1.2 mil-lion person-years of follow-up, from which there were 2,674lung cancer deaths among workers with prior radon expo-sure, and 113 lung cancer deaths among workers withoutprior radon exposure. The large number of cases permitteddetailed examination of many factors that may modify therisk of radon-induced lung cancer. The ERR per unit radonexposure (WLM–1) decreased with increasing time sinceexposure and attained age, and with increasing averageradon concentration (the exposure–age–concentrationmodel) or with decreasing duration of exposure (the expo-sure–age–duration model). There was no variation in theERR per unit radon exposure (WLM–1) with age at firstexposure; however, except for the cohort of Chinese tinminers, the range of ages at first exposure was limited, withmean age at first exposure more than 25 years in all cohorts.The joint effect of radon exposure and smoking on lungcancer risk was evaluated for six cohorts where informationon smoking habits was available. The joint association forthe RR was greater than additive and less than multiplica-tive, although the precise modelling of the joint effects wasdifficult to quantify definitively owing to the small numberof miners who had never smoked and to the limited quan-titative information on tobacco use. On the basis of differ-ences in ERR per unit radon exposure (WLM–1) in“ever-smoker” and “never-smoker”, the BEIR VI Com-mittee assigned a twofold greater ERR for never-smokers.Any modifying effects of exposure to other agents encoun-tered in mines were not clear, although the ERR per unitradon exposure was lower after adjusting for arsenic expo-sure [L8]. Because of an absence of data, effects of radonexposure for females could not be evaluated.
(b) New or updated studies
256. Since the BEIR VI Report appeared, follow-ups ofseveral of the miner cohorts have been extended andreanalysed, and new analyses have been conducted onrelated populations. A nested case-control study of lungcancer was selected from a cohort of non-smoking minersemployed in the uranium mining industry of the Colorado
Plateau region [G3]. Results for non-smokers were consis-tent with results from the Colorado Plateau and NewMexico cohort studies in the United States, and showedincreased lung cancer risk with radon exposure (WLM), aswell as evidence of a decreasing radon exposure–responserelationship with increased exposure rate. Tomasekanalysed the S (older, higher-exposed) and N (new, lower-exposed) cohorts of the Czech miner study [T33]. Thesedata extend the follow-up of a subset of the Czech cohortincluded in the pooled analysis to the end of 1999. Resultsshowed decreasing risk with time since exposure and withage at exposure, and a (non-significant) twofold greaterERR per unit radon exposure (WLM–1) for non-smokers.Investigators added six years of follow-up to the Frenchuranium miner cohort, identifying a total of 125 lung cancerdeaths, nearly tripling the number of lung cancer deaths thecohort contributed to the pooled analysis [R39]. Resultsshowed a decreasing ERR per unit exposure with time sinceexposure and with exposure rate, although the exposure-rateeffect disappeared after 1956, when exposure assessmentimproved owing to more frequent and more comprehensivemeasurements. These results are difficult to interpret sincethe mean annual exposure among French miners was 23.9WLM per year prior to 1956 and 1.5 WLM per year after-wards. A new, very large cohort study of miners of theWismut uranium mining company in the former GermanDemocratic Republic has recently been initiated [K37]. Onthe basis of year of initial employment, 60,000 subjectswere selected from an estimated 400,000 total worker pop-ulation covering three periods (1946–1954, 1955–1970 and1971–1989), which represented the “wild” years (whenradon exposures were high and reached 300 WLM peryear), the “transition” years (when radiation protection pro-cedures were introduced, radon measurements were startedand exposures were reduced) and the “consolidation” years(when employment was stable and exposure levels wereestimated as generally below 2 WLM per year), respec-tively. Cohort analyses have not yet been published, but given its size, this study should yield important newinformation.
257. Data used in the miner analyses were drawn fromstudies of a broad range of populations, including workersat uranium, tin, iron and fluorspar mines. For each study inthis diverse group, the relationship between radon exposureand lung cancer mortality risk was consistent with linear-ity, and estimates of the ERR per unit radon exposure(WLM–1) were statistically consistent with homogeneity ofthe radon effect [C36]. Nonetheless, concerns have beenraised about the consequences of radiation exposures fromsources other than radon, e.g. thoron (220Rn and its decayproducts) and gamma radiation, for lung cancer risks to ura-nium miners [D29]. However, the consistency of resultsfrom the pooled analyses and from a comparison of Czechtin and uranium miners [T34] suggests a limited impactfrom these other radiations on estimates for lung cancer riskdue to radon exposure. If exposures to gamma radiationwere a significant contributor to the total radiation exposure of uranium miners, then one might anticipate an
ANNEX A: EPIDEMIOLOGICAL STUDIES OF RADIATION AND CANCER 75
UNSCEAR REPORT-PART 1.qxp 10/7/08 2:58 pm Page 75
76 UNSCEAR 2006 REPORT: VOLUME I
excess incidence of leukaemia, which to date has not beenobserved [D10, L54].
258. The presence of an inverse exposure-rate effect inthe BEIR VI models has important implications for theextrapolation of risk from studies of miners to populationsexposed in residences. This effect implies that, for equaltotal exposure, the risk is higher when the exposure isreceived over a longer rather than a shorter period of time.The inverse exposure-rate effect was seen, to varyingdegrees, in all of the miner studies, except for the Frenchcohort, where miners often worked for many years at lowexposure rates. However, a reanalysis of the data from theBeaverlodge uranium mine in Canada based on revisedexposure estimates [H18] provided no evidence of aninverse exposure-rate effect. It should be noted that thehighest exposure rates, which generally gave rise to thehighest cumulative exposures, occurred in the earliest yearsof mining, when the fewest measurements were made anduncertainties in dose estimation were probably greatest.These greater exposure errors would bias the observed riskstowards the null for these high exposure rates and poten-tially induce an inverse exposure-rate effect. However,adjustments by Lubin et al. [L8, L59] by calendar year offirst exposure, calendar years of exposure, attained age andyears since the last exposure did not markedly influence theeffects. In a reanalysis of the Colorado cohort, Stram et al.directly adjusted for exposure uncertainties and found thatthe inverse exposure-rate effect remained, although it wassmaller [S61]. It therefore seems unlikely that measurementerror entirely explains the inverse exposure-rate effect.
259. Results of experimental studies using animals supportthe inverse exposure-rate effect, having shown that a longerduration of radon exposure at a lower rate induced morelung cancers than a shorter duration of exposure at a higherrate [C19, C20, M38, M42]. Regarding possible mecha-nisms, Moolgavkar et al. [M39, M40] suggested, on the basisof the two-stage initiation–progression model for carcino-genesis, that extended duration allows time for the prolifer-ation of initiated cells and thus for higher excess incidenceof disease. Brenner and Sachs postulated that the inverseexposure-rate effect is a consequence of the “bystander”effect, whereby irradiated cells send signals that can resultin damage to nearby cells [B36, B40]. The model postulatesthat: (a) the bystander signalling emanates from cells whosenucleus is directly hit by an alpha particle, and additionalhits do not increase bystander response; (b) at any giventime, a subpopulation of target cells is hypersensitive in theirresponse to the bystander signal; and (c) cells in the hyper-sensitive subpopulation are also hypersensitive to direct radi-ation damage, such that alpha particle traversal of a nucleusresults in cell death [B40]. On the basis of the miner data,the model estimates that about 50 cells are signalled by thecell with the traversed nucleus [B40]. At low exposures, thebystander effect would be expected to dominate risk esti-mation; however, this effect has already been empiricallyincorporated into the BEIR VI models, and thus the BEIRVI extrapolations would not be expected to underestimate
the risks of exposure to radon in residences [B40]. A con-trasting view is given by Little, who believes that the inverseexposure-rate effect can be explained using a linear RRmodel with adjustment for attained age and age at first expo-sure, without the need to resort to a complex bystander effect[L47]. The bystander effect and other “non-targeted” effectsare discussed at greater length in annex C of the UNSCEAR2006 Report, “Non-targeted and delayed effects of exposureto ionizing radiation”.
260. The biologically based, two-stage clonal expansionmodel has previously been applied in analysing data fromthe cohort study of Colorado Plateau uranium miners in theUnited States [L71] and experimental studies of radon expo-sure in rats [H45, K40]. Application of this model has nowbeen extended to cohort studies of French [B60, H48],Czech [B60, H48] and Chinese [H47] miners. Precise inter-pretation of the results, however, remains problematic,owing to heterogeneity of parameter estimates across animalstrains [K40] and among miner cohorts [H48], although thispoint is controversial [B60]. However, results generally sug-gest that radon exposure affects the initiation rate, but itsdominating influence is on promotion (clonal expansion)[H49], while it does not affect the rate of transformation ofinitiated cells [H48]. Little et al. have raised concerns aboutthese results, in particular with respect to the ColoradoPlateau uranium miner data, as they found an improved fitto the data using a three-stage model compared with thetwo-stage model and an effect of radon exposure on thesecond-mutation rate [L41].
261. Since publication of the UNSCEAR 2000 Report[U2], several new epidemiological case-control studies ofradon in residences and lung cancer have been reported,supplementing the already existing case-control studies (seetable 29). While it remains important to assess lung cancerrisk and radon concentration for a variety of populationsthat involve different lifestyles, smoking habits, occupationsand other potential confounding factors, several consortiaof investigators have reported results from the pooling oforiginal data from China [L61], Europe [D24, D30] andNorth America [K38, K39]. These reports jointly representthe best available characterization to date of lung cancerrisk and residential exposure to radon. These pooling pro-jects were the result of extensive and ongoing planningworkshops held between 1989 and 1995 and sponsored bythe Office of Health and Environmental Research of theUnited States Department of Energy, and the RadiationProtection Programme, Commission of EuropeanCommunities [D31, D32, D33, D34]. The goals of thesemeetings were: to minimize study heterogeneity by makingthe protocols for radon measurement and for collection ofother data as consistent as possible across studies; todevelop a common data format for the pooling of data; andto create a collaborative environment to facilitate analyses.Combined data for the studies of residential exposureincluded 12,282 lung cancer cases (China, 1,053; Europe,7,148; North America, 3,662) and 21,486 controls (China,1,997; Europe 14,208; North America, 5,281).
UNSCEAR REPORT-PART 1.qxp 10/7/08 2:58 pm Page 76
262. The importance of these pooling projects cannot beoveremphasized. By the late 1980s, investigators had clearlyidentified elevated exposure to radon and radon progeny asa risk factor for lung cancer among underground miners[C34, I18, N13]. Surveys of radon concentrations in indoorair of residences, early epidemiological studies using surro-gate markers of radon exposure and extrapolations usinglung cancer risk models based on miner data suggested thatthe general population may carry a substantial burden ofincreased risk of lung cancer from radon exposures indwellings [C34]. Owing to differences in environmental con-ditions between mines and dwellings, and in patterns ofexposure between miners and the general population, therewas substantial uncertainty about the application of modelsfor estimating lung cancer risk based on miner data to gen-eral populations. The mean radon exposure of miners fromthe pooled data analysed by the BEIR VI Committee was162 WLM [N2], which is 20–30 times the exposure from25 years of residence in a typical dwelling. It should be rec-ognized, however, that although mean exposures were higherfor miners, 13.2% (353 out of 2,674) of the lung cancerdeaths among exposed miners occurred among thoseexposed to less than 50 WLM. In comparison, long-term res-idence in dwellings with concentrations in the range 400–500Bq/m3 results in a radon exposure of about 50 WLM; therange reflects varying assumptions on residential conditions[D29, K39]. Thus cumulative exposures for some minerswere comparable to cumulative exposures for long-term res-idents of dwellings with high radon concentrations. Thisoverlap of the ranges of exposure for mines and dwellingshelps to reduce the uncertainty associated with extrapolatingbeyond the ranges of observable data for miners.Nonetheless, owing to the potentially large number of indi-viduals exposed to this known human carcinogen in thehome, it was important to provide independent confirmatoryinformation of the risk projections based on miner data bydirectly evaluating risks from epidemiological studies ofradon exposure in dwellings. Lubin et al. [L62, L63] sug-gested, however, that epidemiological studies would have toovercome two substantial problems: (a) very low expectedexcess lung cancer risks from radon exposure, since theradon concentrations in the indoor air of most homes werelow compared with those in mines; and (b) substantial uncer-tainties in estimating current and historical radon exposuresfor 20–30 years and more in the past, because some previ-ous homes no longer exist or cannot be measured, andbecause of the natural temporal and spatial variability ofradon concentrations in indoor air. As a result of these twolimitations, Lubin et al. emphasized the need for sufficientstatistical power to test for significant risk from radon expo-sure and to evaluate modifications in these effects by con-ducting studies with large sample sizes and by poolingoriginal data from multiple studies [L62, L63]. The threecurrent pooling studies effectively address these limitations.
263. Criteria for inclusion, as well as exposure assessmentprocedures, differed slightly for the three pooling projects.The pooling of Chinese studies included the two case-control studies conducted in China, which used air alpha
track detectors accumulating exposure over 1 year, and col-lected comprehensive information on smoking habits andother personal characteristics [L61]. Exposure assessmentfocused on an “exposure time window” (ETW), defined asthe period 5–30 years prior to disease occurrence for casesor prior to the year of interview for controls. For theShenyang study [B37], investigators measured the radonconcentration in air of one home only, either the currenthome if it was occupied for 5 or more years, or the previ-ous home if it was occupied for 5 or more years. Becausecases were ascertained in the period 1985–1987, before theimportance of an ETW was fully appreciated, investigatorsrecalculated exposures for the pooled analysis based on the5–30 year ETW. The European study pooling included all13 European studies that enrolled 150 or more cases andcontrols, ascertained detailed smoking histories and demo-graphic and other information, and sought radon measure-ments in all homes occupied in the previous 15 years ormore [D24, D30]. Exposure assessment relied mostly onradon concentrations measured using 1-year alpha trackdetectors, although two Swedish studies (nationwide [P18]and “never-smokers” [L65]) used 3-month detectors inwinter, the Spanish study used 5-month detectors [B39], andthe French [B41] and United Kingdom [D13] studies used6-month detectors. The ETW was defined by the 30-yearperiod 5–34 years prior to study enrolment. The NorthAmerican pooling included all seven studies that enrolled200 or more cases, and ascertained detailed smoking histo-ries and demographic and other information [K38, K39]. Itrelied primarily on 1-year air alpha track detectors [K38,K39]. In the Winnipeg study, investigators based radonexposure assessment on two alpha track detectors placedconsecutively for 6 months each [L64], while in the NewJersey study in the United States, the investigators surveyedthe homes of 8% of subjects using a 4-day charcoal canis-ter detector [S62]. However, data included in the NorthAmerican analyses were limited to subjects whose exposureassessment was based, at least in part, on measurementsusing long-term alpha track detectors. The ETW wasdefined by the period 5–30 years prior to study enrolment.It should be noted that, except for the two Swedish stud-ies, investigators who used detectors in place for less than1 year either staggered measurements throughout the yearsor conducted seasonal adjustment. Thus the main influenceon exposure assessment of using detectors in place for lessthan 1 year would be a slight increase in variability ofassessed exposures, but no introduction of bias.
264. Table 29 summarizes mean radon concentrations inair of residences of both cases and controls, and values ofexcess odds ratios (EORs) for 100 Bq/m3 based on a linearOR model. Although the range of estimates was wide, 19 studies estimated a positive trend with radon concentra-tion, while three studies estimated a (non-significant) neg-ative trend with concentration. The model for the summaryORs for each pooling was consistent with linearity and statistically significant (as shown in figure XIV). The esti-mated EORs were 0.13 (95% CI: 0.01, 0.36) for 100 Bq/m3
for the Chinese pooling, 0.08 (0.03, 0.16) for the European
ANNEX A: EPIDEMIOLOGICAL STUDIES OF RADIATION AND CANCER 77
UNSCEAR REPORT-PART 1.qxp 10/7/08 2:58 pm Page 77
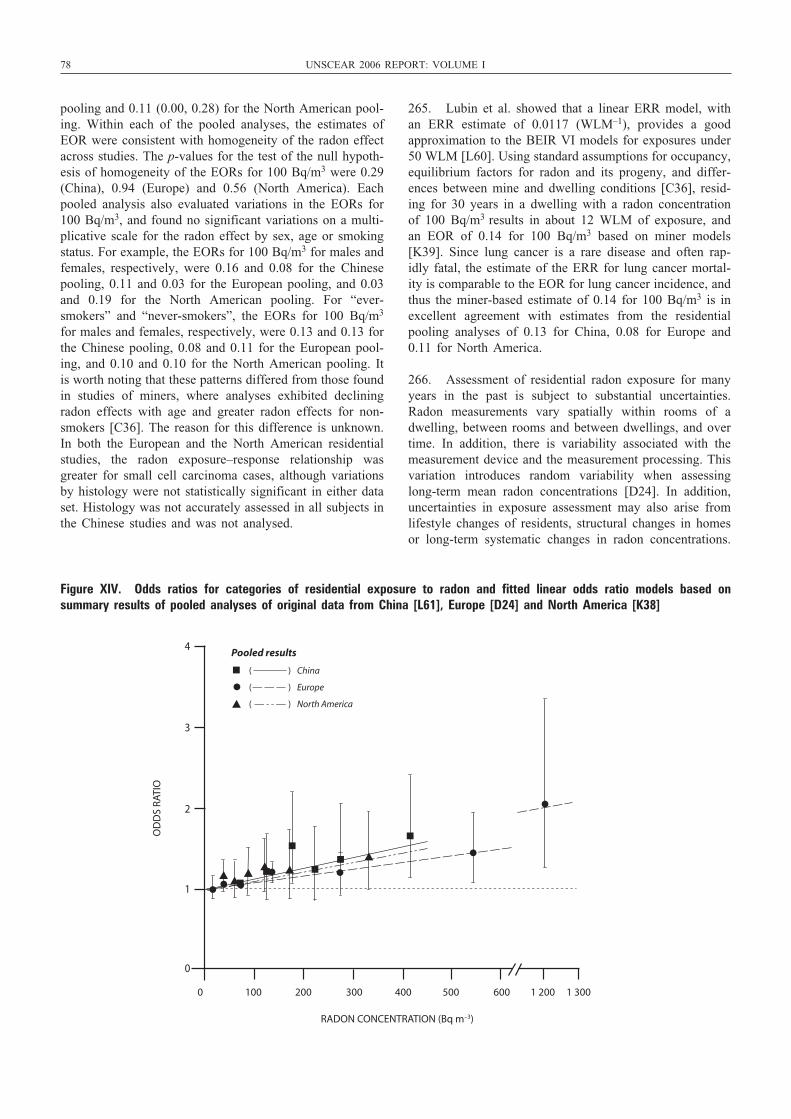
78 UNSCEAR 2006 REPORT: VOLUME I
pooling and 0.11 (0.00, 0.28) for the North American pool-ing. Within each of the pooled analyses, the estimates ofEOR were consistent with homogeneity of the radon effectacross studies. The p-values for the test of the null hypoth-esis of homogeneity of the EORs for 100 Bq/m3 were 0.29(China), 0.94 (Europe) and 0.56 (North America). Eachpooled analysis also evaluated variations in the EORs for100 Bq/m3, and found no significant variations on a multi-plicative scale for the radon effect by sex, age or smokingstatus. For example, the EORs for 100 Bq/m3 for males andfemales, respectively, were 0.16 and 0.08 for the Chinesepooling, 0.11 and 0.03 for the European pooling, and 0.03and 0.19 for the North American pooling. For “ever-smokers” and “never-smokers”, the EORs for 100 Bq/m3
for males and females, respectively, were 0.13 and 0.13 forthe Chinese pooling, 0.08 and 0.11 for the European pool-ing, and 0.10 and 0.10 for the North American pooling. Itis worth noting that these patterns differed from those foundin studies of miners, where analyses exhibited decliningradon effects with age and greater radon effects for non-smokers [C36]. The reason for this difference is unknown.In both the European and the North American residentialstudies, the radon exposure–response relationship wasgreater for small cell carcinoma cases, although variationsby histology were not statistically significant in either dataset. Histology was not accurately assessed in all subjects inthe Chinese studies and was not analysed.
265. Lubin et al. showed that a linear ERR model, withan ERR estimate of 0.0117 (WLM–1), provides a goodapproximation to the BEIR VI models for exposures under50 WLM [L60]. Using standard assumptions for occupancy,equilibrium factors for radon and its progeny, and differ-ences between mine and dwelling conditions [C36], resid-ing for 30 years in a dwelling with a radon concentrationof 100 Bq/m3 results in about 12 WLM of exposure, andan EOR of 0.14 for 100 Bq/m3 based on miner models[K39]. Since lung cancer is a rare disease and often rap-idly fatal, the estimate of the ERR for lung cancer mortal-ity is comparable to the EOR for lung cancer incidence, andthus the miner-based estimate of 0.14 for 100 Bq/m3 is inexcellent agreement with estimates from the residentialpooling analyses of 0.13 for China, 0.08 for Europe and0.11 for North America.
266. Assessment of residential radon exposure for manyyears in the past is subject to substantial uncertainties.Radon measurements vary spatially within rooms of adwelling, between rooms and between dwellings, and overtime. In addition, there is variability associated with themeasurement device and the measurement processing. Thisvariation introduces random variability when assessinglong-term mean radon concentrations [D24]. In addition,uncertainties in exposure assessment may also arise fromlifestyle changes of residents, structural changes in homesor long-term systematic changes in radon concentrations.
4
3
2
1
0
0 100 200 300 400 500 600 1 200 1 300
RADON CONCENTRATION (Bq m–3)
OD
DS
RATI
O
( ) China
( ) Europe
( ) North America
Pooled results
Figure XIV. Odds ratios for categories of residential exposure to radon and fitted linear odds ratio models based on summary results of pooled analyses of original data from China [L61], Europe [D24] and North America [K38]
UNSCEAR REPORT-PART 1.qxp 10/7/08 2:58 pm Page 78
Uncertainties in the estimation of radon exposure are influ-enced by gaps in residential histories for which no meas-urement exists because measurement protocols may excludeshort-term residences, houses that no longer exist or are nolonger used as residences, or houses for which the currentowners refused measurement. Finally, uncertainties mayalso arise from ignoring exposures that may contribute torisk, for example exposures beyond 30 or 35 years in thepast. The approaches to addressing the consequences ofthese uncertainties differed among the pooled analyses. TheEuropean project used replicate measurement data from theCzech Republic, Italy, Sweden and the United Kingdom toestimate measurement variability for all the study popula-tions [D30], and integrated those estimates into their expo-sure–response modelling using either regression calibration[C12] or integrated likelihood [R19] methods. With theiradjustment for random uncertainties, the estimated radoneffects increased the EOR from 0.08 to 0.16 for 100 Bq/m3.Assessments of exposure uncertainties in the NorthAmerican pooling and the Chinese pooling were conductedby restricting subjects on the basis of length of occupancyin the current house, under the assumption that contempo-rary measurements of radon more accurately reflect trueconcentrations throughout the ETW period for long-termresidents, and also by restricting subjects to those withincreased coverage of the ETW with measurement data,under the assumption that greater coverage of the ETWresulted in less supposition for values of missing data [K38,K39]. In the North American pooling, risk estimatesincreased consistently with increasing stringency of cover-age of the ETW, and when subjects were limited to thoseresiding in one or two homes in the ETW. For example,EORs were 0.11 per 100 Bq/m3 with no residency restric-tion, and 0.14 for subjects with 20 years or more of cov-erage of the ETW. For subjects residing in one or twohomes, EORs were 0.15 per 100 Bq/m3 with no residencyrestriction, and 0.18 for subjects with 20 years or more ofcoverage. In the Chinese pooling, the overall EOR was 0.13 per 100 Bq/m3; it increased to 0.32 for subjects with25 years of coverage of the ETW and to 0.33 for subjectswho lived in exactly one residence. In a separate evalua-tion, investigators for the Gansu study in China conducteda 3-year radon measurement study to evaluate temporal andspatial variation [L66]. The adjustment for uncertaintiesincreased risk estimates by 50–100%, similar to the impactfound in the European pooling and the North Americanpooling.
267. Alternative methods for reducing uncertaintiesinclude the use of an improved dosimeter and improvedstudy design. A surface dosimeter measures residual radia-tion from 210Po, which is embedded in glass artefacts, suchas glass mirrors and picture frames, following recoil fromdecay of 210Pb [L67, M43]. It is believed that measurementsof residual radiation in glass objects that are retained anddisplayed over many years and in multiple homes providea more accurate estimate of cumulative radon exposures,although concerns have been raised about the effects ofincreased particulate levels from the presence of smokers
on plate-out rates [W26]. In the United States, a study ofMissouri women reported an EOR of 0.63 (95% CI: 0.1,1.9) per 100 Bq/m3 using a glass surface monitor, but foundno excess risk when dosimetry was based on standard airradon detectors accumulating exposure over a year [A9]. A Swedish study estimated an EOR of 0.33 (95% CI: –0.12,2.0) per 100 Bq/m3 with dosimetry based on radon meas-urements in air, and 0.75 (95% CI: –0.04, 4.30) withdosimetry based on surface monitors [L67]. Surface moni-tors may offer an improved measurement technology, butdo not eliminate temporal uncertainties from misspecifica-tion of the age of the artefact, or address spatial uncertain-ties from the exact location of the artefact and within-homevariation. Uncertainties can also be reduced through studydesign. In the United States, the Iowa radon study enrolledonly long-term (20 years or more) residents of a singledwelling, thereby minimizing uncertainties from residentialmobility [F12], and carried out radon measurementsthroughout the house, adjusting for residential occupancyand time spent in other buildings and outdoors [F12, S63].The EOR ranged from 0.16 (95% CI: 0.0, 0.6) per 100Bq/m3 for all subjects to 0.33 (95% CI: 0.02, 1.23) per 100Bq/m3 for living subjects [F12, S63]. A study in Finlandalso restricted participation to persons with 20 years or moreof residency in their current dwelling, and estimated anEOR of 0.11 (95% CI: 0.09, 1.3) per 100 Bq/m3 [A26].
268. Recent works have largely resolved the decade-longdebate over results of “ecological studies” [M44]. Startingin the early 1990s, Cohen published a series of reportsshowing decreasing lung cancer mortality rates in UnitedStates counties with increasing average radon concentra-tions in dwellings grouped by counties [C14, C21, C22,C23]. Indeed, the “ecological” model predicted a protectiveeffect of radon concentrations above 50 Bq/m3 relative tolower radon concentrations. The most recent of these cor-relation analyses used combined mortality data for the years1979–1994 [C23]. Radon measurements were based on datafrom three sources: a University of Pittsburgh project con-ducted in the period 1986–1991; survey measurementsmade by the United States Environmental ProtectionAgency; and measures made by state agencies [H46].Smoking data were not available either for individuals orfor counties, but were extrapolated for each county usingdata from a 1985 survey and using models that includedcounty-specific socio-economic factors and state-level cig-arette smoking data. The smoking estimates were furtheradjusted to reflect prevalence in the 1960–1970 period.Results from the correlation analyses contrast markedlywith results from all cohort studies of radon-exposed minersand nearly all case-control studies of lung cancer and resi-dential radon concentration, where data on radon exposureand on smoking and other factors are specifically collectedon individuals.
269. Arguments against the validity of the “ecologicalstudies” were based on both theoretical and practicalgrounds. “Ecological analysis” involves grouped data, andcan be related directly to individual-level effects only when
ANNEX A: EPIDEMIOLOGICAL STUDIES OF RADIATION AND CANCER 79
UNSCEAR REPORT-PART 1.qxp 10/7/08 2:58 pm Page 79
80 UNSCEAR 2006 REPORT: VOLUME I
the relationship between exposure and outcome is linear[L68]. In the case of lung cancer and radon, where a linearrelationship does not hold, results are subject to a varietyof biases, many of which do not exist for studies of indi-viduals. Radon studies are particularly vulnerable to biasesassociated with the use of radon levels averaged over geo-graphical areas, because of extreme variation in radon levelswithin areas. Greenland and Robins illustrated that theabsence of, or adjustment for, confounding at the grouplevel does not imply the elimination of confounding at theindividual level [G13]. This is particularly important in thecase of indoor radon, because of the dominant role of smok-ing habits on lung cancer risk. Whereas smoking habits arethe main potential confounder in an individual-level study,the corresponding potential confounder in an “ecologicalstudy” consists of the smoking-risk-weighted distribution ofhistorical radon concentrations for smokers and “never-smokers” within each area [L69]. Thus adjustment for theeffects of tobacco use in “ecological analyses” of radon andlung cancer is not likely to be adequate without detailedinformation on smoking habits and radon exposure histo-ries within counties, for example from independent popula-tion surveys [P27, S64]. Lubin demonstrated the potentialfor “ecological bias” theoretically by showing that aggre-gate disease rates may be strongly influenced by small cor-relations of factors within groups [L68]. There has been afurther exchange of correspondence between Cohen andLubin in relation to this study [C49, L97]. Muirhead et al.[M45] and Piantadosi et al. [P28] demonstrated that corre-lations between factors could be greatly affected, evenresulting in a reversal of sign, when the unit of analysis wassubject to further aggregation.
270. More recent criticisms of Cohen’s results havefocused more directly on the “ecological” regressionbetween radon concentration and lung cancer. Smith et al.[S65] reported that a negative correlation seen in the stateof Iowa disappeared when mortality data were replaced byincidence data, although the value of these data has beendisputed [C24, F17]. In a particularly revealing analysis,Puskin explored the adequacy of Cohen’s adjustment forsmoking by evaluating the regression of mortality rates fora variety of cancer sites grouped by the strength of theirassociation with cigarette smoking [P29]. Puskin foundstrongly negative correlations with average county indoorradon concentrations for cancers (lung, oral cavity and phar-ynx, larynx and oesophagus) strongly linked to smoking,moderately negative correlations for cancers (bladder andpancreas) moderately linked to smoking, and essentiallyzero correlations for cancers (prostate, colon and breast) notlinked to smoking. Since the lung is the only cancer sitethat has been associated with radon exposure [C36],Puskin’s study indicates that Cohen’s results are very likelyto be the consequence of incomplete control for the smok-ing factor. There has been a further exchange of corre-spondence between Cohen and Puskin and others in relationto this study [C47, P49]. In a report coordinated by theUnited States National Council on Radiation Protection andMeasurements, Heath et al. reanalysed Cohen’s data and
showed that, after adjustment for smoking, the negativetrend was largely confined to counties with mean concen-trations of below about 50 Bq/m3, and the regression wasgenerally flat from this level to about 175 Bq/m3. Data weretoo sparse to evaluate above 175 Bq/m3 [H46]. The analy-sis suggested that the trend may be influenced by con-founding from smoking, which was greater for the countieswith lower average radon concentrations. It suggests that“systematic errors and uncertainties in Cohen’s data andanalysis … preclude estimating to what degree or in whatdirection lung cancer mortality is altered by exposure to …radon” [H46]. Cohen has responded to these criticisms,questioning a number of the statements made by Heath etal. in relation to his analysis, and also disputing the flat-ness of the dose response in the range 50–175 Bq/m3 [C48].
7. Transfer of risk estimates
271. Estimates of ERR per unit dose for lung cancer fromseveral studies involving medical exposures in predomi-nantly Caucasian patients are lower than those based on sur-vivors of the atomic bombings (table 27). Although thismight indicate that absolute risks are more comparable thanRRs, the lower ERR estimates may also have resulted fromother differences in the study populations, particularly themuch higher doses in several of the medical studies. Lungcancer rates in Japan have increased in the past few decades.Because of this increase, lung cancer rates for the LSScohort are generally lower than current Japanese rates, animportant consideration in transferring risk estimates for theLSS cohort to another population.
272. Because much of the variation in underlying lungcancer rates among countries is likely to be due to differ-ences in smoking habits, the finding that the joint effect ofsmoking and radiation exposure on lung cancer risks in sur-vivors of the atomic bombings is well described by an addi-tive model [P17] lends support to the use of absolute risktransfer. Nevertheless, studies of lung cancer risks in under-ground miners exposed to radon [C36] or in Hodgkin’s dis-ease patients treated with high doses of radiation [G23]rejected additive interactions and found that multiplicativeinteractions were compatible with the data. However, thehigh doses involved in these studies may make them lessrelevant for estimating risks of low-dose exposures.
8. Summary
273. Lung cancer risk has been associated with externallow-LET radiation in survivors of the atomic bombings, inpersons exposed at high doses for medical reasons and inMayak workers exposed at high doses. Based on data forthe survivors of the atomic bombings, the ERR per unitdose (Sv–1) was larger for females than for males, but theEARs were similar for both sexes. Unlike the case of manyother solid cancers, there is little evidence that the ERR forlung cancer declines with increasing age at exposure. The
UNSCEAR REPORT-PART 1.qxp 10/7/08 2:58 pm Page 80
evidence regarding the interaction of radiation and smokingis conflicting, with data on survivors of the atomic bomb-ings supporting an additive interaction, while studies of per-sons exposed therapeutically support a multiplicative, andpossibly even a supramultiplicative, interaction. Most stud-ies of low-dose protracted exposure have failed to demon-strate dose–response relationships for lung cancer, but thismay be because of limited statistical power. Particularlynoteworthy is the lack of dose response for lung canceramong tuberculosis patients who received multiple chestfluoroscopies, where it was possible to demonstrate that theERR per unit dose was incompatible with that based on survivors of the atomic bombings. However, findings forpatients with a lung disease may not be typical for the general population.
274. With regard to high-LET radiation, there is little evi-dence that lung cancer risk is related to internal exposurefrom Thorotrast or radium, although this may be due to lim-itations in the available data. However, lung cancer risk hasbeen strongly linked with internal exposure, predominantlyvia inhalation, to plutonium in studies of Mayak workers inthe Russian Federation, and there is a wealth of data link-ing lung cancer risk with exposure to radon and its prog-eny. More is said about radon dosimetry and risks in annex E of the UNSCEAR 2006 Report, “Sources-to-effectsassessment for radon in homes and workplaces”.
K. Malignant tumours of the bone and connective tissue
1. General background
275. Malignant tumours of the bone account for about0.5% of malignant neoplasms in humans [M56], while soft-tissue sarcomas, which include connective tissue malignan-cies, account for about 1% of all malignancies [Z9]. Thereis not much variation in incidence rates worldwide: annualage-standardized world incidence rates vary from less than0.3 per 100,000 among both men and women in some partsof Japan to more than 3 per 100,000 among men in partsof Italy [P19]. Among bone sarcomas, dissimilarities in celltype between osteosarcoma and Ewing’s sarcoma indicatethat these tumours have different origins. The role of geneticsusceptibility has been identified through molecular andcytogenetic studies of the gene loci for these types of sar-coma, as well as by the linkages of osteosarcoma withhereditary retinoblastoma and the Li–Fraumeni syndrome[M56]. Li–Fraumeni syndrome has also been investigatedtogether with connective tissue malignancies [Z9]. As willbe described below, a variety of studies on external low-LET and internal high-LET exposures have established thatbone sarcomas can be induced by radiation. Human andanimal studies have suggested a possible associationbetween exposure to chromium and nickel and the risk ofbone and soft-tissue malignancies [M56].
2. Summary of UNSCEAR 2000
276. Among the survivors of the atomic bombings overall,although not reported in the incidence data [T1], the esti-mated trend in risk per unit dose is statistically significantlypositive, but is based on very small numbers (34 cases). Thereare indications that the risk is higher for exposure in child-hood than in adulthood [T1]. Statistically more powerfulinformation comes from studies of patients treated for cancerin childhood. Three studies with reasonably large numbersof cases [H27, T10, W11] have reported a statistically sig-nificant trend of increasing risk with (external low-LET)dose, based on mean doses of between 10 and 30 Gy; anothersuch study reported similar results, although with fewerdetails [D16]. However, few studies of adult external low-LET exposure are informative, owing in part to the rarity ofmalignant tumours of the bone or connective tissue. Forexample, the study of cervical cancer patients involved meandoses comparable to those in the above childhood cancerstudies [B8]; in that instance, no significant trend of increas-ing risk with dose was found. Among ankylosing spondyli-tis patients in the United Kingdom, the total number of deathswas significantly greater than expected from national rates,but the data were not analysed in relation to estimates of dose[W8]. In a group of over 120,000 women in Sweden treatedfor breast cancer, the incidence rate of soft-tissue sarcomaswas about double that expected from national rates [K18].
277. In relation to the effects of internal high-LET expo-sure, there is strong evidence that large intakes of radiumhave induced increased numbers of bone sarcomas in a groupof patients in Germany [N2, S79] and in radium dial work-ers in the United States [C11, F4, R18, R27]. Because of thelong half-lives of 226Ra and 228Ra (the source of the high-LET exposures in the United States study) relative to the half-life of 224Ra (the source of exposure in the German study),it is easier to model risks using the latter study. Analysis ofthe 224Ra data indicates that the EAR decreases with increas-ing time since exposure (beyond about 12 years) and age atexposure, and that the effect on risks of exposure rate is smallat doses below around 10 Sv. The 224Ra data are consistentwith a linear dose response over a range up to more than 100 Sv, although there is uncertainty in extrapolating the find-ings down to doses of a few sieverts. The United States studyon 226Ra and 228Ra offers little evidence of an elevated riskat these lower doses, although it is difficult to evaluate thedose associated with any “practical threshold” in risk.
3. New or updated studies
278. Table 30 summarizes the risk estimates for cancerand cancer mortality based on epidemiological studies ofradiation exposure.
(a) External low-LET exposures
279. An excess risk of bone and soft-tissue cancers, inparticular angiosarcoma, has also been found in other recent
ANNEX A: EPIDEMIOLOGICAL STUDIES OF RADIATION AND CANCER 81
UNSCEAR REPORT-PART 1.qxp 10/7/08 2:58 pm Page 81
82 UNSCEAR 2006 REPORT: VOLUME I
studies of women treated with radiotherapy for primarybreast cancer [E2, H3, Y8], although detailed dosimetry islacking in these studies.
280. Virtanen et al. [V11] studied bone and soft-tissue sar-comas among 295,712 Finnish patients who had been treatedfor certain cancers during the period 1953–2000, and iden-tified 147 cases against 88.5 expected from Finnish nationalrates, the excess becoming apparent 10–14 years after treat-ment. Patients who received radiotherapy alone constituted43% of the total person-years of follow-up, those whoreceived chemotherapy alone 5%, and those who receivedboth radiotherapy and chemotherapy 3%. The SIR for thosewho were treated with radiation alone was 2.1 (95% CI: 1.6,2.6), with those diagnosed below 55 years of age having anSIR of 3.4 (95% CI: 2.5, 4.6). When the cancer rate forthose patients treated with radiation alone was comparedwith that for patients who had received neither radiotherapynor chemotherapy, the crude RR was 1.6 (95% CI: 1.0, 2.6),and the RR adjusted for age, sex and type of primary cancerwas 1.5 (95% CI: 0.9, 2.6). There was no statistically sig-nificant difference between the effect of radiation upon therisk of bone versus soft-tissue sarcoma [V11].
281. In an international study of second cancers after treat-ment for Hodgkin’s lymphoma [D46], elevated SIRs for bonecancers (3.8; 95% CI: 1.7, 7.2) and soft-tissue cancers (5.1;95% CI: 3.5, 7.2) were found for a group of 32,591 patients.The SIR of 7.0 (95% CI: 3.3, 10.5) for bone and soft-tissuesarcomas in patients who had been treated with radiationcompares with an SIR of 3.4 (95% CI: 2.0, 5.3) among thosewho were not, an SIR of 15 being apparent among thosereceiving radiotherapy 10–19 years after treatment. The RRof bone and soft-tissue sarcomas decreased significantly withincreasing age at treatment [D46]. In a similar study of aBritish cohort of 5,519 survivors of Hodgkin’s lymphoma,Swerdlow et al. [S77] found a raised SIR for bone cancers(10.7; 95% CI: 3.3, 24.8) and for soft-tissue sarcomas (3.9;95% CI: 1.0, 10.1), and all the cases occurred in patients whohad been treated with radiation. The SIR for bone and soft-tissue sarcomas combined was greatest for those treatedbefore the age of 25 years and was significantly elevated inthe period 5–14 years after first treatment [S77].
282. In a cohort of 6,597 persons treated for breast cancerin France, 12 bone or soft-tissue sarcomas developed afterhigh-dose radiotherapy (doses of more than 10 Gy) [R52].There is a trend of increasing risk of bone/soft-tissue sar-coma with radiation dose, although the ERR is not large(ERR = 0.05 (95% CI: indeterminate, 1.18) Gy–1; the lowerconfidence bound did not converge). The best fit wasobtained with a quadratic dose–response model. Excludingthree cases of women with Stewart–Treves syndrome, thetrend was highly statistically significant (p < 0.01).
283. Although not considered in the UNSCEAR 2000Report [U2], the 1997 study of Artalejo et al. [A32] reportedan excess of bone tumours among workers for the SpanishNuclear Energy Board. This excess (SMR = 2.95; 95% CI:
1.1, 6.4) was based on only 6 cases of cancer, of which 3 were among the 27% of the cohort who had been minersand may have been exposed to alpha radiation [A32].
(b) Internal high-LET exposures
284. Workers at the Mayak nuclear complex in theChelyabinsk region of the former Soviet Union were exposedto high levels of external radiation and plutonium (239Pu)during the production of weapons materials, especially duringthe early years of operations in the late 1940s and the 1950s.Substantial doses to the lung, liver and skeleton werereceived from 239Pu. Koshurnikova et al. [K46] examinedmortality risks from bone cancer before 1997 among 10,797Mayak workers employed during the period 1948–1958.Nineteen bone cancers together with four deaths fromtumours sited in soft tissues close to bone surfaces wereincluded in the analysis; 21 of these deaths occurred among9,381 workers monitored for exposure to external sources ofradiation (mean recorded cumulative dose with a two-yearlag = 1.23 Sv), and five deaths were in the group of 954 workers with cumulative external doses in excess of 3 Sv.
285. Of 5,521 workers with plutonium body burdens thatwere considered to be known (i.e. either the workers weremonitored for exposure to plutonium or worked in areaswith a low potential for exposure), 2,207 had detectablelevels of plutonium in urine samples (mean body burden =4.5 kBq, mean bone surface dose from plutonium = 3.8 Gy), and six bone cancers occurred in this exposedgroup [K46]. Three bone cancers were in the group of 251 workers with plutonium body burdens in excess of 7.4 kBq. A further 5,276 workers were considered to havehad the potential to have been exposed to plutonium, butwere unmonitored, and 13 bone cancer deaths occurred in this group. Seven of these deaths were among 2,142workers in the plutonium plant, where the highest exposures tended to be experienced [K46].
286. Uniformly raised levels of bone cancer mortality rateswere found for the various groups of Mayak workers whencompared with either Russian or United States referencerates, but given the potential for bias when comparing withrates based upon external populations, most reliance shouldbe placed upon the findings using comparisons within theMayak workforce [K46]. Indications of an increase in bonecancer risk with increasing cumulative external dose, treatedas a categorical variable, were found, but because fullaccount could not be taken of the influence of the dose fromplutonium, reliable conclusions could not be drawn.
287. Further analyses treating the estimated plutoniumbody burden as a continuous variable indicate an increasingrisk of bone cancer with increasing body burden (p < 0.001) [K46]. Overall, the evidence from this studystrongly suggests that exposure to high levels of plutoniumat Mayak has increased the risk of bone cancer, but risk coef-ficients cannot at present be determined, because of the lackof comprehensive estimates of doses to bone surfaces from
UNSCEAR REPORT-PART 1.qxp 10/7/08 2:58 pm Page 82
plutonium. Shilnikova et al. [S28] also examined cancer mor-tality among the Mayak workforce, but they considered bone,liver and lung cancers (i.e. those cancers most likely to berelated to plutonium deposition) as a group, so that the studydoes not provide information on bone cancers alone.
288. An update of mortality data for Portuguese patientsinjected with Thorotrast [D27] found a statistically signifi-cant (p < 0.001) SMR for bone cancer (12.8) when usingPortuguese mortality rates as a comparison, but the ratio ofthis SMR to that for unexposed patients was not significant:rate ratio = 7.60 (95% CI: 0.85, 359). Travis et al. [T30]studied cancer incidence and mortality rates for Thorotrastpatients from Denmark, Sweden and the United States, andfound a statistically significant (p < 0.05) SMR for bonecancer among United States patients (13.9, based upon 2 deaths), but also found no case of bone cancer among theScandinavian patients (although the expected number ofcases, while not presented, would have been small). Theypointed out that 224Ra, a bone-seeking radionuclide, is pres-ent in the decay chain of 232Th, and that the total skeletaldose from all radionuclides in the decay chain could be inthe range from 3 to 9 Gy, so that an excess risk of bonecancer among Thorotrast patients is plausible.
4. Summary
289. As in the UNSCEAR 2000 Report [U2], studies ofpatients treated for childhood cancer demonstrate anincreasing risk of bone and soft tissue sarcomas with dose,over a range of several tens of grays (low-LET). These stud-ies are not informative about risks at doses below a fewgrays, but a study of retinoblastoma patients in particularindicates that genetic predisposition may affect risks asso-ciated with high-dose therapeutic radiation exposure. Otherstudies of external low-LET exposure are less informative,although there is some suggestion that the RR is lower forexposure in adulthood than in childhood. Studies of personsreceiving high-LET radiation, in particular 226Ra, 228Ra and224Ra, strongly suggest an exposure-related increased riskof bone tumours. The major new study to appear in rela-tion to internal high-LET exposure is that of the Mayakworkers exposed to 239Pu, which also suggests a radiogenicexcess bone tumour risk. However, until the bone dosime-try for this cohort is established, in particular identifyingthe components of dose due to 239Pu and to external low-LET radiation exposure, quantitative risk estimates cannotbe derived from this study.
L. Cutaneous malignant melanoma
1. General background
290. Cutaneous malignant melanoma is a comparativelyrare tumour in many populations, although incidence rates
are increasing around the world [A14]. The incidence ofmalignant melanoma is strongly related to ultraviolet radi-ation (UVR) exposure, with exposure at all ages likely tobe important for various stages of development of thetumour (initiation, development of naevi, and invasivemelanoma) [T22]. For this reason, possible depletion ofatmospheric ozone may exacerbate these trends [A15]. Theincidence of malignant melanoma is strongly correlatedwith skin pigmentation, but it is about 10 times lesscommon than non-melanoma skin cancer. Age-standardizedworld annual incidence rates for melanoma vary from about0.5 per 100,000 persons in Algeria to over 40 per 100,000in parts of Australia [P19, T22]. Unlike many tumours ofadults, melanoma arises relatively frequently among theyoung and the middle aged. Malignant melanoma incidencerises steeply with age until about age 50, after which therate of increase slows [A18]. Much of the increase in inci-dence in the last few decades appears to be due to solarexposure [A16]. A number of recent case-control studieshave provided corroborating evidence for this proposition,but have indicated that the exposure–response relationshipis complex [A17, A18, A20, T22]. In contrast to non-melanoma skin cancer, both cumulative exposure and inter-mittent exposure of untanned skin are risk factors for thedisease [A17, A18, A20, T22]. Melanoma can usually beclassified into one of three histopathological types: super-ficial spreading melanoma, lentigo malignant melanoma(also known as Hutchison’s melanotic freckle melanoma),and nodular melanoma, although this classification is con-troversial [A18]. As noted above, skin pigmentation is avery important risk factor [A18], and there is considerableevidence also for familial susceptibility, hormonal factors(e.g. use of oral contraceptives and reproductive status) andimmune suppression as risk factors [A18, T22]. Some stud-ies have suggested associations with diet, and in particularthat intake of vitamin E is a protective factor for the dis-ease [A18]. Further details on the epidemiology are to befound in reference [A18].
2. Summary of UNSCEAR 2000
291. The UNSCEAR 2000 Report indicated that no rela-tionship of melanoma with radiation exposure has beendemonstrated in the major exposed groups [U2], includingthe survivors of the atomic bombings [R25]. As shown intable 31, there is a moderate ERR of melanoma within theLSS cohort of 0.21 (90% CI: <0, 3.15) Sv–1, with wide con-fidence intervals, based on 13 cases (6 with unweightedcolon doses of more than 0.01 Gy) [R25, T1].
292. In the past there were concerns that an excess inci-dence of cutaneous malignant melanoma at the LawrenceLivermore National Laboratory in the United States mightbe due to radiation exposure [A19]. However, a later studyconcluded that the supposed excess was most likely due tofactors relating to host constitutional factors, such as skinreactivity and number of moles, and to exposure to sunlight[M28].
ANNEX A: EPIDEMIOLOGICAL STUDIES OF RADIATION AND CANCER 83
UNSCEAR REPORT-PART 1.qxp 10/7/08 2:58 pm Page 83
84 UNSCEAR 2006 REPORT: VOLUME I
3. New or updated studies
(a) External low-LET exposures
293. An association between external ionizing radiationand melanoma risk was suggested by a study of UnitedStates radiologic technologists who had first worked before1950 (RR = 1.8; 95% CI: 0.6, 5.5), particularly among thosewho worked 5 or more years before 1950 (RR = 2.4; 95%CI: 0.7, 8.7; 2-sided p = 0.03) [F11]. Beginning work before1940 was associated with a greatly increased risk (RR =8.6; 95% CI: 1.0, 72.7), but this observation was based ononly 4 cases. Risk was also moderately elevated amongtechnologists who did not customarily use a lead apronwhen they first started employment (RR = 1.4; 95% CI: 0.8,25) [F11]. As with the various other analyses of this cohort,no individual doses had been estimated. The study relies onself-reported diagnoses, although pathological records wereobtained for a sample of 160 (66%) of the 243 reportedmelanomas; 140 of these 160 cases had the diagnosis con-firmed. Information on hair and eye colour, skin tone andfamily history of melanoma was only requested in thesecond (of two) questionnaires; no information on historyof sunburn was collected. In view of this limited informa-tion with which to adjust for solar exposure and constitu-tional factors, the association with ionizing radiation is notconvincing.
294. The analysis of cancer incidence in relation to occu-pational dose in the National Dose Registry of Canada hasdocumented a statistically significant increased SIR formelanoma of 1.16 (90% CI: 1.04, 1.30) [S8]. The trend withdose of melanoma incidence in this cohort is not statisti-cally significant: there is a high ERR of 4.3 (90% CI: <0,19.6) Sv–1, with wide confidence intervals [S8]. However,as with the parallel analysis of the mortality data associatedwith this cohort [A8], concerns have been expressed aboutthe reliability of record linkage, a possible source of bias[G16]. Moreover, there is no information on solar exposureand constitutional factors in this study.
295. Analysis of cancer incidence in a small group of chil-dren who underwent cardiac catheterization yielded an SIRamong males of 4.87 (95% CI: 1.0, 14.2). However, therewere no cases (of any cancer) among the female children,and the authors did not calculate an overall SIR for the com-bined group, so that it is difficult to interpret this finding.No radiation dose estimates exist for this cohort [M27].There is also no information on constitutional factors orexposure to sunlight in this study, so that it is difficult toinfer any link between melanoma and ionizing radiationexposure from the results of this study.
296. Analyses of melanoma incidence in a group of 4,401survivors of childhood cancer treated at French and Britishcentres and 25,120 survivors of cancer treated before theage of 20 at various centres in the Nordic countries found16 melanoma cases. An excess risk at borderline levels ofstatistical significance was observed at high local doses,
>15 Gy, for which the OR was 13 (95% CI: 0.94, 174)[G31]. Likewise, a continuous model fitted to these datasuggested a trend of risk that increased with dose at bor-derline levels of statistical significance (2-sided p = 0.05)[G31].
(b) External high-LET exposures
297. Because aircrew receive elevated radiation doses,which can range up to 6 mSv per year, with a substantialneutron component (25–50% of the absorbed dose) [B22,G15], there has been much interest in studies of this group.To date there have been various, generally small, studies ofaircrew, whether of pilots or flight attendants. The largeststudies to date are three large pan-European studies, the firstof flight attendants [Z4], the second and third of male cock-pit crew [B23, L48]. The first study, of flight attendants,found a statistically non-significant increase in mortalityfrom melanoma (SMR = 1.93; 95% CI: 0.70, 4.44) amongmale crew, but no suggestion of increased risk amongfemale staff (SMR = 0.36; 95% CI: 0.04, 1.37) [Z4]. Thesecond study, of male cockpit crew, found a statisticallysignificant increase in mortality from melanoma (SMR =1.78; 95% CI: 1.15, 2.67) [B23]. No consistent associationbetween employment period or duration and cancer mor-tality was observed, whether for melanoma or any other endpoint, in either study [B23, Z4]. In the third study, therewas no indication of a trend of melanoma risk with radia-tion dose (p = 0.481), so that, for example, the RR associ-ated with doses of greater than 25 mSv was 0.33 (95% CI:0.06, 1.85) [L48]. Radiation doses were measured only inthe third study [L48]. There is no assessment of solar expo-sure or constitutional factors in any of these three studies.The aircrew studies have recently been reviewed, and evi-dence has been found of a consistent excess risk ofmelanoma, non-melanoma skin cancer and breast cancer[S35]. However, as with the three large studies discussedabove, there is generally no relation with duration ofemployment. Since the only study implying a risk of cuta-neous melanoma did not estimate radiation doses [B23], andin the absence of individual information on solar exposurein all three studies [B23, L48, Z4], it would be difficult toascribe the excess risks observed in these studies to ionizing radiation exposure [S35].
4. Summary
298. Solar UVR has the potential to seriously confoundthe ionizing radiation dose response for melanoma, becauseit is a known risk factor for this end point and may wellbe correlated with cumulative ionizing radiation dose. Ingeneral, there will be appreciable positive bias in any esti-mated radiation dose response if solar UVR is not takeninto account.
299. As for the UNSCEAR 2000 Report [U2], thereremains only weak evidence that cutaneous melanoma isinducible by ionizing radiation. Most of the studies that sug-
UNSCEAR REPORT-PART 1.qxp 10/7/08 2:58 pm Page 84
gest that there might be such risks do not have adequateradiation dosimetry, and do not properly control for consti-tutional factors and sunlight exposure.
M. Non-melanoma skin cancer
1. General background
300. Non-melanoma skin cancer (NMSC) is extremelycommon in Caucasian populations but relatively rare in pop-ulations with highly pigmented skin [S36]. The two maintypes of NMSC are squamous cell carcinoma (SCC) andbasal cell carcinoma (BCC) or epithelioma (otherwiseknown as a rodent ulcer as it appears to erode the sur-rounding skin) [L42]. Both SCC and BCC of the skin arederived from keratinocytes [P20, S37]. SCC occurs as aresult of the neoplastic transformation of cells in the epi-dermis—the suprabasal cells; this tumour may occasionallymetastasize to other organs. BCCs are particularly slowgrowing and originate from the basal cells of the epidermisor hair follicles; this tumour does not usually metastasize.In Caucasian populations, the incidence of BCC is almostalways greater than that of SCC. Scotto and colleagues[S38] reported a sex- and age-adjusted rate for SCC in eightregions of the United States as 41 per 100,000 persons peryear, compared with a rate of 192 per 100,000 per year forBCC. The BCC:SCC incidence ratio was about 4:1 formales and about 6:1 for females [S38]. Very similar ratioshave been reported in a number of other surveys ([A21],but see also the reviews in references [L42, S36]). However,because of the higher fatality rate for SCC than for BCC(principally because of the greater metastatic potential ofSCC), the numbers of deaths due to SCC are generallyrather higher than for BCC [W18]. Annual age-standardizedworld incidence rates for NMSC vary from about 0.8 per100,000 persons in parts of China to over 100 per 100,000in parts of Switzerland [P19]. Since most NMSC cases areroutinely treated in doctors’ surgeries, whereas cancer reg-istries routinely rely on inpatient records from hospitals,reporting of NMSC is often very incomplete, and somecancer registries do not report it at all. Therefore population-based estimates of NMSC incidence require special surveys involving the collection of data from office recordsand outpatient files [S36].
301. NMSC is believed to be induced predominantly byexposure to UVR [A20]. NMSC incidence rates rise rap-idly with age, with such cancers being common among theelderly [S36]. Over the past decades, there has been a sub-stantial increase in the incidence rate of NMSC, by about15–20% over a decade [A21, M29]. Much of the increasein incidence appears to be due to sun exposure. Total accu-mulated exposure appears to be the main risk factor forSCC, although for BCC a combination of cumulative expo-sure and intermittent exposure is more relevant [A20].NMSC is a generally treatable malignancy with a very high
cure rate: fewer than 1 in 500 patients with SCC dies fromthis cancer [P20]. In the United Kingdom there were 46,741diagnosed cases of NMSC in 1999, and in the same year368 deaths [O5, O6]. Several chemical carcinogens havebeen linked to an increased risk of NMSC, in particulararsenic, polycyclic aromatic hydrocarbons (PAHs) and pso-ralens [S36]. Cigarette smoking and diet have also been sug-gested as risk factors in some studies [S36]. As noted above,constitutional factors, in particular skin pigmentation, arevery important risk factors [S36], and risks are alsoincreased in persons with certain rare genetic disorders, inparticular naevoid basal cell carcinoma syndrome and xero-derma pigmentosum [E4, S36]. Immune status is alsoclearly important, with increased risks seen in variousgroups with immune suppression [S36]. Further details onthe epidemiology are to be found in references [L42, S36].
2. Summary of UNSCEAR 2000
302. An association between external ionizing radiationand NMSC risk has been demonstrated in the LSS of thesurvivors of the atomic bombings [L30, L42, R25], the NewYork (United States) and Israeli tinea capitis studies [R16,S15], the Rochester thymus study in the United States [H26,S22] and in various other groups (reviewed in references[L42, U2]).
303. In the latest data from the LSS, a strongdose–response relationship was demonstrated for BCC(ERR = 1.9 (90% CI: 0.83, 3.3) Sv–1) (table 32), but notfor SCC (ERR ≤–0.1 (90% CI: <–0.1, 0.1) Sv–1) [R25].There was non-linearity in the BCC dose response [R25].A dose–response curve having two slopes (with the changein slopes at 1 Sv) marginally improved the fit (p = 0.09);a linear model with a threshold at 1 Sv did not fit the dataas well [R25]. In earlier evaluations of all NMSC in theLSS, non-linearity was highly statistically significant; theindicated models had non-zero thresholds in dose, or werefunctions involving powers of dose that were greater than1, combined with exponential terms representing cell sterilization [L30]. The ERR decreased strongly and highlystatistically significantly (p < 0.001) with increasing age atexposure [L30, R25].
304. There is evidence that the risk of BCC in the LSScohort is lower for parts of the body exposed to the sun[R25], in contrast to the evidence presented by an ICRPTask Group [I13]. As discussed by Little et al. [L42], thereis evidence that the ICRP analysis may have been con-founded by the effects of age at exposure. Most (all butone) of the sites exposed to UVR considered by the ICRP[I13] were for exposures in childhood, whereas most (allbut one) of the sites shielded from UVR were for exposuresin adulthood. As noted above, there is an appreciable reduc-tion of ERR with increasing age at exposure. A complica-tion in comparing UVR exposure status for the LSS withthat for other groups is that the patterns of solar radiationexposure in the Japanese population may be different from
ANNEX A: EPIDEMIOLOGICAL STUDIES OF RADIATION AND CANCER 85
UNSCEAR REPORT-PART 1.qxp 10/7/08 2:58 pm Page 85
86 UNSCEAR 2006 REPORT: VOLUME I
those in most Caucasian populations [L42]. Present-dayJapanese women are rarely exposed to UVR, because theyuse parasols when outside even for short walks; Japanesemen often use wide-brimmed hats when working in the sun.However, it seems that the patterns of solar radiation expo-sure in the Japanese population four or five decades agomay have been appreciably different from the present pat-tern. For example, 50 or so years ago it was common forJapanese manual labourers to be clad only in a fundoshi, asimple loincloth, particularly in summer when much ofJapan can be quite humid [L42].
305. To date, there has been little indication of an asso-ciation between ionizing radiation and SCC, but the dataare sparse [L42]. As with many other cancers [U2], the ERRof BCC decreases with increasing age at exposure [R25].Data on the dose–response relationship for BCC suggestnon-linearity, but more data are needed to better character-ize the shape of the dose response, to further evaluate therole of ionizing radiation in the development of SCC, andto clarify the role of UVR relative to ionizing radiation.
3. New or updated studies
(a) External low-LET exposures
306. The New York tinea capitis study has recently beenupdated [S7]. There were 128 cases of NMSC in the groupof 2,224 irradiated persons, and 21 in the control group of1,380 persons. Of the 128 irradiated people with NMSC,125 were Caucasian and 3 African-American; of the peoplewith NMSC in the control group, all 21 were Caucasian,i.e. none were African-American [S7]. Almost all the casesamong the Caucasians were of BCC: 124 out of 125 casesamong Caucasians in the exposed group were of BCC. Theratio of EAR associated with ionizing radiation exposurefor the Caucasians relative to the African-Americans was10.0 (95% CI: 3.2, 31), which the authors take as implyinga large enhancement of radiation risk for persons ‘effec-tively’ exposed to UVR (i.e. for those whose skin was notshielded by melanin). This does not necessarily contradictthe findings from the LSS data. Shore et al. [S7] calculateEARs, whereas in the LSS [R25] the measure used is ERR.The number of BCCs occurring on skin unexposed to solarUVR will be very much less than the number occurring onskin exposed. Thus the ERRs could well be much greaterthan on UVR-exposed skin, yet the EARs on UVR-shieldedskin be rather less on UVR-exposed skin. The ERR for BCCon the scalp of 1.7 Gy–1 is slightly but not statistically sig-nificantly (p = 0.24) greater than the ERR of 0.6 Gy–1 forthe margins of the scalp, which are presumed to receivemore solar UVR, in support of the findings from the LSSdata [R25]. Shore et al. [S7] argue for considering normal-ized risk, i.e. excess BCCs per unit area of skin per unitdose, similar to the measure proposed by the ICRP [I13].If this is done, then EARs for UVR-exposed skin are greaterthan for skin unexposed to UVR. Case ascertainment was via four surveys. About 88.1% of the people in the
original exposed group and 84.4% of those in the controlgroup were contacted and answers to questionnairesobtained. In the exposed group, 94.4% of reported caseswere medically verified. This is undoubtedly a high-quality study. However, the very small number of cases ofNMSC (3) among African-Americans and possible lifestyledifferences between this group and the Caucasian groupmean that caution should be exercised in ascribing the dif-ferences in radiation risk between these groups to their UVRexposure status.
307. An association between exposure to external ioniz-ing radiation and risk of BCC was suggested by a study ofwhite United States radiologic technologists. The risk ofBCC adjusted for the total numbers of years workeddecreased in a statistically significant manner with earliercalendar years of first employment [Y4]. There were nosuggestions of increased risks for SCC [Y4]. Among thoseworking before 1950, there was no suggestion of a doseresponse for BCC based on the number of years worked.The RR for those working for up to 5 years was 1.45 (95%CI: 1.06, 1.97), compared with an RR of 1.14 (95% CI:0.74, 1.75) for those working for more than 5 years [Y4].Among those working in the period 1950–1959, there weremore indications of a dose response for BCC. The RR forthose working for up to 5 years was 1.29 (95% CI: 1.03,1.62), compared with an RR of 1.59 (95% CI: 1.23, 2.06)for those working for more than 5 years [Y4]. The risk ofBCC associated with exposure to ionizing radiation (basedon years first worked) was not modified by UVR exposureas an adult or in childhood, although there were significantmodifying effects due to skin pigmentation. As with otheranalyses of this cohort [F11], the study is reliant on self-reported diagnoses, although confirmatory pathologicalrecords were obtained for a sample of 668 (49%) of the1,355 reported BCC cases and 79 (29%) of the 270 reportedSCC cases [Y4]. Information on hair and eye colour wasonly requested in the second (of two) questionnaires. Solarultraviolet B (UVB) exposure in adulthood was estimatedon the basis of information about the state within the UnitedStates in which residence was held and the length of thatresidence. Solar UVB exposure in childhood was estimatedfrom the state of birth. No information on sunburn or familyhistory was collected [Y4]. In view of the limited infor-mation with which to adjust for solar exposure and consti-tutional factors, and the lack of ionizing radiationdosimetry, the association with ionizing radiation exposureis not convincing.
308. There is a small, and statistically non-significant,excess risk of NMSC mortality for United Kingdom radi-ologists in the early years of practice, 1897–1920, specifi-cally 2 deaths compared with 0.46 expected (SMR = 4.35)[B2]. These deaths are very likely to be cases of SCC.Yoshinaga et al. [Y5] reviewed all the radiologist and radi-ologic technologist studies and concluded that several stud-ies provide evidence for a radiation effect on the risk ofNMSC, in particular the studies of United States radiolo-gists [M30] and of Chinese medical X-ray workers [W3].
UNSCEAR REPORT-PART 1.qxp 10/7/08 2:58 pm Page 86
However, the only one of the cohorts considered byYoshinaga et al. [Y5] that had individual dose measure-ments was the small cancer incidence study by Anderssonet al. [A6] of 4,151 persons employed at two radiotherapydepartments in Denmark, in which the trend of NMSC riskwith dose is not statistically significant.
309. In the United States, a case-control study in NewHampshire has evaluated risks of BCC and SCC in relationto previous therapeutic exposure [L43]. Persons with BCCor SCC diagnosed from a population-based ascertainmentprogramme [K29] and age- and sex-matched controls wererecruited. Information was collected by interview on med-ical history (including previous radiotherapy treatment), sunexposure history and sun sensitivity. Medical records ofthose reporting treatment with radiotherapy were obtained.Although limited radiation dosimetry appears to exist (prob-ably only treatment planning or skin entrance doses), nodose–response analysis has been attempted. Excess risks ofboth BCC and SCC in relation to previous radiotherapeuticexposure are suggested. For BCC, excess risk was notedboth among those who tend to burn in sunlight and amongthose who tend to tan [L43]. In contrast, for SCC, excessrisk was noted only among those who tend to burn in sun-light, and not among those who tend to tan [L43]. The mainproblem with this study is the lack of proper radiationdosimetry, which makes it difficult to evaluate NMSC risksquantitatively.
(b) External high-LET exposures
310. Because aircrew receive elevated doses, which canrange up to 6 mSv per year, with a substantial neutron com-ponent (25–50% of the absorbed dose) [B22, G15], therehas been much interest in studies of this group. To datethere have been various, generally small, studies of aircrew,whether pilots or flight attendants. The largest studies todate are three large pan-European studies, the first of flightattendants [Z4], the second and third of male cockpit crew[B23, L48], but these consider mortality risks only, and soare not very useful for study of the risk of NMSC. The onlylarge study to assess cancer incidence is that of Nordic air-crew by Pukkala et al. [P21]. (This meta-analytical studyincludes a number of previously studied national cohorts.)There was a statistically significant increase in SIR of 2.08(95% CI: 1.74, 2.79) based on 27 cases. However, inPoisson regression analyses, there was no significant trendof NMSC risk with dose (2-sided p = 0.14), nor was therefor BCC (2-sided p = 0.17) [P21]. In the absence of dataon solar exposure or constitutional factors for individuals,the findings of this study are difficult to interpret.
4. Summary
311. As for melanoma, solar UVR has the potential toseriously confound the ionizing radiation dose response,because it is a known risk factor for this end point and maywell be correlated with cumulative ionizing radiation dose.
In general, one would expect appreciable positive bias inany estimated radiation dose response if solar UVR werenot taken into account.
312. As for the UNSCEAR 2000 Report [U2], there isstrong evidence that NMSC, and specifically BCC, isinducible by ionizing radiation, with the RR stronglydecreasing with increasing age at exposure. There are sug-gestions of upward curvature in the BCC dose response. Anunresolved issue is that of interaction between exposure tosolar UVR and to ionizing radiation. The available data[R25, S7] suggest that ERRs may be lower for sites exposedto sunlight, whereas EARs may be higher for such sites.
N. Breast cancer
1. General background
313. Breast cancer is the most commonly diagnosedcancer among women in most countries. Rates vary con-siderably between regions, with standardized rates for NorthAmerica and Western Europe being at least two to threetimes higher than those in East Asian countries and higherstill in comparison with those seen in African countries[A30, P19]. For example, annual age-standardized worldincidence rates for breast cancer vary from fewer than 25per 100,000 women in many parts of Africa to over 100per 100,000 in parts of the United States [P19]. Despite thewide variation across populations, breast cancer incidencerates exhibit a fairly consistent pattern of increase with agethat differs from that seen for most other cancers. In par-ticular, rates increase markedly up to about age 50, afterwhich the rates increase much less rapidly. For most othersolid cancers, incidence rises steeply until age 70 or 80,after which there is some slackening of the rate of increase.The well-documented dependence of breast cancer rates onage and on reproductive factors (including the associationof increased risk with decreasing parity and increased ageat first full-term pregnancy [P39, S76], and the transientincrease in risk seen during the five years following child-birth [L76]) highlights the importance of hormonal factorsfor breast cancer risks. This has been demonstrated moredirectly in a number of recent studies [C29, K45, N15].Other non-hereditary factors for which there is evidence ofan association with breast cancer risk include factors relatedto energy balance (e.g. height, weight and obesity, diet andactivity levels) [D39, S76] and history of benign breast disease [P40].
314. There are well-established effects on breast cancerincidence from and clear associations with a family historyof breast cancer [C30]. In a recent study of breast cancerrisks in twins, it was suggested that about one quarter ofall breast cancer cases are associated with genetic effectsor gene–environment interactions [L77]. A number of cellcycle and DNA repair genes have been found to be
ANNEX A: EPIDEMIOLOGICAL STUDIES OF RADIATION AND CANCER 87
UNSCEAR REPORT-PART 1.qxp 10/7/08 2:58 pm Page 87
88 UNSCEAR 2006 REPORT: VOLUME I
associated with breast cancer susceptibility, includingBRCA1, BRCA2 and ATM. However, it is currently believedthat only about 20% of breast cancer cases are attributableto mutations in known susceptibility genes [T37].
315. Breast cancer rates among women have been increas-ing for many decades and were recently estimated to haveincreased by 30–40% between the early 1970s and the late1990s [A30]. The increasing trends have been especiallysharp in Asian countries [A30]. This increase, particularly indeveloped countries, has been generally attributed toincreased detection using mammographic screening, whilethe increase in countries where the incidence was previouslylow, e.g. Japan, may have been due to changes in lifestylefactors. These factors, together with genetic differences, arethe most plausible explanation for the large variation in ratesacross populations. Ionizing radiation is well documented asa cause of radiation-induced breast cancer in women, whichis one of the most closely studied cancers, as described inreference [U4] and in reference [R32]. These references pro-vide an extensive review of the current understanding of risksdue to radiation exposure and factors that modify these risks.
2. Summary of UNSCEAR 2000
316. The UNSCEAR 2000 Report [U2] concluded thatthere was strong evidence of an effect of ionizing radiationon breast cancer risks that was consistent with a linear doseresponse. It was also concluded that the ERR per unit doseexhibited a strong dependence on age at exposure, with thelargest risks for those exposed as children or young adults,and smaller RRs for women who were over 40 at the timeof exposure. On the basis of the comparison of results fromstudies of populations from Japan and from studies of otherpopulations it was noted that, while RRs varied consider-ably, excess rates appeared to be less variable, and that dosefractionation had little apparent effect on the risk per unitdose. The UNSCEAR 2000 Report contained no explicitdiscussion of interactions between radiation and other riskfactors, although it was noted that interpretation of radia-tion effects in some reports “is complicated by the poten-tial for confounding as a consequence of reproductivefactors or other exposures”.
317. Results from the LSS for breast cancer were basedon case follow-up for the period 1958–1987 [T1] and mor-tality follow-up for the period 1950–1990 [P1]. The LSSincidence and mortality results were broadly similar. Thesummary risk estimates clearly indicate that the RR dependson age at exposure and may increase with time since expo-sure. However, interpretation of the results in relation to thetime since exposure is complicated by the correlationbetween age at exposure and time since exposure.
318. With the exception of a study that involved thymicirradiation of infants [H10], the estimates of ERR per unitdose from the other studies considered in the UNSCEAR2000 Report were generally statistically significant but
much smaller than those from the LSS. These other stud-ies involved North American and European populationswhose members received therapeutic [B10, B11, B16, D17,L7, M8, M17, S5, S20, W8], diagnostic [B3, H9] or occu-pational [C3] exposures to ionizing radiation. It was notedthat studies of internal low- and high-LET exposures [H6,H10, H24, N2, R3] have failed to provide any indicationof increased breast cancer risks.
3. New or updated studies
319. Table 33 summarizes the risk estimates for breastcancer and breast cancer mortality from epidemiologicalstudies of radiation exposure.
(a) External low-LET exposures
320. An update of the LSS data on breast cancer inci-dence was published in 2003 [L78]. That paper was basedon follow-up between 1950 and 1990. However, the pri-mary analyses focused on risks after 1958, since the tumourregistries did not begin operating until 1958, and the authorsconsidered that there were indications that the minimallatent period might be of the order of the widely acceptedvalue of 10–12 years [R32]. The paper gives an estimatefor ERR of 1.7 (90% CI: 1.3, 2.1) Gy–1, without allowingfor variation in the ERR with either age at exposure orattained age. A major emphasis in this paper concerns therelative importance of attained age and age at exposure asmodifiers of the ERR. It noted that there are statisticallysignificant decreases in the ERR per unit dose with increas-ing attained age or age at exposure, and that, even afterallowing for such effects, there is still evidence for verylarge RRs for cases diagnosed under the age of 35. It con-cluded that, after allowing for this early onset effect, thereis no statistically significant variation in the ERR per unitdose with attained age, but that the ERR still exhibits a sta-tistically significant decrease with increasing age at expo-sure. After allowing for an 8.5-fold (90% CI: 2.3, 48)increased risk for the early onset, the authors suggested thatthe ERR per unit dose decreases by about 30% (90% CI: –50%, –10%) per decade increase in age at exposure. Whilethere was a marked decrease in risk with age at exposure,the data suggested that risks for women exposed at ages of50 or more remain elevated, with increases of 40–50%. Anon-parametric estimate of the joint dependence of the ERRper unit dose on age at exposure and on attained age givenin this paper suggested that the ERR per unit dose forwomen exposed after age 40 is 0.5 (90% CI: 0, 1.4) Gy–1.An ERR of this magnitude is comparable to that seen formany other solid cancers in the cohort of survivors of theatomic bombings and in other populations.
321. The other publication presenting LSS results is apooled analysis of incidence data from eight major breastcancer cohorts [P3]. This analysis used the LSS breastcancer incidence data for the period 1958–1993 togetherwith data on tuberculosis patients who received multiple
UNSCEAR REPORT-PART 1.qxp 10/7/08 2:58 pm Page 88
chest fluoroscopies as part of their treatment [B3], womenwith benign breast disease [M8, S5], and infants whoreceived radiation therapy for an enlarged thymus [H10] orskin haemangioma [L4, L7]. The analysis considered vari-ation in both the ERR and the EAR with both attained ageand age at exposure, and developed pooled ERR and EARmodels for the risk based on the underlying studies. Theirfinal ERR model allowed for: a decrease in the ERRinversely proportional to the square of the attained age, andno variation with age at exposure for the LSS, tuberculosisand thymic irradiation cohorts; a large effect of age at expo-sure for the Swedish benign breast disease cohort; and novariation with either age or age at exposure for the mastitisor haemangioma cohorts. As for other pooled analyses ofsome of these data sets [L5, L79], the RRs for the survivorsof the atomic bombings were significantly higher than thosefor United States and European populations. The authorsrecommended the use of a pooled EAR model in which theEAR increases with attained age, with a reduction in therate of increase after age 50 for all cohorts and a 40%decrease in the EAR per unit dose for every 10-year increasein age at exposure for the LSS, fluoroscopy and thymic irra-diation cohorts. There was a much more rapid decrease withage at exposure in the Swedish benign breast disease cohortand a non-significant increase in the mastitis cohort. Risksper unit dose were low in the haemangioma cohort evenafter allowing for infancy at the time of exposure. In gen-eral, the results suggested that no relatively simple pooledmodel can adequately describe the risks of all the cohorts,and that factors such as a history of breast disease may havea marked effect on risk. The ERR results suggested thatmore attention needs to be given to descriptions of breastcancer risks that allow for the effects of both attained ageand age at exposure.
322. Studies of second primary cancers diagnosed amongHodgkin’s disease (HD) survivors have been an importantsource of information on the risks of breast cancer follow-ing high-dose exposures. Updated results have been pub-lished for several of the major HD survivor cohorts. Theseinclude analyses of cancer incidence in a United Statescohort of 1,380 childhood HD survivors (including 480women with an average follow-up of 17 years per person)treated before age 16 [B46], and a United Kingdom HDcohort that includes 5,519 survivors (including 2,085 women)of all ages with an average follow-up of about 8.5 years perperson [S77]. Both incidence [V8, V9] and mortality [A31]risks have recently been examined in a Dutch cohort thattakes in 1,261 people (including 539 women) treated priorto age 41 with an average follow-up of about 20 years perperson. The nested case-control study with 48 breast cancercases and 175 controls based on the Dutch cohort of vanLeeuwen et al. [V8] is one of the most important since,unlike other studies of HD survivors, it makes use of indi-vidual dose estimates, and the authors make a concertedeffort to investigate effect modification by chemotherapyand other factors. The study of those women treated underthe age of 30 forms part of a meta-analysis of HD survivors[T25]. In 2000, Metayer et al. [M52] presented results of a
pooled analysis of cancer incidence among 5,925 Europeanand North American paediatric HD survivors who wereunder 21 years of age at the time of treatment. The pooledanalysis cohort includes 2,737 women with an averagefollow-up of about 9.5 years per person.
323. Despite the problems in separating the effects ofchemotherapy and radiotherapy, all of these studies provideclear indications of large, statistically significant increasesin breast cancer risk from high-dose radiotherapy. There arealso indications that the risks decrease with increasing ageat exposure. The pooled analysis of paediatric HD survivors[M52] reports an O/E of 14 (p < 0.05). In the UnitedKingdom study [S77], the SIR estimate for breast cancerassociated with radiotherapy among women treated prior toage 25 is 14 (95% CI: 6, 29), while for women agedbetween 25 and 55 the estimated SIR is about 2 and notsignificantly greater than 1. The Dutch study of breastcancer incidence [V9] reports an SIR of 17 (95% CI: 8, 32)for paediatric HD cases and of about 4 for women treatedafter age 20. The United States study of paediatric HD sur-vivors [B46] finds an SIR of 52 (95% CI: 40, 76).
324. In a cohort of 1,814 female 3-year survivors of child-hood cancer in France and the United Kingdom, 16 personsdeveloped breast cancer [G29]. Radiation doses to the breastaveraged 5.06 Gy. There was a trend of increasing breastcancer risk with dose at borderline levels of statistical significance; ERR = 0.13 (95% CI: <0, 0.75) Gy–1 (2-sided p = 0.06).
325. As noted above, the Dutch nested case-control study[V8] is the only HD follow-up study to make use of indi-vidual dose estimates. The authors provided an estimate forthe ERR of 0.06 (95% CI: 0.01, 0.13) Gy–1 among womentreated using only radiotherapy. They also noted that riskestimates were about 50% lower for women who receivedboth chemotherapy and radiotherapy. They carried outanalyses which suggested that this difference is largelyattributable to early onset of menopause induced by thechemotherapy. These estimates of ERR per unit dose andof the SIR and O/E discussed above are considerably lowerthan the risks that would be predicted on the basis of linearrisk estimates from the LSS or from other populations withlower doses (i.e. less than about 5 Gy), supporting the concept of effects due to cell-killing at high doses.
326. Initial results from a cohort study of more than90,000 United States radiologic technologists employedbetween 1926 and 1982 have been published in recent years[M10, S29]. Analyses indicated that the breast cancer inci-dence rate for this population was higher than that forwomen recorded in the SEER cancer registries in the UnitedStates, with an overall SIR of 1.16 (95% CI: 1.09, 1.23)based on 177 cases. The breast cancer risks were particu-larly high for women employed in earlier years and declinedwith later years of initial employment. This pattern lendssupport to the idea that the increased risks are associatedwith occupational exposures to radiation. Since there are
ANNEX A: EPIDEMIOLOGICAL STUDIES OF RADIATION AND CANCER 89
UNSCEAR REPORT-PART 1.qxp 10/7/08 2:58 pm Page 89
90 UNSCEAR 2006 REPORT: VOLUME I
currently no individual dose estimates for cohort members,this study does not yet estimate dose response.
327. As noted in Section II.H, because aircrew receive ele-vated doses, which can range up to 6 mSv per year, with asubstantial neutron component (25–50% of the absorbeddose) [B22, G15], there has been much interest in studies ofthis group. To date there have been various, generally small,studies of aircrew, whether pilots or flight attendants. Breastcancer mortality in a large pan-European study of flightattendants was slightly elevated, but this was not statisticallysignificant: the SMR was 1.11 (95% CI: 0.82, 1.48), basedon 59 deaths [Z4]. There was no trend of breast cancer mor-tality with years of service [Z4]. Likewise, breast cancer inci-dence in a cohort of Norwegian airline cabin attendantsdemonstrated a slight, but statistically non-significant,increase in breast cancer incidence: there were 38 cases com-pared with 34.0 expected (SIR = 1.1; 95% CI: 0.8, 1.5).Again there was no trend of incidence with duration ofemployment; for example, the RR for 15 or more years ofservice compared with less than 5 years of service was 1.0(95% CI: 0.3, 3.0) [H58]. In a study of Icelandic cabin atten-dants, there is a more pronounced (but still statistically non-significant) elevation in risk associated with increased yearsof service, so that the relative breast cancer risk among thosewith 5 or more years of service compared with those withless than 5 years of service was 2.10 (95% CI: 0.93, 4.73)[R53]. For those with 5 or more years of service before 1971compared with those with less than 5 years of service before1971, the RR was 5.24 (95% CI: 1.58, 17.38). This study isunusual among studies of these cohorts in that reproductivehistory (nulliparity and age at first birth) was adjusted forin the analysis. A study of Finnish airline cabin attendantsadjusted for reproductive history, and for familial andlifestyle risk factors, and, unusually, also had individual radi-ation dose estimates. However, there was no suggestion ofincreased risk associated with radiation dose. The adjustedOR was 0.93 (95% CI: 0.68, 1.27) for 10 mSv [K55]. In theabsence of individual information on radiation dose andlifestyle factors for most of these groups, it would be diffi-cult to ascribe the generally modest excess risks observed inthese studies to ionizing radiation exposure [S35].
328. As discussed above, age at exposure is widelyacknowledged as an important modifier of the radiationdose response for breast cancer. The LSS provides someindication of especially high RRs for early onset (diagnosisprior to age 35) of breast cancer among women exposedearly in life [L78]. An early onset effect is also suggestedby the Dutch cohort study [V8, V9]. Such an effect may besuggestive of a genetically susceptible subgroup, but mayalso reflect a modification of the ERR by attained age. Moreanalyses are needed to address this issue.
329. The most comprehensive analysis of interactionsbetween known radiation risk factors and radiation effectsremains the study of 196 breast cancer cases and 566matched controls conducted using the LSS data [L80, L81].The results of this study suggested that the presence of
known protective factors, such as early first childbirth andmultiple births, reduces the excess risk of breast cancersdue to radiation exposure at least as much as it reduces theunderlying risks of breast cancer. The recent Dutch HDanalyses [V8] mentioned above suggested that this reduc-tion might be even greater than that suggested from the LSSdata. The results of the recent pooled analysis [P3] suggestthat a history of benign breast disease may increase the riskof radiation-associated breast cancer. This observation isgiven some support by the findings of a recent case-control study of the effects of medical exposures to radia-tion on breast cancer risks [H51]. This study reported thata significant association between medical radiation expo-sures and breast cancer risks was seen only among womenwith a history of benign breast disease. However, the studywas based on self-reported radiation exposure histories, sothere is some possibility of recall bias.
330. Breast cancer is quite rare among men, accountingfor less than 0.5% of all cancers in men and less than 1%of all breast cancers [P19]. Because it is so rare, it hasseldom been considered in analyses of radiation-associatedcancer risks. However, a recent report on male breast cancerin the LSS of survivors of the atomic bombings [R33] noteda statistically significant increase in the risk with increas-ing radiation dose. Because of the small number of cases,the risk estimate is extremely imprecise.
(b) Internal low-LET exposures
331. A study of 6,841 Swedish, French and Italian patientstreated with a mixture of conventional (external beam) radio-therapy and 131I for thyroid cancer recorded a statisticallysignificant increase in breast cancer incidence (SIR = 1.3;95% CI: 1.0, 1.5; 128 cases) [R38]. However, there was notrend of increasing breast cancer risk with administeredquantity of 131I: adjusted for external radiotherapy. The ERRwas –0.01 (95% CI: indeterminate, 0.04) GBq–1 of 131I (the2.5 percentile estimate did not converge). There was a (sta-tistically non-significant) positive trend with administered131I among those people who did not receive external radio-therapy. The ERR was 0.002 (95% CI: indeterminate, 0.07)GBq–1 of 131I (the 2.5 percentile estimate did not converge)[R38]. A highly statistically significant (p = 0.004) trend ofincreasing breast cancer mortality with dose was observedin the study of persons exposed to weapons test fallout inthe Semipalatinsk area of Kazakhstan [B58]. Based on aninternal analysis, the aggregate ERR was 1.28 (95% CI:0.27, 3.28) Sv–1. However, when the analysis was restrictedto the exposed group and based on individual dose estimates,the trend estimate was slightly reduced and no longer statistically significant: 1.09 (95% CI: –0.05, 15.8) Sv–1. As noted in section II.D, “ecological bias” may operate inthis study, so these findings should be treated with caution.
(c) Internal high-LET exposures
332. As noted in the UNSCEAR 2000 Report, there arefew published data on the effects of internal high-LET
UNSCEAR REPORT-PART 1.qxp 10/7/08 2:58 pm Page 90
exposures to ionizing radiation on breast cancer risks. Theprimary published data concern the effects of doses arisingfrom 224Ra administered for therapeutic purposes [N3]. Thisstudy found no indication of elevated risks associated withthe radiation exposure.
333. The potential for studies of the Mayak worker [K2]and Techa River [D40, K6] cohorts to provide informationon breast cancer risks from internal radiation exposures wasnoted in the UNSCEAR 2000 Report [U2]. However, whilesome information on risks for these cohorts is now avail-able [G2, G12, K46, S28], the reports do not provide infor-mation on breast cancer risks.
4. Summary
334. Radiation effects on female breast cancer risks havebeen widely studied because breast tissue appears to be rel-atively radiosensitive and because breast cancer is the mostcommon cancer among women. As outlined above andrecently reviewed in reference [R32], there is compelling evi-dence for effects of radiation exposure on breast cancer rates.The dose response appears to be linear for doses of up toseveral grays, while epidemiological studies of populationswho received radiotherapy suggest that cell-killing mayreduce the relative effectiveness at very high doses. There isaccumulating information to delineate the complex modify-ing effects of age at exposure and attained age. There seemsto be fairly strong evidence supporting the notion that age atexposure is an important risk factor, with younger womenhaving higher risks than women exposed later in life.However, more attention should be paid to characterizationof the ERR as a function of attained age, and of the relativeeffect of attained age and age at exposure on the risk of radiation-associated breast cancer. Comparison of the LSSresults with those from studies on European and United Statespopulations suggests that radiation may act additively withrespect to many of the factors responsible for differencesbetween the underlying breast cancer rates of Japanese andof Western populations. On the other hand, the limited dataon the joint effects of radiation and known risk factors forbreast cancer suggest that radiation may act multiplicativelywith respect to reproductive factors. Furthermore, some factors, such as a history of benign breast disease, may mark-edly increase the risk of radiation-associated breast cancer.
O. Uterine cancer
1. General background
335. Uterine cancer includes cancer of the body (corpus)of the uterus and cancer of the uterine cervix. Most cancersof the uterine corpus are adenocarcinomas of the lining ofthe uterus (endometrium); sarcomas arise in the musculartissue of the corpus (myometrium) but are rare [G25]. Most
cancers of the uterine cervix are SCCs [S51]. Annual age-standardized world incidence rates for corpus uterine cancervary from less than 5 per 100,000 women in most of Asiato more than 20 per 100,000 in parts of the United States[P19]. Annual age-standardized world incidence rates forcervical cancer vary from less than 15 per 100,000 womenin most of Western Europe to over 30 per 100,000 in partsof South Asia [P19].
336. Cancers of the uterine cervix and corpus have verydifferent aetiologies. Human papillomavirus (HPV) appearsto be involved in nearly all cervical cancers, although otherfactors must also be involved, since HPV infection is muchmore common than cervical cancer [S51]. Different strainsof HPV have different degrees of oncogenicity [S51]. Theusual mode of transmission is sexual intercourse. Cigarettesmoking is also associated with risk [D5, L2]. With theintroduction of cervical cytological screening (“Pap smear”)programmes, the incidence and mortality rates for cervicalcancer have declined precipitously in developed countries;nonetheless, cervical cancer is the second most commoncancer in women worldwide [P38, S51]. Unlike cervicalcancer, corpus cancer appears to be more common inwomen of higher socio-economic status [G25]. Risk factorsfor endometrial cancer include menstrual and reproductivecharacteristics, obesity, use of hormones and certain med-ical conditions [A2, G25]. Risk factors for uterine sarco-mas have not been studied extensively and are poorlyunderstood. Data on uterine cancer logically should be sub-divided into those for the uterine cervix and for the uterinecorpus; however, a number of the available radiation stud-ies have combined data on cervical and corpus cancers.Table 34 notes when the data for the two types were combined in the various studies.
2. Summary of UNSCEAR 2000
337. Uterine cancer was not considered in the UNSCEAR2000 Report [U2].
3. New or updated studies
(a) External low-LET exposures
338. Neither cancer of the uterine corpus nor cancer ofthe uterine cervix appeared to be related to radiation expo-sure in studies of the survivors of the atomic bombings [T1].Corpus cancer showed a non-significant inverse associationwith radiation dose (ERR at 1 Sv = –0.25; EAR = –0.26(104 PY Sv)–1. A non-significant negative association alsowas seen for cervical cancer: ERR at 1 Sv = –0.07 (95%CI: –0.29, 0.27) and EAR = –0.37 (95% CI: –1.57, 1.38)(104 PY Sv)–1. For all cancers of the uterus combined, therewas no significant modifying effect of age at exposure, timesince exposure or attained age. In the most recent mortal-ity analysis for the LSS cohort [P9], the ERR for all uter-ine cancers combined was 0.17 (95% CI: –0.10, 0.52) Sv–1,
ANNEX A: EPIDEMIOLOGICAL STUDIES OF RADIATION AND CANCER 91
UNSCEAR REPORT-PART 1.qxp 10/7/08 2:58 pm Page 91
92 UNSCEAR 2006 REPORT: VOLUME I
and the EAR was 0.44 (95% CI: –0.27, 1.3) (104 PY Sv)–1.Cancer of the uterine corpus is uncommon in Japan [P19].
339. Within the AHS subset of the LSS cohort, the inci-dence of benign uterine myoma was associated with radia-tion dose, and the association did not appear to be readilyexplicable in terms of better detection among the morehighly exposed women [Y3]. If a high proportion of womenwith myomas went on to have hysterectomies, this couldintroduce a downward bias in the dose response for uterinecancer, particularly for corpus cancer.
340. Cancer of the uterine corpus was increased signifi-cantly 15 or more years after radiotherapy for cervical cancer(RR = 6.0), and the RR increased with dose (p = 0.14) [B5].Most women in the study received radiotherapy for their cer-vical cancer, and doses were extremely high; indeed, womenwith doses to the uterus of up to 100 Gy constituted the ref-erence group for dose–response analyses. Controls for theuterine corpus cases had to have an intact uterus at the timeof diagnosis of the matched case. There was some indica-tion that the risk was greater for adenocarcinoma of theuterus than for sarcoma of the uterus, but this comparisonwas limited by the small number of sarcoma cases.
341. Several studies have reported increased incidence[W30] and mortality rates [D7, I4] of uterine cancer amongwomen irradiated for benign gynaecological disorders asso-ciated with excessive or irregular uterine bleeding.However, interpretation is complicated by the possible rela-tion between uterine cancer and the underlying gynaeco-logical conditions for which the radiotherapy was given.These include hyperplasia of the endometrium, uterinefibroids and endometrial polyps, all of which are thoughtto be related to hormonal factors [K44]. Furthermore, thefrequency of hysterectomy for women with such disordersmight differ from that for women in the general population.Wagoner [W30] reported a significantly elevated incidenceof uterine cancer among Connecticut (United States) womenirradiated for benign gynaecological disorders (observed =83, expected = 29.3, SIR = 2.8 (p < 0.01)). The risk of uter-ine sarcoma or carcinosarcoma was especially high relativeto that for women in the general population (observed = 12,expected = 1.5, SIR = 8.0 (p < 0.01)). Approximately halfof the women were irradiated by external beam X-rays andhalf by intracavitary 226Ra. Among women fromMassachusetts or Rhode Island (United States) irradiated byintrauterine radium, Inskip et al. [I4] reported a significantlyelevated overall SMR of 1.8, with some indication of anincreasing risk with increasing follow-up time. However,there was little evidence of a dose response (ERR = 0.006(90% CI: –0.01, 0.05) Gy–1). The median dose to the uteruswas 32 Gy. Death due to cervical cancer occurred less oftenthan expected (SMR = 0.5). In extended follow-up of acohort of Scottish patients irradiated with X-rays formetropathia (with a mean dose to the uterus of 5.2 Gy),Darby et al. [D7] observed a non-significantly elevatedSMR for cervical cancer (SMR =1 .31; 95% CI: 0.67, 2.28)and for all uterine cancer combined (SMR = 1.41; 95% CI:
0.91, 2.08). The estimated ERR for uterine cancer was 0.09(95% CI: –0.02, 0.19) Gy–1, and there was no clear trendof increasing RR with increasing follow-up time.
342. A statistically non-significant, negative trend of uterine cancer incidence with radiation dose was observedin a Swedish group treated for haemangioma in infancy: 22 such tumours were observed [L10].
343. In general, no significant trends of uterine cancer riskwith external radiation dose have been observed in variousgroups of radiation workers. For example, in the UnitedKingdom there were 15 deaths due to uterine cancer in theNRRW, compared with 14.9 expected. There was a largebut statistically non-significant trend with external filmbadge dose: the ERR was 16.8 (90% CI: <–1.95, 130.3)Sv–1 [M12]. Likewise, in the IARC three-country nuclearworker study, there were positive trends with dose for bothuterine cervix and other uterine cancer deaths, which forthe latter end point approached statistical significance (1-sided p = 0.092) [C3].
344. Rates of cancer of the uterine corpus were slightly,but not significantly, increased among women treated withradiation to the ovaries and pituitary gland for infertility(SIR = 1.44; 95% CI: 0.52, 3.13) [R30]. The mean dose tothe uterus was 0.97 Gy, and there was no indication ofincreasing risk with increasing dose. Excess cancers of theuterine corpus also have been observed following ovarianablation therapy for breast cancer [E9], but not among anky-losing spondylitis patients [W8].
345. Cancer of the uterus (including corpus and cervixcancer) did not occur more often than expected in a cohortof 69,524 radiologic technologists compared with the inci-dence rate in the general female population (SIR = 0.80;95% CI: 0.69, 0.90) [S29]. The risk of cancer of the uterus(including cervix) was not associated with low-dose radia-tion exposure (mean dose = 1.75 mSv) in a cohort of occu-pationally exposed women from Canada (SIR = 0.71; 95%CI: 0.63, 0.80) [S8]. Only 77 women in this cohort haddoses of 100 mSv or greater.
(b) Internal low-LET exposures
346. A study of cancer incidence following radioiodinetreatment for hyperthyroidism [F1] reported that there wasno overall excess of uterine cancer in the treated group com-pared with the general population but did find adose–response association: for ≤220 MBq, SIR = 0.52 (95%CI: 0.28, 0.96); for 221–480 MBq, SIR = 0.73 (95% CI:0.41, 1.32); for >480 MBq, SIR = 2.11 (95% CI: 1.2, 3.7);p = 0.002 for trend. The uterus does not concentrate radioio-dine, and it is questionable whether it would receive mean-ingful exposure from this treatment. Death due to cancer ofthe uterus occurred significantly less often than expected inanother large cohort of hyperthyroid patients treated withradioiodine compared with mortality rates in the generalfemale population [R3].
UNSCEAR REPORT-PART 1.qxp 10/7/08 2:58 pm Page 92
(c) Internal high-LET exposures
347. The International Thorotrast Study [T30] did notfind any elevation in uterine cancer incidence rates asso-ciated with Thorotrast administration. There were 6 casesof uterine cervical cancer in the Thorotrast-exposed groupand 9 in the comparison group in the Denmark–Swedenpart of this study, resulting in an RR of 0.6 (95% CI: 0.2,1.8). There were 5 cases of uterine corpus cancer in theThorotrast-exposed group and 10 in the comparison groupin the Denmark–Sweden part of the study, resulting in anRR of 0.6 (95% CI: 0.2, 1.8) [T30]. No uterine (or otherorgan) dose estimates have been made for the study, andno trend with administered Thorotrast volume wasreported.
4. Summary
348. Available evidence indicates that there is no strongionizing radiation dose response for uterine cancer [B44,T1]. An absence of association between cervical cancerrisks and radiation exposures is a consistent finding,including exposures at very high doses. The evidence isnot quite so universally negative for cancer of the uterinecorpus but suggests that, if there is an effect, it is largelyconfined to the region of very high doses, i.e. in the tensof grays or more. These inferences must be tempered bythe possibility that radiation dose is also related to treat-ment of conditions that lead to hysterectomy, which wouldpreclude the possible future occurrence of uterine corpuscancer. Dose-dependent removal of the organ at risk couldexert a downward bias in the dose response for uterinecancer.
P. Ovarian cancer
1. General background
349. Ovarian cancer will affect 1–2% of women indeveloped countries during their lifetime [W25]. Annualage-standardized world incidence rates for ovarian cancervary from fewer than 6 per 100,000 women in most ofChina to more than 10 per 100,000 in most of the UnitedStates [P19]. The ovarian cancer mortality rate is high,and it is the fourth most common cause of cancer mor-tality in women, accounting for 1% of their total mortal-ity. There has been a steady increase in mortality fromovarian cancer in industrialized countries [Y2]. There areseveral histological types, with epithelial tumours clearlydominating. Risk factors, other than reproductive patternsand hormone levels, are not well understood. It has beenshown that occupational exposures to asbestos and talcmay be associated with this cancer. Further details on theepidemiology of ovarian cancer can be found in Weiss et al. [W25].
2. Summary of UNSCEAR 2000
350. Ovarian cancer was not considered in the UNSCEAR2000 Report [U2].
3. New or updated studies
(a) External low-LET exposures
351. The number of epidemiological studies providingresults for ovarian cancer risk is quite limited. The largestnumber of cases comes from the case-control and cohortstudies of women treated with radiation for cervical cancer[B8, K1]. Excess risk of ovarian cancer due to radiationexposure was not observed; however, the doses were excep-tionally large (e.g. 32 Sv), which probably resulted in cellkilling. A non-significant excess risk was observed in agroup of women treated with 226Ra for uterine bleeding. TheERR was 0.4 (95% CI: –0.7, 1.5) based on 37 cases [I4].
352. The best evidence for an effect due to radiation expo-sure comes from the studies of the incidence and mortalitydata for the survivors of the atomic bombings (LSS). Up tothe end of 1987, 66 cases of ovarian cancer were observedin women with exposures of greater than 0.01 Sv. The esti-mated RR was 0.99 (95% CI: 0.12, 2.34) at 1 Sv [T1]. Formortality, there is longer follow-up of the data (up to theend of 1997), and 85 deaths due to ovarian cancer wereobserved among women receiving more than 0.005 Sv [P9].A significant ERR of 0.94 (95% CI: 0.07, 2.0) at 1 Sv wasestimated (see table 35). In a previous mortality analysis[P1], this dose–response relationship was clearly linear,although the numbers of cases were limited. There was alsoa suggestion, although statistically non-significant, thatexposures at either young (less than 10 years old) or older(more than 40 years old) ages were a greater risk.
(b) Internal low-LET exposures
353. Very few data are available to relate ovarian cancerand internal low-LET radiation exposures. Patients treatedfor hyperthyroidism [R3] showed no increase in ovariancancer incidence rates (based on 86 cases), but the dose waslow (less than 0.1 Sv). A (statistically non-significant) positive trend of ovarian cancer incidence rates with radia-tion dose was observed in a Swedish group treated for haemangioma in infancy: 15 such tumours were observed,yielding an ERR of 0.62 Gy–1 [L10].
354. In general, no significant trends of ovarian cancerwith external radiation dose have been observed in variousgroups of radiation workers. For example, in the UnitedKingdom there were 13 deaths due to ovarian cancer in theNRRW, compared with 16.2 expected; there was a largebut statistically non-significant trend with external filmbadge dose: the ERR was 82.8 (90% CI: <–1.95, 2583) Sv–1
[M12]. Likewise, in the IARC three-country nuclear workerstudy, there were positive (but statistically non-significant)
ANNEX A: EPIDEMIOLOGICAL STUDIES OF RADIATION AND CANCER 93
UNSCEAR REPORT-PART 1.qxp 10/7/08 2:58 pm Page 93
94 UNSCEAR 2006 REPORT: VOLUME I
trends of ovarian cancer mortality with dose (1-sided p = 0.312) [C3].
(c) Internal high-LET exposures
355. The International Thorotrast Study [T30] found ele-vated risks of ovarian cancer associated with Thorotrastadministration. There were 9 cases of ovarian cancer in theThorotrast-exposed group and 3 in the comparison group inthe Denmark–Sweden part of this study, resulting in an RRof 4.3 (95% CI: 1.1, 24.3) [T30]. No ovarian (or otherorgan) dose estimates have been made for this study, andno trend with administered Thorotrast volume was reported.
4. Summary
356. Although the body of evidence is not strong, the LSSprovides evidence that ovarian cancer is inducible by ion-izing radiation.
Q. Prostate cancer
1. General background
357. Prostate cancer is one of the most commonly occur-ring cancers among men in Europe, Africa and theAmericas, with particularly high incidence rates in theUnited States, especially among black people. Rates areconsiderably lower throughout Asia, particularly in Japanand China [P19], where, despite increases in recent years,they remain an order of magnitude or more lower than thosein the United States and other high-risk countries [H28,S78]. For example, annual age-standardized world incidencerates for prostate cancer are less than 10 per 100,000 menin most of China, whereas in some parts of the UnitedStates, rates exceed 180 per 100,000 [P19]. Because of rel-atively effective treatments, mortality rates are lower thanthose of lung, stomach and other relatively common can-cers. There are some indications that in recent years prostatecancer mortality rates are declining in many developedcountries [B47]. Both the increase in incidence rates andthe possible decline in mortality rates reflect, at least in part,the effects of increased screening.
358. Prostate cancer is extremely rare before age 40, afterwhich rates increase more rapidly than for other cancers.The rate of increase with age is largely independent ofregional variations in rates [P19]. Little is known about riskfactors for prostate cancer; however, migration and familystudies [M53, R34] have suggested that, while genetic pre-disposition has some role in explaining the large regionaldifferences in the risk of prostate cancer, other factors arealso important. Dietary factors, particularly levels of bodyfat [R34, V10, W33], and levels of sex hormones [H38] aresuspected risk factors.
2. Summary of UNSCEAR 2000
359. Studies of the risk of prostate cancer following radi-ation exposure are limited by the fact that prostate cancerlargely occurs at older ages, and that few studies have suf-ficient follow-up or sample size to have appreciable powerto detect excess risk at levels comparable to that seen formost other cancers linked with radiation exposure. It wasnoted that several studies have provided some evidencefor a radiation effect on prostate cancer incidence, mostnotably the long-term follow-up of the United Kingdomcohort of ankylosing spondylitis patients who received X-ray treatments [W8], and United Kingdom Atomic EnergyAuthority workers with internal low-LET radiation expo-sures [R14]. However, it was concluded that there is nocompelling evidence for a radiation effect on prostatecancer risks. This conclusion was based on the lack of asignificant dose response in the studies on survivors of theatomic bombings [T1], in a United States study of menwho had received radiotherapy for peptic ulcers [G6] and in the study of the large pooled cohort of nuclearworkers [C3].
3. New or updated studies
(a) External low-LET exposures
360. Table 36 summarizes the risk estimates for prostatecancer and prostate cancer mortality from epidemiologicalstudies of radiation exposure.
361. While mortality among survivors of the atomicbombings has been presented in recent publications [P9,P10], these reports do not explicitly consider prostate cancerrisks. However, the Radiation Effects Research Foundationhas released the data set used in the analyses for reference[P9], and this data set does contain information that per-mits analyses of possible radiation effects on prostate cancermortality risks for the period 1950–1997. An update of thepeptic ulcer study on cancer mortality has been publishedrecently [C4]. Unfortunately, since the publication of theUNSCEAR 2000 Report [U2], there have been no newreports on prostate cancer incidence for the survivors of theatomic bombings, nor have any of the other studies con-sidered in the UNSCEAR 2000 Report been updated.Prostate cancer is routinely considered in many follow-upstudies of cancer survivors (e.g. [A31, V9]), but because ofthe relatively short follow-up period and the ages of mostmembers of these cohorts, they do not provide useful infor-mation on the relation between radiation exposure andprostate cancer risks.
362. The latest follow-up data on mortality among thesurvivors of the atomic bombings [P9] include 53 deathsdue to prostate cancer among 19,992 male members of thecohort with dose estimates of greater than 5 mGy. The esti-mate for ERR per unit dose of prostate cancer reported byPreston et al. [P9] is 0.21 (90% CI: <–0.3, 0.96) Gy–1.
UNSCEAR REPORT-PART 1.qxp 10/7/08 2:58 pm Page 94
As with the incidence data [T1], there is no indication of astatistically significant increase in prostate cancer risk withradiation exposure. The point estimate for the ERR per unitdose is about half of that seen for all solid cancer deathsamong men in the LSS, but the uncertainty on both estimates is such that there is no evidence that the ERR for prostate cancer is significantly lower than that for allsolid cancers.
363. The study of cancer mortality in the peptic ulcerstudy has been updated to include follow-up to the end of1998 [C4]. The cohort includes 2,914 men, half of whomreceived radiotherapy, with an average of 25 years offollow-up per person. There have been 72 prostate cancerdeaths. As in the earlier analyses of this cohort, theobserved number of deaths due to prostate cancer washigher than expected number based on the general malepopulation for both the radiotherapy and the non-radiotherapy group, with the ratio of observed to expectedsmaller (1.24) in the radiotherapy group than in the non-radiotherapy group (1.47). These results do not suggestthat radiation exposure is increasing prostate cancer ratesin this cohort.
364. Prostate cancer and prostate cancer mortality riskshave been considered for the 21,000 men in the cohort ofUnited States radiologic technologists. Individual dose esti-mates are not yet available for this cohort. However, com-parisons with expected numbers of cases based on nationalincidence [S29] and mortality rates [M10] do not suggestthat prostate cancer rates are associated with occupationalexposures for this cohort. Based on 222 cases of prostatecancer, the estimated SIR was 1.02 (95% CI: 0.89, 1.16),while the SMR for the 87 deaths due to prostate cancer was0.89 (95% CI: 0.7, 1.1). Recent studies of mortality among47,000 male workers in the United States nuclear powerindustry led to a large negative estimated ERR of prostatecancer of –2.50 (95% CI: <–2.51, 26.4) Sv–1, which wasnot significant, however [H44]. No significant effects dueto radiation exposure were found for prostate cancer in thelatest analysis of mortality data among Japanese nuclearworkers [I14].
365. Atkinson et al. [A22] have studied mortality follow-up in a cohort of 51,367 United Kingdom Atomic EnergyAuthority workers, extending a previous study of Beral etal. [B59]. The trend of prostate cancer risk with dose failedto be statistically significant (2-sided p = 0.13), althoughthe trend remained statistically significant for those work-ers followed up until 1979 (2-sided p < 0.01) [A22], some-what corroborating the previous findings in this cohort[B59]. A study of 12,540 workers at the Capenhurst ura-nium enrichment facility in the United Kingdom did notsuggest any elevated risk of prostate cancer: the trend ofprostate cancer risk with cumulative external dose wasnegative [M4]. Likewise, a study of 13,960 radiation work-ers at the Springfields uranium production facility in theUnited Kingdom did not suggest any increased incidenceor mortality rates for prostate cancer [M5]. A study of
2,628 workers at the United Kingdom Chapelcross sitefound a statistically significant positive trend of mortalitydue to prostate cancer with cumulative external dose (1-sided p = 0.036 for a 10-year lag, adjusted for age, sex,calendar year, industrial status, worker status and timesince first exposure), based on 8 deaths [M6]. However,with increasing lag time the significance of the trend pro-gressively decreased, so that with a 20-year lag time, thetrend was no longer conventionally statistically significant(1-sided p > 0.05) [M6]. None of the 8 deaths had beenmonitored for tritium, 51Cr, 59Fe, 60Co or 65Zn, theradionuclides suggested by the study of Rooney et al.[R14] as being associated with elevated risk. Some ofthese cohorts include substantial groups who were heavily exposed to tritium [A22, B59, M4, M6], althoughin general, doses from tritium do not appear to have been estimated.
366. Although not considered in the UNSCEAR 2000Report [U2], the study of Artalejo et al. [A32] reported aslight deficit of prostate cancer mortality among workersfor the Spanish Nuclear Energy Board; the SMR was 0.73(95% CI: 0.29, 1.51), based on only 7 cancer deaths, ofwhich 1 was among the 27% of the cohort who had beenminers and who may have been exposed to alpha radiation[A32].
(b) Internal high-LET exposures
367. The International Thorotrast Study [T30] found ele-vated risks of prostate cancer associated with Thorotrastadministration. There were 14 cases of prostate cancer inthe Thorotrast-exposed group and 4 in the comparison groupin the Denmark–Sweden part of this study, resulting in anRR of 4.5 (95% CI: 1.6, 16.3) [T30]. There was a singledeath from prostate cancer in the Thorotrast-exposed groupand there were 2 in the comparison group in the UnitedStates part of this study, resulting in an RR of 0.2 (95%CI: 0.0, 5.1) [T30]. Prostate (or other organ) doses were notestimated for this study, and no trend with administeredThorotrast volume was reported.
4. Summary
368. There is little indication of effects due to radiationexposure on prostate cancer risks. Despite the relativelylong follow-up and large cohort size, the power of the stud-ies of the survivors of the atomic bombings is somewhatlimited by the low underlying rates of prostate cancer inJapan and the relatively low mean dose for the survivors.It is of some interest that the United Kingdom ankylosingspondylitis study led to a statistically significant result, withan estimate for the ERR per unit dose that is similar to thatseen from the LSS. Occupational cohorts and studies ofpeople who received radiotherapy provide little indicationthat external or internal radiation exposure increasesprostate cancer risks.
ANNEX A: EPIDEMIOLOGICAL STUDIES OF RADIATION AND CANCER 95
UNSCEAR REPORT-PART 1.qxp 10/7/08 2:58 pm Page 95
96 UNSCEAR 2006 REPORT: VOLUME I
R. Cancer of the urinary bladder
1. General background
369. Bladder cancer accounts for less than 5% of totalcancer incidence and less than 2% of total cancer mortal-ity in industrialized countries. There is wide internationalvariation in bladder cancer incidence, with high rates inEurope and North America and low rates in Latin Americaand Asia. Incidence rates increase steeply with age, and thiscancer is substantially more common among men thanwomen: in some countries the ratio can reach 5:1 [H37,P19]. The incidence rate increased from the 1960s to the1980s, but recently has begun to stabilize. Mortality rateshave been decreasing for both men and women and for allages. The temporal trends are influenced by changes indetection and improvements in survival.
370. Cigarette smoking is a leading cause of bladdercancer. In Western countries, approximately 50% of the cancers in men and 30% in women would be attributableto smoking. Occupational exposures to carcinogens, partic-ularly to aromatic amines, and urinary tract infections, especially among women, also are associated with anincreased risk of bladder cancer. Use of phenacetin-containing analgesics and cyclophosphamide, as well asexposure to arsenic in drinking water and Schistosomahaematobium infection, are also suspected risk factors forbladder cancer [H37, M33, S44].
2. Summary of UNSCEAR 2000
371. The UNSCEAR 2000 Report concluded that therewas convincing evidence of a relation between low-LETradiation exposure and bladder cancer risk based on theLSS incidence and mortality data [P1, R10, T1], as wellas on studies of several populations medically exposed toradiation for benign diseases [D7, I4, W8] and populationsreceiving radiotherapy for malignant diseases [B8, B50,N9, T27, T28]. The risk estimates from the studies of thesurvivors of the atomic bombings were generally greaterthan those from most other studies. However, this differ-ence may be related to the phenomenon of cell killing arising from the very high doses involved in many of themedical studies.
372. In the LSS, the effects of age and sex on bladdercancer risk were unclear. A statistically significant differ-ence between the risks for the two sexes, with the ERR forfemales exceeding that for males by a factor of about 5,was seen in the incidence data; however, no significant dif-ference was observed when an EAR model was used [T1].Based on the mortality data, the point estimates of theERRs and EARs for males were higher than those forfemales, although the differences were not statistically sig-nificant [P1]. Neither the mortality data [P1, S3] nor theincidence data [T1] exhibited statistically significant
variation with age at exposure for either the ERR or theEAR. The UNSCEAR 2000 Report indicated that poten-tial interactions between smoking and radiation exposureneeded to be studied.
373. Information on bladder cancer risks from internallow-LET radiation exposure was limited, and there waslittle evidence of a link between bladder cancer and expo-sure to 131I [D18, H2, H6, H24, R3], with the exception oftwo relatively small studies of thyroid cancer [E8] and ofhyperthyroid patients [F1] treated with 131I.
374. The risk of bladder cancer associated with exposureto high-LET radiation was unclear. No risk was seenamong patients exposed to Thorotrast as a contrast medium[A5, D15, M14, V4]. In one study of patients treated with224Ra [N2], there was a suggestion of an elevated risk, butthis was not found in another study of similarly treatedpatients [W15].
3. New or updated studies
(a) External low-LET exposures
375. The results from studies reported in the UNSCEAR2000 Report and the new and updated studies are presentedin table 37. The most recent LSS report stated that 150bladder cancers occurred between 1950 and 1997. Of these,99 occurred among survivors exposed to 5 mSv or more,of which about 16% would be attributable to radiation expo-sure [P9]. While there was little difference in the ERRbetween the sexes for exposure at age 30, the estimatedEAR for males was about twice that for females (0.7 and0.33, respectively). No information on time patterns wasprovided in this report.
376. The Chicago study of mortality due to peptic ulcerwas updated in 2002 [C4]. Based on a small number ofdeaths due to bladder cancer among irradiated and non-irradiated patients (13 and 8, respectively), the RR for radio-therapy was estimated as 1.49 (95% CI: 0.50, 4.4) in theperiod 11–62 years after treatment. With a mean bladderdose of 0.2 Gy, an ERR of 2.5 (90% CI: <0, 17.2) couldbe estimated.
377. Although individual organ doses frequently are notavailable, several, but not all, studies of second cancershave reported an association between bladder cancer riskand high therapeutic radiation doses. As described in theUNSCEAR 2000 Report, elevated risks of bladder cancerwere associated with radiotherapy in studies of patients withnon-Hodgkin’s lymphoma [T29], or with cancers of theovary [K31, T27], cervix [B8], testis [T28] or prostate [B50,N9, P23]. Results from two new studies of bladder cancerfollowing radiotherapy for prostate cancer are inconsistent.Pickles and Phillips [P24] observed an elevated risk of blad-der cancer 10 or more years after radiotherapy for prostatecancer. However, no excess risk was reported in a much
UNSCEAR REPORT-PART 1.qxp 10/7/08 2:58 pm Page 96
smaller series of patients from the Mayo Clinic in the UnitedStates [C16].
378. No clear excess of bladder cancer incidence or mor-tality has been shown in a number of studies of nuclearradiation workers, including those of the Canadian NationalDose Registry [S8], the United Kingdom NRRW [M12], thecombined analysis of workers in Canada, the UnitedKingdom and the United States [C3], and several smallerstudies [A22, F2, I14, M4, M5, M6, M34, W6]. An ele-vated risk of bladder cancer has been reported amongChinese radiology workers, particularly those who workedbefore 1970 [W3]. In contrast, neither bladder cancer inci-dence nor mortality was increased in a cohort of UnitedStates radiologic technologists [M31, S29].
(b) Internal low-LET exposures
379. High doses of 131I are often used to treat thyroidcancer. Because the bladder is one of the few organs thatconcentrate iodine [U2], the 131I dose to the bladder fromthis treatment is about 2 Gy. An excess risk of bladdercancer was reported in one small study of thyroid cancerpatients [E8], but not in two others [D18, H2]. In the onlynew study of low-LET radiation exposure, bladder cancerincidence rates were elevated, but the lower confidenceinterval did not include unity (SIR for 131I therapy compared with no 131I therapy = 1.6; 95% CI: 0.6, 4.5) following 131I exposure during treatment for thyroid cancer [R38]. This study was the largest conducted to dateand included cohorts of patients from France, Italy andSweden.
(c) Internal high-LET exposures
380. In an analysis of Danish, Swedish and United Statespatients injected with Thorotrast as a contrast medium, blad-der cancer incidence and mortality rates did not differ sig-nificantly from those observed in a comparison group [T30].These results are consistent with earlier studies of internalhigh-LET exposure from Thorotrast [A5, D15, M14, V4].
381. In a Finnish study of persons exposed to dissolvedradioactive material (predominantly 222Rn, but also 234U,238U, 226Ra, 210Po and 210Pb), an elevated incidence rate ofurinary bladder cancer was not statistically significantly asso-ciated with ingested aggregate quantities of radon, radium oruranium, or with the aggregate bladder dose [K56].
4. Summary
382. Updated mortality information from studies of thesurvivors of the atomic bombings continues to demonstratea positive radiation dose response for bladder cancer. In theaggregate, studies of cancer patients treated with high-doseradiotherapy also demonstrate an association between radi-ation exposure and risk of bladder cancer. Studies of nuclearworkers do not provide evidence of a radiation-related
bladder cancer risk, but because the radiation exposure ofthese workers was low, the statistical power of the studiesis quite limited. One relevant study of occupational expo-sure in medicine with presumably high exposures hasreported an excess incidence of bladder cancer. In the recentBEIR report [C37], the estimate of lifetime mortality dueto bladder cancer, 0.90% (95% CI: 0.3, 2.90) Sv–1, is sim-ilar to that proposed by the ICRP [I11], and is between thetwo estimates proposed in the UNSCEAR 2000 Report,although it is much closer to the estimate based on anabsolute risk transfer model.
S. Kidney cancer
1. General background
383. The estimated annual number of cases of kidneycancer worldwide is approximately 189,000, and the asso-ciated annual number of deaths is about 91,000 [F14]. Theincidence rate of renal cell carcinoma is about eightfoldhigher in developed countries than in developing ones, witha worldwide range of annual age-standardized world inci-dence rate from 0.5 per 100,000 persons in parts of Indiato 20.0 and 10.2 per 100,000 men and women, respectively,in parts of the Czech Republic [P19]. Part of this differ-ence is due to the relative availability of ultrasound, com-puterized tomography (CT) and magnetic resonanceimaging (MRI) scans [G26]. Well-documented risk factorsfor the disease include cigarette smoking, obesity, hyper-tension and acquired polycystic kidney disease. Risk fac-tors for which there is some evidence, but for which linksare as yet unproven, are renal transplantation, infection withhuman immunodeficiency virus (HIV), exposure to heavymetals (especially to cadmium and lead), chlorinated sol-vents, asbestos and phenacitin analgesics, and urinary tractinfections. Other factors, such as higher levels of physicalactivity, of vegetable consumption, and of calcium and vita-min E supplements, may be protective [G26, M50]. Thereis a clear familial component to the disease: the RR for asibling, but not for the parents, of an affected person isabout 2.5, thereby suggesting recessive genetic risk [H50].A study in Iceland reported that nearly 60% of kidneycancer patients also had a first or second degree familymember with kidney cancer [G27]. At the molecular level,common findings in familial and sporadic renal cell carci-noma are a loss of the terminal portion of the small arm ofchromosome 3, sometimes with a translocation near thebreakpoint 3p13 in familial cases, and/or a somatic muta-tion or hypermethylation in the 3p segment on or near thevon Hippel–Lindau (VHL) gene locus [G26].
2. Summary of UNSCEAR 2000
384. Kidney cancer was not assessed in the UNSCEAR2000 Report [U2].
ANNEX A: EPIDEMIOLOGICAL STUDIES OF RADIATION AND CANCER 97
UNSCEAR REPORT-PART 1.qxp 10/7/08 2:58 pm Page 97
98 UNSCEAR 2006 REPORT: VOLUME I
3. New or updated studies
(a) External low-LET exposures
385. The data are quite sparse for radiation exposure andkidney cancer risk. In the LSS cohort, the associationbetween radiation dose and kidney cancer incidence was notstatistically significant, although the point estimate of theeffect was similar to that seen for many other sites (ERR= 0.71 Sv–1) [T1] (see table 38). Similarly, in the LSS mor-tality data, the dose–response association was not statisti-cally significant for either males or females, although therisk was nominally larger for females (ERR = 0.97 (90%CI: <–0.3, 3.8) Sv–1) than for males (ERR = –0.02 (90%CI: <–0.3, 1.1) Sv–1) [P9]. Studies of several cohorts of cer-vical cancer patients receiving radiotherapy did not indicatesignificant elevations in risk (compared with general popu-lation rates or non-irradiated comparison groups) [B11, K1,S20]. However, a case-control study nested within thelargest cervical cancer cohort study showed a positive butnot statistically significant (p = 0.17) dose–response rela-tionship (ERR = 0.71 (95% CI: 0.03, 2.2) Sv–1) [B8]. TheUnited Kingdom ankylosing spondylitis study also showedan elevation in kidney cancer risk in association with gen-erally high (radiotherapeutic) doses (ERR = 0.10 (95% CI:0.02, 0.20) Sv–1) [W8]. Two smaller studies of radiother-apy for uterine bleeding or peptic ulcer did not exhibitraised risks [I4, C4], but they had low statistical power.
386. A number of studies of radiation workers haveshown no positive dose–response association or clear excessof kidney cancers. For example, the United Kingdomnuclear worker study [M12] observed 83 deaths due tokidney cancer compared with 89.7 expected, and a statisti-cally significant negative trend with external film badgedose: the ERR was <–1.95 (90% CI: <–1.95, –0.96) Sv–1.Likewise, there is a negative trend, albeit not a statisticallysignificant one (p = 0.848), with increasing film badge dosein the IARC three-country study, based on 88 deaths fromkidney cancer [C3]. The Canadian National Dose Registry[S8] reported 69 kidney cancer deaths versus 91.1 expected(SMR = 0.76; 90% CI: 0.61, 0.93) among male workers,and 21 kidney cancer deaths versus 26.5 expected (SMR =0.79; 90% CI: 0.53, 1.14) among female workers. Generally(non-significant) negative trends of kidney cancer mortalitywith external dose were observed in a United Kingdomcohort of workers at a uranium production facility. Onlywith a 20-year lag is the trend with dose (non-significantly)positive [M5]. Likewise, generally negative trends of kidneycancer mortality rates with external film badge dose areobserved among workers at the Chapelcross plant in theUnited Kingdom [M6]. The study of Artalejo et al. [A32]reported a slight excess of kidney cancer mortality amongworkers for the Spanish Nuclear Energy Board; the SMRwas 1.26 (95% CI: 0.34, 3.21), based on only 4 cancerdeaths, of which 2 were among the 27% of the cohort whohad been miners and may have been exposed to alpha radi-ation [A32]. The statistical power of all of the occupationalstudies is limited by the low levels of dose.
(b) Internal low-LET exposures
387. Three studies have examined kidney cancer risk inrelation to internal exposure to low-LET radiation. ASwedish study of cancer incidence following 131I treatmentfor hyperthyroidism reported significantly more kidney can-cers in the 131I-treated group than expected on the basis ofgeneral population rates. However, a dose–response analy-sis was not reported, so it is unknown whether the excesswas associated primarily with hyperthyroidism or with radi-ation exposure [H6]. A United States study of mortality fol-lowing hyperthyroidism treatment showed no excess riskfor kidney cancer [R3]. A study of 6,841 Swedish, Frenchand Italian patients treated with a mixture of conventional(external beam) radiotherapy and 131I for thyroid cancerrecorded a modest, and statistically significant, increase inkidney cancer incidence rate (SIR = 2.6; 95% CI: 1.7, 3.8;31 cases) [R38]. However, there was no relation with 131Iexposure; risks were comparable in the group treated withand that treated without 131I (SIR = 2.6 in both cases) [R38].
(c) Internal high-LET exposures
388. The only recent study of kidney cancer risk in rela-tion to internal high-LET radiation exposure was of a groupof Danish, Swedish and United States patients who receivedthe diagnostic contrast medium Thorotrast, and a compan-ion group who received a non-radioactive contrast medium[T30]. There were 12 cases of kidney cancer in the exposedgroup and 4 in the control group, representing an RR of5.7 (95% CI: 1.9, 21.0, p < 0.05) [T30]. The RR alsoincreased with increasing interval of follow-up (p < 0.001),suggesting a causal association between Thorotrast expo-sure and the risk of kidney cancer; however, there was nostatistically significant trend with increasing volume ofinjected Thorotrast (p = 0.23). No statistically significantexcess of kidney cancer has been observed in German orJapanese Thorotrast-exposed groups [M19, V4]. Ishikawaet al. [I15] have estimated that the kidney in Thorotrastpatients would typically receive a relatively modest radia-tion dose, of about 1.5 mGy per year. Given that the kidneyappears to be relatively radio-resistant, it is unlikely thatthe excess risk observed in the three-country study iscausally associated with the Thorotrast exposure.
389. In a Finnish study of persons exposed to dissolvedradioactive material (predominantly 222Rn, but also 234U,238U, 226Ra, 210Po and 210Pb), the incidence of kidney cancerwas not statistically significantly associated with ingestedaggregate quantities of radon, radium or uranium, or withthe aggregate kidney dose [K56].
4. Summary
390. There is weak evidence linking the risk of kidneycancer with radiation exposure. The strongest evidence isfrom those studies (on patients with cervical cancer andankylosing spondylitis) where the kidney doses were likely
UNSCEAR REPORT-PART 1.qxp 10/7/08 2:58 pm Page 98
to have been high (in the radiotherapy range), suggestingthat there is no strong dose response for kidney cancer.
T. Brain and central nervous system tumours
1. General background
391. The most common types of tumour of the brain andcentral nervous system (CNS) are gliomas, meningiomasand schwannomas. Schwannomas (also known as neuro-lemmomas) and most meningiomas are benign, whereasgliomas are malignant. Depending on tumour location,benign and malignant tumours of the CNS can have simi-lar symptoms and outcomes. As a result, the two types oftumour are not always easily distinguished, and manytumour registries routinely include benign and malignanthistological types in their evaluations of CNS tumour inci-dence [I20, P32].
392. Annual age-standardized world incidence rates forCNS cancers range from about 1.0 to about 10 per 100,000persons, but, since the quality of medical care varies fromcountry to country and the reporting of benign tumours isinconsistent among registries, international comparisons ofreported CNS tumour incidence rates can be misleading[P19]. The fact that lower incidence rate values are reportedprimarily by cancer registries with uncertain completenessof ascertainment suggests that country-to-country variationis probably considerably smaller than current reporting indi-cates. Over the last few decades, brain tumour incidenceand mortality rates have increased, especially for the eld-erly, but whether this is a real increase or a result of betterdiagnosis and reporting is controversial [I20, P32].Meningiomas are more common in females than in males,but malignant CNS tumours occur more frequently amongmen [P19]. This section will consider both benign andmalignant CNS tumours occurring within the cranium(brain, cranial nerves and cranial meninges), spinal cord,spinal meninges and peripheral nervous system, because ofthe potential problem of misclassification or inconsistentclassification according to tumour behaviour. In addition,since the rates used for comparison in some studies arederived from tumour registries that combine all CNStumours into one category, results are reported for all CNStumours together and not only for malignant tumours.
393. Primary malignancies of the CNS are among themost lethal of cancers. In the United States, 5-year survivalfor malignant CNS tumours is approximately 30% [R28].Survival for benign meningiomas has improved consider-ably over the past few decades but, depending on tumoursize and location, the quality of life can be severelyimpaired [L74].
394. While the aetiology of CNS tumours remains elusive, therapeutic irradiation of the head and neck
during childhood is an established risk factor [I20, P32].Findings of inverse associations between risk of glioma andself-reported history of asthma or allergies has promptedinterest in the possible importance of immune system factors [B45, S52, W31, W32]. A small proportion of brain and nervous system tumours occur in association with family cancer syndromes, such as Li–Fraumeni syn-drome, neurofibromatosis types 1 and 2, and hereditary retinoblastoma [L73].
2. Summary of UNSCEAR 2000
(a) External low-LET exposures
395. A significant relationship between radiation dose andCNS tumour risk was demonstrated in the Israeli tinea capi-tis study [R17] and in various other studies of radiotherapyused to treat non-malignant conditions [A7, H10, H26, K14,K15, L4, S45, S53, S54, S68]; however, CNS tumour incidence rates were not elevated in a Swedish study of persons treated for haemangioma in childhood [L10].
396. A higher than expected number of second primaryCNS tumours among survivors of childhood cancers hasbeen noted in several studies [B43, D16, D19, E7, L16,L24, N14, W11]. There is evidence of risk being higher forbenign CNS tumours than for malignant CNS tumours [L24,R17]. Data on adult exposures are considerably more lim-ited. Following high dose (~40 Gy) fractionated radiother-apy, an excess risk of CNS tumours was observed amongpituitary adenoma patients [B13], but lower doses, of 0.6Gy, are not associated with an increase in CNS tumour inci-dence or mortality rates in two small cohorts of infertilewomen whose pituitary glands and ovaries were irradiated[R29, R30]. Ankylosing spondylitis patients did not havean excess of mortality from spinal cord tumours after theirspinal cords were exposed to high radiation doses [W8].
397. Radiation workers in general receive low, fraction-ated doses with relatively little exposure of the brain. Todate, most occupational studies have been negative withrespect to brain cancer [C3, M12, W29].
398. Dental diagnostic X-ray exposures have beenassessed in several studies conducted by Preston-Martin etal. in relation to various types of CNS tumour [P33, P34,P35, P36]. They found associations between meningiomaand both frequent full-mouth X-ray examinations and X-rayexaminations performed many years ago, when radiationdoses were relatively high. In other studies, however, braintumour cases did not have a history of dental X-ray expo-sure significantly more often than controls [R31].
399. The issue of whether CNS tumours are related tofoetal exposure to radiation remains controversial. Doll andWakeford [D37] carefully reviewed the literature and con-cluded that in utero exposure to a mean dose of approxi-mately 10 mGy increases the risk of childhood cancer. This
ANNEX A: EPIDEMIOLOGICAL STUDIES OF RADIATION AND CANCER 99
UNSCEAR REPORT-PART 1.qxp 10/7/08 2:58 pm Page 99
100 UNSCEAR 2006 REPORT: VOLUME I
conclusion was largely based on the Oxford Survey ofChildhood Cancers (OSCC). In the OSCC, mortality fromchildhood CNS tumours was associated with foetal irradia-tion (RR = 1.4; 95% CI: 1.2, 1.7) [B2]. Miller and Boice[B42, M48] expressed concern about the OSCC results,noting that all childhood cancers were increased by about40%, whereas such commonality is not seen in either animalor human studies. Among survivors of the atomic bomb-ings exposed in utero, an association between dose andcancer mortality risk has not been found, but the in uterosurvivor cohort is small, with consequently limited statisti-cal power, and the negative result is therefore compatiblewith a wide range of possible risk values [D14].
(b) Internal low-LET exposures
400. Little is known about brain and CNS tumours fol-lowing internal exposure to low-LET radiation. A smallincreased risk of CNS tumours was observed among 35,000 Swedish patients receiving diagnostic 131I examina-tions, although since the dose to the brain was less than 10 mGy, the observed excess is not likely to be due to theradiation exposure [H8]. Significant excess risks were not demonstrated for patients receiving 131I therapy for hyper-thyroidism [H6, H24, R3] or thyroid cancer [D38, E8, G24,H2]; however, among 10-year survivors, the brain tumourincidence rate was significantly elevated in the Swedishhyperthyroid patients [H6].
(c) Internal high-LET exposures
401. Danish patients exposed to Thorotrast, a radiographiccontrast agent associated with internal exposure to alpha-particle-emitting radionuclides, had a significantly elevatedincidence of brain tumours, but the fact that these tumoursdeveloped very soon after the Thorotrast examination sug-gests that they are related to the underlying disease or tobetter ascertainment rather than to the Thorotrast itself [A5].Thorotrast was given in conjunction with cerebral angio-graphy because of a suspected brain disorder. Often this disorder was later found to be a brain tumour, especiallyamong epileptic patients. Brain malignancies and other CNStumours have not been linked to exposure to radium [S50]or radon among miners [D10].
3. New or updated studies
(a) External low-LET exposures
402. As summarized in table 39, the epidemiological literature provides evidence for an association between ionizing radiation and tumours of the CNS.
403. A detailed investigation of CNS tumours in the LSSupdated data on tumour incidence up to 1995, and includedthorough tumour ascertainment and a pathology review[P33]. The intracranial tumours included 43 gliomas, 88 meningiomas and 33 schwannomas. There were nearly
statistically significant elevations in risk for glioma (ERR= 0.56 (95% CI: –0.2, 2.0) Sv–1) and meningioma (ERR =0.64 (95% CI: –0.01, 1.8) Sv–1, and a stronger associationfor schwannoma (including both intracranial and others,ERR = 4.5 (95% CI: 1.9, 9.2) Sv–1 (table 39). For nervoussystem tumours other than schwannomas, the lineardose–response model fits very well, while, for schwanno-mas, the dose–response relationship tended to curve down-wards at high doses (>2 Sv), albeit not significantly (p = 0.09) [P33]. For nervous system tumours other thanschwannomas, there was a suggestion of greater risk fol-lowing radiation exposure at earlier ages (p = 0.06 fortrend), such that those exposed before age 20 had ERR =1.2 (95% CI: 0.3, 2.9) Sv–1, and those after age 20 had ERR= 0.2 (95% CI: <–0.2, 1.0) Sv–1. There was no indicationof modification of risk due to time since exposure, sug-gesting that elevated risks may persist throughout the life-time. For nervous system tumours other than schwannomas,there was a greater radiation risk for males than females(ratio of ERRs per unit dose = 14, p = 0.05). The doseresponse for tumours of the nervous system remained significant when analysis was limited to persons with braindoses of less than 1 Sv.
404. It was estimated that 14% of the first primarytumours of the CNS and pituitary gland occurring in theLSS cohort would have been attributable to radiation [P33],and clinical characteristics of the tumours occurring in thisstudy population were similar to those of spontaneoustumours in population-based studies [Y6]. While in NorthAmerica and Europe, tumours of neuroepithelial origin pre-dominate, meningioma is the most common neural tumourin Japan.
405. As in earlier reports, the most recent analysis of mor-tality data from the survivors of the atomic bombings doesnot show a statistically significant association between mor-tality due to tumours of the brain or CNS and radiation dose[P9]. An earlier analysis showed virtually no associationwith brain tumour risk but a non-significant positive asso-ciation with the risk of CNS tumours other than those ofthe brain [P1].
406. A significant relationship between radiation dose andCNS tumour risk was demonstrated in the latest follow-upof the Israeli tinea capitis study [S48]. The mean age at thetime of irradiation was 7.1 years. Risks of both benignmeningioma and malignant brain tumours were associatedwith dose in this tinea capitis cohort [S48]. Thedose–response relationship was stronger for meningiomathan for malignant brain tumours. The ERR was 4.63 (95%CI: 2.43, 9.12) Gy–1 for meningioma and 1.98 (95% CI:0.73, 4.69) Gy–1 for malignant tumours. The EAR was 0.48(95% CI: 0.28, 0.73) (104 PY Gy)–1 for meningioma and0.31 (95% CI: 0.12, 0.53) (104 PY Gy)–1 for malignant braintumours. The ERR for malignant tumours was inverselyassociated with age at irradiation, varying from 3.56 Gy–1
for those under age 5 at the time of exposure to 0.47 Gy–1
for those over age 10. The ERR per unit dose for meningioma
UNSCEAR REPORT-PART 1.qxp 10/7/08 2:58 pm Page 100
showed little relation to age at exposure. The risk of bothtypes of tumour remained elevated after 30 years. The EARincreased with increasing follow-up time, reaching 0.31 (104
PY Gy)–1 and 2.03 (104 PY Gy)–1 after 30 years for malig-nant brain tumours and meningioma, respectively. The ERRper unit dose did not appear to differ between the sexes. Themalignant brain tumours were predominantly (75%) ofneuroepithelial origin. The results of this study are thereforeconsistent with earlier reports of larger risks for benign braintumours than for malignant brain tumours [L24].
407. Recent follow-up of a cohort of 4339 Dutch patientsgiven nasopharyngeal radium irradiation did not reveal evidence of increased brain cancer incidence or mortalityrate [R4, R41]. The average dose to the brain was 1.8 cGy.A smaller study from Maryland (United States) noted anelevated number of brain tumours, three of which weremalignant and four benign, but the RR estimate was highlyunstable (RR = 14.6; 95% CI: 0.76, 286.3) [Y7].
408. For patients irradiated for hereditary retinoblastoma,the risk of developing a brain cancer was 16 times that forthe general population [K43]. Young children who receivedcranial irradiation as a conditioning regimen before bonemarrow transplantation were found to have a significantlyelevated RR of developing brain or other CNS cancers.However, it was likely that earlier cranial radiotherapy totreat acute lymphoblastic leukaemia prior to bone marrowtransplantation (and associated whole-body irradiation)played an important role in the development of these neuralmalignancies [C26].
409. Data on adult exposures are considerably more lim-ited. Longstreth et al. [L75] reported an association betweenmeningioma risk and having had six or more full-mouth X-rays 15–40 years before diagnosis, but little evidence ofa dose–response relationship. These data somewhat supportthe earlier studies of Preston-Martin et al. discussed above[P33, P34, P35, P36].
410. As was true of the earlier studies of radiation work-ers, most occupational studies to date have been negativewith respect to this site of cancer, in particular two studiesof radiologists and radiologic technologists [S29, Y5]. Arecent study of 191,333 workers in Canada exposed occu-pationally to very low doses of radiation (mean dose of 6.64mSv) did not show an increased incidence rate of braincancer relative to the general population (SIR = 0.79; 95%CI: 0.67, 0.93) [S8].
411. Although not considered in the UNSCEAR 2000Report [U2], the study of Artalejo et al. [A32] reported aslight excess of brain and CNS cancer mortality amongworkers for the Spanish Nuclear Energy Board; the SMRwas 1.33 (95% CI: 0.61, 2.52), based on 9 cancer deaths,of which 2 were among the 27% of the cohort who hadbeen miners and may have been exposed to alpha radiation[A32]. Rogel et al. [R54] reported excess mortality due tobrain and CNS cancer at borderline levels of statistical
significance compared with French national mortality rates among radiation workers of Électricité de France (16 observed versus 10.3 expected deaths; SMR = 1.56;90% CI: 0.98, 2.37); there was no statistically significanttrend of mortality with dose (ERR = –4.1 (90% CI: –9.9,28.9) Sv–1).
(b) Internal low-LET exposures
412. There have been no new studies since theUNSCEAR 2000 Report [U2].
(c) Internal high-LET exposures
413. There has been a recent analysis of cancer mortalityin a group of Danish and Swedish patients who underwentcerebral angiography with Thorotrast and in a comparisongroup of patients who underwent cerebral angiography witha non-radioactive contrast agent [T30]. The RR was not sig-nificantly different from 1.0, suggesting that apparentincreases seen in previous analyses [A5] may have been dueto pre-existing brain tumours rather than to radiation expo-sure. Radiation doses to the brain were very low relative tothose to the liver, spleen or bone marrow.
4. Summary
414. Ionizing radiation can induce tumours of the CNS,although the relationship is not as strong as for several othertumours, for example breast and thyroid cancer orleukaemia, and most of the observed radiation-associatedtumour risk occurs for tumours that are benign. Overall,exposure during childhood appears to be more effective intumour induction than adult exposure, but the data on adultexposures are fairly sparse, and the most recent study ofsurvivors of the atomic bombings demonstrated ERRs forneurilemmoma following exposure at all ages. Little isknown about other factors that modify risk. The associationbetween the risk of benign tumours, particularly menin-gioma and neurilemmoma, and radiation exposure appearsto be substantially stronger than the risk of malignanttumours. Additional data are needed to better characterizethe dose response for CNS tumours of various histologicaltypes, especially for glioblastoma.
U. Thyroid cancer
1. General background
415. Thyroid cancer is one of the less common forms ofcancer, and cases constitute somewhat less than 2% of allcancers [P19]. Unlike most cancers, the thyroid cancer inci-dence rate is relatively high before age 40 years, increasescomparatively slowly with age, and is about three timeshigher in women than men. This predominance among
ANNEX A: EPIDEMIOLOGICAL STUDIES OF RADIATION AND CANCER 101
UNSCEAR REPORT-PART 1.qxp 10/7/08 2:58 pm Page 101
102 UNSCEAR 2006 REPORT: VOLUME I
females is also observed for benign thyroid tumours.Incidence (world adjusted) rates for much of the worldrange between 1 and 2 cases per 100,000 males and between2 and 8 per 100,000 females [P19]. Data from many coun-tries suggest that incidence rates are increasing while mor-tality rates are falling [F16].
416. Papillary, follicular and anaplastic thyroid carcino-mas originate from cells derived from the follicular epithe-lium, and they constitute about 95% of thyroid cancers.Medullary cancers also arise from epithelial cells, but fromthe calcitonin-producing parafollicular or C-cells. Thedegree of malignancy varies widely with histological type,ranging from the rapidly fatal anaplastic type to the rela-tively benign papillary type [R42, S87]. Overall 5-year survival is close to 90%, because papillary carcinoma is the predominant type (usually over 65% of cases) of thyroid cancer, whereas anaplastic carcinoma is relativelyrare (generally less than 15% of cases).
417. Ionizing radiation is a well-documented cause of thyroid cancer. For the most part, radiation-related thyroidcancers are papillary carcinomas, and their clinical courseis similar to that of other thyroid cancers [S87]. The RR ofthyroid cancer is substantially increased among persons witha history of self-reported benign nodules and goitre, but thecausal role of these benign diseases is unclear. There issome evidence that elevated levels of thyroid-stimulatinghormone, multiparity, miscarriage, artificial menopause,iodine intake and diet also may be risk factors for thyroidcancer [R42, S87].
2. Summary of UNSCEAR 2000
418. The UNSCEAR 2000 Report [U2] concluded that thethyroid gland is highly sensitive to the oncogenic effects ofexternal radiation exposure during childhood and that alinear dose–response relationship was consistent with thepublished data. Age at exposure is an important modifier ofrisk, with a strong tendency for the risk to decrease withincreasing age at exposure.
419. A pooled analysis of studies of external irradiationof the thyroid [R6] allowed a more detailed evaluation ofthe dose–response relationship and of modifying factorsthan had previously been possible. In the analysis of thefive cohort studies of persons irradiated before age 15 years,436 thyroid cancers were diagnosed among the exposedpopulation. The pooled ERR was 7.7 (95% CI: 2.1, 28.7)Gy–1, and each of the studies in the pooled analysis wasconsistent with a linear dose–response relationship, althoughthe range of doses varied considerably among studies [R6].No single study was found to have an undue influence onthe overall estimates of risk.
420. The ERR per unit dose for females was nearly twicethat for males, but the results were not consistent acrossstudies [R6]. Since thyroid cancer naturally occurs two to
three times more frequently among females than males, theabsolute radiation-induced risk was correspondingly higherfor women. Even within the narrow range of ages at expo-sure, there was strong evidence of a decrease in the ERRwith increasing age at exposure, which suggests that thethyroid is particularly sensitive to tumour induction at thetime of rapid cell proliferation [W14]. The ERR per unitdose was highest between 15 and 29 years following child-hood exposure, but it remained high for more than 40 yearsafter exposure [R6]. The latter finding was also reportedfrom an extended follow-up study of the Stockholm skinhaemangioma cohort in Sweden [L13]. In contrast to thewell-described carcinogenic effects of external exposure inchildhood, data are sparse regarding exposure after age 20 years. To date, there is little evidence of an excess thyroid cancer risk associated with adult exposure [R6,S14]. Among survivors of the atomic bombings exposedafter age 40 years, the ERR was negative [T1].
421. Elevated risks of thyroid cancer were reported forpatients treated with high-dose radiotherapy for Hodgkin’sdisease [H19, T5], for childhood cancers [B63, D50, H5]and for bone marrow transplant patients undergoing high-dose whole-body radiation [C26]. Few studies, however,described the shape of the dose response or reported quan-titative risk estimates.
422. Information about occupational exposure to radiationand risk of thyroid cancer is limited. Radiation workers gen-erally receive low, fractionated doses to the thyroid gland.The low doses and the relative rarity of the disease makeincreased risks difficult to observe in most epidemiologicalstudies. A few studies have reported elevated risks [A34,B64, C46, W29], but they had several methodological limitations. Results were based on a small number of cases,individual dose estimates were not available and multiplecomparisons were tested.
423. The carcinogenic effects of internal exposure to 131Iare less well understood. Most epidemiological studies haveevaluated the risk of thyroid cancer for patients receivingdiagnostic 131I or high-dose 131I treatment for hyperthy-roidism or thyroid cancer. Results from these investigationshave provided little evidence of increased risk following awide range of exposure levels, but almost all of the studypatients were adults at the time of exposure, and the stud-ies therefore do not allow strong inferences about the risksof childhood exposure. In addition, although individual thy-roid doses have not been calculated, the intention of treat-ment with 131I for hyperthyroidism is to deliver 60–100 Gyof radiation to destroy thyroid gland function [B53]. Thusthere is a substantially reduced chance of subsequentlydeveloping thyroid cancer. In two [F1, R3] out of the three[F1, H6, R3] cohort studies of hyperthyroid patients treatedwith 131I, small elevated risks of thyroid cancer wereobserved soon after therapy, but no dose response wasdemonstrated. These findings suggest that some of theobserved excess may be due to close medical surveillanceand to the underlying thyroid disease.
UNSCEAR REPORT-PART 1.qxp 10/7/08 2:58 pm Page 102
424. Early studies of populations exposed to radiation fol-lowing the Chernobyl accident indicated that exposure toradioactive iodine, primarily 131I, during childhood waslinked to thyroid cancer development, but the level of riskwas at that time not well quantified [A35, B65, D47, K53,L94, S86, T40, T44]. The risk appeared to increase withdecreasing age at exposure [A10, K52, P44, W13], andsome data suggested that risks were beginning to stabilizefor individuals who were in their teens at the time of theaccident [K52, T40]. “Ecological studies” of thyroid cancerrisks due to exposure arising from the Chernobyl accidentreported strong associations between childhood exposure to131I and early development of thyroid cancer [J7, J8, L94,L95], with EARs and ERRs generally being lower andhigher, respectively, than those observed in studies of exter-nal radiation exposure.
3. New or updated studies
(a) External low-LET exposures
425. Studies conducted since the 2000 UNSCEAR Reportwas issued (table 40) continue to demonstrate clearly astrong association between external low-LET radiationexposure and increased risk of thyroid cancer. New data onradiation-related thyroid cancer in AHS members, a sub-group of the LSS of survivors of the atomic bombings, werepublished recently [I28]. In a population of 3,185 membersof the AHS with DS02 dose estimates and who participatedin a special thyroid screening examination conductedbetween 2000 and 2003, the prevalence of malignant thy-roid tumours was 2.2%. Almost 60 years after the bomb-ings, a significant linear dose–response relationship wasfound (p < 0.001), and the EOR was 1.95 (95% CI: 0.67,4.92) Sv–1 for a person aged 10 years at the time of expo-sure. This risk is about one third of those found in the1958–1987 tumour-registry-based follow-up including themembers of the full LSS cohort who were about the sameage at exposure [T1]. This is partly due to the difference instatistical models used and to the fact that only a small sub-group of the LSS cohort was evaluated in the current report.The ERR is decreasing somewhat with time since the bomb-ings, and the study shows a small reduction (about 10%) inrisk related to the use of the new dosimetry system [P10].
426. Risk decreased with increasing age at exposure,although the effect of age at exposure was not statisticallysignificant (p = 0.10). The EORs for persons exposed atages 0–9, 10–19 and 20+ years were 3.45 (95% CI: 0.92,10.51) Sv–1, 1.49 (95% CI: 0.37, 3.74) Sv–1 and 0.25 (95%CI: –0.29, 1.96) Sv–1, respectively. The major limitation ofthis study is the low participation rate. Of the 11,028 AHSmembers alive in 1990, 8,995 were invited to the biennialAHS examination. Of these only 4,552 actually presentedthemselves for the examination, and 4,091 participated inthe special thyroid examination. This resulted in an overallparticipation rate of 37% of living AHS members or 46%of the invited members.
427. Two studies of X-ray treatment for benign medicalconditions have been published. One study, conducted innorthern Sweden, was of thyroid cancer following X-raytreatment for benign conditions of the cervical spine (50%females) [D1], and the other was a new follow-up (themedian follow-up time was 39 years) of the New York tineacapitis study [S68]. The Swedish study is notable becausethe patients were adults at the time of radiation treatment.Out of three series totalling 27,415 patients who weretreated with X-rays, 8,144 had received such treatment tothe cervical spine. For these, the thyroid gland was in theprimary beam. The remaining 19,271 persons who receivedX-ray treatment other than to the cervical spine served asa comparison group.
428. The X-ray series consisted of three treatments givenat 2–3 day intervals, with a skin dose of 100–200 R at eachtreatment: 84% received one treatment series, 13% twoseries, and 3% three or more series. The average thyroiddose was about 1.0 Gy. For the other 19,000+ members ofthe cohort, the thyroid doses were very low. In the wholecohort, 51 thyroid cancers were diagnosed: 22 in the high-dose group and 29 in the low-dose group. The ERR was0.58 Gy–1.
429. In the tinea capitis study in the United States, 2 thy-roid cancers occurred among 2,224 irradiated subjects,whereas none occurred among the 1,380 controls [S68]. Theexpected number of thyroid cancers in the irradiated groupwas 2.04, and the mean thyroid dose was 0.06 Gy, result-ing in an ERR of –0.67 (95% CI: –29.96, 86.41) Gy–1 [S68],which is lower than, but not inconsistent with, the Israelitinea capitis study [R9], and is exactly the risk obtained inthe pooled analysis of external radiation [R6]. The EARbased on an earlier follow-up [S14] was 1.5 (90% CI: 0,9.4) (104 PY Gy)–1, which is consistent with several otherstudies of external radiation exposure in childhood.
430. Because survival for childhood cancer patients hasincreased substantially, the risk of developing a second pri-mary cancer has become a more prominent concern. Asnoted earlier, the thyroid gland is particularly sensitive toradiation exposure at early ages, and therefore quantifyingthe risk of developing thyroid cancer following radiother-apy for childhood cancer is important. Elevated radiation-related risks of thyroid cancer have been noted amongyoung patients receiving radiotherapy for Hodgkin’s dis-ease, non-Hodgkin’s lymphoma, neuroblastoma, Wilm’stumour, leukaemia, Ewing’s sarcoma and malignancies ofthe central nervous system [I27, K7]. Since the UNSCEAR2000 Report, a number of new studies on secondary thy-roid cancer have been published demonstrating that the pri-mary thyroid cancer incidence rate following radiotherapyfor a first childhood malignancy is significantly greater thanexpected. The magnitude of the risk estimates, however, isgenerally substantially lower for patients receiving radio-therapy for cancer than those found for people receivingtreatment for benign disease, or for survivors of the atomicbombings. This appears to be due to flattening out of the
ANNEX A: EPIDEMIOLOGICAL STUDIES OF RADIATION AND CANCER 103
UNSCEAR REPORT-PART 1.qxp 10/7/08 2:58 pm Page 103
104 UNSCEAR 2006 REPORT: VOLUME I
dose response at doses above several grays, because of thecompeting effect of cell killing, in which the cells availableto transform into malignant cells are, for the most part,depleted. Little and Wright [L26] have shown that, as theaverage or maximum dose in the medical studies increases,the ERRs derived in medical studies become smaller rela-tive to those of subgroups of survivors of the atomic bomb-ings of similar age and sex distribution.
431. In Italy, 113 children who underwent bone marrowtransplants between 1981 and 1991 and survived at least 3 years were followed to determine the incidence of sub-sequent thyroid cancer [C44]. Eight patients developed sec-ondary thyroid cancer between 3 and 16 years after thetransplant. When a multiple regression analysis was per-formed, there was a suggestion of an association betweenincreased thyroid cancer risk and radiotherapy doses ofmore than 10 Gy compared with doses of less than 10 Gy(RR = 4.3; 95% CI: 0.67, 7.3). However, the number ofcases was small, and the result did not reach statistical significance.
432. Secondary thyroid cancers occurred in excess fol-lowing radiotherapy for childhood neuroblastoma in acohort of 544 patients who had survived 5 years and whowere treated in eight centres in France and the UnitedKingdom [R47]. Slightly more than 294 (50%) of thepatients were treated between 1948 and 1986 with radiation(214 received both radiotherapy and chemotherapy). Themean thyroid dose was 3.4 Gy. Among the 5 patients whodeveloped a secondary thyroid cancer, the mean thyroiddose was 6.7 Gy. However, the dose distribution wasextremely variable, with 3 patients receiving doses of lessthan 1 Gy and 2 patients receiving doses of more than 10 Gy (specifically, 14 and 19 Gy). None of the 5 patientswas treated with chemotherapy. The ERR was 0.50 (95%CI: <0, 16) Gy–1. The authors noted, however, that the treat-ment protocols used during the study period have since beenchanged, and the more recent protocols involve less radio-therapy and more intensive chemotherapy, so this findingmay not reflect current practice.
433. In a study of 446 children with childhood malig-nancies who survived 5 years and who were treated withradiation between 1954 and 1980, 3 subsequent thyroid can-cers were diagnosed when only 0.2 were expected, result-ing in an RR of 13.7 (95% CI: 2.8, 38) [G20]. No otherinformation about the thyroid cancers was provided in thereport.
434. The largest and most comprehensive study of radio-therapy-related secondary thyroid cancer was publishedrecently [R48, S88]. This nested case-control study included69 cases of secondary thyroid cancer and 265 controls.Controls were matched paediatric cancer survivors who didnot have a subsequent thyroid cancer. Both the cases andthe controls were identified from the cohort of over 14,0005-year survivors enrolled in the Childhood Cancer SurvivorStudy, and all had individual thyroid dose estimates. The
first cancers were diagnosed between 1970 and 1986, sothe data on these represent the effects of early treatmentprotocols. Radiotherapy was associated with an increase inthe risk of developing a secondary thyroid cancer, and therisk rose with increasing radiation dose up to 29 Gy. Above30 Gy, a downturn in the RR was seen. No association withchemotherapy was noted.
435. In a paper describing more detailed analyses [R48],the authors reported an ERR of 0.51 Gy–1 over the wholerange of doses. The linear model, however, was not the bestfitting model. The best fitting model described an ERR of1.3 (95% CI: 0.4, 4.1) Gy–1 at doses of below 6 Gy, witha significant downturn in the risk above 6 Gy. At 40 Gy,the ERR per unit dose had decreased by about 95%. Atdoses of less than 6 Gy, the risk appeared to decrease withincreasing age at treatment.
436. When taken together, the current research providesclear evidence of an increase in thyroid cancer risk amongpatients treated with high-dose radiotherapy for childhoodcancer; however, the risks per unit dose are smaller thanthose observed for persons receiving lower doses. The exactshape of the dose–response curve at doses of above 10 Gy,as well as the role of age at treatment for the first cancer,type of first cancer and sex, are not yet well characterized.
437. Few studies of thyroid cancer occurring subsequentto radiotherapy given to adult cancer patients have had ade-quate information on doses. Using the United States SEERcancer registry data, Huang et al. [H11] investigated therisk of thyroid cancer for 48,495 women who receivedradiotherapy between 1973 and 1993 for breast cancerduring the first four months after diagnosis compared with146,303 breast cancer cases from the same years who didnot receive radiotherapy during the first four months afterdiagnosis. A total of 28 women in the radiotherapy cohortand 112 women in the unexposed cohort subsequentlydeveloped thyroid cancer. Up to 20 years after diagnosis ofbreast cancer, there were no differences in thyroid cancerrisk between the two groups (RR = 1.0; 95% CI: 0.7, 1.5).However, a subgroup of women who were more likely tohave received higher doses of radiation to the thyroid glandhad an RR of 1.7 (95% CI: 0.9, 3.2).
438. The main limitations of this study were that follow-up times tended to be short, radiation doses to the thyroidgland were not known, radiotherapy data were availableonly at the time of initial treatment and information on othertreatments was not available.
439. Information on fractionated and low-dose-rate expo-sures can come from studies of occupational exposure toradiation. However, occupational studies of thyroid cancergenerally are not very informative, because thyroid dosesare rarely available; many occupational groups, e.g. nuclearworkers, are predominately male; and cancer mortality oftenhas been the study end point, thereby missing most casesof thyroid cancer, which are usually survivable. Finally, it
UNSCEAR REPORT-PART 1.qxp 10/7/08 2:58 pm Page 104
is the thyroid of the young that has been shown to be verysensitive to radiation, whereas workers are obviouslyexposed as adults. Studies that considered thyroid cancersince the UNSCEAR 2000 Report was published have beennegative on the whole [A22, M4, M34], but have had toofew cases of thyroid cancer to draw any clear conclusions.
440. Thyroid cancer incidence rates were elevated amongCanadian radiation workers, mainly medical workers, com-pared with national Canadian cancer rates [S8]. Doseresponse was not evaluated, because of the few cases withsignificant doses. Similarly, thyroid cancer incidence rateswere higher than expected among United States radiologictechnologists compared with rates for the United States pop-ulation [S29]. It should be noted, however, that when com-paring medical workers with the general population,presumed better medical diagnosis and reporting among theworkers warrant attention.
441. As a consequence of the Chernobyl accident, largenumbers of men from all over the former Soviet Union werebrought in to participate in decontamination and other clean-up activities at the reactor and in the surrounding 30 kmzone. Approximately 600,000 workers (often called “liquidators” or “clean-up workers”) were involved; about240,000 of them worked during 1986 and 1987. Recoveryoperation workers were exposed to varying levels of exter-nal gamma and beta radiation, depending on their specificjobs and the time period and duration of their work. Internalexposure due to radioiodines was minor after the first fewweeks, but a small number of workers who were on-sitesoon after the accident may have been irradiated internally,resulting in sizeable thyroid doses [U2]. Doses to the thy-roid are very uncertain, but the estimated mean thyroid doseis about 0.2 Gy. The majority (about 65%) of workers arelikely to have received doses to the thyroid of less than 0.15 Gy [K10].
442. To date, there is no evidence of a dose response forthyroid cancer incidence among the recovery operationworkers [I10, R11, R49]. A combined cohort of 10,332Latvian and Estonian recovery operation workers, with amean external whole-body dose of 109 mGy, was followeduntil 1998 using national population, mortality and cancerregistries [R49]. Compared with age-, sex- and calendar-year-specific national cancer rates, the recovery operationworkers had a significantly elevated risk of thyroid cancerbased on 3 cases. There was, however, no correlation withdose, and the workers were under close medical surveillance,suggesting that the enhanced incidence rate of thyroid cancerseen was related to medical care practices rather than radi-ation exposures. Given the low doses and older ages at expo-sure, these negative findings are consistent with data fromthe LSS of survivors of the atomic bombings [T1].
443. Within the framework of large studies of RussianChernobyl recovery operation workers [I30], thyroid cancerincidence between 1986 and 1998 was evaluated among 99,024 workers [I29]. Fifty-eight thyroid cancers occurred
during the study period. Similar to the results describedabove for Estonian and Latvian recovery operation work-ers, the incidence rate of thyroid cancer was significantlyhigher (SIR = 4.33; 95% CI: 3.29, 5.60) among Russianrecovery operation workers compared with rates for theRussian male population, but the risk of thyroid cancer wasnot significantly elevated when an internal comparisonbased on external dose was performed. The workers’ ele-vated thyroid cancer incidence rate compared with that forthe general Russian population was likely to be due to morefrequent and comprehensive medical examinations.
(b) External high-LET exposures
444. No new studies of external high-LET radiation expo-sures and thyroid cancer risks have been published sincethe UNSCEAR 2000 Report.
(c) Internal low-LET exposures
445. Since the UNSCEAR 2000 Report, a large body ofdata on internal low-LET radiation exposure, especially to131I, has accumulated from studies of situations involvingmedical and environmental exposures. New information hascome from studies of radioactive deposits from the Hanfordnuclear weapons plant emissions and from the Chernobylaccident.
446. Hahn et al. [H1] studied thyroid cancer subsequentto diagnostic administration of 131I to German patients under18 years of age. Among the 2,262 patients who receiveddiagnostic 131I, 74% were females, the median age at firstexamination was 14.9 years, the mean follow-up time was20.9 years and the average thyroid dose was about 1.0 Gy.
447. In a small subgroup of examined study participants,2 thyroid cancers were found among the 789 irradiatedpatients, and 3 were found in the unexposed group of 1,118children who underwent other thyroid diagnostic procedures.The ERR was –0.14 (95% CI: –0.9, 4.1). Thus there was noevidence of risk associated with administration of 131I.
448. It should be noted that only 20% of the study pop-ulation were younger than 11 years of age at the time of131I exposure, and 9% were less than 6 years of age; hencemost of the exposures were received when the subjects wereolder than the most radiosensitive ages for thyroid cancerinduction. Only 35% of the exposed subjects and 41% ofthe unexposed subjects participated in the examination pro-gramme, and such low participation rates increase the like-lihood of selection biases. Additional opportunity forselection biases may have occurred in that several of the10 participating hospitals had either only exposed patientsor mostly/only unexposed patients, so that institutionalimbalances could have biased the results. Because of thesmall sample size, the study had 80% statistical power todetect RRs on the order of fourfold. Since 80% of the sub-jects were older than age 10 at exposure, an RR of 4 ormore for a 1 Gy exposure would probably not be expected.
ANNEX A: EPIDEMIOLOGICAL STUDIES OF RADIATION AND CANCER 105
UNSCEAR REPORT-PART 1.qxp 10/7/08 2:58 pm Page 105
106 UNSCEAR 2006 REPORT: VOLUME I
449. The follow-up to the Swedish study of the long-termeffects of diagnostic 131I administration has been extended8 years to 26 years on average, and tabulations of thyroidcancers included those observed more than 2 years after 131Iadministration (rather than the 5-year minimum period ofprevious reports) [D42]. For the 1,767 patients who hadreceived previous external radiation to the head and neck,and the 11,015 patients who had been referred because ofsuspicion of a thyroid tumour, there were elevated risks,SIR = 9.8 (95% CI: 6.3, 14.6) and SIR = 3.5 (95% CI: 2.7,4.4), respectively. For the group of 24,010 patients withoutexternal radiation exposure or referral for suspicion of thy-roid tumour, the most common reasons for diagnosticadministration of 131I were suspected hyperthyroidism(62%), hypothyroidism (25%) or hypercalcaemia (12%).For this group, there was no excess risk (SIR = 0.91; 95%CI: 0.64, 1.26), nor was a dose–response association seen.However, only 2,367 patients in this group were under age20, and about 300 under age 10, at the time of exposure to131I. Among those under age 20 and without prior externalradiation exposure or referral for suspicion of thyroidtumour, 2 thyroid cancers were observed compared with2.08 expected (SIR = 0.96; 95% CI: 0.12, 3.46). In inter-preting this null result, consideration should be given to thesmall numbers of cases and to the fact that so few wereexposed before age 10, the group for whom the associatedrisk is expected to be the highest.
450. While the data from these studies are informative,the uncertainties associated with estimating thyroid dosesdue to 131I, especially for persons with thyroid abnormali-ties, reduce the precision of the risk estimates. The non-uniformity of the dose distribution in the thyroid gland fol-lowing 131I administration results in some areas of tissuereceiving high doses and other areas receiving much lowerdoses [N19]. Thus the tumorigenic effects of the exposuremight be lower than would be expected on the basis of theaverage dose. Overall, there is little evidence that radiationexposure to adult patients treated for hyperthyroidism orexamined with diagnostic levels of 131I or examined to eval-uate potential thyroid disease results in a measurablyincreased risk of thyroid cancer. Data regarding risks ofexposure in childhood remain sparse. The three studies ofthe diagnostic use of 131I in Germany, Sweden and theUnited States found that, among 6,659 children examined,with a mean thyroid dose of 0.89 Gy, 9 thyroid cancerswere detected against 8.99 expected [B61].
451. Determining the role of continuous low-dose expo-sure to radionuclides from living near nuclear plants andwaste sites has been a concern to members of the public inmany countries having nuclear weapons plants or powerplants. These environmental exposures of the thyroid areprimarily due to 131I, but can also be due to short-livedradioiodines and to some external radiation.
452. The largest evaluation of environmental exposures ofthe thyroid is of people living near the Hanford nuclearweapons site in the United States [D48]. Between 1944 and
1957, the Hanford site in Washington state released 20–25PBq of 131I into the atmosphere during fuel processing. Intotal, 5,199 people born between 1940 and 1946 in sevencounties in eastern Washington state were identified forstudy. Ninety-four per cent were located, 4,350 (84%) werealive and 3,441 agreed to participate in the study. Thyroiddoses were estimated for the 3,193 study participants whohad lived near Hanford during the time of the radioiodinereleases. The remaining 248 participants had moved fromthe Hanford area and received little or no exposure. The131I doses to the thyroid glands of the people who contin-ued to live near Hanford ranged from 0 to 2.84 Gy (median0.10 Gy), with only a small percentage receiving doses atthe higher end of the range.
453. Nineteen participants were diagnosed with thyroidcancer and 249 with benign thyroid nodules. No evidenceof a dose–response relationship was found for malignant orbenign nodules, even though the population was exposed atyoung ages. Although there are large uncertainties in thedose estimates [N18], taking these into account does notappear to change the results materially.
454. A recent study compared cancer mortality in fourcounties in Washington state (presumably heavily exposedto 131I from the Hanford plant) with that in five other coun-ties (much less heavily exposed) [B61]. There was no elevation in thyroid cancer mortality in the heavily exposedcounties: the RR was 0.84 (95% CI: 0.56, 1.26), based on 33 deaths in the highly exposed counties and 76 in thecontrol counties [B61].
455. On 1 March 1954, an unanticipated change in winddirection caused people living on the Marshall Islands tobe exposed to high levels of radioactive fallout from aUnited States nuclear weapons test in the Pacific Ocean[C45, R13]. About 80–90% of the dose to the thyroid wasfrom short-lived radioisotopes and gamma radiation, andvery little was from 131I [R13]. Following the accidentalexposure, an elevated risk of thyroid cancer and other thyroid diseases was linked to the radiation exposure [C45, H25].
456. In a recent evaluation, an international team ofresearchers examined 3,709 Marshall Islanders who wereborn before 1954, using ultrasound and neck palpation.Thirty thyroid cancers were diagnosed. An additional 27 examinees had had surgery for thyroid cancer in the past.There was evidence of a weak association between thyroidcancer prevalence and an increasing surrogate measure ofthyroid dose [T41, T42].
457. From 1949 to 1962, the former Soviet Union con-ducted over 100 atmospheric nuclear tests at theSemipalatinsk test site in Kazakhstan [B62, G21, R51].Local fallout was particularly high from three tests con-ducted in 1949, 1951 and 1953. Approximately 10,000 per-sons living near the test site and 40,000 living in the Altairegion in the Russian Federation received more than
UNSCEAR REPORT-PART 1.qxp 10/7/08 2:58 pm Page 106
250 mSv effective dose. The first analytical study of thehealth effects on the populations living near Semipalatinskwas published by Bauer et al. [B58]. They studied solidcancer mortality in a cohort of 19,544 exposed and com-parison subjects living near the Semipalatinsk test site, andfound a significant dose response for all solid cancers andseveral specific cancer sites. However, they did not reporton thyroid cancer.
458. Following the 1986 accident at Chernobyl, about 5 million people living in Belarus and in extensive areas inUkraine and the Russian Federation were exposed toradioactive materials. Persons living in the contaminatedareas of the three countries received external exposure fromradionuclides deposited on the ground and internal expo-sure from ingesting milk and leafy green vegetables. Theprincipal component of dose to the thyroid gland was fromthe atmospheric releases of 131I, although there was alsovery limited exposure to shorter-lived radioisotopes, e.g.132I, 133I and 135I [U2].
459. Four years after the Chernobyl accident, a substan-tial increase in childhood thyroid cancer in the contaminatedregions of Belarus, Ukraine and the Russian Federation wasobserved [H13, M11]. Although the exact number of thy-roid cancers diagnosed among persons who were living inthese areas and who were younger than 18 years old at thetime of the accident is not known, at least 4,000 werereported between 1992 and 2000. Because thyroid cancer isfrequently indolent, efficiency and uniformity of ascertain-ment are crucial to establishing unbiased estimates of risks.Variations in the efficiency of screening may have a roleto play in explaining some of the excess incidence, althoughthe magnitude of the excess leaves little doubt that muchof it is associated with radiation exposures resulting fromthe accident [U2]. However, variations in screening effi-ciency over time could bias inference of trends in excessrisk with age and time. A recent study showed that, whereasofficial screening programmes contributed little to theobserved increase in the thyroid cancer incidence rate in theaffected countries, other factors, such as the introduction ofultrasound examinations, increased attention to thyroid dis-eases during normal medical examinations and improvedreporting, increased the apparent underlying incidence inBelarus and in the more highly contaminated regions ofUkraine from 1988 to 1999 by a factor of 3 [J11]; in theother parts of Ukraine, the corresponding factor wasassessed to be 2.
460. Since the UNSCEAR 2000 Report, a number of newstudies have been conducted [C2, D49, H52, J9, K11, T43],and a few have reported quantitative risk estimates for thy-roid cancer related to 131I exposure. A small population-based case-control study conducted in Bryansk, RussianFederation, included 26 cases diagnosed between 1991 and1997 and twice the number of controls [D49]. Cases andcontrols were younger than 19 years of age at the time ofthe accident, and individual thyroid doses due to 131I werereconstructed for all study subjects. A strong dose response
was demonstrated (p < 0.01), but because of the small studysize, little other information was available.
461. Cardis et al. [C2] recently reported on a larger pop-ulation-based case-control study that included 276 cases and1,300 matched controls from Gomel and Mogilev in Belarusand from Bryansk, Kaluga, Orel and Tula in the RussianFederation. Cases were diagnosed between 1992 and 1998.Individual thyroid doses due to 131I, external radiation, andintake of other short-lived and long-lived radioiodines werereconstructed. A strong association between thyroid cancerrisks and childhood exposure to 131I and to all radioiodineswas observed. Based on a linear dose–response model, theERR ranged from 5.5 (95% CI: 2.2, 8.8) Gy–1 to 8.4 (95%CI: 4.1, 17.3) Gy–1, depending on the statistical model used.Of particular interest is the finding that, depending onwhether dose due to all exposures, due to all iodine iso-topes or due to 131I alone was evaluated, the risk estimatesremained virtually unchanged. The ERR per unit dose wasthree times greater in areas where dietary iodine was defi-cient than in regions with sufficient dietary iodine. Themodifying effect of dietary iodine levels was noted also byShakhtarin and colleagues [S4], who reported a twofold riskof childhood thyroid cancer in iodine-deficient areas ofBryansk, Russian Federation, compared with that in iodine-sufficient areas. While the Cardis et al. [C2] study has sig-nificantly added to what is known about 131I, moreinformation is still needed about the role of iodine defi-ciency, the effects of age at exposure and for each sex, andthe pattern of risk over time. The results of the study couldbe biased by large uncertainties in the dose estimates, whichare based on retrospective determination of consumptionrates and assumptions about the contamination of theingested food. In particular, as discussed by the authors,such uncertainties in the dose estimates could account forat least part of the marked saturation of the dose responseabove 2 Gy [C2].
462. Risk estimates for radiation-related thyroid cancerhave been published from “ecological studies” [H52, J7, J8,J9, L95, S86]. While these studies have provided importantinformation about risks from radiation exposure due to theChernobyl accident, they have inherent methodologicalproblems [G13, P15] that need to be considered when inter-preting their results. In the most recent “ecological study”of thyroid cancer risk following childhood exposure to radi-ation due to the Chernobyl accident, thyroid cancer casesand thyroid dose data for 426 settlements in Belarus and608 settlements in Ukraine were analysed [J9]. Thyroiddoses were based on 166 012 individual dose estimates forpeople who had direct measurements of 131I activity. Therewere 1,089 thyroid cancers observed between 1990 and 2001in the cohort of people born between 1968 and April 1986.The estimated linear coefficient of the EAR was 2.66 (95%CI: 2.19, 3.13) (104 PY Gy)–1 and the quadratic coefficientwas –0.145 (95% CI: –0.171, –0.119) (104 PY)–1 Gy–2. Thelinear coefficient of the ERR was 18.9 (95% CI: 11.1, 26.7)Gy–1 and the quadratic coefficient was –1.03 (95% CI:–1.46, –0.60) Gy–2. The EAR was higher for females than
ANNEX A: EPIDEMIOLOGICAL STUDIES OF RADIATION AND CANCER 107
UNSCEAR REPORT-PART 1.qxp 10/7/08 2:58 pm Page 107
108 UNSCEAR 2006 REPORT: VOLUME I
males, decreased with age at exposure and increased withattained age. The ERR was higher for males than femalesand decreased with age at exposure and attained age.
463. The results from this and earlier “ecological studies”differ from the Cardis et al. [C2] case-control study andstudies on the effects of external radiation exposure [R6].The estimates of the EAR in the “ecological studies” areabout half that reported from the pooled analysis of exter-nal low-LET radiation [R6] (table 40). Estimates of theERR, on the other hand, are considerably larger than theestimate from the pooled analysis or from the most recentChernobyl case-control study [C2].
464. The link between thyroid cancer risks and exposureof adults to radioiodine from the Chernobyl accident hasnot been studied extensively, but when adult patientsreceived similar doses of 131I from diagnostic examinations,little evidence of an association was seen [D42], suggest-ing that the effects of radiation exposure due to the acci-dent would be small. The thyroid cancer incidence rateamong Russians born in the contaminated region of Bryanskbetween 1917 and 1971, i.e. who were between the ages of15 and 69 years at the time of the accident, was elevatedcompared with rates in the general population for the samesex and for similar ages and calendar year periods [I31]. Asin several other studies of persons exposed to radioactivecontamination resulting from the Chernobyl accident, theincreased thyroid cancer rates compared with rates in thegeneral population appear to be due to heightened medicalsurveillance rather than to the radiation exposure. Indeed,when internal comparisons were made, the ERR was –0.9(95% CI: –2.4, 0.8).
465. To date, there have been few reports of increasedrisk of thyroid cancer after in utero exposure [H13]. Thisis an area for which data are clearly lacking and for whichefforts should be made to carefully collect more data.
(d) Internal high-LET exposures
466. No new studies of internal high-LET radiation expo-sures and thyroid cancer risks have been published sincethe UNSCEAR 2000 Report.
4. Summary
467. The thyroid gland is highly susceptible to the car-cinogenic effects of external radiation exposure duringchildhood. Age at exposure is an important modifier of risk,and a very strong trend of decreasing risk with increasingage at exposure is observed in most studies. Although thy-roid cancer naturally occurs more frequently among women,the role of sex in determining radiation risk is unclear. TheBEIR VII Committee [C37] estimates the lifetime risks ofthyroid cancer at 0.32% Gy–1 for men and at 1.6% Gy–1 forwomen. Among people exposed during childhood, elevatedrisks persist throughout life, but some data suggest that the
ERR begins to decline at about 20 years after exposure. Thecarcinogenic effects from 131I doses are less well under-stood. Most epidemiological studies of medical exposureshave shown little risk following a wide range of dose levels;however, most of these studies were of adult exposures. Afollow-up study of persons who lived near the Hanfordnuclear facility in the United States when they were chil-dren provides no evidence of an association between 131Idoses and thyroid cancer risk. In contrast, results from stud-ies of people exposed as a result of the Chernobyl accidentdemonstrate that exposure to radioactive iodine during earlychildhood is significantly linked with the risk of thyroidcancer development. The risk appears to be modified by theamount of stable iodine in the diet. Similar to the data onexternal low-LET radiation exposure, the data from theChernobyl accident studies suggest that risk decreases withincreasing age at exposure. The effect of sex is not con-sistent in all studies. In the last few years, information about131I exposures has improved; however, the thyroid cancerrisk from 131I exposure is still not adequately quantified.
V. Non-Hodgkin’s lymphoma
1. General background
468. Non-Hodgkin’s lymphoma (NHL) is a collection ofdistinct disease entities that are malignant expansions oflymphocytes. The lymphomas that make up this groupingcan generally be separated into those with B-cell or T-celllineage. The precise definition of NHL has varied over time;a classification that is widely used is the RevisedEuropean–American Lymphomas classification [H42].
469. Annual age-standardized world incidence rates forNHL range from about 3 to about 25 per 100,000 persons,with rates tending to be highest in North America and some-what lower in African and Asian countries. However, sincethe diagnosis of this tumour is inconsistent among registries,international comparisons of NHL rates can be misleading[P19]. Rates of NHL have increased in many countries overthe past few decades, particularly for older ages [B28, H39],with no indication that rates have peaked. In part thisincrease is likely to be due to changes in the definition ofNHL and to improved ascertainment, although these factorsare unlikely to explain all of the apparent increases [H39].Chronic lymphocytic leukaemia, which had been regardedas a distinct entity, is now thought to be a variety of NHL[J12]. Epidemiological studies have shown associationswith chronic immunosuppression, for example, amongtransplant recipients and other patients who receivedimmunosuppressive therapy [H43, K33]. However, suchfactors may explain only a small percentage of the tempo-ral increase in NHL rates [Z7]. Associations with certainviruses, such as Epstein–Barr virus (EBV) [M37] and HIV[S55], have also been identified. Some studies suggest ele-vated risks for people employed in agriculture, particularly
UNSCEAR REPORT-PART 1.qxp 10/7/08 2:58 pm Page 108
those working with pesticides (e.g. [C17]), although otherstudies have not shown such a link (e.g. [W21]). No work-place exposures have been conclusively identified as causesof NHL [B4, C1]. The role of the immune system in relation to NHL is discussed further in annex D to the 2006 UNSCEAR Report, “Effects of ionizing radiation onthe immune system”.
2. Summary of UNSCEAR 2000
470. The results from the studies considered were mixed,with many of the studies having failed to show a statisti-cally significant association with radiation exposure. TheLSS of survivors of the atomic bombings falls into this cat-egory, although Preston et al. [P4] reported some evidenceof an increasing dose response for males (p = 0.04) but notfor females, among whom, if anything, the trend was nega-tive. The latter findings might appear to contradict those forthe cervical cancer patients, where there was borderline evi-dence of a positive dose response; however, among exposedpatients, there was little indication of an increasing risk withincreasing dose [B8]. Furthermore, studies of women treatedfor benign gynaecological disorders [D7, I1] have not sug-gested associations with radiation. Comparison of the LSSfindings for males with those findings for the ankylosingspondylitis patients might be informative, given that most ofthese patients were male. Weiss et al. [W8] reported thatNHL mortality among spondylitis patients was raised sig-nificantly compared with national rates (RR = 1.73; 95% CI:1.23, 2.36), and that this elevated risk appeared to disappearbeyond 25 years after exposure; however, no dose–responseanalysis was performed. In another study of a mostly malepopulation, Cardis et al. [C3] did not find an associationbetween NHL risks and external radiation exposure amongnuclear industry workers, although the precision of the studywas limited by the generally low doses. The same limitationaffected a study of patients undergoing diagnostic X-ray procedures [B17], which also did not show an associationwhen based on a two-year lag time; however, this study usednumbers of X-ray procedures as a surrogate of exposurerather than actual doses.
471. In summary, results from studies of NHL risk amonggroups exposed to external low-LET radiation were mixed.Studies of the survivors of the atomic bombings as a wholedid not show an association, although there was some evi-dence of a trend of increased incidence with dose amongmales (but not females). Findings from other studies werevariable, with no clear consistency. Overall, there was littleevidence of an association between the risk of NHL andexternal low-LET radiation exposure.
472. There was limited information on NHL risk in rela-tion to internal low- or high-LET radiation exposure. Thegeneral absence of analyses in relation to the level of expo-sure, and the limited statistical precision of one such analy-sis that was conducted, hindered interpretation of theavailable data.
3. New or updated studies
(a) External low-LET exposures
473. At present, there are no new data on NHL for thesurvivors of the atomic bombings. However, there are somenew findings from studies of other groups exposed to exter-nal radiation. Among patients in the United States treatedwith radiation for peptic ulcer [C4], the mortality rate forNHL was raised relative to national rates (see table 41).However, there was a suggestion that the NHL mortalityrate was also raised among patients who did not receiveradiotherapy. Overall, the evidence for an increased risk topatients receiving radiotherapy compared with that to otherpeptic ulcer patients was weak. A few other studies of med-ically exposed groups (e.g. [M35, R4]) have suggested ele-vated risks of NHL relative to unexposed comparisongroups. However, the small numbers of cases observedimply that the statistical precision of these results is low.Furthermore, in instances where this has been examined,there have been at most very weak indications of any trendof increasing risk with increasing dose [R4].
474. A few recent studies of radiation workers have pro-vided extra information on NHL risk in relation to occu-pational radiation exposure (see table 41). One of thesestudies was a population-based case-control study con-ducted for parts of the United States that involved 1,056NHL cases, of whom 114 reported occupational exposureto radiation [E10]. The study showed no elevated risk asso-ciated with reporting having ever been occupationallyexposed to radiation (RR = 0.90; 95% CI: 0.74, 1.10), norany trend in risk with either estimated cumulative dose orduration of exposure. Although a reasonably large numberof cases, ascertained from population-based cancer reg-istries, and pathological reviews are notable strengths of thisstudy, it is limited by the lack of objective measures of radi-ation exposure and by the low doses likely to have beenreceived by exposed workers (mean dose ≈ 0.015 Gy, low-LET radiation). Another study examined cancer incidencein a group of about 191,000 workers included in theCanadian National Dose Registry [S8]. Again this wasbased on a reasonably large number of NHL cases, identi-fied from cancer registry data, although in this instanceinformation on radiation exposure was obtained in an objec-tive manner. While NHL incidence in this group of work-ers was substantially less than expected from national rates,the central estimate of the trend in risk with dose withinthe cohort was positive, although with a very wide confi-dence interval (90% CI for ERR = (<0, 31.8) Sv–1). Rogelet al. [R54] reported no excess mortality due to NHL com-pared with French national mortality rates among radiationworkers of Électricité de France (5 observed versus 5.6 expected deaths; SMR = 0.89; 90% CI: 0.35, 1.88).
475. Other studies have provided generally little addi-tional information on the risk of NHL in relation to occu-pational radiation exposure. An updated follow-up of maleradiologists in the United Kingdom indicated an excess rate
ANNEX A: EPIDEMIOLOGICAL STUDIES OF RADIATION AND CANCER 109
UNSCEAR REPORT-PART 1.qxp 10/7/08 2:58 pm Page 109
110 UNSCEAR 2006 REPORT: VOLUME I
of mortality due to NHL relative to social-class-specificnational rates, but based on only small numbers (9 observed,3.74 expected) [B2]. In contrast, a study of United Statesradiologic technologists, based on a much larger number ofdeaths, showed that the rate of mortality due to NHL wasclose to that expected from national rates, for both malesand females [M31]. An analysis of NHL incidence in thesame cohort did not show any association either with thenumber of years worked as a radiologic technologist or withthe year of starting this work [L11]. The lack of dosimet-ric data is a limitation of these last two studies.
(b) External high-LET exposures
476. While various studies have been conducted of cancerrisks among aircrew who have been exposed externally toboth high- and low-LET radiation, results have not alwaysbeen reported specifically for NHL. Some studies havereported elevated risks for male cabin attendants; for exam-ple, the rate of mortality due to NHL in a cohort study con-ducted in eight European countries was twice that expectedfrom national rates [Z4]. However, large excesses of AIDS-related mortality seen among the same workers indicate thatHIV/AIDS is the explanation for the findings in relation toNHL. A similar analysis conducted of male cockpit crewfrom nine European countries indicated that the rate of mor-tality due to NHL was less than expected from national rates(SMR = 0.71; 95% CI: 0.42, 1.15) [B23].
(c) Internal low-LET exposures
477. There is no new information that would materiallyaffect the previous assessment. Findings from earlier stud-ies are summarized in table 41.
(d) Internal high-LET exposures
478. A difficulty in interpreting the literature has been thesmall number of occasions on which findings have beenpresented specifically for NHL, as opposed to those for alllymphomas or all lymphopoietic and/or haematopoietic neo-plasms together. It would appear that larger disease group-ings have often been chosen for presentation because of thevery small numbers of cases involved. For example, Traviset al. [T30] presented findings for NHL among Thorotrast-exposed patients in Denmark and Sweden, but not for asmaller cohort of patients in the United States. In the formerinstance, while the SIR for NHL was greater than 1, onlyfour cases of NHL were observed among the Danish andSwedish Thorotrast patients, and rates in this group wereconsistent both with national rates and with those in a com-parison group [T30].
479. A large population-based case-control study of child-hood cancer in the United Kingdom found that, if anything,radon concentrations in the homes of NHL cases may havebeen lower than those in the homes of control children[U16]. However, the similarity in findings seen across a range of childhood cancer types in this study suggests
that differences in participation rates both between casesand controls and by level of deprivation might have led tosome bias.
4. Summary
480. Findings from recent studies do not change theassessment made by the Committee in its 2000 Report.The results from studies of NHL risk among groupsexposed to external low-LET radiation are mixed, withlittle evidence of an association overall. There is still limited information on NHL risk in relation to either high-LET radiation (external or internal) exposure or internallow-LET radiation exposure, and interpretation of theavailable data is difficult.
W. Hodgkin’s disease
1. General background
481. About 62,000 cases of Hodgkin’s disease (HD) arediagnosed annually worldwide, and the disease causes about25,000 deaths per year [F14]. HD is distinguished fromother lymphomas mainly by the presence of giantReed–Sternberg cells. Overall rates of the disease have notchanged greatly in recent decades; rates have increased inadolescents and young adults in a number of populationsbut have decreased at older ages [C27]. Mortality rates havedecreased sharply in most countries, reflecting mainlyimproved treatment [C27]. At younger ages, disease ratesin Asian populations tend to be much lower than those inEuropean and North American populations; at older ages,they are about half the rates in Europe and North America[C27]. For example, annual age-standardized world inci-dence rates for HD are generally less than 0.5 per 100,000persons for most Chinese registries, whereas rates exceed3.5 per 100,000 for certain North American registries [P19].There is substantial evidence for a viral aetiology or cofac-tors for HD. Particularly suspect is EBV. About 50% ofcases of HD are EBV-seropositive in Western developedcountries and 90% in developing countries [T36]. ElevatedEBV titres have been demonstrated in pre-disease sera,compatible with a causal role for EBV [M51]. An elevatedrisk of HD has been shown among those with HIV, espe-cially around the time of AIDS onset, suggesting an asso-ciation with immunosuppression [S49]. Other studies ofimmunosuppression or immunodeficiency have shownmixed results. Elevated HD risk has been found among allo-geneic bone marrow transplant patients but not generallyamong renal transplant patients, while there is a suggestionof an elevated risk among primary immunodeficiencypatients [S49]. Several studies have documented a familialrisk for HD, and a study of identical versus fraternal twinsdemonstrated a strong genetic component to HD risk.However, probably only around 5% of HD cases are
UNSCEAR REPORT-PART 1.qxp 10/7/08 2:58 pm Page 110
attributable to a genetic risk [C27, S49]. Lifestyle factors (e.g. smoking, alcohol consumption and diet) appear to playlittle role in the aetiology of HD, while early childbirth maybe protective for women [C27].
2. Summary of UNSCEAR 2000
482. The UNSCEAR 2000 Report indicated that therewere few studies that had evaluated dose–response associ-ations for HD. The LSS data on HD incidence did not showa statistically significant dose–response relationship, but thenumber of cases was relatively small, so the statisticalpower was low [P4] (see table 42). Studies of people treatedwith external X- or gamma radiation for benign gynaeco-logical disorders and studies of people occupationallyexposed to radiation were also null for HD risk, but againthere were limitations in the data because of the smallnumber of cases and/or low radiation doses. Two studies ofpeople undergoing internal low-LET irradiation, namely aSwedish [H6] and a United States [R3] study of 131I treat-ment for hyperthyroidism, had small numbers of HD casesand failed to show an association of risk with radiationexposure. Finally, two studies of Thorotrast patients [A5,V4] and one of miners exposed to radon [D10] also hadsmall numbers of HD cases and failed to show a radiationeffect. It was concluded that the available data did not indi-cate an association between the risk of HD and radiationexposure, either for external or for internal exposure, butthat the data were very limited.
3. New or updated studies
(a) External low-LET exposures
483. The additional information considered by theCommittee here includes that from an earlier report of acohort study of patients receiving radiotherapy for cervicalcancer [K1], for whom the mean dose to the bone marrow(used as a surrogate for lymphopoietic tissue) was about 7 Gy. Fifteen cases of HD were observed in this cohort, butthere was no indication of excess risk (table 42). The par-allel case-control study also exhibited no excess risk: therewere 14 HD cases and 27 controls, with an RR of 0.63(90% CI: 0.2, 2.6) [B8]. A cohort of patients treated withX-rays for benign diseases of the locomotor system [D2]had a mean dose to lymphopoietic tissue of 390 mGy, andthere were 17 cases of HD and 21 deaths from HD (mor-tality was observed for a longer time than tumour cases);analyses did not show statistically significant associationsof either HD risk or HD mortality risk with dose.
484. Various studies of radiation workers have reportedon HD incidence or mortality rates since the UNSCEAR2000 Report (table 42). The largest of these, the CanadianNational Dose Registry [S8], reported a statistically non-significant positive dose–response relationship for HD inci-dence, based on 79 HD cases and a mean dose of 66 mSv.
Other studies with good dosimetry included the Springfieldsuranium workers in the United Kingdom (10 HD cases;mean dose 21 mSv) [M5], the United Kingdom NRRW (17deaths from HD; mean dose 31 mSv) [M12] and the LosAlamos National Laboratory workers in the United States(10 deaths from HD; mean dose approximately 16 mSv)[W6]. Two more occupational studies with limited dosecharacterization include that of United States radiologictechnologists [M31], which had 34 deaths from HD, andthe study of the early (1943–1947) workers at the OakRidge National Laboratory in the United States, which had18 deaths from HD [F2]. None of the occupational studiescited here showed statistically significant associationsbetween radiation exposure and risk of HD, but a limita-tion is that the dose levels were low.
(b) Internal low-LET exposures
485. There is no new information that would materiallyaffect the previous assessment.
(c) Internal high-LET exposures
486. The only substantive new study is that of a group ofDanish, Swedish and United States patients who receivedthe diagnostic contrast medium Thorotrast, and a compa-nion group who received a non-radioactive contrast medium[T30]. There were single cases of HD in both the exposedand the control groups among the Danish and Swedishpatients, who were followed for cancer incidence, repre-senting an RR of 1.5 (95% CI: 0.1, 81.8) [T30]. Amongthe United States patients, who were followed for mortal-ity, there were 1 and 0 deaths from HD in the Thorotrast-exposed and the control group, respectively, representing anominal RR of ∞ (95% CI: 0.1, ∞) [T30].
4. Summary
487. There continues to be no clear indication of anexcess risk of HD associated with radiation exposure, butthe data are very sparse, and most of the data sets lackdose–response analyses.
X. Multiple myeloma
1. General background
488. Multiple myeloma is one of a group of plasma cellmalignancies that are characterized by the presence of elevated numbers of plasma cells in the bone marrow and,very often, elevated levels of monoclonal protein in serumand urine [H33]. Plasma cell malignancies include:Waldenstrom’s macroglobulinaemia, in which there is pro-duction of IgM; multiple myeloma, in which there is pro-duction of IgA, IgD, IgE, IgG or light chains; and the heavy
ANNEX A: EPIDEMIOLOGICAL STUDIES OF RADIATION AND CANCER 111
UNSCEAR REPORT-PART 1.qxp 10/7/08 2:58 pm Page 111
112 UNSCEAR 2006 REPORT: VOLUME I
chain diseases, characterized by production of heavy chains(gamma, mu, delta) [H33, O7]. There is evidence that themalignant transformation causing multiple myeloma occursat the early B-cell or lymphoid stem cell lineage [H33].Multiple myeloma is a difficult disease to diagnose [K30];in particular, detection of light chains requires elec-trophoresis or immunofixation, relatively expensive meth-ods [H33]. Perhaps because of the limited availability ofserum protein electrophoresis, the reported diagnosis ofmultiple myeloma varies widely by country [H33, P19], andthe annual age-standardized world incidence rate variesfrom about 1 per 100,000 persons in China to more than 8 per 100,000 in parts of the United States [H33, P19]. Itis more common among men than women and is particu-larly rare at young ages [C38]. Black people in the UnitedStates or the United Kingdom seem to be at particularlyhigh risk, and Asians have relatively low risk [H33, P19].Incidence rates have been increasing during the past fewdecades in various countries [H33]. While part of thisincrease may be due to earlier incompleteness in ascertain-ment, there have been increases in regions with well-estab-lished and high-quality registries [H33]. In particular, inMalmö, Sweden, the incidence rate for men increased by60% between 1950 and 1979, although little change wasseen for women over this period [T23]. Even largerincreases have been reported in parts of the United Statesover the period 1947–1975, although not after 1975 [D25].Multiple myeloma has been associated with autoimmunediseases, in particular rheumatoid arthritis, in a number ofstudies [H33]. There is weak evidence linking incidence ofmultiple myeloma to exposure to a number of physicalagents, including asbestos, benzene and pesticides [H33].There is little evidence of familial risk factors [H33].Further details on the epidemiology are to be found in ref-erence [H33].
2. Summary of UNSCEAR 2000
489. Of particular note is the discrepancy between thefindings for incidence and mortality rates among the LSScohort of survivors of the atomic bombings. The mostrecent mortality follow-up study [P1] showed a statisti-cally significant association between multiple myelomarisk and radiation dose. However, LSS data on myelomaincidence yield a much lower estimate for the trend in riskwith dose, and are consistent with there being no effect ofdose [P4]. The authors of the cancer incidence report notedthat the mortality findings appeared to be heavily depend-ent on the inclusion of questionable diagnoses and on bothsecond primary cancers and cases in people who hadreceived more than 4 Gy that were excluded from the disease incidence analysis [P4]. In view of the care takento review the myeloma diagnoses in the incidence analy-sis, it seems reasonable to place greater weight on thesefindings.
490. There were similar discrepancies between analysesof the mortality and incidence data for other cohorts. For
example, in a Swedish study of persons irradiated forbenign lesions of the locomotor system, an elevated risk ofmortality from multiple myeloma was observed in relationto national mortality rates, but there was no analogousincrease in rates of the disease itself [D2]. In general, thestudies tending to show significantly elevated risks, such asthe metropathia haemorrhagica study of Darby et al. [D7]and the ankylosing spondylitis study of Weiss et al. [W8],tend to be of cancer mortality, whereas studies of cancerincidence, such as the diagnostic X-ray study of Boice etal. [B17] and the IRSCC [B8, B11], find no elevation inrisk. This suggests that the classification of multiplemyeloma on death certificates may have been conducteddifferentially according to whether there was a known pastradiation exposure, although it is difficult to be certain.Given the generally better quality of diagnoses recorded indisease incidence data, the findings from the survivors ofthe atomic bombings, in particular, would suggest that thereis little evidence of an association of risk with low-LETradiation exposure.
491. There are a few studies of persons exposed to inter-nal high-LET radiation that suggest an association of therisk of multiple myeloma with radiation dose, but thesestudies are generally based on very small numbers of cases.
3. New or updated studies
492. Table 43 summarizes the radiation risk estimatesderived from epidemiological studies of incidence and mor-tality rates of multiple myeloma.
(a) External low-LET exposures
493. The analysis of cancer incidence in relation to occu-pational dose in the Canadian National Dose Registry hasdocumented a decreased SIR, of statistical significance, formultiple myeloma of 0.68 (90% CI: 0.49, 0.93) [S8]. Thetrend with dose of multiple myeloma incidence within thiscohort is not reported, and is presumably not statisticallysignificant. However, as with the parallel analysis of themortality data associated with this cohort [A8], concernshave been expressed about the reliability of record linkage,a possible source of bias [G16].
494. Analysis of cancer mortality in relation to occupa-tional dose for a group of Japanese nuclear workers hasdocumented an increased but not statistically significantSMR, for multiple myeloma of 1.12 (95% CI: 0.69, 1.74)[I11]. The trend with dose of multiple myeloma withinthis cohort is not statistically significant, but the numeri-cal value of the ERR (and confidence intervals) is notreported [I11].
495. Wing et al. [W7] have analysed multiple myelomamortality for four United States nuclear sites: Hanford, LosAlamos National Laboratory, Oak Ridge NationalLaboratory and Savannah River. Trends of increasing
UNSCEAR REPORT-PART 1.qxp 10/7/08 2:58 pm Page 112
multiple myeloma mortality with whole-body dose wererecorded, but were not statistically significant, with valuesof ERR of 0.66 (90% CI: –2.35, 3.67) Sv–1, assuming doseswere lagged by 10 years [W7]. Wing et al. went on toanalyse trends of multiple myeloma mortality above certaincritical ages, and found that above the age of 40 (also above45 and 50) years of age the trends of risk with dose becamemuch larger and generally statistically significant. Forexample, considering mortality above the age of 40, Winget al. obtained values of ERR of 5.64 (90% CI: 0.61, 10.67)Sv–1, assuming doses were lagged by 10 years [W7].However, the values of attained age limit used (40, 45 and50 years) are not chosen a priori. Therefore Wing et al. areeffectively fitting another parameter, and if this is taken intoaccount, it substantially reduces the nominal statistical significance of the results. The largest χ2 value calculatedby Wing et al. is 5.43, and P[χ2
2 > 5.43] = 0.07, so thatthere is no statistically significant effect in this study.
(b) Internal low-LET exposures
496. There is no new information that would materiallyaffect the previous assessment.
(c) Internal high-LET exposures
497. The only substantive new study is of a group ofDanish, Swedish and United States patients who receivedthe diagnostic contrast medium Thorotrast, and a compan-ion group who received a non-radioactive contrast medium[T30]. There were 5 cases of multiple myeloma in theexposed group and 2 cases in the control group, represent-ing an RR of 3.7 (95% CI: 0.5, 30.9) [T30].
4. Summary
498. As for the UNSCEAR 2000 Report [U2], thereremains only weak evidence that multiple myeloma isinducible by ionizing radiation. Several studies indicate atrend of increasing risk of mortality due to multiplemyeloma with external low-LET radiation exposure.However, such trends are not generally apparent in studiesof myeloma incidence, even in groups such as the survivorsof the atomic bombings where the parallel study of diseasemortality points to increased risk. This apparent inconsis-tency suggests differential classification of myeloma ondeath certificates depending on whether there was knownprevious radiation exposure. At least in the LSS this isthought possible [P1]. The generally better quality of diag-nostic information for the disease incidence data, and in par-ticular the negative findings of the LSS incidence study,would suggest that there is little evidence of an associationof risk with low-LET radiation exposure.
499. There continues to be limited information for inter-nal low- and high-LET radiation exposures. Although somestudies indicate elevated risk, they are based on only smallnumbers of cases.
Y. Leukaemia
1. General background
500. Although one of the rarer cancers, leukaemia is ofparticular interest because there is substantial information,both epidemiological and experimental, on increased risk ofthis disease due to ionizing radiation exposure. In terms ofthe general epidemiology relating to leukaemia, the varia-tion in rates between different populations is not as largeas that for most solid tumours [U2]. For example, the annualage-standardized world incidence rate of lymphoidleukaemia varies between about 1 per 100,000 persons and6 per 100,000 persons for most parts of Asia, Europe andNorth America, and a similar range is exhibited for myeloidleukaemia [P19]. In considering trends and aetiological fac-tors, it is important to take account of the various subtypesof leukaemia and their different age-specific rates. Modernclassifications of leukaemia and other lymphatic andhaematopoietic malignancies (e.g. [B33]) are based on cyto-genetic and molecular principles that do not always coin-cide with the International Classification of Diseases. Threemain subtypes will be considered here: acute lymphoblas-tic leukaemia (ALL), which is a leukaemia of precursorcells of either B-cell or T-cell origin; acute myeloidleukaemia (AML), whose lineage and subtype are generallydefined according to the French–American–British (FAB)system [B33]; and chronic myeloid leukaemia (CML),whose predominant haematological feature is an elevatedwhite cell count in the peripheral blood and which is char-acterized cytogenetically by the Philadelphia chromosome[L58]. Reference will also be made to chronic lymphaticleukaemia (CLL), which has a B-cell or a T-cell lineage[L58]. CLL is now thought to be a variety of non-Hodgkin’slymphoma [J12].
501. Most cases of childhood leukaemia are ALL,whereas CML and CLL make up a high percentage of casesin adulthood. In the case of childhood ALL, the most strik-ing and consistent trend among different countries since1950 has been the decline in mortality rates [K32], reflect-ing the introduction of effective chemotherapy and cranialradiotherapy. Childhood ALL incidence rates, in contrast,have been fairly constant or have perhaps shown a smallincrease over the same period [D28]. While over 200 geneshave been associated with chromosomal translocations, todate only MLL, TEL and AML1 have been linked withchildhood leukaemia. There is increasing evidence to sup-port the theory that gene rearrangements such as these mayoriginate in utero [L57]. Apart from ionizing radiation expo-sure, risk factors for childhood ALL include exposure toalkylating chemotherapeutic agents and genetic factors suchas Down’s syndrome. Exposure to pesticides has beenhypothesized as being a risk factor for childhood leukaemia[D51, M1, Z10], but this has not been confirmed. Greaves[G18] suggested that the increase in rates during the pastcentury would be consistent with many acute lymphoblas-tic leukaemias in children being due to delayed exposure to
ANNEX A: EPIDEMIOLOGICAL STUDIES OF RADIATION AND CANCER 113
UNSCEAR REPORT-PART 1.qxp 10/7/08 2:58 pm Page 113
114 UNSCEAR 2006 REPORT: VOLUME I
childhood infections. Kinlen suggested, however, that a spe-cific infective agent (or agents) underlies childhoodleukaemias, as is true for several animal leukaemias [K32].In a recent review, McNally and Eden [M36] suggested thatsome supportive evidence for an infectious aetiology is pro-vided by analyses of space–time clustering and seasonalvariation in the appearance of childhood leukaemia.
502. For adult leukaemia, rates at ages 75–84 years haveincreased in several countries since 1950 [K32]. Thesetrends are consistent with improvements in cancer registra-tion and in the details of death certification. Ionizing radi-ation, benzene and cytotoxic agents are known causes ofleukaemias in adults; there is also some evidence that cig-arette smoking is a risk factor, particularly for myeloidleukaemia [K32]. Rates of leukaemia also appear to beraised among patients with ataxia-telangiectasia (e.g. [O9]).
2. Summary of UNSCEAR 2000
503. There is a substantial amount of information on therisks of leukaemia due to radiation exposure. This reflectsthe high relative increase in risk compared with other cancertypes and the temporal pattern in risk, with many of theexcess leukaemias occurring within about the first twodecades following exposure, particularly among those irra-diated at young ages. There are some differences betweenthe LSS of survivors of the atomic bombings and some largestudies of medically exposed groups in estimates of boththe magnitude of the radiation risk and the shape of thedose response for external low-LET radiation exposure.These findings may reflect differences between studies inthe uniformity of exposure of the bone marrow and in thedegree of fractionation and protraction of exposure, as wellas differences in the pattern of risk for different leukaemiasubtypes. There is clear evidence of non-linearity in thedose response for leukaemia, which has a slope thatdecreases at lower doses.
504. A study of radiation workers in three countries sug-gested an elevated leukaemia risk, although the results werecompatible with a range of values. Case-control studies ofprenatal X-ray exposures indicated an increased risk ofleukaemia in childhood due to in utero irradiation, althoughthe absence of a dose-related increase in the sparse corre-sponding data for survivors of the atomic bombings addeduncertainty to the magnitude of the risk. Epidemiologicalevidence does not suggest that irradiation prior to concep-tion gives rise to a materially increased risk of childhoodleukaemia.
505. The data available on internal exposures to low-LETradiation did not indicate elevated risks of leukaemia; thismay well reflect the low statistical precision associated withstudies involving generally small radiation doses. There wasno convincing evidence of an increased risk of leukaemiadue to environmental exposures associated with theChernobyl accident, although investigations were continuing.
Excesses of childhood leukaemia were reported aroundsome nuclear installations in the United Kingdom, but gen-erally not in other countries; these excesses are based onsmall numbers of cases and have not been explained on thebasis of radioactive releases from the installations. Dose-related increases in leukaemia risk have been seen amongpatients with large exposures to high-LET radiation arisingfrom injections of the diagnostic X-ray contrast mediumThorotrast. There was less evidence for elevated risksamong patients injected with 224Ra, and little or no evidencefor increased risks in studies of radium dial workers or stud-ies with individual assessments of radon exposure, either inmines or in homes.
3. New or updated studies
(a) External low-LET exposures
506. There have been no new findings on leukaemia inci-dence for the survivors of the atomic bombings since theUNSCEAR 2000 Report. However, Preston et al. [P10]have reported findings from a follow-up of mortality to theend of 2000, based on the new DS02 dosimetry. The trendsin the EAR of leukaemia with age at exposure and timesince exposure are similar to those from the previous analy-sis of leukaemia mortality [P1]. In particular, the EARdecreased sharply with increasing time since exposure forthose exposed in childhood, but varied little with time sinceexposure for those exposed in adulthood. The excessnumber of deaths due to leukaemia up to the end of 2000among the cohort of 86,955 survivors was estimated to be93 [P10]. This compares with an estimate of 87 excessleukaemia deaths based on follow-up to the end of 1990[P1], indicating that the elevated risk has been low in recentyears. The shape of the dose–response relationship is vir-tually unchanged using the new dosimetry system. In par-ticular, using a linear–quadratic dose–response model, theestimated ratio of the quadratic coefficient to the linearcoefficient is 0.89 (90% CI: 0.2, 6.0) Sv–1, which is verysimilar to the corresponding estimate based on the DS86dosimetry. In addition, relative to values based on DS86,the values of the risks at low doses estimated using alinear–quadratic model are reduced by about 8% as a con-sequence of the change in dosimetry [P10].
507. Owing to the low prevalence of CLL in Japan, thestudy of survivors of the atomic bombings provides littleinformation on whether the risk of CLL might be relatedto radiation exposure. In a recent review, Richardson et al.[R37] suggested that the epidemiological evidence linkingCLL risks and external radiation exposure is weak, but thatepidemiological findings are consistent with an elevatedCLL risk “after a latency and morbidity period that spansseveral decades”. However, various studies considered inthe UNSCEAR 2000 Report [U2] that show raised risks ofleukaemia other than CLL in relation to external low-LETradiation exposures—for example studies of patients treatedfor cervical cancer [B5, K1], breast cancer [C9], cancer of
UNSCEAR REPORT-PART 1.qxp 10/7/08 2:58 pm Page 114
the uterine corpus [C8] and benign gynaecological disor-ders [D7, I1]—do not show such associations for CLL, evenfor latency periods of greater than 30 years [K1]. In addition, while there was a weak suggestion of raised ratesof mortality due to CLL among irradiated ankylosingspondylitis patients when compared with national rates,there was also a weak suggestion of a similar increaseamong non-irradiated patients [W2]. More recently, Shoreet al. [S68] found some evidence of a raised risk ofleukaemia among irradiated tinea capitis patients in theUnited States, which, although based on small numbers, wasconfined solely to leukaemia other than CLL. In addition,analyses of occupationally exposed workers that haveshown raised risks for leukaemia other than CLL (e.g. work-ers at the Mayak plant in the Russian Federation [S28] andradiologic technologists in the United States [L11]; seebelow) have, in contrast, not shown associations for CLLrisks.
508. A few recent analyses of medically exposed groupshave provided extra information on leukaemia risks. Forexample, Travis et al. [T24] found a trend of increasing riskof leukaemia with dose to the active bone marrow amongpatients treated for testicular cancer. Some other studies,such as those of patients treated for peptic ulcer [C4] or forcancer, e.g. [J1, R36], provide some indication of raisedleukaemia risks, but the small numbers involved and thelack of dosimetric data do not allow detailed inferences onthe relationship between risk and dose. A case-control studyin Canada reported a raised risk of childhood ALL amongthose who had two or more post-natal diagnostic X-rayexposures (RR = 1.61; 95% CI: 1.13, 2.28), and it was sug-gested that this risk might be modified by variants in repairgenes [I16]. However, a case-control study in the UnitedStates found that, after excluding exposures within the pre-vious two years, there was generally no association betweenpost-natal diagnostic X-ray exposures and the risk of child-hood ALL [S67]. A limitation of both of these studies wastheir reliance on maternal reporting of diagnostic X-rayexaminations.
509. Further analyses have been conducted on the risk ofchildhood leukaemia in relation to in utero exposure. Alarge case-control study in the United States reported an RRof 1.2 (95% CI: 0.8, 1.7) for childhood ALL in relation toin utero pelvimetric diagnostic X-ray exposure [S67].However, as mentioned earlier, this study relied solely onmothers’ reports of diagnostic X-ray exposures. In contrast,a population-based national study conducted in Sweden suc-cessfully ascertained the history of prenatal X-ray exami-nations using medical records [N4]. In this study, the RRfor childhood leukaemia in relation to obstetric prenatal X-ray exposures was 1.11 (95% CI: 0.83, 1.47), and there wasno indication of an increasing risk with increasing numbersof X-rays. In comparing these findings with those from ear-lier studies, it should be borne in mind that most of the chil-dren in these two recent studies were born in the 1970s or1980s. It is likely that the dose to the foetus per obstetricexamination was lower in this period than in previous
decades, although there is no direct information on this topicfrom these studies. Furthermore, the frequency of obstetricX-ray examinations appears to be lower than in earlierdecades; indeed, it was found in the United States studythat the proportion of mothers undergoing pelvimetry wasless than 3% after 1980 [S67]. When additionally statisti-cal uncertainties are taken into account, the above findingsare consistent not only with the absence of a raised risk butalso with the RRs of the order of 1.4 reported from earlierstudies of obstetric X-rays, such as the Oxford Survey ofChildhood Cancers (OSCC), conducted during a periodwhen both the frequency of such examinations and the asso-ciated doses per examination were higher. In a recentreview, Wakeford and Little noted that, once account istaken of various sources of uncertainties, findings from theOSCC and from the cohort of survivors of the atomic bomb-ings who were exposed in utero are consistent; the findingssupport a causal link between in utero irradiation andincreased risk of childhood cancer, although quantificationof this risk at low doses is difficult [W23]. Paragraph 79includes additional discussion concerning the scientificdebate on the nature of the association between prenatal X-ray exposures and childhood cancer.
510. Further findings have been reported in recent yearsfrom studies of workers exposed to radiation occupation-ally. Of these, the largest has been a study of mortalityamong over 400,000 nuclear industry workers from 15countries [C41]. Many of the workers in this study had beenincluded in earlier, smaller studies. However, this newerstudy focused on those workers whose radiation doses werepredominantly from higher-energy photons. Since manyworkers with potential doses from neutrons or from inter-nal radiation exposure also had relatively high externaldoses, their exclusion from the analysis meant that its sta-tistical power was not as great as might have been expectedfrom the studies of individual components (e.g. [M12]), oreven as great as for the previous three-country study [C3].The estimated ERR per unit dose from the 15-country studywas similar to that estimated for the survivors of the atomicbombings and from some other studies of radiation work-ers; however, the estimate of risk was not statistically sig-nificant, and the values of the 95% confidence intervalranged from less than zero up to about five times the esti-mate for low doses derived from the study of the survivorsof the atomic bombings (ERR = 1.93 (95% CI: <0, 8.47)Sv–1. There was little change in this value when the lagperiod was increased from 2 to 10 years. There was alsono indication of a decrease in the ERR per unit dose withtime since exposure, although the power of this analysiswas limited. Analyses that excluded workers included inearlier studies gave results similar to those from the fullanalysis [C41].
511. Leukaemia incidence has been studied for about 191,000 persons included in the Canadian National DoseRegistry [S8]. While the incidence rate of leukaemia otherthan CLL was significantly lower than expected fromnational rates (SIR = 0.71; 90% CI: 0.58, 0.86), there was
ANNEX A: EPIDEMIOLOGICAL STUDIES OF RADIATION AND CANCER 115
UNSCEAR REPORT-PART 1.qxp 10/7/08 2:58 pm Page 115
116 UNSCEAR 2006 REPORT: VOLUME I
some indication of a trend of increasing risk with increas-ing cumulative dose, although the 90% confidence intervalfor the ERR per unit dose was very wide and included zero(see table 44). The estimate of the ERR per unit dose wasconsistent with that obtained from earlier large studies, suchas that of the United Kingdom NRRW [M12] and that ofthe combined analysis of nuclear workers from Canada, theUnited Kingdom and the United States [C3], as well as thesubsequent 15-country worker study [C41], which includeddata on about 39,000 nuclear workers from the CanadianNational Dose Registry. However, interpretation of findingsfrom the Canadian dose registry is complicated by the factthat the estimated ERR per unit dose for leukaemia wassimilar to that observed for all other cancers combined, incontrast to the pattern seen in other large occupational stud-ies (see table 13) and in other studies of radiation-exposedgroups [G16]. An analysis based on a subgroup of the work-ers recorded in the Canadian National Dose Registry,namely those employed in the nuclear power industry, gavea higher estimate of the ERR per unit dose for leukaemiaother than CLL (i.e. 52.5), but with a very wide confidenceinterval (90% CI: 0.205, 291) and based on only 18 deathsin total [Z6].
512. In an updated analysis of mortality among nuclearindustry workers in Japan [I14], the number of leukaemiasobserved in a prospective follow-up of around 120,000workers followed for an average of 4.5 years was limited;the estimated ERR per unit dose was consistent with a widerange of values, including estimates from other studies andvalues less than zero (see table 44). A study of an expandedcohort of workers at the Portsmouth naval shipyard in theUnited States followed to the end of 1996 showed that theleukaemia mortality rate among workers monitored for radi-ation exposure may have been slightly less than thatexpected from national rates, but there was some sugges-tion of a trend of increasing risk with increasing cumula-tive dose [S56, Y10]. However, confidence limits for theestimated trend were wide, reflecting the fairly small totalnumber of deaths in this study (see table 44). The analysisdescribed in reference [Y10] took account of the potentialimpact of exposure to solvents, although this did not appearto be a confounding factor. However, this analysis did notdifferentiate between CLL and other types of leukaemia. Asmall update to an earlier case-control analysis of leukaemiaamong Chernobyl recovery operation workers [I6] found nostatistically significant association with dose, although thenumbers of cases were small and the findings were veryimprecise [K3].
513. Reference was made earlier in this annex to an analy-sis of mortality in relation to external gamma dose amongabout 21,500 workers at the Mayak nuclear complex in theRussian Federation [S28]. In contrast to studies of recentradiation workers, the range of doses received by theseworkers was very wide (with an average external dose of0.8 Gy, low-LET). This analysis provided strong evidenceof a trend of increasing risk of leukaemia other than CLLwith increasing dose. After being adjusted for a surrogate
measure of the exposure to plutonium, the data were con-sistent with a linear trend of increasing risk with externaldose, although there were weak indications of a concaveupward dose response. There was strong evidence that theRR was highest within 3–5 years of exposure (ERR of 6.9(90% CI: 2.9, 15) Gy–1) and was lower subsequently (ERRof 0.45 (90% CI: 0.1, 1.1) Gy–1, in line with the temporalpattern seen in some other studies of radiation-exposedgroups. Of the 66 observed deaths due to leukaemia otherthan CLL during the follow-up period, it was estimated that40% might be associated with occupational exposure toexternal gamma radiation [S28].
514. Aside from those included in the Canadian NationalDose Registry discussed earlier [S8], several analyses haveappeared recently involving medical X-ray workers andradiologic technologists. In the study involving medicalradiologic technologists in the United States, data on mor-tality due to ALL, AML and CML (hereafter collectivelycalled non-CLL leukaemia) were examined in more detailfor those who had completed an initial questionnaire survey,which permitted the investigators to control for other dis-ease risk factors [M31]. The results showed that neither thelength of work as a radiation technologist nor the year offirst radiologic certification was associated with the risk ofnon-CLL leukaemia. However, the risk of non-CLLleukaemia rose with increasing length of work prior to 1950(p = 0.05 for trend). The latter finding is of note since thelevels of radiation exposure were higher prior to 1950 thanin more recent years. Similar findings arose from an analy-sis of non-CLL leukaemia incidence in the same cohort[L11]. Raised rates of leukaemia incidence have beenobserved among Chinese medical X-ray workers employedbefore 1970, but there was less evidence for an excess riskrelative to other medical specialists for workers employedbetween 1970 and 1980 (RRs of 2.4 and 1.7, respectively)[W3]. For these X-ray workers, the RR of leukaemia washighest for those who started their work at under 20–25years of age and peaked within 5–14 years of the start ofradiation work. In addition, there was some indication of araised risk of leukaemia mortality among United Kingdomradiologists who first registered before 1955, although thenumbers of cases were small [B2]. These findings areindicative of an effect associated with radiation exposuresthat were larger in earlier than in later calendar periods.However, the general lack of dosimetric data makes it dif-ficult to quantify these risks.
515. Although not included in the UNSCEAR 2000Report [U2], the 1997 study of Artalejo et al. [A32]reported a slight deficit of leukaemia mortality amongworkers for the Spanish Nuclear Energy Board; the SMRwas 0.70 (95% CI: 0.19, 1.80), based on only 4 leukaemiadeaths, of which 1 was among the 27% of the cohort whohad been miners and may have been exposed to alpha radi-ation [A32]. Rogel et al. [R54] reported mortality due tonon-CLL leukaemia close to the values expected fromFrench national mortality rates among radiation workers of Électricité de France (5 observed deaths versus
UNSCEAR REPORT-PART 1.qxp 10/7/08 2:58 pm Page 116
7.2 expected; SMR = 0.70; 90% CI: 0.27, 1.46); there wasa positive but not statistically significant trend of risk ofmortality due to non-CLL leukaemia with dose (ERR = 6.8(90% CI: –8.4, 62.2) Sv–1).
516. Further information has become available on the riskof leukaemia for young people in relation to their exposureto gamma radiation from natural sources. A large case-con-trol study in the United Kingdom did not show any associ-ation between childhood leukaemia risks and gamma doserate, as measured in the dwelling occupied for at least sixmonths in the period immediately before diagnosis [U17].Further details of this study are given in table 15.Notwithstanding the large number of subjects in this studyand the collection of individual dosimetric data, the study’sstatistical precision is limited both by the low mean gammadose rate (i.e. 0.843 mGy per year) and by the relativelynarrow range of dose rates (from less than 0.1 to about 2 mGy per year). A national study in Sweden provided aweak suggestion of a trend of increasing risk of ALL at agesof less than 20 years with gamma radiation exposure aris-ing from living in dwellings built from uranium-containingalum shale concrete [A24]. However, the statistical precisionof these findings is low, reflecting in part the low dosesreceived and the lack of detailed dosimetry for dwellings notknown to have been built from alum shale concrete, whichmay have led to some misclassification of the exposures.
(b) External high-LET exposures
517. Various studies have been conducted of leukaemiarisks among aircrew exposed externally to both high-LETand low-LET radiation. As with studies of other types ofexposure, caution needs to be attached to findings fromsmall studies, and more weight should be given to well-designed large analyses. For example, Gundestrup andStorm [G22] drew attention to an excess incidence of AMLin a cohort of Danish jet cockpit crew, albeit based on only3 cases. A similar result had been reported previously fora study involving Canadian pilots [B32]. However, this find-ing was not replicated in a subsequent analysis based on alarger cohort of airline pilots in five Nordic countries [P21].Analyses of leukaemia mortality in larger cohorts of air-crew from a wider range of European countries have gen-erally provided little evidence of raised leukaemia risksrelative to national rates with duration of employment (formore than 44,000 cabin crew [Z4]) or with estimated cumu-lative dose (for around 19,000 male pilots [L48]). However,even in large analyses such as these, the numbers ofleukaemias have been small, so making inferences is diffi-cult. Furthermore, when dose–response analyses have beenconducted, the high- and low-LET components of dose havenot been separated [L48].
(c) Internal low-LET exposures
518. Two recent studies have considered leukaemia ratesamong people who lived near the Techa River in theSouthern Urals in the Russian Federation, and who received
protracted internal exposures (mainly due to 90Sr) and exter-nal exposures as a consequence of releases from the Mayakcomplex. Krestinina et al. [K50] conducted a study ofleukaemia mortality based on a cohort of about 30,000people born before 1950 who lived near the river sometimebetween 1950 and 1960. As of the start of 2000, about halfthe cohort was known to have died, and the cause of deathwas known in 85% of these instances. Although it wasstated that about 16% of residents were lost to follow-up,the date of migration from the study area was known inmany cases, and this allowed a more accurate determina-tion of the number of person-years at risk. Krestinina et al.[K50] estimated that the ERR (low-LET) was 4.2 (95% CI:1.2, 13) Gy–1 for all leukaemias and 6.5 (95% CI: 1.8, 24)Gy–1 for non-CLL leukaemia. However, they stressed cau-tion in interpreting these values because of uncertainties inthe dose estimates. In particular, this risk analysis incorpo-rated “individualized” dose estimates—summed over inter-nal and external exposures—that used age-dependentparameters and detailed residential histories, but did nottake account of the precise location of individual residenceswithin villages or of detailed lifestyle patterns. This is likelyto give rise to Berkson measurement errors in the doses.These measurement errors may not have biased the esti-mates of any dose–response relationship, but would implythat confidence intervals for estimated trends in risk withdose are too narrow. Further work to improve the dosime-try and the follow-up of this population is in progress.
519. The other recent analysis of the Techa River popu-lation was a case-control study of leukaemia incidence,nested within essentially the same cohort as above [O13].Leukaemia cases arising within the study region were iden-tified from medical records of the leading haematologicalclinic in that area. Controls were selected randomly fromthe cohort and individually matched to the cases on the basisof the individual’s age at the time of diagnosis, the indi-vidual’s sex, and whether or not they moved into the areaafter the period of peak exposures. The dose estimates usedin this analysis pre-dated those used by Krestinina et al.[K50]. However, the findings were broadly similar. TheEOR (low-LET), based on both internal and external expo-sures, was 3.5 (95% CI: 1.5, 8.1) Gy–1 for all leukaemiasand 4.6 (95% CI: 1.7, 12.3) Gy–1 for non-CLL leukaemia[O13]. Based solely on the cumulative internal dose at thetime of diagnosis, the EOR (low-LET) for non-CLLleukaemia was little changed: specifically it was 5.4 (95%CI: 1.1, 27.2) Gy–1. Adjustment for level of education, occu-pation and any history of tumours had little impact on theseresults. There was a weak suggestion that the estimated riskper unit dose might have been greater for persons youngerthan 26 years of age at around the time of peak exposuresand for those diagnosed before 1970, but these findingswere not statistically significant. There were a somewhatlarger number of cases (83) than in the recent mortality data[K50] (49 non-CLL and 12 CLL), although only 50 of thesewere of known cell type, and 20 of these cases were CLL.Nevertheless, it should be recognized that both analyses arebased on essentially the same cohort. Consequently, precise
ANNEX A: EPIDEMIOLOGICAL STUDIES OF RADIATION AND CANCER 117
UNSCEAR REPORT-PART 1.qxp 10/7/08 2:58 pm Page 117
118 UNSCEAR 2006 REPORT: VOLUME I
quantification of risks is difficult for the same reasons asthose mentioned earlier, particularly owing to the uncer-tainties in dosimetry.
520. Some other studies have examined the incidence ofleukaemia in children in relation to radiation exposures aris-ing from the Chernobyl accident in 1986. An updatedfollow-up of childhood leukaemia in Belarus continued toshow no increase in rates [G19], as did an analysis in theBryansk region of the Russian Federation [I32], whereas ananalysis in Ukraine indicated a raised risk among childrenborn in 1986 [N5]. Further afield, an analysis of childhoodleukaemia in Hungary did not show a statistically signifi-cant increase in relation to the accident [T46] and, while ithad been suggested that infant leukaemia was increased inScotland and Wales as a result of the accident [B6], a wideranalysis of data from the United Kingdom did not confirman association [C28]. These analyses were “ecological stud-ies”, which did not take account of individual exposures. Incontrast, a case-control study of leukaemia in young peoplehas been conducted in Ukraine in which individual doseswere estimated [N6]. This study indicated a raised riskamong those with doses due to the accident of 10 mSv ormore relative to those with doses of less than 2 mSv (RR= 2.5; 95% CI: 1.1, 5.4). However, a key limitation was thelow proportion of eligible subjects who were included inthe study, therefore raising the possibility of bias. A largercase-control study of leukaemia in young people was con-ducted in parts of Belarus, the Russian Federation andUkraine [D52]. Only a small subset of the cases in this studywas included in the earlier study [N6], while participationrates appeared to be higher in the three-country study. Therewas a statistically significant trend in leukaemia risk withestimated bone marrow dose, but interpretation of this find-ing was complicated by differences in the estimated doseresponse between the three countries [D52]. In particular,most of the evidence for a raised risk came from Ukraine,even though the mean dose for controls here was lower thanthe corresponding values for the regions of Belarus and theRussian Federation that were included in the study.Furthermore, all of these mean doses were low; the high-est value was 11.74 mSv for the regions studied in Belarus.
521. There is little new information on leukaemia risksfor those who might have received environmental exposuresin adulthood as a consequence of the Chernobyl accident.An “ecological study” in northern Sweden did not show aclear excess of leukaemia [T47], although some aspects ofthe methodology (e.g. the exclusion of deaths when calcu-lating disease rates during the 1986–1987 reference period)were questionable. Given these and the “ecological” designof the study, which is known to be susceptible to bias [L68,L69], little weight should be attached to the null findingsof this study.
522. Further studies have been conducted in recent yearsaround nuclear installations in other countries. A study ofchildhood leukaemia cases around the 29 nuclear installa-tions in France found no evidence of a generally increased
risk [W24]. While there was a weak suggestion of a raisedrate of the incidence of ALL at ages younger than 10 yearswithin 10 km of the La Hague reprocessing plant in Franceduring 1978–1998, this finding was based on only 4 cases.Furthermore, an assessment based on a radioecological studyconducted around this plant estimated that the expectednumber of radiation-induced leukaemias in young peopledue to releases from local nuclear installations would be lessthan 0.002 [L70, R50]. Likewise, there was little evidenceof excess risk around French nuclear sites when using a geo-graphical zoning based on gaseous discharge dose estimates[E13]. A study in the United Kingdom found no excess ofchildhood leukaemia during the period 1969–1993 aroundnuclear power plants and, aside from the raised rates previ-ously reported around sites such as Sellafield and Dounreay,there was generally no new evidence of excesses aroundother nuclear sites [C7]. A study in Japan indicated a raisedrate of leukaemia mortality summed over all ages in munic-ipalities that contained a nuclear installation; however, therewas no increase among young people [Y9]. An updatedanalysis of mortality rates around the Three Mile Islandnuclear power plant in the United States did not indicateclear patterns in leukaemia risks [T45]. Overall, while thereare a few nuclear installations around which raisedleukaemia risks have previously been observed, there is verylittle evidence of raised rates around nuclear sites generally[L56]. This is not surprising in view of the very low radia-tion exposures of those living near most sites.
523. With regard to environmental exposures due toatmospheric nuclear weapons testing, Abylkassimova et al.[A23] gave brief details of a leukaemia case-control studyconducted in Kazakhstan. This study was nested within acohort of about 10,000 residents of settlements that weredownwind from the Semipalatinsk nuclear test site. The riskamong those with estimated doses of more than 2 Sv wasabout twice that among those whose doses were less than0.5 Sv. However, this RR value was very imprecise, andthe associated 95% confidence interval included 1, reflect-ing the small total number of cases of non-CLL leukaemia(i.e. 22). A study in French Polynesia reported higher ratesof childhood leukaemia in the period 1985–1989 when com-pared with the period 1990–1995, although over the fullstudy period of 1985–1995, rates were similar to thoseexpected among New Zealand Maoris and natives of Hawaii[C5]. These data were not analysed specifically in relationto atmospheric nuclear weapons testing at the Mururoa andFangataufa atolls. Extended follow-up of United Kingdomparticipants in the United Kingdom atmospheric nuclearweapons test programme provided some evidence of araised risk of non-CLL leukaemia relative to a controlgroup, although this might have been a chance finding inview of the low mortality observed in the controls relativeto national rates [M35]. In a study of United States mili-tary personnel who took part in nuclear weapons tests inNevada or the Pacific in the 1950s, mortality due toleukaemia was less than that expected from national rates,while the RR compared with a control group was slightlygreater than, but consistent with, unity [I17].
UNSCEAR REPORT-PART 1.qxp 10/7/08 2:58 pm Page 118
524. A study of patients in France, Italy and Sweden whowere treated with 131I for thyroid cancer has investigatedthe subsequent risk of various types of second cancers,including leukaemia [R38]. This study indicated a trend ofincreasing leukaemia risk with the cumulative 131I activityadministered during the period two or more years previ-ously. External irradiation as part of the treatment for thy-roid cancer did not appear to influence this relationship.However, although this combined analysis has greater statistical power than the earlier studies conducted in eachof the three countries [D18, D38, H2], detailed inferencesabout the relationship between administered activity andrisk are not possible, because of the small total number ofleukaemias (specifically 18). In addition, the risk of non-CLL leukaemia was not evaluated separately.
(d) Internal high-LET exposures
525. A combined analysis of patients in Denmark andSweden who were injected with Thorotrast [T30] shows asubstantial excess incidence rate of non-CLL leukaemia rel-ative to both national rates and rates in an unexposed groupof patients (see table 44). Leukaemia excesses have alsobeen seen in recent analyses of patients injected withThorotrast in the United States [T30] and Portugal [D27],although these were based on smaller numbers. Travis et al.[T30] noted that leukaemias were diagnosed throughout themore than 50 years of follow-up for the Danish and Swedishpatients, which the authors considered to be due to the con-tinual radiation exposure rather than an effect of the timesince exposure. This analysis provided some suggestion ofa higher incidence of CLL among irradiated than non-irra-diated patients (with 6 and 1 cases observed, respectively,in similarly sized groups). However, this difference was notstatistically significant and also appeared to be lower inmagnitude than the corresponding difference for non-CLLleukaemia [T30]. In the Portuguese study, none of theleukaemias among irradiated patients was CLL, althoughthe small numbers make inferences difficult [D27]. On thebasis of earlier findings from studies on patients receivingThorotrast and on survivors of the atomic bombings [U2],Harrison and Muirhead [H40] suggested that the relativebiological effectiveness of alpha radiation might be around2–3 times that of external low-LET radiation for the caseof leukaemia, which would fit with associated animal data.However, Travis et al. [T30] noted that risk estimates basedon Thorotrast data are subject to uncertainty, particularlywith regard to dosimetry.
526. In a review published in 2001 of studies of radonexposure and leukaemia risks, Laurier et al. [L54] drewattention to the differences between findings from “ecolog-ical studies” and those from case-control studies involvingindividual assessments of exposures. This point, which washighlighted in the UNSCEAR 2000 Report [U2], has beenreinforced by results from more recent studies of radonexposure and leukaemia risks. On the basis of data for 348geographical units in France, Evrard et al. [E11] reported a trend of increasing risk of childhood acute leukaemia
averaged over each of these areas with the average indoorradon concentration. This trend was of borderline statisticalsignificance for all acute leukaemias (p = 0.053), but wasmost apparent for AML (p = 0.004) rather than for ALL (p = 0.49). This conclusion was not modified by taking intoaccount exposure to terrestrial and cosmic radiation [E1].Attention has been drawn previously to the difficulties aris-ing in interpreting such correlation studies, and greaterweight would generally be placed on cohort and case-control studies [U2]. For example, a large case-control studyin the United Kingdom found that, if anything, radon concentrations in the homes of childhood leukaemia casesmay have been lower than those in the homes of the children in the control group [U16]. However, the similarityin findings seen across a range of childhood cancer typesin this study suggests that differences in participation ratesboth between cases and controls and by level of depriva-tion might have led to some bias. Another large case-control study in the United Kingdom, this time focusing onincidence of acute leukaemia in adults, found no associa-tion with radon concentration as measured in the homeoccupied at the time of diagnosis [L55].
527. Recent reviews have considered the health risks[T31, T32], including leukaemia risks, in relation to expo-sure to uranium. These reviews have considered findingsfrom studies of occupational exposures arising, for exam-ple, from the processing, manufacturing and milling of ura-nium. Studies of uranium miners have also been considered.In general, these studies have not indicated elevated risksof leukaemia in relation to uranium exposure. The RoyalSociety report [T32] concluded that any extra risk of deathfrom leukaemia as a result of exposure to depleted uraniumwould be substantially lower than that from lung cancer,and that any raised leukaemia risk to persons exposed todepleted uranium is likely to be too small to be detectable.However, epidemiological studies of uranium exposures islimited by difficulties in assessing individual doses and inseparating any effect due to radiation from that due to thechemical toxicity of uranium, as well as by the limited pre-cision of individual studies and by the healthy worker effect[T31, T32]. For example, a recent study involving a cohortof uranium mill workers in the United States indicated that,if anything, leukaemia mortality was less than that expectedfrom local rates (5 observed versus 6.51 expected), but thestudy was based on very small numbers [P25]. Studies ofenvironmental exposures have also been conducted. In par-ticular, a study of uranium and other natural radionuclidesin drinking water in Finland did not indicate an associationwith leukaemia incidence, based on a total of 35 cases[A25]. Also, studies of populations living around some sitesin the United States involved in uranium processing, man-ufacturing and milling did not show raised leukaemia risks[B29, B30, B31].
528. Of the roughly 21,500 workers at the Mayak plantin the Russian Federation who were studied by Shilnikovaet al. [S28], 25% had been monitored for their exposure to plutonium. Although detailed estimates of plutonium
ANNEX A: EPIDEMIOLOGICAL STUDIES OF RADIATION AND CANCER 119
UNSCEAR REPORT-PART 1.qxp 10/7/08 2:58 pm Page 119
120 UNSCEAR 2006 REPORT: VOLUME I
exposures were not available, analysis based on a surrogatemeasure of plutonium exposure did not indicate an associ-ation with rates of mortality due to non-CLL leukaemia[S28]. In a small study of radiation workers in the UnitedStates, Ritz et al. [R1] reported some weak evidence of atrend of increasing rates of mortality due to haematopoieticand lymphopoietic cancers (of which most were leukaemias)with internal dose, based on low- and high-LET radiationexposure from a mixture of radionuclides. However, notonly was this finding based on only 10 deaths, but also thedose estimates were specific to the lung rather than the bonemarrow. Other recent studies of radiation workers exposedinternally to high-LET radiation have not reported resultsfor leukaemia and/or they lacked detailed measures of exposure (e.g. [W22]).
4. Summary
529. New findings for leukaemia mortality in the cohortof Japanese survivors of the atomic bombings based on anextended follow-up show similar age and time patterns inradiation risks to those seen previously in this group.Furthermore, the use of the new DS02 dosimetry systemhas little impact either on the level of risk estimated for thiscohort or on the evidence for a curvilinear dose–responserelationship, such that the excess risk per unit dosedecreases with decreasing dose.
530. A few recent studies have provided extra informa-tion on leukaemia risks among groups exposed for medicalreasons. However, the studies of this type that werereviewed in the UNSCEAR 2000 Report and are also con-sidered in Section II of this annex are generally moreinformative. In particular, these studies and also those ofoccupational exposures provide far stronger evidence of anassociation between non-CLL leukaemia risks and radiationexposure than is the case for CLL risks. Moreover, in viewof the clinical and aetiological links between CLL and lym-phomas, the conclusions reached elsewhere in this annexconcerning radiation exposure and lymphoma risk shouldalso apply to CLL risk.
531. New analyses of radiologists, radiologic technolo-gists and other X-ray workers have confirmed higher risksof leukaemia among those exposed many years ago, whenoccupational doses are likely to have been higher than thosereceived in recent years. In contrast, there is little evidenceof increased risks for people receiving X-ray exposuresmore recently. However, more detailed inferences are pre-cluded by the general lack of individual dosimetric data forthese groups. Follow-up of workers at the Mayak plant inthe Russian Federation who received a wide range of exter-nal and internal doses over a protracted period shows araised risk of leukaemia in relation to external gamma dose,but not in relation to a measure of plutonium exposure.While precise quantification of the level of risk for theseworkers is difficult, the findings appear to be consistent withthose from the studies of the Japanese survivors of the
atomic bombings. Other recent analyses of radiation work-ers, including a large study based on data for workers in15 countries, considered groups whose cumulative dosestended to be much lower than those of Mayak workers. Thefindings from these studies are largely consistent withextrapolation from the atomic bombing survivor data, butbecause of their generally low statistical precision, thesestudies are also consistent with a range of risks both lowerand higher than this.
532. Several analyses have been conducted recently ofaircrew exposed to external high-LET and low-LET radia-tion. In general, these studies have tended not to showraised risks of leukaemia. However, even analyses based onlarge cohorts have been limited by the relatively small num-bers of leukaemias involved, as well as by the low dosesreceived and by the general lack of individual dose estimates.
533. New information on leukaemia risks for groupsexposed to internal low-LET radiation, as well as to exter-nal low-LET radiation, has become available from studiesin the former Soviet Union. Cohort and case-control stud-ies of Techa River residents have indicated dose-relatedtrends in leukaemia risk that are reasonably consistent withestimates from studies of the Japanese survivors of theatomic bombings, but which are still somewhat uncertain.At much lower doses, a recent case-control study in Belarus,the Russian Federation and Ukraine of exposures due to theChernobyl accident reported a dose-related increase inleukaemia in young people, but heterogeneity in the find-ings between the countries makes interpretation difficult.Recent studies of people living around nuclear installationsin other countries have generally not shown raised risks,while findings for groups exposed as a consequence ofatmospheric nuclear weapons testing have been mixed andgenerally do not provide strong evidence of an increasedrisk of leukaemia. A combined analysis of patients fromthree countries who were treated for thyroid cancer indi-cates a trend of increasing leukaemia risk with cumulativeintake of 131I, but the number of cases studied was small.
534. Further data on patients injected with Thorotrast con-tinue to show raised risks of leukaemia associated with thistype of exposure. Comparison of these and earlier findingswith those for the Japanese survivors of the atomic bomb-ings provide some indication that, in this instance, the relative biological effectiveness of alpha radiation forleukaemia induction might be around 2–3. However, thisestimate is subject to various sources of uncertainty, par-ticularly relating to Thorotrast dosimetry.
535. Studies of radon exposure and leukaemia risks pub-lished since the UNSCEAR 2000 Report have continued toprovide differing findings, according to whether they arebased on an “ecological design” or on the collection of indi-vidual exposure information as part of case-control orcohort studies. While some of the case-control studies havehad methodological limitations, the lack of any indication
UNSCEAR REPORT-PART 1.qxp 10/7/08 2:58 pm Page 120
from these and earlier case-control and cohort studies of atrend of increasing leukaemia risk with increasing individ-ually assessed radon exposures is notable. In view of thegenerally low doses to the bone marrow arising from expo-sure to radon in dwellings, it is unlikely that risks of theorder predicted from current radiation risk estimates forleukaemia could have been observed.
536. Studies of groups exposed to uranium or plutoniumhave generally provided little indication, if any, of raisedleukaemia risks. Many of these studies have been limitedby the relatively small numbers of cases and a general lackof detailed dosimetric data. However, it would appear thatany increase in leukaemia associated with these exposureswould be very small.
ANNEX A: EPIDEMIOLOGICAL STUDIES OF RADIATION AND CANCER 121
UNSCEAR REPORT-PART 1.qxp 10/7/08 2:58 pm Page 121

UNSCEAR REPORT-PART 2.qxp 10/7/08 3:18 pm Page 122
IV. LIFETIME RISK FOR TOTAL CANCER
A. Methods and assumptions of calculations
537. As noted in the Introduction to this annex and as fur-ther discussed in both section I.G and appendix B, theCommittee has evaluated four commonly used measures ofpopulation cancer risk, derived from risk models fitted tothe LSS mortality data, using the latest DS02 dosimetry andfollow-up [P10]. Lifetime population cancer risks have beencalculated for China, Japan, Puerto Rico, the United Statesand the United Kingdom. Mortality risk estimates are pre-sented for solid cancers and leukaemia separately, thesebeing the only malignant disease end points yet availablefor analysis in the latest version of the LSS mortality datausing the updated DS02 dosimetry [P10]. The Committeehas also evaluated risks of cancer for oesophageal, stom-ach, colon, liver, lung, bone, non-melanoma skin, femalebreast, urinary bladder, central nervous system, thyroid andall other solid cancers in the latest version of the LSS inci-dence data using the updated DS02 dosimetry [P48]. Therewere 100 or more cases for all these cancer sites with theexception of bone cancer, and a statistically significant (2-sided p < 0.05) dose response (see appendix A). Althoughthere were only 19 cases of bone cancer, risks have never-theless been assessed. The results of fitting models to themortality rate and cancer incidence rate data using classi-cal likelihood-based methods (with adjustment for dosimet-ric error) are presented; these methods are described in moredetail in appendices C and D. Models have also been fittedto the DS02 mortality data using Bayesian methods, as out-lined in appendix E. As discussed in section I.D, the mainadvantage of the Bayesian approach is that dosimetric andother uncertainties are better reflected in the variability ofthe model parameters. The analysis employs the two-stepmethod recently used to evaluate the effects of dose uncer-tainties on model parameters and to propagate these intouncertainties in population cancer risk estimates [B18, L17].
538. Risks are calculated at three test doses, Dt, of 0.01Sv, 0.1 Sv and 1 Sv. It is implicitly assumed that thesedoses are whole-body doses, uniformly irradiating the tissues under consideration. The results depend on the following factors, which are discussed briefly below:
• The exposed population for which risk estimates aredeveloped, and the models used to describe theexcess risks to this population;
• The models used to describe risk at low doses;• The method used to extend the excess risk models
beyond the period of observation of the populationfrom which these models were developed;
• The cause-specific incidence and mortality rates andthe age structure of the population to which the ratesare applied;
• The methods used to transfer estimates of excesscancer risk based on models for one population toanother population;
• The method used to allow for dose fractionation ordose-rate effects.
1. Risk models
539. As in the previous UNSCEAR reports [U2, U4], theCommittee’s risk estimates are based on recent data fromthe follow-up of the LSS of the survivors of the atomicbombings in Japan. The recent analysis by Preston et al.[P10] of LSS mortality data based on mortality follow-upfrom October 1950 to December 2000 is employed, as wellas the latest analysis of the solid cancer incidence databased on follow-up from January 1958 to December 1998[P48]. The Committee’s analysis of the LSS data is thefirst to use the recently revised DS02 dosimetry [C13]. Asnoted in the Introduction, for some time it was thoughtthat the neutron dose estimates for the survivors of thebombing of Hiroshima using the previous (DS86) dosime-try were systematic underestimates, particularly for sur-vivors from beyond 1000 m from the hypocentre [R20,S39]. This led to substantial multinational efforts todevelop a new dose assessment system, the DS02 dosime-try [C13, R12]. Recent analysis of all the data, includingthose on fast-neutron activation products, suggests thatthere are no appreciable systematic errors in the DS86 esti-mates of neutron doses for survivors of the bombing ofHiroshima [C13, R12, S41]. The DS02 dosimetry differsslightly from the DS86 system, for both neutron andgamma doses, by amounts generally of no more than 20%in the range up to 1,500 m from the two hypocentres,where survivors received the greatest doses [C13, R12].Analyses of the Radiation Effects Research Foundation(RERF) epidemiological data using the new dosimetryindicate that cancer risk estimates might decrease by about8% as a result, with no appreciable change in the shapeof the dose response or in the age and time patterns ofexcess risk [P10].
540. The cancer risk models that are fitted to this data setfor the purposes for deriving population risk estimates weredeveloped specifically for the Committee. Radiation risksare often described by models for cause-specific death ratesor “hazard functions”. The hazard function, h(a), for mor-
123
UNSCEAR REPORT-PART 2.qxp 10/7/08 3:18 pm Page 123
124 UNSCEAR 2006 REPORT: VOLUME I
tality at age a is defined as the probability of dying in ashort interval [a,a + δ] divided by the probability of sur-viving up to age a and the length of the interval δ, in thelimit that δ → 0, or more formally,
Similar definitions for the hazard function can be derivedfor deaths from some specific cause, or indeed for the occurrence of any specific type of event, e.g. the occurrenceof cancer. Quite often the hazard function, h(a), will dependon variables other than only age, for example sex, s, calendar period, y, and exogenous exposures, for instanceto a dose of ionizing radiation D delivered at age e, so thatone may write the hazard function as h = h(a,y,s,D,e).
541. In modelling the effect of some exposure, in partic-ular that to ionizing radiation, it is usual to consider the dif-ference between the instantaneous cancer death rate, orhazard function, when there has been exposure, h(a,y,s,D,e),and what the instantaneous death rate, or hazard function,would have been without that exposure, h0(a,y,s,e) =h(a,y,s,0,e), the “baseline” hazard function. This differenceis the excess absolute risk (EAR):
(7)
An essential element of such models is the associated modelfor the baseline hazard function, which is often of simpleparametric form, for example:
(8)
where c refers to the city of residence at the time of thebombings (Hiroshima or Nagasaki), s is the sex, a is attainedage, e is age at exposure, and π0,π1,π2,π3,π4 are the modelparameters (which are often determined by fitting to thedata).
542. Another commonly used measure is the excess rela-tive risk (ERR), which is given by the EAR divided by thebaseline hazard:
(9)
Again, an essential element in the specification of suchmodels is the baseline hazard function, h0(a,s) = h(a,y,s,0,e),which is again often assumed to have a simple parametricform, for example along the lines of expression (8).
543. Corresponding to these methods for decomposing thehazard function are two much used models of radiation-
ERR(a, y, s, D,e) = EAR(a, y, s, D,e) / h(a, y, s,0,e)
= [h(a, y, s, D,e) − h(a, y, s,0,e)]/ h(a, y, s,0,e)
h0(a, y, s,e,c) = exp[π0 ⋅1c= Nagasaki + π1 ⋅1s= female
+ π2 ⋅ ln[a] + π3 ⋅[ln[a]]2 + π 4 ⋅ e]
h0(a, y, s,e,c) = exp[π0 ⋅1c= Nagasaki + π1 ⋅1s= female
h(a) = limδ ↓0+
P[time of death ∈[a,a + δ )]
δ ⋅ P[time of death ≥ a]
induced cancer risk. Until the late 1980s, two fairly simplemodels for describing radiation-induced cancer risks wereused by the Committee [U6] and by other national and inter-national committees, such as the BEIR committee [C33]and the ICRP [I11]. These are empirical models, which donot depend on assumptions about specific mechanisms ofcarcinogenesis. The first is the “time-constant absolute (oradditive) risk projection model”, which assumes that, aftersome “latent period”, the annual excess cancer risk is con-stant. This results in the cancer rate following exposure toa dose of radiation being given by:
h0(a,s) + F(D) (10)
where h0(a,s) is the baseline cancer hazard function in theabsence of exposure to radiation, i.e. the underlying cancerrate at age a and for sex s. F(D) is the function describingthe dose dependency of the cancer risk, which is often ofthe linear–quadratic form F(D) = α ⋅ D + β ⋅ D2. In theUNSCEAR 1988 Report [U6], a model of this form wasused for describing the risk of leukaemia. The second modelis the “time-constant relative (or multiplicative) risk pro-jection model”, which assumes that, after some latent periodfollowing an exposure to radiation, the annual cancer raterises in a manner proportional to the underlying annualcancer risk. This results in the cancer rate following expo-sure to a dose D of radiation being given by:
h0(a,s) ⋅ [1 + F(D)] (11)
where again F(D) is the function determining the dosedependency of the cancer risk, which again is often of theform F(D) = α ⋅ D + β ⋅ D2.
544. In the UNSCEAR 1988 Report [U6], a model of thisform (with linear dose response) was used for modellingsolid cancer risks. Until the late 1980s, both models wereused for the purposes of estimating cancer risks. Largely asa result of extra years of follow-up of the survivors of theatomic bombings, it became clear that the RR model fittedmost solid cancer data much better than the absolute riskmodel. For this reason, the ICRP [I11] and most other sci-entific committees [C35] tend to use the RR model ratherthan the absolute risk model for projecting solid cancer risksto the end of life.
545. While the RR model is the most useful for the pur-pose of modelling cancer risks, it is the absolute risk thatis often of most interest to an exposed individual or popu-lation. This is readily derived from the calculated RR whenthe baseline risk is known.
546. It is well known that, for all cancer subtypes (includ-ing leukaemia), the ERR diminishes with increasing age atexposure [L51, L52, U2]. For those irradiated in childhood,there is evidence of a reduction in the ERR of solid cancer25 or more years after exposure [L16, L53, P9, T1].Therefore, even for solid cancers, various factors have tobe employed to adjust the ERR. For many solid cancers, a
UNSCEAR REPORT-PART 2.qxp 10/7/08 3:18 pm Page 124
EAR a y s D e h a y s D e h a y s e( , , , , ) ( , , , , ) ( , , , , )= − 0
“generalized excess relative risk model” is commonly used,in which the cancer rate at t years after exposure, for sexs, following exposure at age e to a dose D of radiation isgiven by:
(12)
where as before h0(a,s) is the baseline cancer rate, a = t +e is the age at observation (attained age) of the person andF(D) is the function determining the dose dependency ofthe cancer risk, which is often of the form F(D) = α ⋅ D +β ⋅ D2. The expression φ(t,e,s) describes the adjustment tothe ERR, F(D), as a function of time since exposure t, ageat exposure e and sex s.
547. For leukaemia, neither the time-constant EAR modelnor the time-constant ERR model fits well. For reasonslargely of ease of interpretation, Preston et al. [P4] presentmost of their analyses of the LSS leukaemia incidence dataset using a “generalized excess absolute risk model”, fromwhich the cancer rate t years after exposure, for sex s, following exposure at age e to a dose D of radiation is given by:
(13)
The expression ψ (t,e,s) describes the adjustment to theEAR, F(D), as a function of time since exposure t, age atexposure e and for sex s. As above, very frequently alinear–quadratic form, F(D) = α ⋅ D + β ⋅ D2, is assumedfor the dose response.
548. Given appropriate forms of the adjusting or modi-fying functions φ (t,e,s) and ψ (t,e,s) of the relative andabsolute risk, respectively, equivalently good fits to theleukaemia incidence data set were achieved using bothgeneralized ERR and generalized EAR models [P4]. It isto some extent arbitrary which of these two models isused. However, models with equivalent fits to the data canyield somewhat different estimates of population cancerrisks. The reason for this is that about half the LSS cohortare still alive [P10], so that population risk estimationsbased on this data set (and used by many scientific com-mittees [C33, C35, I11, U2, U4, U6]) crucially depend onextrapolating the current mortality and incidence follow-up of this group to the end of life. Uncertainties due torisk projection are greatest for solid cancers, because theradiation-associated excess risk as seen by the LSS is stillincreasing [P9, P10]. For leukaemia, the excess risk isdecreasing over time [P4], and most models used predictvery few radiation-associated leukaemia deaths or cases inthe future.
549. In modelling solid cancer and leukaemia mortalityfor the latest follow-up of mortality of the survivors of the atomic bombings [P10], the Committee has used
h0(a,s) + F(D) ⋅ψ (t,e,s) = h0 (a, s) + EAR(D, t,e, s)
h0(a,s) ⋅[1+ F(D) ⋅φ(t,e, s)] = h0 (a, s) ⋅[1 + ERR(D, t,e,s)]
generalized ERR and EAR models. For solid cancer mor-tality, the following generalized ERR model was used, inwhich the cancer mortality rate for age a, age at exposuree, city c, sex s and “true” colon dose D is given by:
(14)
This is a generalized ERR model that is linear in dose andthat incorporates adjustment to the ERR for sex, s, attainedage, a, and time since exposure, a – e. For purposes of com-parison with models previously fitted by the Committee, thefollowing generalized ERR model was also used, in whichthe cancer mortality rate is given by:
(15)
This is a generalized ERR model that is linear in dose, andthat incorporates adjustment to the ERR for sex, s, and ageat exposure, e.
550. A generalized EAR model was also fitted in whichthe mortality rate is given by:
(16)
This is a generalized EAR model that is linear–quadratic indose, and that incorporates adjustment to the EAR forattained age, a, and time since exposure, a – e. The param-eters associated with the fits of these two models to the LSSDS02 solid cancer mortality data [P10] are given in table45. The associated analysis of statistical deviance is givenin tables D1 and D2 in appendix D. Table D17 in appen-dix D gives details of the specific form of the baseline rate,h0(a,e,c,s), used in model fitting.
551. Likewise, for leukaemia mortality the following gen-eralized ERR model was used, in which the leukaemia mor-tality rate for age a, age at exposure e, city c, sex s and“true” colon dose D is given by:
(17)
This is a generalized ERR model that is linear–quadratic indose, and that incorporates adjustment to the ERR forattained age, a. The Committee also fitted a generalizedEAR model in which the leukaemia mortality rate is given by:
(18)
h0(a,e,c, s) + (α ⋅ D + β ⋅ D2 ) ⋅ exp[κ1 ⋅1s = female
+κ2 ⋅ ln[a − e]]
h0(a,e,c, s) ⋅ 1+ (α ⋅ D + β ⋅ D2 ) ⋅ exp[κ1 ⋅ ln[a]]⎡⎣ ⎤⎦
h0(a,e,c, s) + (α ⋅ D + β ⋅ D2 ) ⋅ exp[κ1 ⋅ ln[a − e]
+κ2 ⋅ ln[a]]
h0(a,e,c, s) ⋅ 1+ (α ⋅ D + β ⋅ D2 ) ⋅ exp[κ1 ⋅1s = female
+κ2 ⋅ ln[e]]
⎡⎣⎤⎦
h0(a,e,c, s) ⋅ 1+ α ⋅ D ⋅ exp[κ1 ⋅1s = female + κ 2 ⋅ ln[e]]⎡⎣ ⎤⎦
ANNEX A: EPIDEMIOLOGICAL STUDIES OF RADIATION AND CANCER 125
UNSCEAR REPORT-PART 2.qxp 10/7/08 3:18 pm Page 125
h a e c s D D a es female02
1 2 31 1( , , , ) ( ) exp[ ln[ ] ln⋅ + ⋅ + ⋅ ⋅ ⋅ + ⋅ − + ⋅=α β κ κ κ [[ ]]a h a e c s D D a es female0
21 2 31 1( , , , ) ( ) exp[ ln[ ] ln⋅ + ⋅ + ⋅ ⋅ ⋅ + ⋅ − + ⋅=α β κ κ κ [[ ]]a
⎡⎣⎤⎦
126 UNSCEAR 2006 REPORT: VOLUME I
This is a generalized EAR model that is linear–quadratic indose, and that incorporates adjustment to the absolute riskfor sex, s, and time since exposure, a – e. The parametersassociated with the fits of these two models to the LSSDS02 leukaemia mortality data [P10] are given in table 46.The associated analysis of deviance is given in tables D3and D4 in appendix D. Table D17 in appendix D givesdetails of the specific form of the baseline rate, h0(a,e,c,s),used in model fitting.
552. In modelling the incidence of specific types of solidcancer for the latest follow-up of the survivors of the atomicbombings [P48], the Committee again used generalizedERR and EAR models. For solid cancer incidence, the fol-lowing generalized ERR model was used, in which thecancer rate for age a, age at exposure e, city c, sex s and“true” colon dose D is given by:
(19)
This is a generalized ERR model that is linear–quad-ratic–exponential in dose, and that incorporates adjustmentto the ERR for sex, s, attained age, a, time since exposure,a – e, and age at exposure, e. For specific solid cancer sub-types, various coefficients are set to zero. In particular, forall cancers except non-melanoma skin cancer, the cell ster-ilization parameter, γ, is set to zero.
553. Likewise, the following generalized EAR model wasused, in which the cancer rate for age a, age at exposure e,city c, sex s and “true” colon dose D is given by:
(20)
This is a generalized EAR model that is linear–quadratic–exponential in dose, and that incorporatesadjustment to the EAR for sex, s, attained age, a, timesince exposure, a – e, and age at exposure, e. Again, forspecific solid cancer subtypes, various coefficients are setto zero. In particular, for all cancers except non-melanomaskin cancer, the cell sterilization parameter, γ, is set tozero. The parameters associated with the fits of thesemodels to the DS02 cancer incidence data [P48] are givenin tables 47–58. The associated analyses of deviance aregiven in tables D5–D16 in appendix D. Table D17 givesdetails of the specific forms of the underlying rate,h0(a,e,c,s), used in model fitting to data on each solidcancer type.
h0 (a,e,c, s) + (α ⋅ D + β ⋅ D2 ) ⋅ exp[γ ⋅ D] ⋅exp[κ1 ⋅1s = female +κ2 ⋅ ln[a − e] +κ 3 ⋅ ln[a]
+κ 4 ⋅ ln[e]]
h0(a,e,c, s) ⋅1+ (α ⋅ D + β ⋅ D2 ) ⋅ exp[γ ⋅ D] ⋅exp[κ1 ⋅1s = female +κ2 ⋅ ln[a − e]
+κ 3 ⋅ ln[a] +κ 4 ⋅ ln[e]]
⎡
⎣⎢
⎤
⎦⎥
2. Low-dose response, fractionation and dose-rate effects
554. As noted above, it has been customary to model thedose–response function F(D) that appears in expressions(10)–(13) in fits to biological [U5] and epidemiological[U2] data by the linear–quadratic expression:
(21)
While this formulation can be drawn from knowledge ofchromosome repair (e.g. [K54]), on a more heuristic basis,it represents the second-order Taylor series expansion of thedose response. There is significant curvilinearity in the doseresponse for leukaemia in the LSS [L29, L33, L34, L35,L37, P11], although for solid cancers, apart from non-melanoma skin cancer [L30, T1] and bone cancer [R27,T26], there has until recently generally been little evidencefor anything other than a linear dose–response relationshipfor the Japanese cohort [L29, L33, L34, L35, L37, P11,P12] or for any other group [U2]. This issue is discussedat greater length in section I.J. However, the most recentfollow-up of the survivors of the atomic bombings exhibitsa pronounced and statistically significant upward curvaturein the low dose (less than 2 Sv) region [P10], as will bediscussed at greater length below.
555. It should be noted that, as well as differences in theeffectiveness (per unit dose) relating to the total dosereceived, there are also possible variations in effectivenessas a result of dose fractionation (i.e. the splitting of a givendose into a number of smaller doses suitably separated intime) and dose rate [U5]. This is not surprising from aradiobiological point of view. If a given dose is adminis-tered at progressively lower dose rates (i.e. giving the sametotal dose over longer periods of time), or is split into manyfractions, the biological system has time to repair thedamage, so that the total damage induced will be less [U5].Therefore, although for cancers other than leukaemia thereis generally little justification for assuming anything otherthan a linear dose–response relationship, i.e. β = 0 in Eq.(21), it may nevertheless be justifiable to employ a doseand dose-rate effectiveness factor (DDREF) other than 1.(The DDREF is the factor by which one divides risks forhigh-dose and high-dose-rate exposures to obtain risks forlow-dose and low-dose-rate exposures.) The ICRP [I11]recommended that a DDREF of 2 be used together withlinear dose–response models for all cancer sites, largely onthe basis of observations from various epidemiological datasets. The UNSCEAR 1993 Report [U5] recommended thata DDREF of no more than 3 be used in conjunction withthese linear models. The BEIR VII Committee [C37] esti-mated what it termed an “LSS DDREF” to be 1.5 (95% CI:1.1, 2.3) on the basis of estimates of curvature derived fromdata from animal experiments and from the latest LSS solidcancer incidence data. The BEIR VII Committee also con-ducted a detailed review of the experimental literature, anddocumented substantial DDREF values that had been foundfor chromosome aberrations and cell mutation (for
F(D) = α ⋅ D + β ⋅ D2
UNSCEAR REPORT-PART 2.qxp 10/7/08 3:18 pm Page 126
example at the HPRT locus), and for carcinogenesis in ani-mals [C37]. DDREF values in excess of 2 were seen formany cellular systems; most of the animal cancer studies—the experimental end point nearest to cancer in humans—yield “[DDREF] estimates on the order of 2 to 6, with mostvalues in the range 4–5” [C37]. The BEIR committee statedthat their analysis was sensitive to the particular studies theychose to include and, perhaps more importantly, that theDDREF should not be mistakenly thought of as a univer-sal low-dose correction factor. There is further discussionof the DDREF in section I.J.
556. Another form to represent dose response, perhapsless commonly used, slightly generalizes Eq. (21):
(22)
This has been employed in fits to biological data [U5] andto epidemiological data [B5, L29, L30, L31, T21, W2]. Theα ⋅ D + β ⋅ D2 component represents the effect of (carcino-genic) mutation induction, while the exp(γ ⋅ D) term repre-sents the effect of cell sterilization or killing. In general,the cell sterilization coefficient γ is less than zero.Essentially this expresses the idea that there is a competingmechanism due to cell killing, which is more effective athigher radiation doses. A dead cell cannot proliferate andbecome the focus of a malignant clone. Variant forms ofthe cell-sterilization term exp(γ ⋅ D) that incorporate higherpowers of dose D, i.e. exp(γ ⋅ Dk) for k > 1, are sometimesemployed [L30, U5].
557. Although it is generally assumed that protraction ofradiation dose results in a reduction of effect (i.e. DDREF > 1), largely as a result of the extra time that pro-traction allows for cellular repair processes to operate, thereare biological mechanisms that could increase the effectwhen dose is protracted (i.e. DDREF < 1). Bystandereffects, whereby cells that are not directly exposed to radi-ation exhibit adverse biological effects, have been observedin a number of experimental systems in vitro and in vivo[M49, M61]. The bystander effect implies that the doseresponse after broad-beam irradiation could be highly con-cave at low doses because of saturation of the bystandereffect at high doses. This would mean that linear extrapo-lation from data for high-dose exposures would lead to sub-stantial underestimates of effects at low doses. Recently,Brenner et al. [B25] proposed a model for the bystandereffect based on the oncogenic transformation data of Sawantet al. [S43] and Miller et al. [M41] for in vitro exposure ofC3H 10T1⁄2 cells to alpha particles. Brenner et al. [B25] dis-cussed evidence from experimental systems consistent withconcluding that the linear extrapolation of high-dose effectsto low doses underestimates oncogenic transformation ratesby a factor of between 60 and 3,000. However, Little andWakeford [L46] assessed the ratio of the lung cancer riskfor persons exposed to low (residential) doses of radondaughters to that for persons (underground miners) exposedto high doses of radon daughters; the ratio lay in the range2–4 (95% CI: <1, ~14). This implies that low-dose-rate lung
F(D) = (α ⋅ D + β ⋅ D2 ) ⋅ exp(γ ⋅ D)
cancer risks associated with alpha particle exposure are notseriously underestimated by extrapolation from the high-dose miner data; it also implies that the bystander effectobserved in the C3H 10T1⁄2 cell system cannot play a largepart in the process of lung carcinogenesis in humans dueto radon exposure [L46]. The bystander effect and other“non-targeted” effects are discussed at greater length inannex C of the UNSCEAR 2006 Report, “Non-targeted anddelayed effects of exposure to ionizing radiation”.
558. As noted above, in the latest follow-up of the sur-vivors of the atomic bombings there has emerged evidenceof a statistically significant (p < 0.05) upward curvature inthe dose response for solid cancer mortality in the low doserange (colon dose less than 2 Sv) [P10, W20], although thisis not observed over the full dose range (0–4 Sv). Similarfindings have not as yet been observed in the solid cancerincidence data [P12, T1], so caution is advised in interpre-tation of this finding. As shown in appendix D, in generalthere are only weak indications of curvature in the doseresponse for particular solid cancer sites in the latest cancerincidence data [P48], with the possible exception of bonecancer and non-melanoma skin cancer. Nevertheless, it isimportant to explore the implications of this curvature inthe low-dose response for solid cancer risk estimates. Forthis reason, models (14) and (16) were separately fitted tothe mortality data [P10], assuming both a purely lineardose–response relationship (with the quadratic coefficient,β, set to zero) and a linear–quadratic dose response.
559. For leukaemia in the low dose range (bone marrowdose less than 2 Sv), comparison of the linear–quadratic andpurely quadratic models suggests that the linear term doesnot statistically significantly improve the fit of the purequadratic model (p > 0.50), although the linear–quadraticmodel fits statistically significantly better than the purelylinear model (p = 0.003). This suggests that in this low doseregion, a purely quadratic dose response may best describethe leukaemia induction curve. For solid cancers, similarfindings have not as yet been observed in the incidence data[L29, P4], so caution is advised in interpretation of thisfinding. Nevertheless, it is important to explore the impli-cations of this curvature in the low-dose leukaemia responsefor cancer risk estimates. For this reason, models of theform of Eqs (17) and (18)—assuming both a purely quad-ratic dose response (with the linear coefficient, α, set tozero) and a linear–quadratic dose response—were separatelyfitted to the mortality data [P10].
560. As discussed in section I.D, measurement error cansubstantially alter the shape of the dose–response relation-ship and hence the derived population risk estimates [T17].The problem of dosimetric error for the RERF data has beeninvestigated by Jablon [J3], Gilbert [G17], and subsequentlyin a series of papers by Pierce et al. [P2, P11, P16] andLittle et al. [B18, L17, L29, L32, L33, L35, L37, L49].Because of the marked effect of adjusting for dosimetricerrors on the shape of the dose–response curve, all the analy-ses presented in this annex employ such dosimetric adjust-
ANNEX A: EPIDEMIOLOGICAL STUDIES OF RADIATION AND CANCER 127
UNSCEAR REPORT-PART 2.qxp 10/7/08 3:18 pm Page 127
128 UNSCEAR 2006 REPORT: VOLUME I
ments, using the regression calibration methodology devel-oped by Pierce et al. [P2, P11, P16] and Little et al. [L29,L32, L33, L35, L37, L49]. Jablon [J3] investigated the errorsin the dosimetry for the survivors of the atomic bombingsand found that the errors were most likely to be log-nor-mally distributed, with a geometric standard deviation (GSD)of about 30%. The analyses of this report employ the “cen-tral” estimate of 35% for GSD. This is the same central esti-mate as used by Pierce et al. [P2] and assumed by Little etal. [L29, L32, L33, L35, L37, L49]. Details on the methodsfor fitting the extended Weibull distribution to the LSS mortality data are given in appendix C.
3. Projection methods
561. In the UNSCEAR 2000 Report [U2], some use hasbeen made of generalized ERR models for solid cancerincorporating adjustment for attained age and sex, and alsosuch models with adjustment for age at exposure and sex.However, it is clear from the data on solid cancer incidence[L16, L21, T1], as also from the latest data on mortality[P10], that these models are not optimal. Detailed compar-ison of models with various sorts of adjustment (all com-binations of logarithmic adjustment for attained age, age atexposure, time since exposure, sex and city) in the latestfollow-up of the solid cancer mortality data [P10] suggestedthat, as indicated by the form of model (14) above, the opti-mal generalized ERR model was one with adjustment forsex, time since exposure and attained age. Among general-ized EAR models for solid cancer mortality with these sortsof adjustment (all combinations of logarithmic adjustmentfor attained age, age at exposure, time since exposure, sexand city), as indicated by the form of model (16) above,again the optimal model was one with adjustment for thetime since exposure and attained age. There was little tochoose between the fits of these two classes of model (gen-eralized ERR and generalized EAR). This annex thereforeuses both models to project cancer risk over time. For pur-poses of comparison with the risk models used previously[U2], the risks calculated using model (15), with adjustmentto the ERR for age at exposure and sex, are also presented.The mortality risks for these three models are presented intables 59–62. In table 72, summary risk values from table59 are presented together with various other recent estima-tions of population cancer mortality risks. Mortality risksestimated using Bayesian Markov Chain Monte Carlo(MCMC) methods are given in tables 63 and 64.
562. In previous UNSCEAR reports, a variety of meth-ods were used to project leukaemia risk over time, includ-ing a time-constant EAR model for the UNSCEAR 1988Report [U6] and the generalized EAR models developed byPreston et al. [P4] from the LSS incidence data for theUNSCEAR 1994 [U4] and 2000 [U2] Reports. As notedabove, the EAR for leukaemia is generally declining overtime, so projection of risk is not such an issue as for solidcancers. Detailed comparison of models with various sortsof adjustment (all combinations of logarithmic adjustment
for attained age, age at exposure, time since exposure, sexand city) in the latest follow-up of the leukaemia mortalitydata [P10] suggested that, as indicated by the form of model(17) above, the optimal generalized ERR model was onewith adjustment for attained age. Although the optimal gen-eralized ERR model is one with logarithmic adjustment forattained age, a model with adjustment for time since expo-sure and age at exposure fitted nearly as well. However,the risks predicted by these two models are close, so forsimplicity, the risk values presented here are only those cal-culated using the model with adjustment for attained age.Among generalized EAR models for leukaemia mortalitywith these sorts of adjustment (all combinations of loga-rithmic adjustment for attained age, age at exposure, timesince exposure, sex and city), the optimal model was onewith adjustment for sex and time since exposure, as indi-cated by the form of model (18) above. There was little tochoose between the fits of these two classes of model (gen-eralized ERR and generalized EAR). Therefore both modelshave been used to project cancer risk over time. Mortalityrisks for these two models are presented in tables 65–67.In table 72, summary risk values from table 65 are pre-sented together with various other recent estimations ofpopulation mortality risks due to leukaemia. Mortality risksestimated using Bayesian MCMC methods are given intables 68 and 69.
563. In the UNSCEAR 2000 Report [U2], similar modelswere employed for projection of the risk for solid cancerincidence as of the risk for solid cancer mortality. In par-ticular, generalized ERR models with adjustment for powersof attained age or powers of age at exposure were used inthe UNSCEAR 2000 Report [U2]. In the current report, ageneral framework for risk projection is used for the gener-alized ERR and EAR models expressed in Eqs (19) and (20).The details of the particular ERR and EAR models used foreach cancer site are given in tables 47–58. Appendix D givesmore details on the model fitting and the detailed justifica-tion of the form of each model (see particularly tablesD5–D16). Tables 70 and 71 present risk estimates for solidcancer incidence calculated using the generalized ERR andEAR models separately for each of the five populations con-sidered (China, Japan, Puerto Rico, the United States andthe United Kingdom). Table 73 presents summary riskvalues from table 70, together with various other recent esti-mations of population risks for solid cancer.
564. As detailed in appendix B, the four measures of pop-ulation risk relevant to mortality were estimated, namely:excess cancer deaths (ECD), risk of exposure-induced death(REID), years of life lost (YLL) per unit dose, and yearsof life lost per radiation-induced cancer death (YLLRIC).For cancer incidence, the measure of risk expressed asexposure-induced cancer incidence (REIC) is used. Personsare assumed capable of surviving in principle up to the ageof yT (121 years here), at which point they are assumed todie instantaneously (i.e. the population is truncated at thatage). It was assumed that there are no excess solid cancercases or deaths in the first 5 years after exposure, and no
UNSCEAR REPORT-PART 2.qxp 10/7/08 3:18 pm Page 128
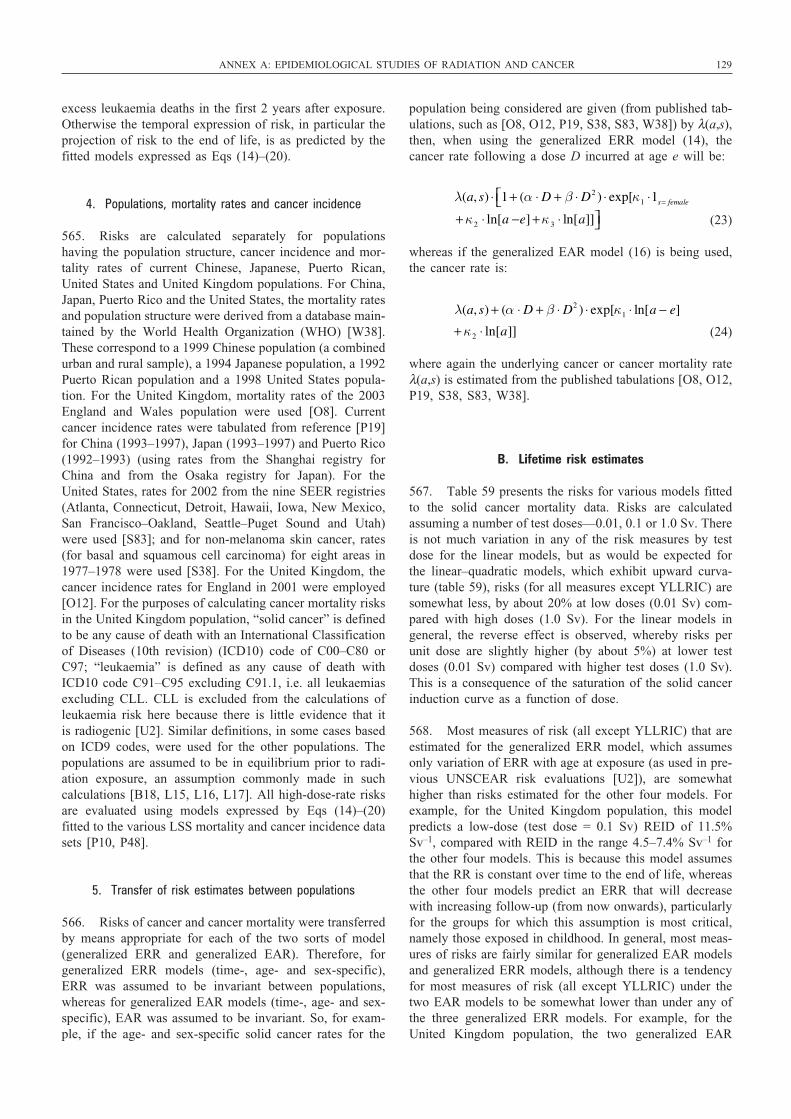
excess leukaemia deaths in the first 2 years after exposure.Otherwise the temporal expression of risk, in particular theprojection of risk to the end of life, is as predicted by thefitted models expressed as Eqs (14)–(20).
4. Populations, mortality rates and cancer incidence
565. Risks are calculated separately for populationshaving the population structure, cancer incidence and mor-tality rates of current Chinese, Japanese, Puerto Rican,United States and United Kingdom populations. For China,Japan, Puerto Rico and the United States, the mortality ratesand population structure were derived from a database main-tained by the World Health Organization (WHO) [W38].These correspond to a 1999 Chinese population (a combinedurban and rural sample), a 1994 Japanese population, a 1992Puerto Rican population and a 1998 United States popula-tion. For the United Kingdom, mortality rates of the 2003England and Wales population were used [O8]. Currentcancer incidence rates were tabulated from reference [P19]for China (1993–1997), Japan (1993–1997) and Puerto Rico(1992–1993) (using rates from the Shanghai registry forChina and from the Osaka registry for Japan). For theUnited States, rates for 2002 from the nine SEER registries(Atlanta, Connecticut, Detroit, Hawaii, Iowa, New Mexico,San Francisco–Oakland, Seattle–Puget Sound and Utah)were used [S83]; and for non-melanoma skin cancer, rates(for basal and squamous cell carcinoma) for eight areas in1977–1978 were used [S38]. For the United Kingdom, thecancer incidence rates for England in 2001 were employed[O12]. For the purposes of calculating cancer mortality risksin the United Kingdom population, “solid cancer” is definedto be any cause of death with an International Classificationof Diseases (10th revision) (ICD10) code of C00–C80 orC97; “leukaemia” is defined as any cause of death withICD10 code C91–C95 excluding C91.1, i.e. all leukaemiasexcluding CLL. CLL is excluded from the calculations ofleukaemia risk here because there is little evidence that itis radiogenic [U2]. Similar definitions, in some cases basedon ICD9 codes, were used for the other populations. Thepopulations are assumed to be in equilibrium prior to radi-ation exposure, an assumption commonly made in such calculations [B18, L15, L16, L17]. All high-dose-rate risksare evaluated using models expressed by Eqs (14)–(20)fitted to the various LSS mortality and cancer incidence datasets [P10, P48].
5. Transfer of risk estimates between populations
566. Risks of cancer and cancer mortality were transferredby means appropriate for each of the two sorts of model(generalized ERR and generalized EAR). Therefore, forgeneralized ERR models (time-, age- and sex-specific),ERR was assumed to be invariant between populations,whereas for generalized EAR models (time-, age- and sex-specific), EAR was assumed to be invariant. So, for exam-ple, if the age- and sex-specific solid cancer rates for the
population being considered are given (from published tab-ulations, such as [O8, O12, P19, S38, S83, W38]) by λ(a,s),then, when using the generalized ERR model (14), thecancer rate following a dose D incurred at age e will be:
(23)
whereas if the generalized EAR model (16) is being used,the cancer rate is:
(24)
where again the underlying cancer or cancer mortality rateλ(a,s) is estimated from the published tabulations [O8, O12,P19, S38, S83, W38].
B. Lifetime risk estimates
567. Table 59 presents the risks for various models fittedto the solid cancer mortality data. Risks are calculatedassuming a number of test doses—0.01, 0.1 or 1.0 Sv. Thereis not much variation in any of the risk measures by testdose for the linear models, but as would be expected forthe linear–quadratic models, which exhibit upward curva-ture (table 59), risks (for all measures except YLLRIC) aresomewhat less, by about 20% at low doses (0.01 Sv) com-pared with high doses (1.0 Sv). For the linear models ingeneral, the reverse effect is observed, whereby risks perunit dose are slightly higher (by about 5%) at lower testdoses (0.01 Sv) compared with higher test doses (1.0 Sv).This is a consequence of the saturation of the solid cancerinduction curve as a function of dose.
568. Most measures of risk (all except YLLRIC) that areestimated for the generalized ERR model, which assumesonly variation of ERR with age at exposure (as used in pre-vious UNSCEAR risk evaluations [U2]), are somewhathigher than risks estimated for the other four models. Forexample, for the United Kingdom population, this modelpredicts a low-dose (test dose = 0.1 Sv) REID of 11.5%Sv–1, compared with REID in the range 4.5–7.4% Sv–1 forthe other four models. This is because this model assumesthat the RR is constant over time to the end of life, whereasthe other four models predict an ERR that will decreasewith increasing follow-up (from now onwards), particularlyfor the groups for which this assumption is most critical,namely those exposed in childhood. In general, most meas-ures of risks are fairly similar for generalized EAR modelsand generalized ERR models, although there is a tendencyfor most measures of risk (all except YLLRIC) under thetwo EAR models to be somewhat lower than under any ofthe three generalized ERR models. For example, for theUnited Kingdom population, the two generalized EAR
λ(a, s) + (α ⋅ D + β ⋅ D2 ) ⋅ exp[κ1 ⋅ ln[a − e]
+κ2 ⋅ ln[a]]
λ(a, s) ⋅ 1+ (α ⋅ D + β ⋅ D2 ) ⋅ exp[κ1 ⋅1s= female
+κ2 ⋅ ln[a −e] +κ 3 ⋅ ln[a]]
⎡⎣⎤⎦
ANNEX A: EPIDEMIOLOGICAL STUDIES OF RADIATION AND CANCER 129
UNSCEAR REPORT-PART 2.qxp 10/7/08 3:18 pm Page 129
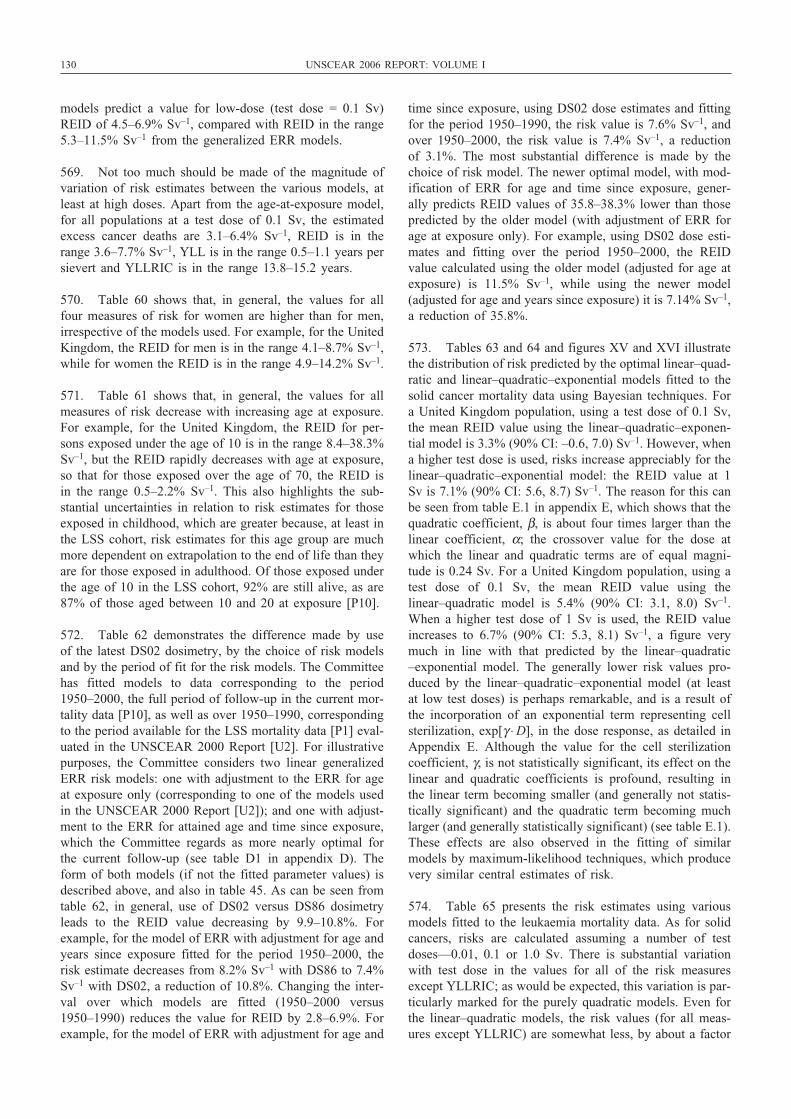
130 UNSCEAR 2006 REPORT: VOLUME I
models predict a value for low-dose (test dose = 0.1 Sv)REID of 4.5–6.9% Sv–1, compared with REID in the range5.3–11.5% Sv–1 from the generalized ERR models.
569. Not too much should be made of the magnitude ofvariation of risk estimates between the various models, atleast at high doses. Apart from the age-at-exposure model,for all populations at a test dose of 0.1 Sv, the estimatedexcess cancer deaths are 3.1–6.4% Sv–1, REID is in therange 3.6–7.7% Sv–1, YLL is in the range 0.5–1.1 years persievert and YLLRIC is in the range 13.8–15.2 years.
570. Table 60 shows that, in general, the values for allfour measures of risk for women are higher than for men,irrespective of the models used. For example, for the UnitedKingdom, the REID for men is in the range 4.1–8.7% Sv–1,while for women the REID is in the range 4.9–14.2% Sv–1.
571. Table 61 shows that, in general, the values for allmeasures of risk decrease with increasing age at exposure.For example, for the United Kingdom, the REID for per-sons exposed under the age of 10 is in the range 8.4–38.3%Sv–1, but the REID rapidly decreases with age at exposure,so that for those exposed over the age of 70, the REID isin the range 0.5–2.2% Sv–1. This also highlights the sub-stantial uncertainties in relation to risk estimates for thoseexposed in childhood, which are greater because, at least inthe LSS cohort, risk estimates for this age group are muchmore dependent on extrapolation to the end of life than theyare for those exposed in adulthood. Of those exposed underthe age of 10 in the LSS cohort, 92% are still alive, as are87% of those aged between 10 and 20 at exposure [P10].
572. Table 62 demonstrates the difference made by useof the latest DS02 dosimetry, by the choice of risk modelsand by the period of fit for the risk models. The Committeehas fitted models to data corresponding to the period1950–2000, the full period of follow-up in the current mor-tality data [P10], as well as over 1950–1990, correspondingto the period available for the LSS mortality data [P1] eval-uated in the UNSCEAR 2000 Report [U2]. For illustrativepurposes, the Committee considers two linear generalizedERR risk models: one with adjustment to the ERR for ageat exposure only (corresponding to one of the models usedin the UNSCEAR 2000 Report [U2]); and one with adjust-ment to the ERR for attained age and time since exposure,which the Committee regards as more nearly optimal forthe current follow-up (see table D1 in appendix D). Theform of both models (if not the fitted parameter values) isdescribed above, and also in table 45. As can be seen fromtable 62, in general, use of DS02 versus DS86 dosimetryleads to the REID value decreasing by 9.9–10.8%. Forexample, for the model of ERR with adjustment for age andyears since exposure fitted for the period 1950–2000, therisk estimate decreases from 8.2% Sv–1 with DS86 to 7.4%Sv–1 with DS02, a reduction of 10.8%. Changing the inter-val over which models are fitted (1950–2000 versus1950–1990) reduces the value for REID by 2.8–6.9%. Forexample, for the model of ERR with adjustment for age and
time since exposure, using DS02 dose estimates and fittingfor the period 1950–1990, the risk value is 7.6% Sv–1, andover 1950–2000, the risk value is 7.4% Sv–1, a reductionof 3.1%. The most substantial difference is made by thechoice of risk model. The newer optimal model, with mod-ification of ERR for age and time since exposure, gener-ally predicts REID values of 35.8–38.3% lower than thosepredicted by the older model (with adjustment of ERR forage at exposure only). For example, using DS02 dose esti-mates and fitting over the period 1950–2000, the REIDvalue calculated using the older model (adjusted for age atexposure) is 11.5% Sv–1, while using the newer model(adjusted for age and years since exposure) it is 7.14% Sv–1,a reduction of 35.8%.
573. Tables 63 and 64 and figures XV and XVI illustratethe distribution of risk predicted by the optimal linear–quad-ratic and linear–quadratic–exponential models fitted to thesolid cancer mortality data using Bayesian techniques. Fora United Kingdom population, using a test dose of 0.1 Sv,the mean REID value using the linear–quadratic–exponen-tial model is 3.3% (90% CI: –0.6, 7.0) Sv–1. However, whena higher test dose is used, risks increase appreciably for thelinear–quadratic–exponential model: the REID value at 1Sv is 7.1% (90% CI: 5.6, 8.7) Sv–1. The reason for this canbe seen from table E.1 in appendix E, which shows that thequadratic coefficient, β, is about four times larger than thelinear coefficient, α; the crossover value for the dose atwhich the linear and quadratic terms are of equal magni-tude is 0.24 Sv. For a United Kingdom population, using atest dose of 0.1 Sv, the mean REID value using thelinear–quadratic model is 5.4% (90% CI: 3.1, 8.0) Sv–1.When a higher test dose of 1 Sv is used, the REID valueincreases to 6.7% (90% CI: 5.3, 8.1) Sv–1, a figure verymuch in line with that predicted by the linear–quadratic–exponential model. The generally lower risk values pro-duced by the linear–quadratic–exponential model (at leastat low test doses) is perhaps remarkable, and is a result ofthe incorporation of an exponential term representing cellsterilization, exp[γ ⋅ D], in the dose response, as detailed inAppendix E. Although the value for the cell sterilizationcoefficient, γ, is not statistically significant, its effect on thelinear and quadratic coefficients is profound, resulting inthe linear term becoming smaller (and generally not statis-tically significant) and the quadratic term becoming muchlarger (and generally statistically significant) (see table E.1).These effects are also observed in the fitting of similarmodels by maximum-likelihood techniques, which producevery similar central estimates of risk.
574. Table 65 presents the risk estimates using variousmodels fitted to the leukaemia mortality data. As for solidcancers, risks are calculated assuming a number of testdoses—0.01, 0.1 or 1.0 Sv. There is substantial variationwith test dose in the values for all of the risk measuresexcept YLLRIC; as would be expected, this variation is par-ticularly marked for the purely quadratic models. Even forthe linear–quadratic models, the risk values (for all meas-ures except YLLRIC) are somewhat less, by about a factor
UNSCEAR REPORT-PART 2.qxp 10/7/08 3:18 pm Page 130
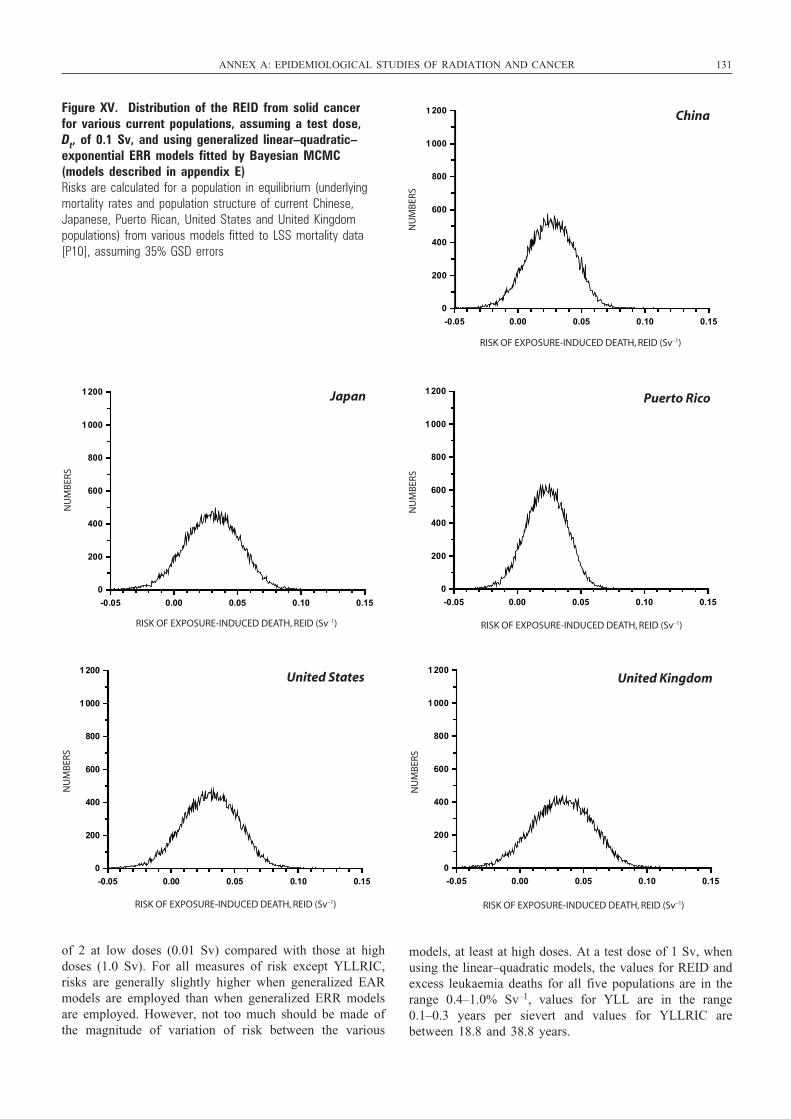
ANNEX A: EPIDEMIOLOGICAL STUDIES OF RADIATION AND CANCER 131
RISK OF EXPOSURE-INDUCED DEATH, REID (Sv–1)
NU
MB
ERS
China
-0.05 0.00 0.05 0.10 0.15
0
200
400
600
800
1000
1 200
RISK OF EXPOSURE-INDUCED DEATH, REID (Sv–1)
NU
MB
ERS
Japan
-0.05 0.00 0.05 0.10 0.15
0
200
400
600
800
1000
1200
RISK OF EXPOSURE-INDUCED DEATH, REID (Sv–1)
NU
MB
ERSPuerto Rico
-0.05 0.00 0.05 0.10 0.15
0
200
400
600
800
1 000
1 200
RISK OF EXPOSURE-INDUCED DEATH, REID (Sv–1)
NU
MB
ERS
United States
-0.05 0.00 0.05 0.10 0.15
0
200
400
600
800
1000
1200
RISK OF EXPOSURE-INDUCED DEATH, REID (Sv–1)
NU
MB
ERS
United Kingdom
-0.05 0.00 0.05 0.10 0.15
0
200
400
600
800
1000
1200
Figure XV. Distribution of the REID from solid cancer for various current populations, assuming a test dose, Dt, of 0.1 Sv, and using generalized linear–quadratic–exponential ERR models fitted by Bayesian MCMC(models described in appendix E) Risks are calculated for a population in equilibrium (underlyingmortality rates and population structure of current Chinese,Japanese, Puerto Rican, United States and United Kingdom populations) from various models fitted to LSS mortality data[P10], assuming 35% GSD errors
of 2 at low doses (0.01 Sv) compared with those at highdoses (1.0 Sv). For all measures of risk except YLLRIC,risks are generally slightly higher when generalized EARmodels are employed than when generalized ERR modelsare employed. However, not too much should be made ofthe magnitude of variation of risk between the various
models, at least at high doses. At a test dose of 1 Sv, whenusing the linear–quadratic models, the values for REID andexcess leukaemia deaths for all five populations are in therange 0.4–1.0% Sv–1, values for YLL are in the range0.1–0.3 years per sievert and values for YLLRIC arebetween 18.8 and 38.8 years.
UNSCEAR REPORT-PART 2.qxp 10/7/08 3:18 pm Page 131
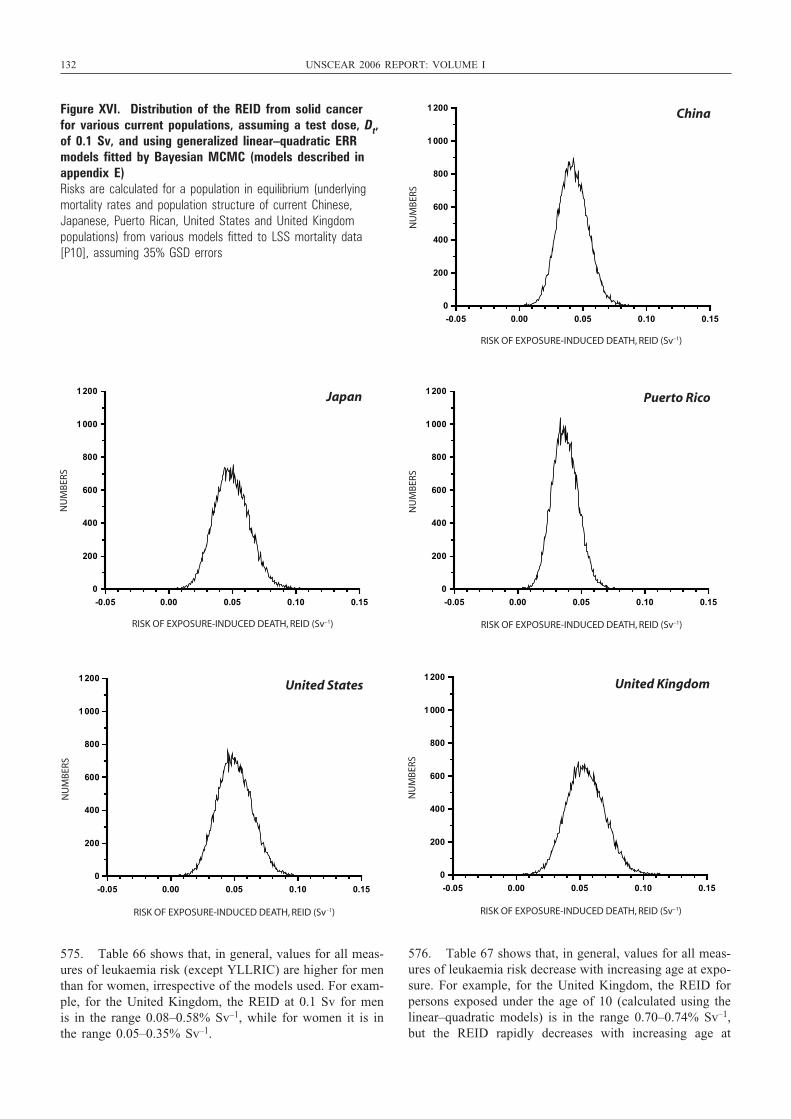
132 UNSCEAR 2006 REPORT: VOLUME I
575. Table 66 shows that, in general, values for all meas-ures of leukaemia risk (except YLLRIC) are higher for menthan for women, irrespective of the models used. For exam-ple, for the United Kingdom, the REID at 0.1 Sv for menis in the range 0.08–0.58% Sv–1, while for women it is inthe range 0.05–0.35% Sv–1.
576. Table 67 shows that, in general, values for all meas-ures of leukaemia risk decrease with increasing age at expo-sure. For example, for the United Kingdom, the REID forpersons exposed under the age of 10 (calculated using thelinear–quadratic models) is in the range 0.70–0.74% Sv–1,but the REID rapidly decreases with increasing age at
RISK OF EXPOSURE-INDUCED DEATH, REID (Sv–1)
NU
MB
ERS
China
-0.05 0.00 0.05 0.10 0.15
0
200
400
600
800
1000
1200
RISK OF EXPOSURE-INDUCED DEATH, REID (Sv–1)
NU
MB
ERS
Japan
-0.05 0.00 0.05 0.10 0.15
0
200
400
600
800
1000
1200
RISK OF EXPOSURE-INDUCED DEATH, REID (Sv–1)
NU
MB
ERSPuerto Rico
-0.05 0.00 0.05 0.10 0.15
0
200
400
600
800
1000
1200
RISK OF EXPOSURE-INDUCED DEATH, REID (Sv–1)
NU
MB
ERS
United States
-0.05 0.00 0.05 0.10 0.15
0
200
400
600
800
1000
1200
RISK OF EXPOSURE-INDUCED DEATH, REID (Sv–1)
NU
MB
ERS
United Kingdom
-0.05 0.00 0.05 0.10 0.15
0
200
400
600
800
1000
1200
Figure XVI. Distribution of the REID from solid cancer for various current populations, assuming a test dose, Dt,of 0.1 Sv, and using generalized linear–quadratic ERRmodels fitted by Bayesian MCMC (models described inappendix E) Risks are calculated for a population in equilibrium (underlyingmortality rates and population structure of current Chinese,Japanese, Puerto Rican, United States and United Kingdom populations) from various models fitted to LSS mortality data[P10], assuming 35% GSD errors
UNSCEAR REPORT-PART 2.qxp 10/7/08 3:18 pm Page 132
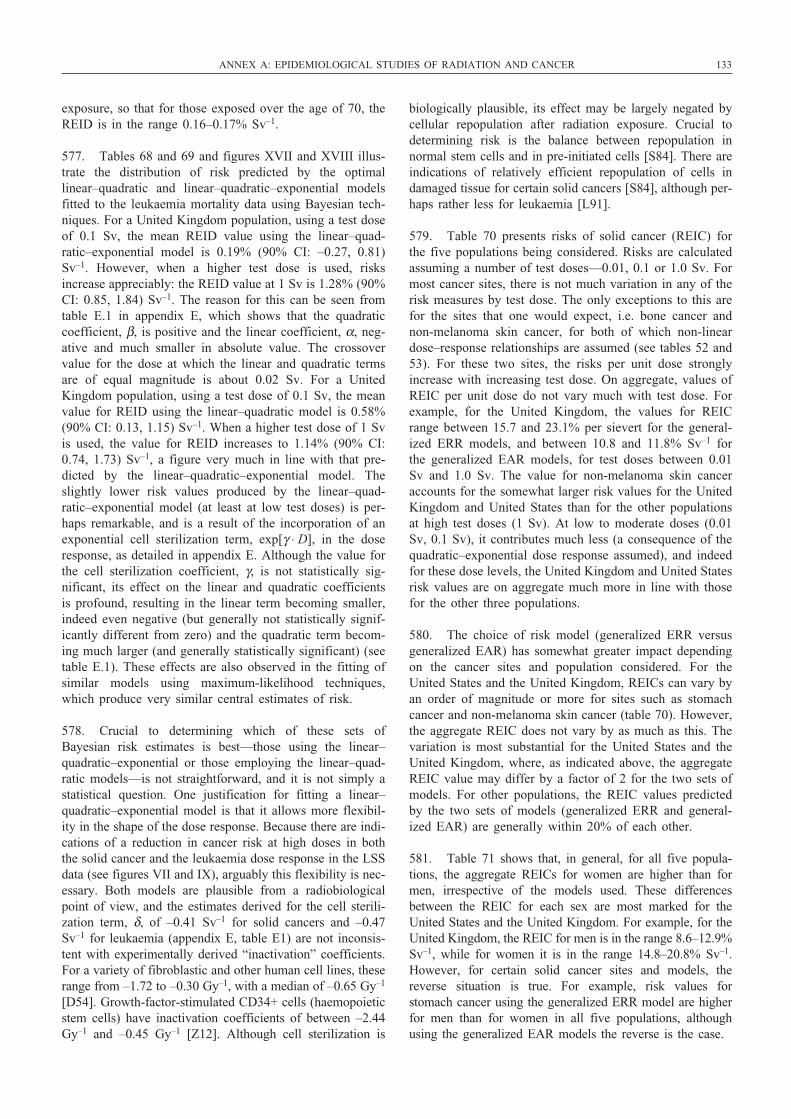
exposure, so that for those exposed over the age of 70, theREID is in the range 0.16–0.17% Sv–1.
577. Tables 68 and 69 and figures XVII and XVIII illus-trate the distribution of risk predicted by the optimallinear–quadratic and linear–quadratic–exponential modelsfitted to the leukaemia mortality data using Bayesian tech-niques. For a United Kingdom population, using a test doseof 0.1 Sv, the mean REID value using the linear–quad-ratic–exponential model is 0.19% (90% CI: –0.27, 0.81)Sv–1. However, when a higher test dose is used, risksincrease appreciably: the REID value at 1 Sv is 1.28% (90%CI: 0.85, 1.84) Sv–1. The reason for this can be seen fromtable E.1 in appendix E, which shows that the quadraticcoefficient, β, is positive and the linear coefficient, α, neg-ative and much smaller in absolute value. The crossovervalue for the dose at which the linear and quadratic termsare of equal magnitude is about 0.02 Sv. For a UnitedKingdom population, using a test dose of 0.1 Sv, the meanvalue for REID using the linear–quadratic model is 0.58%(90% CI: 0.13, 1.15) Sv–1. When a higher test dose of 1 Svis used, the value for REID increases to 1.14% (90% CI:0.74, 1.73) Sv–1, a figure very much in line with that pre-dicted by the linear–quadratic–exponential model. Theslightly lower risk values produced by the linear–quad-ratic–exponential model (at least at low test doses) is per-haps remarkable, and is a result of the incorporation of anexponential cell sterilization term, exp[γ ⋅ D], in the doseresponse, as detailed in appendix E. Although the value forthe cell sterilization coefficient, γ, is not statistically sig-nificant, its effect on the linear and quadratic coefficientsis profound, resulting in the linear term becoming smaller,indeed even negative (but generally not statistically signif-icantly different from zero) and the quadratic term becom-ing much larger (and generally statistically significant) (seetable E.1). These effects are also observed in the fitting ofsimilar models using maximum-likelihood techniques,which produce very similar central estimates of risk.
578. Crucial to determining which of these sets ofBayesian risk estimates is best—those using the linear–quadratic–exponential or those employing the linear–quad-ratic models—is not straightforward, and it is not simply astatistical question. One justification for fitting a linear–quadratic–exponential model is that it allows more flexibil-ity in the shape of the dose response. Because there are indi-cations of a reduction in cancer risk at high doses in boththe solid cancer and the leukaemia dose response in the LSSdata (see figures VII and IX), arguably this flexibility is nec-essary. Both models are plausible from a radiobiologicalpoint of view, and the estimates derived for the cell sterili-zation term, δ, of –0.41 Sv–1 for solid cancers and –0.47Sv–1 for leukaemia (appendix E, table E1) are not inconsis-tent with experimentally derived “inactivation” coefficients.For a variety of fibroblastic and other human cell lines, theserange from –1.72 to –0.30 Gy–1, with a median of –0.65 Gy–1
[D54]. Growth-factor-stimulated CD34+ cells (haemopoieticstem cells) have inactivation coefficients of between –2.44Gy–1 and –0.45 Gy–1 [Z12]. Although cell sterilization is
biologically plausible, its effect may be largely negated bycellular repopulation after radiation exposure. Crucial todetermining risk is the balance between repopulation innormal stem cells and in pre-initiated cells [S84]. There areindications of relatively efficient repopulation of cells indamaged tissue for certain solid cancers [S84], although per-haps rather less for leukaemia [L91].
579. Table 70 presents risks of solid cancer (REIC) forthe five populations being considered. Risks are calculatedassuming a number of test doses—0.01, 0.1 or 1.0 Sv. Formost cancer sites, there is not much variation in any of therisk measures by test dose. The only exceptions to this arefor the sites that one would expect, i.e. bone cancer andnon-melanoma skin cancer, for both of which non-lineardose–response relationships are assumed (see tables 52 and53). For these two sites, the risks per unit dose stronglyincrease with increasing test dose. On aggregate, values ofREIC per unit dose do not vary much with test dose. Forexample, for the United Kingdom, the values for REICrange between 15.7 and 23.1% per sievert for the general-ized ERR models, and between 10.8 and 11.8% Sv–1 forthe generalized EAR models, for test doses between 0.01Sv and 1.0 Sv. The value for non-melanoma skin canceraccounts for the somewhat larger risk values for the UnitedKingdom and United States than for the other populationsat high test doses (1 Sv). At low to moderate doses (0.01Sv, 0.1 Sv), it contributes much less (a consequence of thequadratic–exponential dose response assumed), and indeedfor these dose levels, the United Kingdom and United Statesrisk values are on aggregate much more in line with thosefor the other three populations.
580. The choice of risk model (generalized ERR versusgeneralized EAR) has somewhat greater impact dependingon the cancer sites and population considered. For theUnited States and the United Kingdom, REICs can vary byan order of magnitude or more for sites such as stomachcancer and non-melanoma skin cancer (table 70). However,the aggregate REIC does not vary by as much as this. Thevariation is most substantial for the United States and theUnited Kingdom, where, as indicated above, the aggregateREIC value may differ by a factor of 2 for the two sets ofmodels. For other populations, the REIC values predictedby the two sets of models (generalized ERR and general-ized EAR) are generally within 20% of each other.
581. Table 71 shows that, in general, for all five popula-tions, the aggregate REICs for women are higher than formen, irrespective of the models used. These differencesbetween the REIC for each sex are most marked for theUnited States and the United Kingdom. For example, for theUnited Kingdom, the REIC for men is in the range 8.6–12.9%Sv–1, while for women it is in the range 14.8–20.8% Sv–1.However, for certain solid cancer sites and models, thereverse situation is true. For example, risk values for stomach cancer using the generalized ERR model are higherfor men than for women in all five populations, althoughusing the generalized EAR models the reverse is the case.
ANNEX A: EPIDEMIOLOGICAL STUDIES OF RADIATION AND CANCER 133
UNSCEAR REPORT-PART 2.qxp 10/7/08 3:18 pm Page 133
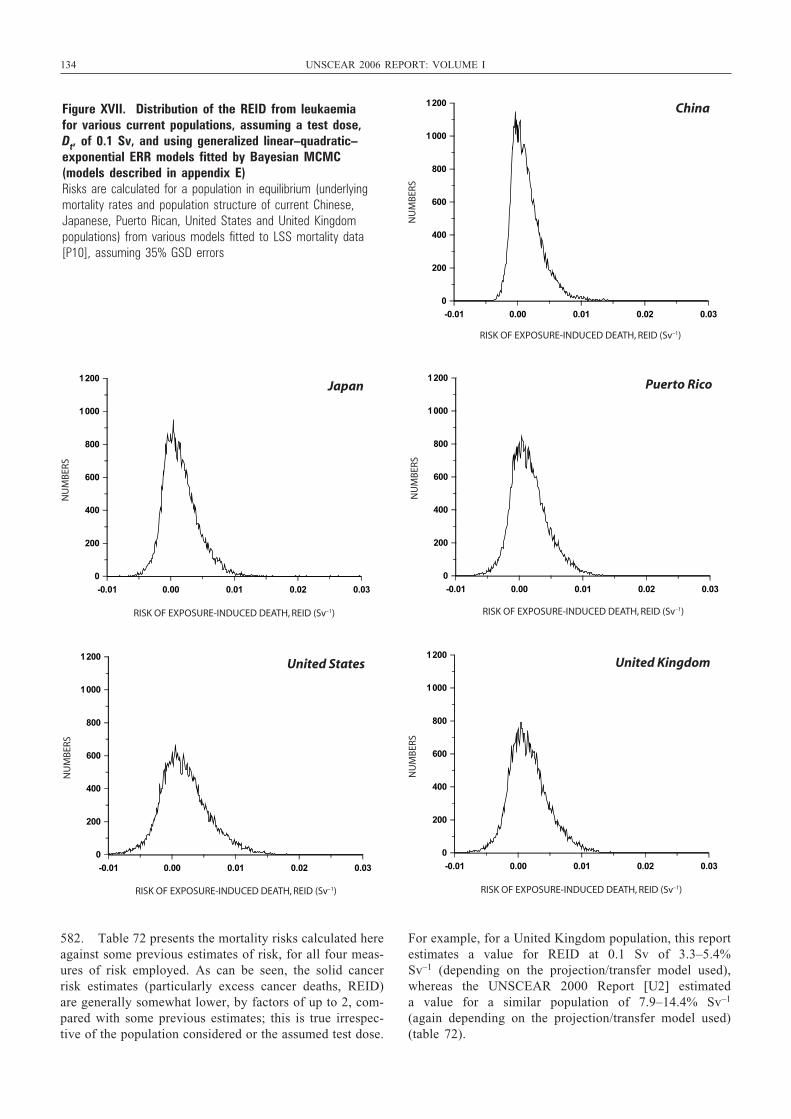
134 UNSCEAR 2006 REPORT: VOLUME I
582. Table 72 presents the mortality risks calculated hereagainst some previous estimates of risk, for all four meas-ures of risk employed. As can be seen, the solid cancerrisk estimates (particularly excess cancer deaths, REID)are generally somewhat lower, by factors of up to 2, com-pared with some previous estimates; this is true irrespec-tive of the population considered or the assumed test dose.
For example, for a United Kingdom population, this reportestimates a value for REID at 0.1 Sv of 3.3–5.4% Sv–1 (depending on the projection/transfer model used),whereas the UNSCEAR 2000 Report [U2] estimated a value for a similar population of 7.9–14.4% Sv–1
(again depending on the projection/transfer model used)(table 72).
RISK OF EXPOSURE-INDUCED DEATH, REID (Sv–1)
NU
MB
ERS
China
-0.01 0.00 0.01 0.02 0.03
0
200
400
600
800
1000
1200
RISK OF EXPOSURE-INDUCED DEATH, REID (Sv–1)
NU
MB
ERS
Japan
-0.01 0.00 0.01 0.02 0.03
0
200
400
600
800
1000
1200
RISK OF EXPOSURE-INDUCED DEATH, REID (Sv–1)
NU
MB
ERS
Puerto Rico
-0.01 0.00 0.01 0.02 0.03
0
200
400
600
800
1000
1200
RISK OF EXPOSURE-INDUCED DEATH, REID (Sv–1)
NU
MB
ERS
United States
-0.01 0.00 0.01 0.02 0.03
0
200
400
600
800
1000
1200
RISK OF EXPOSURE-INDUCED DEATH, REID (Sv–1)
NU
MB
ERS
United Kingdom
-0.01 0.00 0.01 0.02 0.03
0
200
400
600
800
1000
1200
Figure XVII. Distribution of the REID from leukaemia for various current populations, assuming a test dose, Dt, of 0.1 Sv, and using generalized linear–quadratic–exponential ERR models fitted by Bayesian MCMC(models described in appendix E) Risks are calculated for a population in equilibrium (underlyingmortality rates and population structure of current Chinese,Japanese, Puerto Rican, United States and United Kingdom populations) from various models fitted to LSS mortality data[P10], assuming 35% GSD errors
UNSCEAR REPORT-PART 2.qxp 10/7/08 3:18 pm Page 134
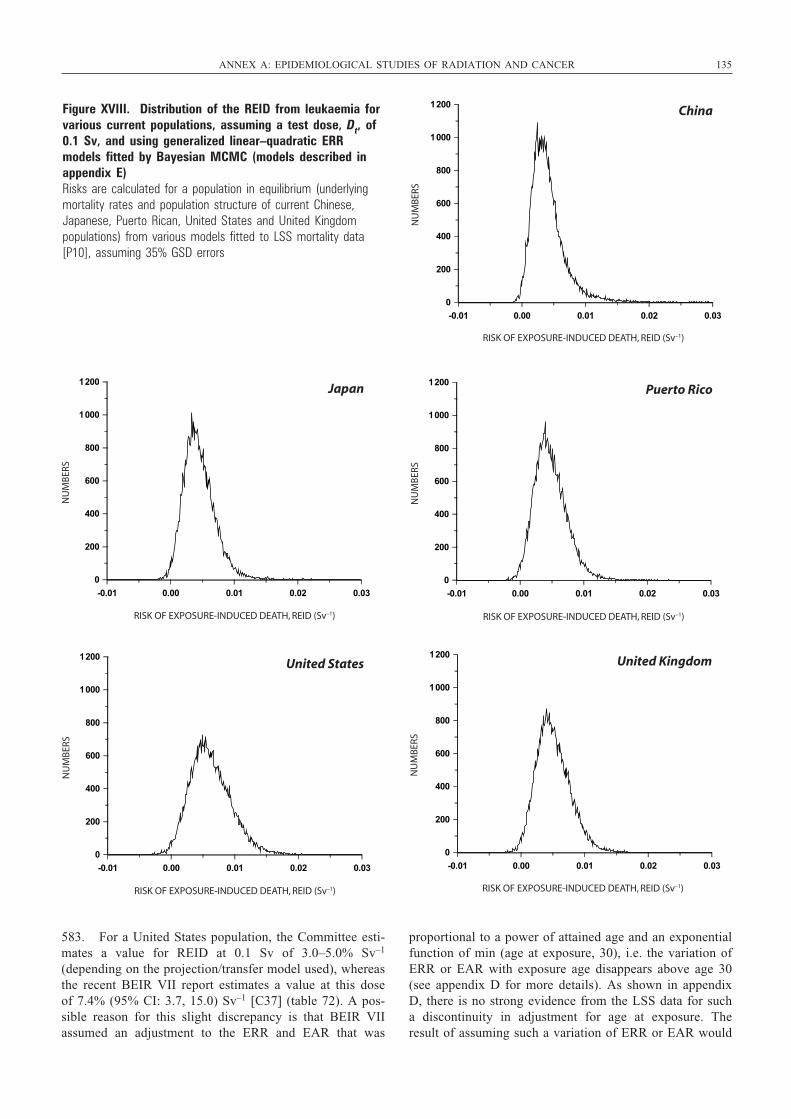
583. For a United States population, the Committee esti-mates a value for REID at 0.1 Sv of 3.0–5.0% Sv–1
(depending on the projection/transfer model used), whereasthe recent BEIR VII report estimates a value at this doseof 7.4% (95% CI: 3.7, 15.0) Sv–1 [C37] (table 72). A pos-sible reason for this slight discrepancy is that BEIR VIIassumed an adjustment to the ERR and EAR that was
proportional to a power of attained age and an exponentialfunction of min (age at exposure, 30), i.e. the variation ofERR or EAR with exposure age disappears above age 30(see appendix D for more details). As shown in appendixD, there is no strong evidence from the LSS data for sucha discontinuity in adjustment for age at exposure. Theresult of assuming such a variation of ERR or EAR would
ANNEX A: EPIDEMIOLOGICAL STUDIES OF RADIATION AND CANCER 135
RISK OF EXPOSURE-INDUCED DEATH, REID (Sv–1)
NU
MB
ERS
China
-0.01 0.00 0.01 0.02 0.03
0
200
400
600
800
1000
1200
RISK OF EXPOSURE-INDUCED DEATH, REID (Sv–1)
NU
MB
ERS
Japan
-0.01 0.00 0.01 0.02 0.03
0
200
400
600
800
1000
1200
RISK OF EXPOSURE-INDUCED DEATH, REID (Sv–1)
NU
MB
ERS
Puerto Rico
-0.01 0.00 0.01 0.02 0.03
0
200
400
600
800
1000
1200
RISK OF EXPOSURE-INDUCED DEATH, REID (Sv–1)
NU
MB
ERS
United States
-0.01 0.00 0.01 0.02 0.03
0
200
400
600
800
1000
1200
RISK OF EXPOSURE-INDUCED DEATH, REID (Sv–1)
NU
MB
ERS
United Kingdom
-0.01 0.00 0.01 0.02 0.03
0
200
400
600
800
1000
1200
Figure XVIII. Distribution of the REID from leukaemia forvarious current populations, assuming a test dose, Dt, of0.1 Sv, and using generalized linear–quadratic ERRmodels fitted by Bayesian MCMC (models described inappendix E)Risks are calculated for a population in equilibrium (underlyingmortality rates and population structure of current Chinese,Japanese, Puerto Rican, United States and United Kingdom populations) from various models fitted to LSS mortality data[P10], assuming 35% GSD errors
UNSCEAR REPORT-PART 2.qxp 10/7/08 3:18 pm Page 135
136 UNSCEAR 2006 REPORT: VOLUME I
be to inflate risks for those exposed above this age.However, one should not overemphasize this discrepancyin view of the other uncertainties, as implied by the uncer-tainty interval for the BEIR estimate, as well as by theuncertainty interval for the Bayesian risk calculations per-formed here.
584. Leukaemia risk estimates are more similar, althougheven in this case the risks estimated here tend to be smallerthan previous estimates, by 20–30% (but in some cases bymuch more than this). For example, for a United Kingdompopulation, this report estimates a value for REID at 1.0 Svof 0.8–0.9% Sv–1 (depending on the projection/transfermodel used), whereas the UNSCEAR 2000 Report esti-mated a value for a similar population and dose of 1.0%Sv–1 (table 72). For a United States population, this reportestimates a value for REID at 0.1 Sv of 0.2–0.7% Sv–1,whereas the recent BEIR VII report estimates a value at thisdose of 0.6 % Sv–1 [C37] (table 72).
585. Table 73 presents the risks of solid cancer (REIC)calculated here against some previous estimates of risk. Ascan be seen, aggregate values for solid cancer REIC aregenerally similar to those previously estimated, althoughthere is a substantial spread in the risk estimates, depend-ing on the projection/transfer model used. For example, fora United Kingdom population, this report estimates anaggregate value for REIC at 1.0 Sv of 10.8–23.1% Sv–1
(depending on the projection/transfer model used), whereasthe UNSCEAR 2000 Report estimated an aggregate valueof 17.0–19.3% Sv–1 (again depending on the projection/transfer model used). For a United States population, thisreport estimates an aggregate value for REIC at 0.1 Sv of11.6–24.1% Sv–1 (depending on the projection/transfermodel used), whereas the recent BEIR VII report estimates
a value at this dose of 16.9–18.6% Sv–1 (depending on theprojection/transfer model used) [C37] (tables 70 and 73). Itmay be thought remarkable that risks of solid cancer arenot vastly dissimilar from those assessed in the UNSCEAR2000 Report [U2], in contrast to the much lower mortalityrisks compared with those previously derived. However, asshown by the analysis of table 62, a major part of the reduc-tion in the risk estimates for solid cancer mortality is drivenby the use of different optimal risk models, with a muchsmaller part of the reduction due to alterations in the inter-val for follow-up and to changes in dosimetry. Models forsolid cancer incidence are generally of a different form frommodels for solid cancer mortality, and much more hetero-geneous, as can be seen from tables 45 and 47–58, so it isnot unexpected that they should produce changes in riskvalues of the same magnitude.
586. The risk estimates derived here using linear modelsare nominally exposure risks for high dose rates, and takeno account of possible effects due to dose rate or fraction-ation. As discussed in section I.J (see also table 8), a DDREFof about 2 may be applied to obtain cancer risks at low doses and low dose rates. However, those models in whicha linear–quadratic or more general (linear–quadratic–exponential) dose response is assumed (in particular theBayesian MCMC model fits) implicitly take account ofextrapolation of dose (if not dose rate), so that to someextent they take account of DDREF. As can be seen fromtables 59, 63 and 64, these models predict solid cancer mor-tality risks (REID) per unit dose at high dose (1 Sv) thatare between 20% and 185% larger than those at low doses(0.01 Sv). Likewise it is seen from tables 65, 68 and 69that the leukaemia mortality risks (REID) per unit dose athigh dose (1 Sv) are at least 100% larger than those at lowdoses (0.01 Sv).
UNSCEAR REPORT-PART 2.qxp 10/7/08 3:18 pm Page 136
CONCLUSIONS
587. Since the Committee’s assessment of the risks ofradiation-induced cancer in the UNSCEAR 2000 Report[U2], more information has become available from epi-demiological studies of radiation-exposed groups. Therehave been substantive updates to the follow-up of the sur-vivors of the atomic bombings at Hiroshima and Nagasaki,both for solid cancer morbidity [P48] and for all cancermortality [P10]; both of these reports incorporate therecently revised (DS02) dose estimates [R12]. The latestmortality analysis [P10] extended follow-up of the LSScohort another 10 years, to the end of 2000, from the 1990follow-up available in the previous report [P1]. As ofDecember 2000, 45% of the cohort of 86,611 survivors werestill alive. Out of the 10,127 deaths due to solid cancer,some 479 would be estimated to be associated with the radi-ation exposure incurred from either bomb detonation; andsome 93 leukaemia deaths out of 296 would be estimatedto be associated with radiation exposure [P10]. Analyses ofthe RERF epidemiological data using the new DS02dosimetry indicate that values for cancer risk factors mightdecrease by about 8% as a result, with no appreciablechange in the shape of the dose response or in the age–timepatterns of excess risk [P10]. The reanalysis of the solidcancer incidence data using the DS02 dosimetry [P48]extends the follow-up to 1998 from 1994 (the year to whichdata had previously been followed up [P12]), resulting in atotal of 18,645 cases of cancer, 13,454 of these within 10km of either hypocentre at the time of the bombings andwith a DS02 dose estimate. It is sometimes forgotten that,despite the high doses received by some survivors (in excessof 4 Sv), this is fundamentally a moderate dose cohort, forwhich the average colon dose is about 0.21 Sv.
588. Both these studies and further follow-up of patientswho were medically exposed to radiation have providedadditional data on cancer risks at long times after irradia-tion, particularly for those exposed at young ages. However,there are still uncertainties in the projection of risks fromthe current follow-up periods until the end of life, giventhat most of the people who were irradiated at young agesare still alive. For example, 92% of those exposed underthe age of 10 in the LSS are still alive, as are 87% of thoseaged between 10 and 20 at exposure [P10].
589. The increased statistical precision associated with thelonger follow-up and the resulting larger number of cancercases observed in the above studies have also been usefulin the examination of dose–response relationships, particu-larly at lower doses. For example, the most recent data forthe survivors of the atomic bombings are largely consistent
with linear or linear–quadratic dose trends over a wide rangeof doses. However, analyses restricted solely to low dosesare complicated by: the limitations of statistical precision;the potential for misleading findings owing to any small,undetected biases; and the effects of performing multipletests of statistical significance when attempting to establisha minimum dose at which elevated risks can be detected.Longer follow-up of large groups such as the survivors ofthe atomic bombings should hopefully provide more infor-mation at low doses. However, epidemiology alone will notbe able to resolve the issue of whether there are dose thresh-olds for risk. In particular, the inability to detect increasedrisk at very low doses using epidemiological methods doesnot mean that the underlying cancer risks are not elevated.However, the high-dose radiotherapy studies of patientsindicate that, for some cancers, e.g. bone, connective tissue,rectum, uterus and small intestine, any risks at doses ofbelow several grays, if they exist, are small.
590. New findings have also been published from analy-ses of fractionated or chronic low-dose exposure to low-LET radiation, in particular the IARC 15-country nuclearworker study [C41] (although the statistical precision ofthese studies is low in comparison with the results from thesurvivors of the atomic bombings, exposed at high doserates). There have also been major new analyses of theTecha River [K49, K50] and Semipalatinsk [B58] data sets.As noted in section II.E, there are concerns about bias inall three studies, which may explain why solid cancer risksare substantially elevated in comparison with those seen inthe LSS cohort, although at least for the 15-country andTecha River studies, the confidence intervals for the riskestimates are wide [C41, K50] and overlap with findingsfrom the studies of the survivors of the atomic bombings.However, these studies are potentially informative aboutrisks following chronic exposure to moderate doses, oncethe various problems can be resolved. Further work toimprove dosimetry and follow-up in all three cohorts wouldimprove the interpretation of the studies’ findings.
591. Particular attention has been paid in this report to risksfor specific cancer sites. Again, the information that hasbecome available in recent years has helped in the examina-tion of risks. Risks have been assessed for cancer of the sali-vary gland, oesophagus, stomach, small intestine (includingduodenum), colon, rectum, liver, pancreas, lung, bone andconnective tissue, female breast, uterus, ovary, prostate, uri-nary bladder, kidney, brain and central nervous system, andthyroid, as well as for cutaneous melanoma, non-melanomaskin cancer, non-Hodgkin’s lymphoma, Hodgkin’s disease,
137
UNSCEAR REPORT-PART 2.qxp 10/7/08 3:18 pm Page 137
138 UNSCEAR 2006 REPORT: VOLUME I
multiple myeloma and leukaemia. Of these, cancers of thesalivary gland, small intestine, rectum, pancreas, uterus, ovaryand kidney, as well as cutaneous melanoma, were not con-sidered in the UNSCEAR 2000 Report [U2]. There are stillproblems in characterizing risks for some cancer sites, owingto the low statistical precision associated with relatively smallnumbers of estimated excess cases. This can limit, for exam-ple, the ability to estimate trends in risk in relation to factorssuch as age at exposure, time since exposure and sex.Furthermore, data are sometimes lacking or have not beenpublished in a format that is detailed enough to allow anassessment of how risks vary between populations. An excep-tion is breast cancer, where a comparison of data on the sur-vivors of the atomic bombings and on women with medicalexposures in North America indicates an absolute transfer ofrisks between populations. For some other sites, such as thestomach, there are indications that a multiplicative transferbetween populations would be appropriate, although the evi-dence is generally not strong. There are some cancer sites forwhich there is little evidence for an association with radia-tion (e.g. chronic lymphocytic leukaemia, pancreatic cancer,prostate cancer, cervical cancer, testicular cancer, uterinecancer, non-Hodgkin’s lymphoma, Hodgkin’s disease andmultiple myeloma), and others where excess risks have onlybeen seen following very high (radiotherapeutic) doses (e.g.cancers of the small intestine, rectum, uterus and kidney).While the risk evaluations for lymphomas are affected by thesmall numbers of cases in several studies, these results shouldbe contrasted with the clear relation found in many popula-tions between radiation and the risk of leukaemia (excludingCLL), which is also a rare disease. Despite the statisticalproblems posed by considering particular cancer sites, thereare indications of differences in the shape of dose response;in particular, the more substantial upward curvature in thedose response for bone cancer, non-melanoma skin cancerand leukaemia should be noted.
592. The results presented in tables 59–73 illustrate thesensitivity of the lifetime risk estimates to variations inunderlying rates. These findings suggest that this variabil-ity can lead to differences that are comparable with the vari-ations associated with the transfer method or method of riskprojection. Issues of uncertainty in lifetime risk estimatesare discussed in more detail in Report No. 126 of theNational Council on Radiation Protection andMeasurements [N17] and in the recent BEIR VII report[C37]. The variability in these projections highlights the dif-ficulty of choosing a single value to represent the lifetimerisk of radiation-induced cancer. Furthermore, uncertaintiesin estimates of risk for specific types of cancer are gener-ally greater than for all cancers combined.
593. Despite these difficulties, risk estimates are of con-siderable value for use in characterizing the health impactof exposure of a population to radiation. In the UNSCEAR2000 Report [U2], models with variation of relative riskaccording to age at exposure or attained age were empha-sized for risk projection purposes. With the increased follow-up, it has become clear that those models do not fit well.
The preferred models for solid cancer mortality imply thatrelative or absolute excess risk is proportional to a productof powers of the time since exposure and attained age, withlinear, linear–quadratic or linear–quadratic–exponential doseresponse. The preferred models for leukaemia mortalityimply that relative excess risk is proportional to a power ofthe attained age, and that absolute excess risk is proportionalto a power of the time since exposure, with in both cases alinear–quadratic or linear–quadratic–exponential doseresponse. When these models are applied to any of five spe-cific populations (China, Japan, Puerto Rico, United Statesor United Kingdom) of all ages, the lifetime risk of expo-sure-induced death due to all solid cancers combined fol-lowing an acute dose of 0.1 Sv is estimated to be about3.6–7.7% Sv–1 averaged over both sexes, and at 1 Sv therisk is about 4.3–7.2% Sv–1. When Bayesian models areused, the range of mean risks is 2.3–5.4% Sv–1 followingan acute dose of 0.1 Sv, and at 1 Sv the mean risk range is4.6–7.1% Sv–1. Leukaemia mortality risks at a dose of 0.1Sv are estimated to be about 0.3–0.5% Sv–1 averaged overboth sexes, and at 1 Sv the risk is 0.6–1.0% Sv–1. WhenBayesian models are used, the range of mean risks is0.2–0.7% Sv–1 following an acute dose of 0.1 Sv, and at 1Sv the mean risk range is 1.1–1.5% Sv–1. The calculationsin this report show that these values can vary for differentpopulations and with different risk models. These cancer riskestimates are somewhat lower, although not much lower,than those previously estimated by UNSCEAR [U2], as wellas those previously estimated by other bodies, e.g. [C35,C37]. A reduction of about 10% in the solid cancer risk esti-mate may be due to the new atomic bombings dosimetry,and a relatively small reduction of 3–7% may be due toincreased follow-up [P10]. However, there is a relativelylarge reduction of 35–40% due to the different risk projec-tion and transfer models used. The statistical uncertaintiesin the above estimates may be of the order of a factor of 2 higher, and the lower bounds include zero. These estimates,particularly those based on linear–quadratic or linear–quadratic–exponential models, implicitly adjust for extrapo-lation to low doses, so that no extra adjustment for chronicexposure (i.e. application of a DDREF) is needed. Values ofDDREF of about 2, recommended by others [I11], are consistent with the dose protraction effects predicted by thesemodels and with a large body of epidemiological and exper-imental data. Lifetime solid cancer risk estimates for thoseexposed as children might be factors of 2–3 times higher thanthe estimates for the general population. For certain cancersites (e.g. thyroid and breast), the variation of risk with ageat exposure would be expected to be greater than implied bythis. Continued follow-up of existing irradiated cohorts willbe important in determining lifetime risks. The experience ofstudies of the survivors of the atomic bombings is consistentwith a linear dose response for the risk of all solid cancerscombined; therefore, as a first approximation, linear extrap-olation of the estimates of risk following an acute dose of 1 Sv can be used for estimating solid cancer risks at lowerdoses. For specific types of solid cancer, the risks estimatedin this annex are broadly similar to those presented in theUNSCEAR 2000 Report [U2].
UNSCEAR REPORT-PART 2.qxp 10/7/08 3:18 pm Page 138
ACKNOWLEDGEMENTS
594. The Committee gratefully acknowledges the consid-erable help (particularly in providing and reviewing thematerial for section III on site-specific cancer risks) received
by the principal consultant, M. Little, from J. Boice, E. Gilbert, D. Hoel, P. Inskip, C. Land, J. Lubin, C. Muirhead,D. Preston, E. Ron, R. Shore, L. Travis and R. Wakeford.
139
UNSCEAR REPORT-PART 2.qxp 10/7/08 3:18 pm Page 139

UNSCEAR REPORT-PART 2.qxp 10/7/08 3:18 pm Page 140
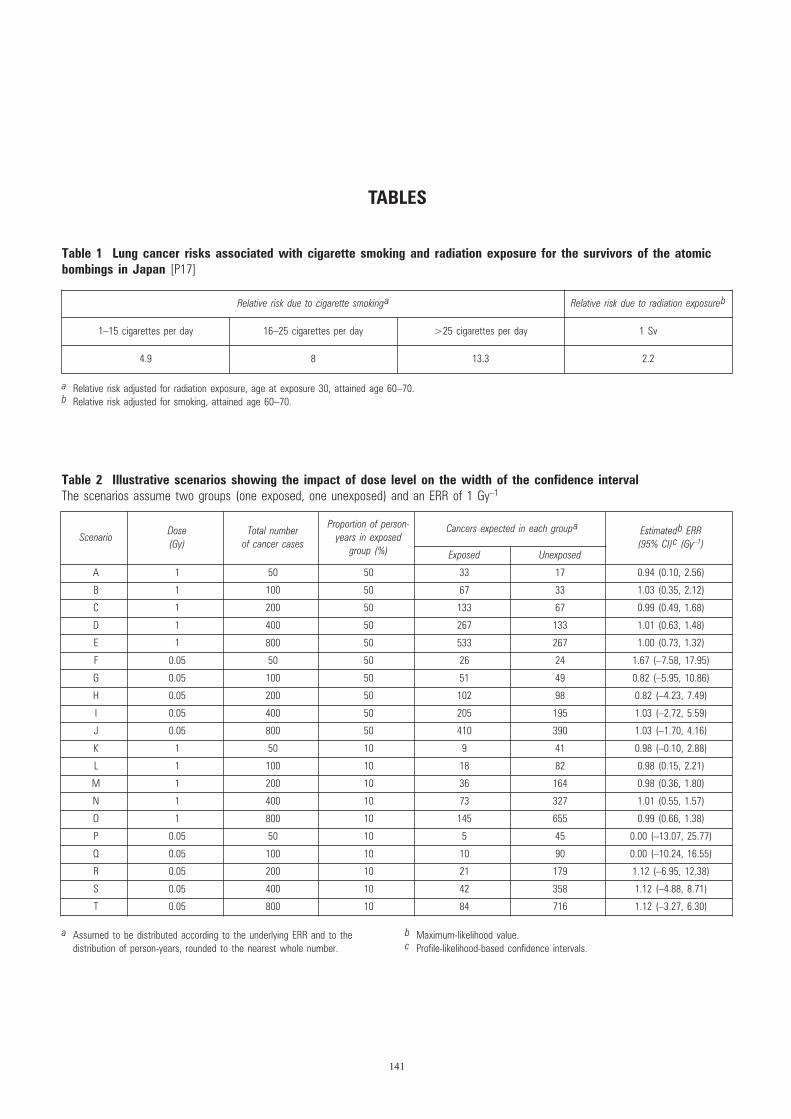
TABLES
Table 1 Lung cancer risks associated with cigarette smoking and radiation exposure for the survivors of the atomic bombings in Japan [P17]
141
Table 2 Illustrative scenarios showing the impact of dose level on the width of the confidence intervalThe scenarios assume two groups (one exposed, one unexposed) and an ERR of 1 Gy–1
ScenarioDose (Gy)
Total number of cancer cases
Proportion of person-years in exposed
group (%)
Cancers expected in each groupa Estimatedb ERR (95% CI)c (Gy–1)
Exposed Unexposed
A 1 50 50 33 17 0.94 (0.10, 2.56)
B 1 100 50 67 33 1.03 (0.35, 2.12)
C 1 200 50 133 67 0.99 (0.49, 1.68)
D 1 400 50 267 133 1.01 (0.63, 1.48)
E 1 800 50 533 267 1.00 (0.73, 1.32)
F 0.05 50 50 26 24 1.67 (–7.58, 17.95)
G 0.05 100 50 51 49 0.82 (–5.95, 10.86)
H 0.05 200 50 102 98 0.82 (–4.23, 7.49)
I 0.05 400 50 205 195 1.03 (–2.72, 5.59)
J 0.05 800 50 410 390 1.03 (–1.70, 4.16)
K 1 50 10 9 41 0.98 (–0.10, 2.88)
L 1 100 10 18 82 0.98 (0.15, 2.21)
M 1 200 10 36 164 0.98 (0.36, 1.80)
N 1 400 10 73 327 1.01 (0.55, 1.57)
O 1 800 10 145 655 0.99 (0.66, 1.38)
P 0.05 50 10 5 45 0.00 (–13.07, 25.77)
Q 0.05 100 10 10 90 0.00 (–10.24, 16.55)
R 0.05 200 10 21 179 1.12 (–6.95, 12.38)
S 0.05 400 10 42 358 1.12 (–4.88, 8.71)
T 0.05 800 10 84 716 1.12 (–3.27, 6.30)
a Relative risk adjusted for radiation exposure, age at exposure 30, attained age 60–70.b Relative risk adjusted for smoking, attained age 60–70.
Relative risk due to cigarette smokinga Relative risk due to radiation exposureb
1–15 cigarettes per day 16–25 cigarettes per day >25 cigarettes per day 1 Sv
4.9 8 13.3 2.2
a Assumed to be distributed according to the underlying ERR and to the distribution of person-years, rounded to the nearest whole number.
b Maximum-likelihood value.c Profile-likelihood-based confidence intervals.
UNSCEAR REPORT-PART 2.qxp 10/7/08 3:19 pm Page 141
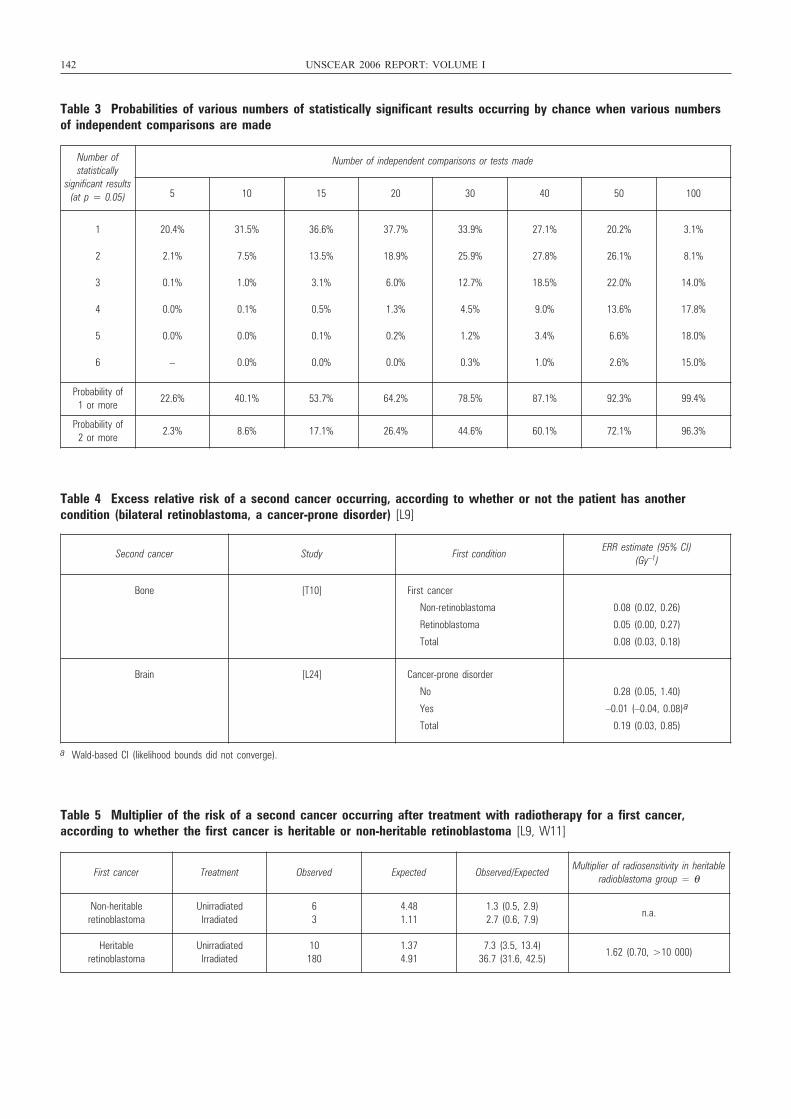
Table 5 Multiplier of the risk of a second cancer occurring after treatment with radiotherapy for a first cancer, according to whether the first cancer is heritable or non-heritable retinoblastoma [L9, W11]
First cancer Treatment Observed Expected Observed/ExpectedMultiplier of radiosensitivity in heritable
radioblastoma group = θ
Non-heritable retinoblastoma
UnirradiatedIrradiated
63
4.481.11
1.3 (0.5, 2.9)2.7 (0.6, 7.9)
n.a.
Heritable retinoblastoma
Unirradiated Irradiated
10180
1.374.91
7.3 (3.5, 13.4)36.7 (31.6, 42.5)
1.62 (0.70, >10 000)
142 UNSCEAR 2006 REPORT: VOLUME I
Table 3 Probabilities of various numbers of statistically significant results occurring by chance when various numbersof independent comparisons are made
Number of statistically
significant results (at p = 0.05)
Number of independent comparisons or tests made
5 10 15 20 30 40 50 100
1
2
3
4
5
6
20.4%
2.1%
0.1%
0.0%
0.0%
–
31.5%
7.5%
1.0%
0.1%
0.0%
0.0%
36.6%
13.5%
3.1%
0.5%
0.1%
0.0%
37.7%
18.9%
6.0%
1.3%
0.2%
0.0%
33.9%
25.9%
12.7%
4.5%
1.2%
0.3%
27.1%
27.8%
18.5%
9.0%
3.4%
1.0%
20.2%
26.1%
22.0%
13.6%
6.6%
2.6%
3.1%
8.1%
14.0%
17.8%
18.0%
15.0%
Probability of 1 or more
22.6% 40.1% 53.7% 64.2% 78.5% 87.1% 92.3% 99.4%
Probability of 2 or more
2.3% 8.6% 17.1% 26.4% 44.6% 60.1% 72.1% 96.3%
Table 4 Excess relative risk of a second cancer occurring, according to whether or not the patient has another condition (bilateral retinoblastoma, a cancer-prone disorder) [L9]
a Wald-based CI (likelihood bounds did not converge).
Second cancer Study First conditionERR estimate (95% CI)
(Gy–1)
Bone [T10] First cancer
Non-retinoblastoma
Retinoblastoma
Total
0.08 (0.02, 0.26)
0.05 (0.00, 0.27)
0.08 (0.03, 0.18)
Brain [L24] Cancer-prone disorder
No
Yes
Total
0.28 (0.05, 1.40)
–0.01 (–0.04, 0.08)a
0.19 (0.03, 0.85)
UNSCEAR REPORT-PART 2.qxp 10/7/08 3:19 pm Page 142
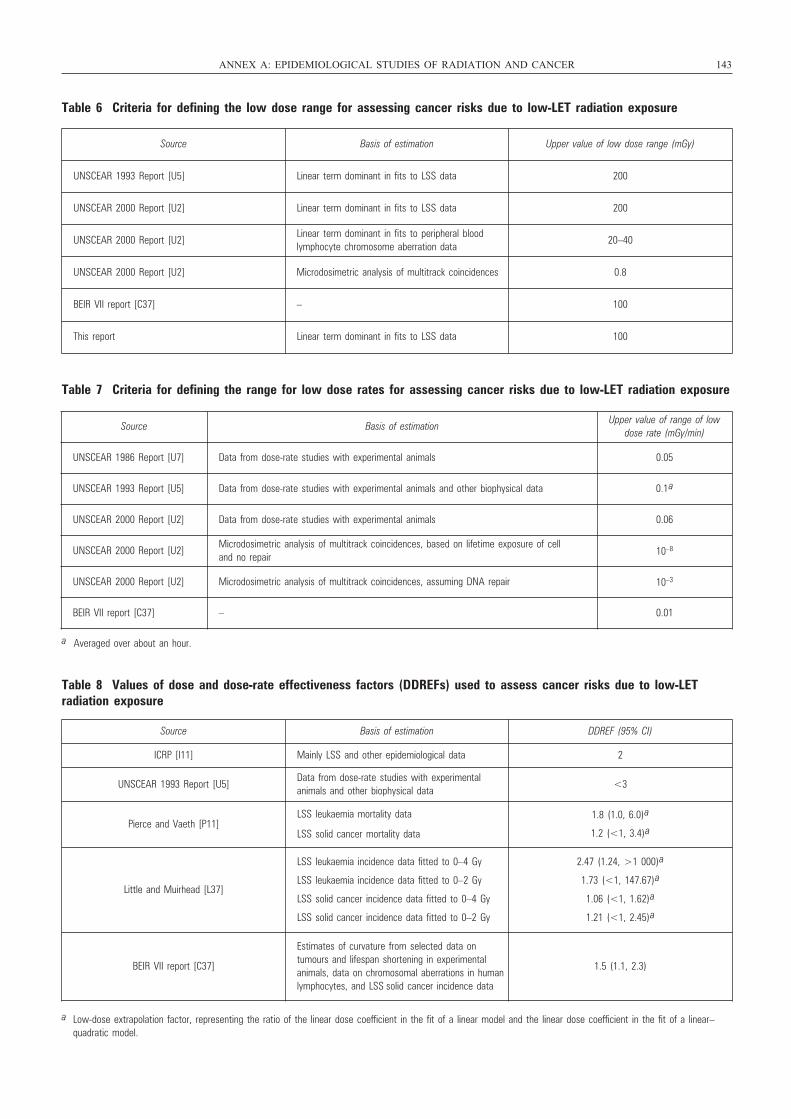
ANNEX A: EPIDEMIOLOGICAL STUDIES OF RADIATION AND CANCER 143
Table 6 Criteria for defining the low dose range for assessing cancer risks due to low-LET radiation exposure
Source Basis of estimation Upper value of low dose range (mGy)
UNSCEAR 1993 Report [U5] Linear term dominant in fits to LSS data 200
UNSCEAR 2000 Report [U2] Linear term dominant in fits to LSS data 200
UNSCEAR 2000 Report [U2]Linear term dominant in fits to peripheral blood lymphocyte chromosome aberration data
20–40
UNSCEAR 2000 Report [U2] Microdosimetric analysis of multitrack coincidences 0.8
BEIR VII report [C37] – 100
This report Linear term dominant in fits to LSS data 100
Table 7 Criteria for defining the range for low dose rates for assessing cancer risks due to low-LET radiation exposure
a Averaged over about an hour.
Source Basis of estimationUpper value of range of low
dose rate (mGy/min)
UNSCEAR 1986 Report [U7] Data from dose-rate studies with experimental animals 0.05
UNSCEAR 1993 Report [U5] Data from dose-rate studies with experimental animals and other biophysical data 0.1a
UNSCEAR 2000 Report [U2] Data from dose-rate studies with experimental animals 0.06
UNSCEAR 2000 Report [U2]Microdosimetric analysis of multitrack coincidences, based on lifetime exposure of cell and no repair 10–8
UNSCEAR 2000 Report [U2] Microdosimetric analysis of multitrack coincidences, assuming DNA repair 10–3
BEIR VII report [C37] – 0.01
Table 8 Values of dose and dose-rate effectiveness factors (DDREFs) used to assess cancer risks due to low-LET radiation exposure
Source Basis of estimation DDREF (95% CI)
ICRP [I11] Mainly LSS and other epidemiological data 2
UNSCEAR 1993 Report [U5]Data from dose-rate studies with experimental animals and other biophysical data
<3
Pierce and Vaeth [P11]LSS leukaemia mortality data
LSS solid cancer mortality data
1.8 (1.0, 6.0)a
1.2 (<1, 3.4)a
Little and Muirhead [L37]
LSS leukaemia incidence data fitted to 0–4 Gy
LSS leukaemia incidence data fitted to 0–2 Gy
LSS solid cancer incidence data fitted to 0–4 Gy
LSS solid cancer incidence data fitted to 0–2 Gy
2.47 (1.24, >1 000)a
1.73 (<1, 147.67)a
1.06 (<1, 1.62)a
1.21 (<1, 2.45)a
BEIR VII report [C37]
Estimates of curvature from selected data ontumours and lifespan shortening in experimental animals, data on chromosomal aberrations in humanlymphocytes, and LSS solid cancer incidence data
1.5 (1.1, 2.3)
a Low-dose extrapolation factor, representing the ratio of the linear dose coefficient in the fit of a linear model and the linear dose coefficient in the fit of a linear–quadratic model.
UNSCEAR REPORT-PART 2.qxp 10/7/08 3:19 pm Page 143
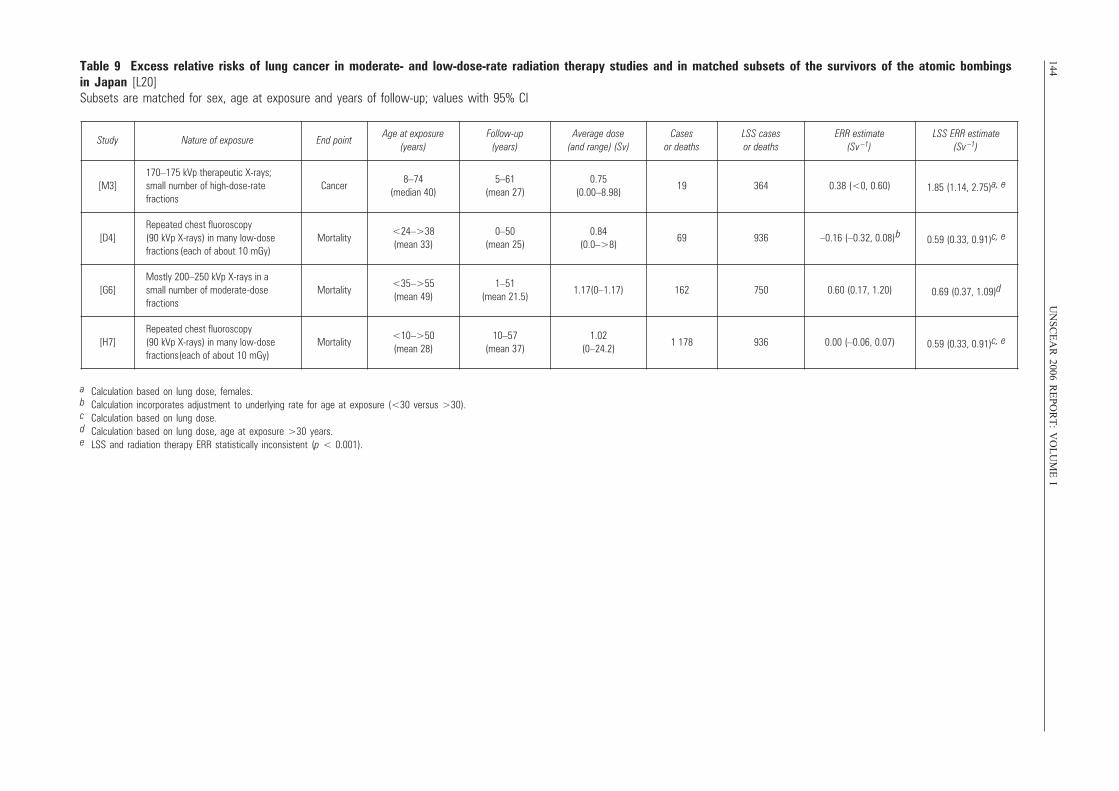
144U
NS
CE
AR
2006 RE
PO
RT
: VO
LU
ME
ITable 9 Excess relative risks of lung cancer in moderate- and low-dose-rate radiation therapy studies and in matched subsets of the survivors of the atomic bombingsin Japan [L20] Subsets are matched for sex, age at exposure and years of follow-up; values with 95% CI
a Calculation based on lung dose, females.b Calculation incorporates adjustment to underlying rate for age at exposure (<30 versus >30).c Calculation based on lung dose.d Calculation based on lung dose, age at exposure >30 years.e LSS and radiation therapy ERR statistically inconsistent (p < 0.001).
Study Nature of exposure End pointAge at exposure
(years)Follow-up
(years)Average dose
(and range) (Sv)Cases
or deathsLSS cases or deaths
ERR estimate(Sv –1)
LSS ERR estimate (Sv –1)
[M3]170–175 kVp therapeutic X-rays; small number of high-dose-rate fractions
Cancer8–74
(median 40)5–61
(mean 27)0.75
(0.00–8.98)19 364 0.38 (<0, 0.60) 1.85 (1.14, 2.75)a, e
[D4]Repeated chest fluoroscopy (90 kVp X-rays) in many low-dose fractions (each of about 10 mGy)
Mortality<24–>38 (mean 33)
0–50(mean 25)
0.84(0.0–>8)
69 936 –0.16 (–0.32, 0.08)
b 0.59 (0.33, 0.91)c, e
[G6]Mostly 200–250 kVp X-rays in a small number of moderate-dose fractions
Mortality<35–>55 (mean 49)
1–51(mean 21.5)
1.17(0–1.17) 162 750 0.60 (0.17, 1.20) 0.69 (0.37, 1.09)d
[H7]Repeated chest fluoroscopy (90 kVp X-rays) in many low-dose fractions (each of about 10 mGy)
Mortality<10–>50 (mean 28)
10–57(mean 37)
1.02(0–24.2)
1 178 936 0.00 (–0.06, 0.07) 0.59 (0.33, 0.91)c, e
UNSCEAR REPORT-PART 2.qxp 10/7/08 3:19 pm Page 144
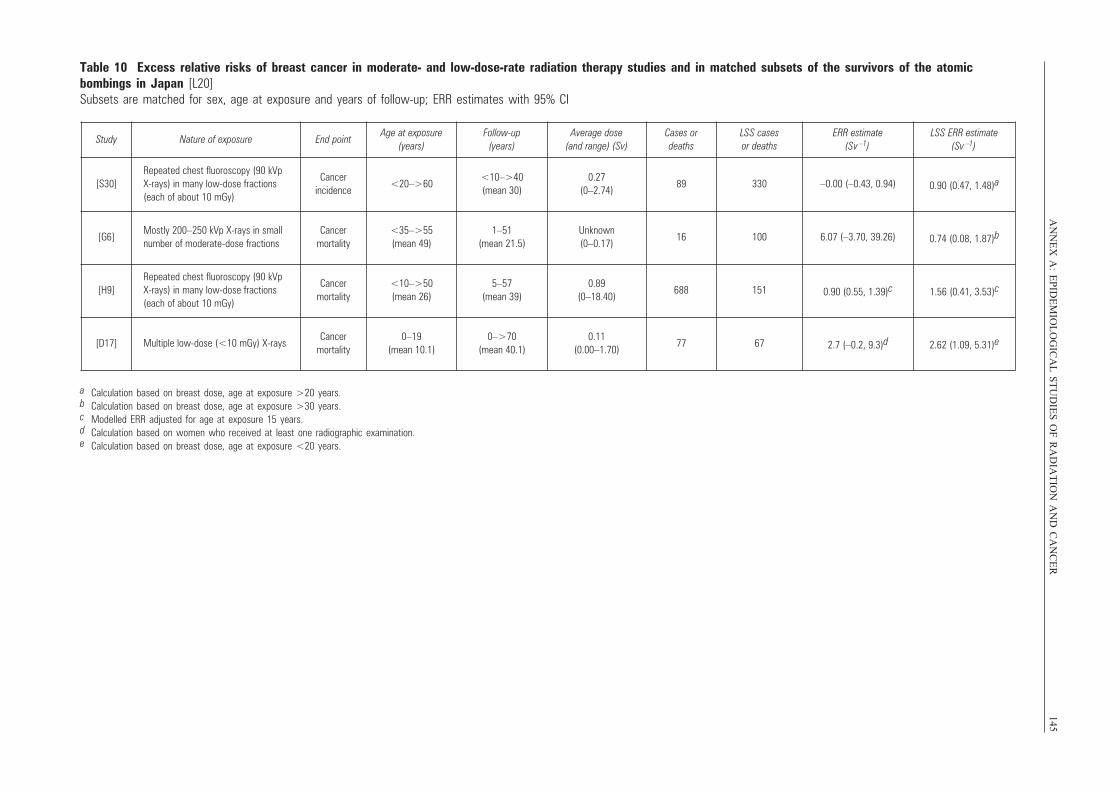
AN
NE
X A
: EP
IDE
MIO
LO
GIC
AL
ST
UD
IES
OF
RA
DIA
TIO
N A
ND
CA
NC
ER
145Table 10 Excess relative risks of breast cancer in moderate- and low-dose-rate radiation therapy studies and in matched subsets of the survivors of the atomic bombings in Japan [L20] Subsets are matched for sex, age at exposure and years of follow-up; ERR estimates with 95% CI
a Calculation based on breast dose, age at exposure >20 years.b Calculation based on breast dose, age at exposure >30 years.c Modelled ERR adjusted for age at exposure 15 years.d Calculation based on women who received at least one radiographic examination.e Calculation based on breast dose, age at exposure <20 years.
Study Nature of exposure End pointAge at exposure
(years)Follow-up
(years)Average dose
(and range) (Sv)Cases or deaths
LSS cases or deaths
ERR estimate(Sv –1)
LSS ERR estimate (Sv –1)
[S30]Repeated chest fluoroscopy (90 kVp X-rays) in many low-dose fractions(each of about 10 mGy)
Cancer incidence
<20–>60<10–>40(mean 30)
0.27(0–2.74)
89 330 –0.00 (–0.43, 0.94) 0.90 (0.47, 1.48)a
[G6]Mostly 200–250 kVp X-rays in smallnumber of moderate-dose fractions
Cancer mortality
<35–>55(mean 49)
1–51(mean 21.5)
Unknown(0–0.17)
16 100 6.07 (–3.70, 39.26) 0.74 (0.08, 1.87)b
[H9]Repeated chest fluoroscopy (90 kVp X-rays) in many low-dose fractions(each of about 10 mGy)
Cancer mortality
<10–>50(mean 26)
5–57(mean 39)
0.89(0–18.40)
688 151 0.90 (0.55, 1.39)c 1.56 (0.41, 3.53)c
[D17] Multiple low-dose (<10 mGy) X-raysCancer
mortality0–19
(mean 10.1)0–>70
(mean 40.1)0.11
(0.00–1.70)77 67 2.7 (–0.2, 9.3)d 2.62 (1.09, 5.31)e
UNSCEAR REPORT-PART 2.qxp 10/7/08 3:19 pm Page 145
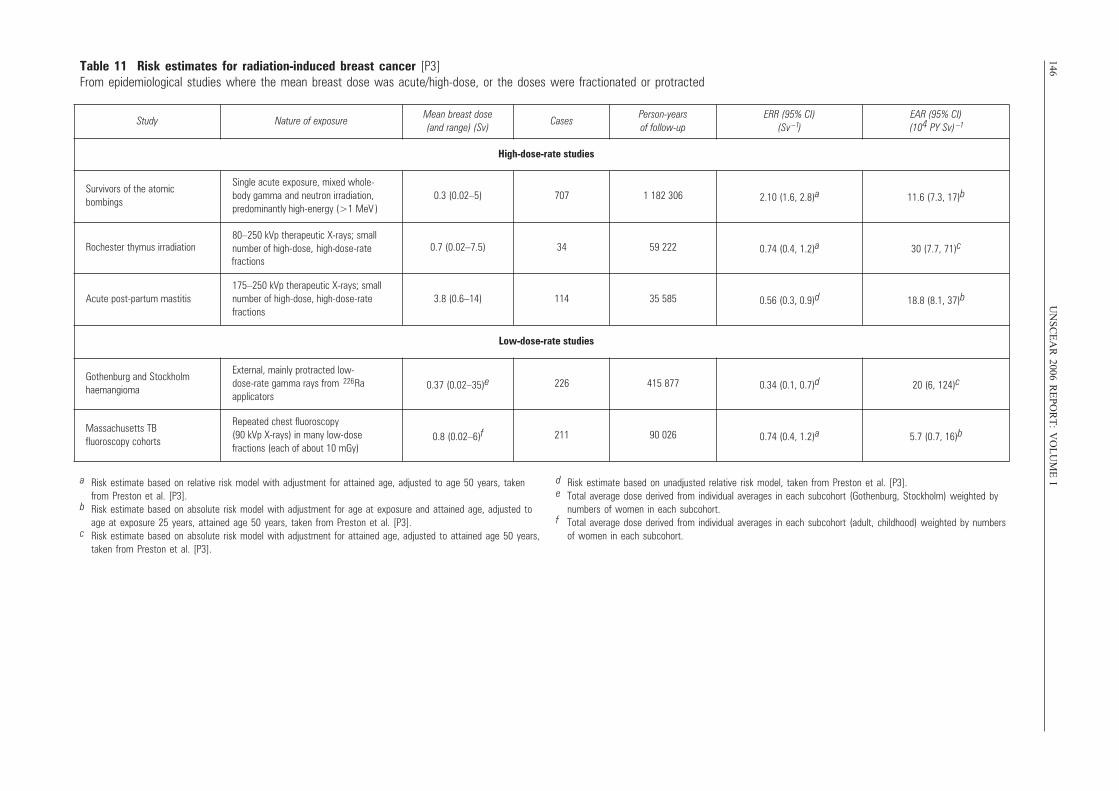
146U
NS
CE
AR
2006 RE
PO
RT
: VO
LU
ME
ITable 11 Risk estimates for radiation-induced breast cancer [P3] From epidemiological studies where the mean breast dose was acute/high-dose, or the doses were fractionated or protracted
Study Nature of exposureMean breast dose (and range) (Sv)
CasesPerson-years of follow-up
ERR (95% CI)(Sv –1)
EAR (95% CI)(104 PY Sv) –1
High-dose-rate studies
Survivors of the atomic bombings
Single acute exposure, mixed whole-body gamma and neutron irradiation, predominantly high-energy (>1 MeV )
0.3 (0.02–5) 707 1 182 306 2.10 (1.6, 2.8)a 11.6 (7.3, 17)b
Rochester thymus irradiation 80–250 kVp therapeutic X-rays; small number of high-dose, high-dose-rate fractions
0.7 (0.02–7.5) 34 59 222 0.74 (0.4, 1.2)a 30 (7.7, 71)c
Acute post-partum mastitis175–250 kVp therapeutic X-rays; smallnumber of high-dose, high-dose-rate fractions
3.8 (0.6–14) 114 35 585 0.56 (0.3, 0.9)d 18.8 (8.1, 37)b
Low-dose-rate studies
Gothenburg and Stockholm haemangioma
External, mainly protracted low-dose-rate gamma rays from 226Ra applicators
0.37 (0.02–35)e 226 415 877 0.34 (0.1, 0.7)d 20 (6, 124)c
Massachusetts TB fluoroscopy cohorts
Repeated chest fluoroscopy (90 kVp X-rays) in many low-dose fractions (each of about 10 mGy)
0.8 (0.02–6)f 211 90 026 0.74 (0.4, 1.2)a 5.7 (0.7, 16)b
a Risk estimate based on relative risk model with adjustment for attained age, adjusted to age 50 years, taken from Preston et al. [P3].
b Risk estimate based on absolute risk model with adjustment for age at exposure and attained age, adjusted to age at exposure 25 years, attained age 50 years, taken from Preston et al. [P3].
c Risk estimate based on absolute risk model with adjustment for attained age, adjusted to attained age 50 years, taken from Preston et al. [P3].
d Risk estimate based on unadjusted relative risk model, taken from Preston et al. [P3].e Total average dose derived from individual averages in each subcohort (Gothenburg, Stockholm) weighted by
numbers of women in each subcohort.f Total average dose derived from individual averages in each subcohort (adult, childhood) weighted by numbers
of women in each subcohort.
UNSCEAR REPORT-PART 2.qxp 10/7/08 3:19 pm Page 146
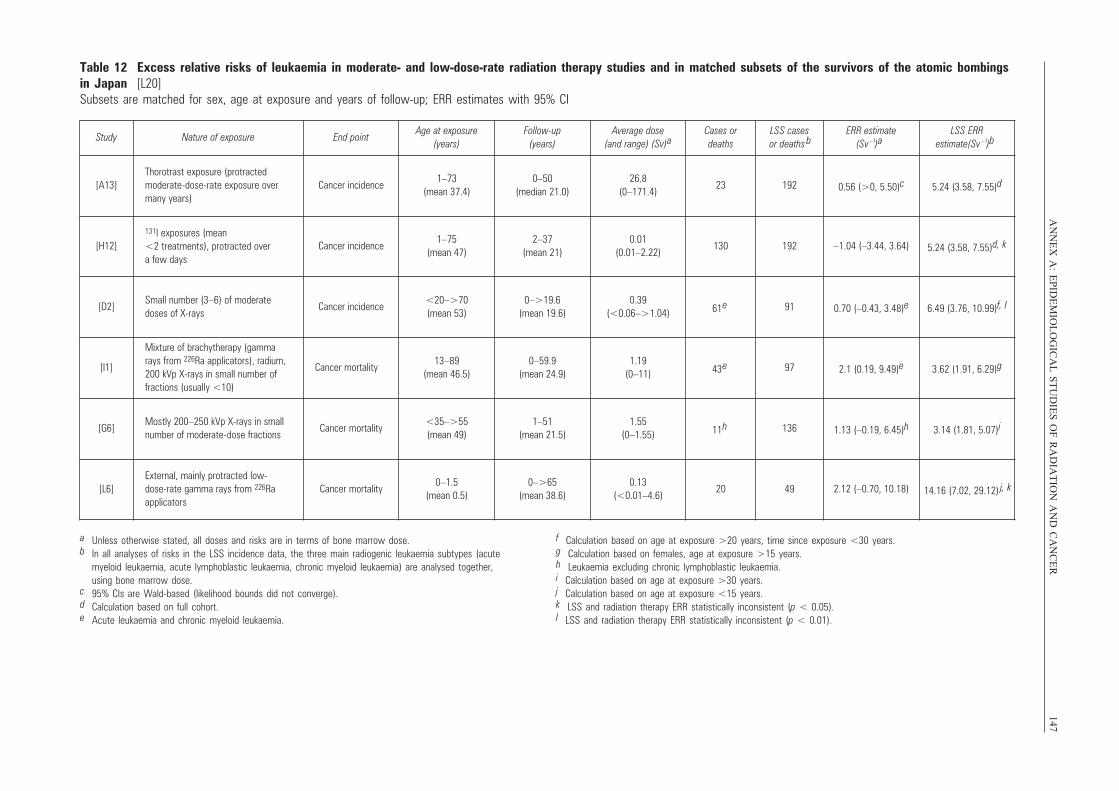
AN
NE
X A
: EP
IDE
MIO
LO
GIC
AL
ST
UD
IES
OF
RA
DIA
TIO
N A
ND
CA
NC
ER
147Table 12 Excess relative risks of leukaemia in moderate- and low-dose-rate radiation therapy studies and in matched subsets of the survivors of the atomic bombings in Japan [L20]Subsets are matched for sex, age at exposure and years of follow-up; ERR estimates with 95% CI
Study Nature of exposure End pointAge at exposure
(years)Follow-up
(years)Average dose
(and range) (Sv)aCases or deaths
LSS cases or deaths b
ERR estimate(Sv –1)a
LSS ERRestimate(Sv )b
[A13]Thorotrast exposure (protracted moderate-dose-rate exposure over many years)
Cancer incidence1–73
(mean 37.4)0–50
(median 21.0)26.8
(0–171.4)23 192 0.56 (>0, 5.50)c 5.24 (3.58, 7.55)d
[H12]131I exposures (mean <2 treatments), protracted over a few days
Cancer incidence1–75
(mean 47)2–37
(mean 21)0.01
(0.01–2.22)130 192 –1.04 (–3.44, 3.64) 5.24 (3.58, 7.55)d, k
[D2]Small number (3–6) of moderate doses of X-rays
Cancer incidence<20–>70(mean 53)
0–>19.6(mean 19.6)
0.39(<0.06–>1.04) 61 e 91 0.70 (–0.43, 3.48)e 6.49 (3.76, 10.99)f, l
[I1]
Mixture of brachytherapy (gamma rays from 226Ra applicators), radium, 200 kVp X-rays in small number of fractions (usually <10)
Cancer mortality13–89
(mean 46.5)0–59.9
(mean 24.9)1.19
(0–11) 43 e 97 2.1 (0.19, 9.49)e 3.62 (1.91, 6.29)g
[G6]Mostly 200–250 kVp X-rays in smallnumber of moderate-dose fractions
Cancer mortality<35–>55(mean 49)
1–51(mean 21.5)
1.55(0–1.55) 11 h 136 1.13 (–0.19, 6.45)h 3.14 (1.81, 5.07)i
[L6]External, mainly protracted low-dose-rate gamma rays from 226Ra applicators
Cancer mortality0–1.5
(mean 0.5)0–>65
(mean 38.6)0.13
(<0.01–4.6)20 49 2.12 (–0.70, 10.18) 14.16 (7.02, 29.12) j, k
–1
a Unless otherwise stated, all doses and risks are in terms of bone marrow dose.b In all analyses of risks in the LSS incidence data, the three main radiogenic leukaemia subtypes (acute
myeloid leukaemia, acute lymphoblastic leukaemia, chronic myeloid leukaemia) are analysed together, using bone marrow dose.
c 95% CIs are Wald-based (likelihood bounds did not converge).d Calculation based on full cohort.e Acute leukaemia and chronic myeloid leukaemia.
f Calculation based on age at exposure >20 years, time since exposure <30 years.g Calculation based on females, age at exposure >15 years.h Leukaemia excluding chronic lymphoblastic leukaemia.i Calculation based on age at exposure >30 years.j Calculation based on age at exposure <15 years.k LSS and radiation therapy ERR statistically inconsistent (p < 0.05).l LSS and radiation therapy ERR statistically inconsistent (p < 0.01).
UNSCEAR REPORT-PART 2.qxp 10/7/08 3:19 pm Page 147
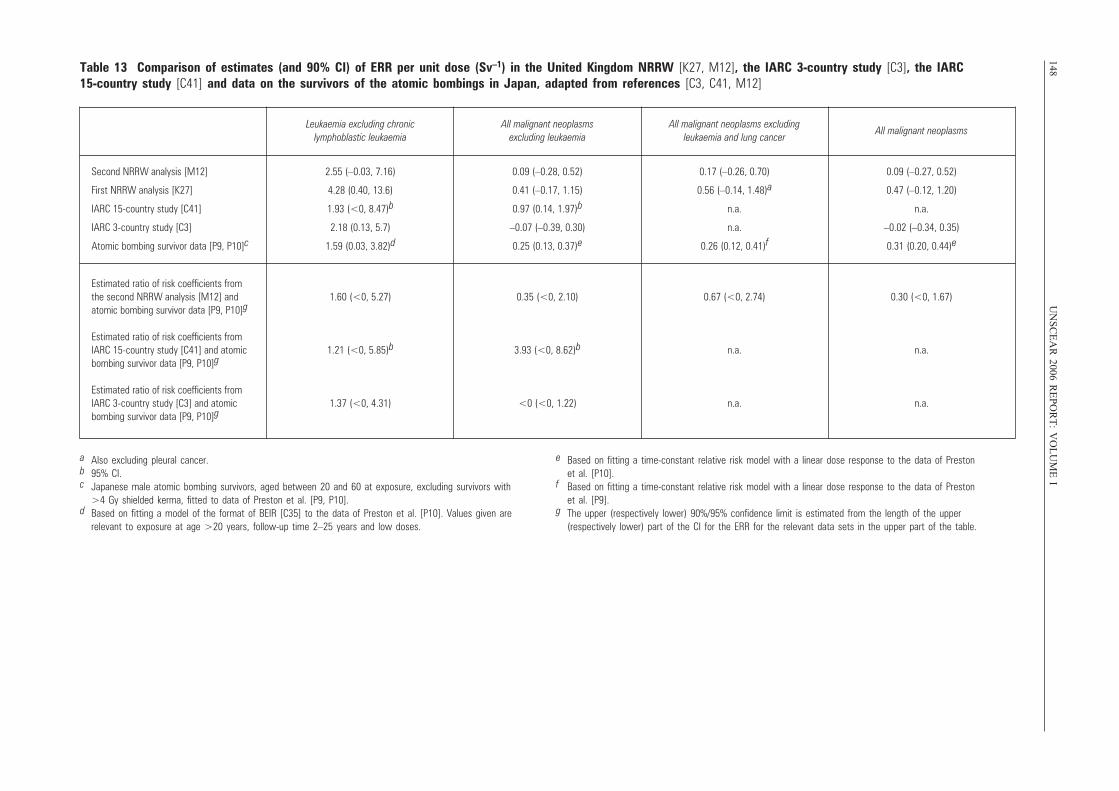
148U
NS
CE
AR
2006 RE
PO
RT
: VO
LU
ME
ITable 13 Comparison of estimates (and 90% CI) of ERR per unit dose (Sv–1) in the United Kingdom NRRW [K27, M12], the IARC 3-country study [C3], the IARC 15-country study [C41] and data on the survivors of the atomic bombings in Japan, adapted from references [C3, C41, M12]
Leukaemia excluding chronic lymphoblastic leukaemia
All malignant neoplasms excluding leukaemia
All malignant neoplasms excluding leukaemia and lung cancer
All malignant neoplasms
Second NRRW analysis [M12]
First NRRW analysis [K27]
IARC 15-country study [C41]
IARC 3-country study [C3]
Atomic bombing survivor data [P9, P10]c
2.55 (–0.03, 7.16)
4.28 (0.40, 13.6)
1.93 (<0, 8.47)b
2.18 (0.13, 5.7)
1.59 (0.03, 3.82)d
0.09 (–0.28, 0.52)
0.41 (–0.17, 1.15)
0.97 (0.14, 1.97)b
–0.07 (–0.39, 0.30)
0.25 (0.13, 0.37)e
0.17 (–0.26, 0.70)
0.56 (–0.14, 1.48)a
n.a.
n.a.
0.26 (0.12, 0.41)f
0.09 (–0.27, 0.52)
0.47 (–0.12, 1.20)
n.a.
–0.02 (–0.34, 0.35)
0.31 (0.20, 0.44)e
Estimated ratio of risk coefficients from the second NRRW analysis [M12] and atomic bombing survivor data [P9, P10]g
Estimated ratio of risk coefficients from IARC 15-country study [C41] and atomicbombing survivor data [P9, P10]g
Estimated ratio of risk coefficients from IARC 3-country study [C3] and atomic bombing survivor data [P9, P10]g
1.60 (<0, 5.27)
1.21 (<0, 5.85)b
1.37 (<0, 4.31)
0.35 (<0, 2.10)
3.93 (<0, 8.62)b
<0 (<0, 1.22)
0.67 (<0, 2.74)
n.a.
n.a.
0.30 (<0, 1.67)
n.a.
n.a.
a Also excluding pleural cancer.b 95% CI.c Japanese male atomic bombing survivors, aged between 20 and 60 at exposure, excluding survivors with
>4 Gy shielded kerma, fitted to data of Preston et al. [P9, P10].d Based on fitting a model of the format of BEIR [C35] to the data of Preston et al. [P10]. Values given are
relevant to exposure at age >20 years, follow-up time 2–25 years and low doses.
e Based on fitting a time-constant relative risk model with a linear dose response to the data of Preston et al. [P10].
f Based on fitting a time-constant relative risk model with a linear dose response to the data of Preston et al. [P9].
g The upper (respectively lower) 90%/95% confidence limit is estimated from the length of the upper (respectively lower) part of the CI for the ERR for the relevant data sets in the upper part of the table.
UNSCEAR REPORT-PART 2.qxp 10/7/08 3:19 pm Page 148
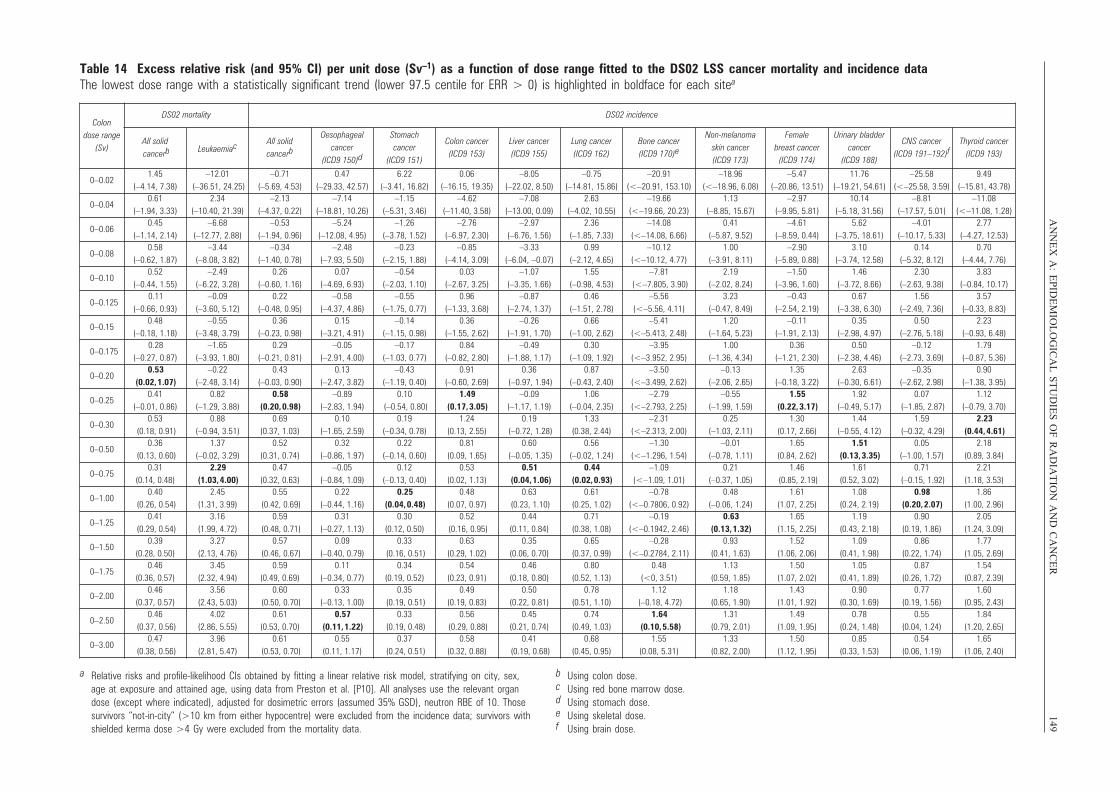
AN
NE
X A
: EP
IDE
MIO
LO
GIC
AL
ST
UD
IES
OF
RA
DIA
TIO
N A
ND
CA
NC
ER
149Table 14 Excess relative risk (and 95% CI) per unit dose (Sv–1) as a function of dose range fitted to the DS02 LSS cancer mortality and incidence dataThe lowest dose range with a statistically significant trend (lower 97.5 centile for ERR > 0) is highlighted in boldface for each sitea
Colon dose range
(Sv)
DS02 mortality DS02 incidence
All solidcancerb Leukaemiac All solid
cancerb
Oesophageal cancer
(ICD9 150)d
Stomach cancer
(ICD9 151)
Colon cancer (ICD9 153)
Liver cancer (ICD9 155)
Lung cancer (ICD9 162)
Bone cancer (ICD9 170)e
Non-melanoma skin cancer (ICD9 173)
Female breast cancer
(ICD9 174)
Urinary bladder cancer
(ICD9 188)
CNS cancer (ICD9 191–192)f
Thyroid cancer (ICD9 193)
0–0.021.45
(–4.14, 7.38)–12.01
(–36.51, 24.25)–0.71
(–5.69, 4.53)0.47
(–29.33, 42.57)6.22
(–3.41, 16.82)0.06
(–16.15, 19.35)–8.05
(–22.02, 8.50)–0.75
(–14.81, 15.86)–20.91
(<–20.91, 153.10)–18.96
(<–18.96, 6.08)–5.47
(–20.86, 13.51)11.76
(–19.21, 54.61)–25.58
(<–25.58, 3.59)9.49
(–15.81, 43.78)
0–0.040.61
(–1.94, 3.33)2.34
(–10.40, 21.39)–2.13
(–4.37, 0.22)–7.14
(–18.81, 10.26)–1.15
(–5.31, 3.46)–4.62
(–11.40, 3.58)–7.08
(–13.00, 0.09)2.63
(–4.02, 10.55)–19.66
(<–19.66, 20.23)1.13
(–8.85, 15.67)–2.97
(–9.95, 5.81)10.14
(–5.18, 31.56)–8.81
(–17.57, 5.01)–11.08
(<–11.08, 1.28)
0–0.060.45
(–1.14, 2.14)–6.68
(–12.77, 2.88)–0.53
(–1.94, 0.96)–5.24
(–12.08, 4.95)–1.26
(–3.78, 1.52)–2.76
(–6.97, 2.30)–2.97
(–6.76, 1.56)2.36
(–1.85, 7.33)–14.08
(<–14.08, 6.66)0.41
(–5.87, 9.52)–4.61
(–8.59, 0.44)5.62
(–3.75, 18.61)–4.01
(–10.17, 5.33)2.77
(–4.27, 12.53)
0–0.080.58
(–0.62, 1.87)–3.44
(–8.08, 3.82)–0.34
(–1.40, 0.78)–2.48
(–7.93, 5.50)–0.23
(–2.15, 1.88)–0.85
(–4.14, 3.09)–3.33
(–6.04, –0.07)0.99
(–2.12, 4.65)–10.12
(<–10.12, 4.77)1.00
(–3.91, 8.11)–2.90
(–5.89, 0.88)3.10
(–3.74, 12.58)0.14
(–5.32, 8.12)0.70
(–4.44, 7.76)
0–0.100.52
(–0.44, 1.55)–2.49
(–6.22, 3.28)0.26
(–0.60, 1.16)0.07
(–4.69, 6.93)–0.54
(–2.03, 1.10)0.03
(–2.67, 3.25)–1.07
(–3.35, 1.66)1.55
(–0.98, 4.53)–7.81
(<–7.805, 3.90)2.19
(–2.02, 8.24)–1.50
(–3.96, 1.60)1.46
(–3.72, 8.66)2.30
(–2.63, 9.38)3.83
(–0.84, 10.17)
0–0.1250.11
(–0.66, 0.93)–0.09
(–3.60, 5.12)0.22
(–0.48, 0.95)–0.58
(–4.37, 4.86)–0.55
(–1.75, 0.77)0.96
(–1.33, 3.68)–0.87
(–2.74, 1.37)0.46
(–1.51, 2.78)–5.56
(<–5.56, 4.11)3.23
(–0.47, 8.49)–0.43
(–2.54, 2.19)0.67
(–3.38, 6.30)1.56
(–2.49, 7.36)3.57
(–0.33, 8.83)
0–0.150.48
(–0.18, 1.18)–0.55
(–3.48, 3.79)0.36
(–0.23, 0.98)0.15
(–3.21, 4.91)–0.14
(–1.15, 0.98)0.36
(–1.55, 2.62)–0.26
(–1.91, 1.70)0.66
(–1.00, 2.62)–5.41
(<–5.413, 2.48)1.20
(–1.64, 5.23)–0.11
(–1.91, 2.13)0.35
(–2.98, 4.97)0.50
(–2.76, 5.18)2.23
(–0.93, 6.48)
0–0.1750.28
(–0.27, 0.87)–1.65
(–3.93, 1.80)0.29
(–0.21, 0.81)–0.05
(–2.91, 4.00)–0.17
(–1.03, 0.77)0.84
(–0.82, 2.80)–0.49
(–1.88, 1.17)0.30
(–1.09, 1.92)–3.95
(<–3.952, 2.95)1.00
(–1.36, 4.34)0.36
(–1.21, 2.30)0.50
(–2.38, 4.46)–0.12
(–2.73, 3.69)1.79
(–0.87, 5.36)
0–0.200.53
(0.02, 1.07)–0.22
(–2.48, 3.14)0.43
(–0.03, 0.90)0.13
(–2.47, 3.82)–0.43
(–1.19, 0.40)0.91
(–0.60, 2.69)0.36
(–0.97, 1.94)0.87
(–0.43, 2.40)–3.50
(<–3.499, 2.62)–0.13
(–2.06, 2.65)1.35
(–0.18, 3.22)2.63
(–0.30, 6.61)–0.35
(–2.62, 2.98)0.90
(–1.38, 3.95)
0–0.250.41
(–0.01, 0.86)0.82
(–1.29, 3.88)0.58
(0.20, 0.98)–0.89
(–2.83, 1.94)0.10
(–0.54, 0.80)1.49
(0.17, 3.05)–0.09
(–1.17, 1.19)1.06
(–0.04, 2.35)–2.79
(<–2.793, 2.25)–0.55
(–1.99, 1.59)1.55
(0.22, 3.17)1.92
(–0.49, 5.17)0.07
(–1.85, 2.87)1.12
(–0.79, 3.70)
0–0.300.53
(0.18, 0.91)0.88
(–0.94, 3.51)0.69
(0.37, 1.03)0.10
(–1.65, 2.59)0.19
(–0.34, 0.78)1.24
(0.13, 2.55)0.19
(–0.72, 1.28)1.33
(0.38, 2.44)–2.31
(<–2.313, 2.00)0.25
(–1.03, 2.11)1.30
(0.17, 2.66)1.44
(–0.55, 4.12)1.59
(–0.32, 4.29)2.23
(0.44, 4.61)
0–0.500.36
(0.13, 0.60)1.37
(–0.02, 3.29)0.52
(0.31, 0.74)0.32
(–0.86, 1.97)0.22
(–0.14, 0.60)0.81
(0.09, 1.65)0.60
(–0.05, 1.35)0.56
(–0.02, 1.24)–1.30
(<–1.296, 1.54)–0.01
(–0.78, 1.11)1.65
(0.84, 2.62)1.51
(0.13, 3.35)0.05
(–1.00, 1.57)2.18
(0.89, 3.84)
0–0.750.31
(0.14, 0.48)2.29
(1.03, 4.00)0.47
(0.32, 0.63)–0.05
(–0.84, 1.09)0.12
(–0.13, 0.40)0.53
(0.02, 1.13)0.51
(0.04, 1.06)0.44
(0.02, 0.93)–1.09
(<–1.09, 1.01)0.21
(–0.37, 1.05)1.46
(0.85, 2.19)1.61
(0.52, 3.02)0.71
(–0.15, 1.92)2.21
(1.18, 3.53)
0–1.000.40
(0.26, 0.54)2.45
(1.31, 3.99)0.55
(0.42, 0.69)0.22
(–0.44, 1.16)0.25
(0.04, 0.48)0.48
(0.07, 0.97)0.63
(0.23, 1.10)0.61
(0.25, 1.02)–0.78
(<–0.7806, 0.92)0.48
(–0.06, 1.24)1.61
(1.07, 2.25)1.08
(0.24, 2.19)0.98
(0.20, 2.07)1.86
(1.00, 2.96)
0–1.250.41
(0.29, 0.54)3.16
(1.99, 4.72)0.59
(0.48, 0.71)0.31
(–0.27, 1.13)0.30
(0.12, 0.50)0.52
(0.16, 0.95)0.44
(0.11, 0.84)0.71
(0.38, 1.08)–0.19
(<–0.1942, 2.46)0.63
(0.13, 1.32)1.65
(1.15, 2.25)1.19
(0.43, 2.18)0.90
(0.19, 1.86)2.05
(1.24, 3.09)
0–1.500.39
(0.28, 0.50)3.27
(2.13, 4.76)0.57
(0.46, 0.67)0.09
(–0.40, 0.79)0.33
(0.16, 0.51)0.63
(0.29, 1.02)0.35
(0.06, 0.70)0.65
(0.37, 0.99)–0.28
(<–0.2784, 2.11)0.93
(0.41, 1.63)1.52
(1.06, 2.06)1.09
(0.41, 1.98)0.86
(0.22, 1.74)1.77
(1.05, 2.69)
0–1.750.46
(0.36, 0.57)3.45
(2.32, 4.94)0.59
(0.49, 0.69)0.11
(–0.34, 0.77)0.34
(0.19, 0.52)0.54
(0.23, 0.91)0.46
(0.18, 0.80)0.80
(0.52, 1.13)0.48
(<0, 3.51)1.13
(0.59, 1.85)1.50
(1.07, 2.02)1.05
(0.41, 1.89)0.87
(0.26, 1.72)1.54
(0.87, 2.39)
0–2.000.46
(0.37, 0.57)3.56
(2.43, 5.03)0.60
(0.50, 0.70)0.33
(–0.13, 1.00)0.35
(0.19, 0.51)0.49
(0.19, 0.83)0.50
(0.22, 0.81)0.78
(0.51, 1.10)1.12
(–0.18, 4.72)1.18
(0.65, 1.90)1.43
(1.01, 1.92)0.90
(0.30, 1.69)0.77
(0.19, 1.56)1.60
(0.95, 2.43)
0–2.500.46
(0.37, 0.56)4.02
(2.86, 5.55)0.61
(0.53, 0.70)0.57
(0.11, 1.22)0.33
(0.19, 0.48)0.56
(0.29, 0.88)0.45
(0.21, 0.74)0.74
(0.49, 1.03)1.64
(0.10, 5.58)1.31
(0.79, 2.01)1.49
(1.09, 1.95)0.78
(0.24, 1.48)0.55
(0.04, 1.24)1.84
(1.20, 2.65)
0–3.000.47
(0.38, 0.56)3.96
(2.81, 5.47)0.61
(0.53, 0.70)0.55
(0.11, 1.17)0.37
(0.24, 0.51)0.58
(0.32, 0.88)0.41
(0.19, 0.68)0.68
(0.45, 0.95)1.55
(0.08, 5.31)1.33
(0.82, 2.00)1.50
(1.12, 1.95)0.85
(0.33, 1.53)0.54
(0.06, 1.19)1.65
(1.06, 2.40)
a Relative risks and profile-likelihood CIs obtained by fitting a linear relative risk model, stratifying on city, sex, age at exposure and attained age, using data from Preston et al. [P10]. All analyses use the relevant organ dose (except where indicated), adjusted for dosimetric errors (assumed 35% GSD), neutron RBE of 10. Those survivors “not-in-city” (>10 km from either hypocentre) were excluded from the incidence data; survivors with shielded kerma dose >4 Gy were excluded from the mortality data.
b Using colon dose.c Using red bone marrow dose.d Using stomach dose.e Using skeletal dose.f Using brain dose.
UNSCEAR REPORT-PART 2.qxp 10/7/08 3:19 pm Page 149
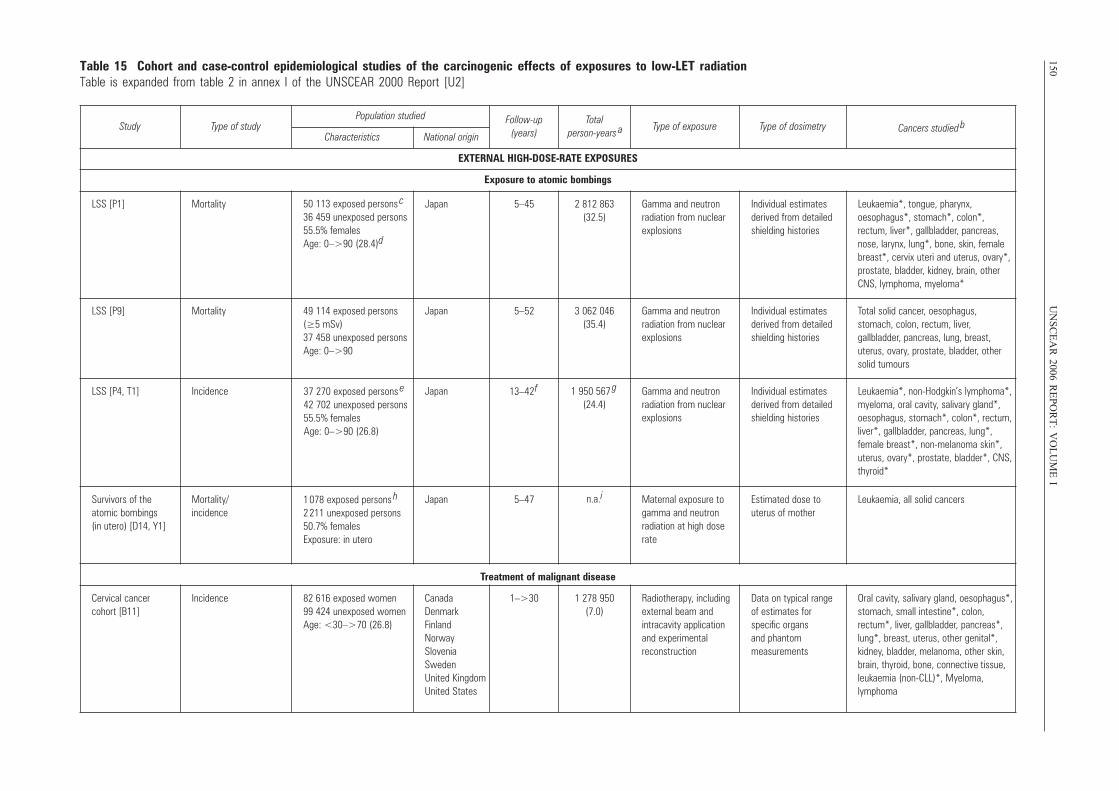
150U
NS
CE
AR
2006 RE
PO
RT
: VO
LU
ME
ITable 15 Cohort and case-control epidemiological studies of the carcinogenic effects of exposures to low-LET radiationTable is expanded from table 2 in annex I of the UNSCEAR 2000 Report [U2]
Study Type of studyPopulation studied Follow-up
(years)Total
person-years a Type of exposure Type of dosimetry Cancers studied bCharacteristics National origin
EXTERNAL HIGH-DOSE-RATE EXPOSURES
Exposure to atomic bombings
LSS [P1] Mortality 50 113 exposed persons c
36 459 unexposed persons55.5% females Age: 0–>90 (28.4)d
Japan 5–45 2 812 863 (32.5)
Gamma and neutron radiation from nuclearexplosions
Individual estimatesderived from detailedshielding histories
Leukaemia*, tongue, pharynx, oesophagus*, stomach*, colon*, rectum, liver*, gallbladder, pancreas,nose, larynx, lung*, bone, skin, femalebreast*, cervix uteri and uterus, ovary*,prostate, bladder, kidney, brain, otherCNS, lymphoma, myeloma*
LSS [P9] Mortality 49 114 exposed persons(≥5 mSv) 37 458 unexposed personsAge: 0–>90
Japan 5–52 3 062 046 (35.4)
Gamma and neutron radiation from nuclearexplosions
Individual estimatesderived from detailedshielding histories
Total solid cancer, oesophagus, stomach, colon, rectum, liver, gallbladder, pancreas, lung, breast,uterus, ovary, prostate, bladder, othersolid tumours
LSS [P4, T1] Incidence 37 270 exposed persons e
42 702 unexposed persons55.5% females Age: 0–>90 (26.8)
Japan 13–42 f 1 950 567 g
(24.4)Gamma and neutron radiation from nuclearexplosions
Individual estimatesderived from detailedshielding histories
Leukaemia*, non-Hodgkin’s lymphoma*, myeloma, oral cavity, salivary gland*, oesophagus, stomach*, colon*, rectum,liver*, gallbladder, pancreas, lung*,female breast*, non-melanoma skin*,uterus, ovary*, prostate, bladder*, CNS,thyroid*
Survivors of the atomic bombings (in utero) [D14, Y1]
Mortality/incidence
1 078 exposed persons h
2 211 unexposed persons50.7% females Exposure: in utero
Japan 5–47 n.a.i Maternal exposure togamma and neutron radiation at high dose rate
Estimated dose to uterus of mother
Leukaemia, all solid cancers
Treatment of malignant disease
Cervical cancer cohort [B11]
Incidence 82 616 exposed women 99 424 unexposed women Age: <30–>70 (26.8)
Canada Denmark Finland Norway Slovenia Sweden United Kingdom United States
1–>30 1 278 950 (7.0)
Radiotherapy, includingexternal beam and intracavity application and experimental reconstruction
Data on typical range of estimates for specific organs and phantom measurements
Oral cavity, salivary gland, oesophagus*, stomach, small intestine*, colon, rectum*, liver, gallbladder, pancreas*,lung*, breast, uterus, other genital*, kidney, bladder, melanoma, other skin,brain, thyroid, bone, connective tissue,leukaemia (non-CLL)*, Myeloma, lymphoma
UNSCEAR REPORT-PART 2.qxp 10/7/08 3:19 pm Page 150
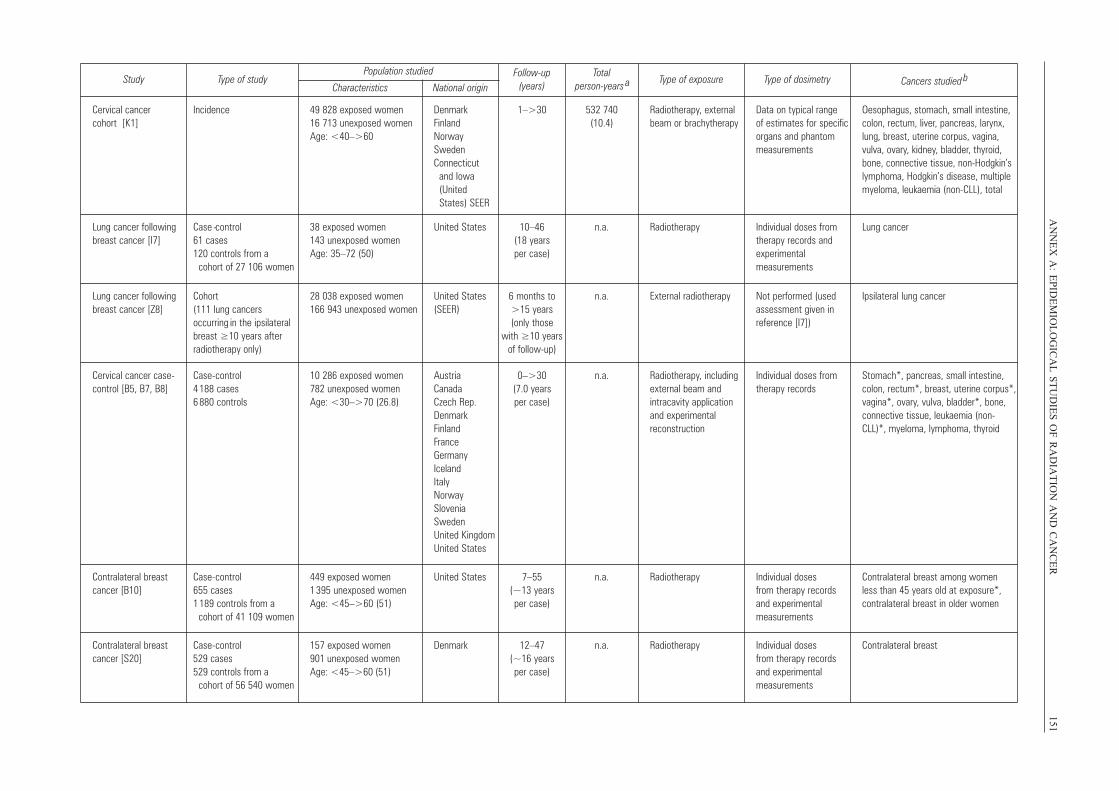
AN
NE
X A
: EP
IDE
MIO
LO
GIC
AL
ST
UD
IES
OF
RA
DIA
TIO
N A
ND
CA
NC
ER
151Study Type of study
Population studied Follow-up (years)
Total person-years a Type of exposure Type of dosimetry Cancers studied b
Characteristics National origin
Cervical cancer cohort [K1]
Incidence 49 828 exposed women 16 713 unexposed womenAge: <40–>60
Denmark Finland Norway SwedenConnecticut
and Iowa (United States) SEER
1–>30 532 740 (10.4)
Radiotherapy, externalbeam or brachytherapy
Data on typical range of estimates for specificorgans and phantommeasurements
Oesophagus, stomach, small intestine,colon, rectum, liver, pancreas, larynx,lung, breast, uterine corpus, vagina,vulva, ovary, kidney, bladder, thyroid,bone, connective tissue, non-Hodgkin’slymphoma, Hodgkin’s disease, multiplemyeloma, leukaemia (non-CLL), total
Lung cancer followingbreast cancer [I7]
Case -control 61 cases 120 controls from a
cohort of 27 106 women
38 exposed women 143 unexposed women Age: 35–72 (50)
United States 10–46 (18 years per case)
n.a. Radiotherapy Individual doses fromtherapy records andexperimental measurements
Lung cancer
Lung cancer followingbreast cancer [Z8]
Cohort (111 lung cancers occurring in the ipsilateralbreast ≥10 years after radiotherapy only)
28 038 exposed women 166 943 unexposed women
United States(SEER)
6 months to >15 years (only those
with ≥10 yearsof follow-up)
n.a. External radiotherapy Not performed (usedassessment given in reference [I7])
Ipsilateral lung cancer
Cervical cancer case-control [B5, B7, B8]
Case-control 4 188 cases 6 880 controls
10 286 exposed women 782 unexposed women Age: <30–>70 (26.8)
Austria Canada Czech Rep.Denmark Finland France Germany Iceland Italy Norway Slovenia Sweden United KingdomUnited States
0–>30 (7.0 years per case)
n.a. Radiotherapy, includingexternal beam and intracavity application and experimental reconstruction
Individual doses fromtherapy records
Stomach*, pancreas, small intestine,colon, rectum*, breast, uterine corpus*,vagina*, ovary, vulva, bladder*, bone,connective tissue, leukaemia (non-CLL)*, myeloma, lymphoma, thyroid
Contralateral breast cancer [B10]
Case-control 655 cases 1 189 controls from a
cohort of 41 109 women
449 exposed women 1 395 unexposed womenAge: <45–>60 (51)
United States 7–55 (~13 years per case)
n.a. Radiotherapy Individual dosesfrom therapy recordsand experimental measurements
Contralateral breast among women less than 45 years old at exposure*,contralateral breast in older women
Contralateral breastcancer [S20]
Case-control 529 cases529 controls from a
cohort of 56 540 women
157 exposed women 901 unexposed women Age: <45–>60 (51)
Denmark 12–47 (~16 years per case)
n.a. Radiotherapy Individual doses from therapy recordsand experimental measurements
Contralateral breast
UNSCEAR REPORT-PART 2.qxp 10/7/08 3:19 pm Page 151
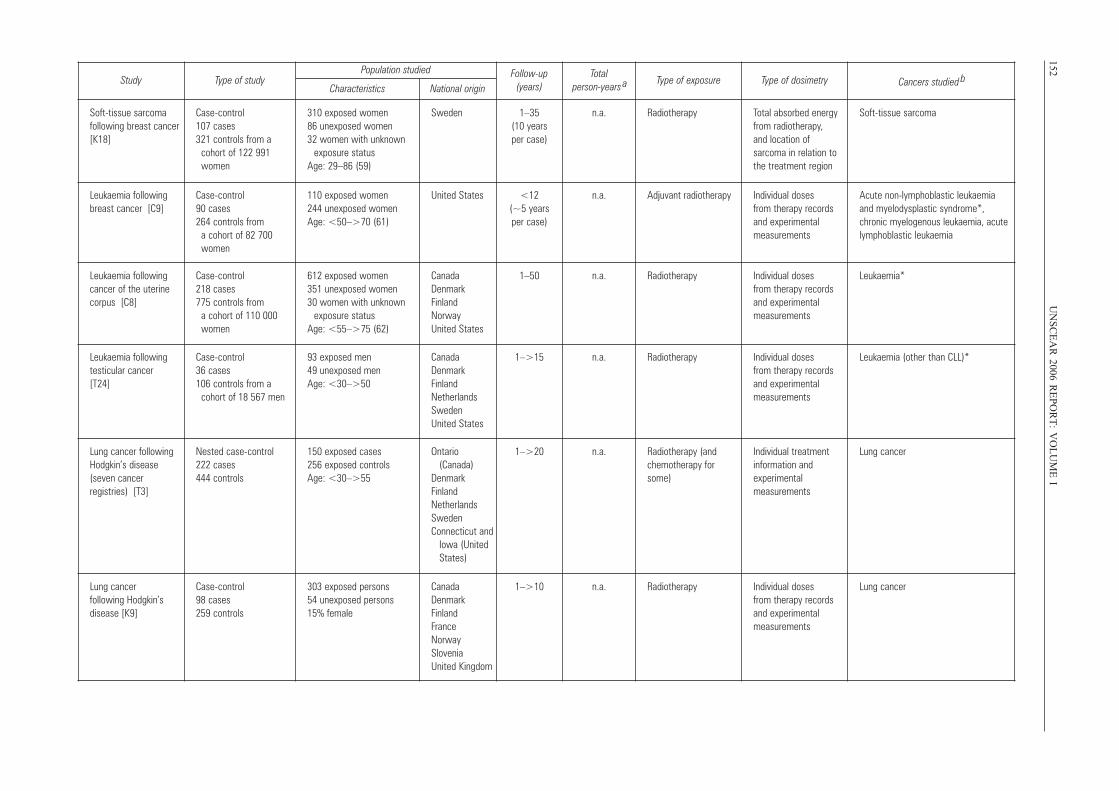
152U
NS
CE
AR
2006 RE
PO
RT
: VO
LU
ME
IStudy Type of study
Population studied Follow-up (years)
Total person-years a Type of exposure Type of dosimetry Cancers studied b
Characteristics National origin
Soft-tissue sarcoma following breast cancer[K18]
Case-control 107 cases 321 controls from a
cohort of 122 991women
310 exposed women 86 unexposed women 32 women with unknown
exposure status Age: 29–86 (59)
Sweden 1–35(10 yearsper case)
n.a. Radiotherapy Total absorbed energyfrom radiotherapy, and location of sarcoma in relation tothe treatment region
Soft-tissue sarcoma
Leukaemia followingbreast cancer [C9]
Case-control90 cases 264 controls from
a cohort of 82 700women
110 exposed women 244 unexposed women Age: <50–>70 (61)
United States <12 (~5 years per case)
n.a. Adjuvant radiotherapy Individual doses from therapy recordsand experimental measurements
Acute non-lymphoblastic leukaemia and myelodysplastic syndrome*, chronic myelogenous leukaemia, acutelymphoblastic leukaemia
Leukaemia followingcancer of the uterinecorpus [C8]
Case-control 218 cases 775 controls from
a cohort of 110 000women
612 exposed women 351 unexposed women 30 women with unknown
exposure statusAge: <55–>75 (62)
CanadaDenmark Finland Norway United States
1–50 n.a. Radiotherapy Individual doses from therapy recordsand experimental measurements
Leukaemia*
Leukaemia followingtesticular cancer [T24]
Case-control 36 cases 106 controls from a
cohort of 18 567 men
93 exposed men49 unexposed men Age: <30–>50
CanadaDenmark FinlandNetherlandsSweden United States
1–>15 n.a. Radiotherapy Individual doses from therapy recordsand experimental measurements
Leukaemia (other than CLL)*
Lung cancer followingHodgkin’s disease(seven cancer registries) [T3]
Nested case-control 222 cases 444 controls
150 exposed cases 256 exposed controls Age: <30–>55
Ontario (Canada)
Denmark FinlandNetherlandsSwedenConnecticut and
Iowa (United States)
1–>20 n.a. Radiotherapy (andchemotherapy forsome)
Individual treatmentinformation and experimental measurements
Lung cancer
Lung cancer following Hodgkin’s disease [K9]
Case-control 98 cases 259 controls
303 exposed persons 54 unexposed persons 15% female
CanadaDenmark Finland France Norway Slovenia United Kingdom
1–>10 n.a. Radiotherapy Individual dosesfrom therapy recordsand experimental measurements
Lung cancer
UNSCEAR REPORT-PART 2.qxp 10/7/08 3:19 pm Page 152
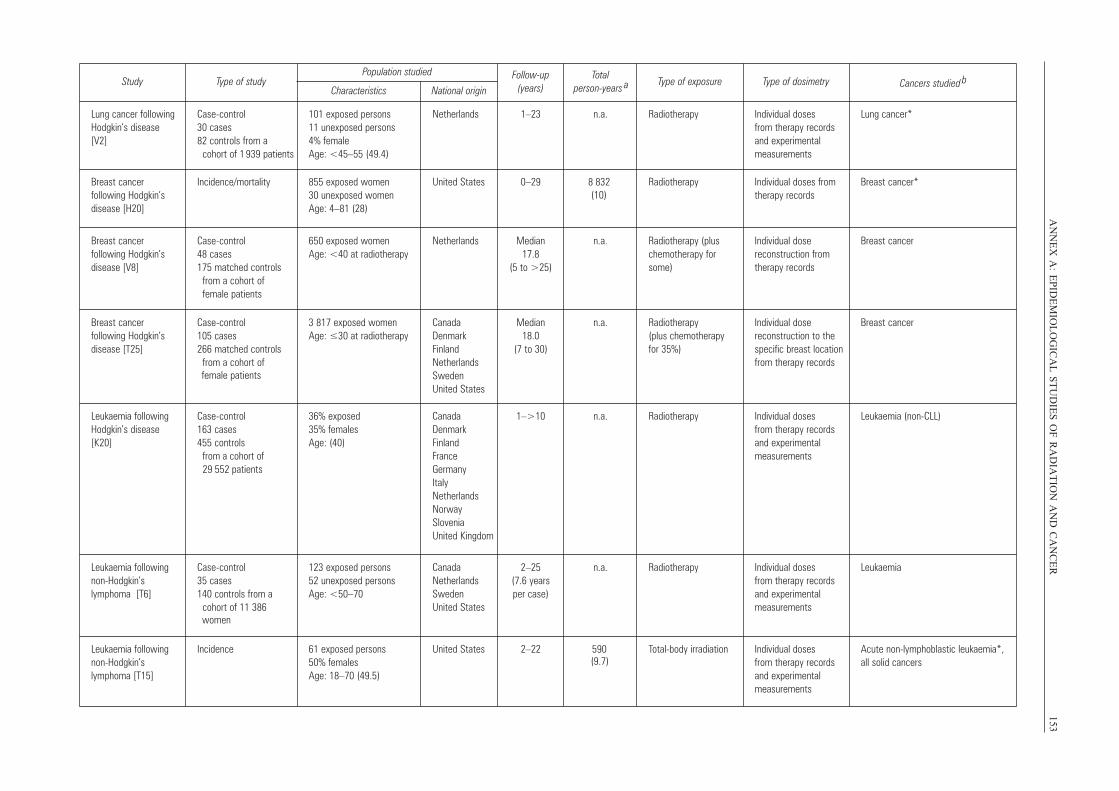
AN
NE
X A
: EP
IDE
MIO
LO
GIC
AL
ST
UD
IES
OF
RA
DIA
TIO
N A
ND
CA
NC
ER
153Study Type of study
Population studied Follow-up (years)
Total person-years a Type of exposure Type of dosimetry Cancers studied b
Characteristics National origin
Lung cancer followingHodgkin’s disease [V2]
Case-control 30 cases 82 controls from a
cohort of 1 939 patients
101 exposed persons 11 unexposed persons 4% female Age: <45–55 (49.4)
Netherlands 1–23 n.a. Radiotherapy Individual doses from therapy recordsand experimentalmeasurements
Lung cancer*
Breast cancer following Hodgkin’s disease [H20]
Incidence/ mortality 855 exposed women 30 unexposed women Age: 4–81 (28)
United States 0–29 8 832 (10)
Radiotherapy Individual doses fromtherapy records
Breast cancer*
Breast cancer following Hodgkin’s disease [V8]
Case-control 48 cases 175 matched controls
from a cohort of female patients
650 exposed women Age: <40 at radiotherapy
Netherlands Median 17.8
(5 to >25)
n.a. Radiotherapy (pluschemotherapy forsome)
Individual dose reconstruction fromtherapy records
Breast cancer
Breast cancer following Hodgkin’s disease [T25]
Case-control 105 cases 266 matched controls
from a cohort of
3 817 exposed women Age: ≤30 at radiotherapy
CanadaDenmark FinlandNetherlandsSweden United States
Median 18.0
(7 to 30)
n.a. Radiotherapy (plus chemotherapy for 35%)
Individual dose reconstruction to thespecific breast locationfrom therapy records
Breast cancer
Leukaemia followingHodgkin’s disease[K20]
Case-control 163 cases 455 controls
from a cohort of 29 552 patients
36% exposed 35% females Age: (40)
CanadaDenmark Finland France Germany ItalyNetherlandsNorway Slovenia United Kingdom
1–>10 n.a. Radiotherapy Individual doses from therapy recordsand experimentalmeasurements
Leukaemia (non-CLL)
Leukaemia followingnon- Hodgkin’s lymphoma [T6]
Case-control 35 cases 140 controls from a
cohort of 11 386 women
123 exposed persons 52 unexposed persons Age: <50–70
CanadaNetherlandsSweden United States
2–25 (7.6 years per case)
n.a. Radiotherapy Individual doses from therapy recordsand experimental measurements
Leukaemia
Leukaemia followingnon- Hodgkin’s lymphoma [T15]
Incidence 61 exposed persons 50% females Age: 18–70 (49.5)
United States 2–22 590 (9.7)
Total-body irradiation Individual doses from therapy recordsand experimental measurements
Acute non-lymphoblastic leukaemia*, all solid cancers
female patients
UNSCEAR REPORT-PART 2.qxp 10/7/08 3:19 pm Page 153
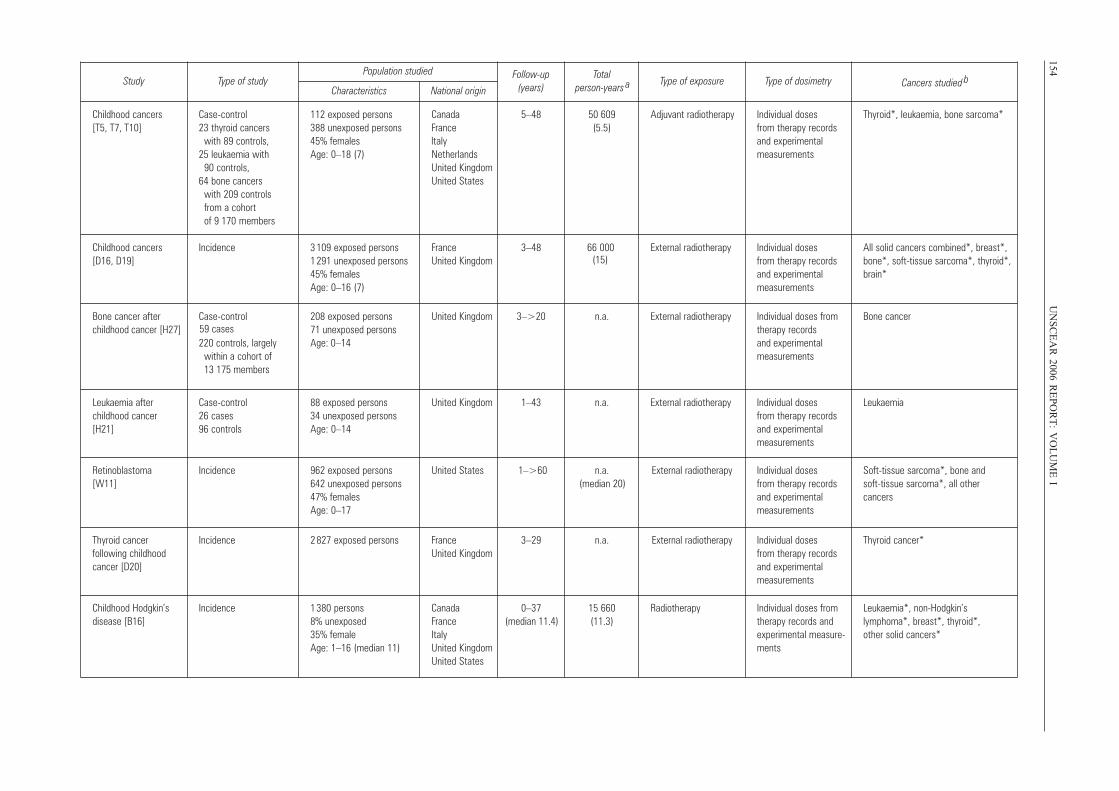
154U
NS
CE
AR
2006 RE
PO
RT
: VO
LU
ME
IStudy Type of study
Population studied Follow-up (years)
Total person-years a Type of exposure Type of dosimetry Cancers studied b
Characteristics National origin
Childhood cancers [T5, T7, T10]
Case-control 23 thyroid cancers
with 89 controls, 25 leukaemia with
90 controls, 64 bone cancers
with 209 controlsfrom a cohort of 9 170 members
112 exposed persons 388 unexposed persons 45% females Age: 0–18 (7)
Canada France
Netherlands Italy
United KingdomUnited States
5–48 50 609 (5.5)
Adjuvant radiotherapy Individual doses from therapy recordsand experimentalmeasurements
Thyroid*, leukaemia, bone sarcoma*
Childhood cancers[D16, D19]
Incidence 3 109 exposed persons 1 291 unexposed persons45% females Age: 0–16 (7)
France United Kingdom
3–48 66 000 (15)
External radiotherapy Individual doses from therapy recordsand experimental measurements
All solid cancers combined*, breast*,bone*, soft-tissue sarcoma*, thyroid*,brain*
Bone cancer after childhood cancer [H27]
Case-control 59 cases220 controls, largely
within a cohort of 13 175 members
208 exposed persons 71 unexposed persons Age: 0–14
United Kingdom 3–>20 n.a. External radiotherapy Individual doses fromtherapy records and experimentalmeasurements
Bone cancer
Leukaemia after childhood cancer [H21]
Case-control 26 cases 96 controls
88 exposed persons 34 unexposed persons Age: 0–14
United Kingdom 1–43 n.a. External radiotherapy Individual doses from therapy recordsand experimental measurements
Leukaemia
Retinoblastoma [W11]
Incidence 962 exposed persons 642 unexposed persons47% femalesAge: 0–17
United States 1–>60 n.a.(median 20)
External radiotherapy Individual doses from therapy recordsand experimental measurements
Soft-tissue sarcoma*, bone and soft-tissue sarcoma*, all other cancers
Thyroid cancer following childhood cancer [D20]
Incidence 2 827 exposed persons FranceUnited Kingdom
3–29 n.a. External radiotherapy Individual doses from therapy recordsand experimental measurements
Thyroid cancer*
Childhood Hodgkin’s disease [B16]
Incidence 1 380 persons 8% unexposed 35% female Age: 1–16 (median 11)
Canada France Italy United Kingdom United States
0–37 (median 11.4)
15 660(11.3)
Radiotherapy Individual doses fromtherapy records andexperimental measure-ments
Leukaemia*, non-Hodgkin’s lymphoma*, breast*, thyroid*, other solid cancers*
UNSCEAR REPORT-PART 2.qxp 10/7/08 3:19 pm Page 154
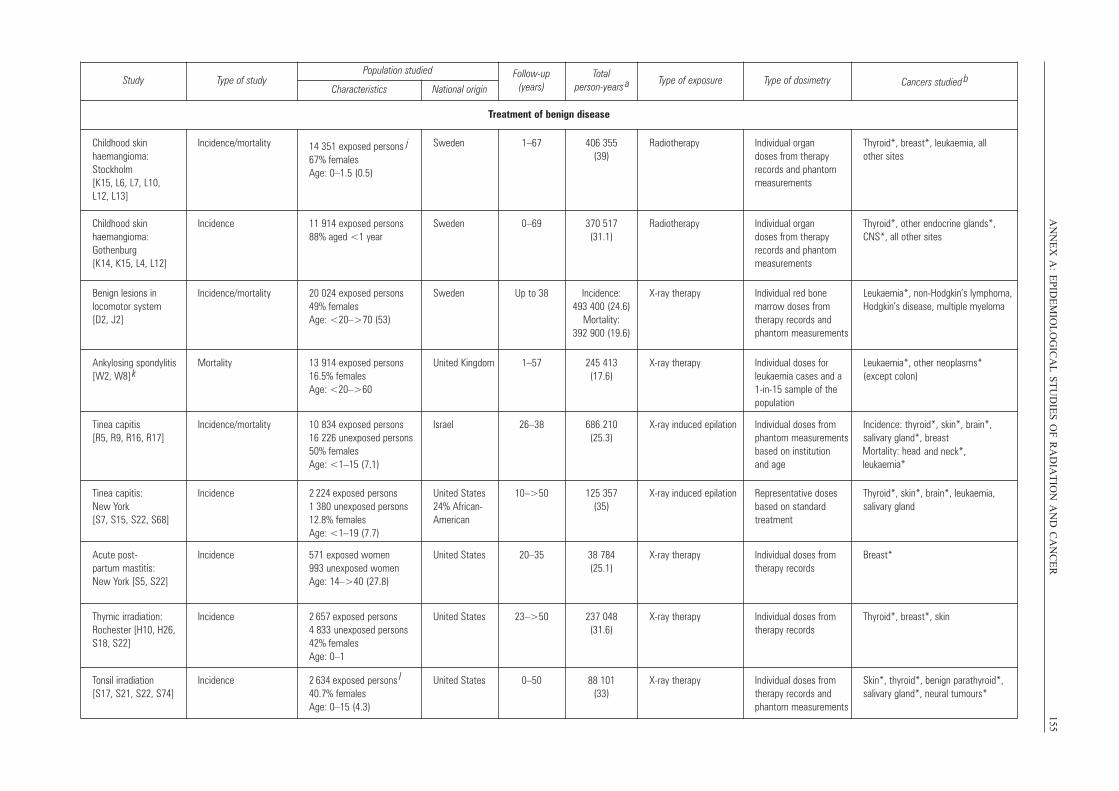
AN
NE
X A
: EP
IDE
MIO
LO
GIC
AL
ST
UD
IES
OF
RA
DIA
TIO
N A
ND
CA
NC
ER
155Study Type of study
Population studied Follow-up (years)
Total person-years a Type of exposure Type of dosimetry Cancers studied b
Characteristics National origin
Treatment of benign disease
Childhood skin haemangioma:Stockholm [K15, L6, L7, L10, L12, L13]
Incidence/mortality 14 351 exposed persons j
67% females Age: 0–1.5 (0.5)
Sweden 1–67 406 355 (39)
Radiotherapy Individual organ doses from therapyrecords and phantommeasurements
Thyroid*, breast*, leukaemia, all other sites
Childhood skin haemangioma:Gothenburg [K14, K15, L4, L12]
Incidence 11 914 exposed persons88% aged <1 year
Sweden 0–69 370 517 (31.1)
Radiotherapy Individual organ doses from therapyrecords and phantommeasurements
Thyroid*, other endocrine glands*,CNS*, all other sites
Benign lesions in locomotor system [D2, J2]
Incidence/ mortality 20 024 exposed persons49% females Age: <20–>70 (53)
Sweden Up to 38 Incidence:493 400 (24.6)
Mortality: 392 900 (19.6)
X-ray therapy Individual red bone marrow doses from therapy records andphantom measurements
Leukaemia*, non-Hodgkin’s lymphoma,Hodgkin’s disease, multiple myeloma
Ankylosing spondylitis[W2, W8] k
Mortality 13 914 exposed persons16.5% females Age: <20–>60
United Kingdom 1–57 245 413 (17.6)
X-ray therapy Individual doses forleukaemia cases and a1-in-15 sample of thepopulation
Leukaemia*, other neoplasms* (except colon)
Tinea capitis [R5, R9, R16, R17]
Incidence/ mortality 10 834 exposed persons 16 226 unexposed persons50% females Age: <1–15 (7.1)
Israel 26–38 686 210 (25.3)
X-ray induced epilation Individual doses fromphantom measurementsbased on institution and age
Incidence: thyroid*, skin*, brain*, salivary gland*, breast Mortality: head and neck*,
leukaemia*
Tinea capitis: New York [S7, S15, S22, S68]
Incidence 2 224 exposed persons 1 380 unexposed persons12.8% females Age: <1–19 (7.7)
United States24% African-American
10–>50 125 357(35)
X-ray induced epilation Representative dosesbased on standard treatment
Thyroid*, skin*, brain*, leukaemia, salivary gland
Acute post-partum mastitis: New York [S5, S22]
Incidence 571 exposed women 993 unexposed women Age: 14–>40 (27.8)
United States 20–35 38 784 (25.1)
X-ray therapy Individual doses fromtherapy records
Breast*
Thymic irradiation:Rochester [H10, H26,S18, S22]
Incidence 2 657 exposed persons 4 833 unexposed persons42% females Age: 0–1
United States 23–>50 237 048(31.6)
X-ray therapy Individual doses fromtherapy records
Thyroid*, breast*, skin
Tonsil irradiation [S17, S21, S22, S74]
Incidence 2 634 exposed persons l
40.7% females Age: 0–15 (4.3)
United States 0–50 88 101 (33)
X-ray therapy Individual doses fromtherapy records andphantom measurements
Skin*, thyroid*, benign parathyroid*,salivary gland*, neural tumours*
UNSCEAR REPORT-PART 2.qxp 10/7/08 3:19 pm Page 155
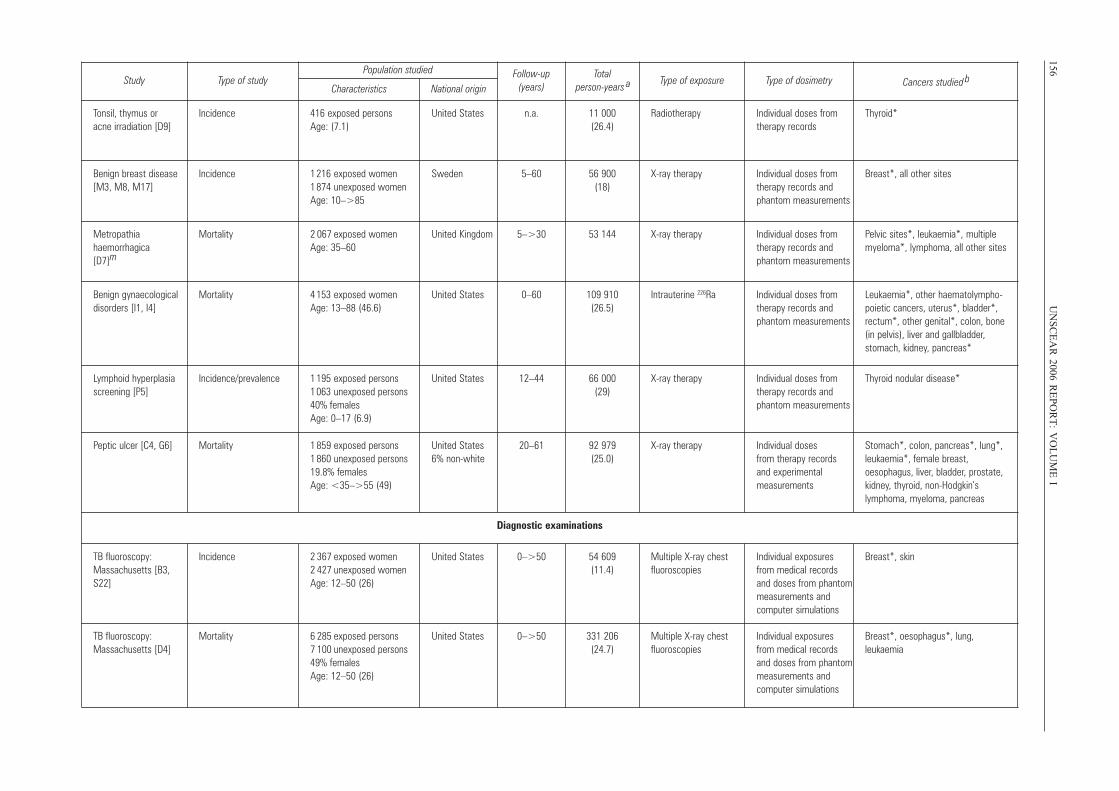
156U
NS
CE
AR
2006 RE
PO
RT
: VO
LU
ME
IStudy T ype of s tudy
P opulation studied Follow-up (years)
T otal person-year s a
T ype of exposur e T ype of dosimetr y Cancers studied bCharacteristics National origi n
T onsil, thymus or acne irradiation [D9]
Incidence 416 exposed persons Age: ( 7.1)
United States n.a. 11 000 (26.4)
Radiotherapy Individual doses from therapy records
Thyroid*
Benign breast disease [M3, M 8, M 17]
Incidence 1 216 exposed women 1 874 unexposed womenAge: 10–>85
Sweden 5–60 56 900 (18)
X-ray therapy Individual doses from therapy records and phantom measurement s
Breast*, all other sites
Metropathia haemorrhagica [D7] m
Mortalit y 2 067 exposed women Age: 35–60
United Kingdom 5–>30 53 144 X-ray therapy Individual doses from therapy records and phantom measurement s
Pe lvic s ites*, l euk aemia*, multiplemyeloma*, l ymphoma, a ll other sites
Benign gynaecological disorders [I1, I4]
Mortalit y 4 153 exposed women Age: 13–88 (46.6)
United States 0–60 109 910 (26.5)
Intrauterine 226Ra Individual doses from therapy records and phantom measurement s
Leuk aemia*, other haematolympho - poietic cancers, uterus*, b ladder*, rectum*, other genital*, colon, bone (in pelvis), liver and gallbladder , stomach, k idney , pancreas*
Ly mphoid hyperplasi a screening [P5]
Incidence/ prevalence 1 195 exposed persons 1 063 unexposed persons40% females Age: 0–17 (6.9)
United States 12–44 66 000 (29)
X-ray therapy Individual doses from therapy records and phantom measurement s
Thyroid nodular disease*
P eptic ulcer [C4, G6] Mortalit y 1 859 exposed persons 1 860 unexposed persons19.8% females Age: < 35–>55 (49)
United States 6% non-white
20–61 92 979 (25.0)
X-ray therapy Individual doses from therapy records and experimental measurement s
Stomach*, colon, pancreas*, l ung*, leuk aemia*, female breast, oesophagus, liver , bladder , prostate, kidney , thyroid, non-Hodgki n’ s lymphoma, m yeloma, pancreas
Diagnostic examinations
TB fluoroscopy: Massachusetts [ B3, S22]
Incidence 2 367 exposed women 2 427 unexposed womenAge: 12–50 (26)
United States 0–>50 54 609 (11.4)
Multiple X-ray chest fluoroscopies
Individual exposures from m edical r ecords and doses from phantom measurements and computer s imulations
Breast*, ski n
TB fluoroscopy: Massachusetts [ D4]
Mortalit y 6 285 exposed persons 7 100 unexposed persons49% females Age: 12–50 (26)
United States 0–>50 331 206 (24.7)
Multiple X-ray chest fluoroscopies
Individual exposures from m edical r ecords and doses from phantom measurements and computer s imulations
Breast*, oesophagus*, l ung , leuk aemi a
UNSCEAR REPORT-PART 2.qxp 10/7/08 3:19 pm Page 156
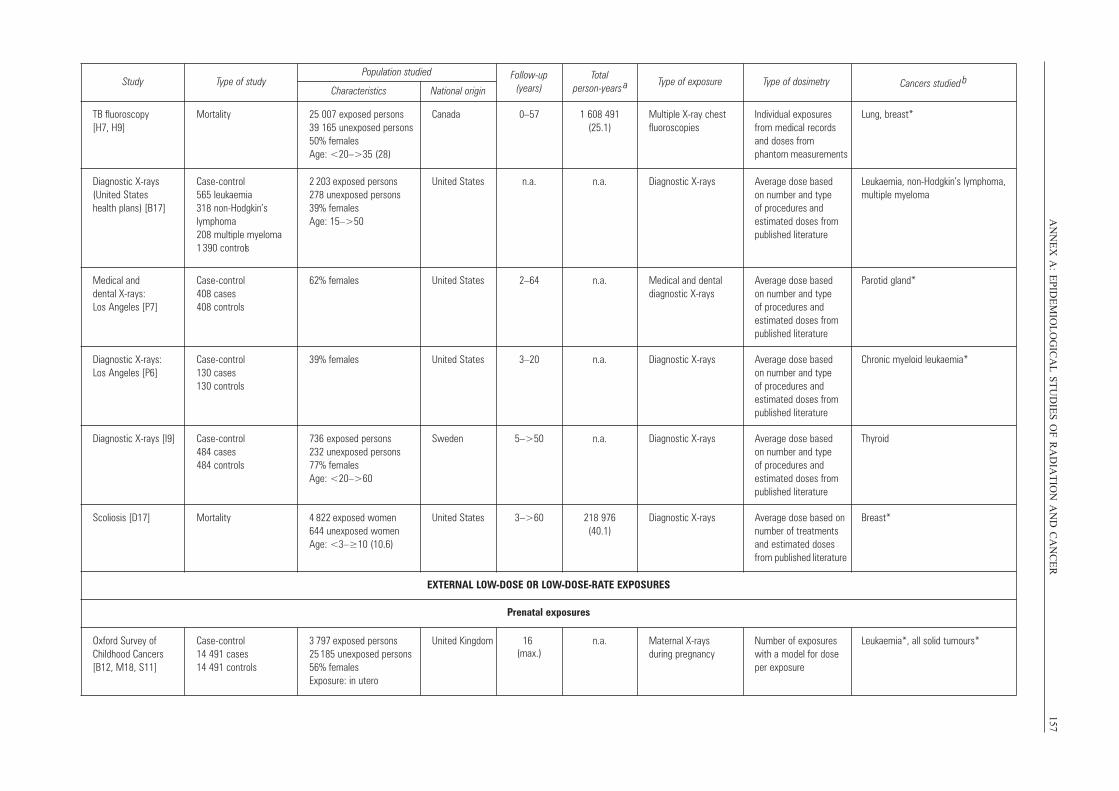
AN
NE
X A
: EP
IDE
MIO
LO
GIC
AL
ST
UD
IES
OF
RA
DIA
TIO
N A
ND
CA
NC
ER
157Study T ype of s tudy
P opulation studied Follow-up (years)
To tal person-year s a
T ype of exposure T ype of dosimetr y Cancers studied bCharacteristics National origi n
TB fluoroscopy [H7, H9]
Mortalit y 25 007 exposed persons 39 165 unexposed persons 50% females Age: < 20–>35 (28)
Canada 0–57 1 608 491 (25.1)
Multiple X-ray chest fluoroscopies
Individual exposures from m edical r ecords and doses from phantom measurements
Lung , breast*
Diagnostic X-rays (United States health plans) [B17]
Case - control 565 leuk aemia 318 non-Hodgki n’ s lymphoma 208 multiple m yelom a 1 390 controls
2 203 exposed persons 278 unexposed persons39% females Age: 15–>50
United States n.a. n.a. Diagnostic X-rays A verage dose based on number and type of procedures and estimated doses from published literature
Leuk aemia, non-Hodgki n’ s lymphoma, multiple m yelom a
Medical and dental X-rays: Los Angeles [P7]
Case - control 408 cases 408 control s
62% females United States 2–6 4 n.a. Medical and dental diagnostic X-rays
A verage dose based on number and type of procedures and estimated doses fro m published literature
P arotid gland*
Diagnostic X-rays: Los Angeles [P6 ]
Case - control 130 cases 130 control s
39% females United States 3–20 n.a. Diagnostic X-rays A verage dose based on number and type of procedures and estimated doses fro m published literature
Chronic myeloid leuk aemia*
Diagnostic X-rays [I9] Case - control 484 cases 484 control s
736 exposed persons 232 unexposed persons 77% females Age: < 20–>6 0
Sweden 5–>50 n.a. Diagnostic X-rays A verage dose based on number and type of procedures and estimated doses fro m published literature
Thyroi d
Scoliosis [D17] Mortalit y 4 822 exposed women 644 unexposed women Age: < 3–≥10 (10.6 )
United States 3–>6 0 218 976 (40.1)
Diagnostic X-rays A verage dose based on number o f treatments and estimated doses from published literature
Breast *
EXTERNAL L OW -DOSE OR LO W- DOSE-RA TE EXPOSURES
P renatal exposures
Oxford Survey of Childhood Cancer s [B12, M 18, S11]
Case - control 14 491 cases 14 491 control s
3 797 exposed persons 25 185 unexposed persons56% females Exposure: i n utero
United Kingdom 16 (max.)
n.a. Maternal X-rays during pregnancy
Number o f exposures with a model f or dose per exposur e
Leuk aemia*, a ll solid tumours*
UNSCEAR REPORT-PART 2.qxp 10/7/08 3:19 pm Page 157
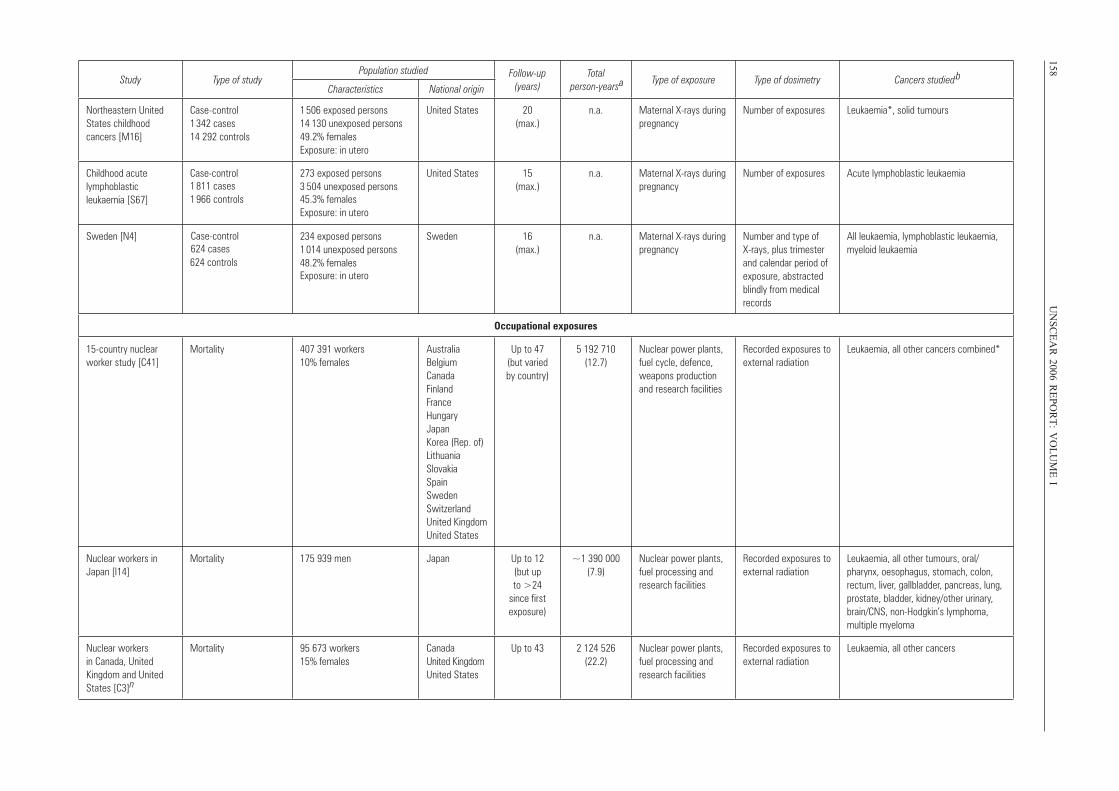
158U
NS
CE
AR
2006 RE
PO
RT
: VO
LU
ME
IStudy Type of study
Population studied Follow-up (years)
Total person-yearsa Type of exposure Type of dosimetry Cancers studiedb
Characteristics National origin
Northeastern United States childhood cancers [M16]
Case-control 1 342 cases 14 292 controls
1 506 exposed persons 14 130 unexposed persons 49.2% females Exposure: in utero
United States 20 (max.)
n.a. Maternal X-rays during pregnancy
Number of exposures Leukaemia*, solid tumours
Childhood acute lymphoblastic leukaemia [S67]
Case-control1 811 cases1 966 controls
273 exposed persons 3 504 unexposed persons 45.3% females Exposure: in utero
United States 15 (max.)
n.a. Maternal X-rays during pregnancy
Number of exposures Acute lymphoblastic leukaemia
Sweden [N4]
624 controls
234 exposed persons 1 014 unexposed persons 48.2% females Exposure: in utero
Sweden 16 (max.)
n.a. Maternal X-rays during pregnancy
Number and type of X-rays, plus trimester and calendar period of exposure, abstracted blindly from medical records
All leukaemia, lymphoblastic leukaemia, myeloid leukaemia
Occupational exposures
15-country nuclear worker study [C41]
Mortality 407 391 workers 10% females
Australia Belgium Canada Finland France Hungary Japan Korea (Rep. of) Lithuania Slovakia Spain Sweden Switzerland United Kingdom United States
Up to 47 (but varied by country)
5 192 710 (12.7)
Nuclear power plants, fuel cycle, defence, weapons production and research facilities
Recorded exposures to external radiation
Leukaemia, all other cancers combined*
Nuclear workers in Japan [I14]
Mortality 175 939 men Japan Up to 12 (but up to >24
since first exposure)
~1 390 000 (7.9)
Nuclear power plants, fuel processing and research facilities
Recorded exposures to external radiation
Leukaemia, all other tumours, oral/pharynx, oesophagus, stomach, colon, rectum, liver, gallbladder, pancreas, lung, prostate, bladder, kidney/other urinary, brain/CNS, non-Hodgkin’s lymphoma, multiple myeloma
Nuclear workers in Canada, United Kingdom and United States [C3]n
Mortality 95 673 workers 15% females
Canada United Kingdom United States
Up to 43 2 124 526 (22.2)
Nuclear power plants, fuel processing and research facilities
Recorded exposures to external radiation
Leukaemia, all other cancers
Case-control 624 cases
UNSCEAR REPORT-PART 2.qxp 10/7/08 3:19 pm Page 158
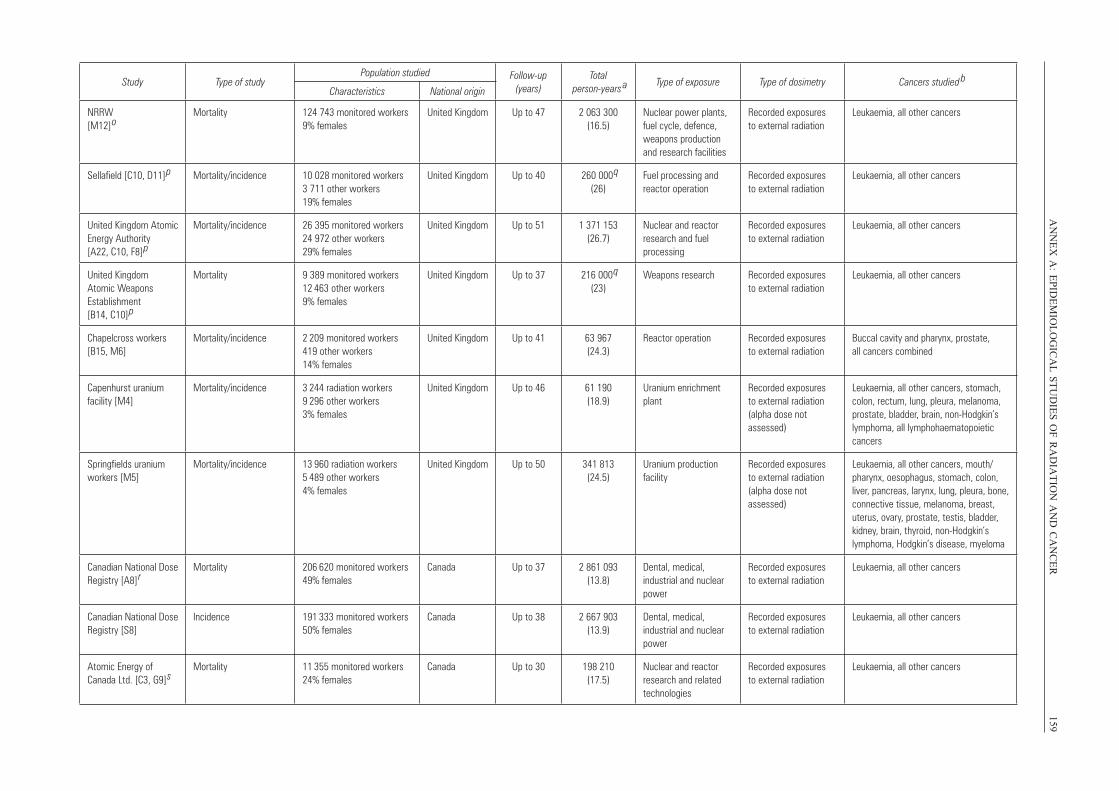
AN
NE
X A
: EP
IDE
MIO
LO
GIC
AL
ST
UD
IES
OF
RA
DIA
TIO
N A
ND
CA
NC
ER
159Study Type of study
Population studied Follow-up (years)
Total person-years
a Type of exposure Type of dosimetry Cancers studied b
Characteristics National origin
NRRW [M12]
oMortality 124 743 monitored workers
9% femalesUnited Kingdom Up to 47 2 063 300
(16.5)Nuclear power plants, fuel cycle, defence, weapons production and research facilities
Recorded exposures to external radiation
Leukaemia, all other cancers
Sellafield [C10, D11]
p Mortality/incidence 10 028 monitored workers 3 711 other workers 19% females
United Kingdom Up to 40 260 000
q
(26)Fuel processing and reactor operation
Recorded exposures to external radiation
Leukaemia, all other cancers
United Kingdom Atomic Energy Authority [A22, C10, F8]
p
Mortality/incidence 26 395 monitored workers 24 972 other workers 29% females
United Kingdom Up to 51 1 371 153 (26.7)
Nuclear and reactor research and fuel processing
Recorded exposures to external radiation
Leukaemia, all other cancers
United Kingdom Atomic Weapons Establishment [B14, C10]
p
Mortality 9 389 monitored workers 12 463 other workers 9% females
United Kingdom Up to 37 216 000
q (23)
Weapons research Recorded exposures to external radiation
Leukaemia, all other cancers
Chapelcross workers [B15, M6]
Mortality/incidence 2 209 monitored workers419 other workers 14% females
United Kingdom Up to 41 63 967 (24.3)
Reactor operation Recorded exposures to external radiation
Buccal cavity and pharynx, prostate, all cancers combined
Capenhurst uranium facility [M4]
Mortality/incidence 3 244 radiation workers 9 296 other workers3% females
United Kingdom Up to 46 61 190 (18.9)
Uranium enrichment plant
Recorded exposures to external radiation (alpha dose not assessed)
Leukaemia, all other cancers, stomach, colon, rectum, lung, pleura, melanoma, prostate, bladder, brain, non-Hodgkin’s lymphoma, all lymphohaematopoietic cancers
Springfields uranium workers [M5]
Mortality/incidence 13 960 radiation workers5 489 other workers4% females
United Kingdom Up to 50 341 813 (24.5)
Uranium production facility
Recorded exposures to external radiation (alpha dose not assessed)
Leukaemia, all other cancers, mouth/ pharynx, oesophagus, stomach, colon, liver, pancreas, larynx, lung, pleura, bone, connective tissue, melanoma, breast, uterus, ovary, prostate, testis, bladder, kidney, brain, thyroid, non-Hodgkin’s lymphoma, Hodgkin’s disease, myeloma
Canadian National Dose Registry [A8]
rMortality 206 620 monitored workers
49% femalesCanada Up to 37 2 861 093
(13.8)Dental, medical, industrial and nuclear power
Recorded exposures to external radiation
Leukaemia, all other cancers
Canadian National Dose Registry [S8]
Incidence 191 333 monitored workers 50% females
Canada Up to 38 2 667 903 (13.9)
Dental, medical, industrial and nuclear power
Recorded exposures to external radiation
Leukaemia, all other cancers
Atomic Energy of Canada Ltd. [C3, G9]
sMortality 11 355 monitored workers
24% femalesCanada Up to 30 198 210
(17.5)Nuclear and reactor research and related technologies
Recorded exposures to external radiation
Leukaemia, all other cancers
UNSCEAR REPORT-PART 2.qxp 10/7/08 3:19 pm Page 159
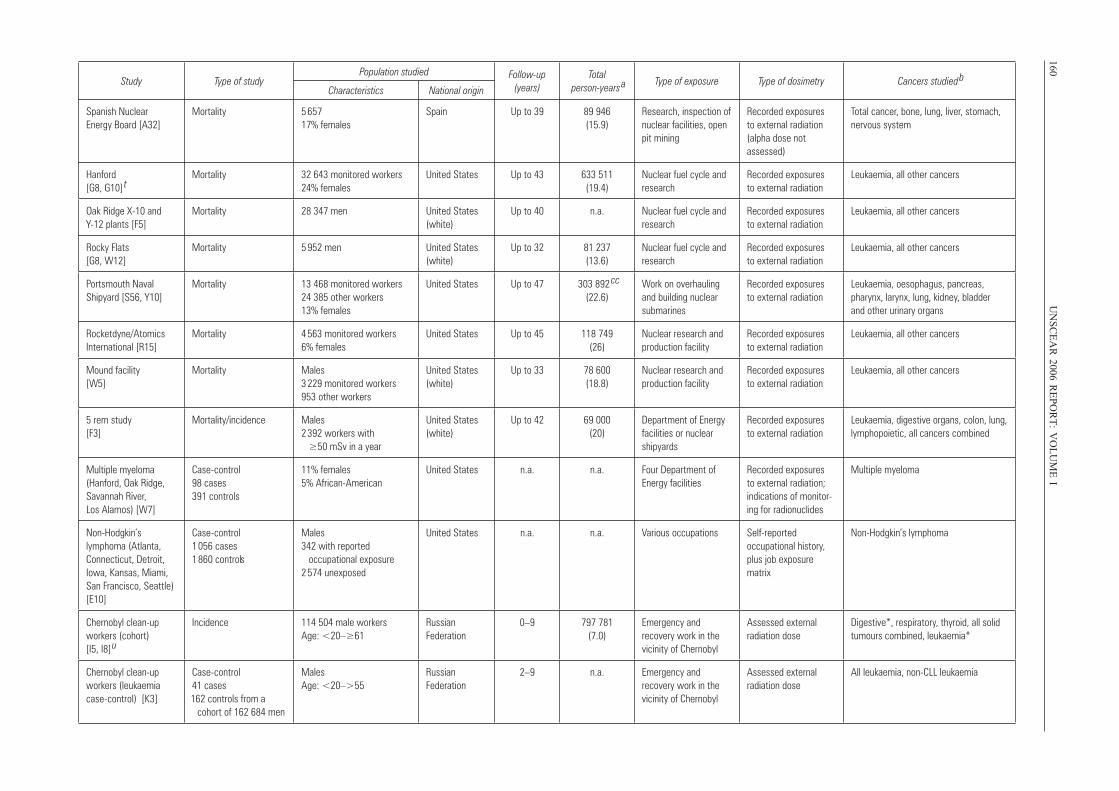
160U
NS
CE
AR
2006 RE
PO
RT
: VO
LU
ME
IStudy Type of study
Population studied Follow-up (years)
Total person-years
a Type of exposure Type of dosimetry Cancers studied b
Characteristics National origin
Spanish Nuclear Energy Board [A32]
Mortality 5 657 17% females
Spain Up to 39 89 946 (15.9)
Research, inspection of nuclear facilities, open pit mining
Recorded exposures to external radiation (alpha dose not assessed)
Total cancer, bone, lung, liver, stomach, nervous system
Hanford [G8, G10]
t Mortality 32 643 monitored workers
24% femalesUnited States Up to 43 633 511
(19.4)Nuclear fuel cycle and research
Recorded exposures to external radiation
Leukaemia, all other cancers
Oak Ridge X-10 and Y-12 plants [F5]
Mortality 28 347 men United States (white)
Up to 40 n.a. Nuclear fuel cycle and research
Recorded exposures to external radiation
Leukaemia, all other cancers
Rocky Flats [G8, W12]
Mortality 5 952 men United States (white)
Up to 32 81 237 (13.6)
Nuclear fuel cycle and research
Recorded exposures to external radiation
Leukaemia, all other cancers
Portsmouth Naval Shipyard [S56, Y10]
Mortality 13 468 monitored workers 24 385 other workers 13% females
United States Up to 47 303 892 cc
(22.6)Work on overhauling and building nuclear submarines
Recorded exposures to external radiation
Leukaemia, oesophagus, pancreas, pharynx, larynx, lung, kidney, bladder and other urinary organs
Rocketdyne/Atomics International [R15]
Mortality 4 563 monitored workers6% females
United States Up to 45 118 749 (26)
Nuclear research and production facility
Recorded exposures to external radiation
Leukaemia, all other cancers
Mound facility [W5]
Mortality Males3 229 monitored workers953 other workers
United States (white)
Up to 33 78 600 (18.8)
Nuclear research and production facility
Recorded exposures to external radiation
Leukaemia, all other cancers
5 rem study [F3]
Mortality/incidence Males 2 392 workers with ≥50 mSv in a year
United States (white)
Up to 42 69 000 (20)
Department of Energy facilities or nuclear shipyards
Recorded exposures to external radiation
Leukaemia, digestive organs, colon, lung, lymphopoietic, all cancers combined
Multiple myeloma (Hanford, Oak Ridge, Savannah River, Los Alamos) [W7]
Case-control 98 cases 391 controls
11% females 5% African-American
United States n.a. n.a. Four Department of Energy facilities
Recorded exposures to external radiation; indications of monitor-ing for radionuclides
Multiple myeloma
Non-Hodgkin’s lymphoma (Atlanta, Connecticut, Detroit, Iowa, Kansas, Miami, San Francisco, Seattle) [E10]
Case-control 1 056 cases 1 860 controls
Males 342 with reported occupational exposure 2 574 unexposed
United States n.a. n.a. Various occupations Self-reported occupational history, plus job exposure matrix
Non-Hodgkin’s lymphoma
Chernobyl clean-up workers (cohort) [I5, I8]
u
Incidence 114 504 male workers Age: <20–≥61
Russian Federation
0–9 797 781 (7.0)
Emergency and recovery work in the vicinity of Chernobyl
Assessed external radiation dose
Digestive*, respiratory, thyroid, all solid tumours combined, leukaemia*
Chernobyl clean-up workers (leukaemia case-control) [K3]
Case-control 41 cases 162 controls from a
cohort of 162 684 men
Males Age: <20–>55
Russian Federation
2–9 n.a. Emergency and recovery work in the vicinity of Chernobyl
Assessed external radiation dose
All leukaemia, non-CLL leukaemia
UNSCEAR REPORT-PART 2.qxp 10/7/08 3:19 pm Page 160
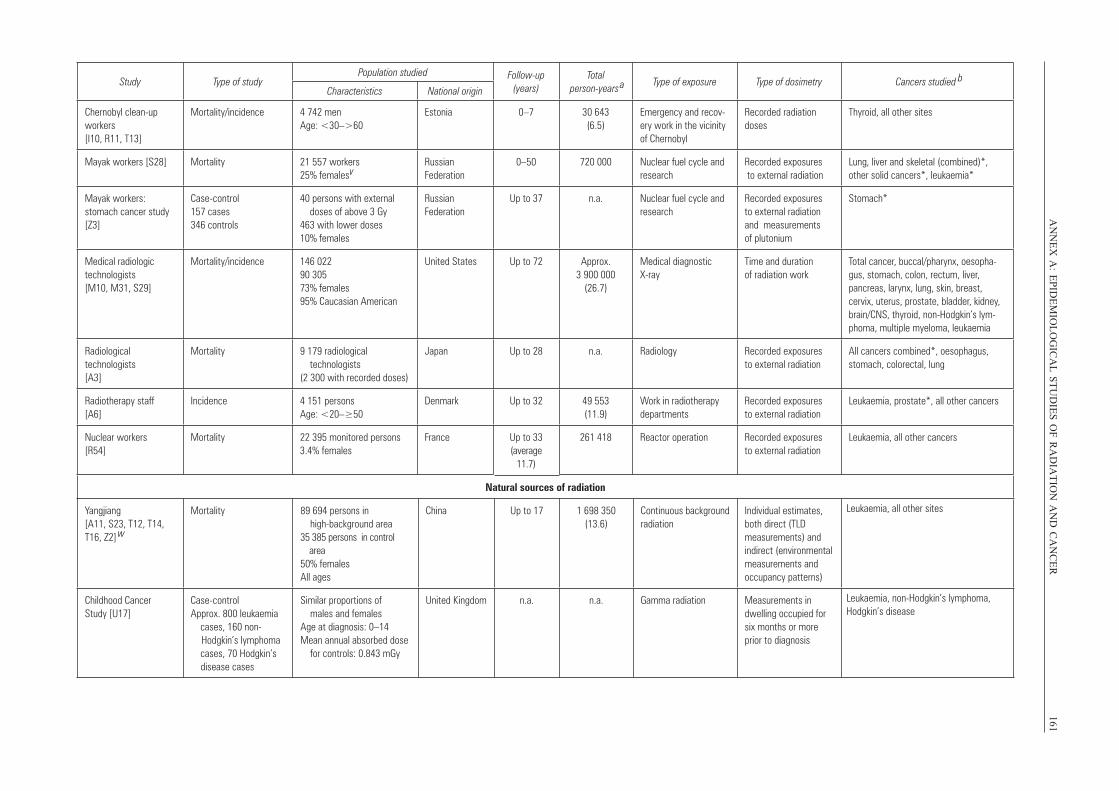
AN
NE
X A
: EP
IDE
MIO
LO
GIC
AL
ST
UD
IES
OF
RA
DIA
TIO
N A
ND
CA
NC
ER
161Study Type of study
Population studied Follow-up (years)
Total person-years
a Type of exposure Type of dosimetry Cancers studied b
Characteristics National origin
Chernobyl clean-up workers [I10, R11, T13]
Mortality/incidence 4 742 men Age: <30–>60
Estonia 0–7 30 643 (6.5)
Emergency and recov-ery work in the vicinity of Chernobyl
Recorded radiation doses
Thyroid, all other sites
Mayak workers [S28] Mortality 21 557 workers 25% femalesv
Russian Federation
0–50 720 000 Nuclear fuel cycle and research
Recorded exposures to external radiation
Lung, liver and skeletal (combined)*, other solid cancers*, leukaemia*
Mayak workers: stomach cancer study [Z3]
Case-control 157 cases 346 controls
40 persons with external doses of above 3 Gy 463 with lower doses 10% females
Russian Federation
Up to 37 n.a. Nuclear fuel cycle and research
Recorded exposures to external radiation and measurements of plutonium
Stomach*
Medical radiologic technologists [M10, M31, S29]
Mortality/incidence 146 022 90 305 73% females 95% Caucasian American
United States Up to 72 Approx. 3 900 000
(26.7)
Medical diagnostic X-ray
Time and duration of radiation work
Total cancer, buccal/pharynx, oesopha-gus, stomach, colon, rectum, liver, pancreas, larynx, lung, skin, breast, cervix, uterus, prostate, bladder, kidney, brain/CNS, thyroid, non-Hodgkin’s lym-phoma, multiple myeloma, leukaemia
Radiological technologists [A3]
Mortality 9 179 radiological technologists (2 300 with recorded doses)
Japan Up to 28 n.a. Radiology Recorded exposures to external radiation
All cancers combined*, oesophagus, stomach, colorectal, lung
Radiotherapy staff [A6]
Incidence 4 151 persons Age: <20–≥50
Denmark Up to 32 49 553 (11.9)
Work in radiotherapy departments
Recorded exposures to external radiation
Leukaemia, prostate*, all other cancers
Nuclear workers [R54]
Mortality 22 395 monitored persons 3.4% females
France Up to 33 (average
11.7)
261 418 Reactor operation Recorded exposures to external radiation
Leukaemia, all other cancers
Natural sources of radiation
Yangjiang [A11, S23, T12, T14, T16, Z2]
w
Mortality 89 694 persons in high-background area 35 385 persons in control area 50% females All ages
China Up to 17 1 698 350(13.6)
Continuous background radiation
Individual estimates, both direct (TLD measurements) and indirect (environmental measurements and occupancy patterns)
Leukaemia, all other sites
Childhood Cancer Study [U17]
Case-control Approx. 800 leukaemia cases, 160 non-
Hodgkin’s lymphoma cases, 70 Hodgkin’s
disease cases
Similar proportions of males and females Age at diagnosis: 0–14Mean annual absorbed dose for controls: 0.843 mGy
United Kingdom n.a. n.a. Gamma radiation Measurements in dwelling occupied for six months or more prior to diagnosis
Leukaemia, non-Hodgkin’s lymphoma, Hodgkin’s disease
UNSCEAR REPORT-PART 2.qxp 10/7/08 3:19 pm Page 161
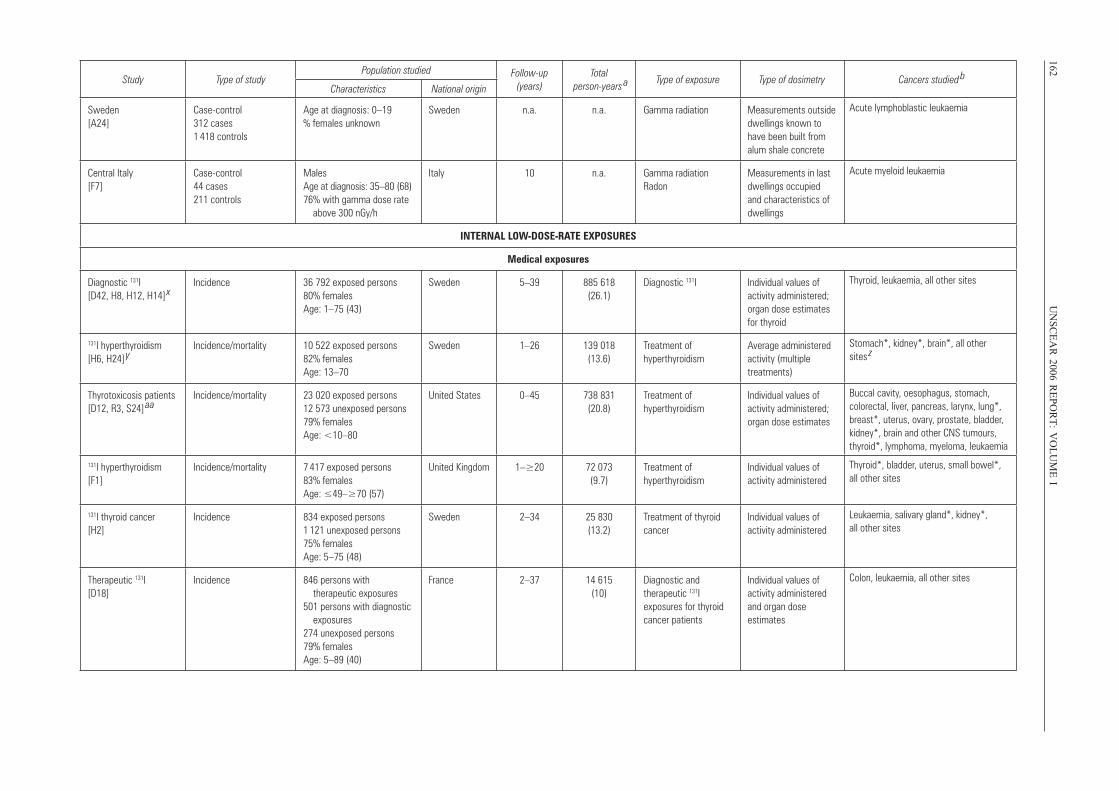
162U
NS
CE
AR
2006 RE
PO
RT
: VO
LU
ME
IStudy Type of study
Population studied Follow-up (years)
Total person-years
a Type of exposure Type of dosimetry Cancers studied b
Characteristics National origin
Sweden [A24]
Case-control 312 cases 1 418 controls
Age at diagnosis: 0–19 % females unknown
Sweden n.a. n.a. Gamma radiation Measurements outside dwellings known to have been built from alum shale concrete
Acute lymphoblastic leukaemia
Central Italy [F7]
Case-control 44 cases 211 controls
Males Age at diagnosis: 35–80 (68) 76% with gamma dose rate above 300 nGy/h
Italy 10 n.a. Gamma radiationRadon
Measurements in last dwellings occupied and characteristics of dwellings
Acute myeloid leukaemia
INTERNAL LOW-DOSE-RATE EXPOSURES
Medical exposures
Diagnostic 131I [D42, H8, H12, H14]
xIncidence 36 792 exposed persons
80% females Age: 1–75 (43)
Sweden 5–39 885 618 (26.1)
Diagnostic 131I Individual values of activity administered; organ dose estimates for thyroid
Thyroid, leukaemia, all other sites
131I hyperthyroidism [H6, H24]
yIncidence/mortality 10 522 exposed persons
82% females Age: 13–70
Sweden 1–26 139 018 (13.6)
Treatment of hyperthyroidism
Average administered activity (multiple treatments)
Stomach*, kidney*, brain*, all other sites
z
Thyrotoxicosis patients [D12, R3, S24]
aaIncidence/mortality 23 020 exposed persons
12 573 unexposed persons 79% females Age: <10–80
United States 0–45 738 831 (20.8)
Treatment of hyperthyroidism
Individual values of activity administered; organ dose estimates
Buccal cavity, oesophagus, stomach, colorectal, liver, pancreas, larynx, lung*, breast*, uterus, ovary, prostate, bladder, kidney*, brain and other CNS tumours, thyroid*, lymphoma, myeloma, leukaemia
131I hyperthyroidism [F1]
Incidence/mortality 7 417 exposed persons 83% females Age: ≤49–≥70 (57)
United Kingdom 1–≥20 72 073 (9.7)
Treatment of hyperthyroidism
Individual values of activity administered
Thyroid*, bladder, uterus, small bowel*, all other sites
131I thyroid cancer [H2]
Incidence 834 exposed persons 1 121 unexposed persons 75% females Age: 5–75 (48)
Sweden 2–34 25 830 (13.2)
Treatment of thyroid cancer
Individual values of activity administered
Leukaemia, salivary gland*, kidney*, all other sites
Therapeutic 131I [D18]
Incidence 846 persons with therapeutic exposures 501 persons with diagnostic exposures 274 unexposed persons 79% females Age: 5–89 (40)
France 2–37 14 615 (10)
Diagnostic and therapeutic 131I exposures for thyroid cancer patients
Individual values of activity administered and organ dose estimates
Colon, leukaemia, all other sites
UNSCEAR REPORT-PART 2.qxp 10/7/08 3:19 pm Page 162
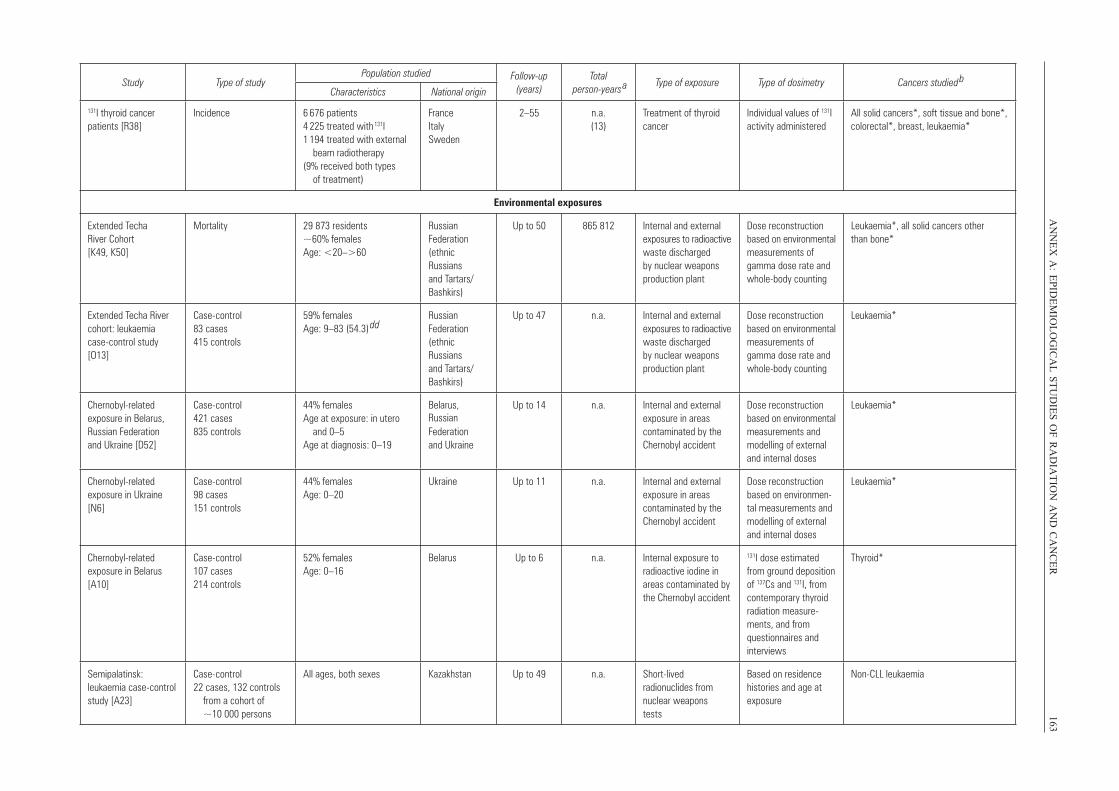
AN
NE
X A
: EP
IDE
MIO
LO
GIC
AL
ST
UD
IES
OF
RA
DIA
TIO
N A
ND
CA
NC
ER
163
Study Type of studyPopulation studied Follow-up
(years)Total
person-years a Type of exposure Type of dosimetry Cancers studied
bCharacteristics National origin
131I thyroid cancer patients [R38]
Incidence 6 676 patients 4 225 treated with 131I 1 194 treated with external beam radiotherapy (9% received both types of treatment)
France Italy Sweden
2–55 n.a.(13)
Treatment of thyroid cancer
Individual values of 131I activity administered
All solid cancers*, soft tissue and bone*, colorectal*, breast, leukaemia*
Environmental exposures
Extended Techa River Cohort [K49, K50]
Mortality 29 873 residents ~60% females Age: <20–>60
Russian Federation (ethnic Russians and Tartars/ Bashkirs)
Up to 50 865 812 Internal and external exposures to radioactive waste discharged by nuclear weapons production plant
Dose reconstruction based on environmental measurements of gamma dose rate and whole-body counting
Leukaemia*, all solid cancers other than bone*
Extended Techa River cohort: leukaemia case-control study [O13]
Case-control83 cases 415 controls
59% females Age: 9–83 (54.3)
ddRussian Federation (ethnic Russians and Tartars/ Bashkirs)
Up to 47 n.a. Internal and external exposures to radioactive waste discharged by nuclear weapons production plant
Dose reconstruction based on environmental measurements of gamma dose rate and whole-body counting
Leukaemia*
Chernobyl-related exposure in Belarus, Russian Federation and Ukraine [D52]
Case-control 421 cases 835 controls
44% females Age at exposure: in utero and 0–5 Age at diagnosis: 0–19
Belarus, RussianFederation and Ukraine
Up to 14 n.a. Internal and external exposure in areas contaminated by the Chernobyl accident
Dose reconstruction based on environmental measurements and modelling of external and internal doses
Leukaemia*
Chernobyl-related exposure in Ukraine [N6]
Case-control 98 cases 151 controls
44% females Age: 0–20
Ukraine Up to 11 n.a. Internal and external exposure in areas contaminated by the Chernobyl accident
Dose reconstruction based on environmen-tal measurements and modelling of external and internal doses
Leukaemia*
Chernobyl-related exposure in Belarus [A10]
Case-control 107 cases 214 controls
52% females Age: 0–16
Belarus Up to 6 n.a. Internal exposure to radioactive iodine in areas contaminated by the Chernobyl accident
131I dose estimated from ground deposition of 137Cs and 131I, from contemporary thyroid radiation measure-ments, and from questionnaires and interviews
Thyroid*
Semipalatinsk: leukaemia case-control study [A23]
Case-control 22 cases, 132 controls from a cohort of ~10 000 persons
All ages, both sexes Kazakhstan Up to 49 n.a. Short-lived radionuclides from nuclear weapons tests
Based on residence histories and age at exposure
Non-CLL leukaemia
UNSCEAR REPORT-PART 2.qxp 10/7/08 3:19 pm Page 163
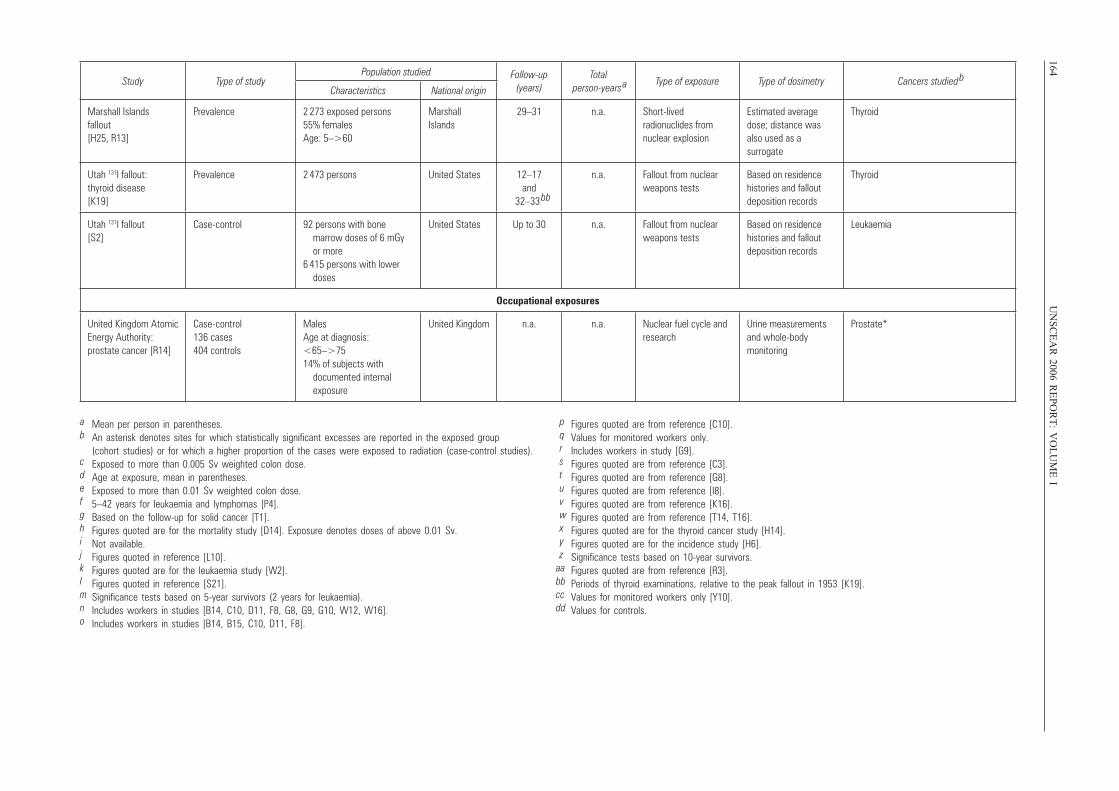
164U
NS
CE
AR
2006 RE
PO
RT
: VO
LU
ME
IStudy Type of study
Population studied Follow-up (years)
Total person-years
a Type of exposure Type of dosimetry Cancers studied b
Characteristics National origin
Marshall Islands fallout [H25, R13]
Prevalence 2 273 exposed persons 55% females Age: 5–>60
Marshall Islands
29–31 n.a. Short-lived radionuclides from nuclear explosion
Estimated average dose; distance was also used as a surrogate
Thyroid
Utah 131I fallout: thyroid disease [K19]
Prevalence 2 473 persons United States 12–17and
32–33 bb
n.a. Fallout from nuclear weapons tests
Based on residence histories and fallout deposition records
Thyroid
Utah 131I fallout [S2]
Case-control 92 persons with bone marrow doses of 6 mGy or more 6 415 persons with lower doses
United States Up to 30 n.a. Fallout from nuclear weapons tests
Based on residence histories and fallout deposition records
Leukaemia
Occupational exposures
United Kingdom Atomic Energy Authority: prostate cancer [R14]
Case-control 136 cases 404 controls
Males Age at diagnosis: <65–>75 14% of subjects with documented internal exposure
United Kingdom n.a. n.a. Nuclear fuel cycle and research
Urine measurements and whole-body monitoring
Prostate*
a Mean per person in parentheses.b An asterisk denotes sites for which statistically significant excesses are reported in the exposed group
(cohort studies) or for which a higher proportion of the cases were exposed to radiation (case-control studies).c Exposed to more than 0.005 Sv weighted colon dose.d Age at exposure, mean in parentheses.e Exposed to more than 0.01 Sv weighted colon dose.f 5–42 years for leukaemia and lymphomas [P4].g Based on the follow-up for solid cancer [T1].h Figures quoted are for the mortality study [D14]. Exposure denotes doses of above 0.01 Sv.i Not available.j Figures quoted in reference [L10].k Figures quoted are for the leukaemia study [W2].l Figures quoted in reference [S21].m Significance tests based on 5-year survivors (2 years for leukaemia).n Includes workers in studies [B14, C10, D11, F8, G8, G9, G10, W12, W16].o Includes workers in studies [B14, B15, C10, D11, F8].
p Figures quoted are from reference [C10].q Values for monitored workers only.r Includes workers in study [G9].s Figures quoted are from reference [C3].t Figures quoted are from reference [G8].u Figures quoted are from reference [I8].v Figures quoted are from reference [K16].w Figures quoted are from reference [T14, T16].x Figures quoted are for the thyroid cancer study [H14].y Figures quoted are for the incidence study [H6].z Significance tests based on 10-year survivors.
aa Figures quoted are from reference [R3].bb Periods of thyroid examinations, relative to the peak fallout in 1953 [K19].cc Values for monitored workers only [Y10].dd Values for controls.
UNSCEAR REPORT-PART 2.qxp 10/7/08 3:19 pm Page 164
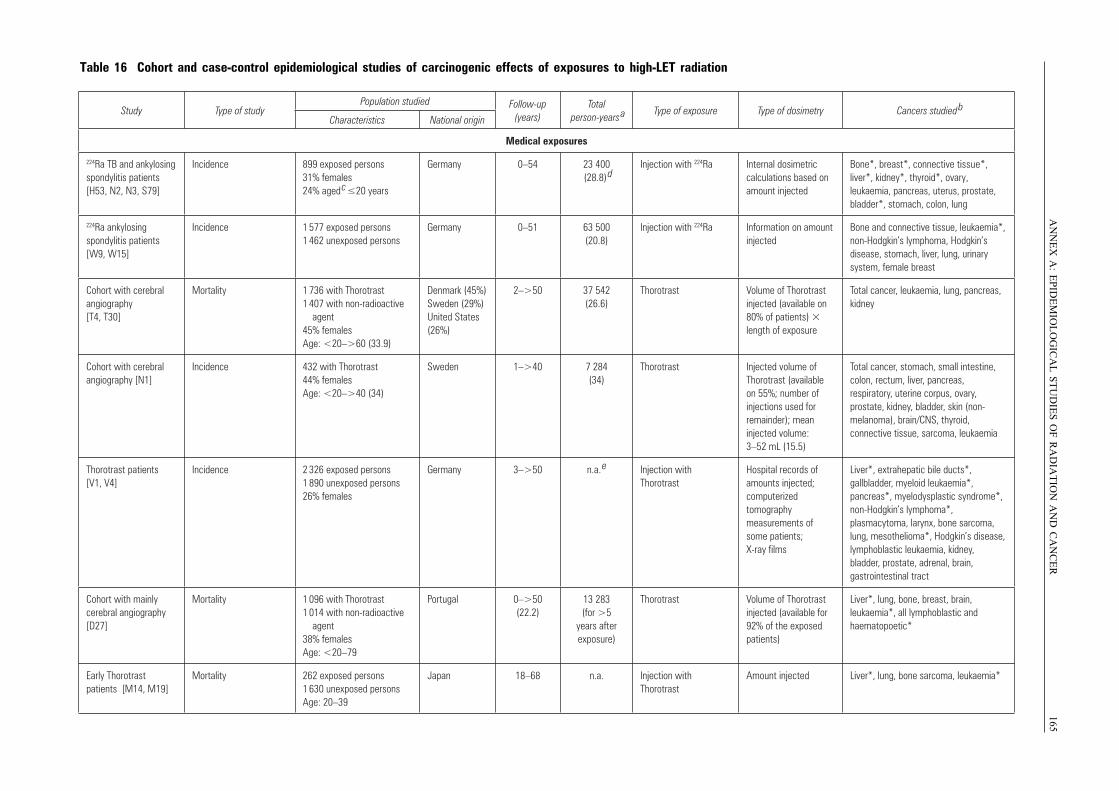
AN
NE
X A
:E
PID
EM
IOL
OG
ICA
L S
TU
DIE
S O
F R
AD
IAT
ION
AN
D C
AN
CE
R165
Table 16 Cohort and case-control epidemiological studies of carcinogenic effects of exposures to high-LET radiation
Study Type of studyPopulation studied Follow-up
(years)Total
person-years a Type of exposure Type of dosimetry Cancers studied bCharacteristics National origin
Medical exposures
224Ra TB and ankylosing spondylitis patients [H53, N2, N3, S79]
Incidence 899 exposed persons 31% females 24% aged c ≤20 years
Germany 0–54 23 400 (28.8) d
Injection with 224Ra Internal dosimetric calculations based on amount injected
Bone*, breast*, connective tissue*,liver*, kidney*, thyroid*, ovary, leukaemia, pancreas, uterus, prostate, bladder*, stomach, colon, lung
224Ra ankylosing spondylitis patients [W9, W15]
Incidence 1 577 exposed persons 1 462 unexposed persons
Germany 0–51 63 500 (20.8)
Injection with 224Ra Information on amount injected
Bone and connective tissue, leukaemia*, non-Hodgkin’s lymphoma, Hodgkin’s disease, stomach, liver, lung, urinary system, female breast
Cohort with cerebral angiography [T4, T30]
Mortality 1 736 with Thorotrast 1 407 with non-radioactive agent 45% females Age: <20–>60 (33.9)
Denmark (45%) Sweden (29%) United States (26%)
2–>50 37 542 (26.6)
Thorotrast Volume of Thorotrast injected (available on 80% of patients) length of exposure
Total cancer, leukaemia, lung, pancreas, kidney
Cohort with cerebral angiography [N1]
Incidence 432 with Thorotrast 44% females Age: <20–>40 (34)
Sweden 1–>40 7 284 (34)
Thorotrast Injected volume of Thorotrast (available on 55%; number of injections used for remainder); mean injected volume: 3–52 mL (15.5)
Total cancer, stomach, small intestine, colon, rectum, liver, pancreas, respiratory, uterine corpus, ovary, prostate, kidney, bladder, skin (non-melanoma), brain/CNS, thyroid, connective tissue, sarcoma, leukaemia
Thorotrast patients [V1, V4]
Incidence 2 326 exposed persons 1 890 unexposed persons 26% females
Germany 3–>50 n.a. e Injection with Thorotrast
Hospital records of amounts injected; computerized tomography measurements of some patients; X-ray films
Liver*, extrahepatic bile ducts*, gallbladder, myeloid leukaemia*, pancreas*, myelodysplastic syndrome*, non-Hodgkin’s lymphoma*, plasmacytoma, larynx, bone sarcoma, lung, mesothelioma*, Hodgkin’s disease, lymphoblastic leukaemia, kidney, bladder, prostate, adrenal, brain, gastrointestinal tract
Cohort with mainly cerebral angiography [D27]
Mortality 1 096 with Thorotrast 1 014 with non-radioactive agent 38% females Age: <20–79
Portugal 0–>50 (22.2)
13 283 (for >5
years after exposure)
Thorotrast Volume of Thorotrast injected (available for 92% of the exposed patients)
Liver*, lung, bone, breast, brain, leukaemia*, all lymphoblastic and haematopoetic*
Early Thorotrast patients [M14, M19]
Mortality 262 exposed persons 1 630 unexposed persons Age: 20–39
Japan 18–68 n.a. Injection with Thorotrast
Amount injected Liver*, lung, bone sarcoma, leukaemia*
UNSCEAR REPORT-PART 3.qxp 10/7/08 3:37 pm Page 165
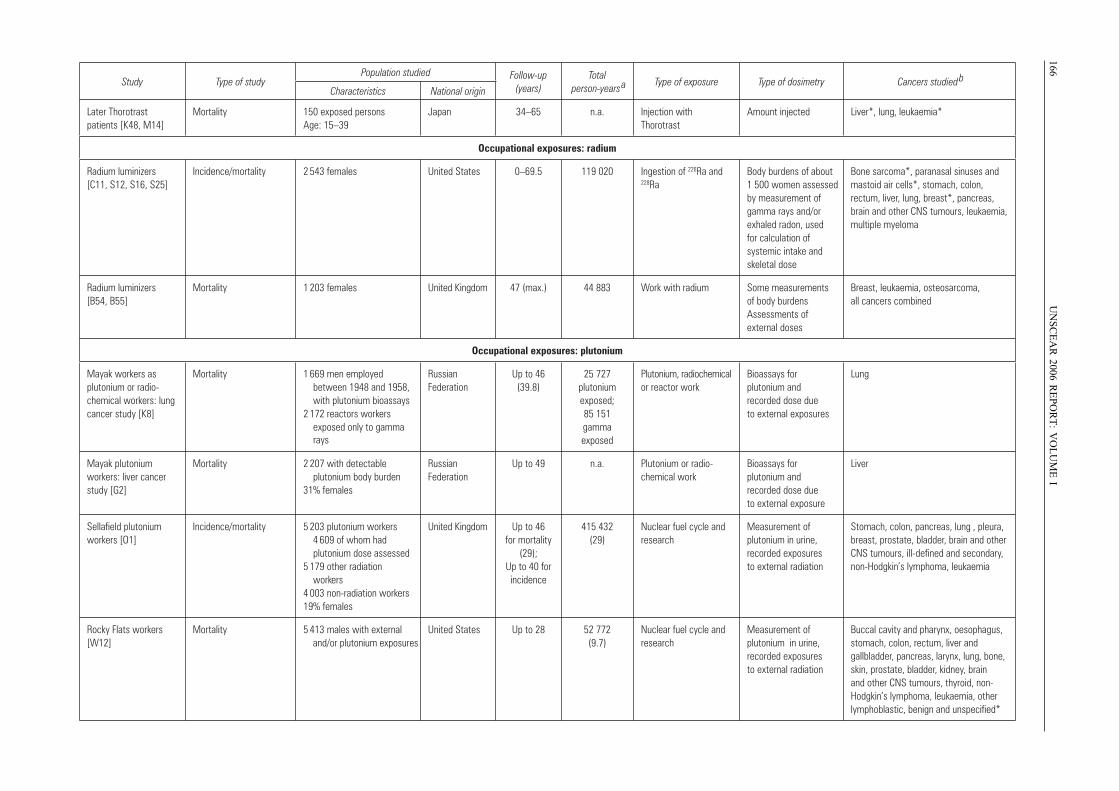
166U
NS
CE
AR
2006 RE
PO
RT
: VO
LU
ME
I
Later Thorotrast patients [K48, M14]
Mortality 150 exposed persons Age: 15–39
Japan 34–65 n.a. Injection with Thorotrast
Amount injected Liver*, lung, leukaemia*
Occupational exposures: radium
Radium luminizers [C11, S12, S16, S25]
Incidence/mortality 2 543 females United States 0–69.5 119 020 Ingestion of 226Ra and 228Ra
Body burdens of about 1 500 women assessed by measurement of gamma rays and/or exhaled radon, used for calculation of systemic intake and skeletal dose
Bone sarcoma*, paranasal sinuses and mastoid air cells*, stomach, colon, rectum, liver, lung, breast*, pancreas, brain and other CNS tumours, leukaemia, multiple myeloma
Radium luminizers [B54, B55]
Mortality 1 203 females United Kingdom 47 (max.) 44 883 Work with radium Some measurements of body burdens Assessments of external doses
Breast, leukaemia, osteosarcoma, all cancers combined
Occupational exposures: plutonium
Mayak workers as plutonium or radio-chemical workers: lung cancer study [K8]
Mortality 1 669 men employed between 1948 and 1958, with plutonium bioassays 2 172 reactors workers exposed only to gamma rays
Russian Federation
Up to 46 (39.8)
25 727 plutonium exposed; 85 151 gamma exposed
Plutonium, radiochemical or reactor work
Bioassays for plutonium and recorded dose due to external exposures
Lung
Mayak plutonium workers: liver cancer study [G2]
Mortality 2 207 with detectable plutonium body burden 31% females
Russian Federation
Up to 49 n.a. Plutonium or radio-chemical work
Bioassays for plutonium and recorded dose due to external exposure
Liver
Sellafield plutonium workers [O1]
Incidence/mortality 5 203 plutonium workers 4 609 of whom had plutonium dose assessed 5 179 other radiation workers 4 003 non-radiation workers 19% females
United Kingdom Up to 46 for mortality
(29); Up to 40 for incidence
415 432 (29)
Nuclear fuel cycle and research
Measurement of plutonium in urine, recorded exposures to external radiation
Stomach, colon, pancreas, lung , pleura, breast, prostate, bladder, brain and other CNS tumours, ill-defined and secondary, non-Hodgkin’s lymphoma, leukaemia
Rocky Flats workers [W12]
Mortality 5 413 males with external and/or plutonium exposures
United States Up to 28 52 772 (9.7)
Nuclear fuel cycle and research
Measurement of plutonium in urine, recorded exposures to external radiation
Buccal cavity and pharynx, oesophagus, stomach, colon, rectum, liver and gallbladder, pancreas, larynx, lung, bone, skin, prostate, bladder, kidney, brain and other CNS tumours, thyroid, non- Hodgkin’s lymphoma, leukaemia, other lymphoblastic, benign and unspecified*
Study Type of studyPopulation studied Follow-up
(years)Total
person-years a Type of exposure Type of dosimetry Cancers studied bCharacteristics National origin
UNSCEAR REPORT-PART 3.qxp 10/7/08 3:37 pm Page 166
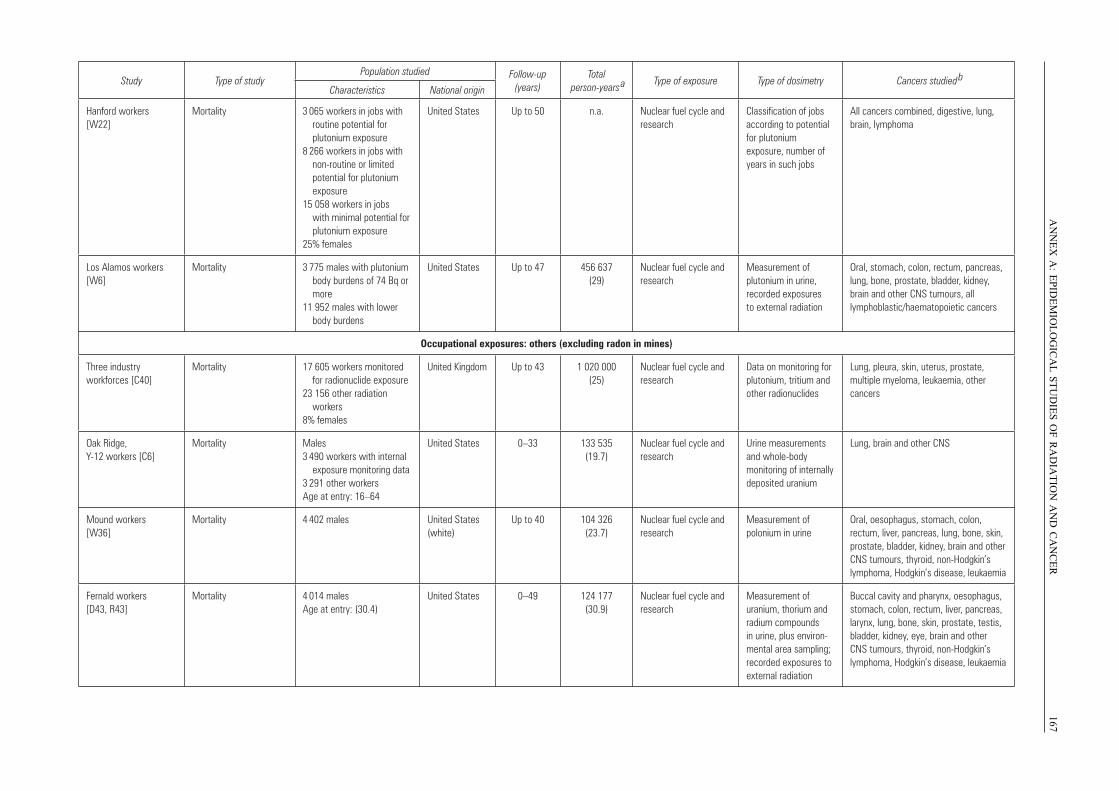
AN
NE
X A
:E
PID
EM
IOL
OG
ICA
L S
TU
DIE
S O
F R
AD
IAT
ION
AN
D C
AN
CE
R167
Study Type of studyPopulation studied Follow-up
(years)Total
person-years a Type of exposure Type of dosimetry Cancers studied
bCharacteristics National origin
Hanford workers [W22]
Mortality 3 065 workers in jobs with routine potential for plutonium exposure 8 266 workers in jobs with non-routine or limited potential for plutonium exposure 15 058 workers in jobs with minimal potential for plutonium exposure25% females
United States Up to 50 n.a. Nuclear fuel cycle and research
Classification of jobs according to potential for plutonium exposure, number of years in such jobs
All cancers combined, digestive, lung, brain, lymphoma
Los Alamos workers [W6]
Mortality 3 775 males with plutonium body burdens of 74 Bq or more 11 952 males with lower body burdens
United States Up to 47 456 637 (29)
Nuclear fuel cycle and research
Measurement of plutonium in urine, recorded exposures to external radiation
Oral, stomach, colon, rectum, pancreas, lung, bone, prostate, bladder, kidney, brain and other CNS tumours, all lymphoblastic/haematopoietic cancers
Occupational exposures: others (excluding radon in mines)
Three industry workforces [C40]
Mortality 17 605 workers monitored for radionuclide exposure 23 156 other radiation workers 8% females
United Kingdom Up to 43 1 020 000 (25)
Nuclear fuel cycle and research
Data on monitoring for plutonium, tritium and other radionuclides
Lung, pleura, skin, uterus, prostate, multiple myeloma, leukaemia, other cancers
Oak Ridge, Y-12 workers [C6]
Mortality Males 3 490 workers with internal exposure monitoring data 3 291 other workers Age at entry: 16–64
United States 0–33 133 535 (19.7)
Nuclear fuel cycle and research
Urine measurements and whole-body monitoring of internally deposited uranium
Lung, brain and other CNS
Mound workers [W36]
Mortality 4 402 males United States (white)
Up to 40 104 326 (23.7)
Nuclear fuel cycle and research
Measurement of polonium in urine
Oral, oesophagus, stomach, colon, rectum, liver, pancreas, lung, bone, skin, prostate, bladder, kidney, brain and other CNS tumours, thyroid, non-Hodgkin’s lymphoma, Hodgkin’s disease, leukaemia
Fernald workers [D43, R43]
Mortality 4 014 males Age at entry: (30.4)
United States 0–49 124 177 (30.9)
Nuclear fuel cycle and research
Measurement of uranium, thorium and radium compounds in urine, plus environ-mental area sampling; recorded exposures to external radiation
Buccal cavity and pharynx, oesophagus, stomach, colon, rectum, liver, pancreas, larynx, lung, bone, skin, prostate, testis, bladder, kidney, eye, brain and other CNS tumours, thyroid, non-Hodgkin’s lymphoma, Hodgkin’s disease, leukaemia
UNSCEAR REPORT-PART 3.qxp 10/7/08 3:37 pm Page 167
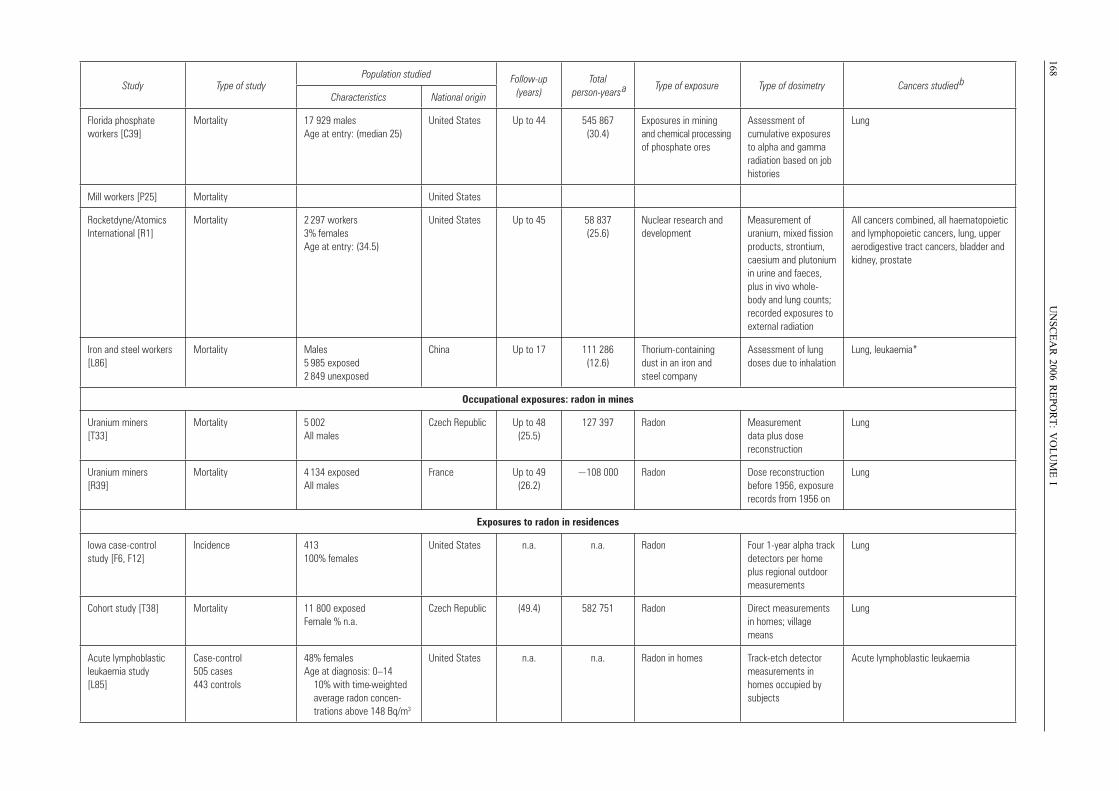
168U
NS
CE
AR
2006 RE
PO
RT
: VO
LU
ME
I
Study Type of studyPopulation studied Follow-up
(years)Total
person-years a Type of exposure Type of dosimetry Cancers studied
bCharacteristics National origin
Florida phosphate workers [C39]
Mortality 17 929 males Age at entry: (median 25)
United States Up to 44 545 867 (30.4)
Exposures in mining and chemical processing of phosphate ores
Assessment of cumulative exposures to alpha and gamma radiation based on job histories
Lung
Mill workers [P25] Mortality United States
Rocketdyne/Atomics International [R1]
Mortality 2 297 workers 3% females Age at entry: (34.5)
United States Up to 45 58 837 (25.6)
Nuclear research and development
Measurement of uranium, mixed fission products, strontium, caesium and plutonium in urine and faeces, plus in vivo whole-body and lung counts; recorded exposures to external radiation
All cancers combined, all haematopoietic and lymphopoietic cancers, lung, upper aerodigestive tract cancers, bladder and kidney, prostate
Iron and steel workers [L86]
Mortality Males 5 985 exposed 2 849 unexposed
China Up to 17 111 286 (12.6)
Thorium-containing dust in an iron and steel company
Assessment of lung doses due to inhalation
Lung, leukaemia*
Occupational exposures: radon in mines
Uranium miners [T33]
Mortality 5 002 All males
Czech Republic Up to 48 (25.5)
127 397 Radon Measurement data plus dose reconstruction
Lung
Uranium miners [R39]
Mortality 4 134 exposed All males
France Up to 49 (26.2)
~108 000 Radon Dose reconstruction before 1956, exposure records from 1956 on
Lung
Exposures to radon in residences
Iowa case-control study [F6, F12]
Incidence 413 100% females
United States n.a. n.a. Radon Four 1-year alpha track detectors per home plus regional outdoor measurements
Lung
Cohort study [T38] Mortality 11 800 exposed Female % n.a.
Czech Republic (49.4) 582 751 Radon Direct measurements in homes; village means
Lung
Acute lymphoblastic leukaemia study [L85]
Case-control 505 cases 443 controls
48% females Age at diagnosis: 0–14 10% with time-weighted average radon concen- trations above 148 Bq/m3
United States n.a. n.a. Radon in homes Track-etch detector measurements in homes occupied by subjects
Acute lymphoblastic leukaemia
UNSCEAR REPORT-PART 3.qxp 10/7/08 3:37 pm Page 168
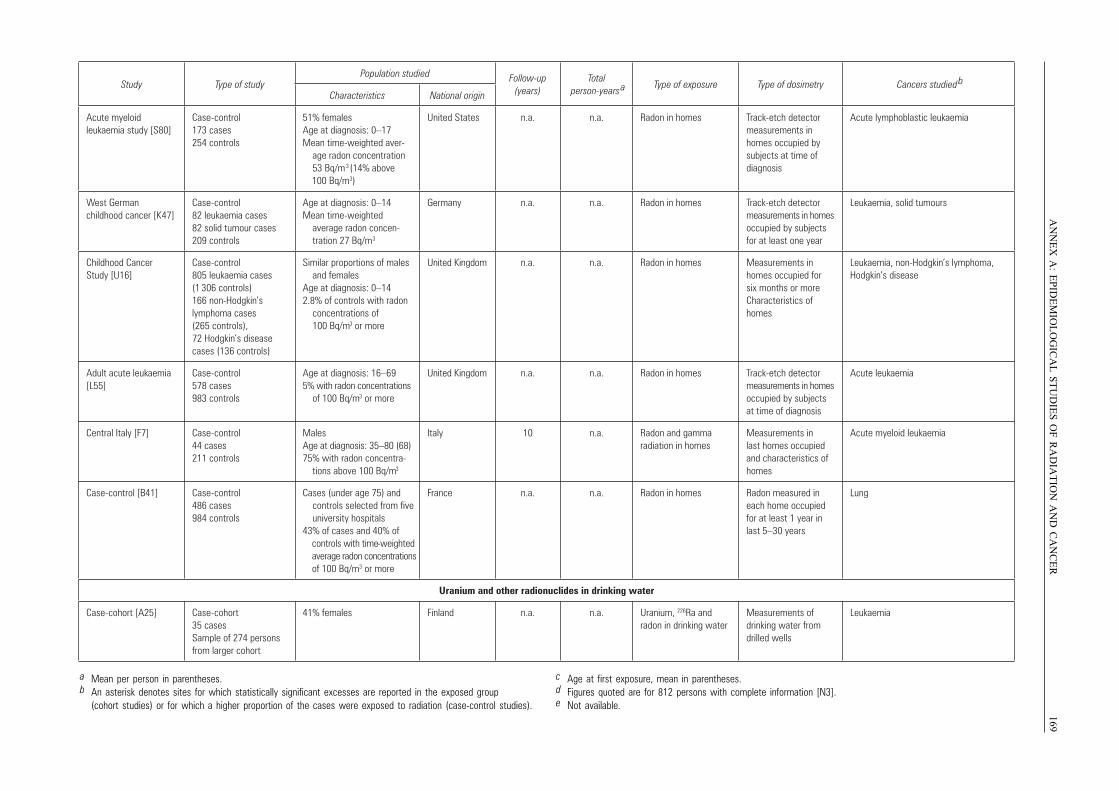
AN
NE
X A
:E
PID
EM
IOL
OG
ICA
L S
TU
DIE
S O
F R
AD
IAT
ION
AN
D C
AN
CE
R169
Study Type of studyPopulation studied Follow-up
(years)Total
person-years a Type of exposure Type of dosimetry Cancers studied
bCharacteristics National origin
Acute myeloid leukaemia study [S80]
Case-control 173 cases 254 controls
51% females Age at diagnosis: 0–17 Mean time-weighted aver- age radon concentration 53 Bq/m3 (14% above
100 Bq/m3)
United States n.a. n.a. Radon in homes Track-etch detector measurements in homes occupied by subjects at time of diagnosis
Acute lymphoblastic leukaemia
West German childhood cancer [K47]
Case-control 82 leukaemia cases 82 solid tumour cases 209 controls
Age at diagnosis: 0–14 Mean time-weighted average radon concen- tration 27 Bq/m3
Germany n.a. n.a. Radon in homes Track-etch detector measurements in homes occupied by subjects for at least one year
Leukaemia, solid tumours
Childhood Cancer Study [U16]
Case-control 805 leukaemia cases (1 306 controls) 166 non-Hodgkin’s lymphoma cases (265 controls), 72 Hodgkin’s disease cases (136 controls)
Similar proportions of males and females Age at diagnosis: 0–14 2.8% of controls with radon concentrations of 100 Bq/m3 or more
United Kingdom n.a. n.a. Radon in homes Measurements in homes occupied for six months or moreCharacteristics of homes
Leukaemia, non-Hodgkin’s lymphoma, Hodgkin’s disease
Adult acute leukaemia [L55]
Case-control 578 cases983 controls
Age at diagnosis: 16–69 5% with radon concentrations of 100 Bq/m3 or more
United Kingdom n.a. n.a. Radon in homes Track-etch detector measurements in homes occupied by subjects at time of diagnosis
Acute leukaemia
Central Italy [F7] Case-control 44 cases 211 controls
Males Age at diagnosis: 35–80 (68) 75% with radon concentra- tions above 100 Bq/m3
Italy 10 n.a. Radon and gamma radiation in homes
Measurements in last homes occupied and characteristics of homes
Acute myeloid leukaemia
Case-control [B41] Case-control 486 cases 984 controls
Cases (under age 75) and controls selected from five university hospitals 43% of cases and 40% of
controls with time-weighted average radon concentrations of 100 Bq/m3 or more
France n.a. n.a. Radon in homes Radon measured in each home occupied for at least 1 year in last 5–30 years
Lung
Uranium and other radionuclides in drinking water
Case-cohort [A25] Case-cohort 35 cases Sample of 274 persons from larger cohort
41% females Finland n.a. n.a. Uranium, 226Ra and radon in drinking water
Measurements of drinking water from drilled wells
Leukaemia
a Mean per person in parentheses.b An asterisk denotes sites for which statistically significant excesses are reported in the exposed group
(cohort studies) or for which a higher proportion of the cases were exposed to radiation (case-control studies).
c Age at first exposure, mean in parentheses.d Figures quoted are for 812 persons with complete information [N3].e Not available.
UNSCEAR REPORT-PART 3.qxp 10/7/08 3:37 pm Page 169
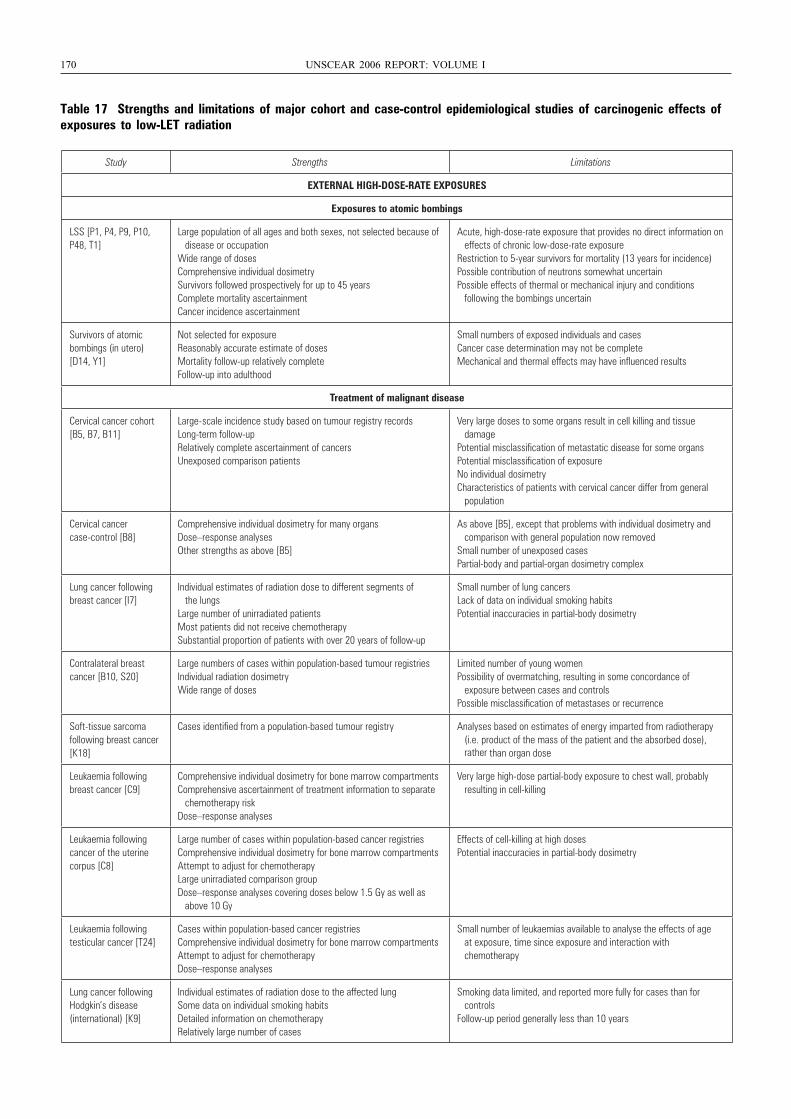
170 UNSCEAR 2006 REPORT: VOLUME I
Table 17 Strengths and limitations of major cohort and case-control epidemiological studies of carcinogenic effects ofexposures to low-LET radiation
Study Strengths Limitations
EXTERNAL HIGH-DOSE-RATE EXPOSURES
Exposures to atomic bombings
LSS [P1, P4, P9, P10, P48, T1]
Large population of all ages and both sexes, not selected because of disease or occupationWide range of dosesComprehensive individual dosimetrySurvivors followed prospectively for up to 45 yearsComplete mortality ascertainmentCancer incidence ascertainment
Acute, high-dose-rate exposure that provides no direct information on effects of chronic low-dose-rate exposureRestriction to 5-year survivors for mortality (13 years for incidence)Possible contribution of neutrons somewhat uncertainPossible effects of thermal or mechanical injury and conditions following the bombings uncertain
Survivors of atomic bombings (in utero) [D14, Y1]
Not selected for exposureReasonably accurate estimate of dosesMortality follow-up relatively completeFollow-up into adulthood
Small numbers of exposed individuals and casesCancer case determination may not be completeMechanical and thermal effects may have influenced results
Treatment of malignant disease
Cervical cancer cohort [B5, B7, B11]
Large-scale incidence study based on tumour registry recordsLong-term follow-upRelatively complete ascertainment of cancersUnexposed comparison patients
Very large doses to some organs result in cell killing and tissue damagePotential misclassification of metastatic disease for some organsPotential misclassification of exposureNo individual dosimetryCharacteristics of patients with cervical cancer differ from general population
Cervical cancer case-control [B8]
Comprehensive individual dosimetry for many organsDose–response analysesOther strengths as above [B5]
As above [B5], except that problems with individual dosimetry and comparison with general population now removedSmall number of unexposed casesPartial-body and partial-organ dosimetry complex
Lung cancer following breast cancer [I7]
Individual estimates of radiation dose to different segments of the lungsLarge number of unirradiated patientsMost patients did not receive chemotherapySubstantial proportion of patients with over 20 years of follow-up
Small number of lung cancersLack of data on individual smoking habitsPotential inaccuracies in partial-body dosimetry
Contralateral breast cancer [B10, S20]
Large numbers of cases within population-based tumour registriesIndividual radiation dosimetryWide range of doses
Limited number of young womenPossibility of overmatching, resulting in some concordance of exposure between cases and controlsPossible misclassification of metastases or recurrence
Soft-tissue sarcoma following breast cancer [K18]
Cases identified from a population-based tumour registry Analyses based on estimates of energy imparted from radiotherapy (i.e. product of the mass of the patient and the absorbed dose), rather than organ dose
Leukaemia following breast cancer [C9]
Comprehensive individual dosimetry for bone marrow compartmentsComprehensive ascertainment of treatment information to separate chemotherapy riskDose–response analyses
Very large high-dose partial-body exposure to chest wall, probably resulting in cell-killing
Leukaemia following cancer of the uterine corpus [C8]
Large number of cases within population-based cancer registries Comprehensive individual dosimetry for bone marrow compartmentsAttempt to adjust for chemotherapyLarge unirradiated comparison groupDose–response analyses covering doses below 1.5 Gy as well as above 10 Gy
Effects of cell-killing at high dosesPotential inaccuracies in partial-body dosimetry
Leukaemia following testicular cancer [T24]
Cases within population-based cancer registriesComprehensive individual dosimetry for bone marrow compartmentsAttempt to adjust for chemotherapyDose–response analyses
Small number of leukaemias available to analyse the effects of age at exposure, time since exposure and interaction with chemotherapy
Lung cancer following Hodgkin’s disease (international) [K9]
Individual estimates of radiation dose to the affected lungSome data on individual smoking habitsDetailed information on chemotherapyRelatively large number of cases
Smoking data limited, and reported more fully for cases than for controlsFollow-up period generally less than 10 years
UNSCEAR REPORT-PART 3.qxp 10/7/08 3:37 pm Page 170
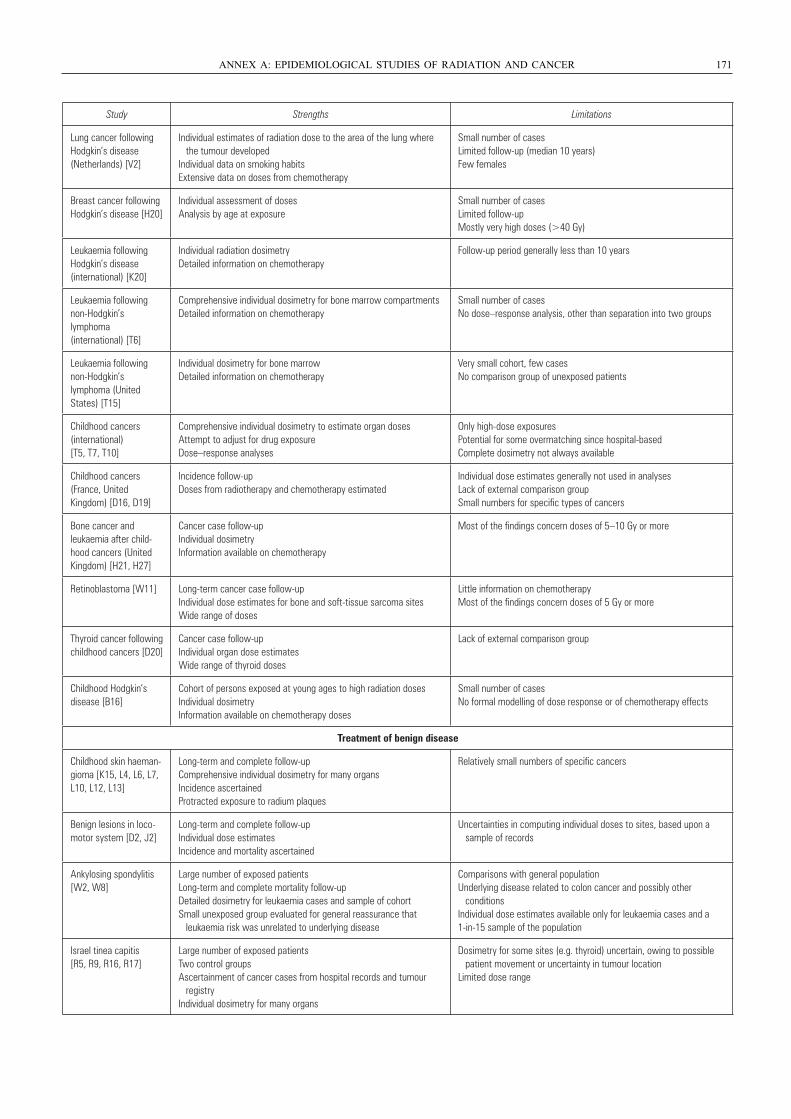
ANNEX A: EPIDEMIOLOGICAL STUDIES OF RADIATION AND CANCER 171
Study Strengths Limitations
Lung cancer following Hodgkin’s disease (Netherlands) [V2]
Individual estimates of radiation dose to the area of the lung where the tumour developedIndividual data on smoking habitsExtensive data on doses from chemotherapy
Small number of casesLimited follow-up (median 10 years)Few females
Breast cancer following Hodgkin’s disease [H20]
Individual assessment of dosesAnalysis by age at exposure
Small number of casesLimited follow-upMostly very high doses (>40 Gy)
Leukaemia following Hodgkin’s disease (international) [K20]
Individual radiation dosimetryDetailed information on chemotherapy
Follow-up period generally less than 10 years
Leukaemia following non-Hodgkin’s lymphoma (international) [T6]
Comprehensive individual dosimetry for bone marrow compartmentsDetailed information on chemotherapy
Small number of casesNo dose–response analysis, other than separation into two groups
Leukaemia following non-Hodgkin’s lymphoma (United States) [T15]
Individual dosimetry for bone marrowDetailed information on chemotherapy
Very small cohort, few casesNo comparison group of unexposed patients
Childhood cancers (international) [T5, T7, T10]
Comprehensive individual dosimetry to estimate organ dosesAttempt to adjust for drug exposureDose–response analyses
Only high-dose exposuresPotential for some overmatching since hospital-basedComplete dosimetry not always available
Childhood cancers (France, United Kingdom) [D16, D19]
Incidence follow-upDoses from radiotherapy and chemotherapy estimated
Individual dose estimates generally not used in analysesLack of external comparison groupSmall numbers for specific types of cancers
Bone cancer and leukaemia after child-hood cancers (United Kingdom) [H21, H27]
Cancer case follow-upIndividual dosimetryInformation available on chemotherapy
Most of the findings concern doses of 5–10 Gy or more
Retinoblastoma [W11] Long-term cancer case follow-upIndividual dose estimates for bone and soft-tissue sarcoma sitesWide range of doses
Little information on chemotherapyMost of the findings concern doses of 5 Gy or more
Thyroid cancer following childhood cancers [D20]
Cancer case follow-upIndividual organ dose estimatesWide range of thyroid doses
Lack of external comparison group
Childhood Hodgkin’s disease [B16]
Cohort of persons exposed at young ages to high radiation dosesIndividual dosimetryInformation available on chemotherapy doses
Small number of casesNo formal modelling of dose response or of chemotherapy effects
Treatment of benign disease
Childhood skin haeman-gioma [K15, L4, L6, L7, L10, L12, L13]
Long-term and complete follow-upComprehensive individual dosimetry for many organsIncidence ascertainedProtracted exposure to radium plaques
Relatively small numbers of specific cancers
Benign lesions in loco-motor system [D2, J2]
Long-term and complete follow-upIndividual dose estimatesIncidence and mortality ascertained
Uncertainties in computing individual doses to sites, based upon a sample of records
Ankylosing spondylitis [W2, W8]
Large number of exposed patientsLong-term and complete mortality follow-upDetailed dosimetry for leukaemia cases and sample of cohortSmall unexposed group evaluated for general reassurance that leukaemia risk was unrelated to underlying disease
Comparisons with general populationUnderlying disease related to colon cancer and possibly other conditionsIndividual dose estimates available only for leukaemia cases and a 1-in-15 sample of the population
Israel tinea capitis [R5, R9, R16, R17]
Large number of exposed patientsTwo control groupsAscertainment of cancer cases from hospital records and tumour registryIndividual dosimetry for many organs
Dosimetry for some sites (e.g. thyroid) uncertain, owing to possible patient movement or uncertainty in tumour locationLimited dose range
UNSCEAR REPORT-PART 3.qxp 10/7/08 3:37 pm Page 171
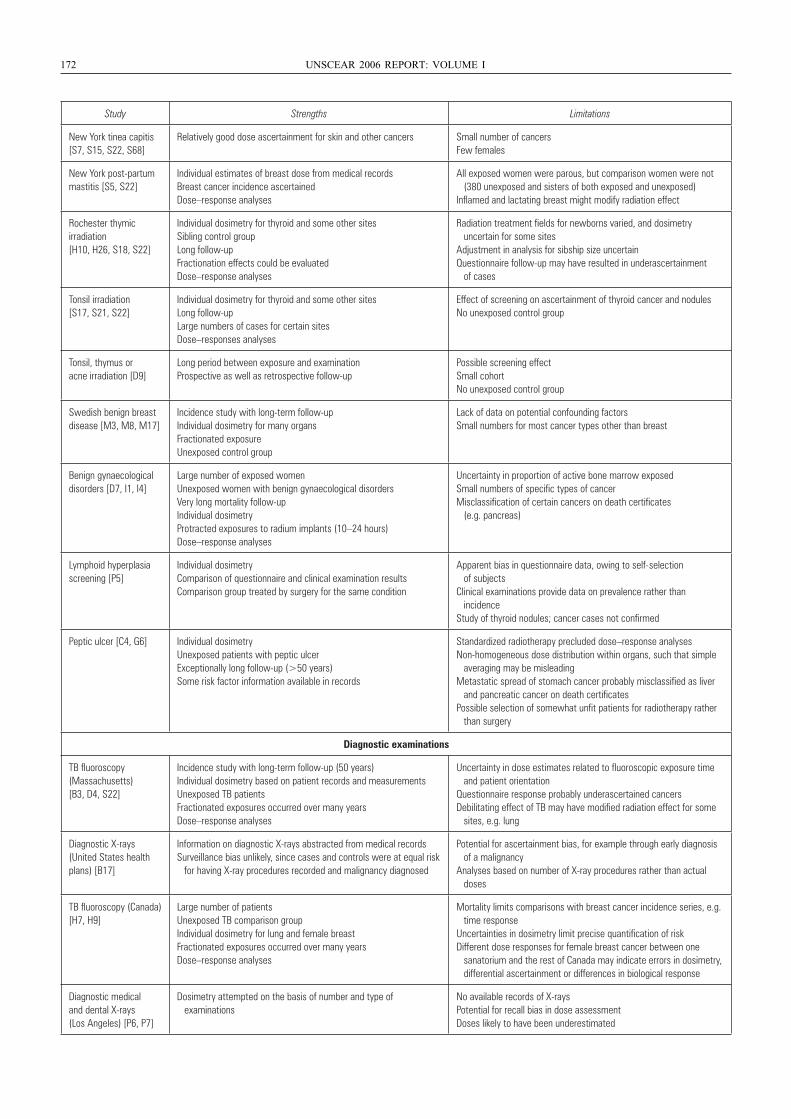
172 UNSCEAR 2006 REPORT: VOLUME I
Study Strengths Limitations
New York tinea capitis [S7, S15, S22, S68]
Relatively good dose ascertainment for skin and other cancers Small number of cancersFew females
New York post-partum mastitis [S5, S22]
Individual estimates of breast dose from medical recordsBreast cancer incidence ascertainedDose–response analyses
All exposed women were parous, but comparison women were not (380 unexposed and sisters of both exposed and unexposed)Inflamed and lactating breast might modify radiation effect
Rochester thymic irradiation [H10, H26, S18, S22]
Individual dosimetry for thyroid and some other sitesSibling control groupLong follow-upFractionation effects could be evaluatedDose–response analyses
Radiation treatment fields for newborns varied, and dosimetry uncertain for some sitesAdjustment in analysis for sibship size uncertainQuestionnaire follow-up may have resulted in underascertainment of cases
Tonsil irradiation [S17, S21, S22]
Individual dosimetry for thyroid and some other sitesLong follow-upLarge numbers of cases for certain sitesDose–responses analyses
Effect of screening on ascertainment of thyroid cancer and nodulesNo unexposed control group
Tonsil, thymus or acne irradiation [D9]
Long period between exposure and examination Prospective as well as retrospective follow-up
Possible screening effectSmall cohortNo unexposed control group
Swedish benign breast disease [M3, M8, M17]
Incidence study with long-term follow-upIndividual dosimetry for many organsFractionated exposureUnexposed control group
Lack of data on potential confounding factorsSmall numbers for most cancer types other than breast
Benign gynaecological disorders [D7, I1, I4]
Large number of exposed womenUnexposed women with benign gynaecological disordersVery long mortality follow-upIndividual dosimetryProtracted exposures to radium implants (10–24 hours)Dose–response analyses
Uncertainty in proportion of active bone marrow exposedSmall numbers of specific types of cancerMisclassification of certain cancers on death certificates (e.g. pancreas)
Lymphoid hyperplasia screening [P5]
Individual dosimetryComparison of questionnaire and clinical examination resultsComparison group treated by surgery for the same condition
Apparent bias in questionnaire data, owing to self-selection of subjectsClinical examinations provide data on prevalence rather than incidenceStudy of thyroid nodules; cancer cases not confirmed
Peptic ulcer [C4, G6] Individual dosimetryUnexposed patients with peptic ulcerExceptionally long follow-up (>50 years)Some risk factor information available in records
Standardized radiotherapy precluded dose–response analysesNon-homogeneous dose distribution within organs, such that simple averaging may be misleadingMetastatic spread of stomach cancer probably misclassified as liver and pancreatic cancer on death certificatesPossible selection of somewhat unfit patients for radiotherapy rather than surgery
Diagnostic examinations
TB fluoroscopy (Massachusetts) [B3, D4, S22]
Incidence study with long-term follow-up (50 years)Individual dosimetry based on patient records and measurementsUnexposed TB patientsFractionated exposures occurred over many yearsDose–response analyses
Uncertainty in dose estimates related to fluoroscopic exposure time and patient orientationQuestionnaire response probably underascertained cancersDebilitating effect of TB may have modified radiation effect for some sites, e.g. lung
Diagnostic X-rays(United States health plans) [B17]
Information on diagnostic X-rays abstracted from medical recordsSurveillance bias unlikely, since cases and controls were at equal risk for having X-ray procedures recorded and malignancy diagnosed
Potential for ascertainment bias, for example through early diagnosis of a malignancyAnalyses based on number of X-ray procedures rather than actual doses
TB fluoroscopy (Canada) [H7, H9]
Large number of patientsUnexposed TB comparison groupIndividual dosimetry for lung and female breastFractionated exposures occurred over many yearsDose–response analyses
Mortality limits comparisons with breast cancer incidence series, e.g. time responseUncertainties in dosimetry limit precise quantification of riskDifferent dose responses for female breast cancer between one sanatorium and the rest of Canada may indicate errors in dosimetry, differential ascertainment or differences in biological response
Diagnostic medical and dental X-rays (Los Angeles) [P6, P7]
Dosimetry attempted on the basis of number and type of examinations
No available records of X-raysPotential for recall bias in dose assessmentDoses likely to have been underestimated
UNSCEAR REPORT-PART 3.qxp 10/7/08 3:37 pm Page 172
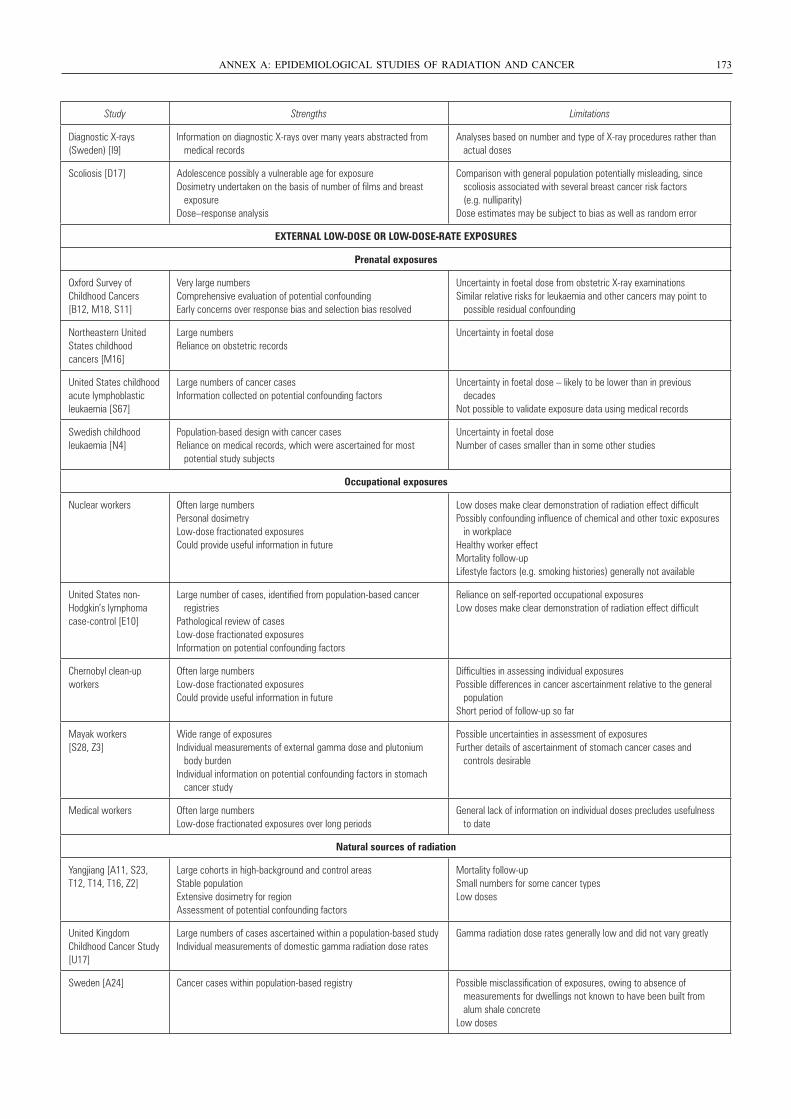
ANNEX A: EPIDEMIOLOGICAL STUDIES OF RADIATION AND CANCER 173
Study Strengths Limitations
Diagnostic X-rays (Sweden) [I9]
Information on diagnostic X-rays over many years abstracted from medical records
Analyses based on number and type of X-ray procedures rather than actual doses
Scoliosis [D17] Adolescence possibly a vulnerable age for exposureDosimetry undertaken on the basis of number of films and breast exposureDose–response analysis
Comparison with general population potentially misleading, since scoliosis associated with several breast cancer risk factors (e.g. nulliparity)Dose estimates may be subject to bias as well as random error
EXTERNAL LOW-DOSE OR LOW-DOSE-RATE EXPOSURES
Prenatal exposures
Oxford Survey of Childhood Cancers [B12, M18, S11]
Very large numbersComprehensive evaluation of potential confoundingEarly concerns over response bias and selection bias resolved
Uncertainty in foetal dose from obstetric X-ray examinationsSimilar relative risks for leukaemia and other cancers may point to possible residual confounding
Northeastern United States childhood cancers [M16]
Large numbersReliance on obstetric records
Uncertainty in foetal dose
United States childhood acute lymphoblastic leukaemia [S67]
Large numbers of cancer casesInformation collected on potential confounding factors
Uncertainty in foetal dose – likely to be lower than in previous decadesNot possible to validate exposure data using medical records
Swedish childhood leukaemia [N4]
Population-based design with cancer casesReliance on medical records, which were ascertained for most potential study subjects
Uncertainty in foetal doseNumber of cases smaller than in some other studies
Occupational exposures
Nuclear workers Often large numbersPersonal dosimetryLow-dose fractionated exposuresCould provide useful information in future
Low doses make clear demonstration of radiation effect difficultPossibly confounding influence of chemical and other toxic exposures in workplaceHealthy worker effectMortality follow-upLifestyle factors (e.g. smoking histories) generally not available
United States non-Hodgkin’s lymphoma case-control [E10]
Large number of cases, identified from population-based cancer registriesPathological review of casesLow-dose fractionated exposuresInformation on potential confounding factors
Reliance on self-reported occupational exposuresLow doses make clear demonstration of radiation effect difficult
Chernobyl clean-up workers
Often large numbersLow-dose fractionated exposuresCould provide useful information in future
Difficulties in assessing individual exposuresPossible differences in cancer ascertainment relative to the general populationShort period of follow-up so far
Mayak workers [S28, Z3]
Wide range of exposuresIndividual measurements of external gamma dose and plutonium body burdenIndividual information on potential confounding factors in stomach cancer study
Possible uncertainties in assessment of exposuresFurther details of ascertainment of stomach cancer cases and controls desirable
Medical workers Often large numbersLow-dose fractionated exposures over long periods
General lack of information on individual doses precludes usefulness to date
Natural sources of radiation
Yangjiang [A11, S23, T12, T14, T16, Z2]
Large cohorts in high-background and control areasStable populationExtensive dosimetry for regionAssessment of potential confounding factors
Mortality follow-upSmall numbers for some cancer typesLow doses
United Kingdom Childhood Cancer Study [U17]
Large numbers of cases ascertained within a population-based studyIndividual measurements of domestic gamma radiation dose rates
Gamma radiation dose rates generally low and did not vary greatly
Sweden [A24] Cancer cases within population-based registry Possible misclassification of exposures, owing to absence of measurements for dwellings not known to have been built from alum shale concreteLow doses
UNSCEAR REPORT-PART 3.qxp 10/7/08 3:37 pm Page 173
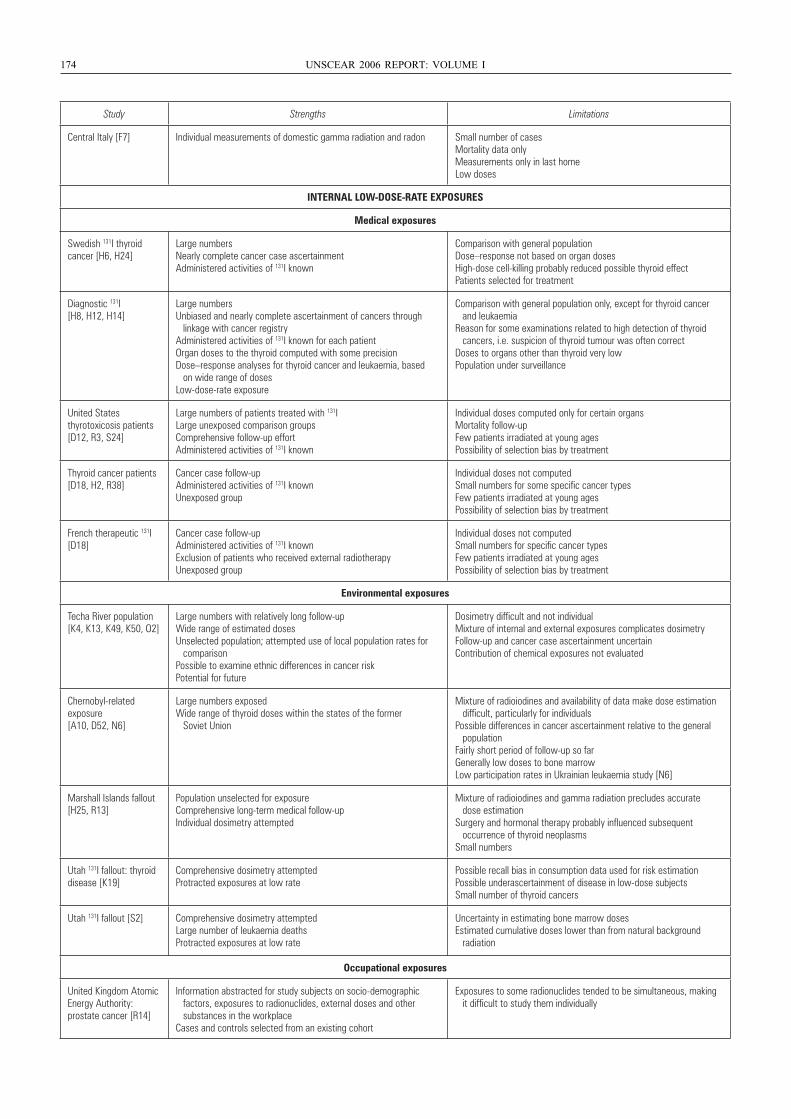
174 UNSCEAR 2006 REPORT: VOLUME I
Study Strengths Limitations
Central Italy [F7] Individual measurements of domestic gamma radiation and radon Small number of casesMortality data onlyMeasurements only in last homeLow doses
INTERNAL LOW-DOSE-RATE EXPOSURES
Medical exposures
Swedish 131I thyroid cancer [H6, H24]
Large numbersNearly complete cancer case ascertainmentAdministered activities of 131I known
Comparison with general populationDose–response not based on organ dosesHigh-dose cell-killing probably reduced possible thyroid effectPatients selected for treatment
Diagnostic 131I [H8, H12, H14]
Large numbersUnbiased and nearly complete ascertainment of cancers through linkage with cancer registryAdministered activities of 131I known for each patientOrgan doses to the thyroid computed with some precisionDose–response analyses for thyroid cancer and leukaemia, based on wide range of dosesLow-dose-rate exposure
Comparison with general population only, except for thyroid cancer and leukaemiaReason for some examinations related to high detection of thyroid cancers, i.e. suspicion of thyroid tumour was often correctDoses to organs other than thyroid very lowPopulation under surveillance
United States thyrotoxicosis patients [D12, R3, S24]
Large numbers of patients treated with 131ILarge unexposed comparison groupsComprehensive follow-up effortAdministered activities of 131I known
Individual doses computed only for certain organsMortality follow-upFew patients irradiated at young agesPossibility of selection bias by treatment
Thyroid cancer patients [D18, H2, R38]
Cancer case follow-upAdministered activities of 131I knownUnexposed group
Individual doses not computedSmall numbers for some specific cancer typesFew patients irradiated at young agesPossibility of selection bias by treatment
French therapeutic 131I [D18]
Cancer case follow-upAdministered activities of 131I knownExclusion of patients who received external radiotherapyUnexposed group
Individual doses not computedSmall numbers for specific cancer typesFew patients irradiated at young agesPossibility of selection bias by treatment
Environmental exposures
Techa River population [K4, K13, K49, K50, O2]
Large numbers with relatively long follow-upWide range of estimated dosesUnselected population; attempted use of local population rates for comparisonPossible to examine ethnic differences in cancer riskPotential for future
Dosimetry difficult and not individualMixture of internal and external exposures complicates dosimetryFollow-up and cancer case ascertainment uncertainContribution of chemical exposures not evaluated
Chernobyl-related exposure [A10, D52, N6]
Large numbers exposedWide range of thyroid doses within the states of the former Soviet Union
Mixture of radioiodines and availability of data make dose estimation difficult, particularly for individualsPossible differences in cancer ascertainment relative to the general populationFairly short period of follow-up so farGenerally low doses to bone marrowLow participation rates in Ukrainian leukaemia study [N6]
Marshall Islands fallout [H25, R13]
Population unselected for exposureComprehensive long-term medical follow-upIndividual dosimetry attempted
Mixture of radioiodines and gamma radiation precludes accurate dose estimationSurgery and hormonal therapy probably influenced subsequent occurrence of thyroid neoplasmsSmall numbers
Utah 131I fallout: thyroid disease [K19]
Comprehensive dosimetry attemptedProtracted exposures at low rate
Possible recall bias in consumption data used for risk estimationPossible underascertainment of disease in low-dose subjectsSmall number of thyroid cancers
Utah 131I fallout [S2] Comprehensive dosimetry attemptedLarge number of leukaemia deathsProtracted exposures at low rate
Uncertainty in estimating bone marrow dosesEstimated cumulative doses lower than from natural background radiation
Occupational exposures
United Kingdom Atomic Energy Authority:prostate cancer [R14]
Information abstracted for study subjects on socio-demographic factors, exposures to radionuclides, external doses and other substances in the workplaceCases and controls selected from an existing cohort
Exposures to some radionuclides tended to be simultaneous, making it difficult to study them individually
UNSCEAR REPORT-PART 3.qxp 10/7/08 3:37 pm Page 174
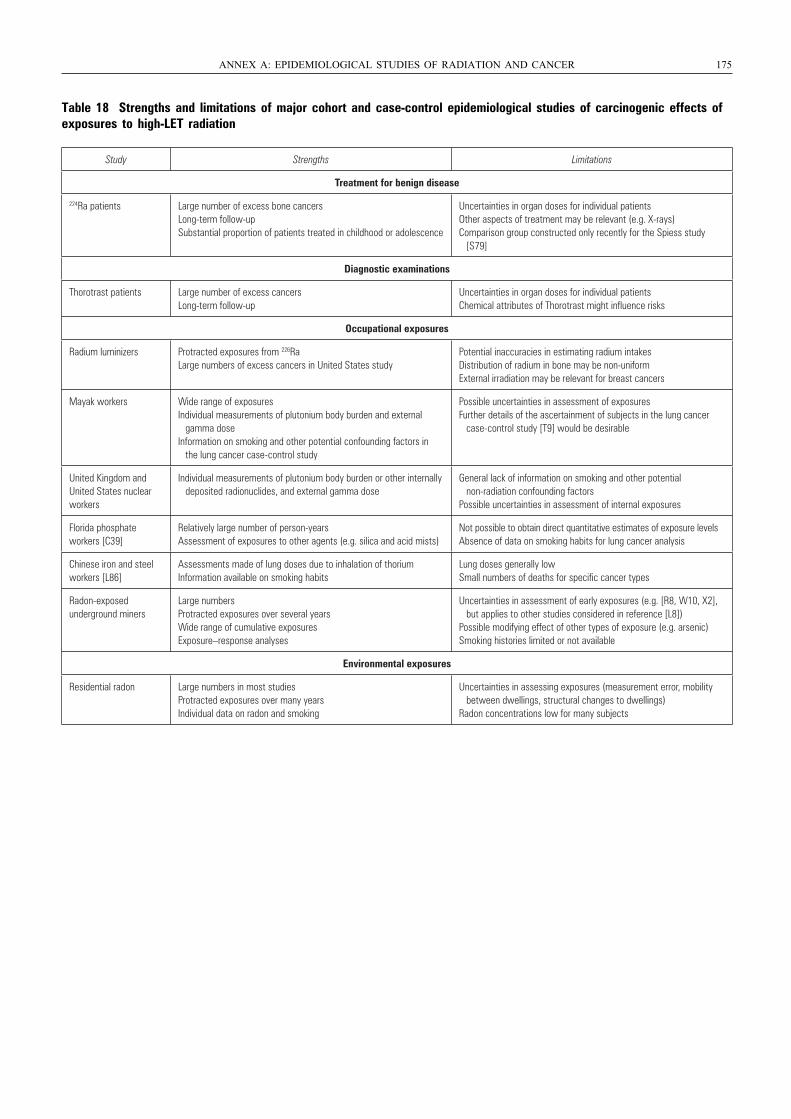
ANNEX A: EPIDEMIOLOGICAL STUDIES OF RADIATION AND CANCER 175
Table 18 Strengths and limitations of major cohort and case-control epidemiological studies of carcinogenic effects ofexposures to high-LET radiation
Study Strengths Limitations
Treatment for benign disease
224Ra patients Large number of excess bone cancers Long-term follow-upSubstantial proportion of patients treated in childhood or adolescence
Uncertainties in organ doses for individual patientsOther aspects of treatment may be relevant (e.g. X-rays)Comparison group constructed only recently for the Spiess study [S79]
Diagnostic examinations
Thorotrast patients Large number of excess cancersLong-term follow-up
Uncertainties in organ doses for individual patientsChemical attributes of Thorotrast might influence risks
Occupational exposures
Radium luminizers Protracted exposures from 226RaLarge numbers of excess cancers in United States study
Potential inaccuracies in estimating radium intakesDistribution of radium in bone may be non-uniformExternal irradiation may be relevant for breast cancers
Mayak workers Wide range of exposuresIndividual measurements of plutonium body burden and external gamma doseInformation on smoking and other potential confounding factors in the lung cancer case-control study
Possible uncertainties in assessment of exposuresFurther details of the ascertainment of subjects in the lung cancer case-control study [T9] would be desirable
United Kingdom and United States nuclear workers
Individual measurements of plutonium body burden or other internally deposited radionuclides, and external gamma dose
General lack of information on smoking and other potential non-radiation confounding factorsPossible uncertainties in assessment of internal exposures
Florida phosphate workers [C39]
Relatively large number of person-yearsAssessment of exposures to other agents (e.g. silica and acid mists)
Not possible to obtain direct quantitative estimates of exposure levelsAbsence of data on smoking habits for lung cancer analysis
Chinese iron and steel workers [L86]
Assessments made of lung doses due to inhalation of thoriumInformation available on smoking habits
Lung doses generally lowSmall numbers of deaths for specific cancer types
Radon-exposed underground miners
Large numbersProtracted exposures over several yearsWide range of cumulative exposuresExposure–response analyses
Uncertainties in assessment of early exposures (e.g. [R8, W10, X2], but applies to other studies considered in reference [L8])Possible modifying effect of other types of exposure (e.g. arsenic)Smoking histories limited or not available
Environmental exposures
Residential radon Large numbers in most studiesProtracted exposures over many yearsIndividual data on radon and smoking
Uncertainties in assessing exposures (measurement error, mobility between dwellings, structural changes to dwellings)Radon concentrations low for many subjects
UNSCEAR REPORT-PART 3.qxp 10/7/08 3:37 pm Page 175
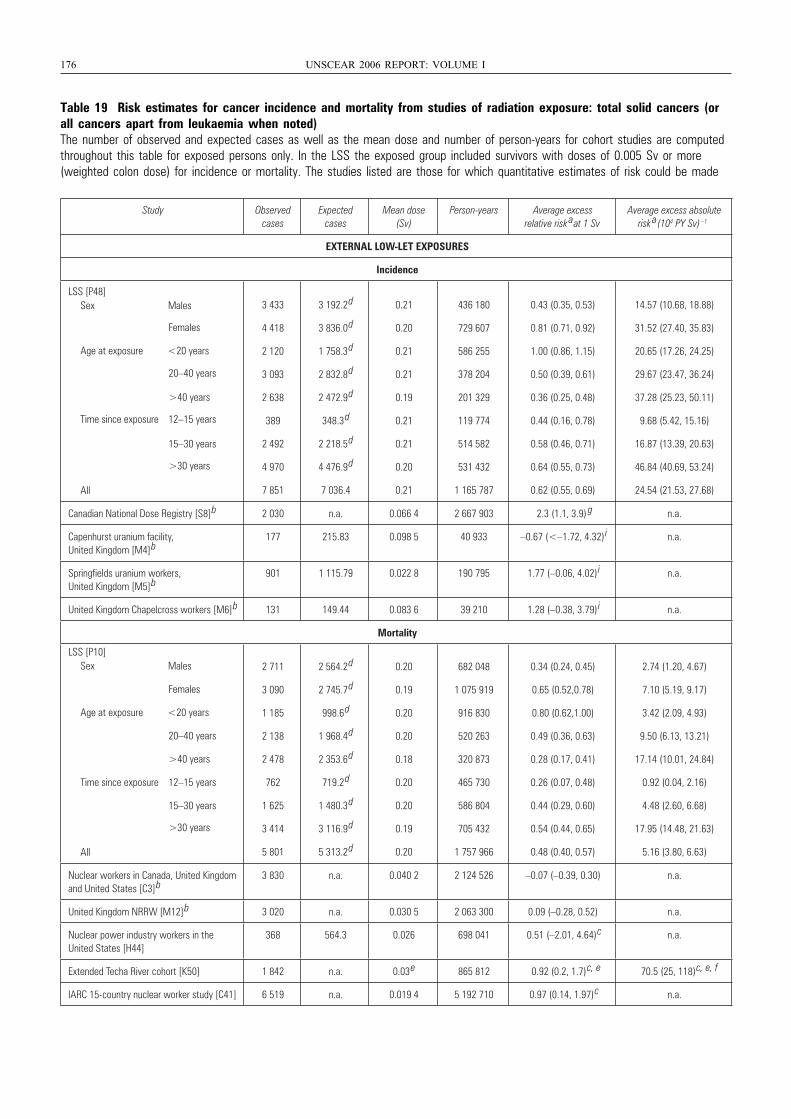
176 UNSCEAR 2006 REPORT: VOLUME I
Table 19 Risk estimates for cancer incidence and mortality from studies of radiation exposure: total solid cancers (orall cancers apart from leukaemia when noted)The number of observed and expected cases as well as the mean dose and number of person-years for cohort studies are computedthroughout this table for exposed persons only. In the LSS the exposed group included survivors with doses of 0.005 Sv or more(weighted colon dose) for incidence or mortality. The studies listed are those for which quantitative estimates of risk could be made
Study Observed cases
Expected cases
Mean dose (Sv)
Person-years Average excess relative risk
a at 1 SvAverage excess absolute
risk a(104 PY Sv) –1
EXTERNAL LOW-LET EXPOSURES
Incidence
LSS [P48] Sex Males
Females
Age at exposure <20 years
20–40 years
>40 years
Time since exposure 12–15 years
15–30 years
>30 years
All
3 433 3 192.2
d 0.21 436 180 0.43 (0.35, 0.53) 14.57 (10.68, 18.88)
4 418 3 836.0
d 0.20 729 607 0.81 (0.71, 0.92) 31.52 (27.40, 35.83)
2 120 1 758.3
d 0.21 586 255 1.00 (0.86, 1.15) 20.65 (17.26, 24.25)
3 093 2 832.8
d 0.21 378 204 0.50 (0.39, 0.61) 29.67 (23.47, 36.24)
2 638 2 472.9
d 0.19 201 329 0.36 (0.25, 0.48) 37.28 (25.23, 50.11)
389 348.3
d 0.21 119 774 0.44 (0.16, 0.78) 9.68 (5.42, 15.16)
2 492 2 218.5
d 0.21 514 582 0.58 (0.46, 0.71) 16.87 (13.39, 20.63)
4 970 4 476.9
d 0.20 531 432 0.64 (0.55, 0.73) 46.84 (40.69, 53.24)
7 851 7 036.4 0.21 1 165 787 0.62 (0.55, 0.69) 24.54 (21.53, 27.68)
Canadian National Dose Registry [S8]
b 2 030 n.a. 0.066 4 2 667 903 2.3 (1.1, 3.9)
g n.a.
Capenhurst uranium facility, United Kingdom [M4]
b177 215.83 0.098 5 40 933 –0.67 (<–1.72, 4.32)
i n.a.
Springfields uranium workers, United Kingdom [M5]
b901 1 115.79 0.022 8 190 795 1.77 (–0.06, 4.02)
i n.a.
United Kingdom Chapelcross workers [M6]
b 131 149.44 0.083 6 39 210 1.28 (–0.38, 3.79)
i n.a.
Mortality
LSS [P10] Sex Males
Females
Age at exposure <20 years
20–40 years
>40 years
Time since exposure 12–15 years
15–30 years
>30 years
All
2 711 2 564.2
d 0.20 682 048 0.34 (0.24, 0.45) 2.74 (1.20, 4.67)
3 090 2 745.7
d 0.19 1 075 919 0.65 (0.52,0.78) 7.10 (5.19, 9.17)
1 185 998.6
d 0.20 916 830 0.80 (0.62,1.00) 3.42 (2.09, 4.93)
2 138 1 968.4
d 0.20 520 263 0.49 (0.36, 0.63) 9.50 (6.13, 13.21)
2 478 2 353.6
d 0.18 320 873 0.28 (0.17, 0.41) 17.14 (10.01, 24.84)
762 719.2
d 0.20 465 730 0.26 (0.07, 0.48) 0.92 (0.04, 2.16)
1 625 1 480.3
d 0.20 586 804 0.44 (0.29, 0.60) 4.48 (2.60, 6.68)
3 414 3 116.9
d 0.19 705 432 0.54 (0.44, 0.65) 17.95 (14.48, 21.63)
5 801 5 313.2
d 0.20 1 757 966 0.48 (0.40, 0.57) 5.16 (3.80, 6.63)
Nuclear workers in Canada, United Kingdom and United States [C3]
b3 830 n.a. 0.040 2 2 124 526 –0.07 (–0.39, 0.30) n.a.
United Kingdom NRRW [M12]
b 3 020 n.a. 0.030 5 2 063 300 0.09 (–0.28, 0.52) n.a.
Nuclear power industry workers in the United States [H44]
368 564.3 0.026 698 041 0.51 (–2.01, 4.64)
c n.a.
Extended Techa River cohort [K50] 1 842 n.a. 0.03
e 865 812 0.92 (0.2, 1.7)
c, e 70.5 (25, 118)
c, e, f
IARC 15-country nuclear worker study [C41] 6 519 n.a. 0.019 4 5 192 710 0.97 (0.14, 1.97)
c n.a.
UNSCEAR REPORT-PART 3.qxp 10/7/08 3:37 pm Page 176
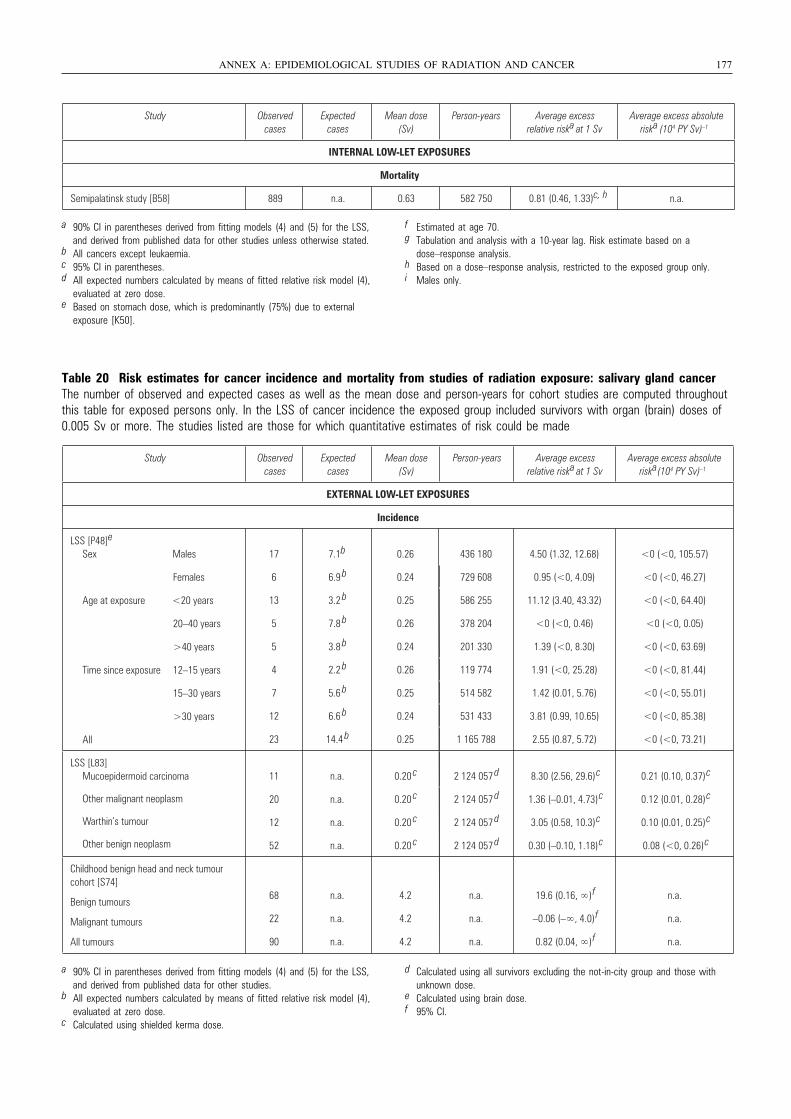
Table 20 Risk estimates for cancer incidence and mortality from studies of radiation exposure: salivary gland cancerThe number of observed and expected cases as well as the mean dose and person-years for cohort studies are computed throughoutthis table for exposed persons only. In the LSS of cancer incidence the exposed group included survivors with organ (brain) doses of0.005 Sv or more. The studies listed are those for which quantitative estimates of risk could be made
ANNEX A: EPIDEMIOLOGICAL STUDIES OF RADIATION AND CANCER 177
Study Observed cases
Expected cases
Mean dose (Sv)
Person-years Average excess relative riska at 1 Sv
Average excess absolute riska (104 PY Sv) –1
INTERNAL LOW-LET EXPOSURES
Mortality
Semipalatinsk study [B58] 889 n.a. 0.63 582 750 0.81 (0.46, 1.33)c, h n.a.
a 90% CI in parentheses derived from fitting models (4) and (5) for the LSS, and derived from published data for other studies unless otherwise stated.
b All cancers except leukaemia.c 95% CI in parentheses.d All expected numbers calculated by means of fitted relative risk model (4),
evaluated at zero dose.e Based on stomach dose, which is predominantly (75%) due to external
exposure [K50].
f Estimated at age 70.g Tabulation and analysis with a 10-year lag. Risk estimate based on a
dose–response analysis.h Based on a dose–response analysis, restricted to the exposed group only.i Males only.
Study Observed cases
Expected cases
Mean dose (Sv)
Person-years Average excess relative riska at 1 Sv
Average excess absolute riska(104 PY Sv) –1
EXTERNAL LOW-LET EXPOSURES
Incidence
LSS [P48]e
Sex Males
Females
Age at exposure <20 years
20–40 years
>40 years
Time since exposure 12–15 years
15–30 years
>30 years
All
17 7.1b 0.26 436 180 4.50 (1.32, 12.68) <0 (<0, 105.57)
6 6.9 b 0.24 729 608 0.95 (<0, 4.09) <0 (<0, 46.27)
13 3.2 b 0.25 586 255 11.12 (3.40, 43.32) <0 (<0, 64.40)
5 7.8 b 0.26 378 204 <0 (<0, 0.46) <0 (<0, 0.05)
5 3.8 b 0.24 201 330 1.39 (<0, 8.30) <0 (<0, 63.69)
4 2.2 b 0.26 119 774 1.91 (<0, 25.28) <0 (<0, 81.44)
7 5.6 b 0.25 514 582 1.42 (0.01, 5.76) <0 (<0, 55.01)
12 6.6 b 0.24 531 433 3.81 (0.99, 10.65) <0 (<0, 85.38)
23 14.4 b 0.25 1 165 788 2.55 (0.87, 5.72) <0 (<0, 73.21)
LSS [L83] Mucoepidermoid carcinoma
Other malignant neoplasm
Warthin’s tumour
Other benign neoplasm
11 n.a. 0.20 c 2 124 057
d 8.30 (2.56, 29.6)
c 0.21 (0.10, 0.37)
c
20 n.a. 0.20 c 2 124 057
d 1.36 (–0.01, 4.73)
c 0.12 (0.01, 0.28)
c
12 n.a. 0.20 c 2 124 057
d 3.05 (0.58, 10.3)
c 0.10 (0.01, 0.25)
c
52 n.a. 0.20 c 2 124 057
d 0.30 (–0.10, 1.18)
c 0.08 (<0, 0.26)
c
Childhood benign head and neck tumour cohort [S74]
Benign tumours
Malignant tumours
All tumours
68 n.a. 4.2 n.a. 19.6 (0.16, ∞)
f n.a.
22 n.a. 4.2 n.a. –0.06 (–∞, 4.0)
f n.a.
90 n.a. 4.2 n.a. 0.82 (0.04, ∞)
f n.a.
a 90% CI in parentheses derived from fitting models (4) and (5) for the LSS, and derived from published data for other studies.
b All expected numbers calculated by means of fitted relative risk model (4), evaluated at zero dose.
c Calculated using shielded kerma dose.
d Calculated using all survivors excluding the not-in-city group and those with unknown dose.
e Calculated using brain dose.f 95% CI.
UNSCEAR REPORT-PART 3.qxp 10/7/08 3:37 pm Page 177
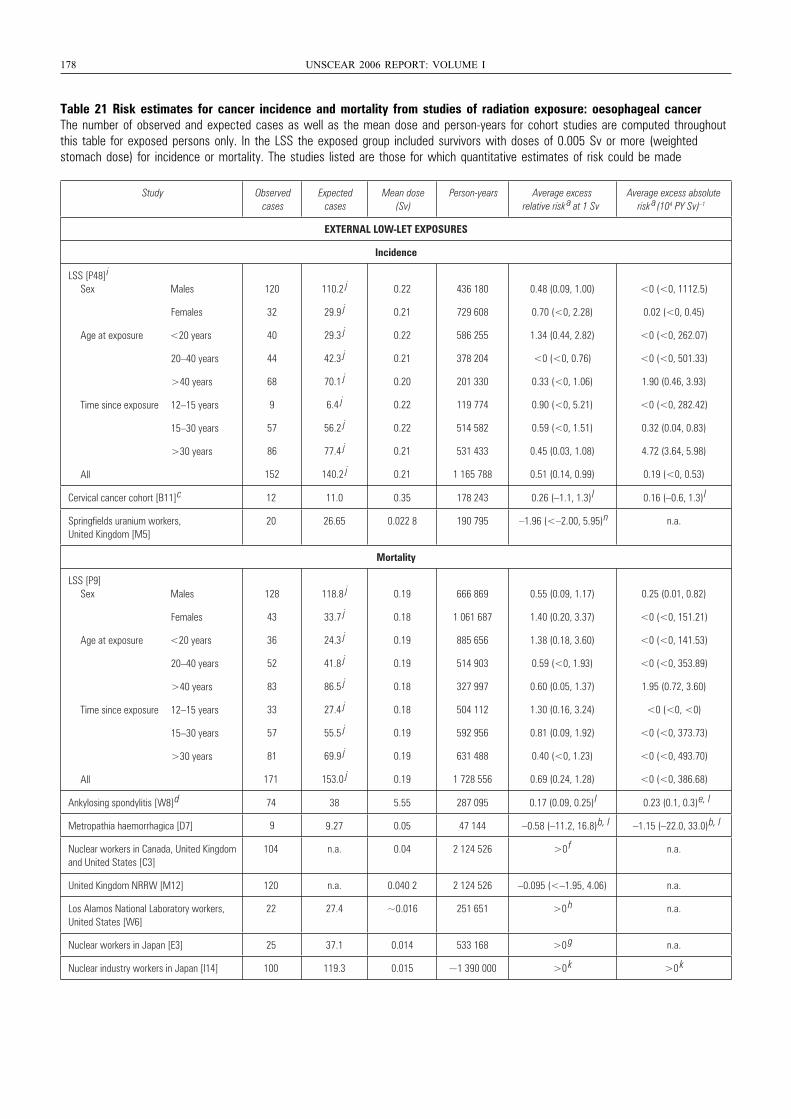
178 UNSCEAR 2006 REPORT: VOLUME I
Table 21 Risk estimates for cancer incidence and mortality from studies of radiation exposure: oesophageal cancerThe number of observed and expected cases as well as the mean dose and person-years for cohort studies are computed throughoutthis table for exposed persons only. In the LSS the exposed group included survivors with doses of 0.005 Sv or more (weighted stomach dose) for incidence or mortality. The studies listed are those for which quantitative estimates of risk could be made
Study Observed cases
Expected cases
Mean dose (Sv)
Person-years Average excess relative risk
a at 1 SvAverage excess absolute
risk a(104 PY Sv) –1
EXTERNAL LOW-LET EXPOSURES
Incidence
LSS [P48]
i
Sex Males
Females
Age at exposure <20 years
20–40 years
>40 years
Time since exposure 12–15 years
15–30 years
>30 years
All
120 110.2
j 0.22 436 180 0.48 (0.09, 1.00) <0 (<0, 1112.5)
32 29.9
j 0.21 729 608 0.70 (<0, 2.28) 0.02 (<0, 0.45)
40 29.3
j 0.22 586 255 1.34 (0.44, 2.82) <0 (<0, 262.07)
44 42.3
j 0.21 378 204 <0 (<0, 0.76) <0 (<0, 501.33)
68 70.1
j 0.20 201 330 0.33 (<0, 1.06) 1.90 (0.46, 3.93)
9 6.4
j 0.22 119 774 0.90 (<0, 5.21) <0 (<0, 282.42)
57 56.2
j 0.22 514 582 0.59 (<0, 1.51) 0.32 (0.04, 0.83)
86 77.4
j 0.21 531 433 0.45 (0.03, 1.08) 4.72 (3.64, 5.98)
152 140.2
j 0.21 1 165 788 0.51 (0.14, 0.99) 0.19 (<0, 0.53)
Cervical cancer cohort [B11]
c 12 11.0 0.35 178 243 0.26 (–1.1, 1.3)
l 0.16 (–0.6, 1.3)
l
Springfields uranium workers, United Kingdom [M5]
20 26.65 0.022 8 190 795 –1.96 (<–2.00, 5.95)
n n.a.
Mortality
LSS [P9] Sex Males
Females
Age at exposure <20 years
20–40 years
>40 years
Time since exposure 12–15 years
15–30 years
>30 years
All
128 118.8
j 0.19 666 869 0.55 (0.09, 1.17) 0.25 (0.01, 0.82)
43 33.7
j 0.18 1 061 687 1.40 (0.20, 3.37) <0 (<0, 151.21)
36 24.3
j 0.19 885 656 1.38 (0.18, 3.60) <0 (<0, 141.53)
52 41.8
j 0.19 514 903 0.59 (<0, 1.93) <0 (<0, 353.89)
83 86.5
j 0.18 327 997 0.60 (0.05, 1.37) 1.95 (0.72, 3.60)
33 27.4
j 0.18 504 112 1.30 (0.16, 3.24) <0 (<0, <0)
57 55.5
j 0.19 592 956 0.81 (0.09, 1.92) <0 (<0, 373.73)
81 69.9
j 0.19 631 488 0.40 (<0, 1.23) <0 (<0, 493.70)
171 153.0
j 0.19 1 728 556 0.69 (0.24, 1.28) <0 (<0, 386.68)
Ankylosing spondylitis [W8]
d 74 38 5.55 287 095 0.17 (0.09, 0.25)
l 0.23 (0.1, 0.3)
e, l
Metropathia haemorrhagica [D7] .27 0.05 47 144 –0.58 (–11.2, 16.8)
b, l –1.15 (–22.0, 33.0)
b, l
Nuclear workers in Canada, United Kingdomand United States [C3]
104 n.a. 0.04 2 124 526 >0
f n.a.
United Kingdom NRRW [M12] 120 n.a. 0.040 2 2 124 526 –0.095 (<–1.95, 4.06) n.a.
Los Alamos National Laboratory workers, United States [W6]
22 27.4 ~0.016 251 651 >0
h n.a.
Nuclear workers in Japan [E3] 25 37.1 0.014 533 168 >0
g n.a.
Nuclear industry workers in Japan [I14] 100 119.3 0.015 ~1 390 000 >0
k >0
k
9 9
UNSCEAR REPORT-PART 3.qxp 10/7/08 3:37 pm Page 178
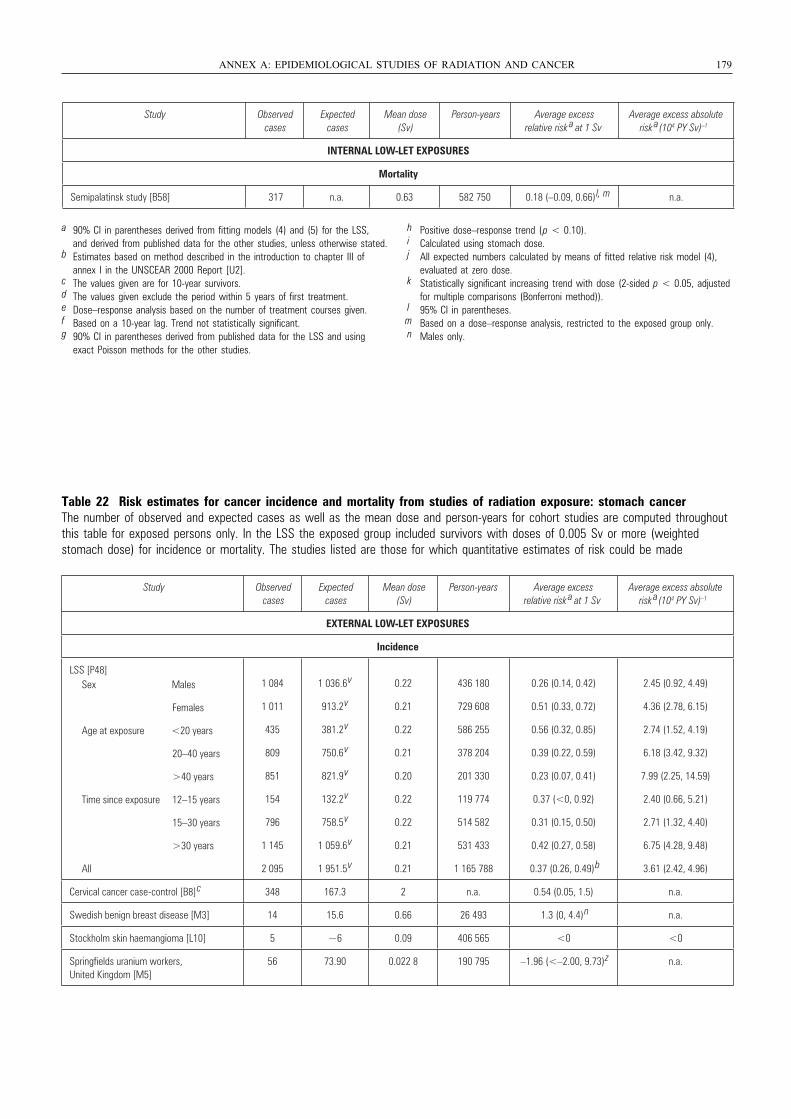
a 90% CI in parentheses derived from fitting models (4) and (5) for the LSS, and derived from published data for the other studies, unless otherwise stated.
b Estimates based on method described in the introduction to chapter III of annex I in the UNSCEAR 2000 Report [U2].
c The values given are for 10-year survivors.d The values given exclude the period within 5 years of first treatment.e Dose–response analysis based on the number of treatment courses given.f Based on a 10-year lag. Trend not statistically significant.g 90% CI in parentheses derived from published data for the LSS and using
exact Poisson methods for the other studies.
h Positive dose–response trend (p < 0.10).i Calculated using stomach dose.j All expected numbers calculated by means of fitted relative risk model (4),
evaluated at zero dose.k Statistically significant increasing trend with dose (2-sided p < 0.05, adjusted
for multiple comparisons (Bonferroni method)).l 95% CI in parentheses.m Based on a dose–response analysis, restricted to the exposed group only.n Males only.
ANNEX A: EPIDEMIOLOGICAL STUDIES OF RADIATION AND CANCER 179
Study Observed cases
Expected cases
Mean dose (Sv)
Person-years Average excess relative risk
a at 1 SvAverage excess absolute
risk a(104 PY Sv) –1
INTERNAL LOW-LET EXPOSURES
Mortality
Semipalatinsk study [B58] 317 n.a. 0.63 582 750 0.18 (–0.09, 0.66)
l, m n.a.
Table 22 Risk estimates for cancer incidence and mortality from studies of radiation exposure: stomach cancerThe number of observed and expected cases as well as the mean dose and person-years for cohort studies are computed throughoutthis table for exposed persons only. In the LSS the exposed group included survivors with doses of 0.005 Sv or more (weighted stomach dose) for incidence or mortality. The studies listed are those for which quantitative estimates of risk could be made
Study Observed cases
Expected cases
Mean dose (Sv)
Person-years Average excess relative risk
a at 1 SvAverage excess absolute
risk a(104 PY Sv) –1
EXTERNAL LOW-LET EXPOSURES
Incidence
LSS [P48] Sex Males
Females
Age at exposure <20 years
20–40 years
>40 years
Time since exposure 12–15 years
15–30 years
>30 years
All
1 084 1 036.6
v 0.22 436 180 0.26 (0.14, 0.42) 2.45 (0.92, 4.49)
1 011 913.2
v 0.21 729 608 0.51 (0.33, 0.72) 4.36 (2.78, 6.15)
435 381.2
v 0.22 586 255 0.56 (0.32, 0.85) 2.74 (1.52, 4.19)
809 750.6
v 0.21 378 204 0.39 (0.22, 0.59) 6.18 (3.42, 9.32)
851 821.9
v 0.20 201 330 0.23 (0.07, 0.41) 7.99 (2.25, 14.59)
154 132.2
v 0.22 119 774 0.37 (<0, 0.92) 2.40 (0.66, 5.21)
796 758.5
v 0.22 514 582 0.31 (0.15, 0.50) 2.71 (1.32, 4.40)
1 145 1 059.6
v 0.21 531 433 0.42 (0.27, 0.58) 6.75 (4.28, 9.48)
2 095 1 951.5
v 0.21 1 165 788 0.37 (0.26, 0.49)
b 3.61 (2.42, 4.96)
Cervical cancer case-control [B8]
c 348 167.3 2 n.a. 0.54 (0.05, 1.5) n.a.
Swedish benign breast disease [M3] 14 15.6 0.66 26 493 1.3 (0, 4.4)
n n.a.
Stockholm skin haemangioma [L10] 5 ~6 0.09 406 565 <0 <0
Springfields uranium workers, United Kingdom [M5]
56 73.90 0.022 8 190 795 –1.96 (<–2.00, 9.73)
z n.a.
UNSCEAR REPORT-PART 3.qxp 10/7/08 3:37 pm Page 179
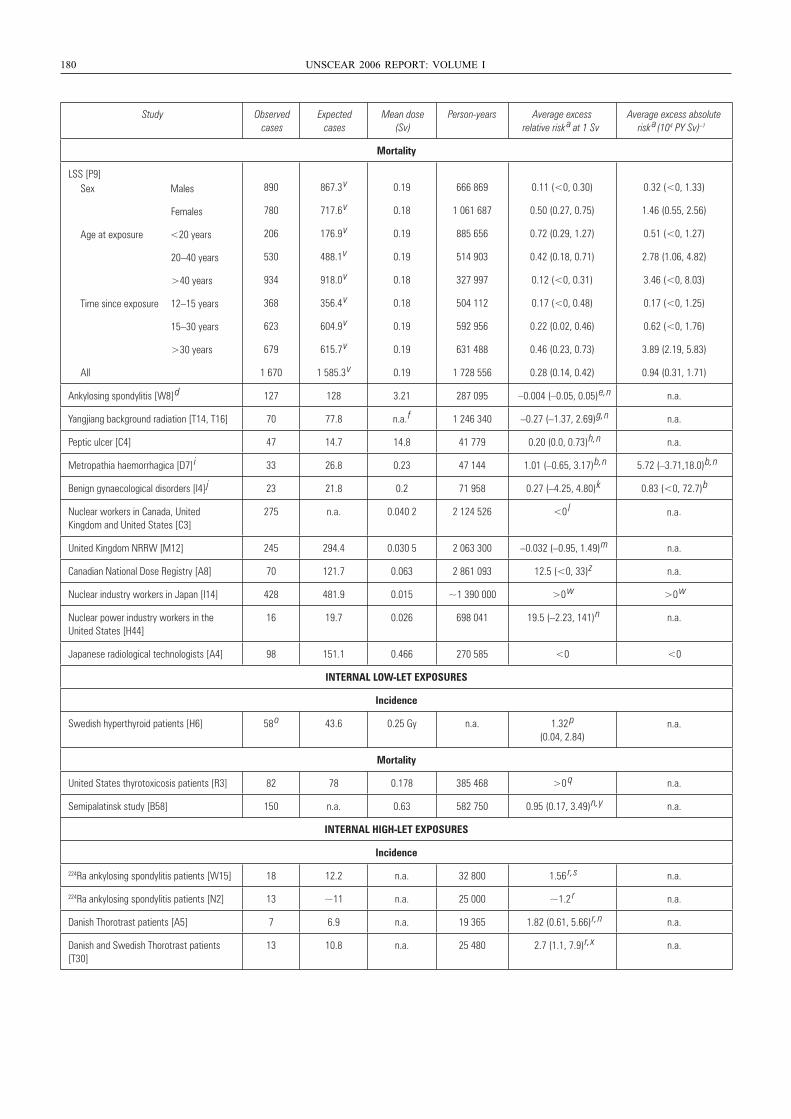
180 UNSCEAR 2006 REPORT: VOLUME I
Study Observed cases
Expected cases
Mean dose (Sv)
Person-years Average excess relative risk
a at 1 SvAverage excess absolute
risk a(104 PY Sv) –1
Mortality
LSS [P9] Sex Males
Females
Age at exposure <20 years
20–40 years
>40 years
Time since exposure 12–15 years
15–30 years
>30 years
All
890 867.3 v 0.19 666 869 0.11 (<0, 0.30) 0.32 (<0, 1.33)
780 717.6 v 0.18 1 061 687 0.50 (0.27, 0.75) 1.46 (0.55, 2.56)
206 176.9 v 0.19 885 656 0.72 (0.29, 1.27) 0.51 (<0, 1.27)
530 488.1
v 0.19 514 903 0.42 (0.18, 0.71) 2.78 (1.06, 4.82)
934 918.0 v 0.18 327 997 0.12 (<0, 0.31) 3.46 (<0, 8.03)
368 356.4 v 0.18 504 112 0.17 (<0, 0.48) 0.17 (<0, 1.25)
623 604.9 v 0.19 592 956 0.22 (0.02, 0.46) 0.62 (<0, 1.76)
679 615.7 v 0.19 631 488 0.46 (0.23, 0.73) 3.89 (2.19, 5.83)
1 670 1 585.3 v 0.19 1 728 556 0.28 (0.14, 0.42) 0.94 (0.31, 1.71)
Ankylosing spondylitis [W8] d 127 128 3.21 287 095 –0.004 (–0.05, 0.05)
e, n n.a.
Yangjiang background radiation [T14, T16] 70 77.8 n.a. f 1 246 340 –0.27 (–1.37, 2.69)
g, n n.a.
Peptic ulcer [C4] 47 14.7 14.8 41 779 0.20 (0.0, 0.73)
h, n n.a.
Metropathia haemorrhagica [D7] i 33 26.8 0.23 47 144 1.01 (–0.65, 3.17)
b, n 5.72 (–3.71,18.0)
b, n
Benign gynaecological disorders [I4] j 23 21.8 0.2 71 958 0.27 (–4.25, 4.80)
k 0.83 (<0, 72.7)
b
Nuclear workers in Canada, United Kingdom and United States [C3]
275 n.a. 0.040 2 2 124 526 <0
l n.a.
United Kingdom NRRW [M12] 245 294.4 0.030 5 2 063 300 –0.032 (–0.95, 1.49)
m n.a.
Canadian National Dose Registry [A8] 70 121.7 0.063 2 861 093 12.5 (<0, 33)
z n.a.
Nuclear industry workers in Japan [I14] 428 481.9 0.015 ~1 390 000 >0
w >0
w
Nuclear power industry workers in the United States [H44]
16 19.7 0.026 698 041 19.5 (–2.23, 141)
n n.a.
Japanese radiological technologists [A4] 98 151.1 0.466 270 585 <0 <0
INTERNAL LOW-LET EXPOSURES
Incidence
Swedish hyperthyroid patients [H6] 58 o 43.6 0.25 Gy n.a. 1.32
p (0.04, 2.84)
n.a.
Mortality
United States thyrotoxicosis patients [R3] 82 78 0.178 385 468 >0
q n.a.
Semipalatinsk study [B58] 150 n.a. 0.63 582 750 0.95 (0.17, 3.49)
n, y n.a.
INTERNAL HIGH-LET EXPOSURES
Incidence
224Ra ankylosing spondylitis patients [W15] 18 12.2 n.a. 32 800 1.56
r, s n.a.
224Ra ankylosing spondylitis patients [N2] 13 ~11 n.a. 25 000 ~1.2
r n.a.
Danish Thorotrast patients [A5] 7 6.9 n.a. 19 365 1.82 (0.61, 5.66)
r, n n.a.
Danish and Swedish Thorotrast patients [T30]
13 10.8 n.a. 25 480 2.7 (1.1, 7.9)
r, x n.a.
UNSCEAR REPORT-PART 3.qxp 10/7/08 3:37 pm Page 180
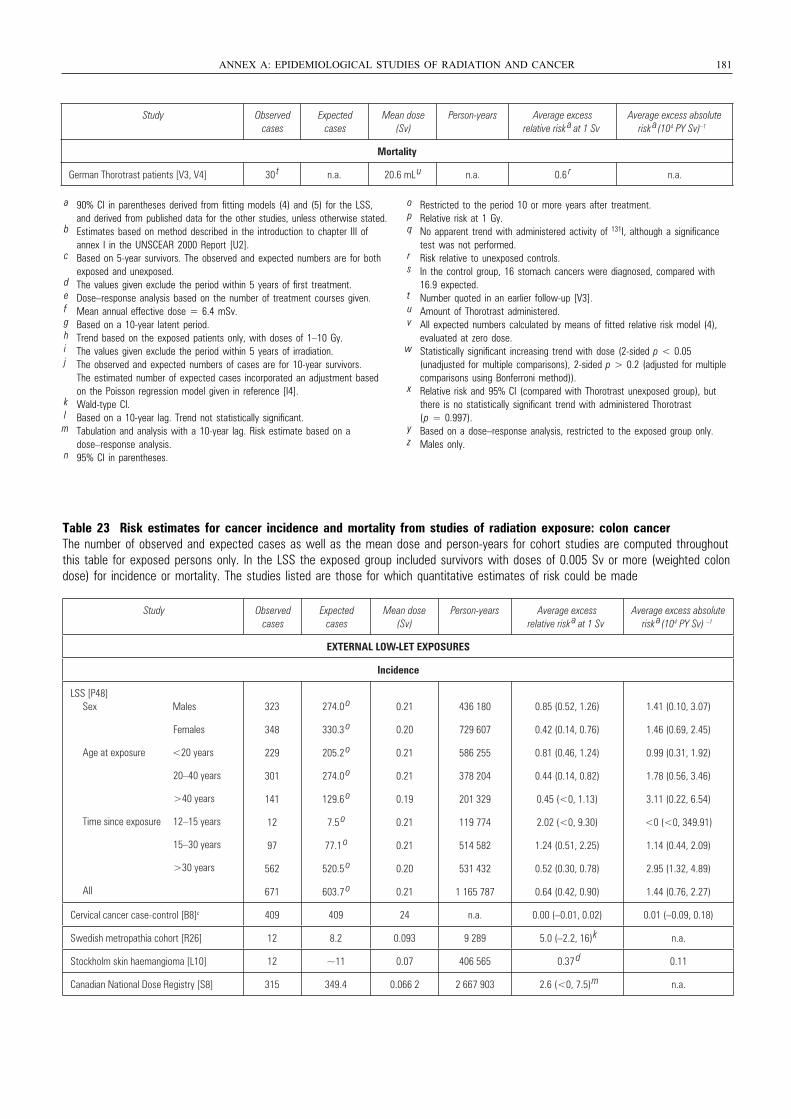
a 90% CI in parentheses derived from fitting models (4) and (5) for the LSS, and derived from published data for the other studies, unless otherwise stated.
b Estimates based on method described in the introduction to chapter III of annex I in the UNSCEAR 2000 Report [U2].
c Based on 5-year survivors. The observed and expected numbers are for both exposed and unexposed.
d The values given exclude the period within 5 years of first treatment. e Dose–response analysis based on the number of treatment courses given.f Mean annual effective dose = 6.4 mSv.g Based on a 10-year latent period.h Trend based on the exposed patients only, with doses of 1–10 Gy.i The values given exclude the period within 5 years of irradiation.j The observed and expected numbers of cases are for 10-year survivors.
The estimated number of expected cases incorporated an adjustment based on the Poisson regression model given in reference [I4].
k Wald-type CI.l Based on a 10-year lag. Trend not statistically significant.m Tabulation and analysis with a 10-year lag. Risk estimate based on a
dose–response analysis.n 95% CI in parentheses.
o Restricted to the period 10 or more years after treatment.p Relative risk at 1 Gy.q No apparent trend with administered activity of 131I, although a significance
test was not performed.r Risk relative to unexposed controls.s In the control group, 16 stomach cancers were diagnosed, compared with
16.9 expected.t Number quoted in an earlier follow-up [V3].u Amount of Thorotrast administered.v All expected numbers calculated by means of fitted relative risk model (4),
evaluated at zero dose.w Statistically significant increasing trend with dose (2-sided p < 0.05
(unadjusted for multiple comparisons), 2-sided p > 0.2 (adjusted for multiple comparisons using Bonferroni method)).
x Relative risk and 95% CI (compared with Thorotrast unexposed group), but there is no statistically significant trend with administered Thorotrast (p = 0.997).
y Based on a dose–response analysis, restricted to the exposed group only.z Males only.
ANNEX A: EPIDEMIOLOGICAL STUDIES OF RADIATION AND CANCER 181
Study Observed cases
Expected cases
Mean dose (Sv)
Person-years Average excess relative risk
a at 1 SvAverage excess absolute
risk a (104 PY Sv) –1
Mortality
German Thorotrast patients [V3, V4] 30 t n.a. 20.6 mL
u n.a. 0.6 r n.a.
Table 23 Risk estimates for cancer incidence and mortality from studies of radiation exposure: colon cancerThe number of observed and expected cases as well as the mean dose and person-years for cohort studies are computed throughoutthis table for exposed persons only. In the LSS the exposed group included survivors with doses of 0.005 Sv or more (weighted colondose) for incidence or mortality. The studies listed are those for which quantitative estimates of risk could be made
Study Observed cases
Expected cases
Mean dose (Sv)
Person-years Average excess relative risk
a at 1 SvAverage excess absolute
risk a (104 PY Sv) –1
EXTERNAL LOW-LET EXPOSURES
Incidence
LSS [P48] Sex Males
Females
Age at exposure <20 years
20–40 years
>40 years
Time since exposure 12–15 years
15–30 years
>30 years
All
323 274.0 o 0.21 436 180 0.85 (0.52, 1.26) 1.41 (0.10, 3.07)
348 330.3 o 0.20 729 607 0.42 (0.14, 0.76) 1.46 (0.69, 2.45)
229 205.2 o 0.21 586 255 0.81 (0.46, 1.24) 0.99 (0.31, 1.92)
301 274.0 o 0.21 378 204 0.44 (0.14, 0.82) 1.78 (0.56, 3.46)
141 129.6 o 0.19 201 329 0.45 (<0, 1.13) 3.11 (0.22, 6.54)
12 7.5 o 0.21 119 774 2.02 (<0, 9.30) <0 (<0, 349.91)
97 77.1 o 0.21 514 582 1.24 (0.51, 2.25) 1.14 (0.44, 2.09)
562 520.5 o 0.20 531 432 0.52 (0.30, 0.78) 2.95 (1.32, 4.89)
671 603.7 o 0.21 1 165 787 0.64 (0.42, 0.90) 1.44 (0.76, 2.27)
Cervical cancer case-control [B8]c 409 409 24 n.a. 0.00 (–0.01, 0.02) 0.01 (–0.09, 0.18)
Swedish metropathia cohort [R26] 12 8.2 0.093 9 289 5.0 (–2.2, 16)
k n.a.
Stockholm skin haemangioma [L10] 12 ~11 0.07 406 565 0.37 d 0.11
Canadian National Dose Registry [S8] 315 349.4 0.066 2 2 667 903 2.6 (<0, 7.5)
m n.a.
UNSCEAR REPORT-PART 3.qxp 10/7/08 3:37 pm Page 181
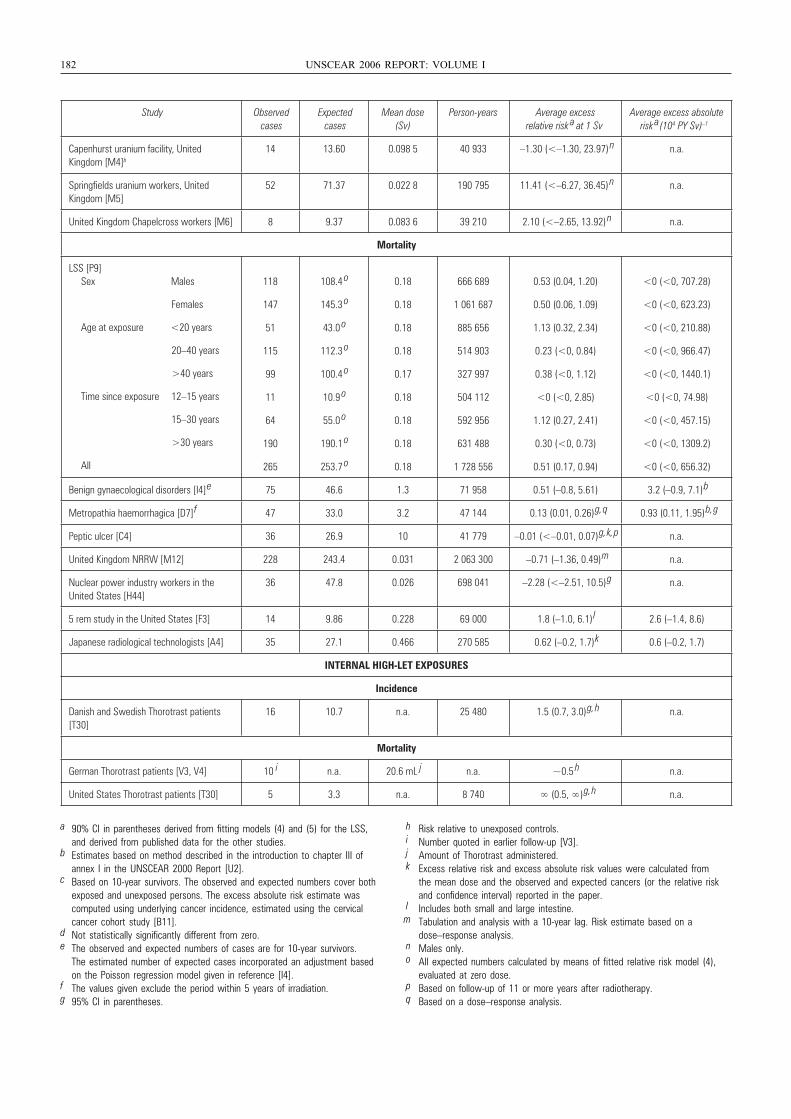
182 UNSCEAR 2006 REPORT: VOLUME I
a 90% CI in parentheses derived from fitting models (4) and (5) for the LSS, and derived from published data for the other studies.
b Estimates based on method described in the introduction to chapter III of annex I in the UNSCEAR 2000 Report [U2].
c Based on 10-year survivors. The observed and expected numbers cover both exposed and unexposed persons. The excess absolute risk estimate was computed using underlying cancer incidence, estimated using the cervical cancer cohort study [B11].
d Not statistically significantly different from zero.e The observed and expected numbers of cases are for 10-year survivors.
The estimated number of expected cases incorporated an adjustment based on the Poisson regression model given in reference [I4].
f The values given exclude the period within 5 years of irradiation.g 95% CI in parentheses.
h Risk relative to unexposed controls.i Number quoted in earlier follow-up [V3].j Amount of Thorotrast administered.k Excess relative risk and excess absolute risk values were calculated from
the mean dose and the observed and expected cancers (or the relative risk and confidence interval) reported in the paper.
l Includes both small and large intestine.m Tabulation and analysis with a 10-year lag. Risk estimate based on a
dose–response analysis.n Males only.o All expected numbers calculated by means of fitted relative risk model (4),
evaluated at zero dose.p Based on follow-up of 11 or more years after radiotherapy.q Based on a dose–response analysis.
Study Observed cases
Expected cases
Mean dose (Sv)
Person-years Average excess relative risk
a at 1 SvAverage excess absolute
risk a(104 PY Sv) –1
Capenhurst uranium facility, United Kingdom [M4]b
14 13.60 0.098 5 40 933 –1.30 (<–1.30, 23.97) n n.a.
Springfields uranium workers, United Kingdom [M5]
52 71.37 0.022 8 190 795 11.41 (<–6.27, 36.45) n n.a.
United Kingdom Chapelcross workers [M6] 8 9.37 0.083 6 39 210 2.10 (<–2.65, 13.92) n n.a.
Mortality
LSS [P9] Sex Males
Females
Age at exposure <20 years
20–40 years
>40 years
Time since exposure 12–15 years
15–30 years
>30 years
All
118 108.4 o 0.18 666 689 0.53 (0.04, 1.20) <0 (<0, 707.28)
147 145.3 o 0.18 1 061 687 0.50 (0.06, 1.09) <0 (<0, 623.23)
51 43.0 o 0.18 885 656 1.13 (0.32, 2.34) <0 (<0, 210.88)
115 112.3 o 0.18 514 903 0.23 (<0, 0.84) <0 (<0, 966.47)
99 100.4 o 0.17 327 997 0.38 (<0, 1.12) <0 (<0, 1440.1)
11 10.9 o 0.18 504 112 <0 (<0, 2.85) <0 (<0, 74.98)
64 55.0 o 0.18 592 956 1.12 (0.27, 2.41) <0 (<0, 457.15)
190 190.1 o 0.18 631 488 0.30 (<0, 0.73) <0 (<0, 1309.2)
265 253.7 o 0.18 1 728 556 0.51 (0.17, 0.94) <0 (<0, 656.32)
Benign gynaecological disorders [I4]
e 75 46.6 1.3 71 958 0.51 (–0.8, 5.61) 3.2 (–0.9, 7.1)
b
Metropathia haemorrhagica [D7]
f 47 33.0 3.2 47 144 0.13 (0.01, 0.26)
g, q 0.93 (0.11, 1.95)
b, g
Peptic ulcer [C4] 36 26.9 10 41 779 –0.01 (<–0.01, 0.07)
g, k, p n.a.
United Kingdom NRRW [M12] 228 243.4 0.031 2 063 300 –0.71 (–1.36, 0.49)
m n.a.
Nuclear power industry workers in the United States [H44]
36 47.8 0.026 698 041 –2.28 (<–2.51, 10.5)
g n.a.
5 rem study in the United States [F3] 14 9.86 0.228 69 000 1.8 (–1.0, 6.1)
l 2.6 (–1.4, 8.6)
Japanese radiological technologists [A4] 35 27.1 0.466 270 585 0.62 (–0.2, 1.7)
k 0.6 (–0.2, 1.7)
INTERNAL HIGH-LET EXPOSURES
Incidence
Danish and Swedish Thorotrast patients [T30]
16 10.7 n.a. 25 480 1.5 (0.7, 3.0)
g, h n.a.
Mortality
German Thorotrast patients [V3, V4] 10 i n.a. 20.6 mL j n.a. ~0.5 h n.a.
United States Thorotrast patients [T30] 5 3.3 n.a. 8 740 ∞ (0.5, ∞)
g, h n.a.
UNSCEAR REPORT-PART 3.qxp 10/7/08 3:37 pm Page 182
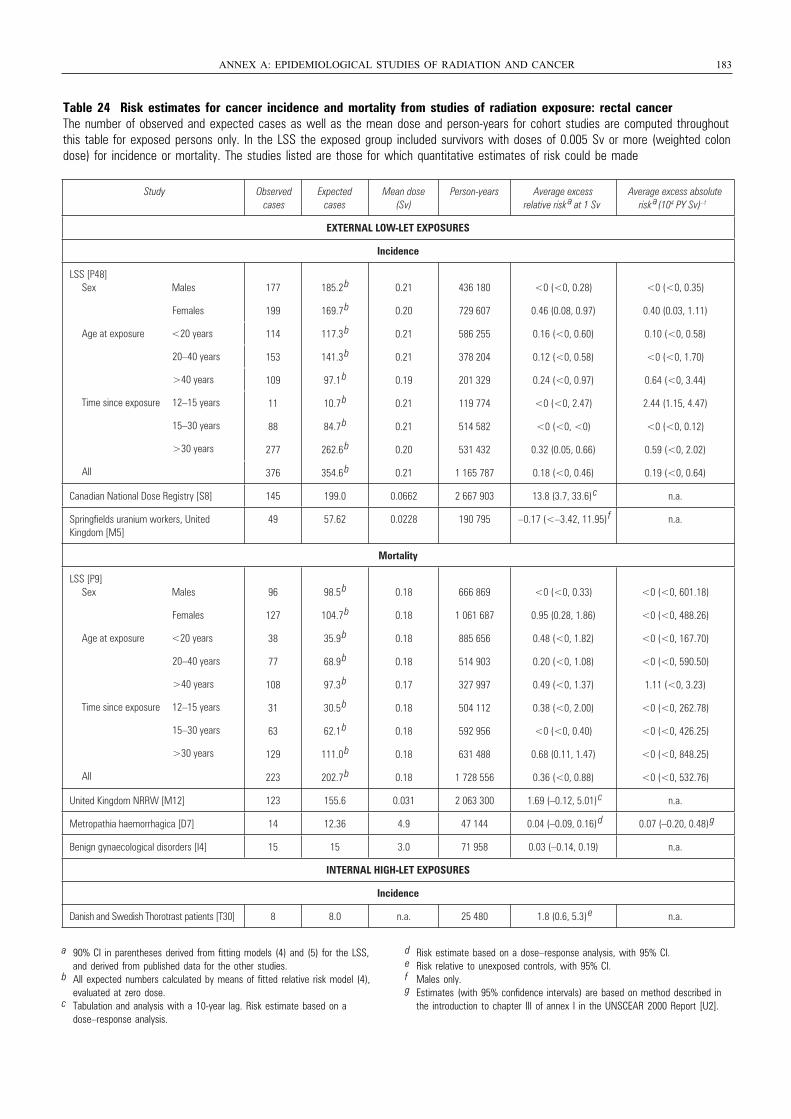
ANNEX A: EPIDEMIOLOGICAL STUDIES OF RADIATION AND CANCER 183
Table 24 Risk estimates for cancer incidence and mortality from studies of radiation exposure: rectal cancerThe number of observed and expected cases as well as the mean dose and person-years for cohort studies are computed throughoutthis table for exposed persons only. In the LSS the exposed group included survivors with doses of 0.005 Sv or more (weighted colondose) for incidence or mortality. The studies listed are those for which quantitative estimates of risk could be made
Study Observed cases
Expected cases
Mean dose (Sv)
Person-years Average excess relative risk a at 1 Sv
Average excess absolute risk a(104 PY Sv) –1
EXTERNAL LOW-LET EXPOSURES
Incidence
LSS [P48] Sex Males
Females
Age at exposure <20 years
20–40 years
>40 years
Time since exposure 12–15 years
15–30 years
>30 years
All
177 185.2 b 0.21 436 180 <0 (<0, 0.28) <0 (<0, 0.35)
199 169.7 b 0.20 729 607 0.46 (0.08, 0.97) 0.40 (0.03, 1.11)
114 117.3 b 0.21 586 255 0.16 (<0, 0.60) 0.10 (<0, 0.58)
153 141.3 b 0.21 378 204 0.12 (<0, 0.58) <0 (<0, 1.70)
109 97.1 b 0.19 201 329 0.24 (<0, 0.97) 0.64 (<0, 3.44)
11 10.7 b 0.21 119 774 <0 (<0, 2.47) 2.44 (1.15, 4.47)
88 84.7 b 0.21 514 582 <0 (<0, <0) <0 (<0, 0.12)
277 262.6 b 0.20 531 432 0.32 (0.05, 0.66) 0.59 (<0, 2.02)
376 354.6 b 0.21 1 165 787 0.18 (<0, 0.46) 0.19 (<0, 0.64)
Canadian National Dose Registry [S8] 145 199.0 0.0662 2 667 903 13.8 (3.7, 33.6) c n.a.
Springfields uranium workers, United Kingdom [M5]
49 57.62 0.0228 190 795 –0.17 (<–3.42, 11.95) f n.a.
Mortality
LSS [P9] Sex Males
Females
Age at exposure <20 years
20–40 years
>40 years
Time since exposure 12–15 years
15–30 years
>30 years
All
96 98.5 b 0.18 666 869 <0 (<0, 0.33) <0 (<0, 601.18)
127 104.7 b 0.18 1 061 687 0.95 (0.28, 1.86) <0 (<0, 488.26)
38 35.9 b 0.18 885 656 0.48 (<0, 1.82) <0 (<0, 167.70)
77 68.9 b 0.18 514 903 0.20 (<0, 1.08) <0 (<0, 590.50)
108 97.3 b 0.17 327 997 0.49 (<0, 1.37) 1.11 (<0, 3.23)
31 30.5 b 0.18 504 112 0.38 (<0, 2.00) <0 (<0, 262.78)
63 62.1 b 0.18 592 956 <0 (<0, 0.40) <0 (<0, 426.25)
129 111.0 b 0.18 631 488 0.68 (0.11, 1.47) <0 (<0, 848.25)
223 202.7 b 0.18 1 728 556 0.36 (<0, 0.88) <0 (<0, 532.76)
United Kingdom NRRW [M12] 123 155.6 0.031 2 063 300 1.69 (–0.12, 5.01) c n.a.
Metropathia haemorrhagica [D7] 14 12.36 4.9 47 144 0.04 (–0.09, 0.16) d 0.07 (–0.20, 0.48)
g
Benign gynaecological disorders [I4] 15 15 3.0 71 958 0.03 (–0.14, 0.19) n.a.
INTERNAL HIGH-LET EXPOSURES
Incidence
Danish and Swedish Thorotrast patients [T30] 8 8.0 n.a. 25 480 1.8 (0.6, 5.3) e n.a.
a 90% CI in parentheses derived from fitting models (4) and (5) for the LSS, and derived from published data for the other studies.
b All expected numbers calculated by means of fitted relative risk model (4), evaluated at zero dose.
c Tabulation and analysis with a 10-year lag. Risk estimate based on a dose–response analysis.
d Risk estimate based on a dose–response analysis, with 95% CI.e Risk relative to unexposed controls, with 95% CI.f Males only.g Estimates (with 95% confidence intervals) are based on method described in
the introduction to chapter III of annex I in the UNSCEAR 2000 Report [U2].
UNSCEAR REPORT-PART 3.qxp 10/7/08 3:37 pm Page 183
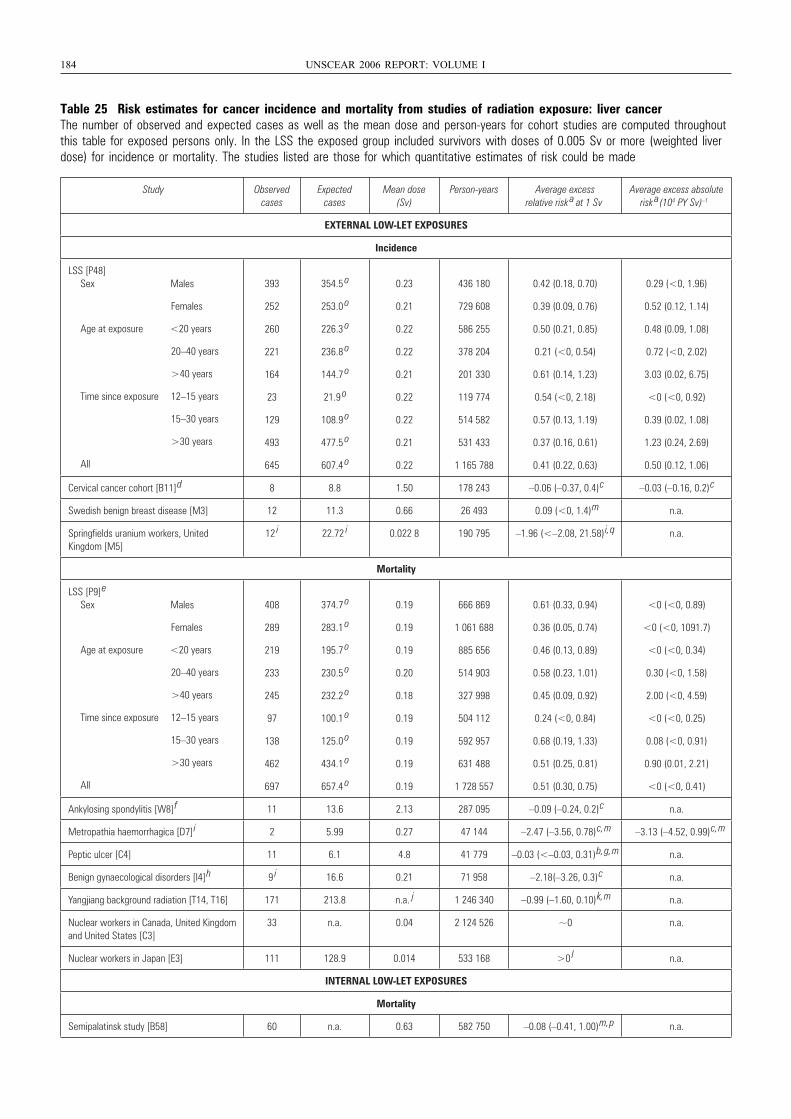
184 UNSCEAR 2006 REPORT: VOLUME I
Table 25 Risk estimates for cancer incidence and mortality from studies of radiation exposure: liver cancerThe number of observed and expected cases as well as the mean dose and person-years for cohort studies are computed throughoutthis table for exposed persons only. In the LSS the exposed group included survivors with doses of 0.005 Sv or more (weighted liverdose) for incidence or mortality. The studies listed are those for which quantitative estimates of risk could be made
Study Observed cases
Expected cases
Mean dose (Sv)
Person-years Average excess relative risk a at 1 Sv
Average excess absolute risk a(104 PY Sv) –1
EXTERNAL LOW-LET EXPOSURES
Incidence
LSS [P48] Sex Males
Females
Age at exposure <20 years
20–40 years
>40 years
Time since exposure 12–15 years
15–30 years
>30 years
All
393 354.5 o 0.23 436 180 0.42 (0.18, 0.70) 0.29 (<0, 1.96)
252 253.0 o 0.21 729 608 0.39 (0.09, 0.76) 0.52 (0.12, 1.14)
260 226.3 o 0.22 586 255 0.50 (0.21, 0.85) 0.48 (0.09, 1.08)
221 236.8 o 0.22 378 204 0.21 (<0, 0.54) 0.72 (<0, 2.02)
164 144.7 o 0.21 201 330 0.61 (0.14, 1.23) 3.03 (0.02, 6.75)
23 21.9 o 0.22 119 774 0.54 (<0, 2.18) <0 (<0, 0.92)
129 108.9 o 0.22 514 582 0.57 (0.13, 1.19) 0.39 (0.02, 1.08)
493 477.5 o 0.21 531 433 0.37 (0.16, 0.61) 1.23 (0.24, 2.69)
645 607.4 o 0.22 1 165 788 0.41 (0.22, 0.63) 0.50 (0.12, 1.06)
Cervical cancer cohort [B11]
d 8 8.8 1.50 178 243 –0.06 (–0.37, 0.4)
c –0.03 (–0.16, 0.2)
c
Swedish benign breast disease [M3] 12 11.3 0.66 26 493 0.09 (<0, 1.4)
m n.a.
Springfields uranium workers, United Kingdom [M5]
12 i 22.72
i 0.022 8 190 795 –1.96 (<–2.08, 21.58)
i, q n.a.
Mortality
LSS [P9]
e
Sex Males
Females
Age at exposure <20 years
20–40 years
>40 years
Time since exposure 12–15 years
15–30 years
>30 years
All
408 374.7 o 0.19 666 869 0.61 (0.33, 0.94) <0 (<0, 0.89)
289 283.1 o 0.19 1 061 688 0.36 (0.05, 0.74) <0 (<0, 1091.7)
219 195.7 o 0.19 885 656 0.46 (0.13, 0.89) <0 (<0, 0.34)
233 230.5 o 0.20 514 903 0.58 (0.23, 1.01) 0.30 (<0, 1.58)
245 232.2 o 0.18 327 998 0.45 (0.09, 0.92) 2.00 (<0, 4.59)
97 100.1 o 0.19 504 112 0.24 (<0, 0.84) <0 (<0, 0.25)
138 125.0 o 0.19 592 957 0.68 (0.19, 1.33) 0.08 (<0, 0.91)
462 434.1 o 0.19 631 488 0.51 (0.25, 0.81) 0.90 (0.01, 2.21)
697 657.4 o 0.19 1 728 557 0.51 (0.30, 0.75) <0 (<0, 0.41)
Ankylosing spondylitis [W8]
f 11 13.6 2.13 287 095 –0.09 (–0.24, 0.2)
c n.a.
Metropathia haemorrhagica [D7]
i 2 5.99 0.27 47 144 –2.47 (–3.56, 0.78)
c, m –3.13 (–4.52, 0.99)
c, m
Peptic ulcer [C4] 11 6.1 4.8 41 779 –0.03 (<–0.03, 0.31)
b, g, m n.a.
Benign gynaecological disorders [I4]
h 9 i 16.6 0.21 71 958 –2.18(–3.26, 0.3)
c n.a.
Yangjiang background radiation [T14, T16] 171 213.8 n.a. j 1 246 340 –0.99 (–1.60, 0.10)
k, m n.a.
Nuclear workers in Canada, United Kingdom and United States [C3]
33 n.a. 0.04 2 124 526 ~0 n.a.
Nuclear workers in Japan [E3] 111 128.9 0.014 533 168 >0 l n.a.
INTERNAL LOW-LET EXPOSURES
Mortality
Semipalatinsk study [B58] 60 n.a. 0.63 582 750 –0.08 (–0.41, 1.00)
m, p n.a.
UNSCEAR REPORT-PART 3.qxp 10/7/08 3:37 pm Page 184
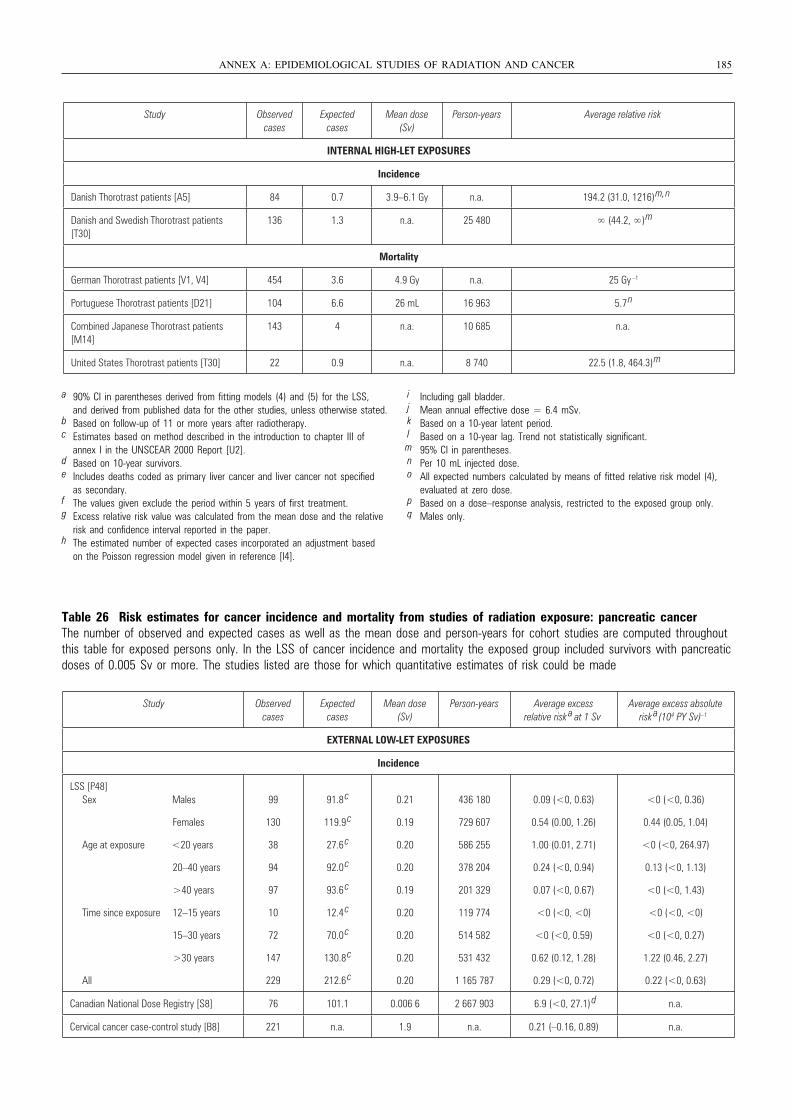
ANNEX A: EPIDEMIOLOGICAL STUDIES OF RADIATION AND CANCER 185
Study Observed cases
Expected cases
Mean dose (Sv)
Person-years Average relative risk
INTERNAL HIGH-LET EXPOSURES
Incidence
Danish Thorotrast patients [A5] 84 0.7 3.9–6.1 Gy n.a. 194.2 (31.0, 1216)
m, n
Danish and Swedish Thorotrast patients [T30]
136 1.3 n.a. 25 480 ∞ (44.2, ∞)
m
Mortality
German Thorotrast patients [V1, V4] 454 3.6 4.9 Gy n.a. 25 Gy –1
Portuguese Thorotrast patients [D21] 104 6.6 26 mL 16 963 5.7 n
Combined Japanese Thorotrast patients [M14]
143 4 n.a. 10 685 n.a.
United States Thorotrast patients [T30] 22 0.9 n.a. 8 740 22.5 (1.8, 464.3)
m
a 90% CI in parentheses derived from fitting models (4) and (5) for the LSS, and derived from published data for the other studies, unless otherwise stated.
b Based on follow-up of 11 or more years after radiotherapy.c Estimates based on method described in the introduction to chapter III of
annex I in the UNSCEAR 2000 Report [U2].d Based on 10-year survivors.e Includes deaths coded as primary liver cancer and liver cancer not specified
as secondary.f The values given exclude the period within 5 years of first treatment.g Excess relative risk value was calculated from the mean dose and the relative
risk and confidence interval reported in the paper.h The estimated number of expected cases incorporated an adjustment based
on the Poisson regression model given in reference [I4].
i Including gall bladder.j Mean annual effective dose = 6.4 mSv.k Based on a 10-year latent period.l Based on a 10-year lag. Trend not statistically significant.m 95% CI in parentheses.n Per 10 mL injected dose.o All expected numbers calculated by means of fitted relative risk model (4),
evaluated at zero dose.p Based on a dose–response analysis, restricted to the exposed group only.q Males only.
Table 26 Risk estimates for cancer incidence and mortality from studies of radiation exposure: pancreatic cancerThe number of observed and expected cases as well as the mean dose and person-years for cohort studies are computed throughoutthis table for exposed persons only. In the LSS of cancer incidence and mortality the exposed group included survivors with pancreaticdoses of 0.005 Sv or more. The studies listed are those for which quantitative estimates of risk could be made
Study Observed cases
Expected cases
Mean dose (Sv)
Person-years Average excess relative risk
a at 1 SvAverage excess absolute
risk a (104 PY Sv) –1
EXTERNAL LOW-LET EXPOSURES
Incidence
LSS [P48] Sex Males
Females
Age at exposure <20 years
20–40 years
>40 years
Time since exposure 12–15 years
15–30 years
>30 years
All
99
130
38
94
97
10
72
147
229
91.8 c
119.9 c
27.6 c
92.0 c
93.6 c
12.4 c
70.0 c
130.8 c
212.6 c
0.21
0.19
0.20
0.20
0.19
0.20
0.20
0.20
0.20
436 180
729 607
586 255
378 204
201 329
119 774
514 582
531 432
1 165 787
0.09 (<0, 0.63)
0.54 (0.00, 1.26)
1.00 (0.01, 2.71)
0.24 (<0, 0.94)
0.07 (<0, 0.67)
<0 (<0, <0)
<0 (<0, 0.59)
0.62 (0.12, 1.28)
0.29 (<0, 0.72)
<0 (<0, 0.36)
0.44 (0.05, 1.04)
<0 (<0, 264.97)
0.13 (<0, 1.13)
<0 (<0, 1.43)
<0 (<0, <0)
<0 (<0, 0.27)
1.22 (0.46, 2.27)
0.22 (<0, 0.63)
Canadian National Dose Registry [S8] 76 101.1 0.006 6 2 667 903 6.9 (<0, 27.1) d n.a.
Cervical cancer case-control study [B8] 221 n.a. 1.9 n.a. 0.21 (–0.16, 0.89) n.a.
UNSCEAR REPORT-PART 3.qxp 10/7/08 3:37 pm Page 185
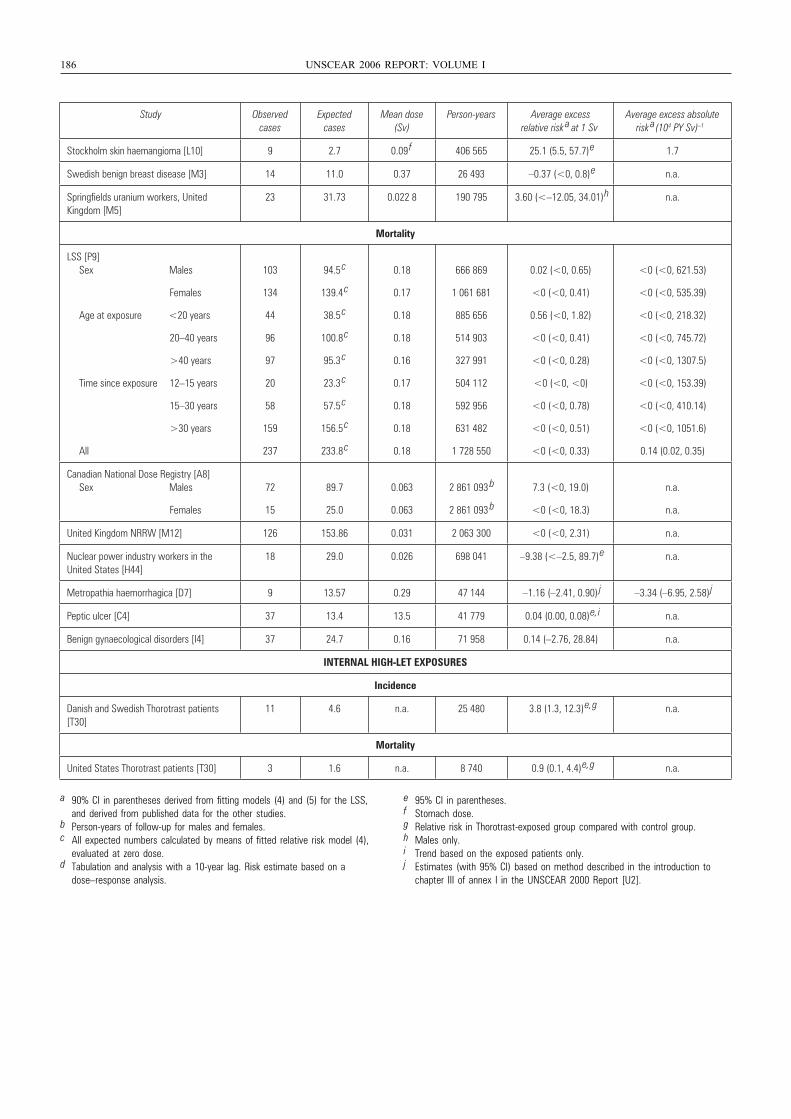
186 UNSCEAR 2006 REPORT: VOLUME I
Study Observed cases
Expected cases
Mean dose (Sv)
Person-years Average excess relative risk
a at 1 SvAverage excess absolute
risk a (104 PY Sv) –1
Stockholm skin haemangioma [L10] 9 2.7 0.09 f 406 565 25.1 (5.5, 57.7)
e 1.7
Swedish benign breast disease [M3] 14 11.0 0.37 26 493 –0.37 (<0, 0.8)
e n.a.
Springfields uranium workers, United Kingdom [M5]
23 31.73 0.022 8 190 795 3.60 (<–12.05, 34.01)
h n.a.
Mortality
LSS [P9] Sex Males
Females
Age at exposure <20 years
20–40 years
>40 years
Time since exposure 12–15 years
15–30 years
>30 years
All
103
134
44
96
97
20
58
159
237
94.5 c
139.4 c
38.5 c
100.8 c
95.3 c
23.3 c
57.5 c
156.5 c
233.8 c
0.18
0.17
0.18
0.18
0.16
0.17
0.18
0.18
0.18
666 869
1 061 681
885 656
514 903
327 991
504 112
592 956
631 482
1 728 550
0.02 (<0, 0.65)
<0 (<0, 0.41)
0.56 (<0, 1.82)
<0 (<0, 0.41)
<0 (<0, 0.28)
<0 (<0, <0)
<0 (<0, 0.78)
<0 (<0, 0.51)
<0 (<0, 0.33)
<0 (<0, 621.53)
<0 (<0, 535.39)
<0 (<0, 218.32)
<0 (<0, 745.72)
<0 (<0, 1307.5)
<0 (<0, 153.39)
<0 (<0, 410.14)
<0 (<0, 1051.6)
0.14 (0.02, 0.35)
Canadian National Dose Registry [A8] Sex Males
Females
72
15
89.7
25.0
0.063
0.063
2 861 093 b
2 861 093 b
7.3 (<0, 19.0)
<0 (<0, 18.3)
n.a.
n.a.
United Kingdom NRRW [M12] 126 153.86 0.031 2 063 300 <0 (<0, 2.31) n.a.
Nuclear power industry workers in the United States [H44]
18 29.0 0.026 698 041 –9.38 (<–2.5, 89.7)
e n.a.
Metropathia haemorrhagica [D7] 9 13.57 0.29 47 144 –1.16 (–2.41, 0.90) j –3.34 (–6.95, 2.58)
j
Peptic ulcer [C4] 37 13.4 13.5 41 779 0.04 (0.00, 0.08)
e, i n.a.
Benign gynaecological disorders [I4] 37 24.7 0.16 71 958 0.14 (–2.76, 28.84) n.a.
INTERNAL HIGH-LET EXPOSURES
Incidence
Danish and Swedish Thorotrast patients [T30]
11 4.6 n.a. 25 480 3.8 (1.3, 12.3)
e, g n.a.
Mortality
United States Thorotrast patients [T30] 3 1.6 n.a. 8 740 0.9 (0.1, 4.4)
e, g n.a.
a 90% CI in parentheses derived from fitting models (4) and (5) for the LSS, and derived from published data for the other studies.
b Person-years of follow-up for males and females.c All expected numbers calculated by means of fitted relative risk model (4),
evaluated at zero dose.d Tabulation and analysis with a 10-year lag. Risk estimate based on a
dose–response analysis.
e 95% CI in parentheses.f Stomach dose.g Relative risk in Thorotrast-exposed group compared with control group.h Males only.i Trend based on the exposed patients only.j Estimates (with 95% CI) based on method described in the introduction to
chapter III of annex I in the UNSCEAR 2000 Report [U2].
UNSCEAR REPORT-PART 3.qxp 10/7/08 3:37 pm Page 186
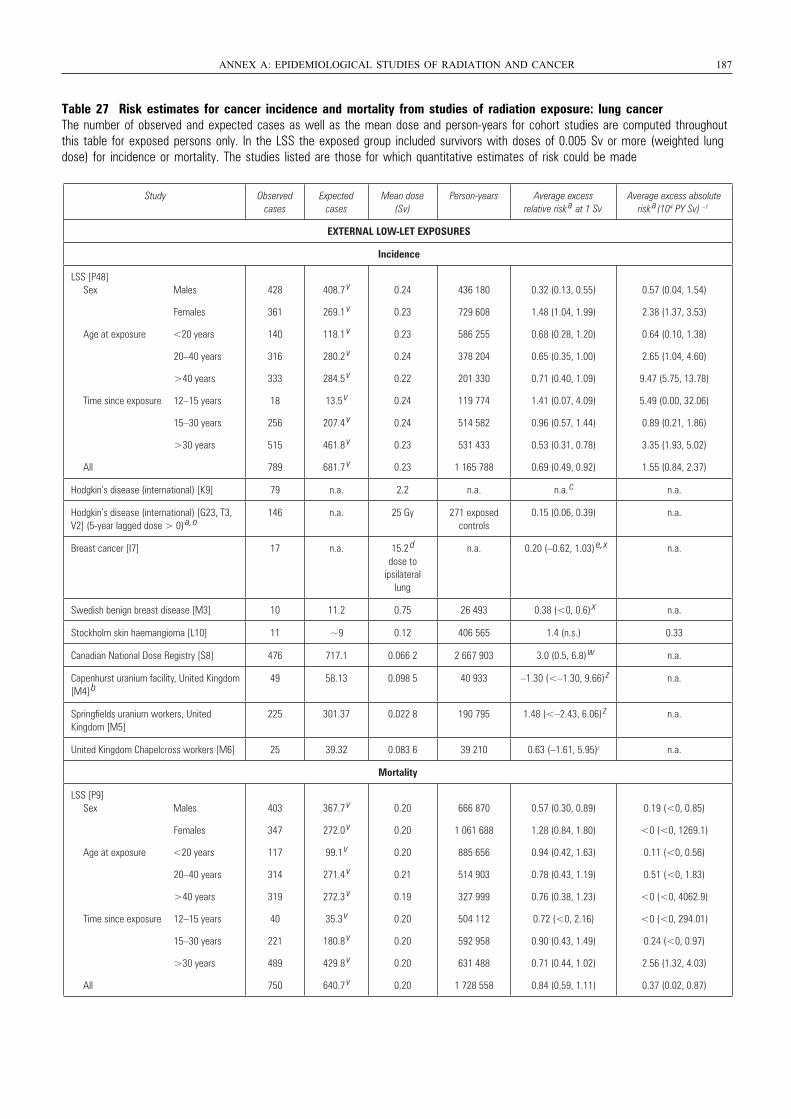
Table 27 Risk estimates for cancer incidence and mortality from studies of radiation exposure: lung cancerThe number of observed and expected cases as well as the mean dose and person-years for cohort studies are computed throughoutthis table for exposed persons only. In the LSS the exposed group included survivors with doses of 0.005 Sv or more (weighted lungdose) for incidence or mortality. The studies listed are those for which quantitative estimates of risk could be made
ANNEX A: EPIDEMIOLOGICAL STUDIES OF RADIATION AND CANCER 187
Study Observed cases
Expected cases
Mean dose (Sv)
Person-years Average excess relative risk a at 1 Sv
Average excess absolute risk a (104 PY Sv) –1
EXTERNAL LOW-LET EXPOSURES
Incidence
LSS [P48] Sex Males
Females
Age at exposure <20 years
20–40 years
>40 years
Time since exposure 12–15 years
15–30 years
>30 years
All
428
361
140
316
333
18
256
515
789
408.7 v
269.1 v
118.1 v
280.2 v
284.5 v
13.5 v
207.4 v
461.8 v
681.7 v
0.24
0.23
0.23
0.24
0.22
0.24
0.24
0.23
0.23
436 180
729 608
586 255
378 204
201 330
119 774
514 582
531 433
1 165 788
0.32 (0.13, 0.55)
1.48 (1.04, 1.99)
0.68 (0.28, 1.20)
0.65 (0.35, 1.00)
0.71 (0.40, 1.09)
1.41 (0.07, 4.09)
0.96 (0.57, 1.44)
0.53 (0.31, 0.78)
0.69 (0.49, 0.92)
0.57 (0.04, 1.54)
2.38 (1.37, 3.53)
0.64 (0.10, 1.38)
2.65 (1.04, 4.60)
9.47 (5.75, 13.78)
5.49 (0.00, 32.06)
0.89 (0.21, 1.86)
3.35 (1.93, 5.02)
1.55 (0.84, 2.37)
Hodgkin’s disease (international) [K9] 79 n.a. 2.2 n.a. n.a. c n.a.
Hodgkin’s disease (international) [G23, T3, V2] (5-year lagged dose > 0) a, o
146 n.a. 25 Gy 271 exposed controls
0.15 (0.06, 0.39) n.a.
Breast cancer [I7] 17 n.a. 15.2 d dose to
ipsilateral lung
n.a. 0.20 (–0.62, 1.03) e, x n.a.
Swedish benign breast disease [M3] 10 11.2 0.75 26 493 0.38 (<0, 0.6) x n.a.
Stockholm skin haemangioma [L10] 11 ~9 0.12 406 565 1.4 (n.s.) 0.33
Canadian National Dose Registry [S8] 476 717.1 0.066 2 2 667 903 3.0 (0.5, 6.8) w n.a.
Capenhurst uranium facility, United Kingdom[M4] b
49 58.13 0.098 5 40 933 –1.30 (<–1.30, 9.66) z n.a.
Springfields uranium workers, United Kingdom [M5]
225 301.37 0.022 8 190 795 1.48 (<–2.43, 6.06) z n.a.
United Kingdom Chapelcross workers [M6] 25 39.32 0.083 6 39 210 0.63 (–1.61, 5.95)z n.a.
Mortality
LSS [P9] Sex Males
Females
Age at exposure <20 years
20–40 years
>40 years
Time since exposure 12–15 years
15–30 years
>30 years
All
403
347
117
314
319
40
221
489
750
367.7 v
272.0 v
99.1 v
271.4 v
272.3 v
35.3 v
180.8 v
429.8 v
640.7 v
0.20
0.20
0.20
0.21
0.19
0.20
0.20
0.20
0.20
666 870
1 061 688
885 656
514 903
327 999
504 112
592 958
631 488
1 728 558
0.57 (0.30, 0.89)
1.28 (0.84, 1.80)
0.94 (0.42, 1.63)
0.78 (0.43, 1.19)
0.76 (0.38, 1.23)
0.72 (<0, 2.16)
0.90 (0.43, 1.49)
0.71 (0.44, 1.02)
0.84 (0.59, 1.11)
0.19 (<0, 0.85)
<0 (<0, 1269.1)
0.11 (<0, 0.56)
0.51 (<0, 1.83)
<0 (<0, 4062.9)
<0 (<0, 294.01)
0.24 (<0, 0.97)
2.56 (1.32, 4.03)
0.37 (0.02, 0.87)
UNSCEAR REPORT-PART 3.qxp 10/7/08 3:37 pm Page 187
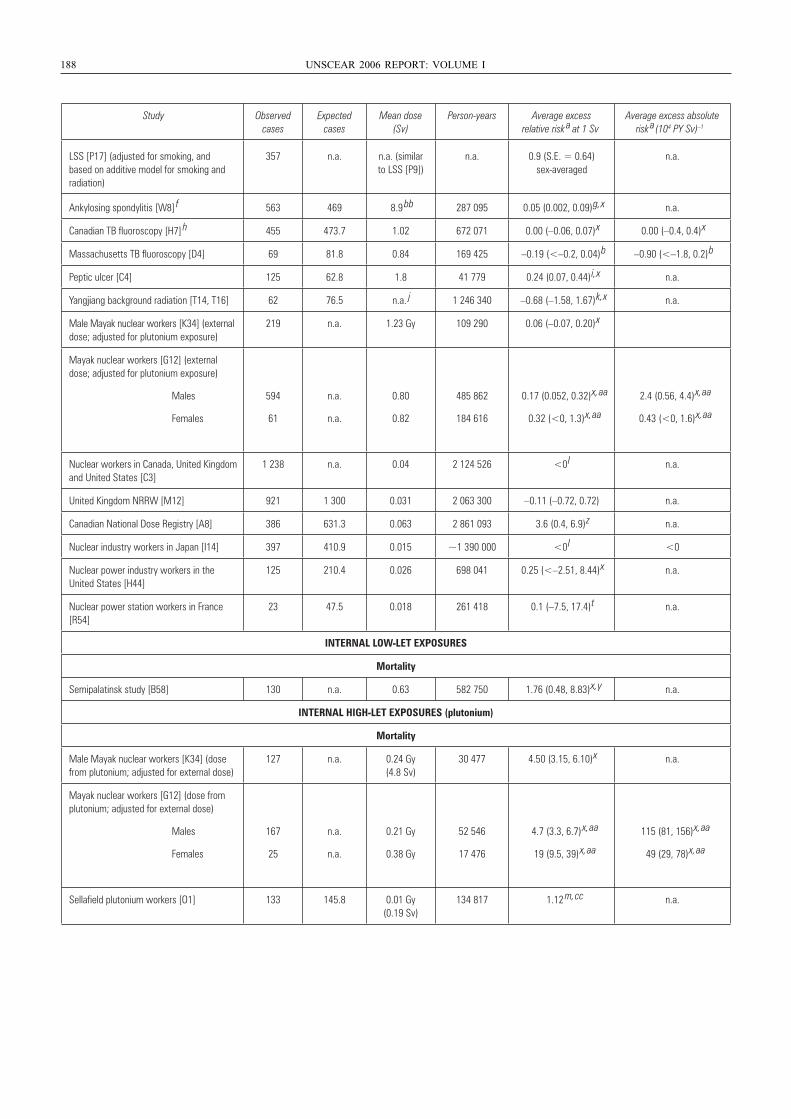
188 UNSCEAR 2006 REPORT: VOLUME I
Study Observed cases
Expected cases
Mean dose (Sv)
Person-years Average excess relative risk
a at 1 SvAverage excess absolute
risk a (104 PY Sv) –1
Ankylosing spondylitis [W8] f 563 469 8.9
bb 287 095 0.05 (0.002, 0.09) g, x n.a.
Canadian TB fluoroscopy [H7] h 455 473.7 1.02 672 071 0.00 (–0.06, 0.07) x 0.00 (–0.4, 0.4) x
Massachusetts TB fluoroscopy [D4] 69 81.8 0.84 169 425 –0.19 (<–0.2, 0.04) b –0.90 (<–1.8, 0.2) b
Peptic ulcer [C4] 125 62.8 1.8 41 779 0.24 (0.07, 0.44) i, x n.a.
Yangjiang background radiation [T14, T16] 62 76.5 n.a. j 1 246 340 –0.68 (–1.58, 1.67) k, x n.a.
Male Mayak nuclear workers [K34] (external dose; adjusted for plutonium exposure)
219 n.a. 1.23 Gy 109 290 0.06 (–0.07, 0.20) x
Mayak nuclear workers [G12] (external dose; adjusted for plutonium exposure)
Males
Females
594
61
n.a.
n.a.
0.80
0.82
485 862
184 616
0.17 (0.052, 0.32) x, aa
0.32 (<0, 1.3) x, aa
2.4 (0.56, 4.4) x, aa
0.43 (<0, 1.6) x, aa
Nuclear workers in Canada, United Kingdomand United States [C3]
1 238 n.a. 0.04 2 124 526 <0 l n.a.
United Kingdom NRRW [M12] 921 1 300 0.031 2 063 300 –0.11 (–0.72, 0.72) n.a.
Canadian National Dose Registry [A8] 386 631.3 0.063 2 861 093 3.6 (0.4, 6.9) z n.a.
Nuclear industry workers in Japan [I14] 397 410.9 0.015 ~1 390 000 <0 l <0
Nuclear power industry workers in the United States [H44]
125 210.4 0.026 698 041 0.25 (<–2.51, 8.44) x n.a.
Nuclear power station workers in France [R54]
23 47.5 0.018 261 418 0.1 (–7.5, 17.4) t n.a.
INTERNAL LOW-LET EXPOSURES
Mortality
Semipalatinsk study [B58] 130 n.a. 0.63 582 750 1.76 (0.48, 8.83) x, y n.a.
INTERNAL HIGH-LET EXPOSURES (plutonium)
Mortality
Male Mayak nuclear workers [K34] (dose from plutonium; adjusted for external dose)
127 n.a. 0.24 Gy (4.8 Sv)
30 477 4.50 (3.15, 6.10) x n.a.
Mayak nuclear workers [G12] (dose from plutonium; adjusted for external dose)
Males
Females
167
25
n.a.
n.a.
0.21 Gy
0.38 Gy
52 546
17 476
4.7 (3.3, 6.7) x, aa
19 (9.5, 39) x, aa
115 (81, 156) x, aa
49 (29, 78) x, aa
Sellafield plutonium workers [O1] 133 145.8 0.01 Gy (0.19 Sv)
134 817 1.12 m, cc n.a.
LSS [P17] (adjusted for smoking, and based on additive model for smoking and radiation)
357 n.a. n.a. (similar to LSS [P9])
n.a. 0.9 (S.E. = 0.64) sex-averaged
n.a.
UNSCEAR REPORT-PART 3.qxp 10/7/08 3:37 pm Page 188
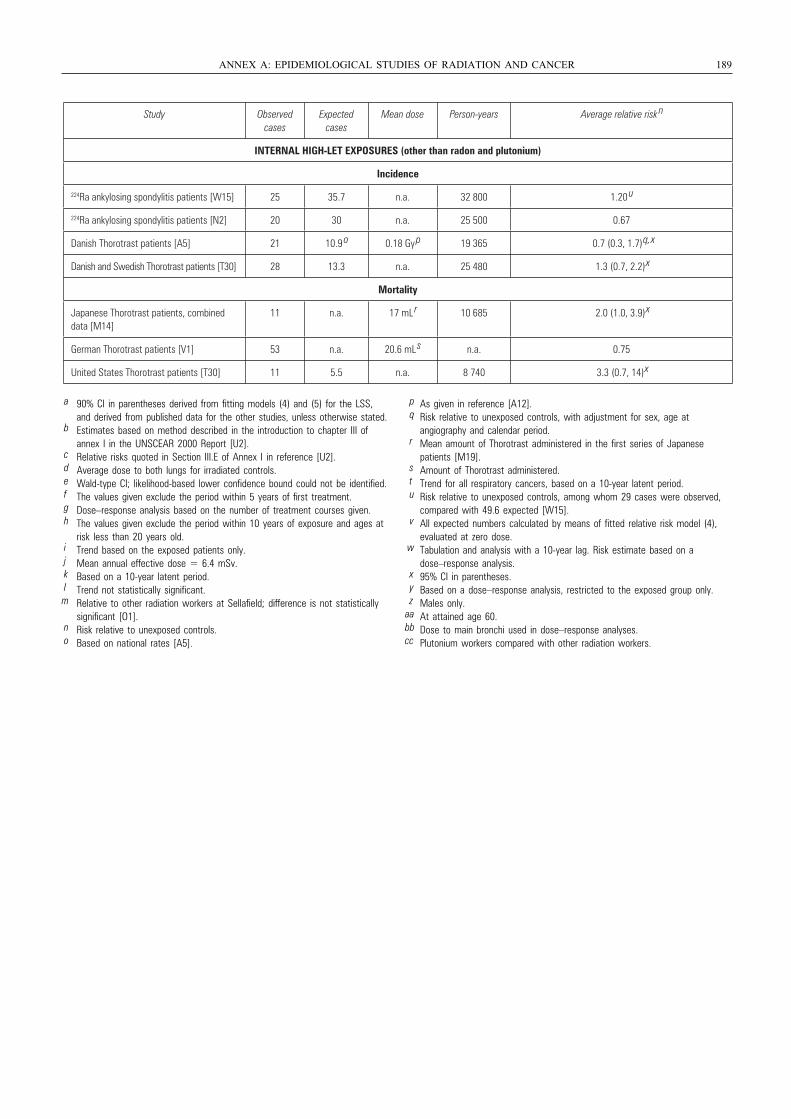
ANNEX A: EPIDEMIOLOGICAL STUDIES OF RADIATION AND CANCER 189
Study Observed cases
Expected cases
Mean dose Person-years Average relative risk n
INTERNAL HIGH-LET EXPOSURES (other than radon and plutonium)
Incidence
224Ra ankylosing spondylitis patients [W15] 25 35.7 n.a. 32 800 1.20 u
224Ra ankylosing spondylitis patients [N2] 20 30 n.a. 25 500 0.67
Danish Thorotrast patients [A5] 21 10.9 o 0.18 Gy
p 19 365 0.7 (0.3, 1.7)
q, x
Danish and Swedish Thorotrast patients [T30] 28 13.3 n.a. 25 480 1.3 (0.7, 2.2)
x
Mortality
Japanese Thorotrast patients, combined data [M14]
11 n.a. 17 mL r 10 685 2.0 (1.0, 3.9)
x
German Thorotrast patients [V1] 53 n.a. 20.6 mL s n.a. 0.75
United States Thorotrast patients [T30] 11 5.5 n.a. 8 740 3.3 (0.7, 14)
x
a 90% CI in parentheses derived from fitting models (4) and (5) for the LSS, and derived from published data for the other studies, unless otherwise stated.
b Estimates based on method described in the introduction to chapter III of annex I in the UNSCEAR 2000 Report [U2].
c Relative risks quoted in Section III.E of Annex I in reference [U2].d Average dose to both lungs for irradiated controls.e Wald-type CI; likelihood-based lower confidence bound could not be identified.f The values given exclude the period within 5 years of first treatment.g Dose–response analysis based on the number of treatment courses given.h The values given exclude the period within 10 years of exposure and ages at
risk less than 20 years old.i Trend based on the exposed patients only.j Mean annual effective dose = 6.4 mSv.k Based on a 10-year latent period.l Trend not statistically significant.m Relative to other radiation workers at Sellafield; difference is not statistically
significant [O1].n Risk relative to unexposed controls.o Based on national rates [A5].
p As given in reference [A12].q Risk relative to unexposed controls, with adjustment for sex, age at
angiography and calendar period.r Mean amount of Thorotrast administered in the first series of Japanese
patients [M19].s Amount of Thorotrast administered.t Trend for all respiratory cancers, based on a 10-year latent period.u Risk relative to unexposed controls, among whom 29 cases were observed,
compared with 49.6 expected [W15].v All expected numbers calculated by means of fitted relative risk model (4),
evaluated at zero dose.w Tabulation and analysis with a 10-year lag. Risk estimate based on a
dose–response analysis.x 95% CI in parentheses.y Based on a dose–response analysis, restricted to the exposed group only.z Males only.
aa At attained age 60.bb Dose to main bronchi used in dose–response analyses.cc Plutonium workers compared with other radiation workers.
UNSCEAR REPORT-PART 3.qxp 10/7/08 3:37 pm Page 189
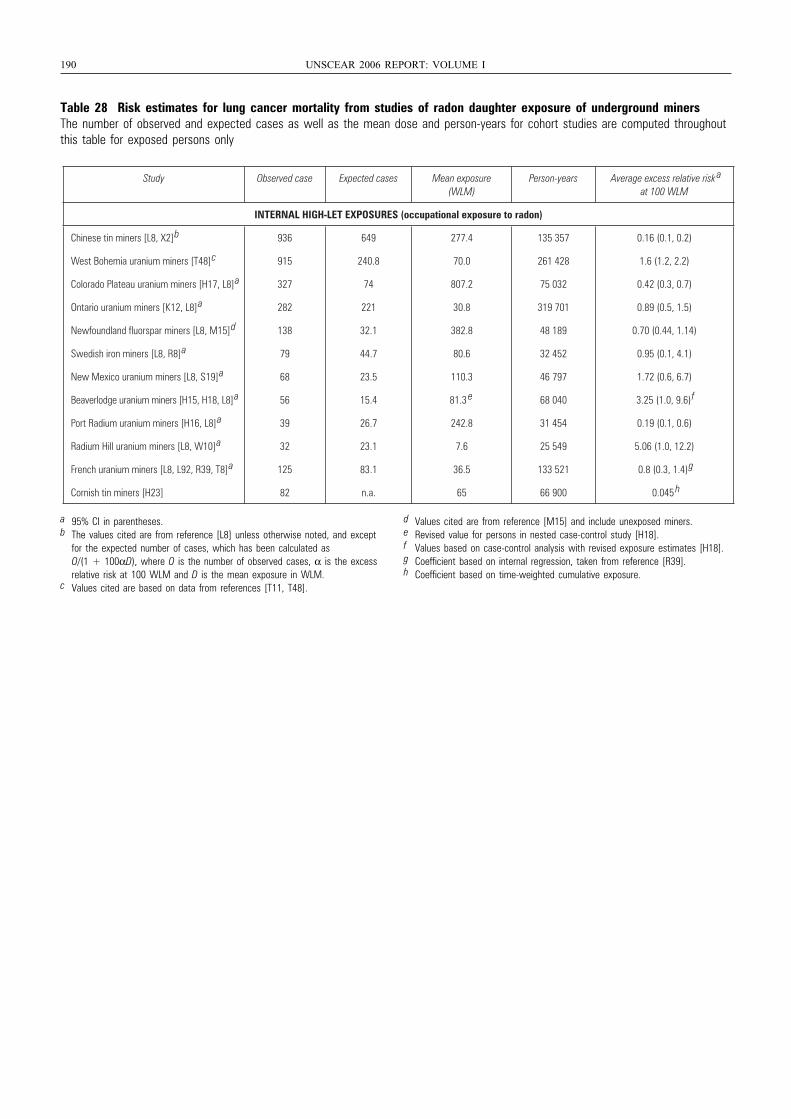
190 UNSCEAR 2006 REPORT: VOLUME I
Table 28 Risk estimates for lung cancer mortality from studies of radon daughter exposure of underground minersThe number of observed and expected cases as well as the mean dose and person-years for cohort studies are computed throughoutthis table for exposed persons only
Study Observed case Expected cases Mean exposure (WLM)
Person-years Average excess relative risk a
at 100 WLM
INTERNAL HIGH-LET EXPOSURES (occupational exposure to radon)
Chinese tin miners [L8, X2]
b 936 649 277.4 135 357 0.16 (0.1, 0.2)
West Bohemia uranium miners [T48]
c 915 240.8 70.0 261 428 1.6 (1.2, 2.2)
Colorado Plateau uranium miners [H17, L8]
a 327 74 807.2 75 032 0.42 (0.3, 0.7)
Ontario uranium miners [K12, L8]
a 282 221 30.8 319 701 0.89 (0.5, 1.5)
Newfoundland fluorspar miners [L8, M15]
d 138 32.1 382.8 48 189 0.70 (0.44, 1.14)
Swedish iron miners [L8, R8]
a 79 44.7 80.6 32 452 0.95 (0.1, 4.1)
New Mexico uranium miners [L8, S19]
a 68 23.5 110.3 46 797 1.72 (0.6, 6.7)
Beaverlodge uranium miners [H15, H18, L8]
a 56 15.4 81.3 e 68 040 3.25 (1.0, 9.6)
f
Port Radium uranium miners [H16, L8]
a 39 26.7 242.8 31 454 0.19 (0.1, 0.6)
Radium Hill uranium miners [L8, W10]
a 32 23.1 7.6 25 549 5.06 (1.0, 12.2)
French uranium miners [L8, L92, R39, T8]
a 125 83.1 36.5 133 521 0.8 (0.3, 1.4)
g
Cornish tin miners [H23] 82 n.a. 65 66 900 0.045 h
a 95% CI in parentheses.b The values cited are from reference [L8] unless otherwise noted, and except
for the expected number of cases, which has been calculated as O/(1 + 100αD), where O is the number of observed cases, α is the excess relative risk at 100 WLM and D is the mean exposure in WLM.
c Values cited are based on data from references [T11, T48].
d Values cited are from reference [M15] and include unexposed miners.e Revised value for persons in nested case-control study [H18].f Values based on case-control analysis with revised exposure estimates [H18].g Coefficient based on internal regression, taken from reference [R39].h Coefficient based on time-weighted cumulative exposure.
UNSCEAR REPORT-PART 3.qxp 10/7/08 3:37 pm Page 190
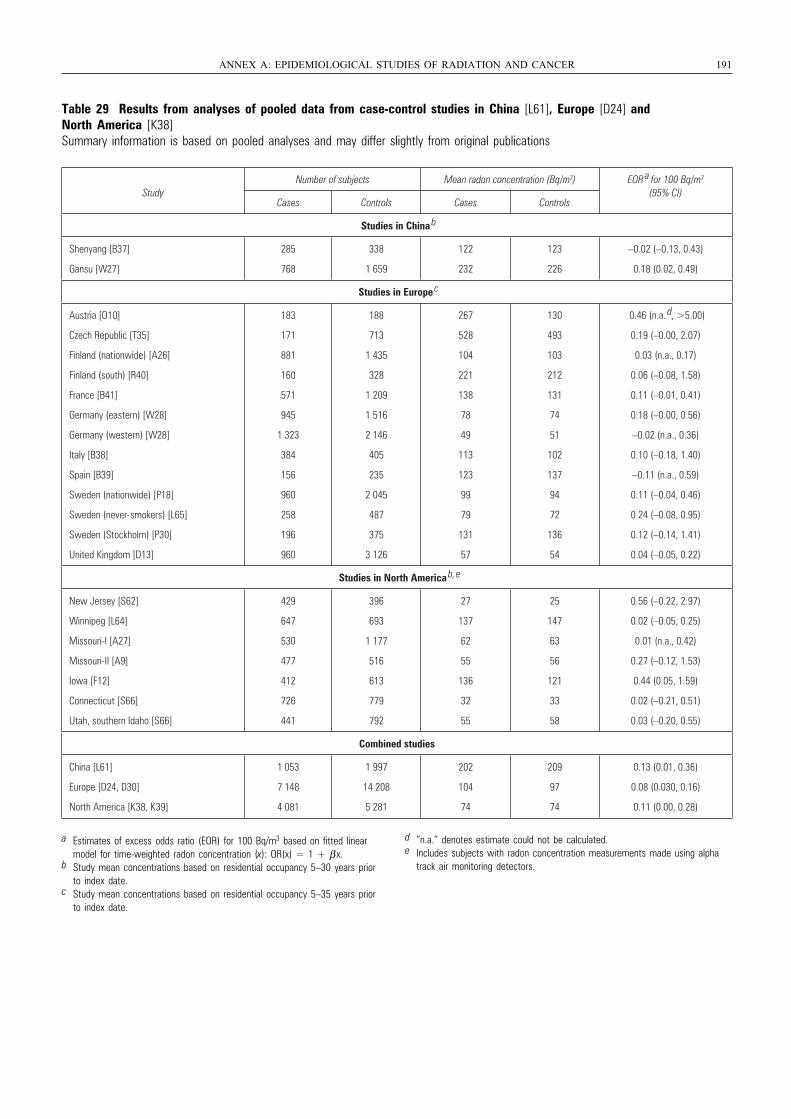
Table 29 Results from analyses of pooled data from case-control studies in China [L61], Europe [D24] and North America [K38]Summary information is based on pooled analyses and may differ slightly from original publications
ANNEX A: EPIDEMIOLOGICAL STUDIES OF RADIATION AND CANCER 191
StudyNumber of subjects Mean radon concentration (Bq/m3) EOR
a for 100 Bq/m3 (95% CI)
Cases Controls Cases Controls
Studies in China b
Shenyang [B37]
Gansu [W27]
285
768
338
1 659
122
232
123
226
–0.02 (–0.13, 0.43)
0.18 (0.02, 0.49)
Studies in Europe c
Austria [O10]
Czech Republic [T35]
Finland (nationwide) [A26]
Finland (south) [R40]
France [B41]
Germany (eastern) [W28]
Germany (western) [W28]
Italy [B38]
Spain [B39]
Sweden (nationwide) [P18]
Sweden (never-smokers) [L65]
Sweden (Stockholm) [P30]
United Kingdom [D13]
183
171
881
160
571
945
1 323
384
156
960
258
196
960
188
713
1 435
328
1 209
1 516
2 146
405
235
2 045
487
375
3 126
267
528
104
221
138
78
49
113
123
99
79
131
57
130
493
103
212
131
74
51
102
137
94
72
136
54
0.46 (n.a. d , >5.00)
0.19 (–0.00, 2.07)
0.03 (n.a., 0.17)
0.06 (–0.08, 1.58)
0.11 (–0.01, 0.41)
0.18 (–0.00, 0.56)
–0.02 (n.a., 0.36)
0.10 (–0.18, 1.40)
–0.11 (n.a., 0.59)
0.11 (–0.04, 0.46)
0.24 (–0.08, 0.95)
0.12 (–0.14, 1.41)
0.04 (–0.05, 0.22)
Studies in North America b, e
New Jersey [S62]
Winnipeg [L64]
Missouri-I [A27]
Missouri-II [A9]
Iowa [F12]
Connecticut [S66]
Utah, southern Idaho [S66]
429
647
530
477
412
726
441
396
693
1 177
516
613
779
792
27
137
62
55
136
32
55
25
147
63
56
121
33
58
0.56 (–0.22, 2.97)
0.02 (–0.05, 0.25)
0.01 (n.a., 0.42)
0.27 (–0.12, 1.53)
0.44 (0.05, 1.59)
0.02 (–0.21, 0.51)
0.03 (–0.20, 0.55)
Combined studies
China [L61]
Europe [D24, D30]
North America [K38, K39]
1 053
7 148
4 081
1 997
14 208
5 281
202
104
74
209
97
74
0.13 (0.01, 0.36)
0.08 (0.030, 0.16)
0.11 (0.00, 0.28)
a Estimates of excess odds ratio (EOR) for 100 Bq/m3 based on fitted linear model for time-weighted radon concentration (x): OR(x) = 1 + β x.
b Study mean concentrations based on residential occupancy 5–30 years prior to index date.
c Study mean concentrations based on residential occupancy 5–35 years prior to index date.
d “n.a.” denotes estimate could not be calculated.e Includes subjects with radon concentration measurements made using alpha
track air monitoring detectors.
UNSCEAR REPORT-PART 3.qxp 10/7/08 3:37 pm Page 191
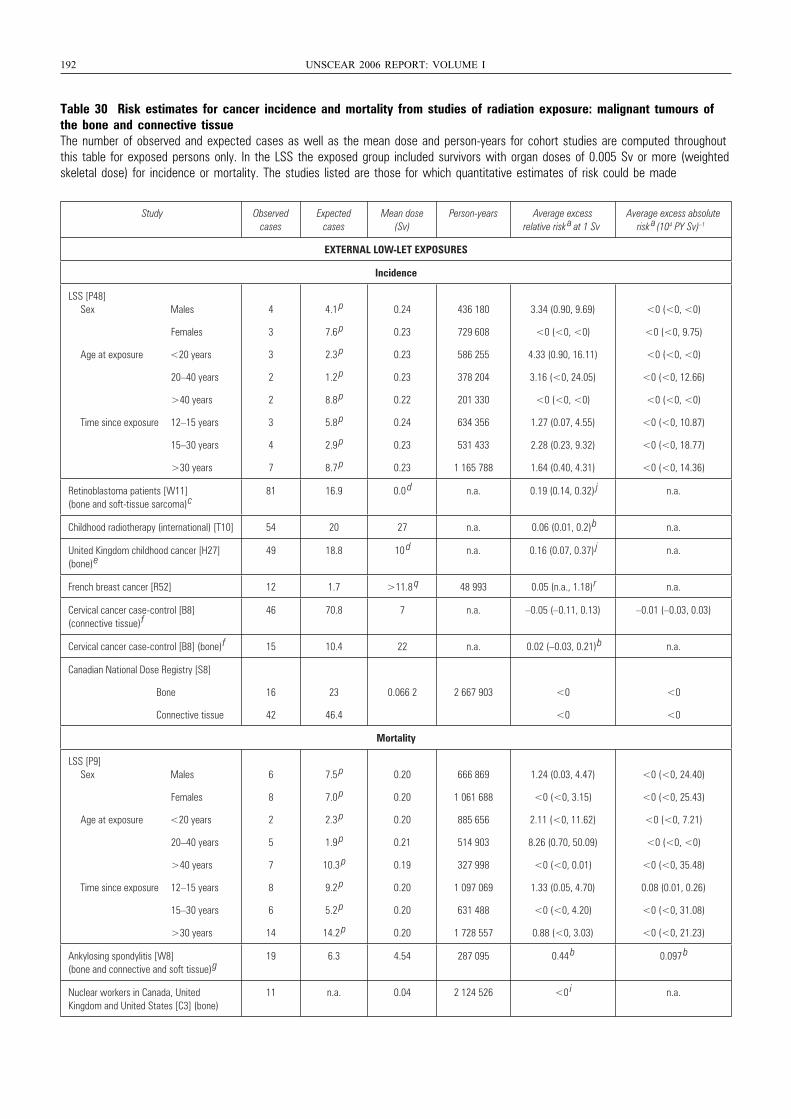
192 UNSCEAR 2006 REPORT: VOLUME I
Table 30 Risk estimates for cancer incidence and mortality from studies of radiation exposure: malignant tumours ofthe bone and connective tissueThe number of observed and expected cases as well as the mean dose and person-years for cohort studies are computed throughoutthis table for exposed persons only. In the LSS the exposed group included survivors with organ doses of 0.005 Sv or more (weightedskeletal dose) for incidence or mortality. The studies listed are those for which quantitative estimates of risk could be made
Study Observed cases
Expected cases
Mean dose (Sv)
Person-years Average excess relative risk a at 1 Sv
Average excess absolute risk a (104 PY Sv) –1
EXTERNAL LOW-LET EXPOSURES
Incidence
LSS [P48] Sex Males
Females
Age at exposure <20 years
20–40 years
>40 years
Time since exposure 12–15 years
15–30 years
>30 years
4
3
3
2
2
3
4
7
4.1 p
7.6 p
2.3 p
1.2 p
8.8 p
5.8 p
2.9 p
8.7 p
0.24
0.23
0.23
0.23
0.22
0.24
0.23
0.23
436 180
729 608
586 255
378 204
201 330
634 356
531 433
1 165 788
3.34 (0.90, 9.69)
<0 (<0, <0)
4.33 (0.90, 16.11)
3.16 (<0, 24.05)
<0 (<0, <0)
1.27 (0.07, 4.55)
2.28 (0.23, 9.32)
1.64 (0.40, 4.31)
<0 (<0, <0)
<0 (<0, 9.75)
<0 (<0, <0)
<0 (<0, 12.66)
<0 (<0, <0)
<0 (<0, 10.87)
<0 (<0, 18.77)
<0 (<0, 14.36)
Retinoblastoma patients [W11] (bone and soft-tissue sarcoma) c
81 16.9 0.0 d n.a. 0.19 (0.14, 0.32) j n.a.
Childhood radiotherapy (international) [T10] 54 20 27 n.a. 0.06 (0.01, 0.2) b n.a.
United Kingdom childhood cancer [H27] (bone) e
49 18.8 10 d n.a. 0.16 (0.07, 0.37) j n.a.
French breast cancer [R52] 12 1.7 >11.8 q 48 993 0.05 (n.a., 1.18) r n.a.
Cervical cancer case-control [B8] (connective tissue) f
46 70.8 7 n.a. –0.05 (–0.11, 0.13) –0.01 (–0.03, 0.03)
Cervical cancer case-control [B8] (bone) f 15 10.4 22 n.a. 0.02 (–0.03, 0.21) b n.a.
Canadian National Dose Registry [S8]
Bone
Connective tissue
16
42
23
46.4
0.066 2 2 667 903 <0
<0
<0
<0
Mortality
LSS [P9] Sex Males
Females
Age at exposure <20 years
20–40 years
>40 years
Time since exposure 12–15 years
15–30 years
>30 years
6
8
2
5
7
8
6
14
7.5 p
7.0 p
2.3 p
1.9 p
10.3 p
9.2 p
5.2 p
14.2 p
0.20
0.20
0.20
0.21
0.19
0.20
0.20
0.20
666 869
1 061 688
885 656
514 903
327 998
1 097 069
631 488
1 728 557
1.24 (0.03, 4.47)
<0 (<0, 3.15)
2.11 (<0, 11.62)
8.26 (0.70, 50.09)
<0 (<0, 0.01)
1.33 (0.05, 4.70)
<0 (<0, 4.20)
0.88 (<0, 3.03)
<0 (<0, 24.40)
<0 (<0, 25.43)
<0 (<0, 7.21)
<0 (<0, <0)
<0 (<0, 35.48)
0.08 (0.01, 0.26)
<0 (<0, 31.08)
<0 (<0, 21.23)
Ankylosing spondylitis [W8] (bone and connective and soft tissue) g
19 6.3 4.54 287 095 0.44 b 0.097 b
Nuclear workers in Canada, United Kingdom and United States [C3] (bone)
11 n.a. 0.04 2 124 526 <0 i n.a.
UNSCEAR REPORT-PART 3.qxp 10/7/08 3:37 pm Page 192
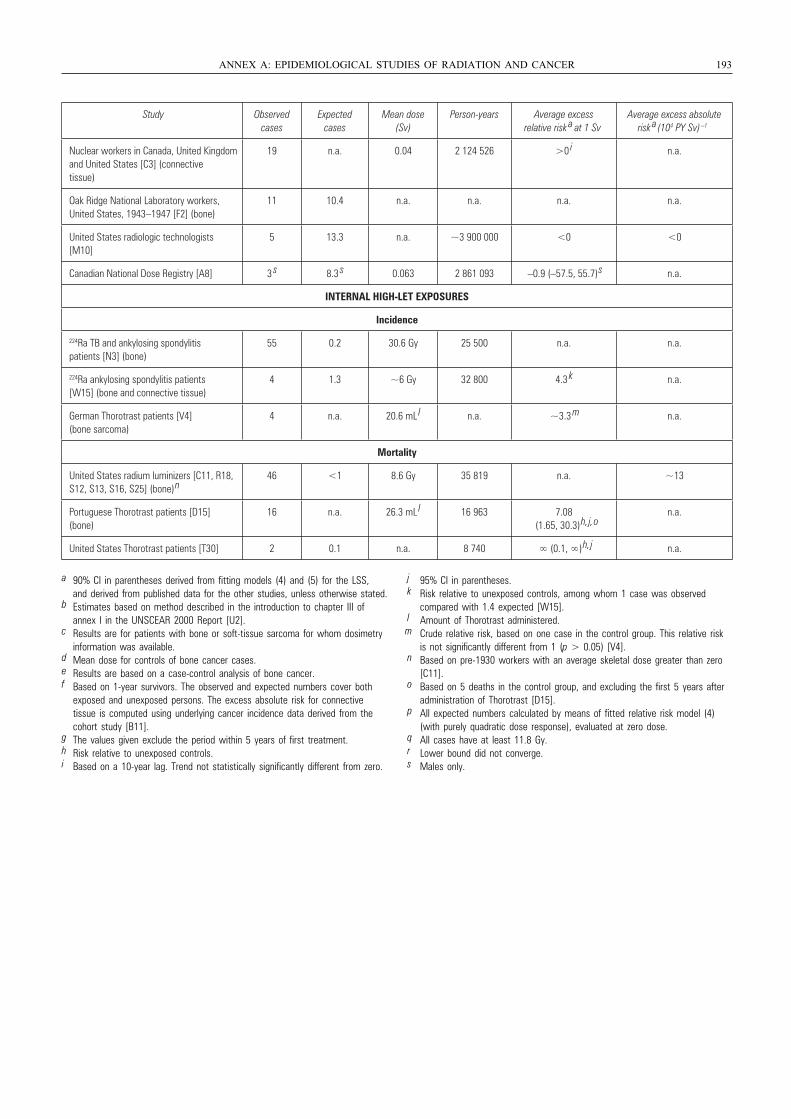
ANNEX A: EPIDEMIOLOGICAL STUDIES OF RADIATION AND CANCER 193
Study Observed cases
Expected cases
Mean dose (Sv)
Person-years Average excess relative risk
a at 1 SvAverage excess absolute
risk a (104 PY Sv) –1
Nuclear workers in Canada, United Kingdomand United States [C3] (connective tissue)
19 n.a. 0.04 2 124 526 >0 i n.a.
Oak Ridge National Laboratory workers, United States, 1943–1947 [F2] (bone)
11 10.4 n.a. n.a. n.a. n.a.
United States radiologic technologists [M10]
5 13.3 n.a. ~3 900 000 <0 <0
Canadian National Dose Registry [A8] 3 s 8.3
s 0.063 2 861 093 –0.9 (–57.5, 55.7)
s n.a.
INTERNAL HIGH-LET EXPOSURES
Incidence
224Ra TB and ankylosing spondylitis patients [N3] (bone)
55 0.2 30.6 Gy 25 500 n.a. n.a.
224Ra ankylosing spondylitis patients [W15] (bone and connective tissue)
4 1.3 ~6 Gy 32 800 4.3 k n.a.
German Thorotrast patients [V4] (bone sarcoma)
4 n.a. 20.6 mL l n.a. ~3.3
m n.a.
Mortality
United States radium luminizers [C11, R18, S12, S13, S16, S25] (bone)
n46 <1 8.6 Gy 35 819 n.a. ~13
Portuguese Thorotrast patients [D15] (bone)
16 n.a. 26.3 mL l 16 963 7.08
(1.65, 30.3)
h, j, on.a.
United States Thorotrast patients [T30] 2 0.1 n.a. 8 740 ∞ (0.1, ∞)
h, j n.a.
a 90% CI in parentheses derived from fitting models (4) and (5) for the LSS, and derived from published data for the other studies, unless otherwise stated.
b Estimates based on method described in the introduction to chapter III of annex I in the UNSCEAR 2000 Report [U2].
c Results are for patients with bone or soft-tissue sarcoma for whom dosimetry information was available.
d Mean dose for controls of bone cancer cases.e Results are based on a case-control analysis of bone cancer.f Based on 1-year survivors. The observed and expected numbers cover both
exposed and unexposed persons. The excess absolute risk for connective tissue is computed using underlying cancer incidence data derived from the cohort study [B11].
g The values given exclude the period within 5 years of first treatment.h Risk relative to unexposed controls.i Based on a 10-year lag. Trend not statistically significantly different from zero.
j 95% CI in parentheses.k Risk relative to unexposed controls, among whom 1 case was observed
compared with 1.4 expected [W15].l Amount of Thorotrast administered.m Crude relative risk, based on one case in the control group. This relative risk
is not significantly different from 1 (p > 0.05) [V4].n Based on pre-1930 workers with an average skeletal dose greater than zero
[C11].o Based on 5 deaths in the control group, and excluding the first 5 years after
administration of Thorotrast [D15].p All expected numbers calculated by means of fitted relative risk model (4)
(with purely quadratic dose response), evaluated at zero dose.q All cases have at least 11.8 Gy.r Lower bound did not converge.s Males only.
UNSCEAR REPORT-PART 3.qxp 10/7/08 3:37 pm Page 193
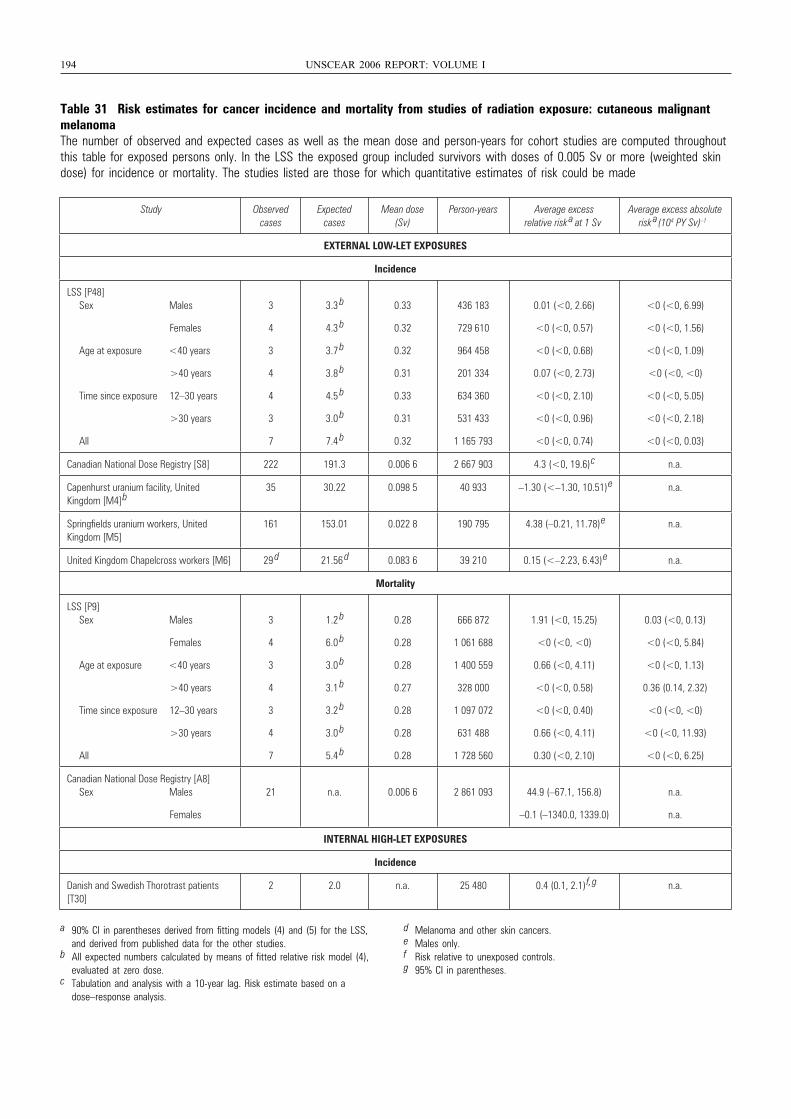
194 UNSCEAR 2006 REPORT: VOLUME I
Table 31 Risk estimates for cancer incidence and mortality from studies of radiation exposure: cutaneous malignantmelanomaThe number of observed and expected cases as well as the mean dose and person-years for cohort studies are computed throughoutthis table for exposed persons only. In the LSS the exposed group included survivors with doses of 0.005 Sv or more (weighted skindose) for incidence or mortality. The studies listed are those for which quantitative estimates of risk could be made
Study Observed cases
Expected cases
Mean dose (Sv)
Person-years Average excess relative risk a at 1 Sv
Average excess absolute risk a (104 PY Sv) –1
EXTERNAL LOW-LET EXPOSURES
Incidence
LSS [P48] Sex Males
Females
Age at exposure <40 years
>40 years
Time since exposure 12–30 years
>30 years
All
3
4
3
4
4
3
7
3.3 b
4.3 b
3.7 b
3.8 b
4.5 b
3.0 b
7.4 b
0.33
0.32
0.32
0.31
0.33
0.31
0.32
436 183
729 610
964 458
201 334
634 360
531 433
1 165 793
0.01 (<0, 2.66)
<0 (<0, 0.57)
<0 (<0, 0.68)
0.07 (<0, 2.73)
<0 (<0, 2.10)
<0 (<0, 0.96)
<0 (<0, 0.74)
<0 (<0, 6.99)
<0 (<0, 1.56)
<0 (<0, 1.09)
<0 (<0, <0)
<0 (<0, 5.05)
<0 (<0, 2.18)
<0 (<0, 0.03)
Canadian National Dose Registry [S8] 222 191.3 0.006 6 2 667 903 4.3 (<0, 19.6) c n.a.
Capenhurst uranium facility, United Kingdom [M4] b
35 30.22 0.098 5 40 933 –1.30 (<–1.30, 10.51) e n.a.
Springfields uranium workers, United Kingdom [M5]
161 153.01 0.022 8 190 795 4.38 (–0.21, 11.78) e n.a.
United Kingdom Chapelcross workers [M6] 29 d 21.56 d 0.083 6 39 210 0.15 (<–2.23, 6.43) e n.a.
Mortality
LSS [P9] Sex Males
Females
Age at exposure <40 years
>40 years
Time since exposure 12–30 years
>30 years
All
3
4
3
4
3
4
7
1.2 b
6.0 b
3.0 b
3.1 b
3.2 b
3.0 b
5.4 b
0.28
0.28
0.28
0.27
0.28
0.28
0.28
666 872
1 061 688
1 400 559
328 000
1 097 072
631 488
1 728 560
1.91 (<0, 15.25)
<0 (<0, <0)
0.66 (<0, 4.11)
<0 (<0, 0.58)
<0 (<0, 0.40)
0.66 (<0, 4.11)
0.30 (<0, 2.10)
0.03 (<0, 0.13)
<0 (<0, 5.84)
<0 (<0, 1.13)
0.36 (0.14, 2.32)
<0 (<0, <0)
<0 (<0, 11.93)
<0 (<0, 6.25)
Canadian National Dose Registry [A8] Sex Males
Females
21 n.a. 0.006 6 2 861 093 44.9 (–67.1, 156.8)
–0.1 (–1340.0, 1339.0)
n.a.
n.a.
INTERNAL HIGH-LET EXPOSURES
Incidence
Danish and Swedish Thorotrast patients [T30]
2 2.0 n.a. 25 480 0.4 (0.1, 2.1) f, g n.a.
a 90% CI in parentheses derived from fitting models (4) and (5) for the LSS, and derived from published data for the other studies.
b All expected numbers calculated by means of fitted relative risk model (4), evaluated at zero dose.
c Tabulation and analysis with a 10-year lag. Risk estimate based on a dose–response analysis.
d Melanoma and other skin cancers.e Males only.f Risk relative to unexposed controls.g 95% CI in parentheses.
UNSCEAR REPORT-PART 3.qxp 10/7/08 3:37 pm Page 194
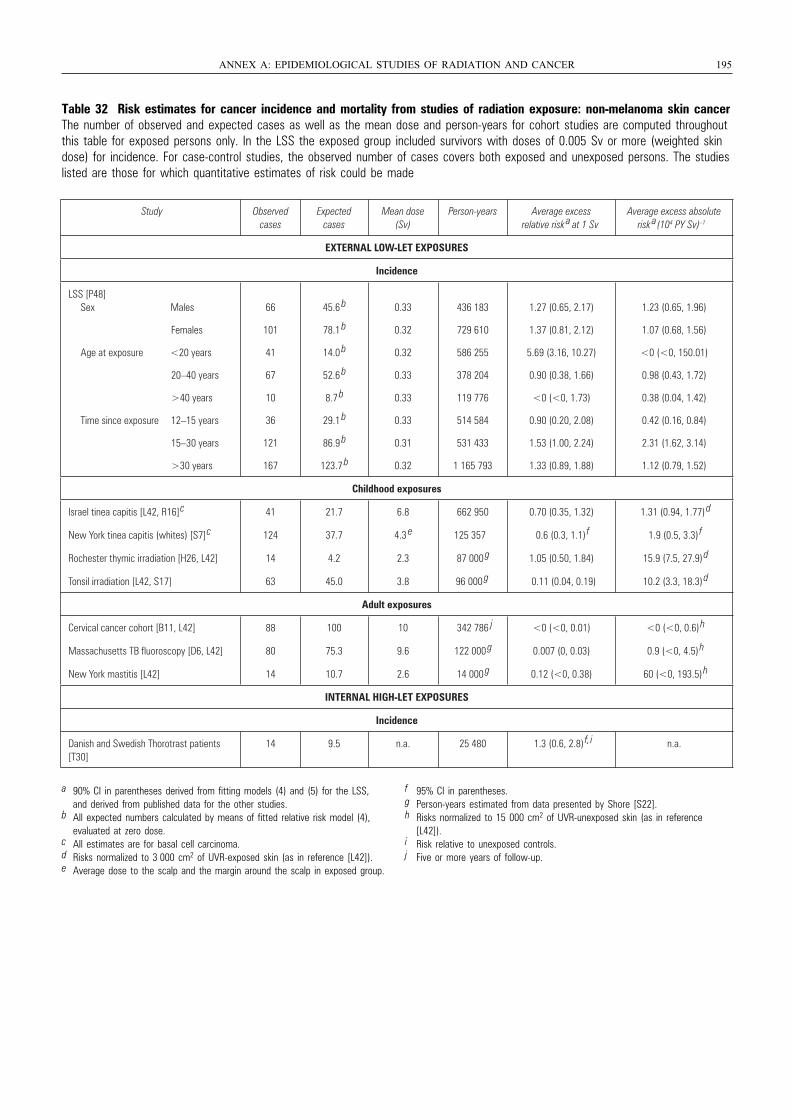
Table 32 Risk estimates for cancer incidence and mortality from studies of radiation exposure: non-melanoma skin cancer The number of observed and expected cases as well as the mean dose and person-years for cohort studies are computed throughoutthis table for exposed persons only. In the LSS the exposed group included survivors with doses of 0.005 Sv or more (weighted skindose) for incidence. For case-control studies, the observed number of cases covers both exposed and unexposed persons. The studieslisted are those for which quantitative estimates of risk could be made
ANNEX A: EPIDEMIOLOGICAL STUDIES OF RADIATION AND CANCER 195
Study Observed cases
Expected cases
Mean dose (Sv)
Person-years Average excess relative risk
a at 1 SvAverage excess absolute
risk a (104 PY Sv) –1
EXTERNAL LOW-LET EXPOSURES
Incidence
LSS [P48] Sex Males
Females
Age at exposure <20 years
20–40 years
>40 years
Time since exposure 12–15 years
15–30 years
>30 years
66
101
41
67
10
36
121
167
45.6 b
78.1 b
14.0 b
52.6 b
8.7 b
29.1 b
86.9 b
123.7 b
0.33
0.32
0.32
0.33
0.33
0.33
0.31
0.32
436 183
729 610
586 255
378 204
119 776
514 584
531 433
1 165 793
1.27 (0.65, 2.17)
1.37 (0.81, 2.12)
5.69 (3.16, 10.27)
0.90 (0.38, 1.66)
<0 (<0, 1.73)
0.90 (0.20, 2.08)
1.53 (1.00, 2.24)
1.33 (0.89, 1.88)
1.23 (0.65, 1.96)
1.07 (0.68, 1.56)
<0 (<0, 150.01)
0.98 (0.43, 1.72)
0.38 (0.04, 1.42)
0.42 (0.16, 0.84)
2.31 (1.62, 3.14)
1.12 (0.79, 1.52)
Childhood exposures
Israel tinea capitis [L42, R16]
c 41 21.7 6.8 662 950 0.70 (0.35, 1.32) 1.31 (0.94, 1.77) d
New York tinea capitis (whites) [S7]
c 124 37.7 4.3 e 125 357 0.6 (0.3, 1.1)
f 1.9 (0.5, 3.3) f
Rochester thymic irradiation [H26, L42] 14 4.2 2.3 87 000 g 1.05 (0.50, 1.84) 15.9 (7.5, 27.9)
d
Tonsil irradiation [L42, S17] 63 45.0 3.8 96 000 g 0.11 (0.04, 0.19) 10.2 (3.3, 18.3)
d
Adult exposures
Cervical cancer cohort [B11, L42] 88 100 10 342 786 j <0 (<0, 0.01) <0 (<0, 0.6) h
Massachusetts TB fluoroscopy [D6, L42] 80 75.3 9.6 122 000 g 0.007 (0, 0.03) 0.9 (<0, 4.5)
h
New York mastitis [L42] 14 10.7 2.6 14 000 g 0.12 (<0, 0.38) 60 (<0, 193.5)
h
INTERNAL HIGH-LET EXPOSURES
Incidence
Danish and Swedish Thorotrast patients [T30]
14 9.5 n.a. 25 480 1.3 (0.6, 2.8) f, i n.a.
a 90% CI in parentheses derived from fitting models (4) and (5) for the LSS, and derived from published data for the other studies.
b All expected numbers calculated by means of fitted relative risk model (4), evaluated at zero dose.
c All estimates are for basal cell carcinoma.d Risks normalized to 3 000 cm2 of UVR-exposed skin (as in reference [L42]).e Average dose to the scalp and the margin around the scalp in exposed group.
f 95% CI in parentheses.g Person-years estimated from data presented by Shore [S22].h Risks normalized to 15 000 cm2 of UVR-unexposed skin (as in reference
[L42]).i Risk relative to unexposed controls.j Five or more years of follow-up.
UNSCEAR REPORT-PART 3.qxp 10/7/08 3:37 pm Page 195
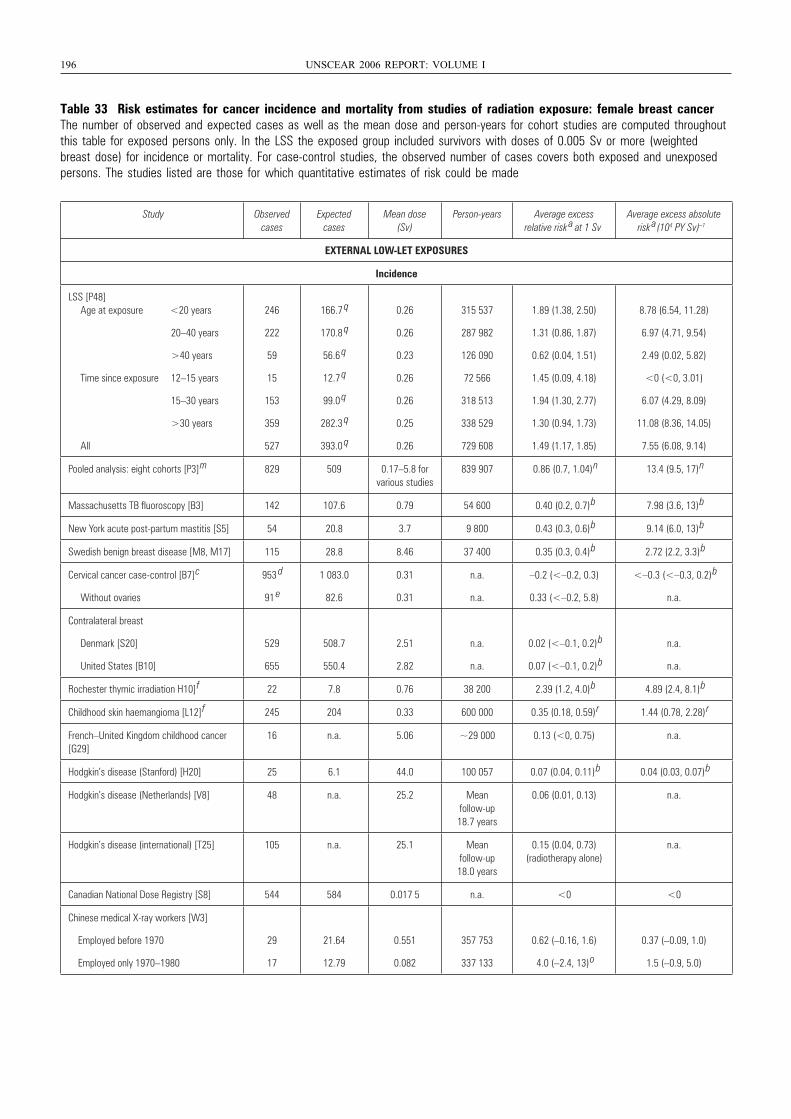
196 UNSCEAR 2006 REPORT: VOLUME I
Table 33 Risk estimates for cancer incidence and mortality from studies of radiation exposure: female breast cancerThe number of observed and expected cases as well as the mean dose and person-years for cohort studies are computed throughoutthis table for exposed persons only. In the LSS the exposed group included survivors with doses of 0.005 Sv or more (weightedbreast dose) for incidence or mortality. For case-control studies, the observed number of cases covers both exposed and unexposedpersons. The studies listed are those for which quantitative estimates of risk could be made
Study Observed cases
Expected cases
Mean dose (Sv)
Person-years Average excess relative risk
a at 1 SvAverage excess absolute
risk a(104 PY Sv) –1
EXTERNAL LOW-LET EXPOSURES
Incidence
LSS [P48] Age at exposure <20 years
20–40 years
>40 years
Time since exposure 12–15 years
15–30 years
>30 years
All
246
222
59
15
153
359
527
166.7 q
170.8 q
56.6 q
12.7 q
99.0 q
282.3 q
393.0 q
0.26
0.26
0.23
0.26
0.26
0.25
0.26
315 537
287 982
126 090
72 566
318 513
338 529
729 608
1.89 (1.38, 2.50)
1.31 (0.86, 1.87)
0.62 (0.04, 1.51)
1.45 (0.09, 4.18)
1.94 (1.30, 2.77)
1.30 (0.94, 1.73)
1.49 (1.17, 1.85)
8.78 (6.54, 11.28)
6.97 (4.71, 9.54)
2.49 (0.02, 5.82)
<0 (<0, 3.01)
6.07 (4.29, 8.09)
11.08 (8.36, 14.05)
7.55 (6.08, 9.14)
Pooled analysis: eight cohorts [P3]
m 829 509 0.17–5.8 for various studies
839 907 0.86 (0.7, 1.04)
n 13.4 (9.5, 17)
n
Massachusetts TB fluoroscopy [B3] 142 107.6 0.79 54 600 0.40 (0.2, 0.7)
b 7.98 (3.6, 13)
b
New York acute post-partum mastitis [S5] 54 20.8 3.7 9 800 0.43 (0.3, 0.6)
b 9.14 (6.0, 13)
b
Swedish benign breast disease [M8, M17] 115 28.8 8.46 37 400 0.35 (0.3, 0.4)
b 2.72 (2.2, 3.3)
b
Cervical cancer case-control [B7]
c
Without ovaries
953 d
91 e
1 083.0
82.6
0.31
0.31
n.a.
n.a.
–0.2 (<–0.2, 0.3)
0.33 (<–0.2, 5.8)
<–0.3 (<–0.3, 0.2)
b
n.a.
Contralateral breast
Denmark [S20]
United States [B10]
529
655
508.7
550.4
2.51
2.82
n.a.
n.a.
0.02 (<–0.1, 0.2)
b
0.07 (<–0.1, 0.2)
b
n.a.
n.a.
Rochester thymic irradiation H10]
f 22 7.8 0.76 38 200 2.39 (1.2, 4.0)
b 4.89 (2.4, 8.1)
b
Childhood skin haemangioma [L12]
f 245 204 0.33 600 000 0.35 (0.18, 0.59)
r 1.44 (0.78, 2.28)
r
French–United Kingdom childhood cancer [G29]
16 n.a. 5.06 ~29 000 0.13 (<0, 0.75) n.a.
Hodgkin’s disease (Stanford) [H20] 25 6.1 44.0 100 057 0.07 (0.04, 0.11)
b 0.04 (0.03, 0.07)
b
Hodgkin’s disease (Netherlands) [V8] 48 n.a. 25.2 Mean follow-up 18.7 years
0.06 (0.01, 0.13) n.a.
Hodgkin’s disease (international) [T25] 105 n.a. 25.1 Mean follow-up 18.0 years
0.15 (0.04, 0.73) (radiotherapy alone)
n.a.
Canadian National Dose Registry [S8] 544 584 0.017 5 n.a. <0 <0
Chinese medical X-ray workers [W3]
Employed before 1970
Employed only 1970–1980
29
17
21.64
12.79
0.551
0.082
357 753
337 133
0.62 (–0.16, 1.6)
4.0 (–2.4, 13)
o
0.37 (–0.09, 1.0)
1.5 (–0.9, 5.0)
UNSCEAR REPORT-PART 3.qxp 10/7/08 3:37 pm Page 196
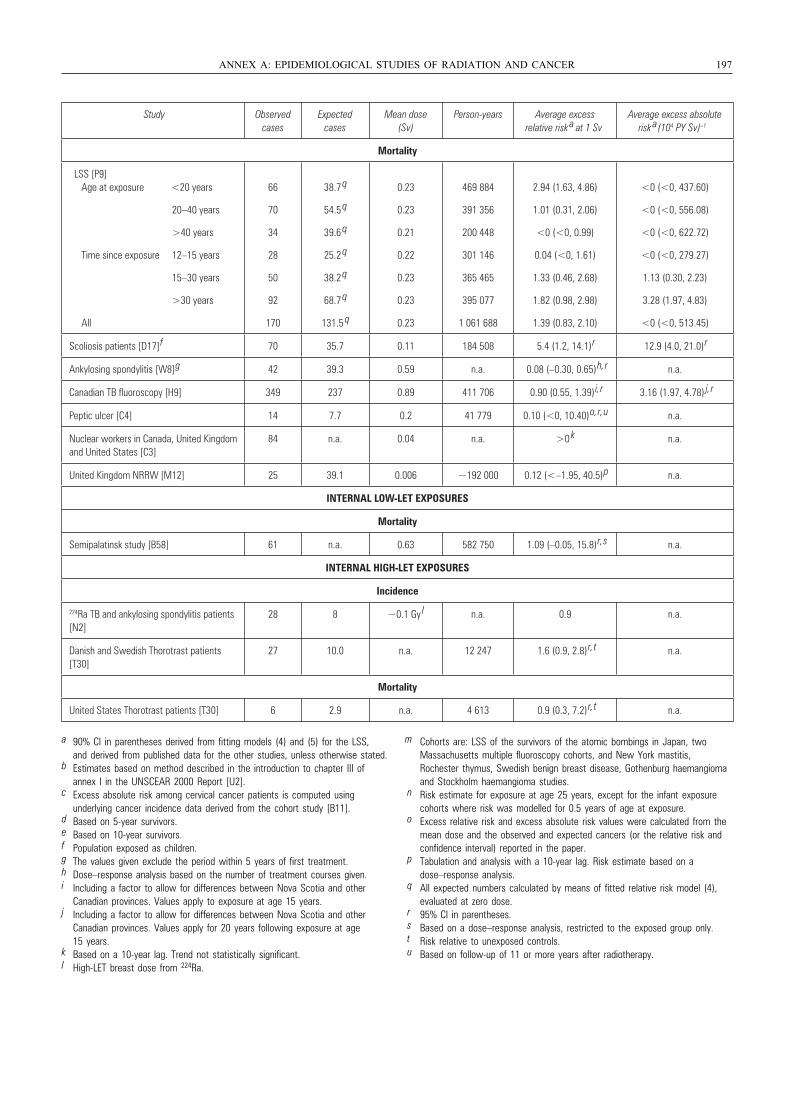
ANNEX A: EPIDEMIOLOGICAL STUDIES OF RADIATION AND CANCER 197
Study Observed cases
Expected cases
Mean dose (Sv)
Person-years Average excess relative risk
a at 1 SvAverage excess absolute
risk a (104 PY Sv) –1
Mortality
LSS [P9] Age at exposure <20 years
20–40 years
>40 years
Time since exposure 12–15 years
15–30 years
>30 years
All
66
70
34
28
50
92
170
38.7 q
54.5 q
39.6 q
25.2 q
38.2 q
68.7 q
131.5 q
0.23
0.23
0.21
0.22
0.23
0.23
0.23
469 884
391 356
200 448
301 146
365 465
395 077
1 061 688
2.94 (1.63, 4.86)
1.01 (0.31, 2.06)
<0 (<0, 0.99)
0.04 (<0, 1.61)
1.33 (0.46, 2.68)
1.82 (0.98, 2.98)
1.39 (0.83, 2.10)
<0 (<0, 437.60)
<0 (<0, 556.08)
<0 (<0, 622.72)
<0 (<0, 279.27)
1.13 (0.30, 2.23)
3.28 (1.97, 4.83)
<0 (<0, 513.45)
Scoliosis patients [D17]
f 70 35.7 0.11 184 508 5.4 (1.2, 14.1)
r 12.9 (4.0, 21.0)
r
Ankylosing spondylitis [W8]
g 42 39.3 0.59 n.a. 0.08 (–0.30, 0.65)
h, r n.a.
Canadian TB fluoroscopy [H9] 349 237 0.89 411 706 0.90 (0.55, 1.39)
i, r 3.16 (1.97, 4.78) j, r
Peptic ulcer [C4] 14 7.7 0.2 41 779 0.10 (<0, 10.40)
o, r, u n.a.
Nuclear workers in Canada, United Kingdom and United States [C3]
84 n.a. 0.04 n.a. >0 k n.a.
United Kingdom NRRW [M12] 25 39.1 0.006 ~192 000 0.12 (<–1.95, 40.5)
p n.a.
INTERNAL LOW-LET EXPOSURES
Mortality
Semipalatinsk study [B58] 61 n.a. 0.63 582 750 1.09 (–0.05, 15.8)
r, s n.a.
INTERNAL HIGH-LET EXPOSURES
Incidence
224Ra TB and ankylosing spondylitis patients [N2]
28 8 ~0.1 Gy l n.a. 0.9 n.a.
Danish and Swedish Thorotrast patients [T30]
27 10.0 n.a. 12 247 1.6 (0.9, 2.8)
r, t n.a.
Mortality
United States Thorotrast patients [T30] 6 2.9 n.a. 4 613 0.9 (0.3, 7.2)
r, t n.a.
a 90% CI in parentheses derived from fitting models (4) and (5) for the LSS, and derived from published data for the other studies, unless otherwise stated.
b Estimates based on method described in the introduction to chapter III of annex I in the UNSCEAR 2000 Report [U2].
c Excess absolute risk among cervical cancer patients is computed using underlying cancer incidence data derived from the cohort study [B11].
d Based on 5-year survivors.e Based on 10-year survivors.f Population exposed as children.g The values given exclude the period within 5 years of first treatment.h Dose–response analysis based on the number of treatment courses given.i Including a factor to allow for differences between Nova Scotia and other
Canadian provinces. Values apply to exposure at age 15 years.j Including a factor to allow for differences between Nova Scotia and other
Canadian provinces. Values apply for 20 years following exposure at age 15 years.
k Based on a 10-year lag. Trend not statistically significant.l High-LET breast dose from 224Ra.
m Cohorts are: LSS of the survivors of the atomic bombings in Japan, two Massachusetts multiple fluoroscopy cohorts, and New York mastitis, Rochester thymus, Swedish benign breast disease, Gothenburg haemangioma and Stockholm haemangioma studies.
n Risk estimate for exposure at age 25 years, except for the infant exposure cohorts where risk was modelled for 0.5 years of age at exposure.
o Excess relative risk and excess absolute risk values were calculated from themean dose and the observed and expected cancers (or the relative risk and confidence interval) reported in the paper.
p Tabulation and analysis with a 10-year lag. Risk estimate based on a dose–response analysis.
q All expected numbers calculated by means of fitted relative risk model (4), evaluated at zero dose.
r 95% CI in parentheses.s Based on a dose–response analysis, restricted to the exposed group only.t Risk relative to unexposed controls.u Based on follow-up of 11 or more years after radiotherapy.
UNSCEAR REPORT-PART 3.qxp 10/7/08 3:37 pm Page 197
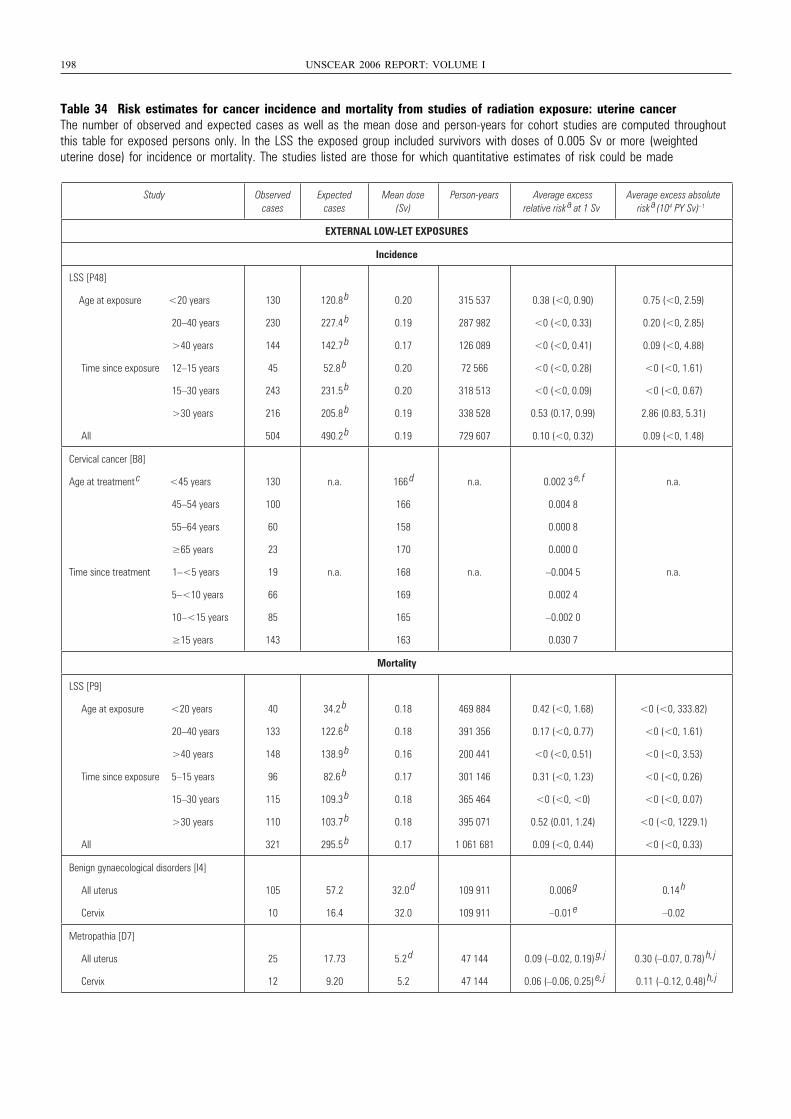
198 UNSCEAR 2006 REPORT: VOLUME I
Table 34 Risk estimates for cancer incidence and mortality from studies of radiation exposure: uterine cancerThe number of observed and expected cases as well as the mean dose and person-years for cohort studies are computed throughoutthis table for exposed persons only. In the LSS the exposed group included survivors with doses of 0.005 Sv or more (weighted uterine dose) for incidence or mortality. The studies listed are those for which quantitative estimates of risk could be made
Study Observed cases
Expected cases
Mean dose (Sv)
Person-years Average excess relative risk a at 1 Sv
Average excess absolute risk a(104 PY Sv) –1
EXTERNAL LOW-LET EXPOSURES
Incidence
LSS [P48]
Age at exposure <20 years
20–40 years
>40 years
Time since exposure 12–15 years
15–30 years
>30 years
All
130
230
144
45
243
216
504
120.8 b
227.4 b
142.7 b
52.8 b
231.5 b
205.8 b
490.2 b
0.20
0.19
0.17
0.20
0.20
0.19
0.19
315 537
287 982
126 089
72 566
318 513
338 528
729 607
0.38 (<0, 0.90)
<0 (<0, 0.33)
<0 (<0, 0.41)
<0 (<0, 0.28)
<0 (<0, 0.09)
0.53 (0.17, 0.99)
0.10 (<0, 0.32)
0.75 (<0, 2.59)
0.20 (<0, 2.85)
0.09 (<0, 4.88)
<0 (<0, 1.61)
<0 (<0, 0.67)
2.86 (0.83, 5.31)
0.09 (<0, 1.48)
Cervical cancer [B8]
Age at treatment c <45 years
45–54 years
55–64 years
≥65 years
Time since treatment 1–<5 years
5–<10 years
10–<15 years
≥15 years
130
100
60
23
19
66
85
143
n.a.
n.a.
166 d
166
158
170
168
169
165
163
n.a.
n.a.
0.002 3 e, f
0.004 8
0.000 8
0.000 0
–0.004 5
0.002 4
–0.002 0
0.030 7
n.a.
n.a.
Mortality
LSS [P9]
Age at exposure <20 years
20–40 years
>40 years
Time since exposure 5–15 years
15–30 years
>30 years
All
40
133
148
96
115
110
321
34.2 b
122.6 b
138.9 b
82.6 b
109.3 b
103.7 b
295.5 b
0.18
0.18
0.16
0.17
0.18
0.18
0.17
469 884
391 356
200 441
301 146
365 464
395 071
1 061 681
0.42 (<0, 1.68)
0.17 (<0, 0.77)
<0 (<0, 0.51)
0.31 (<0, 1.23)
<0 (<0, <0)
0.52 (0.01, 1.24)
0.09 (<0, 0.44)
<0 (<0, 333.82)
<0 (<0, 1.61)
<0 (<0, 3.53)
<0 (<0, 0.26)
<0 (<0, 0.07)
<0 (<0, 1229.1)
<0 (<0, 0.33)
Benign gynaecological disorders [I4]
All uterus
Cervix
105
10
57.2
16.4
32.0 d
32.0
109 911
109 911
0.006 g
–0.01 e
0.14 h
–0.02
Metropathia [D7]
All uterus
Cervix
25
12
17.73
9.20
5.2 d
5.2
47 144
47 144
0.09 (–0.02, 0.19) g, j
0.06 (–0.06, 0.25) e, j
0.30 (–0.07, 0.78) h, j
0.11 (–0.12, 0.48) h, j
UNSCEAR REPORT-PART 3.qxp 10/7/08 3:37 pm Page 198
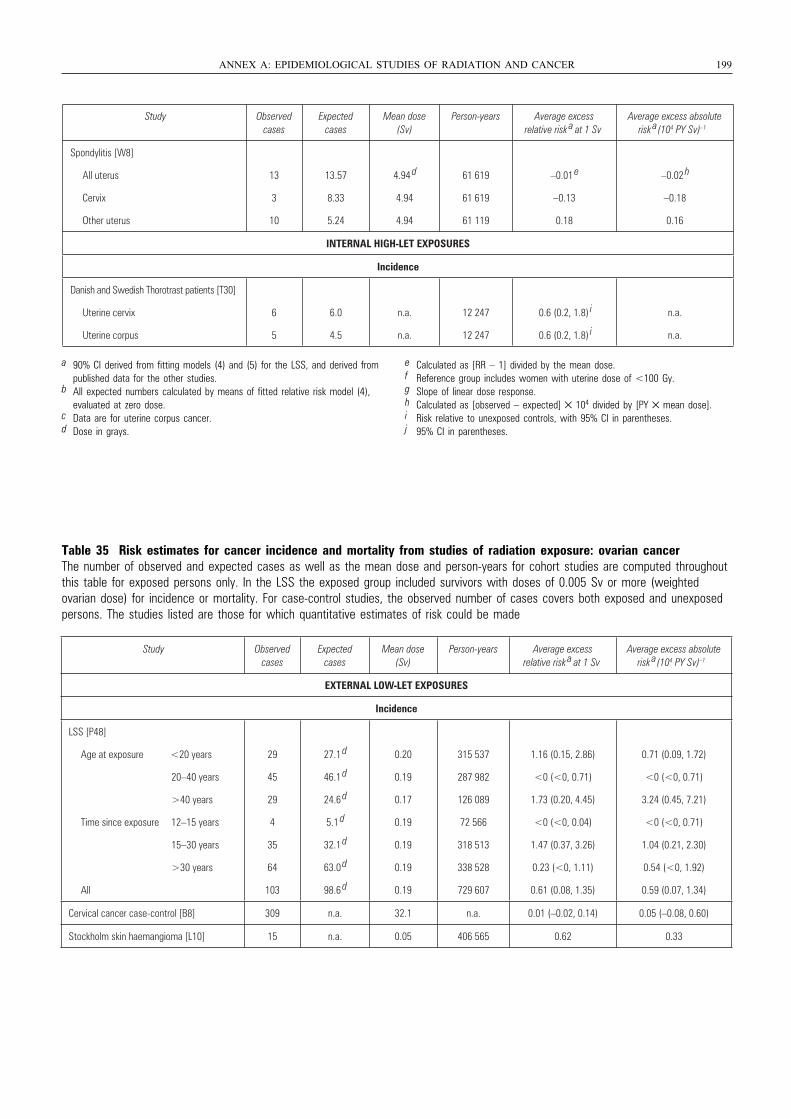
Table 35 Risk estimates for cancer incidence and mortality from studies of radiation exposure: ovarian cancerThe number of observed and expected cases as well as the mean dose and person-years for cohort studies are computed throughoutthis table for exposed persons only. In the LSS the exposed group included survivors with doses of 0.005 Sv or more (weighted ovarian dose) for incidence or mortality. For case-control studies, the observed number of cases covers both exposed and unexposedpersons. The studies listed are those for which quantitative estimates of risk could be made
ANNEX A: EPIDEMIOLOGICAL STUDIES OF RADIATION AND CANCER 199
Study Observed cases
Expected cases
Mean dose (Sv)
Person-years Average excess relative risk
a at 1 SvAverage excess absolute
risk a(104 PY Sv) –1
Spondylitis [W8]
All uterus
Cervix
Other uterus
13
3
10
13.57
8.33
5.24
4.94 d
4.94
4.94
61 619
61 619
61 119
–0.01 e
–0.13
0.18
–0.02 h
–0.18
0.16
INTERNAL HIGH-LET EXPOSURES
Incidence
Danish and Swedish Thorotrast patients [T30]
Uterine cervix
Uterine corpus
6
5
6.0
4.5
n.a.
n.a.
12 247
12 247
0.6 (0.2, 1.8) i
0.6 (0.2, 1.8) i
n.a.
n.a.
a 90% CI derived from fitting models (4) and (5) for the LSS, and derived from published data for the other studies.
b All expected numbers calculated by means of fitted relative risk model (4), evaluated at zero dose.
c Data are for uterine corpus cancer.d Dose in grays.
e Calculated as [RR – 1] divided by the mean dose.f Reference group includes women with uterine dose of <100 Gy.g Slope of linear dose response.h Calculated as [observed – expected] × 104 divided by [PY × mean dose].i Risk relative to unexposed controls, with 95% CI in parentheses.j 95% CI in parentheses.
Study Observed cases
Expected cases
Mean dose (Sv)
Person-years Average excess relative risk a at 1 Sv
Average excess absolute risk a(104 PY Sv) –1
EXTERNAL LOW-LET EXPOSURES
Incidence
LSS [P48]
Age at exposure <20 years
20–40 years
>40 years
Time since exposure 12–15 years
15–30 years
>30 years
All
29
45
29
4
35
64
103
27.1 d
46.1 d
24.6 d
5.1 d
32.1 d
63.0 d
98.6 d
0.20
0.19
0.17
0.19
0.19
0.19
0.19
315 537
287 982
126 089
72 566
318 513
338 528
729 607
1.16 (0.15, 2.86)
<0 (<0, 0.71)
1.73 (0.20, 4.45)
<0 (<0, 0.04)
1.47 (0.37, 3.26)
0.23 (<0, 1.11)
0.61 (0.08, 1.35)
0.71 (0.09, 1.72)
<0 (<0, 0.71)
3.24 (0.45, 7.21)
<0 (<0, 0.71)
1.04 (0.21, 2.30)
0.54 (<0, 1.92)
0.59 (0.07, 1.34)
Cervical cancer case-control [B8] 309 n.a. 32.1 n.a. 0.01 (–0.02, 0.14) 0.05 (–0.08, 0.60)
Stockholm skin haemangioma [L10] 15 n.a. 0.05 406 565 0.62 0.33
UNSCEAR REPORT-PART 3.qxp 10/7/08 3:37 pm Page 199
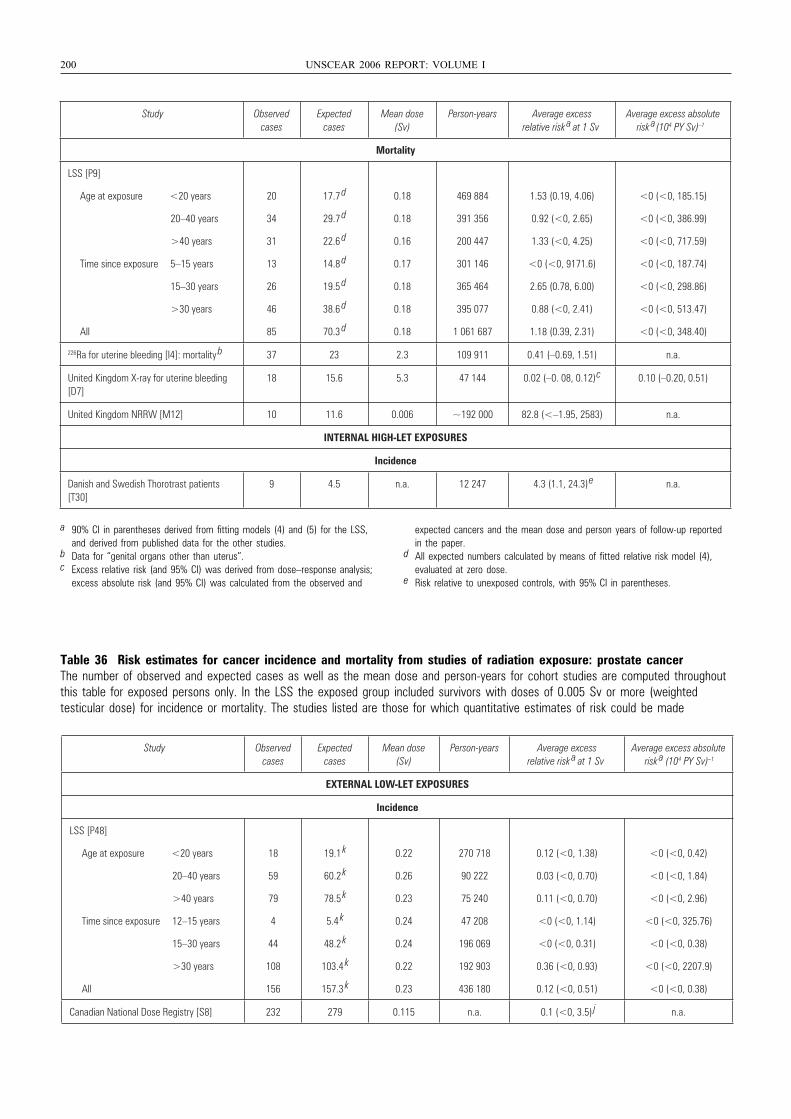
200 UNSCEAR 2006 REPORT: VOLUME I
Table 36 Risk estimates for cancer incidence and mortality from studies of radiation exposure: prostate cancerThe number of observed and expected cases as well as the mean dose and person-years for cohort studies are computed throughoutthis table for exposed persons only. In the LSS the exposed group included survivors with doses of 0.005 Sv or more (weighted testicular dose) for incidence or mortality. The studies listed are those for which quantitative estimates of risk could be made
Study Observed cases
Expected cases
Mean dose (Sv)
Person-years Average excess relative risk
a at 1 SvAverage excess absolute
risk a(104 PY Sv) –1
Mortality
LSS [P9]
Age at exposure <20 years
20–40 years
>40 years
Time since exposure 5–15 years
15–30 years
>30 years
All
20
34
31
13
26
46
85
17.7 d
29.7 d
22.6 d
14.8 d
19.5 d
38.6 d
70.3 d
0.18
0.18
0.16
0.17
0.18
0.18
0.18
469 884
391 356
200 447
301 146
365 464
395 077
1 061 687
1.53 (0.19, 4.06)
0.92 (<0, 2.65)
1.33 (<0, 4.25)
<0 (<0, 9171.6)
2.65 (0.78, 6.00)
0.88 (<0, 2.41)
1.18 (0.39, 2.31)
<0 (<0, 185.15)
<0 (<0, 386.99)
<0 (<0, 717.59)
<0 (<0, 187.74)
<0 (<0, 298.86)
<0 (<0, 513.47)
<0 (<0, 348.40)
226Ra for uterine bleeding [I4]: mortality b 37 23 2.3 109 911 0.41 (–0.69, 1.51) n.a.
United Kingdom X-ray for uterine bleeding [D7]
18 15.6 5.3 47 144 0.02 (–0. 08, 0.12)
c 0.10 (–0.20, 0.51)
United Kingdom NRRW [M12] 10 11.6 0.006 ~192 000 82.8 (<–1.95, 2583) n.a.
INTERNAL HIGH-LET EXPOSURES
Incidence
Danish and Swedish Thorotrast patients [T30]
9 4.5 n.a. 12 247 4.3 (1.1, 24.3)
e n.a.
a 90% CI in parentheses derived from fitting models (4) and (5) for the LSS, and derived from published data for the other studies.
b Data for “genital organs other than uterus”.c Excess relative risk (and 95% CI) was derived from dose–response analysis;
excess absolute risk (and 95% CI) was calculated from the observed and
expected cancers and the mean dose and person years of follow-up reportedin the paper.
d All expected numbers calculated by means of fitted relative risk model (4), evaluated at zero dose.
e Risk relative to unexposed controls, with 95% CI in parentheses.
Study Observed cases
Expected cases
Mean dose (Sv)
Person-years Average excess relative risk a at 1 Sv
Average excess absolute risk a (104 PY Sv) –1
EXTERNAL LOW-LET EXPOSURES
Incidence
LSS [P48]
Age at exposure <20 years
20–40 years
>40 years
Time since exposure 12–15 years
15–30 years
>30 years
All
18
59
79
4
44
108
156
19.1 k
60.2 k
78.5 k
5.4 k
48.2 k
103.4 k
157.3 k
0.22
0.26
0.23
0.24
0.24
0.22
0.23
270 718
90 222
75 240
47 208
196 069
192 903
436 180
0.12 (<0, 1.38)
0.03 (<0, 0.70)
0.11 (<0, 0.70)
<0 (<0, 1.14)
<0 (<0, 0.31)
0.36 (<0, 0.93)
0.12 (<0, 0.51)
<0 (<0, 0.42)
<0 (<0, 1.84)
<0 (<0, 2.96)
<0 (<0, 325.76)
<0 (<0, 0.38)
<0 (<0, 2207.9)
<0 (<0, 0.38)
Canadian National Dose Registry [S8] 232 279 0.115 n.a. 0.1 (<0, 3.5) j n.a.
UNSCEAR REPORT-PART 3.qxp 10/7/08 3:37 pm Page 200
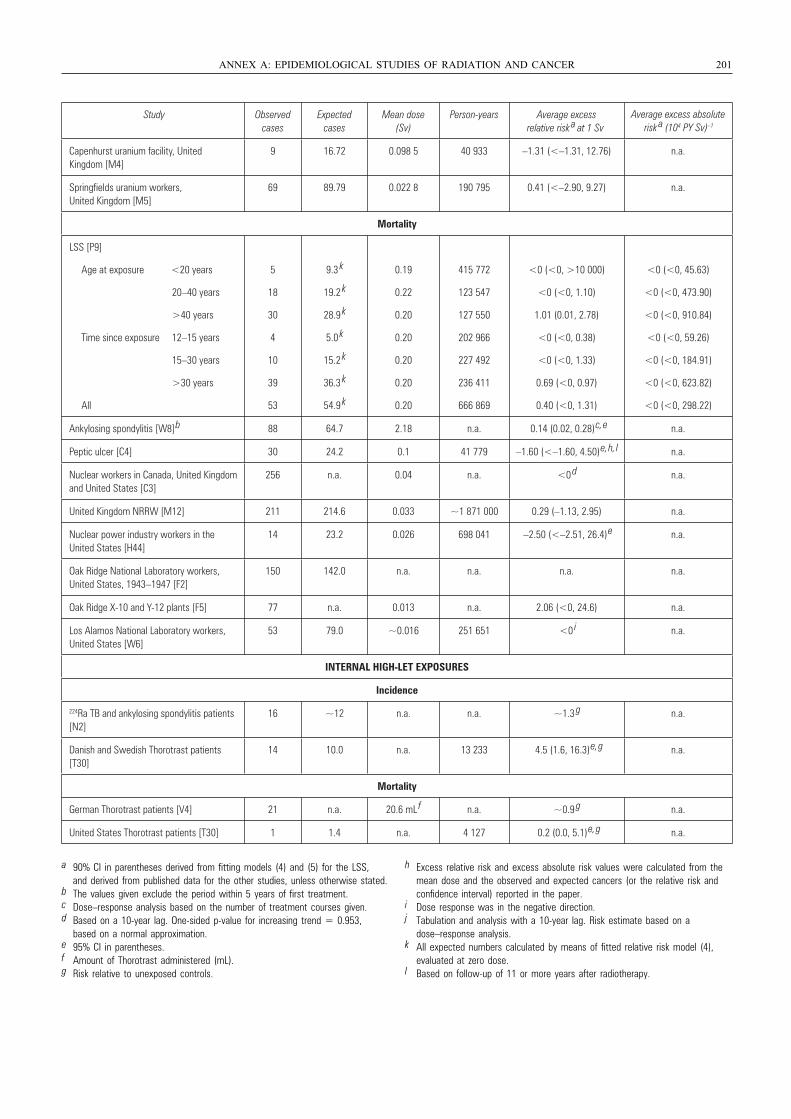
ANNEX A: EPIDEMIOLOGICAL STUDIES OF RADIATION AND CANCER 201
a 90% CI in parentheses derived from fitting models (4) and (5) for the LSS, and derived from published data for the other studies, unless otherwise stated.
b The values given exclude the period within 5 years of first treatment.c Dose–response analysis based on the number of treatment courses given.d Based on a 10-year lag. One-sided p-value for increasing trend = 0.953,
based on a normal approximation.e 95% CI in parentheses.f Amount of Thorotrast administered (mL).g Risk relative to unexposed controls.
h Excess relative risk and excess absolute risk values were calculated from the mean dose and the observed and expected cancers (or the relative risk and confidence interval) reported in the paper.
i Dose response was in the negative direction.j Tabulation and analysis with a 10-year lag. Risk estimate based on a
dose–response analysis.k All expected numbers calculated by means of fitted relative risk model (4),
evaluated at zero dose.l Based on follow-up of 11 or more years after radiotherapy.
Study Observed cases
Expected cases
Mean dose (Sv)
Person-years Average excess relative risk a at 1 Sv
Capenhurst uranium facility, United Kingdom [M4]
9 16.72 0.098 5 40 933 –1.31 (<–1.31, 12.76) n.a.
Springfields uranium workers, United Kingdom [M5]
69 89.79 0.022 8 190 795 0.41 (<–2.90, 9.27) n.a.
Mortality
LSS [P9]
Age at exposure <20 years
20–40 years
>40 years
Time since exposure 12–15 years
15–30 years
>30 years
All
5
18
30
4
10
39
53
9.3 k
19.2 k
28.9 k
5.0 k
15.2 k
36.3 k
54.9 k
0.19
0.22
0.20
0.20
0.20
0.20
0.20
415 772
123 547
127 550
202 966
227 492
236 411
666 869
<0 (<0, >10 000)
<0 (<0, 1.10)
1.01 (0.01, 2.78)
<0 (<0, 0.38)
<0 (<0, 1.33)
0.69 (<0, 0.97)
0.40 (<0, 1.31)
<0 (<0, 45.63)
<0 (<0, 473.90)
<0 (<0, 910.84)
<0 (<0, 59.26)
<0 (<0, 184.91)
<0 (<0, 623.82)
<0 (<0, 298.22)
Ankylosing spondylitis [W8] b 88 64.7 2.18 n.a. 0.14 (0.02, 0.28) c, e n.a.
Peptic ulcer [C4] 30 24.2 0.1 41 779 –1.60 (<–1.60, 4.50) e, h, l n.a.
Nuclear workers in Canada, United Kingdom and United States [C3]
256 n.a. 0.04 n.a. <0 d n.a.
United Kingdom NRRW [M12] 211 214.6 0.033 ~1 871 000 0.29 (–1.13, 2.95) n.a.
Nuclear power industry workers in the United States [H44]
14 23.2 0.026 698 041 –2.50 (<–2.51, 26.4) e n.a.
Oak Ridge National Laboratory workers, United States, 1943–1947 [F2]
150 142.0 n.a. n.a. n.a. n.a.
Oak Ridge X-10 and Y-12 plants [F5] 77 n.a. 0.013 n.a. 2.06 (<0, 24.6) n.a.
Los Alamos National Laboratory workers, United States [W6]
53 79.0 ~0.016 251 651 <0 i n.a.
INTERNAL HIGH-LET EXPOSURES
Incidence
224Ra TB and ankylosing spondylitis patients [N2]
16 ~12 n.a. n.a. ~1.3 g n.a.
Danish and Swedish Thorotrast patients [T30]
14 10.0 n.a. 13 233 4.5 (1.6, 16.3) e, g n.a.
Mortality
German Thorotrast patients [V4] 21 n.a. 20.6 mL f n.a. ~0.9 g n.a.
United States Thorotrast patients [T30] 1 1.4 n.a. 4 127 0.2 (0.0, 5.1) e, g n.a.
Average excess absolute risk a (104 PY Sv) –1
UNSCEAR REPORT-PART 3.qxp 10/7/08 3:37 pm Page 201
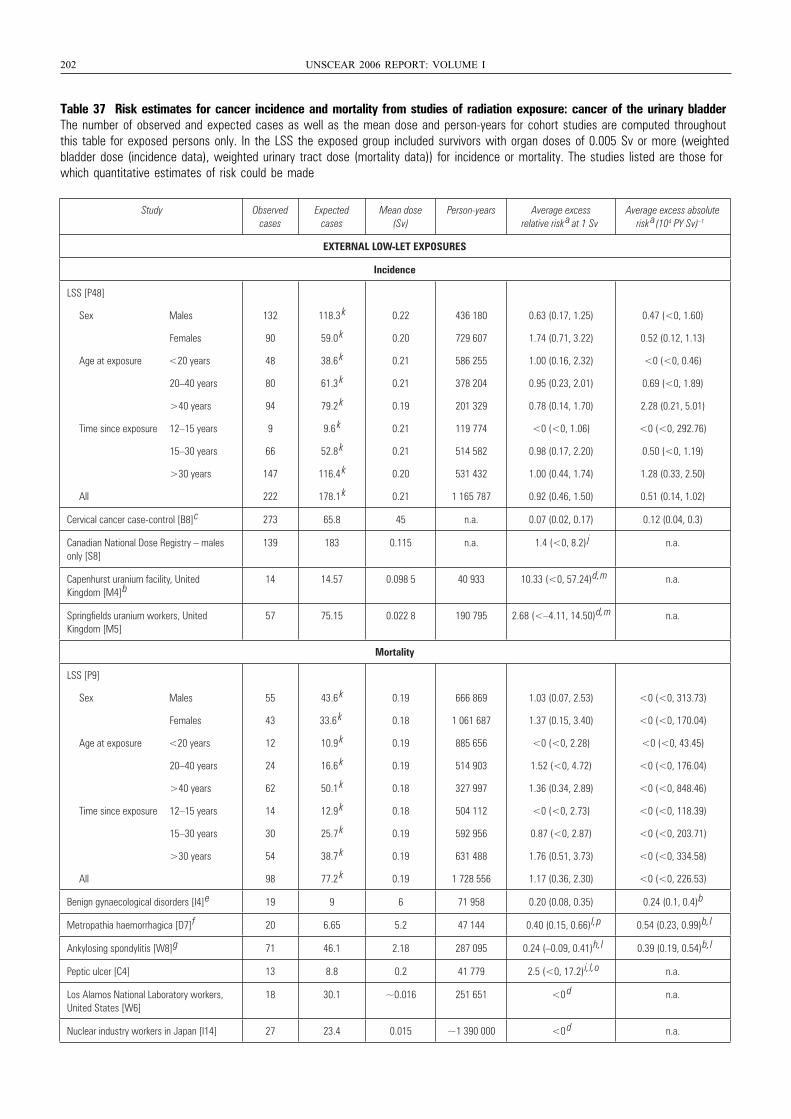
202 UNSCEAR 2006 REPORT: VOLUME I
Table 37 Risk estimates for cancer incidence and mortality from studies of radiation exposure: cancer of the urinary bladderThe number of observed and expected cases as well as the mean dose and person-years for cohort studies are computed throughoutthis table for exposed persons only. In the LSS the exposed group included survivors with organ doses of 0.005 Sv or more (weightedbladder dose (incidence data), weighted urinary tract dose (mortality data)) for incidence or mortality. The studies listed are those forwhich quantitative estimates of risk could be made
Study Observed cases
Expected cases
Mean dose (Sv)
Person-years Average excess relative risk
a at 1 SvAverage excess absolute
risk a(104 PY Sv) –1
EXTERNAL LOW-LET EXPOSURES
Incidence
LSS [P48]
Sex Males
Females
Age at exposure <20 years
20–40 years
>40 years
Time since exposure 12–15 years
15–30 years
>30 years
All
132
90
48
80
94
9
66
147
222
118.3 k
59.0 k
38.6 k
61.3 k
79.2 k
9.6 k
52.8 k
116.4 k
178.1 k
0.22
0.20
0.21
0.21
0.19
0.21
0.21
0.20
0.21
436 180
729 607
586 255
378 204
201 329
119 774
514 582
531 432
1 165 787
0.63 (0.17, 1.25)
1.74 (0.71, 3.22)
1.00 (0.16, 2.32)
0.95 (0.23, 2.01)
0.78 (0.14, 1.70)
<0 (<0, 1.06)
0.98 (0.17, 2.20)
1.00 (0.44, 1.74)
0.92 (0.46, 1.50)
0.47 (<0, 1.60)
0.52 (0.12, 1.13)
<0 (<0, 0.46)
0.69 (<0, 1.89)
2.28 (0.21, 5.01)
<0 (<0, 292.76)
0.50 (<0, 1.19)
1.28 (0.33, 2.50)
0.51 (0.14, 1.02)
Cervical cancer case-control [B8]
c 273 65.8 45 n.a. 0.07 (0.02, 0.17) 0.12 (0.04, 0.3)
Canadian National Dose Registry – males only [S8]
139 183 0.115 n.a. 1.4 (<0, 8.2) j n.a.
Capenhurst uranium facility, United Kingdom [M4]
b14 14.57 0.098 5 40 933 10.33 (<0, 57.24)
d, m n.a.
Springfields uranium workers, United Kingdom [M5]
57 75.15 0.022 8 190 795 2.68 (<–4.11, 14.50)
d, m n.a.
Mortality
LSS [P9]
Sex Males
Females
Age at exposure <20 years
20–40 years
>40 years
Time since exposure 12–15 years
15–30 years
>30 years
All
55
43
12
24
62
14
30
54
98
43.6 k
33.6 k
10.9 k
16.6 k
50.1 k
12.9 k
25.7 k
38.7 k
77.2 k
0.19
0.18
0.19
0.19
0.18
0.18
0.19
0.19
0.19
666 869
1 061 687
885 656
514 903
327 997
504 112
592 956
631 488
1 728 556
1.03 (0.07, 2.53)
1.37 (0.15, 3.40)
<0 (<0, 2.28)
1.52 (<0, 4.72)
1.36 (0.34, 2.89)
<0 (<0, 2.73)
0.87 (<0, 2.87)
1.76 (0.51, 3.73)
1.17 (0.36, 2.30)
<0 (<0, 313.73)
<0 (<0, 170.04)
<0 (<0, 43.45)
<0 (<0, 176.04)
<0 (<0, 848.46)
<0 (<0, 118.39)
<0 (<0, 203.71)
<0 (<0, 334.58)
<0 (<0, 226.53)
Benign gynaecological disorders [I4]
e 19 9 6 71 958 0.20 (0.08, 0.35) 0.24 (0.1, 0.4)
b
Metropathia haemorrhagica [D7]
f 20 6.65 5.2 47 144 0.40 (0.15, 0.66)
l, p 0.54 (0.23, 0.99)
b, l
Ankylosing spondylitis [W8]
g 71 46.1 2.18 287 095 0.24 (–0.09, 0.41)
h, l 0.39 (0.19, 0.54)
b, l
Peptic ulcer [C4] 13 8.8 0.2 41 779 2.5 (<0, 17.2)
i, l, o n.a.
Los Alamos National Laboratory workers, United States [W6]
18 30.1 ~0.016 251 651 <0 d n.a.
Nuclear industry workers in Japan [I14] 27 23.4 0.015 ~1 390 000 <0 d n.a.
UNSCEAR REPORT-PART 3.qxp 10/7/08 3:37 pm Page 202
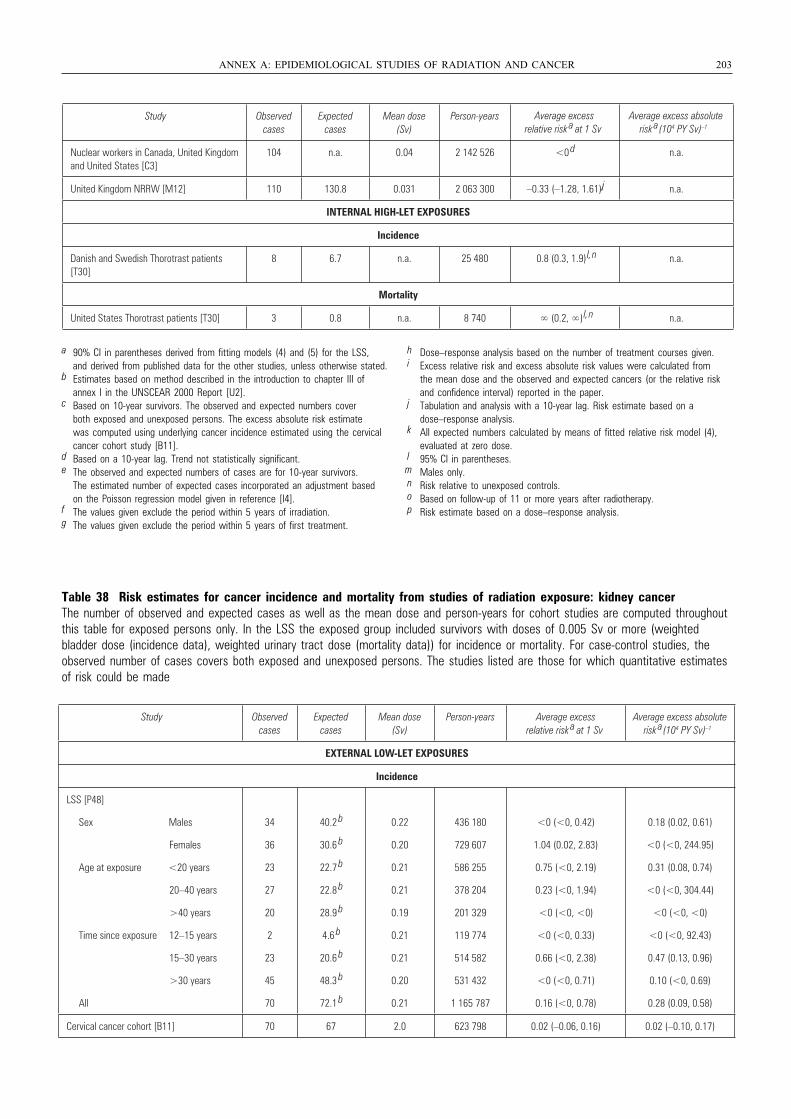
Table 38 Risk estimates for cancer incidence and mortality from studies of radiation exposure: kidney cancerThe number of observed and expected cases as well as the mean dose and person-years for cohort studies are computed throughoutthis table for exposed persons only. In the LSS the exposed group included survivors with doses of 0.005 Sv or more (weighted bladder dose (incidence data), weighted urinary tract dose (mortality data)) for incidence or mortality. For case-control studies, theobserved number of cases covers both exposed and unexposed persons. The studies listed are those for which quantitative estimatesof risk could be made
ANNEX A: EPIDEMIOLOGICAL STUDIES OF RADIATION AND CANCER 203
Study Observed cases
Expected cases
Mean dose (Sv)
Person-years
Nuclear workers in Canada, United Kingdom and United States [C3]
104 n.a. 0.04 2 142 526 <0 d n.a.
United Kingdom NRRW [M12] 110 130.8 0.031 2 063 300 –0.33 (–1.28, 1.61)
jj n.a.
INTERNAL HIGH-LET EXPOSURES
Incidence
Danish and Swedish Thorotrast patients [T30]
8 6.7 n.a. 25 480 0.8 (0.3, 1.9)
l, n n.a.
Mortality
United States Thorotrast patients [T30] 3 0.8 n.a. 8 740 ∞ (0.2, ∞)
l, n n.a.
Average excess relative risk
a at 1 SvAverage excess absolute
risk a(104 PY Sv) –1
a 90% CI in parentheses derived from fitting models (4) and (5) for the LSS, and derived from published data for the other studies, unless otherwise stated.
b Estimates based on method described in the introduction to chapter III of annex I in the UNSCEAR 2000 Report [U2].
c Based on 10-year survivors. The observed and expected numbers cover both exposed and unexposed persons. The excess absolute risk estimate was computed using underlying cancer incidence estimated using the cervical cancer cohort study [B11].
d Based on a 10-year lag. Trend not statistically significant.e The observed and expected numbers of cases are for 10-year survivors.
The estimated number of expected cases incorporated an adjustment based on the Poisson regression model given in reference [I4].
f The values given exclude the period within 5 years of irradiation.g The values given exclude the period within 5 years of first treatment.
h Dose–response analysis based on the number of treatment courses given.i Excess relative risk and excess absolute risk values were calculated from
the mean dose and the observed and expected cancers (or the relative risk and confidence interval) reported in the paper.
j Tabulation and analysis with a 10-year lag. Risk estimate based on a dose–response analysis.
k All expected numbers calculated by means of fitted relative risk model (4), evaluated at zero dose.
l 95% CI in parentheses.m Males only.n Risk relative to unexposed controls.o Based on follow-up of 11 or more years after radiotherapy.p Risk estimate based on a dose–response analysis.
Study Observed cases
Expected cases
Mean dose (Sv)
Person-years Average excess relative risk
a at 1 SvAverage excess absolute
risk a(104 PY Sv) –1
EXTERNAL LOW-LET EXPOSURES
Incidence
LSS [P48]
Sex Males
Females
Age at exposure <20 years
20–40 years
>40 years
Time since exposure 12–15 years
15–30 years
>30 years
All
34
36
23
27
20
2
23
45
70
40.2 b
30.6 b
22.7 b
22.8 b
28.9 b
4.6 b
20.6 b
48.3 b
72.1 b
0.22
0.20
0.21
0.21
0.19
0.21
0.21
0.20
0.21
436 180
729 607
586 255
378 204
201 329
119 774
514 582
531 432
1 165 787
<0 (<0, 0.42)
1.04 (0.02, 2.83)
0.75 (<0, 2.19)
0.23 (<0, 1.94)
<0 (<0, <0)
<0 (<0, 0.33)
0.66 (<0, 2.38)
<0 (<0, 0.71)
0.16 (<0, 0.78)
0.18 (0.02, 0.61)
<0 (<0, 244.95)
0.31 (0.08, 0.74)
<0 (<0, 304.44)
<0 (<0, <0)
<0 (<0, 92.43)
0.47 (0.13, 0.96)
0.10 (<0, 0.69)
0.28 (0.09, 0.58)
Cervical cancer cohort [B11] 70 67 2.0 623 798 0.02 (–0.06, 0.16) 0.02 (–0.10, 0.17)
UNSCEAR REPORT-PART 3.qxp 10/7/08 3:37 pm Page 203
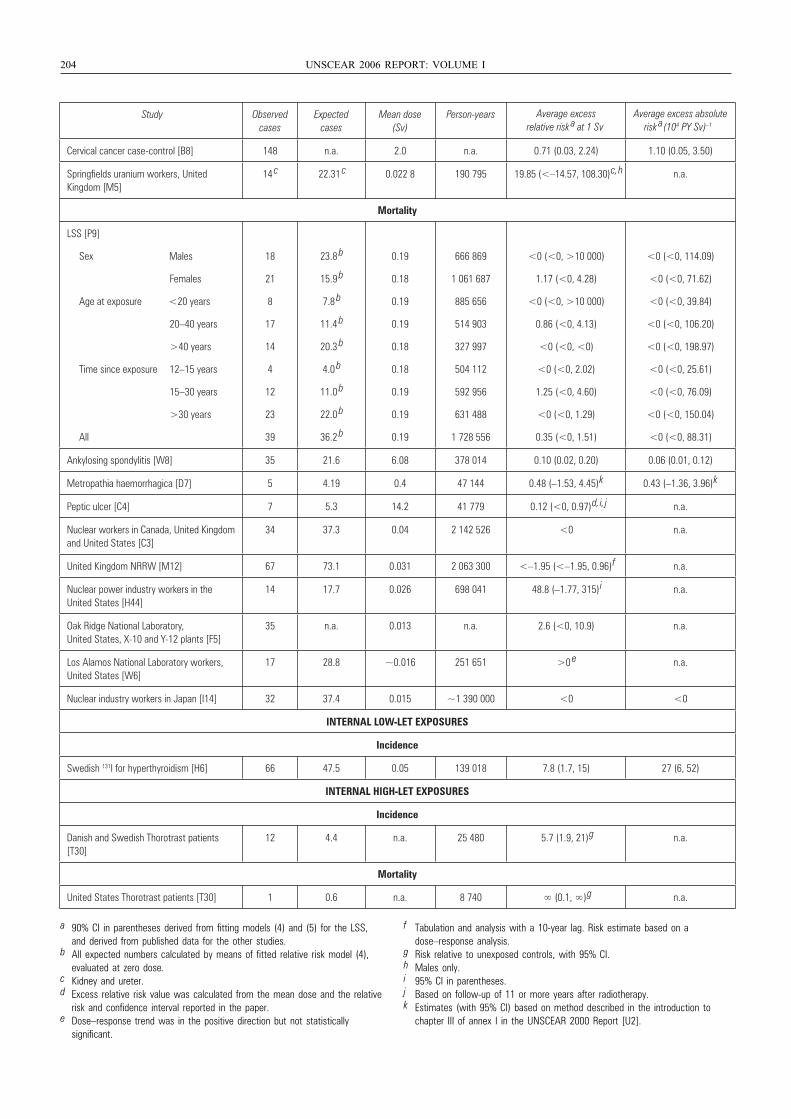
204 UNSCEAR 2006 REPORT: VOLUME I
Study Observed cases
Expected cases
Mean dose (Sv)
Person-years
Cervical cancer case-control [B8] 148 n.a. 2.0 n.a. 0.71 (0.03, 2.24) 1.10 (0.05, 3.50)
Springfields uranium workers, United Kingdom [M5]
14 c 22.31
c 0.022 8 190 795 19.85 (<–14.57, 108.30) c, h n.a.
Mortality
LSS [P9]
Sex Males
Females
Age at exposure <20 years
20–40 years
>40 years
Time since exposure 12–15 years
15–30 years
>30 years
All
18
21
8
17
14
4
12
23
39
23.8 b
15.9 b
7.8 b
11.4 b
20.3 b
4.0 b
11.0 b
22.0 b
36.2 b
0.19
0.18
0.19
0.19
0.18
0.18
0.19
0.19
0.19
666 869
1 061 687
885 656
514 903
327 997
504 112
592 956
631 488
1 728 556
<0 (<0, >10 000)
1.17 (<0, 4.28)
<0 (<0, >10 000)
0.86 (<0, 4.13)
<0 (<0, <0)
<0 (<0, 2.02)
1.25 (<0, 4.60)
<0 (<0, 1.29)
0.35 (<0, 1.51)
<0 (<0, 114.09)
<0 (<0, 71.62)
<0 (<0, 39.84)
<0 (<0, 106.20)
<0 (<0, 198.97)
<0 (<0, 25.61)
<0 (<0, 76.09)
<0 (<0, 150.04)
<0 (<0, 88.31)
Ankylosing spondylitis [W8] 35 21.6 6.08 378 014 0.10 (0.02, 0.20) 0.06 (0.01, 0.12)
Metropathia haemorrhagica [D7] 5 4.19 0.4 47 144 0.48 (–1.53, 4.45) k 0.43 (–1.36, 3.96) k
Peptic ulcer [C4] 7 5.3 14.2 41 779 0.12 (<0, 0.97) d, i, j n.a.
Nuclear workers in Canada, United Kingdom and United States [C3]
34 37.3 0.04 2 142 526 <0 n.a.
United Kingdom NRRW [M12] 67 73.1 0.031 2 063 300 <–1.95 (<–1.95, 0.96) f n.a.
Nuclear power industry workers in the United States [H44]
14 17.7 0.026 698 041 48.8 (–1.77, 315) i n.a.
Oak Ridge National Laboratory, United States, X-10 and Y-12 plants [F5]
35 n.a. 0.013 n.a. 2.6 (<0, 10.9) n.a.
Los Alamos National Laboratory workers, United States [W6]
17 28.8 ~0.016 251 651 >0 e n.a.
Nuclear industry workers in Japan [I14] 32 37.4 0.015 ~1 390 000 <0 <0
INTERNAL LOW-LET EXPOSURES
Incidence
Swedish 131I for hyperthyroidism [H6] 66 47.5 0.05 139 018 7.8 (1.7, 15) 27 (6, 52)
INTERNAL HIGH-LET EXPOSURES
Incidence
Danish and Swedish Thorotrast patients [T30]
12 4.4 n.a. 25 480 5.7 (1.9, 21) g n.a.
Mortality
United States Thorotrast patients [T30] 1 0.6 n.a. 8 740 ∞ (0.1, ∞) g n.a.
Average excess relative risk
a at 1 SvAverage excess absolute
risk a(104 PY Sv) –1
a 90% CI in parentheses derived from fitting models (4) and (5) for the LSS, and derived from published data for the other studies.
b All expected numbers calculated by means of fitted relative risk model (4), evaluated at zero dose.
c Kidney and ureter.d Excess relative risk value was calculated from the mean dose and the relative
risk and confidence interval reported in the paper. e Dose–response trend was in the positive direction but not statistically
significant.
f Tabulation and analysis with a 10-year lag. Risk estimate based on a dose–response analysis.
g Risk relative to unexposed controls, with 95% CI.h Males only.i 95% CI in parentheses.j Based on follow-up of 11 or more years after radiotherapy.k Estimates (with 95% CI) based on method described in the introduction to
chapter III of annex I in the UNSCEAR 2000 Report [U2].
UNSCEAR REPORT-PART 3.qxp 10/7/08 3:37 pm Page 204
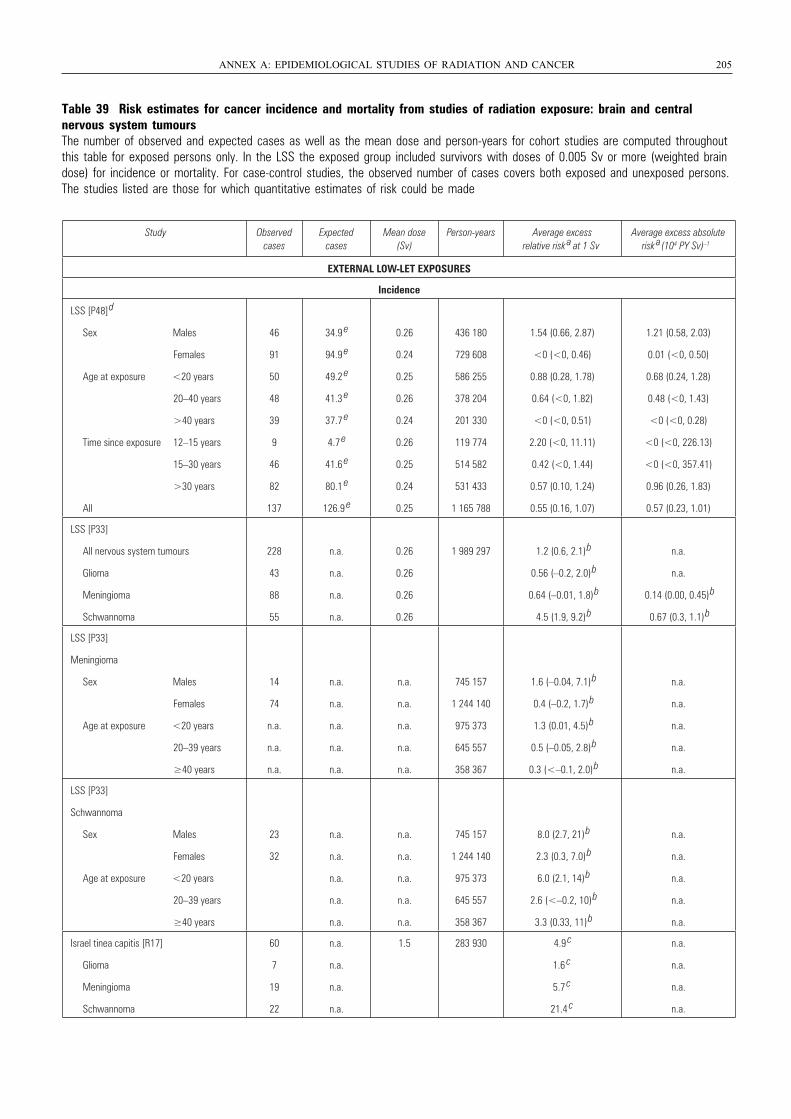
Table 39 Risk estimates for cancer incidence and mortality from studies of radiation exposure: brain and central nervous system tumoursThe number of observed and expected cases as well as the mean dose and person-years for cohort studies are computed throughoutthis table for exposed persons only. In the LSS the exposed group included survivors with doses of 0.005 Sv or more (weighted braindose) for incidence or mortality. For case-control studies, the observed number of cases covers both exposed and unexposed persons.The studies listed are those for which quantitative estimates of risk could be made
ANNEX A: EPIDEMIOLOGICAL STUDIES OF RADIATION AND CANCER 205
Study Observed cases
Expected cases
Mean dose (Sv)
Person-years Average excess relative risk
a at 1 SvAverage excess absolute
risk a(104 PY Sv) –1
EXTERNAL LOW-LET EXPOSURES
Incidence
LSS [P48]
d
Sex Males
Females
Age at exposure <20 years
20–40 years
>40 years
Time since exposure 12–15 years
15–30 years
>30 years
All
46
91
50
48
39
9
46
82
137
34.9 e
94.9 e
49.2 e
41.3 e
37.7 e
4.7 e
41.6 e
80.1 e
126.9 e
0.26
0.24
0.25
0.26
0.24
0.26
0.25
0.24
0.25
436 180
729 608
586 255
378 204
201 330
119 774
514 582
531 433
1 165 788
1.54 (0.66, 2.87)
<0 (<0, 0.46)
0.88 (0.28, 1.78)
0.64 (<0, 1.82)
<0 (<0, 0.51)
2.20 (<0, 11.11)
0.42 (<0, 1.44)
0.57 (0.10, 1.24)
0.55 (0.16, 1.07)
1.21 (0.58, 2.03)
0.01 (<0, 0.50)
0.68 (0.24, 1.28)
0.48 (<0, 1.43)
<0 (<0, 0.28)
<0 (<0, 226.13)
<0 (<0, 357.41)
0.96 (0.26, 1.83)
0.57 (0.23, 1.01)
LSS [P33]
All nervous system tumours
Glioma
Meningioma
Schwannoma
228
43
88
55
n.a.
n.a.
n.a.
n.a.
0.26
0.26
0.26
0.26
1 989 297 1.2 (0.6, 2.1)
b
0.56 (–0.2, 2.0)
b
0.64 (–0.01, 1.8)
b
4.5 (1.9, 9.2)
b
n.a.
n.a.
0.14 (0.00, 0.45)
b
0.67 (0.3, 1.1)
b
LSS [P33]
Meningioma
Sex Males
Females
Age at exposure <20 years
20–39 years
≥40 years
14
74
n.a.
n.a.
n.a.
n.a.
n.a.
n.a.
n.a.
n.a.
n.a.
n.a.
n.a.
n.a.
n.a.
745 157
1 244 140
975 373
645 557
358 367
1.6 (–0.04, 7.1)
b
0.4 (–0.2, 1.7)
b
1.3 (0.01, 4.5)
b
0.5 (–0.05, 2.8)
b
0.3 (<–0.1, 2.0)
b
n.a.
n.a.
n.a.
n.a.
n.a.
LSS [P33]
Schwannoma
Sex Males
Females
Age at exposure <20 years
20–39 years
≥40 years
23
32
n.a.
n.a.
n.a.
n.a.
n.a.
n.a.
n.a.
n.a.
n.a.
n.a.
745 157
1 244 140
975 373
645 557
358 367
8.0 (2.7, 21)
b
2.3 (0.3, 7.0)
b
6.0 (2.1, 14)
b
2.6 (<–0.2, 10)
b
3.3 (0.33, 11)
b
n.a.
n.a.
n.a.
n.a.
n.a.
Israel tinea capitis [R17]
Glioma
Meningioma
Schwannoma
60
7
19
22
n.a.
n.a.
n.a.
n.a.
1.5 283 930 4.9 c
1.6 c
5.7 c
21.4 c
n.a.
n.a.
n.a.
n.a.
UNSCEAR REPORT-PART 3.qxp 10/7/08 3:37 pm Page 205
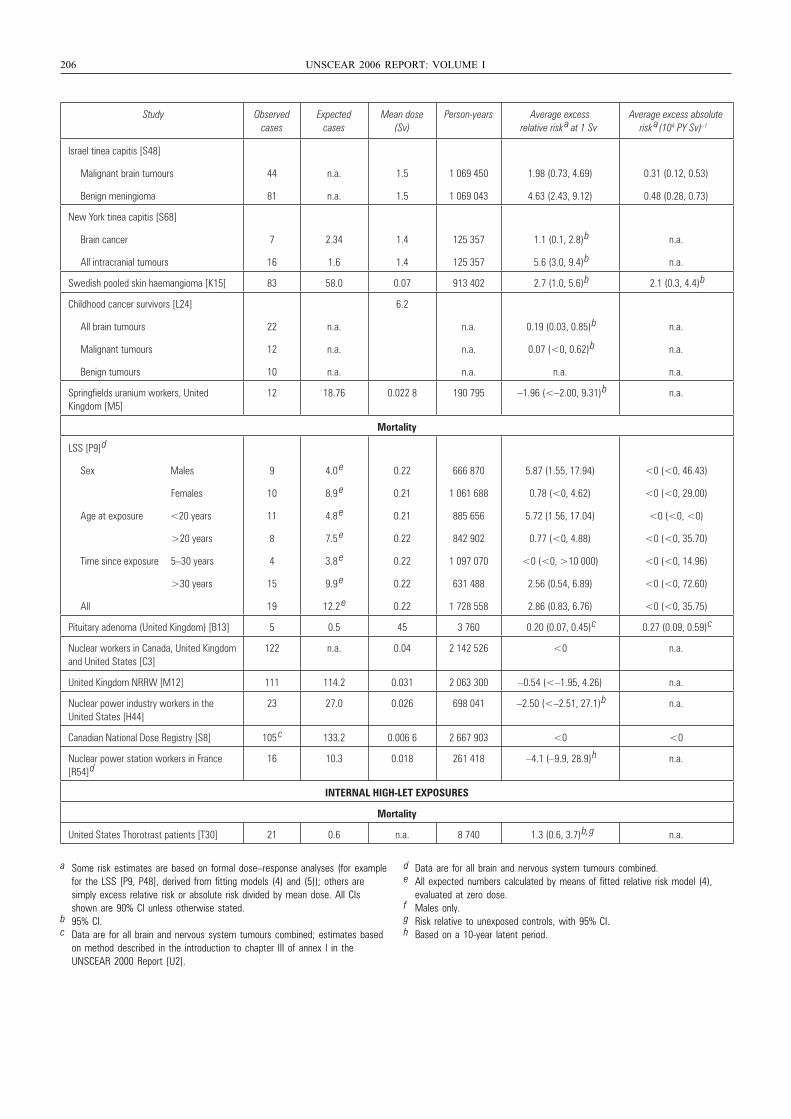
206 UNSCEAR 2006 REPORT: VOLUME I
Study Observed cases
Expected cases
Mean dose (Sv)
Person-years Average excess relative risk
a at 1 SvAverage excess absolute
risk a(104 PY Sv) –1
Israel tinea capitis [S48]
Malignant brain tumours
Benign meningioma
44
81
n.a.
n.a.
1.5
1.5
1 069 450
1 069 043
1.98 (0.73, 4.69)
4.63 (2.43, 9.12)
0.31 (0.12, 0.53)
0.48 (0.28, 0.73)
New York tinea capitis [S68]
Brain cancer
All intracranial tumours
7
16
2.34
1.6
1.4
1.4
125 357
125 357
1.1 (0.1, 2.8)
b
5.6 (3.0, 9.4)
b
n.a.
n.a.
Swedish pooled skin haemangioma [K15] 83 58.0 0.07 913 402 2.7 (1.0, 5.6)
b 2.1 (0.3, 4.4)
b
Childhood cancer survivors [L24]
All brain tumours
Malignant tumours
Benign tumours
22
12
10
n.a.
n.a.
n.a.
6.2
n.a.
n.a.
n.a.
0.19 (0.03, 0.85)
b
0.07 (<0, 0.62)
b
n.a.
n.a.
n.a.
n.a.
Springfields uranium workers, United Kingdom [M5]
12 18.76 0.022 8 190 795 –1.96 (<–2.00, 9.31)
b n.a.
Mortality
LSS [P9]
d
Sex Males
Females
Age at exposure <20 years
>20 years
Time since exposure 5–30 years
>30 years
All
9
10
11
8
4
15
19
4.0 e
8.9 e
4.8 e
7.5 e
3.8 e
9.9 e
12.2 e
0.22
0.21
0.21
0.22
0.22
0.22
0.22
666 870
1 061 688
885 656
842 902
1 097 070
631 488
1 728 558
5.87 (1.55, 17.94)
0.78 (<0, 4.62)
5.72 (1.56, 17.04)
0.77 (<0, 4.88)
<0 (<0, >10 000)
2.56 (0.54, 6.89)
2.86 (0.83, 6.76)
<0 (<0, 46.43)
<0 (<0, 29.00)
<0 (<0, <0)
<0 (<0, 35.70)
<0 (<0, 14.96)
<0 (<0, 72.60)
<0 (<0, 35.75)
Pituitary adenoma (United Kingdom) [B13] 5 0.5 45 3 760 0.20 (0.07, 0.45)
c 0.27 (0.09, 0.59)
c
Nuclear workers in Canada, United Kingdom and United States [C3]
122 n.a. 0.04 2 142 526 <0 n.a.
United Kingdom NRRW [M12] 111 114.2 0.031 2 063 300 –0.54 (<–1.95, 4.26) n.a.
Nuclear power industry workers in the United States [H44]
23 27.0 0.026 698 041 –2.50 (<–2.51, 27.1)
b n.a.
Canadian National Dose Registry [S8] 105 c 133.2 0.006 6 2 667 903 <0 <0
Nuclear power station workers in France [R54]
d16 10.3 0.018 261 418 –4.1 (–9.9, 28.9)
h n.a.
INTERNAL HIGH-LET EXPOSURES
Mortality
United States Thorotrast patients [T30] 21 0.6 n.a. 8 740 1.3 (0.6, 3.7)
b, g n.a.
a Some risk estimates are based on formal dose–response analyses (for examplefor the LSS [P9, P48], derived from fitting models (4) and (5)); others are simply excess relative risk or absolute risk divided by mean dose. All CIs shown are 90% CI unless otherwise stated.
b 95% CI.c Data are for all brain and nervous system tumours combined; estimates based
on method described in the introduction to chapter III of annex I in the UNSCEAR 2000 Report [U2].
d Data are for all brain and nervous system tumours combined.e All expected numbers calculated by means of fitted relative risk model (4),
evaluated at zero dose.f Males only.g Risk relative to unexposed controls, with 95% CI.h Based on a 10-year latent period.
UNSCEAR REPORT-PART 3.qxp 10/7/08 3:37 pm Page 206
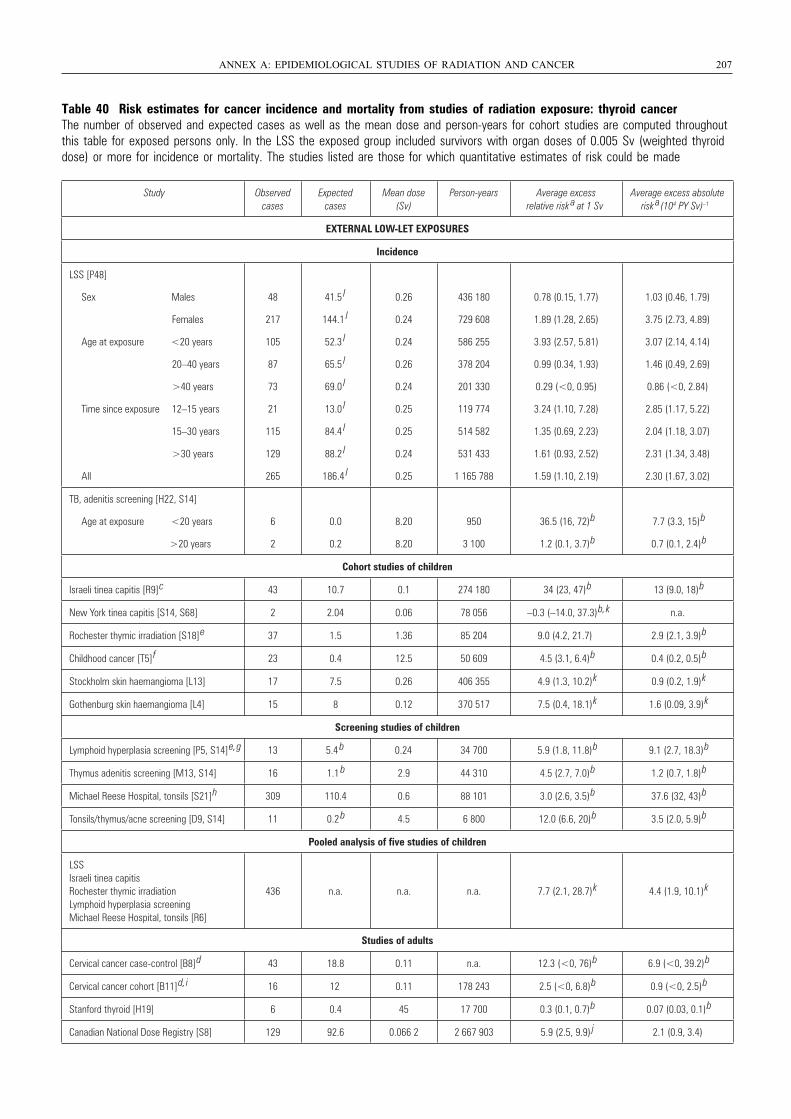
Table 40 Risk estimates for cancer incidence and mortality from studies of radiation exposure: thyroid cancerThe number of observed and expected cases as well as the mean dose and person-years for cohort studies are computed throughoutthis table for exposed persons only. In the LSS the exposed group included survivors with organ doses of 0.005 Sv (weighted thyroiddose) or more for incidence or mortality. The studies listed are those for which quantitative estimates of risk could be made
ANNEX A: EPIDEMIOLOGICAL STUDIES OF RADIATION AND CANCER 207
Study Observed cases
Expected cases
Mean dose (Sv)
Person-years Average excess relative risk a at 1 Sv
Average excess absolute risk a (104 PY Sv) –1
EXTERNAL LOW-LET EXPOSURES
Incidence
LSS [P48]
Sex Males
Females
Age at exposure <20 years
20–40 years
>40 years
Time since exposure 12–15 years
15–30 years
>30 years
All
48
217
105
87
73
21
115
129
265
41.5 l
144.1 l
52.3 l
65.5 l
69.0 l
13.0 l
84.4 l
88.2 l
186.4 l
0.26
0.24
0.24
0.26
0.24
0.25
0.25
0.24
0.25
436 180
729 608
586 255
378 204
201 330
119 774
514 582
531 433
1 165 788
0.78 (0.15, 1.77)
1.89 (1.28, 2.65)
3.93 (2.57, 5.81)
0.99 (0.34, 1.93)
0.29 (<0, 0.95)
3.24 (1.10, 7.28)
1.35 (0.69, 2.23)
1.61 (0.93, 2.52)
1.59 (1.10, 2.19)
1.03 (0.46, 1.79)
3.75 (2.73, 4.89)
3.07 (2.14, 4.14)
1.46 (0.49, 2.69)
0.86 (<0, 2.84)
2.85 (1.17, 5.22)
2.04 (1.18, 3.07)
2.31 (1.34, 3.48)
2.30 (1.67, 3.02)
TB, adenitis screening [H22, S14]
Age at exposure <20 years
>20 years
6
2
0.0
0.2
8.20
8.20
950
3 100
36.5 (16, 72) b
1.2 (0.1, 3.7) b
7.7 (3.3, 15) b
0.7 (0.1, 2.4) b
Cohort studies of children
Israeli tinea capitis [R9] c 43 10.7 0.1 274 180 34 (23, 47) b 13 (9.0, 18) b
New York tinea capitis [S14, S68] 2 2.04 0.06 78 056 –0.3 (–14.0, 37.3) b, k n.a.
Rochester thymic irradiation [S18] e 37 1.5 1.36 85 204 9.0 (4.2, 21.7) 2.9 (2.1, 3.9) b
Childhood cancer [T5] f 23 0.4 12.5 50 609 4.5 (3.1, 6.4) b 0.4 (0.2, 0.5) b
Stockholm skin haemangioma [L13] 17 7.5 0.26 406 355 4.9 (1.3, 10.2) k 0.9 (0.2, 1.9) k
Gothenburg skin haemangioma [L4] 15 8 0.12 370 517 7.5 (0.4, 18.1) k 1.6 (0.09, 3.9) k
Screening studies of children
Lymphoid hyperplasia screening [P5, S14] e, g 13 5.4 b 0.24 34 700 5.9 (1.8, 11.8) b 9.1 (2.7, 18.3) b
Thymus adenitis screening [M13, S14] 16 1.1 b 2.9 44 310 4.5 (2.7, 7.0) b 1.2 (0.7, 1.8) b
Michael Reese Hospital, tonsils [S21] h 309 110.4 0.6 88 101 3.0 (2.6, 3.5) b 37.6 (32, 43) b
Tonsils/thymus/acne screening [D9, S14] 11 0.2 b 4.5 6 800 12.0 (6.6, 20) b 3.5 (2.0, 5.9) b
Pooled analysis of five studies of children
LSSIsraeli tinea capitisRochester thymic irradiationLymphoid hyperplasia screeningMichael Reese Hospital, tonsils [R6]
436 n.a. n.a. n.a. 7.7 (2.1, 28.7) k 4.4 (1.9, 10.1) k
Studies of adults
Cervical cancer case-control [B8] d 43 18.8 0.11 n.a. 12.3 (<0, 76) b 6.9 (<0, 39.2) b
Cervical cancer cohort [B11] d, i 16 12 0.11 178 243 2.5 (<0, 6.8) b 0.9 (<0, 2.5) b
Stanford thyroid [H19] 6 0.4 45 17 700 0.3 (0.1, 0.7) b 0.07 (0.03, 0.1) b
Canadian National Dose Registry [S8] 129 92.6 0.066 2 2 667 903 5.9 (2.5, 9.9) j 2.1 (0.9, 3.4)
UNSCEAR REPORT-PART 3.qxp 10/7/08 3:37 pm Page 207
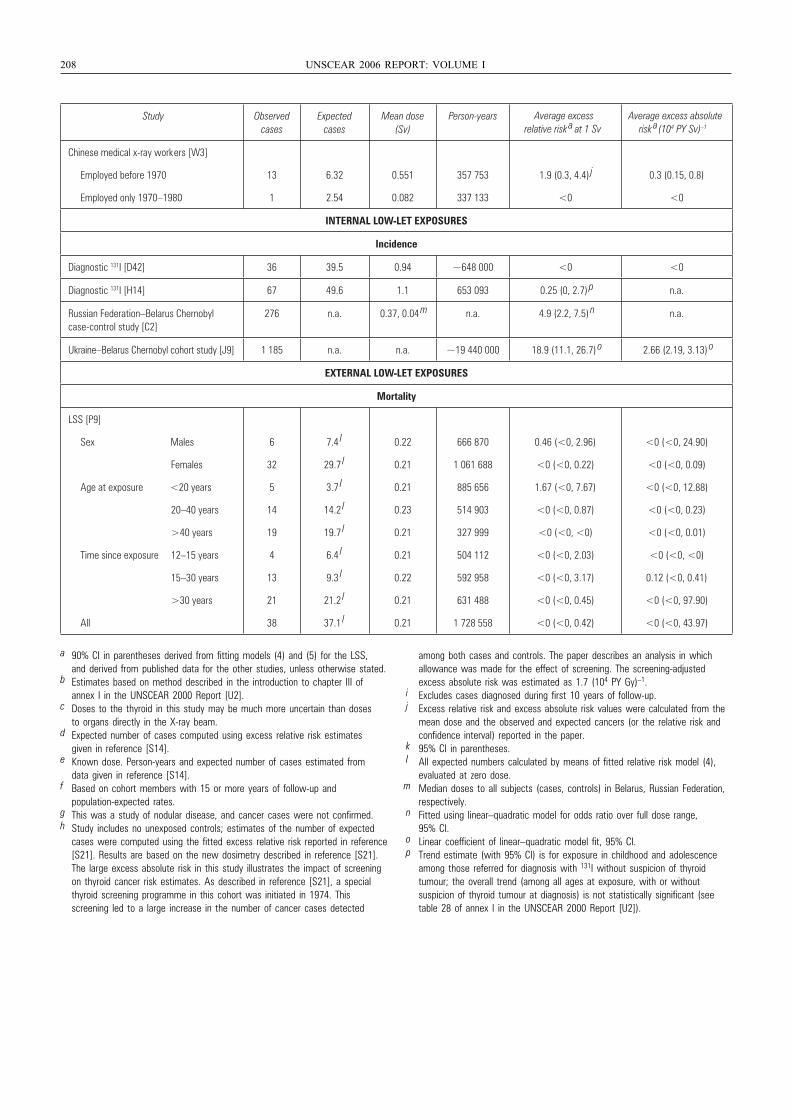
208 UNSCEAR 2006 REPORT: VOLUME I
Study Observed cases
Expected cases
Mean dose (Sv)
Person-years
Chinese medical x-ray workers [W3]
Employed before 1970
Employed only 1970–1980
13
1
6.32
2.54
0.551
0.082
357 753
337 133
1.9 (0.3, 4.4) j
<0
0.3 (0.15, 0.8)
<0
INTERNAL LOW-LET EXPOSURES
Incidence
Diagnostic 131I [D42] 36 39.5 0.94 ~648 000 <0 <0
Diagnostic 131I [H14] 67 49.6 1.1 653 093 0.25 (0, 2.7) p n.a.
Russian Federation–Belarus Chernobyl case-control study [C2]
276 n.a. 0.37, 0.04 m n.a. 4.9 (2.2, 7.5) n n.a.
Ukraine–Belarus Chernobyl cohort study [J9] 1 185 n.a. n.a. ~19 440 000 18.9 (11.1, 26.7) o 2.66 (2.19, 3.13) o
EXTERNAL LOW-LET EXPOSURES
Mortality
LSS [P9]
Sex Males
Females
Age at exposure <20 years
20–40 years
>40 years
Time since exposure 12–15 years
15–30 years
>30 years
All
6
32
5
14
19
4
13
21
38
7.4 l
29.7 l
3.7 l
14.2 l
19.7 l
6.4 l
9.3 l
21.2 l
37.1 l
0.22
0.21
0.21
0.23
0.21
0.21
0.22
0.21
0.21
666 870
1 061 688
885 656
514 903
327 999
504 112
592 958
631 488
1 728 558
0.46 (<0, 2.96)
<0 (<0, 0.22)
1.67 (<0, 7.67)
<0 (<0, 0.87)
<0 (<0, <0)
<0 (<0, 2.03)
<0 (<0, 3.17)
<0 (<0, 0.45)
<0 (<0, 0.42)
<0 (<0, 24.90)
<0 (<0, 0.09)
<0 (<0, 12.88)
<0 (<0, 0.23)
<0 (<0, 0.01)
<0 (<0, <0)
0.12 (<0, 0.41)
<0 (<0, 97.90)
<0 (<0, 43.97)
Average excess relative risk a at 1 Sv
Average excess absolute risk a(104 PY Sv) –1
a 90% CI in parentheses derived from fitting models (4) and (5) for the LSS, and derived from published data for the other studies, unless otherwise stated.
b Estimates based on method described in the introduction to chapter III of annex I in the UNSCEAR 2000 Report [U2].
c Doses to the thyroid in this study may be much more uncertain than doses to organs directly in the X-ray beam.
d Expected number of cases computed using excess relative risk estimates given in reference [S14].
e Known dose. Person-years and expected number of cases estimated from data given in reference [S14].
f Based on cohort members with 15 or more years of follow-up and population-expected rates.
g This was a study of nodular disease, and cancer cases were not confirmed.h Study includes no unexposed controls; estimates of the number of expected
cases were computed using the fitted excess relative risk reported in reference [S21]. Results are based on the new dosimetry described in reference [S21]. The large excess absolute risk in this study illustrates the impact of screening on thyroid cancer risk estimates. As described in reference [S21], a special thyroid screening programme in this cohort was initiated in 1974. This screening led to a large increase in the number of cancer cases detected
among both cases and controls. The paper describes an analysis in which allowance was made for the effect of screening. The screening-adjusted excess absolute risk was estimated as 1.7 (104 PY Gy)–1.
i Excludes cases diagnosed during first 10 years of follow-up.j Excess relative risk and excess absolute risk values were calculated from the
mean dose and the observed and expected cancers (or the relative risk and confidence interval) reported in the paper.
k 95% CI in parentheses.l All expected numbers calculated by means of fitted relative risk model (4),
evaluated at zero dose.m Median doses to all subjects (cases, controls) in Belarus, Russian Federation,
respectively.n Fitted using linear–quadratic model for odds ratio over full dose range,
95% CI.o Linear coefficient of linear–quadratic model fit, 95% CI.p Trend estimate (with 95% CI) is for exposure in childhood and adolescence
among those referred for diagnosis with 131I without suspicion of thyroid tumour; the overall trend (among all ages at exposure, with or without suspicion of thyroid tumour at diagnosis) is not statistically significant (see table 28 of annex I in the UNSCEAR 2000 Report [U2]).
UNSCEAR REPORT-PART 3.qxp 10/7/08 3:37 pm Page 208
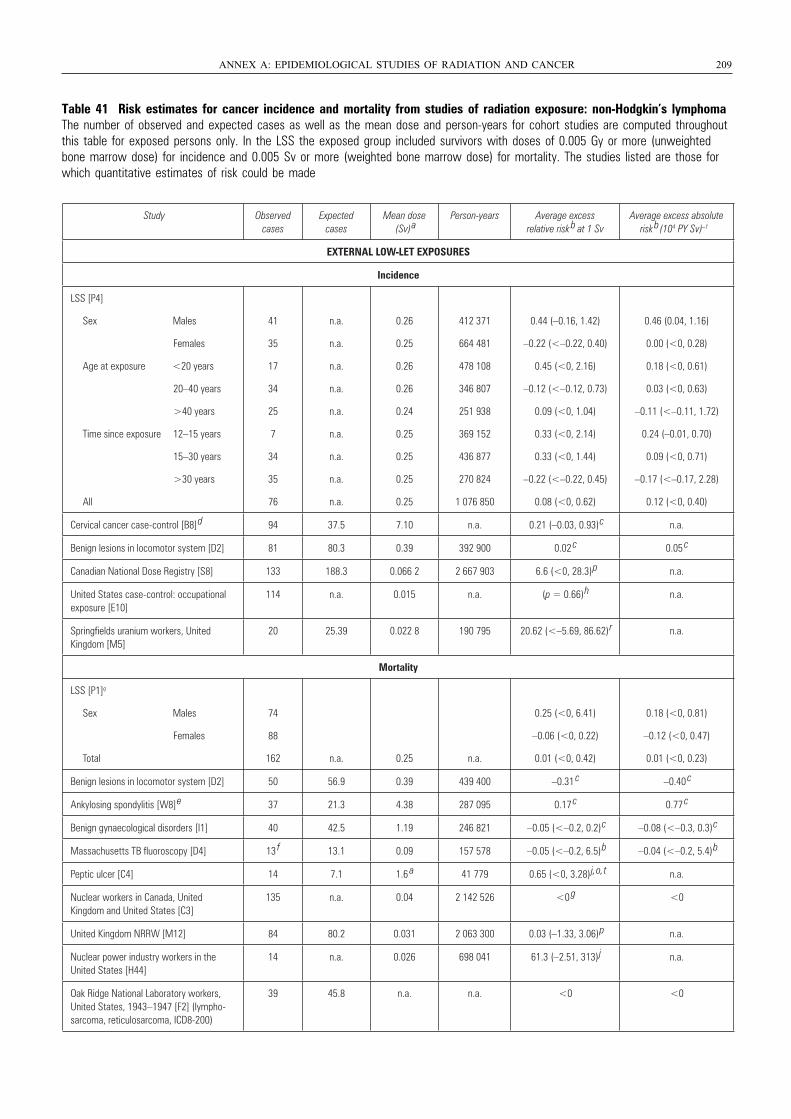
Table 41 Risk estimates for cancer incidence and mortality from studies of radiation exposure: non-Hodgkin’s lymphomaThe number of observed and expected cases as well as the mean dose and person-years for cohort studies are computed throughoutthis table for exposed persons only. In the LSS the exposed group included survivors with doses of 0.005 Gy or more (unweightedbone marrow dose) for incidence and 0.005 Sv or more (weighted bone marrow dose) for mortality. The studies listed are those forwhich quantitative estimates of risk could be made
ANNEX A: EPIDEMIOLOGICAL STUDIES OF RADIATION AND CANCER 209
Study Observed cases
Expected cases
Mean dose (Sv)
aPerson-years Average excess
relative risk b at 1 Sv
Average excess absolute risk
b(104 PY Sv) –1
EXTERNAL LOW-LET EXPOSURES
Incidence
LSS [P4]
Sex Males
Females
Age at exposure <20 years
20–40 years
>40 years
Time since exposure 12–15 years
15–30 years
>30 years
All
41
35
17
34
25
7
34
35
76
n.a.
n.a.
n.a.
n.a.
n.a.
n.a.
n.a.
n.a.
n.a.
0.26
0.25
0.26
0.26
0.24
0.25
0.25
0.25
0.25
412 371
664 481
478 108
346 807
251 938
369 152
436 877
270 824
1 076 850
0.44 (–0.16, 1.42)
–0.22 (<–0.22, 0.40)
0.45 (<0, 2.16)
–0.12 (<–0.12, 0.73)
0.09 (<0, 1.04)
0.33 (<0, 2.14)
0.33 (<0, 1.44)
–0.22 (<–0.22, 0.45)
0.08 (<0, 0.62)
0.46 (0.04, 1.16)
0.00 (<0, 0.28)
0.18 (<0, 0.61)
0.03 (<0, 0.63)
–0.11 (<–0.11, 1.72)
0.24 (–0.01, 0.70)
0.09 (<0, 0.71)
–0.17 (<–0.17, 2.28)
0.12 (<0, 0.40)
Cervical cancer case-control [B8]
d 94 37.5 7.10 n.a. 0.21 (–0.03, 0.93)
c n.a.
Benign lesions in locomotor system [D2] 81 80.3 0.39 392 900 0.02 c 0.05
c
Canadian National Dose Registry [S8] 133 188.3 0.066 2 2 667 903 6.6 (<0, 28.3)
p n.a.
United States case-control: occupational exposure [E10]
114 n.a. 0.015 n.a. (p = 0.66)
h n.a.
Springfields uranium workers, United Kingdom [M5]
20 25.39 0.022 8 190 795 20.62 (<–5.69, 86.62)
r n.a.
Mortality
LSS [P1]q
Sex Males
Females
Total
74
88
162 n.a. 0.25 n.a.
0.25 (<0, 6.41)
–0.06 (<0, 0.22)
0.01 (<0, 0.42)
0.18 (<0, 0.81)
–0.12 (<0, 0.47)
0.01 (<0, 0.23)
Benign lesions in locomotor system [D2] 50 56.9 0.39 439 400 –0.31 c –0.40
c
Ankylosing spondylitis [W8]
e 37 21.3 4.38 287 095 0.17 c 0.77
c
Benign gynaecological disorders [I1] 40 42.5 1.19 246 821 –0.05 (<–0.2, 0.2)
c –0.08 (<–0.3, 0.3)
c
Massachusetts TB fluoroscopy [D4] 13 f 13.1 0.09 157 578 –0.05 (<–0.2, 6.5)
b –0.04 (<–0.2, 5.4)
b
Peptic ulcer [C4] 14 7.1 1.6 a 41 779 0.65 (<0, 3.28)
j, o, t n.a.
Nuclear workers in Canada, United Kingdom and United States [C3]
135 n.a. 0.04 2 142 526 <0 g <0
United Kingdom NRRW [M12] 84 80.2 0.031 2 063 300 0.03 (–1.33, 3.06)
p n.a.
Nuclear power industry workers in the United States [H44]
14 n.a. 0.026 698 041 61.3 (–2.51, 313)
j n.a.
Oak Ridge National Laboratory workers, United States, 1943–1947 [F2] (lympho-sarcoma, reticulosarcoma, ICD8-200)
39 45.8 n.a. n.a. <0 <0
UNSCEAR REPORT-PART 3.qxp 10/7/08 3:37 pm Page 209
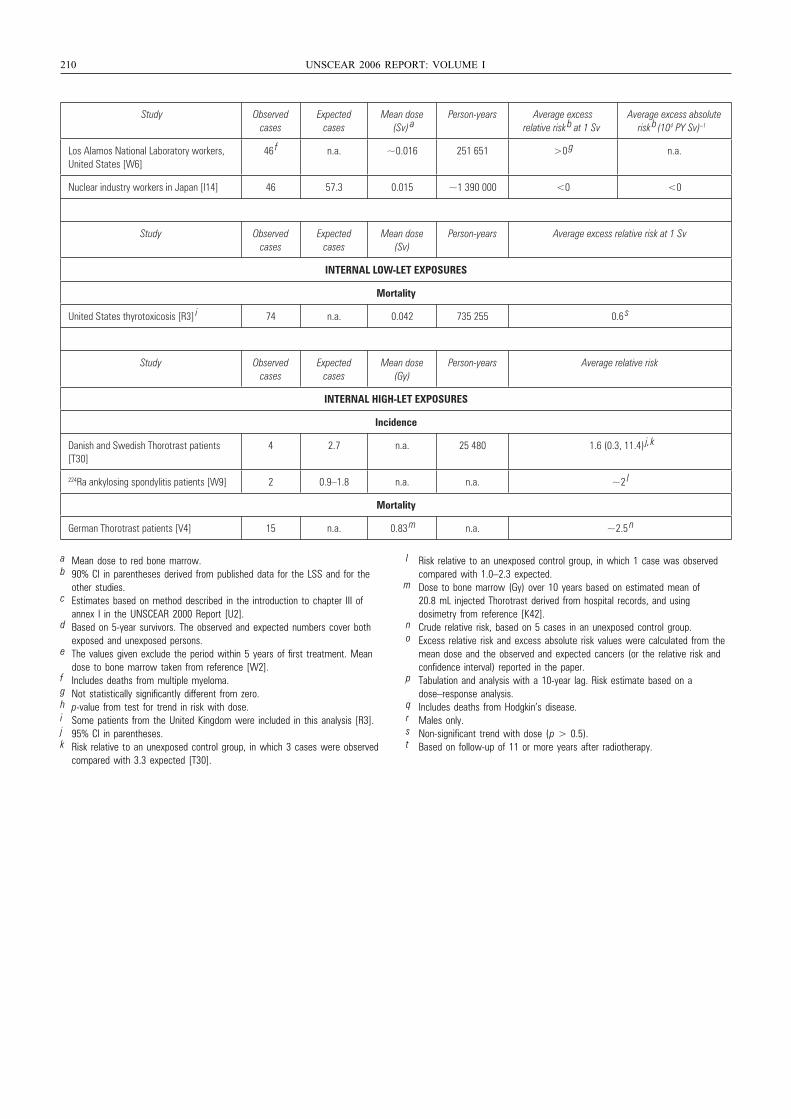
210 UNSCEAR 2006 REPORT: VOLUME I
Study Observed cases
Expected cases
Mean dose (Sv)
aPerson-years Average excess
relative risk b at 1 Sv
Average excess absolute risk
b(104 PY Sv) –1
Los Alamos National Laboratory workers, United States [W6]
46 f n.a. ~0.016 251 651 >0
g n.a.
Nuclear industry workers in Japan [I14] 46 57.3 0.015 ~1 390 000 <0 <0
Study Observed cases
Expected cases
Mean dose (Sv)
Person-years Average excess relative risk at 1 Sv
INTERNAL LOW-LET EXPOSURES
Mortality
United States thyrotoxicosis [R3] i 74 n.a. 0.042 735 255 0.6
s
Study Observed cases
Expected cases
Mean dose (Gy)
Person-years Average relative risk
INTERNAL HIGH-LET EXPOSURES
Incidence
Danish and Swedish Thorotrast patients [T30]
4 2.7 n.a. 25 480 1.6 (0.3, 11.4) j, k
224Ra ankylosing spondylitis patients [W9] 2 0.9–1.8 n.a. n.a. ~2 l
Mortality
German Thorotrast patients [V4] 15 n.a. 0.83 m n.a. ~2.5
n
a Mean dose to red bone marrow.b 90% CI in parentheses derived from published data for the LSS and for the
other studies.c Estimates based on method described in the introduction to chapter III of
annex I in the UNSCEAR 2000 Report [U2].d Based on 5-year survivors. The observed and expected numbers cover both
exposed and unexposed persons.e The values given exclude the period within 5 years of first treatment. Mean
dose to bone marrow taken from reference [W2].f Includes deaths from multiple myeloma.g Not statistically significantly different from zero.h p-value from test for trend in risk with dose.i Some patients from the United Kingdom were included in this analysis [R3].j 95% CI in parentheses.k Risk relative to an unexposed control group, in which 3 cases were observed
compared with 3.3 expected [T30].
l Risk relative to an unexposed control group, in which 1 case was observed compared with 1.0–2.3 expected.
m Dose to bone marrow (Gy) over 10 years based on estimated mean of 20.8 mL injected Thorotrast derived from hospital records, and using dosimetry from reference [K42].
n Crude relative risk, based on 5 cases in an unexposed control group.o Excess relative risk and excess absolute risk values were calculated from the
mean dose and the observed and expected cancers (or the relative risk and confidence interval) reported in the paper.
p Tabulation and analysis with a 10-year lag. Risk estimate based on a dose–response analysis.
q Includes deaths from Hodgkin’s disease.r Males only.s Non-significant trend with dose (p > 0.5).t Based on follow-up of 11 or more years after radiotherapy.
UNSCEAR REPORT-PART 3.qxp 10/7/08 3:37 pm Page 210
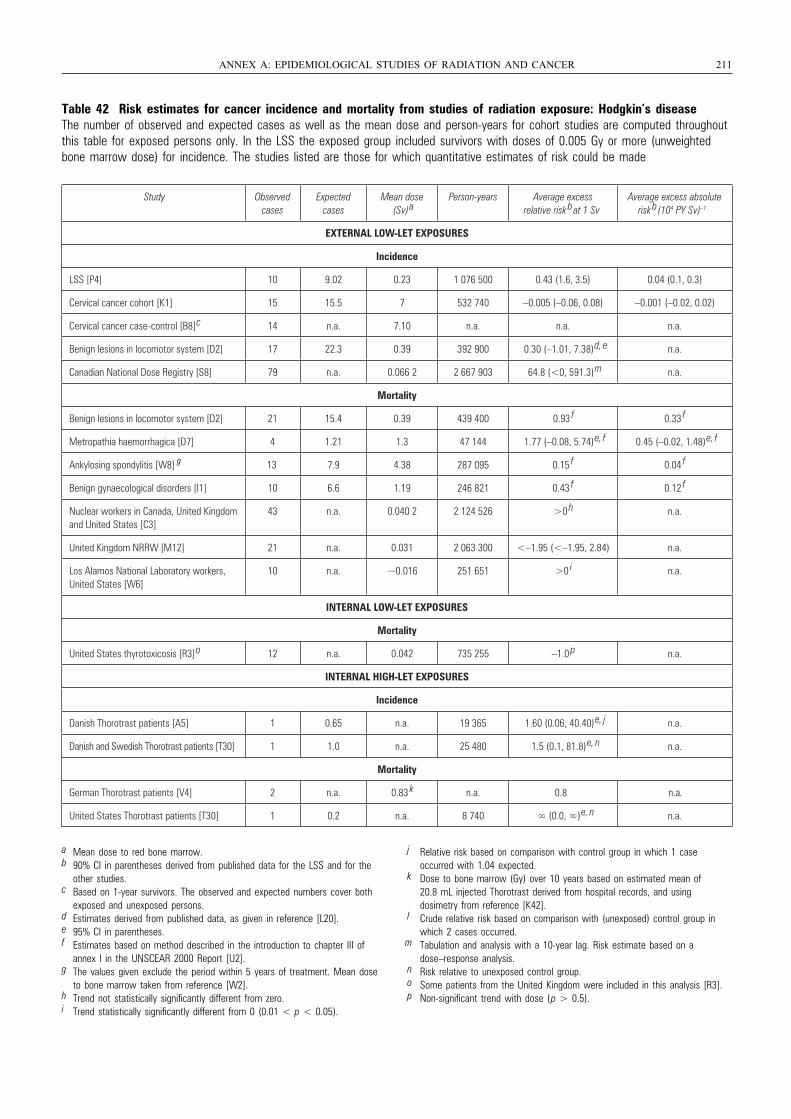
Table 42 Risk estimates for cancer incidence and mortality from studies of radiation exposure: Hodgkin’s diseaseThe number of observed and expected cases as well as the mean dose and person-years for cohort studies are computed throughoutthis table for exposed persons only. In the LSS the exposed group included survivors with doses of 0.005 Gy or more (unweightedbone marrow dose) for incidence. The studies listed are those for which quantitative estimates of risk could be made
ANNEX A: EPIDEMIOLOGICAL STUDIES OF RADIATION AND CANCER 211
a Mean dose to red bone marrow.b 90% CI in parentheses derived from published data for the LSS and for the
other studies.c Based on 1-year survivors. The observed and expected numbers cover both
exposed and unexposed persons.d Estimates derived from published data, as given in reference [L20].e 95% CI in parentheses.f Estimates based on method described in the introduction to chapter III of
annex I in the UNSCEAR 2000 Report [U2].g The values given exclude the period within 5 years of treatment. Mean dose
to bone marrow taken from reference [W2].h Trend not statistically significantly different from zero.i Trend statistically significantly different from 0 (0.01 < p < 0.05).
j Relative risk based on comparison with control group in which 1 case occurred with 1.04 expected.
k Dose to bone marrow (Gy) over 10 years based on estimated mean of 20.8 mL injected Thorotrast derived from hospital records, and using dosimetry from reference [K42].
l Crude relative risk based on comparison with (unexposed) control group in which 2 cases occurred.
m Tabulation and analysis with a 10-year lag. Risk estimate based on a dose–response analysis.
n Risk relative to unexposed control group.o Some patients from the United Kingdom were included in this analysis [R3].p Non-significant trend with dose (p > 0.5).
Study Observed cases
Expected cases
Mean dose (Sv)
aPerson-years Average excess
relative risk bat 1 Sv
Average excess absolute risk
b(104 PY Sv) –1
EXTERNAL LOW-LET EXPOSURES
Incidence
LSS [P4] 10 9.02 0.23 1 076 500 0.43 (1.6, 3.5) 0.04 (0.1, 0.3)
Cervical cancer cohort [K1] 15 15.5 7 532 740 –0.005 (–0.06, 0.08) –0.001 (–0.02, 0.02)
Cervical cancer case-control [B8]
c 14 n.a. 7.10 n.a. n.a. n.a.
Benign lesions in locomotor system [D2] 17 22.3 0.39 392 900 0.30 (–1.01, 7.38)
d, e n.a.
Canadian National Dose Registry [S8] 79 n.a. 0.066 2 2 667 903 64.8 (<0, 591.3)
m n.a.
Mortality
Benign lesions in locomotor system [D2] 21 15.4 0.39 439 400 0.93 f 0.33
f
Metropathia haemorrhagica [D7] 4 1.21 1.3 47 144 1.77 (–0.08, 5.74)
e, f 0.45 (–0.02, 1.48)
e, f
Ankylosing spondylitis [W8] 13 7.9 4.38 287 095 0.15 f 0.04
f
Benign gynaecological disorders [I1] 10 6.6 1.19 246 821 0.43 f 0.12
f
Nuclear workers in Canada, United Kingdom and United States [C3]
43 n.a. 0.040 2 2 124 526 >0 h n.a.
United Kingdom NRRW [M12] 21 n.a. 0.031 2 063 300 <–1.95 (<–1.95, 2.84) n.a.
Los Alamos National Laboratory workers, United States [W6]
10 n.a. ~0.016 251 651 >0 i n.a.
INTERNAL LOW-LET EXPOSURES
Mortality
United States thyrotoxicosis [R3]
o 12 n.a. 0.042 735 255 –1.0 p n.a.
INTERNAL HIGH-LET EXPOSURES
Incidence
Danish Thorotrast patients [A5] 1 0.65 n.a. 19 365 1.60 (0.06, 40.40)
e, j n.a.
Danish and Swedish Thorotrast patients [T30] 1 1.0 n.a. 25 480 1.5 (0.1, 81.8)
e, n n.a.
Mortality
German Thorotrast patients [V4] 2 n.a. 0.83 k n.a. 0.8 n.a.
United States Thorotrast patients [T30] 1 0.2 n.a. 8 740 ∞ (0.0, ∞)
e, n n.a.
UNSCEAR REPORT-PART 3.qxp 10/7/08 3:37 pm Page 211
g
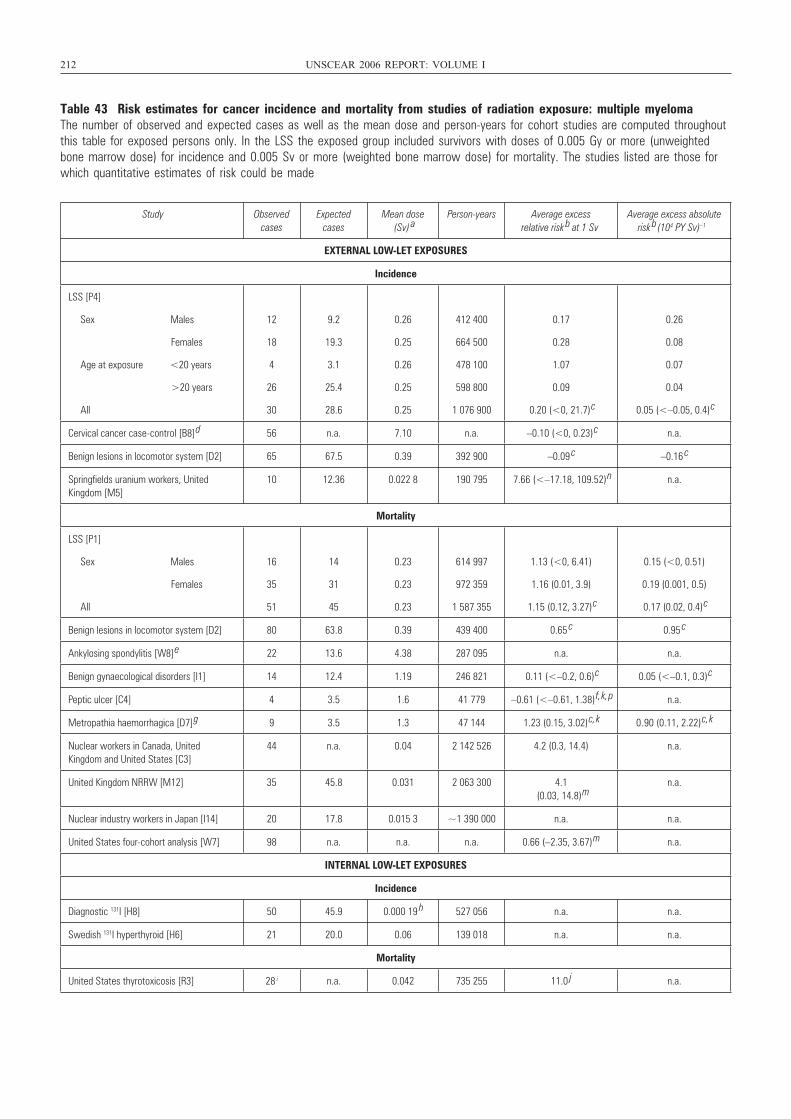
212 UNSCEAR 2006 REPORT: VOLUME I
Table 43 Risk estimates for cancer incidence and mortality from studies of radiation exposure: multiple myelomaThe number of observed and expected cases as well as the mean dose and person-years for cohort studies are computed throughoutthis table for exposed persons only. In the LSS the exposed group included survivors with doses of 0.005 Gy or more (unweightedbone marrow dose) for incidence and 0.005 Sv or more (weighted bone marrow dose) for mortality. The studies listed are those forwhich quantitative estimates of risk could be made
Study Observed cases
Expected cases
Mean dose (Sv) a
Person-years Average excess relative risk b at 1 Sv
Average excess absolute risk b (104 PY Sv) –1
EXTERNAL LOW-LET EXPOSURES
Incidence
LSS [P4]
Sex Males
Females
Age at exposure <20 years
>20 years
All
12
18
4
26
30
9.2
19.3
3.1
25.4
28.6
0.26
0.25
0.26
0.25
0.25
412 400
664 500
478 100
598 800
1 076 900
0.17
0.28
1.07
0.09
0.20 (<0, 21.7)
c
0.26
0.08
0.07
0.04
0.05 (<–0.05, 0.4)
c
Cervical cancer case-control [B8] d 56 n.a. 7.10 n.a. –0.10 (<0, 0.23)
c n.a.
Benign lesions in locomotor system [D2] 65 67.5 0.39 392 900 –0.09 c –0.16
c
Springfields uranium workers, United Kingdom [M5]
10 12.36 0.022 8 190 795 7.66 (<–17.18, 109.52)
n n.a.
Mortality
LSS [P1]
Sex Males
Females
All
16
35
51
14
31
45
0.23
0.23
0.23
614 997
972 359
1 587 355
1.13 (<0, 6.41)
1.16 (0.01, 3.9)
1.15 (0.12, 3.27)
c
0.15 (<0, 0.51)
0.19 (0.001, 0.5)
0.17 (0.02, 0.4)
c
Benign lesions in locomotor system [D2] 80 63.8 0.39 439 400 0.65 c 0.95
c
Ankylosing spondylitis [W8] e 22 13.6 4.38 287 095 n.a. n.a.
Benign gynaecological disorders [I1] 14 12.4 1.19 246 821 0.11 (<–0.2, 0.6)
c 0.05 (<–0.1, 0.3)
c
Peptic ulcer [C4] 4 3.5 1.6 41 779 –0.61 (<–0.61, 1.38)
f, k, p n.a.
Metropathia haemorrhagica [D7] g 9 3.5 1.3 47 144 1.23 (0.15, 3.02)
c, k 0.90 (0.11, 2.22)
c, k
Nuclear workers in Canada, United Kingdom and United States [C3]
44 n.a. 0.04 2 142 526 4.2 (0.3, 14.4) n.a.
United Kingdom NRRW [M12] 35 45.8 0.031 2 063 300 4.1 (0.03, 14.8)
mn.a.
Nuclear industry workers in Japan [I14] 20 17.8 0.015 3 ~1 390 000 n.a. n.a.
United States four-cohort analysis [W7] 98 n.a. n.a. n.a. 0.66 (–2.35, 3.67)
m n.a.
INTERNAL LOW-LET EXPOSURES
Incidence
Diagnostic 131I [H8] 50 45.9 0.000 19 h 527 056 n.a. n.a.
Swedish 131I hyperthyroid [H6] 21 20.0 0.06 139 018 n.a. n.a.
Mortality
United States thyrotoxicosis [R3] 28 i n.a. 0.042 735 255 11.0 j n.a.
UNSCEAR REPORT-PART 4.qxp 10/7/08 3:39 pm Page 212
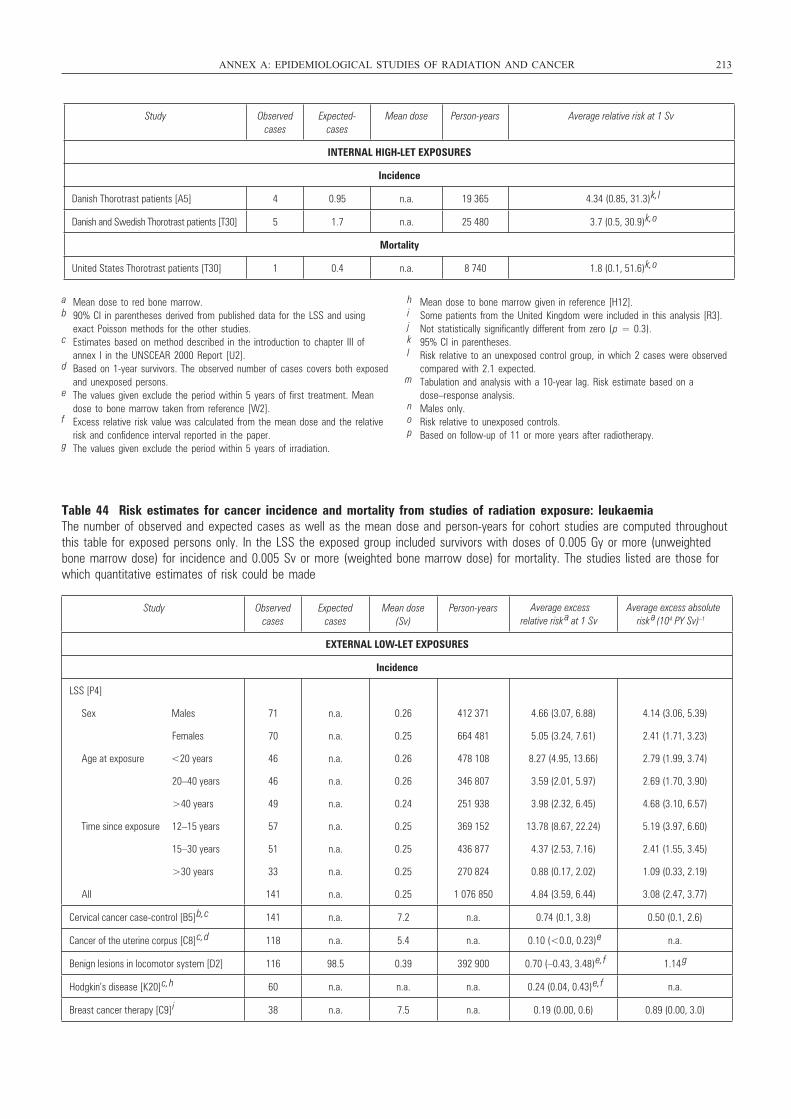
Table 44 Risk estimates for cancer incidence and mortality from studies of radiation exposure: leukaemiaThe number of observed and expected cases as well as the mean dose and person-years for cohort studies are computed throughoutthis table for exposed persons only. In the LSS the exposed group included survivors with doses of 0.005 Gy or more (unweightedbone marrow dose) for incidence and 0.005 Sv or more (weighted bone marrow dose) for mortality. The studies listed are those forwhich quantitative estimates of risk could be made
ANNEX A: EPIDEMIOLOGICAL STUDIES OF RADIATION AND CANCER 213
Study Observed cases
Expected-cases
Mean dose Person-years Average relative risk at 1 Sv
INTERNAL HIGH-LET EXPOSURES
Incidence
Danish Thorotrast patients [A5] 4 0.95 n.a. 19 365 4.34 (0.85, 31.3)
k, l
Danish and Swedish Thorotrast patients [T30] 5 1.7 n.a. 25 480 3.7 (0.5, 30.9)
k, o
Mortality
United States Thorotrast patients [T30] 1 0.4 n.a. 8 740 1.8 (0.1, 51.6)
k, o
a Mean dose to red bone marrow.b 90% CI in parentheses derived from published data for the LSS and using
exact Poisson methods for the other studies.c Estimates based on method described in the introduction to chapter III of
annex I in the UNSCEAR 2000 Report [U2].d Based on 1-year survivors. The observed number of cases covers both exposed
and unexposed persons.e The values given exclude the period within 5 years of first treatment. Mean
dose to bone marrow taken from reference [W2].f Excess relative risk value was calculated from the mean dose and the relative
risk and confidence interval reported in the paper.g The values given exclude the period within 5 years of irradiation.
h Mean dose to bone marrow given in reference [H12]. i Some patients from the United Kingdom were included in this analysis [R3].j Not statistically significantly different from zero (p = 0.3).k 95% CI in parentheses.l Risk relative to an unexposed control group, in which 2 cases were observed
compared with 2.1 expected.m Tabulation and analysis with a 10-year lag. Risk estimate based on a
dose–response analysis.n Males only.o Risk relative to unexposed controls.p Based on follow-up of 11 or more years after radiotherapy.
Study Observed cases
Expected cases
Mean dose (Sv)
Person-years
EXTERNAL LOW-LET EXPOSURES
Incidence
LSS [P4]
Sex Males
Females
Age at exposure <20 years
20–40 years
>40 years
Time since exposure 12–15 years
15–30 years
>30 years
All
71
70
46
46
49
57
51
33
141
n.a.
n.a.
n.a.
n.a.
n.a.
n.a.
n.a.
n.a.
n.a.
0.26
0.25
0.26
0.26
0.24
0.25
0.25
0.25
0.25
412 371
664 481
478 108
346 807
251 938
369 152
436 877
270 824
1 076 850
4.66 (3.07, 6.88)
5.05 (3.24, 7.61)
8.27 (4.95, 13.66)
3.59 (2.01, 5.97)
3.98 (2.32, 6.45)
13.78 (8.67, 22.24)
4.37 (2.53, 7.16)
0.88 (0.17, 2.02)
4.84 (3.59, 6.44)
4.14 (3.06, 5.39)
2.41 (1.71, 3.23)
2.79 (1.99, 3.74)
2.69 (1.70, 3.90)
4.68 (3.10, 6.57)
5.19 (3.97, 6.60)
2.41 (1.55, 3.45)
1.09 (0.33, 2.19)
3.08 (2.47, 3.77)
Cervical cancer case-control [B5] b, c 141 n.a. 7.2 n.a. 0.74 (0.1, 3.8) 0.50 (0.1, 2.6)
Cancer of the uterine corpus [C8] c, d 118 n.a. 5.4 n.a. 0.10 (<0.0, 0.23) e n.a.
Benign lesions in locomotor system [D2] 116 98.5 0.39 392 900 0.70 (–0.43, 3.48) e, f 1.14 g
Hodgkin’s disease [K20] c, h 60 n.a. n.a. n.a. 0.24 (0.04, 0.43) e, f n.a.
Breast cancer therapy [C9] i 38 n.a. 7.5 n.a. 0.19 (0.00, 0.6) 0.89 (0.00, 3.0)
Average excess relative risk a at 1 Sv
Average excess absolute risk a (104 PY Sv) –1
UNSCEAR REPORT-PART 4.qxp 10/7/08 3:39 pm Page 213
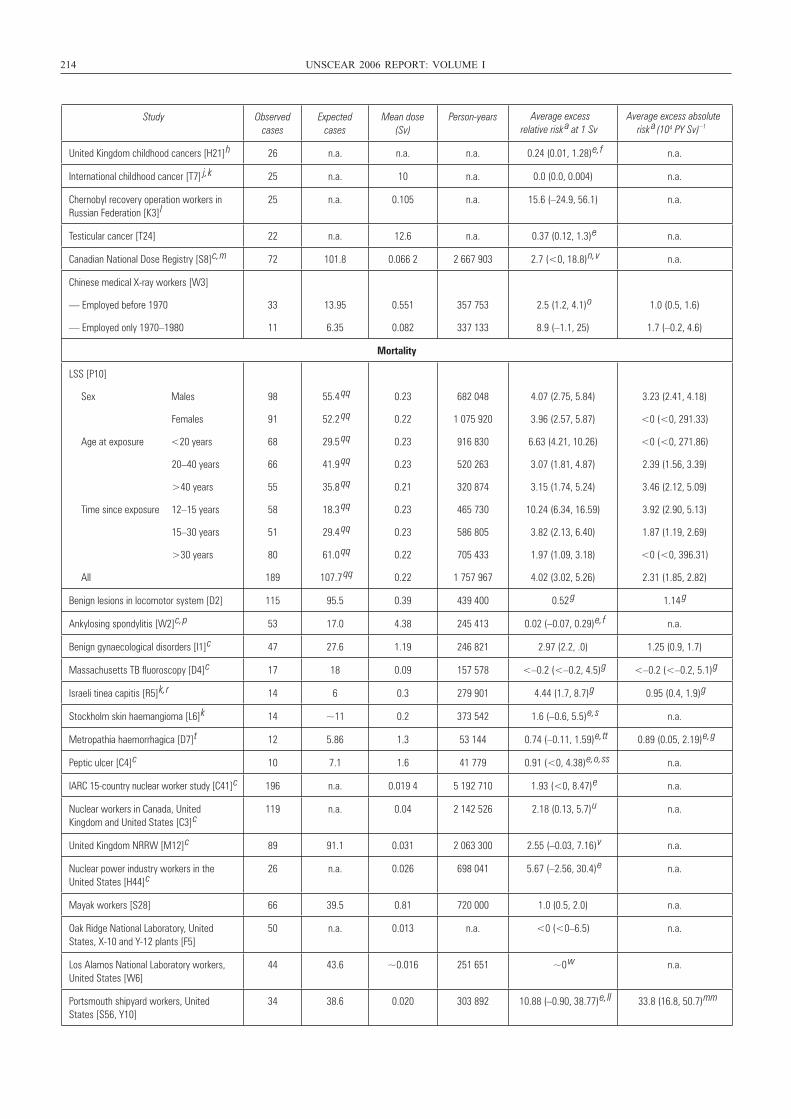
214 UNSCEAR 2006 REPORT: VOLUME I
Study Observed cases
Expected cases
Mean dose (Sv)
Person-years
United Kingdom childhood cancers [H21] h 26 n.a. n.a. n.a. 0.24 (0.01, 1.28) e, f n.a.
International childhood cancer [T7]
j, k 25 n.a. 10 n.a. 0.0 (0.0, 0.004) n.a.
Chernobyl recovery operation workers in Russian Federation [K3] l
25 n.a. 0.105 n.a. 15.6 (–24.9, 56.1) n.a.
Testicular cancer [T24] 22 n.a. 12.6 n.a. 0.37 (0.12, 1.3) e n.a.
Canadian National Dose Registry [S8] c, m 72 101.8 0.066 2 2 667 903 2.7 (<0, 18.8) n, v n.a.
Chinese medical X-ray workers [W3]
— Employed before 1970
— Employed only 1970–1980
33
11
13.95
6.35
0.551
0.082
357 753
337 133
2.5 (1.2, 4.1) o
8.9 (–1.1, 25)
1.0 (0.5, 1.6)
1.7 (–0.2, 4.6)
Mortality
LSS [P10]
Sex Males
Females
Age at exposure <20 years
20–40 years
>40 years
Time since exposure 12–15 years
15–30 years
>30 years
All
98
91
68
66
55
58
51
80
189
55.4 qq
52.2 qq
29.5 qq
41.9 qq
35.8 qq
18.3 qq
29.4 qq
61.0 qq
107.7 qq
0.23
0.22
0.23
0.23
0.21
0.23
0.23
0.22
0.22
682 048
1 075 920
916 830
520 263
320 874
465 730
586 805
705 433
1 757 967
4.07 (2.75, 5.84)
3.96 (2.57, 5.87)
6.63 (4.21, 10.26)
3.07 (1.81, 4.87)
3.15 (1.74, 5.24)
10.24 (6.34, 16.59)
3.82 (2.13, 6.40)
1.97 (1.09, 3.18)
4.02 (3.02, 5.26)
3.23 (2.41, 4.18)
<0 (<0, 291.33)
<0 (<0, 271.86)
2.39 (1.56, 3.39)
3.46 (2.12, 5.09)
3.92 (2.90, 5.13)
1.87 (1.19, 2.69)
<0 (<0, 396.31)
2.31 (1.85, 2.82)
Benign lesions in locomotor system [D2] 115 95.5 0.39 439 400 0.52 g 1.14 g
Ankylosing spondylitis [W2] c, p 53 17.0 4.38 245 413 0.02 (–0.07, 0.29) e, f n.a.
Benign gynaecological disorders [I1] c 47 27.6 1.19 246 821 2.97 (2.2, .0) 1.25 (0.9, 1.7)
Massachusetts TB fluoroscopy [D4] c 17 18 0.09 157 578 <–0.2 (<–0.2, 4.5) g <–0.2 (<–0.2, 5.1) g
Israeli tinea capitis [R5] k, r 14 6 0.3 279 901 4.44 (1.7, 8.7) g 0.95 (0.4, 1.9) g
Stockholm skin haemangioma [L6] k 14 ~11 0.2 373 542 1.6 (–0.6, 5.5) e, s n.a.
Metropathia haemorrhagica [D7] t 12 5.86 1.3 53 144 0.74 (–0.11, 1.59) e, tt 0.89 (0.05, 2.19) e, g
Peptic ulcer [C4] c 10 7.1 1.6 41 779 0.91 (<0, 4.38) e, o, ss n.a.
IARC 15-country nuclear worker study [C41] c 196 n.a. 0.019 4 5 192 710 1.93 (<0, 8.47) e n.a.
Nuclear workers in Canada, United Kingdom and United States [C3] c
119 n.a. 0.04 2 142 526 2.18 (0.13, 5.7) u n.a.
United Kingdom NRRW [M12] c 89 91.1 0.031 2 063 300 2.55 (–0.03, 7.16) v n.a.
Nuclear power industry workers in the United States [H44] c
26 n.a. 0.026 698 041 5.67 (–2.56, 30.4) e n.a.
Mayak workers [S28] 66 39.5 0.81 720 000 1.0 (0.5, 2.0) n.a.
Oak Ridge National Laboratory, United States, X-10 and Y-12 plants [F5]
50 n.a. 0.013 n.a. <0 (<0–6.5) n.a.
Los Alamos National Laboratory workers, United States [W6]
44 43.6 ~0.016 251 651 ~0 w n.a.
Portsmouth shipyard workers, United States [S56, Y10]
34 38.6 0.020 303 892 10.88 (–0.90, 38.77) e, ll 33.8 (16.8, 50.7) mm
Average excess relative risk a at 1 Sv
Average excess absolute risk a (104 PY Sv) –1
UNSCEAR REPORT-PART 4.qxp 10/7/08 3:39 pm Page 214
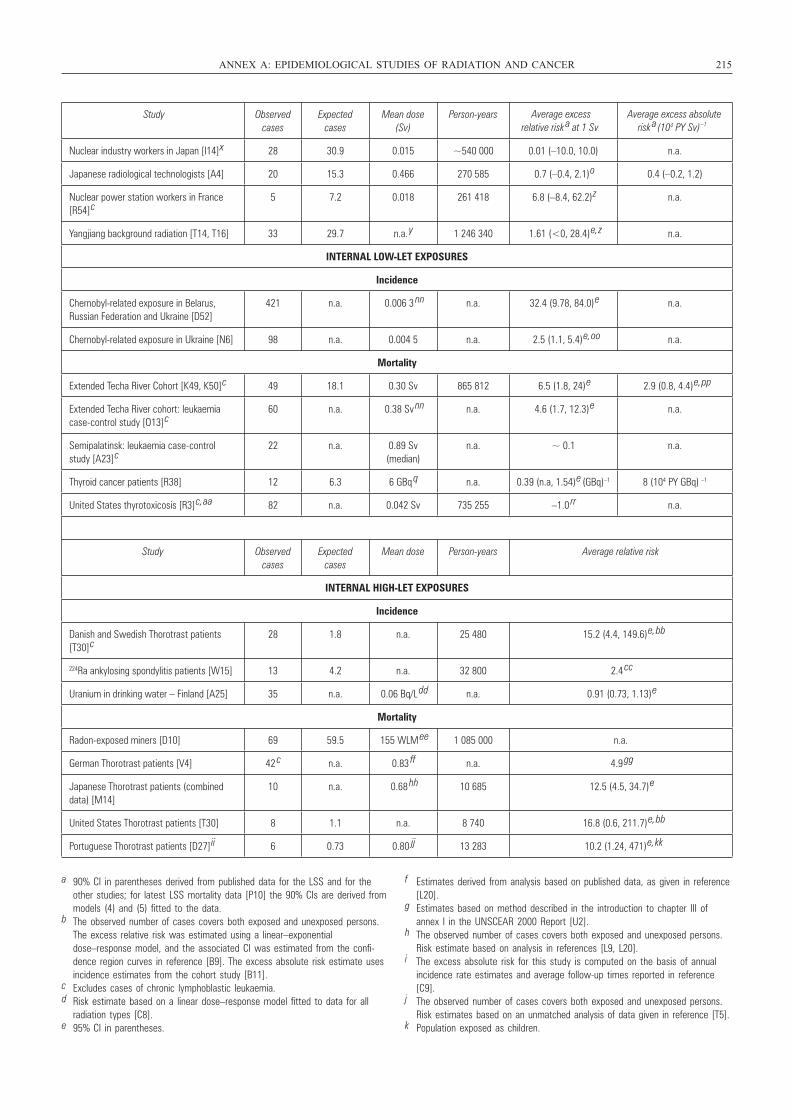
ANNEX A: EPIDEMIOLOGICAL STUDIES OF RADIATION AND CANCER 215
Study Observed cases
Expected cases
Mean dose (Sv)
Person-years
Nuclear industry workers in Japan [I14] x 28 30.9 0.015 ~540 000 0.01 (–10.0, 10.0) n.a.
Japanese radiological technologists [A4] 20 15.3 0.466 270 585 0.7 (–0.4, 2.1) o 0.4 (–0.2, 1.2)
Nuclear power station workers in France [R54] c
5 7.2 0.018 261 418 6.8 (–8.4, 62.2) z n.a.
Yangjiang background radiation [T14, T16] 33 29.7 n.a. y 1 246 340 1.61 (<0, 28.4) e, z n.a.
INTERNAL LOW-LET EXPOSURES
Incidence
Chernobyl-related exposure in Belarus, Russian Federation and Ukraine [D52]
421 n.a. 0.006 3 nn n.a. 32.4 (9.78, 84.0) e n.a.
Chernobyl-related exposure in Ukraine [N6] 98 n.a. 0.004 5 n.a. 2.5 (1.1, 5.4) e, oo n.a.
Mortality
Extended Techa River Cohort [K49, K50] c 49 18.1 0.30 Sv 865 812 6.5 (1.8, 24) e 2.9 (0.8, 4.4) e, pp
Extended Techa River cohort: leukaemia case-control study [O13] c
60 n.a. 0.38 Sv nn n.a. 4.6 (1.7, 12.3) e n.a.
Semipalatinsk: leukaemia case-control study [A23] c
22 n.a. 0.89 Sv (median)
n.a. ~ 0.1 n.a.
Thyroid cancer patients [R38] 12 6.3 6 GBq q n.a. 0.39 (n.a, 1.54) e (GBq)–1 8 (104 PY GBq) –1
United States thyrotoxicosis [R3] c, aa 82 n.a. 0.042 Sv 735 255 –1.0 rr n.a.
Study Observed cases
Expected cases
Mean dose Person-years Average relative risk
INTERNAL HIGH-LET EXPOSURES
Incidence
Danish and Swedish Thorotrast patients [T30] c
28 1.8 n.a. 25 480 15.2 (4.4, 149.6) e, bb
224Ra ankylosing spondylitis patients [W15] 13 4.2 n.a. 32 800 2.4 cc
Uranium in drinking water – Finland [A25] 35 n.a. 0.06 Bq/L dd n.a. 0.91 (0.73, 1.13) e
Mortality
Radon-exposed miners [D10] 69 59.5 155 WLM ee 1 085 000 n.a.
German Thorotrast patients [V4] 42 c n.a. 0.83 ff n.a. 4.9 gg
Japanese Thorotrast patients (combined data) [M14]
10 n.a. 0.68 hh 10 685 12.5 (4.5, 34.7) e
United States Thorotrast patients [T30] 8 1.1 n.a. 8 740 16.8 (0.6, 211.7) e, bb
Portuguese Thorotrast patients [D27] ii 6 0.73 0.80 jj 13 283 10.2 (1.24, 471) e, kk
Average excess relative risk a at 1 Sv
Average excess absolute risk a (104 PY Sv) –1
a 90% CI in parentheses derived from published data for the LSS and for theother studies; for latest LSS mortality data [P10] the 90% CIs are derived frommodels (4) and (5) fitted to the data.
b The observed number of cases covers both exposed and unexposed persons.The excess relative risk was estimated using a linear–exponentialdose–response model, and the associated CI was estimated from the confi-dence region curves in reference [B9]. The excess absolute risk estimate usesincidence estimates from the cohort study [B11].
c Excludes cases of chronic lymphoblastic leukaemia.d Risk estimate based on a linear dose–response model fitted to data for all
radiation types [C8].e 95% CI in parentheses.
f Estimates derived from analysis based on published data, as given in reference[L20].
g Estimates based on method described in the introduction to chapter III ofannex I in the UNSCEAR 2000 Report [U2].
h The observed number of cases covers both exposed and unexposed persons.Risk estimate based on analysis in references [L9, L20].
i The excess absolute risk for this study is computed on the basis of annualincidence rate estimates and average follow-up times reported in reference[C9].
j The observed number of cases covers both exposed and unexposed persons.Risk estimates based on an unmatched analysis of data given in reference [T5].
k Population exposed as children.
UNSCEAR REPORT-PART 4.qxp 10/7/08 3:39 pm Page 215
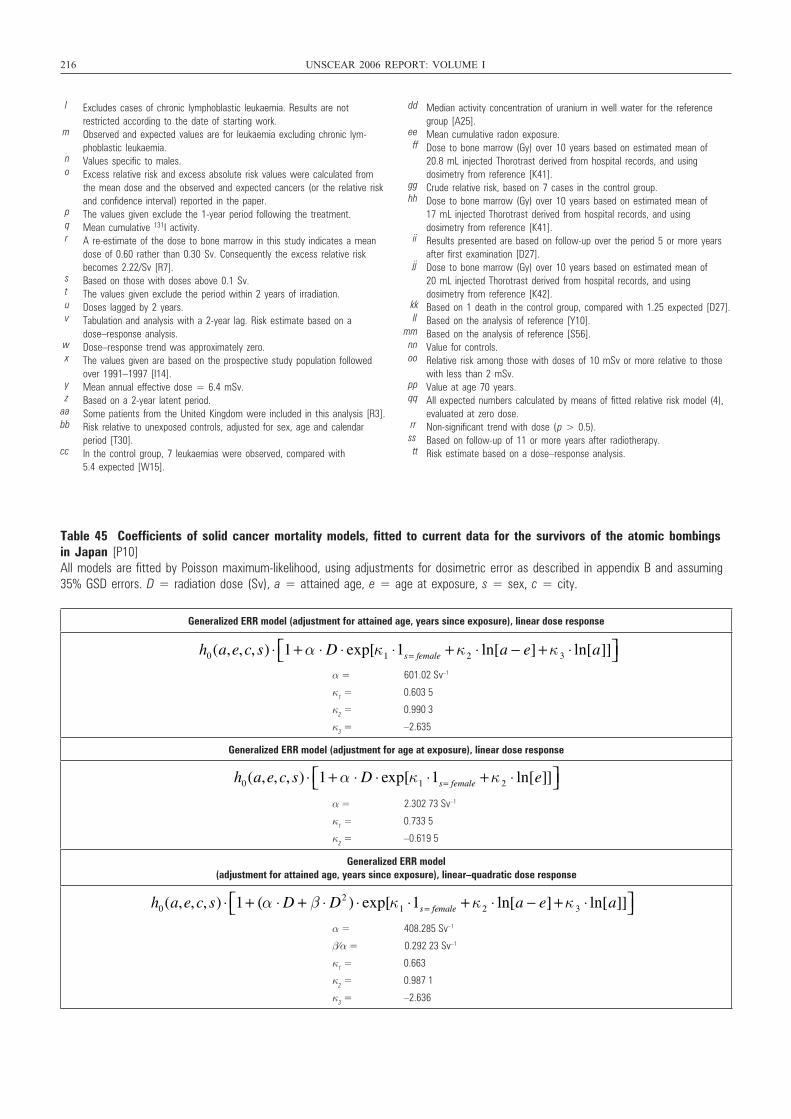
216 UNSCEAR 2006 REPORT: VOLUME I
l Excludes cases of chronic lymphoblastic leukaemia. Results are notrestricted according to the date of starting work.
m Observed and expected values are for leukaemia excluding chronic lym-phoblastic leukaemia.
n Values specific to males.o Excess relative risk and excess absolute risk values were calculated from
the mean dose and the observed and expected cancers (or the relative riskand confidence interval) reported in the paper.
p The values given exclude the 1-year period following the treatment.q Mean cumulative 131I activity.r A re-estimate of the dose to bone marrow in this study indicates a mean
dose of 0.60 rather than 0.30 Sv. Consequently the excess relative riskbecomes 2.22/Sv [R7].
s Based on those with doses above 0.1 Sv.t The values given exclude the period within 2 years of irradiation.u Doses lagged by 2 years.v Tabulation and analysis with a 2-year lag. Risk estimate based on a
dose–response analysis.w Dose–response trend was approximately zero.x The values given are based on the prospective study population followed
over 1991–1997 [I14].y Mean annual effective dose = 6.4 mSv.z Based on a 2-year latent period.
aa Some patients from the United Kingdom were included in this analysis [R3].bb Risk relative to unexposed controls, adjusted for sex, age and calendar
period [T30].cc In the control group, 7 leukaemias were observed, compared with
5.4 expected [W15].
dd Median activity concentration of uranium in well water for the reference group [A25].
ee Mean cumulative radon exposure.ff Dose to bone marrow (Gy) over 10 years based on estimated mean of
20.8 mL injected Thorotrast derived from hospital records, and using dosimetry from reference [K41].
gg Crude relative risk, based on 7 cases in the control group.hh Dose to bone marrow (Gy) over 10 years based on estimated mean of
17 mL injected Thorotrast derived from hospital records, and using dosimetry from reference [K41].
ii Results presented are based on follow-up over the period 5 or more yearsafter first examination [D27].
jj Dose to bone marrow (Gy) over 10 years based on estimated mean of 20 mL injected Thorotrast derived from hospital records, and using dosimetry from reference [K42].
kk Based on 1 death in the control group, compared with 1.25 expected [D27].ll Based on the analysis of reference [Y10].
mm Based on the analysis of reference [S56].nn Value for controls.oo Relative risk among those with doses of 10 mSv or more relative to those
with less than 2 mSv.pp Value at age 70 years.qq All expected numbers calculated by means of fitted relative risk model (4),
evaluated at zero dose.rr Non-significant trend with dose (p > 0.5).ss Based on follow-up of 11 or more years after radiotherapy.tt Risk estimate based on a dose–response analysis.
Table 45 Coefficients of solid cancer mortality models, fitted to current data for the survivors of the atomic bombingsin Japan [P10]All models are fitted by Poisson maximum-likelihood, using adjustments for dosimetric error as described in appendix B and assuming35% GSD errors. D = radiation dose (Sv), a = attained age, e = age at exposure, s = sex, c = city.
Generalized ERR model (adjustment for attained age, years since exposure), linear dose response
α = 601.02 Sv–1
κ1 = 0.603 5
κ2 = 0.990 3
κ3 = –2.635
Generalized ERR model (adjustment for age at exposure), linear dose response
α = 2.302 73 Sv–1
κ1 = 0.733 5
κ2 = –0.619 5
Generalized ERR model (adjustment for attained age, years since exposure), linear–quadratic dose response
α = 408.285 Sv–1
β⁄α = 0.292 23 Sv–1
κ1 = 0.663
κ2 = 0.987 1
κ3 = –2.636
h0(a,e,c, s) ⋅ 1+ α ⋅ D ⋅ exp[κ1 ⋅1s = female + κ2 ⋅ ln[a − e] +κ 3 ⋅ ln[a]]⎡⎣ ⎤⎦
h0(a,e,c, s) ⋅ 1+ α ⋅ D ⋅ exp[κ1 ⋅1s= female +κ 2 ⋅ ln[e]]⎡⎣ ⎤⎦
h0(a,e,c, s) ⋅ 1+ (α ⋅ D + β ⋅ D2 ) ⋅ exp[κ1 ⋅1s = female + κ2 ⋅ ln[a − e] +κ 3 ⋅ ln[a]]⎡⎣ ⎤⎦
UNSCEAR REPORT-PART 4.qxp 10/7/08 3:39 pm Page 216
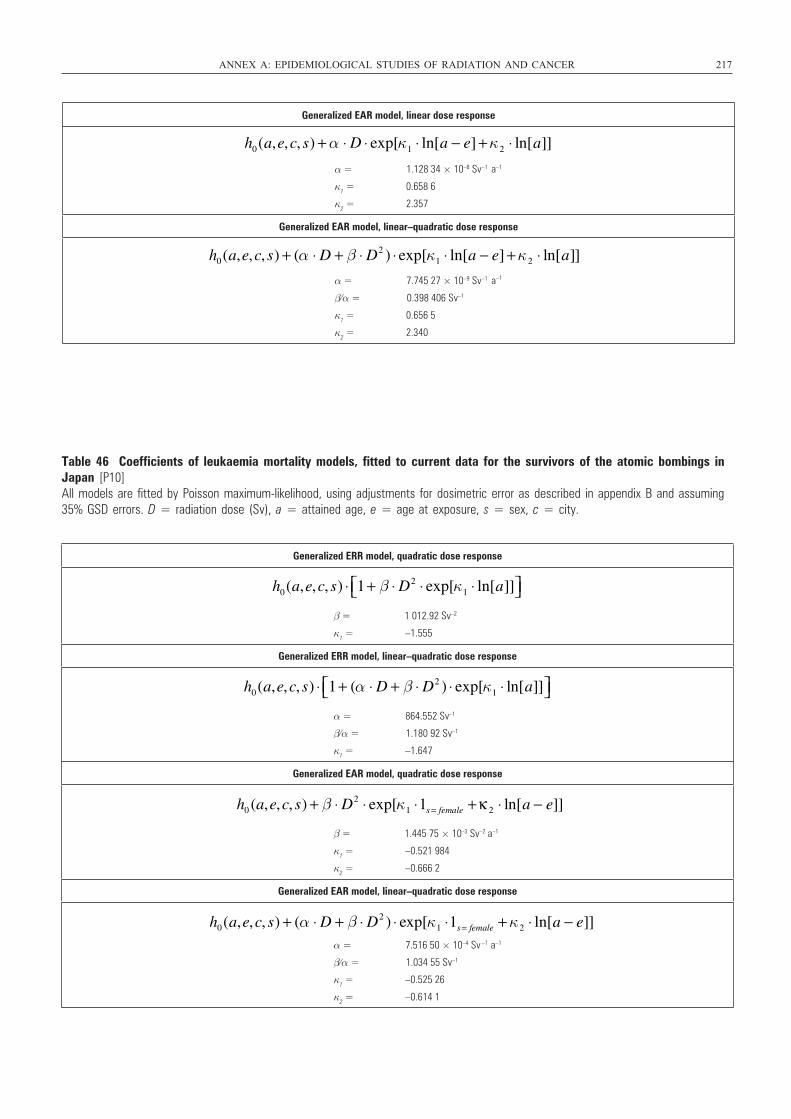
ANNEX A: EPIDEMIOLOGICAL STUDIES OF RADIATION AND CANCER 217
Generalized EAR model, linear dose response
α = 1.128 34 × 10–8 Sv–1 a–1
κ1 = 0.658 6
κ2 = 2.357
Generalized EAR model, linear–quadratic dose response
α = 7.745 27 × 10–9 Sv–1 a
β⁄α = 0.398 406 Sv–1
κ1 = 0.656 5
κ2 = 2.340
h0(a,e,c, s) + α ⋅ D ⋅ exp[κ1 ⋅ ln[a − e] +κ2 ⋅ ln[a]]
h0(a,e,c, s) + (α ⋅ D + β ⋅ D2 ) ⋅ exp[κ1 ⋅ ln[a − e] +κ2 ⋅ ln[a]]–1
Table 46 Coefficients of leukaemia mortality models, fitted to current data for the survivors of the atomic bombings inJapan [P10]All models are fitted by Poisson maximum-likelihood, using adjustments for dosimetric error as described in appendix B and assuming35% GSD errors. D = radiation dose (Sv), a = attained age, e = age at exposure, s = sex, c = city.
Generalized ERR model, quadratic dose response
β = 1 012.92 Sv–2
κ1 = –1.555
Generalized ERR model, linear–quadratic dose response
α = 864.552 Sv–1
β⁄α = 1.180 92 Sv–1
κ1 = –1.647
Generalized EAR model, quadratic dose response
β = 1.445 75 × 10–3 Sv–2 a–1
κ1 = –0.521 984
κ2 = –0.666 2
Generalized EAR model, linear–quadratic dose response
α = 7.516 50 × 10–4 Sv a–1
β⁄α = 1.034 55 Sv–1
κ1 = –0.525 26
κ2 = –0.614 1
h0(a,e,c, s) ⋅ 1+ β ⋅ D2 ⋅ exp[κ1 ⋅ ln[a]]⎡⎣ ⎤⎦
h0(a,e,c, s) ⋅ 1+ (α ⋅ D + β ⋅ D2 ) ⋅ exp[κ1 ⋅ ln[a]]⎡⎣ ⎤⎦
h0 (a,e,c, s) + β ⋅ D2 ⋅ exp[κ1 ⋅1s = female +κ 2 ⋅ ln[a − e]]
h0(a,e,c, s) + (α ⋅ D + β ⋅ D2 ) ⋅ exp[κ1 ⋅1s = female + κ2 ⋅ ln[a − e]]–1
UNSCEAR REPORT-PART 4.qxp 10/7/08 3:39 pm Page 217
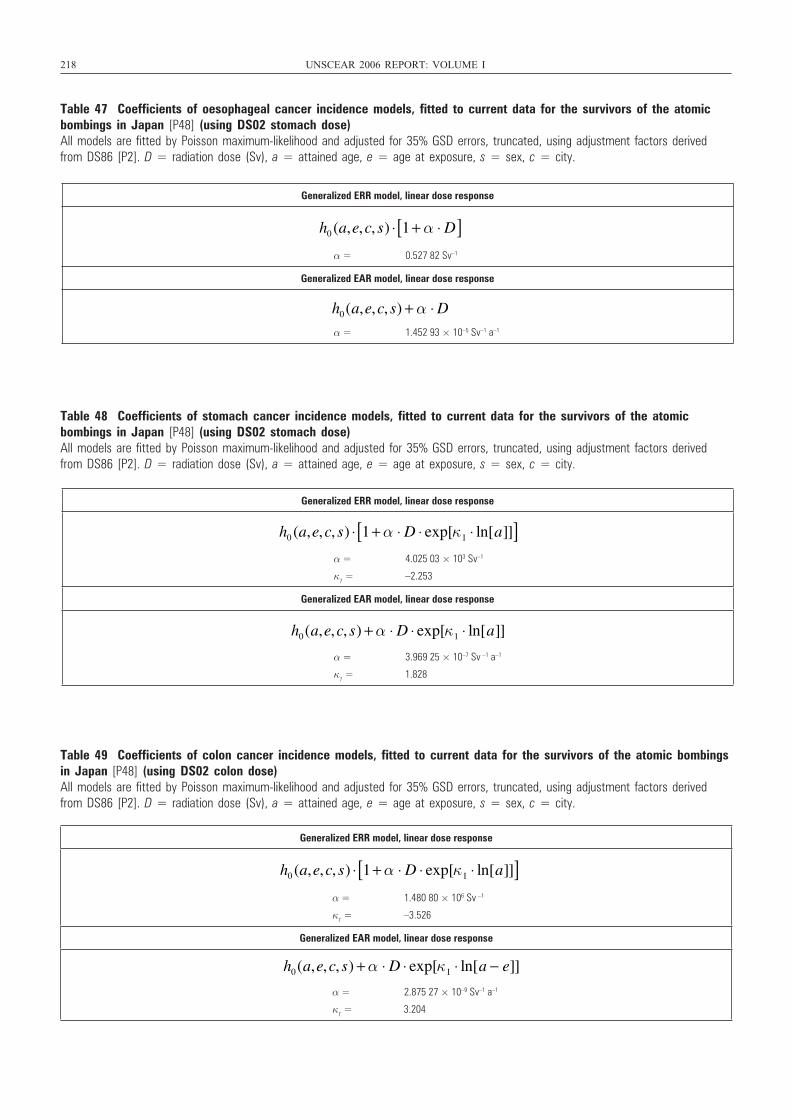
218 UNSCEAR 2006 REPORT: VOLUME I
Table 47 Coefficients of oesophageal cancer incidence models, fitted to current data for the survivors of the atomicbombings in Japan [P48] (using DS02 stomach dose)All models are fitted by Poisson maximum-likelihood and adjusted for 35% GSD errors, truncated, using adjustment factors derivedfrom DS86 [P2]. D = radiation dose (Sv), a = attained age, e = age at exposure, s = sex, c = city.
Generalized ERR model, linear dose response
α = 0.527 82 Sv–1
Generalized EAR model, linear dose response
α = 1.452 93 × 10–5 Sv–1 a–1
h0 (a,e,c, s) ⋅ 1+ α ⋅ D[ ]
h0(a,e,c, s) + α ⋅ D
Table 48 Coefficients of stomach cancer incidence models, fitted to current data for the survivors of the atomic bombings in Japan [P48] (using DS02 stomach dose)All models are fitted by Poisson maximum-likelihood and adjusted for 35% GSD errors, truncated, using adjustment factors derivedfrom DS86 [P2]. D = radiation dose (Sv), a = attained age, e = age at exposure, s = sex, c = city.
Table 49 Coefficients of colon cancer incidence models, fitted to current data for the survivors of the atomic bombingsin Japan [P48] (using DS02 colon dose)All models are fitted by Poisson maximum-likelihood and adjusted for 35% GSD errors, truncated, using adjustment factors derivedfrom DS86 [P2]. D = radiation dose (Sv), a = attained age, e = age at exposure, s = sex, c = city.
Generalized ERR model, linear dose response
α = 4.025 03 × 103 Sv–1
κ1 = –2.253
Generalized EAR model, linear dose response
α = 3.969 25 × 10–7 Sv –1 a–1
κ1 = 1.828
h0 (a,e,c, s) ⋅ 1+ α ⋅ D ⋅ exp[κ1 ⋅ ln[a]][ ]
h0(a,e,c, s) + α ⋅ D ⋅ exp[κ1 ⋅ ln[a]]
Generalized ERR model, linear dose response
α = 1.480 80 × 106 Sv –1
κ1 = –3.526
Generalized EAR model, linear dose response
α = 2.875 27 × 10–9 Sv–1 a–1
κ1 = 3.204
h0 (a,e,c, s) ⋅ 1+ α ⋅ D ⋅ exp[κ1 ⋅ ln[a]][ ]
h0(a,e,c, s) + α ⋅ D ⋅ exp[κ1 ⋅ ln[a − e]]
UNSCEAR REPORT-PART 4.qxp 10/7/08 3:39 pm Page 218
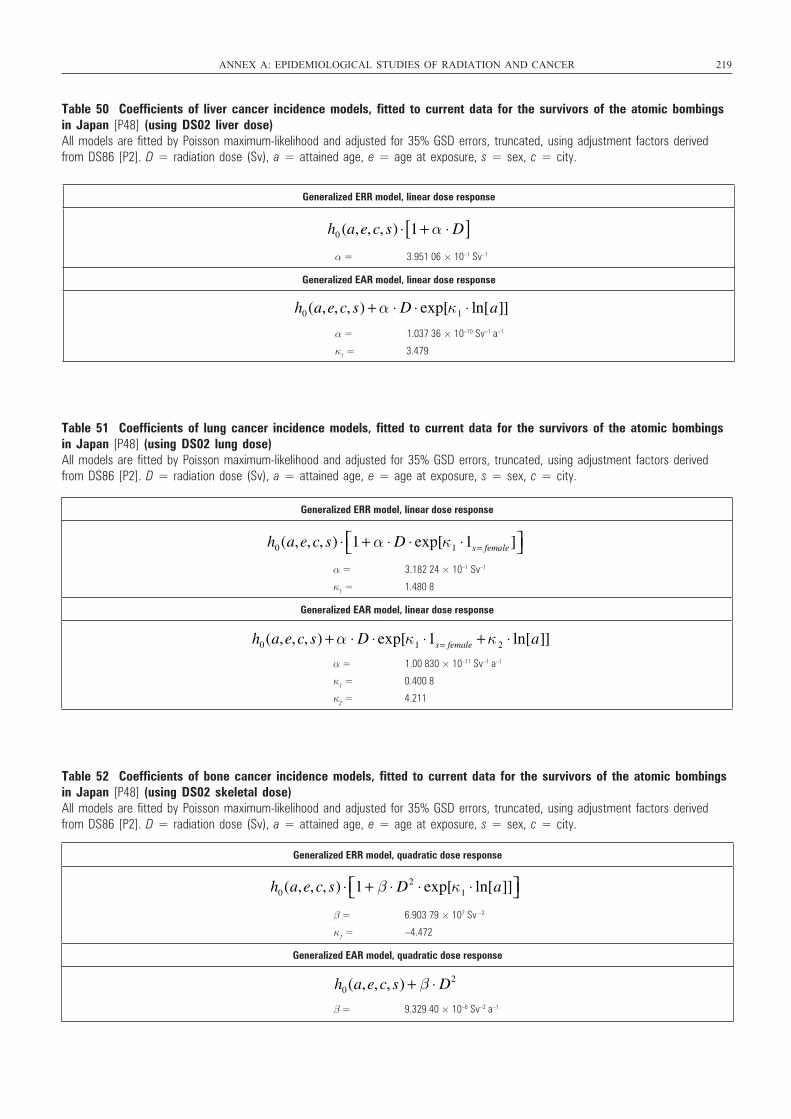
Table 50 Coefficients of liver cancer incidence models, fitted to current data for the survivors of the atomic bombingsin Japan [P48] (using DS02 liver dose)All models are fitted by Poisson maximum-likelihood and adjusted for 35% GSD errors, truncated, using adjustment factors derivedfrom DS86 [P2]. D = radiation dose (Sv), a = attained age, e = age at exposure, s = sex, c = city.
Table 51 Coefficients of lung cancer incidence models, fitted to current data for the survivors of the atomic bombingsin Japan [P48] (using DS02 lung dose)All models are fitted by Poisson maximum-likelihood and adjusted for 35% GSD errors, truncated, using adjustment factors derivedfrom DS86 [P2]. D = radiation dose (Sv), a = attained age, e = age at exposure, s = sex, c = city.
Table 52 Coefficients of bone cancer incidence models, fitted to current data for the survivors of the atomic bombingsin Japan [P48] (using DS02 skeletal dose)All models are fitted by Poisson maximum-likelihood and adjusted for 35% GSD errors, truncated, using adjustment factors derivedfrom DS86 [P2]. D = radiation dose (Sv), a = attained age, e = age at exposure, s = sex, c = city.
ANNEX A: EPIDEMIOLOGICAL STUDIES OF RADIATION AND CANCER 219
Generalized ERR model, linear dose response
α = 3.951 06 × 10–1 Sv–1
Generalized EAR model, linear dose response
α = 1.037 36 × 10–10 Sv–1 a–1
κ1 = 3.479
h0 (a,e,c, s) ⋅ 1+ α ⋅ D[ ]
h0(a,e,c, s) + α ⋅ D ⋅ exp[κ1 ⋅ ln[a]]
Generalized ERR model, linear dose response
α = 3.182 24 × 10–1 Sv–1
κ1 = 1.480 8
Generalized EAR model, linear dose response
α = 1.00 830 × 10–11 Sv–1 a–1
κ1 = 0.400 8
κ2 = 4.211
h0(a,e,c, s) ⋅ 1+ α ⋅ D ⋅ exp[κ1 ⋅1s = female ]⎡⎣ ⎤⎦
h0(a,e,c, s) + α ⋅ D ⋅ exp[κ1 ⋅1s= female +κ 2 ⋅ ln[a]]
Generalized ERR model, quadratic dose response
β = 6.903 79 × 107 Sv –2
κ1 = –4.472
Generalized EAR model, quadratic dose response
β = 9.329 40 × 10–6 Sv–2 a–1
h0(a,e,c, s) ⋅ 1+ β ⋅ D2 ⋅ exp[κ1 ⋅ ln[a]]⎡⎣ ⎤⎦
h0(a,e,c, s) + β ⋅ D2
UNSCEAR REPORT-PART 4.qxp 10/7/08 3:39 pm Page 219
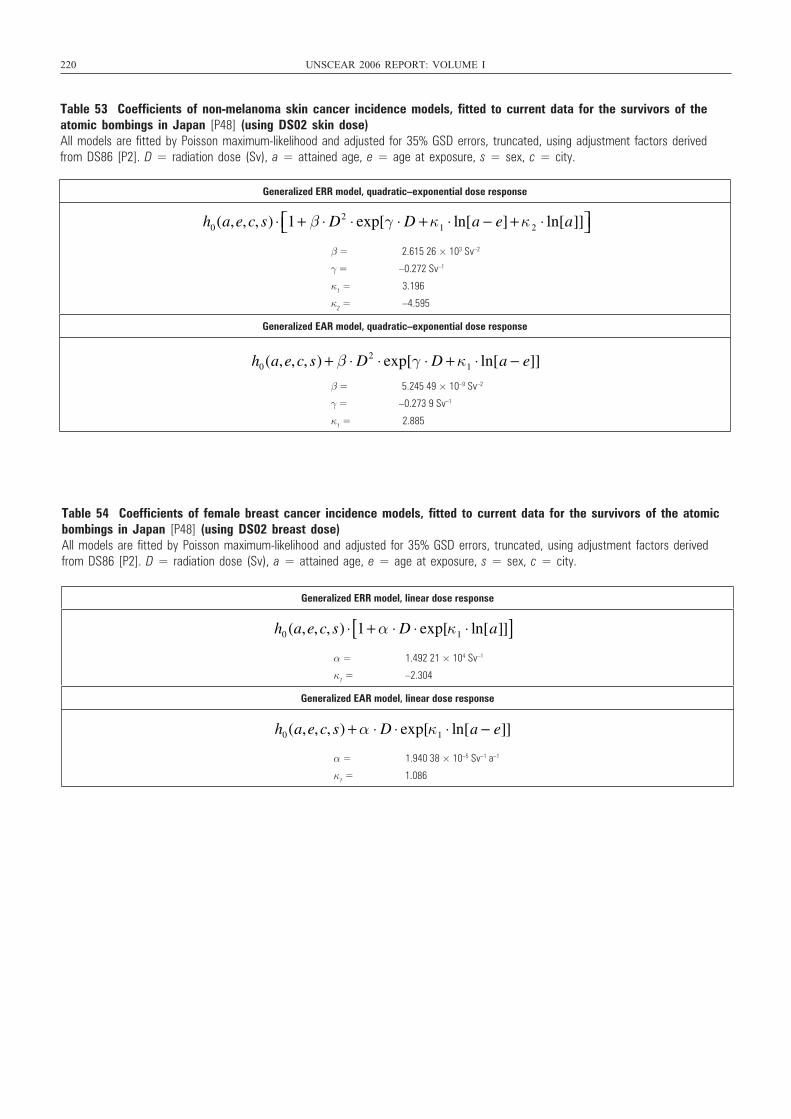
220 UNSCEAR 2006 REPORT: VOLUME I
Table 53 Coefficients of non-melanoma skin cancer incidence models, fitted to current data for the survivors of theatomic bombings in Japan [P48] (using DS02 skin dose)All models are fitted by Poisson maximum-likelihood and adjusted for 35% GSD errors, truncated, using adjustment factors derivedfrom DS86 [P2]. D = radiation dose (Sv), a = attained age, e = age at exposure, s = sex, c = city.
Generalized ERR model, quadratic–exponential dose response
β = 2.615 26 × 103 Sv–2
γ = –0.272 Sv–1
κ1 = 3.196
κ2 = –4.595
Generalized EAR model, quadratic–exponential dose response
β = 5.245 49 × 10–9 Sv–2
γ = –0.273 9 Sv–1
κ1 = 2.885
h0(a,e,c, s) ⋅ 1+ β ⋅ D2 ⋅ exp[γ ⋅ D +κ1 ⋅ ln[a − e] +κ 2 ⋅ ln[a]]⎡⎣ ⎤⎦
h0(a,e,c, s) + β ⋅ D2 ⋅ exp[γ ⋅ D + κ1 ⋅ ln[a − e]]
Table 54 Coefficients of female breast cancer incidence models, fitted to current data for the survivors of the atomicbombings in Japan [P48] (using DS02 breast dose)All models are fitted by Poisson maximum-likelihood and adjusted for 35% GSD errors, truncated, using adjustment factors derivedfrom DS86 [P2]. D = radiation dose (Sv), a = attained age, e = age at exposure, s = sex, c = city.
Generalized ERR model, linear dose response
α = 1.492 21 × 104 Sv–1
κ1 = –2.304
Generalized EAR model, linear dose response
α = 1.940 38 × 10–5 Sv–1 a–1
κ1 = 1.086
h0 (a,e,c, s) ⋅ 1+ α ⋅ D ⋅ exp[κ1 ⋅ ln[a]][ ]
h0(a,e,c, s) + α ⋅ D ⋅ exp[κ1 ⋅ ln[a − e]]
UNSCEAR REPORT-PART 4.qxp 10/7/08 3:39 pm Page 220
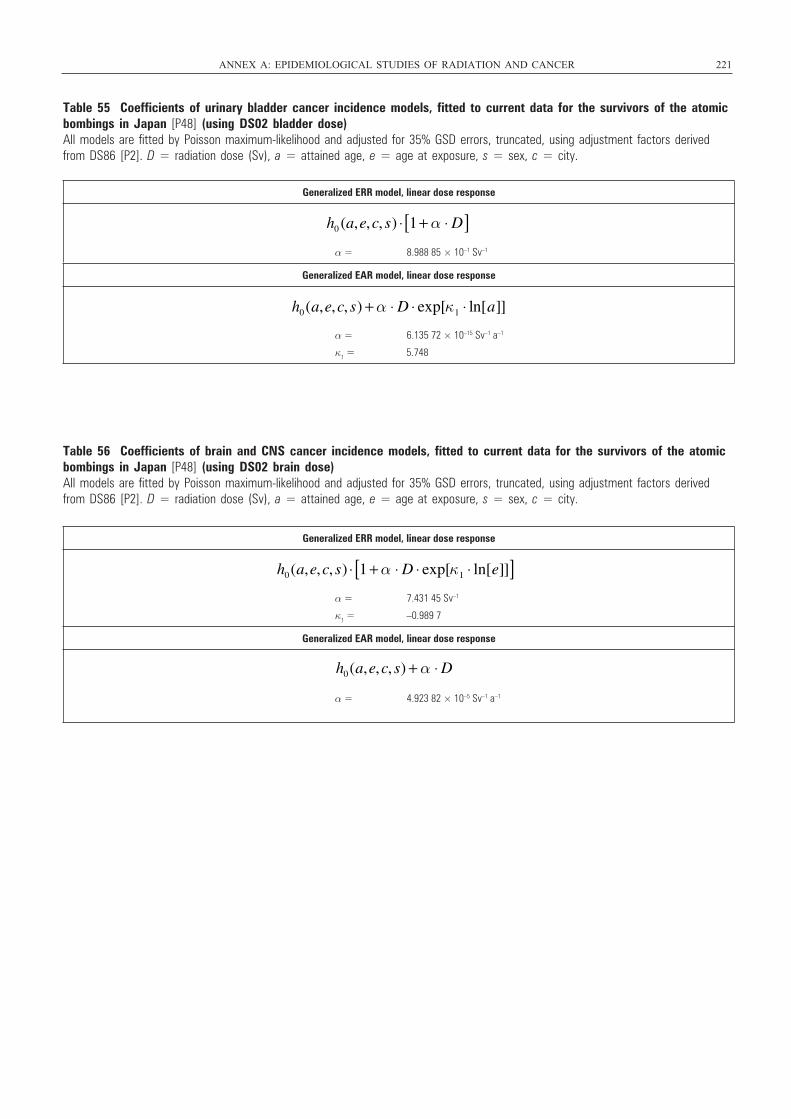
ANNEX A: EPIDEMIOLOGICAL STUDIES OF RADIATION AND CANCER 221
Table 55 Coefficients of urinary bladder cancer incidence models, fitted to current data for the survivors of the atomicbombings in Japan [P48] (using DS02 bladder dose)All models are fitted by Poisson maximum-likelihood and adjusted for 35% GSD errors, truncated, using adjustment factors derivedfrom DS86 [P2]. D = radiation dose (Sv), a = attained age, e = age at exposure, s = sex, c = city.
Generalized ERR model, linear dose response
α = 8.988 85 × 10–1 Sv–1
Generalized EAR model, linear dose response
α = 6.135 72 × 10–15 Sv–1 a–1
κ1 = 5.748
h0 (a,e,c, s) ⋅ 1+ α ⋅ D[ ]
h0(a,e,c, s) + α ⋅ D ⋅ exp[κ1 ⋅ ln[a]]
Table 56 Coefficients of brain and CNS cancer incidence models, fitted to current data for the survivors of the atomicbombings in Japan [P48] (using DS02 brain dose)All models are fitted by Poisson maximum-likelihood and adjusted for 35% GSD errors, truncated, using adjustment factors derivedfrom DS86 [P2]. D = radiation dose (Sv), a = attained age, e = age at exposure, s = sex, c = city.
Generalized ERR model, linear dose response
α = 7.431 45 Sv–1
κ1 = –0.989 7
Generalized EAR model, linear dose response
α = 4.923 82 × 10–5 Sv–1 a–1
h0(a,e,c, s) ⋅ 1 + α ⋅ D ⋅ exp[κ1 ⋅ ln[e]][ ]
h0(a,e,c, s) + α ⋅ D
UNSCEAR REPORT-PART 4.qxp 10/7/08 3:39 pm Page 221
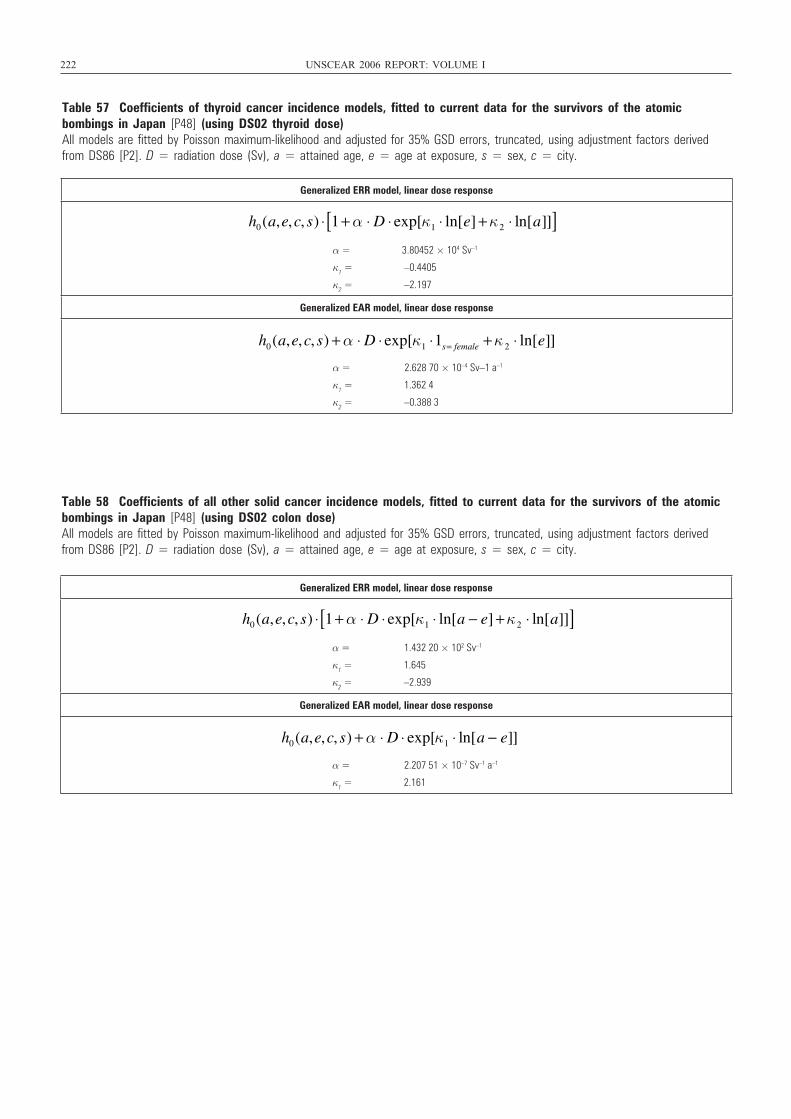
222 UNSCEAR 2006 REPORT: VOLUME I
Table 57 Coefficients of thyroid cancer incidence models, fitted to current data for the survivors of the atomic bombings in Japan [P48] (using DS02 thyroid dose)All models are fitted by Poisson maximum-likelihood and adjusted for 35% GSD errors, truncated, using adjustment factors derivedfrom DS86 [P2]. D = radiation dose (Sv), a = attained age, e = age at exposure, s = sex, c = city.
Generalized ERR model, linear dose response
α = 3.80452 × 10⁴ Sv–1
κ1 = –0.4405
κ2 = –2.197
Generalized EAR model, linear dose response
α = 2.628 70 × 10–4 Sv–1 a–1
κ1 = 1.362 4
κ2 = –0.388 3
h0(a,e,c, s) ⋅ 1+ α ⋅ D ⋅ exp[κ1 ⋅ ln[e] +κ2 ⋅ ln[a]][ ]
h0(a,e,c, s) + α ⋅ D ⋅ exp[κ1 ⋅1s= female +κ 2 ⋅ ln[e]]
Table 58 Coefficients of all other solid cancer incidence models, fitted to current data for the survivors of the atomicbombings in Japan [P48] (using DS02 colon dose)All models are fitted by Poisson maximum-likelihood and adjusted for 35% GSD errors, truncated, using adjustment factors derivedfrom DS86 [P2]. D = radiation dose (Sv), a = attained age, e = age at exposure, s = sex, c = city.
Generalized ERR model, linear dose response
α = 1.432 20 × 102 Sv–1
κ1 = 1.645
κ2 = –2.939
Generalized EAR model, linear dose response
α = 2.207 51 × 10–7 Sv–1 a–1
κ1 = 2.161
h0(a,e,c, s) ⋅ 1+ α ⋅ D ⋅ exp[κ1 ⋅ ln[a − e] +κ2 ⋅ ln[a]][ ]
h0(a,e,c, s) + α ⋅ D ⋅ exp[κ1 ⋅ ln[a − e]]
UNSCEAR REPORT-PART 4.qxp 10/7/08 3:39 pm Page 222
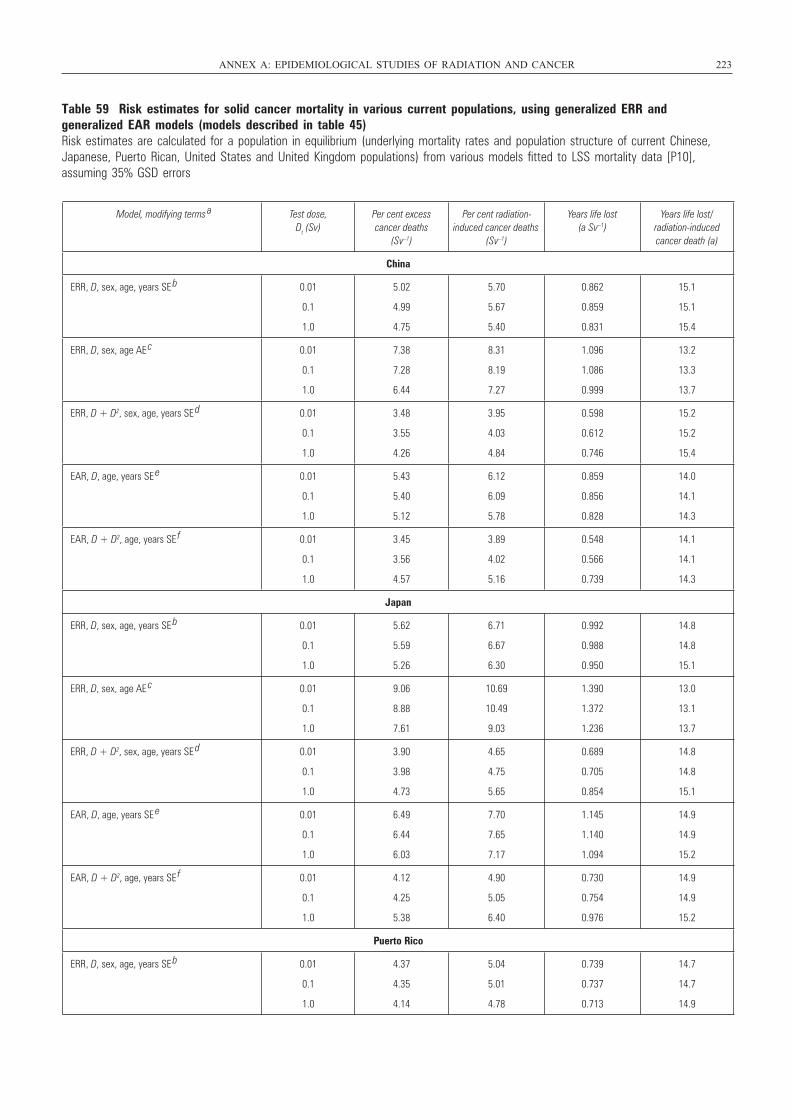
Table 59 Risk estimates for solid cancer mortality in various current populations, using generalized ERR and generalized EAR models (models described in table 45)Risk estimates are calculated for a population in equilibrium (underlying mortality rates and population structure of current Chinese,Japanese, Puerto Rican, United States and United Kingdom populations) from various models fitted to LSS mortality data [P10], assuming 35% GSD errors
ANNEX A: EPIDEMIOLOGICAL STUDIES OF RADIATION AND CANCER 223
Model, modifying terms a Test dose,
Dt (Sv)Per cent excess cancer deaths
(Sv–1)
Per cent radiation-induced cancer deaths
(Sv–1)
Years life lost (a Sv–1)
Years life lost/radiation-induced cancer death (a)
China
ERR, D, sex, age, years SE b 0.01
0.1
1.0
5.02
4.99
4.75
5.70
5.67
5.40
0.862
0.859
0.831
15.1
15.1
15.4
ERR, D, sex, age AE c 0.01
0.1
1.0
7.38
7.28
6.44
8.31
8.19
7.27
1.096
1.086
0.999
13.2
13.3
13.7
ERR, D + D2, sex, age, years SE d 0.01
0.1
1.0
3.48
3.55
4.26
3.95
4.03
4.84
0.598
0.612
0.746
15.2
15.2
15.4
EAR, D, age, years SE e 0.01
0.1
1.0
5.43
5.40
5.12
6.12
6.09
5.78
0.859
0.856
0.828
14.0
14.1
14.3
EAR, D + D2, age, years SE f 0.01
0.1
1.0
3.45
3.56
4.57
3.89
4.02
5.16
0.548
0.566
0.739
14.1
14.1
14.3
Japan
ERR, D, sex, age, years SE b 0.01
0.1
1.0
5.62
5.59
5.26
6.71
6.67
6.30
0.992
0.988
0.950
14.8
14.8
15.1
ERR, D, sex, age AE c 0.01
0.1
1.0
9.06
8.88
7.61
10.69
10.49
9.03
1.390
1.372
1.236
13.0
13.1
13.7
ERR, D + D2, sex, age, years SE d 0.01
0.1
1.0
3.90
3.98
4.73
4.65
4.75
5.65
0.689
0.705
0.854
14.8
14.8
15.1
EAR, D, age, years SE e 0.01
0.1
1.0
6.49
6.44
6.03
7.70
7.65
7.17
1.145
1.140
1.094
14.9
14.9
15.2
EAR, D + D2, age, years SE f 0.01
0.1
1.0
4.12
4.25
5.38
4.90
5.05
6.40
0.730
0.754
0.976
14.9
14.9
15.2
Puerto Rico
ERR, D, sex, age, years SE b 0.01
0.1
1.0
4.37
4.35
4.14
5.04
5.01
4.78
0.739
0.737
0.713
14.7
14.7
14.9
UNSCEAR REPORT-PART 4.qxp 10/7/08 3:39 pm Page 223
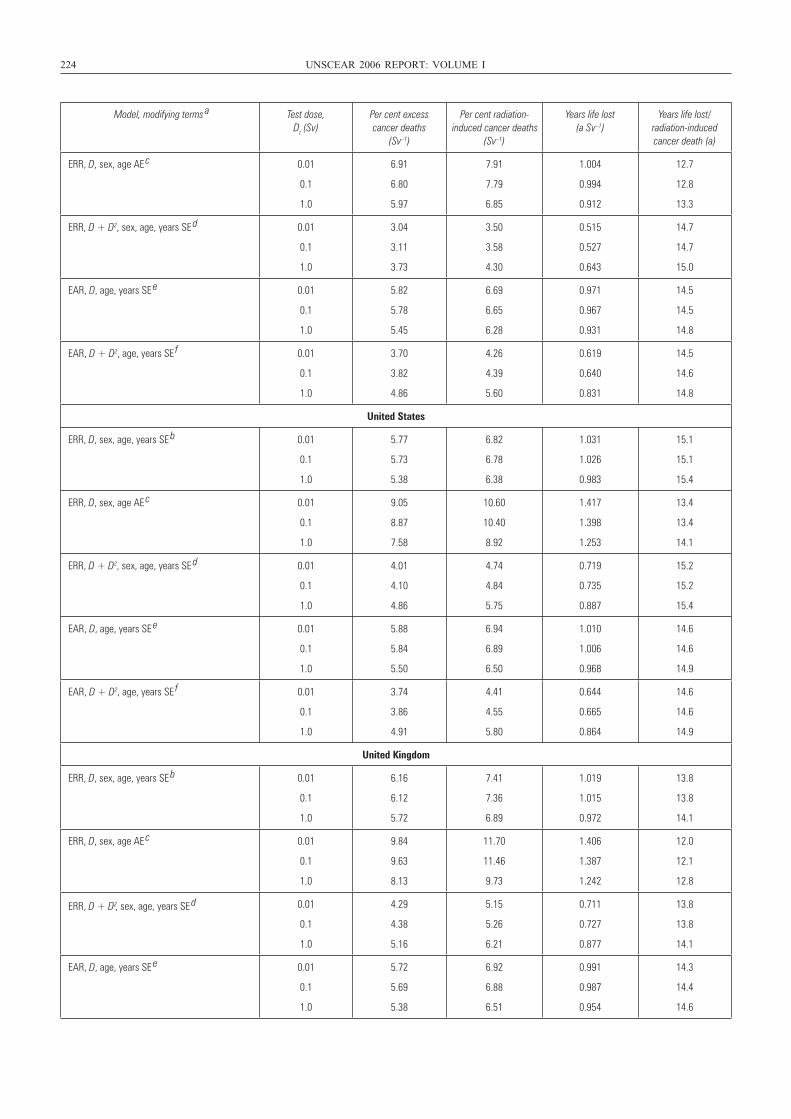
224 UNSCEAR 2006 REPORT: VOLUME I
Model, modifying terms a Test dose,
Dt (Sv)Per cent excess cancer deaths
(Sv–1)
Per cent radiation-induced cancer deaths
(Sv–1)
Years life lost (a Sv–1)
Years life lost/radiation-induced cancer death (a)
ERR, D, sex, age AE c 0.01
0.1
1.0
6.91
6.80
5.97
7.91
7.79
6.85
1.004
0.994
0.912
12.7
12.8
13.3
ERR, D + D2, sex, age, years SE d 0.01
0.1
1.0
3.04
3.11
3.73
3.50
3.58
4.30
0.515
0.527
0.643
14.7
14.7
15.0
EAR, D, age, years SE e 0.01
0.1
1.0
5.82
5.78
5.45
6.69
6.65
6.28
0.971
0.967
0.931
14.5
14.5
14.8
EAR, D + D2, age, years SE f 0.01
0.1
1.0
3.70
3.82
4.86
4.26
4.39
5.60
0.619
0.640
0.831
14.5
14.6
14.8
United States
ERR, D, sex, age, years SE b 0.01
0.1
1.0
5.77
5.73
5.38
6.82
6.78
6.38
1.031
1.026
0.983
15.1
15.1
15.4
ERR, D, sex, age AE c 0.01
0.1
1.0
9.05
8.87
7.58
10.60
10.40
8.92
1.417
1.398
1.253
13.4
13.4
14.1
ERR, D + D2, sex, age, years SE d 0.01
0.1
1.0
4.01
4.10
4.86
4.74
4.84
5.75
0.719
0.735
0.887
15.2
15.2
15.4
EAR, D, age, years SE e 0.01
0.1
1.0
5.88
5.84
5.50
6.94
6.89
6.50
1.010
1.006
0.968
14.6
14.6
14.9
EAR, D + D2, age, years SE f 0.01
0.1
1.0
3.74
3.86
4.91
4.41
4.55
5.80
0.644
0.665
0.864
14.6
14.6
14.9
United Kingdom
ERR, D, sex, age, years SE b 0.01
0.1
1.0
6.16
6.12
5.72
7.41
7.36
6.89
1.019
1.015
0.972
13.8
13.8
14.1
ERR, D, sex, age AE c 0.01
0.1
1.0
9.84
9.63
8.13
11.70
11.46
9.73
1.406
1.387
1.242
12.0
12.1
12.8
ERR, D + D2, sex, age, years SE d 0.01
0.1
1.0
4.29
4.38
5.16
5.15
5.26
6.21
0.711
0.727
0.877
13.8
13.8
14.1
EAR, D, age, years SE e 0.01
0.1
1.0
5.72
5.69
5.38
6.92
6.88
6.51
0.991
0.987
0.954
14.3
14.4
14.6
UNSCEAR REPORT-PART 4.qxp 10/7/08 3:39 pm Page 224
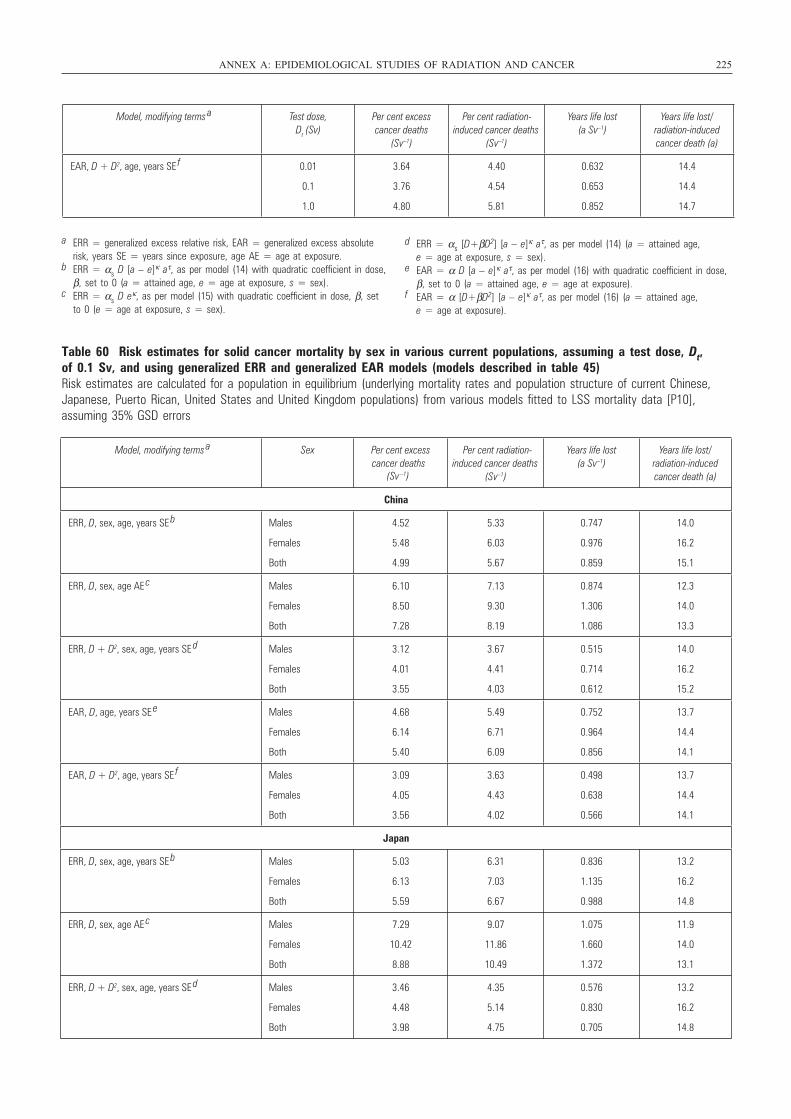
Table 60 Risk estimates for solid cancer mortality by sex in various current populations, assuming a test dose, Dt, of 0.1 Sv, and using generalized ERR and generalized EAR models (models described in table 45)Risk estimates are calculated for a population in equilibrium (underlying mortality rates and population structure of current Chinese,Japanese, Puerto Rican, United States and United Kingdom populations) from various models fitted to LSS mortality data [P10],assuming 35% GSD errors
ANNEX A: EPIDEMIOLOGICAL STUDIES OF RADIATION AND CANCER 225
Model, modifying terms a Test dose,
Dt (Sv)Per cent excess cancer deaths
(Sv–1)
Per cent radiation-induced cancer deaths
(Sv–1)
Years life lost (a Sv–1)
Years life lost/radiation-induced cancer death (a)
EAR, D + D2, age, years SE f 0.01
0.1
1.0
3.64
3.76
4.80
4.40
4.54
5.81
0.632
0.653
0.852
14.4
14.4
14.7
a ERR = generalized excess relative risk, EAR = generalized excess absoluterisk, years SE = years since exposure, age AE = age at exposure.
b ERR = αs D [a – e]κ aτ, as per model (14) with quadratic coefficient in dose,β, set to 0 (a = attained age, e = age at exposure, s = sex).
c ERR = αs D eκ, as per model (15) with quadratic coefficient in dose, β, setto 0 (e = age at exposure, s = sex).
d ERR = αs [D+βD2] [a – e]κ aτ, as per model (14) (a = attained age, e = age at exposure, s = sex).
e EAR = α D [a – e]κ aτ, as per model (16) with quadratic coefficient in dose,β, set to 0 (a = attained age, e = age at exposure).
f EAR = α [D+βD2] [a – e]κ aτ, as per model (16) (a = attained age, e = age at exposure).
Model, modifying terms a Sex Per cent excess
cancer deaths (Sv –1)
Per cent radiation-induced cancer deaths
(Sv–1)
Years life lost (a Sv–1)
Years life lost/radiation-induced cancer death (a)
China
ERR, D, sex, age, years SE b Males
Females
Both
4.52
5.48
4.99
5.33
6.03
5.67
0.747
0.976
0.859
14.0
16.2
15.1
ERR, D, sex, age AE c Males
Females
Both
6.10
8.50
7.28
7.13
9.30
8.19
0.874
1.306
1.086
12.3
14.0
13.3
ERR, D + D2, sex, age, years SE d Males
Females
Both
3.12
4.01
3.55
3.67
4.41
4.03
0.515
0.714
0.612
14.0
16.2
15.2
EAR, D, age, years SE e Males
Females
Both
4.68
6.14
5.40
5.49
6.71
6.09
0.752
0.964
0.856
13.7
14.4
14.1
EAR, D + D2, age, years SE f Males
Females
Both
3.09
4.05
3.56
3.63
4.43
4.02
0.498
0.638
0.566
13.7
14.4
14.1
Japan
ERR, D, sex, age, years SE b Males
Females
Both
5.03
6.13
5.59
6.31
7.03
6.67
0.836
1.135
0.988
13.2
16.2
14.8
ERR, D, sex, age AE c Males
Females
Both
7.29
10.42
8.88
9.07
11.86
10.49
1.075
1.660
1.372
11.9
14.0
13.1
ERR, D + D2, sex, age, years SE d Males
Females
Both
3.46
4.48
3.98
4.35
5.14
4.75
0.576
0.830
0.705
13.2
16.2
14.8
UNSCEAR REPORT-PART 4.qxp 10/7/08 3:39 pm Page 225
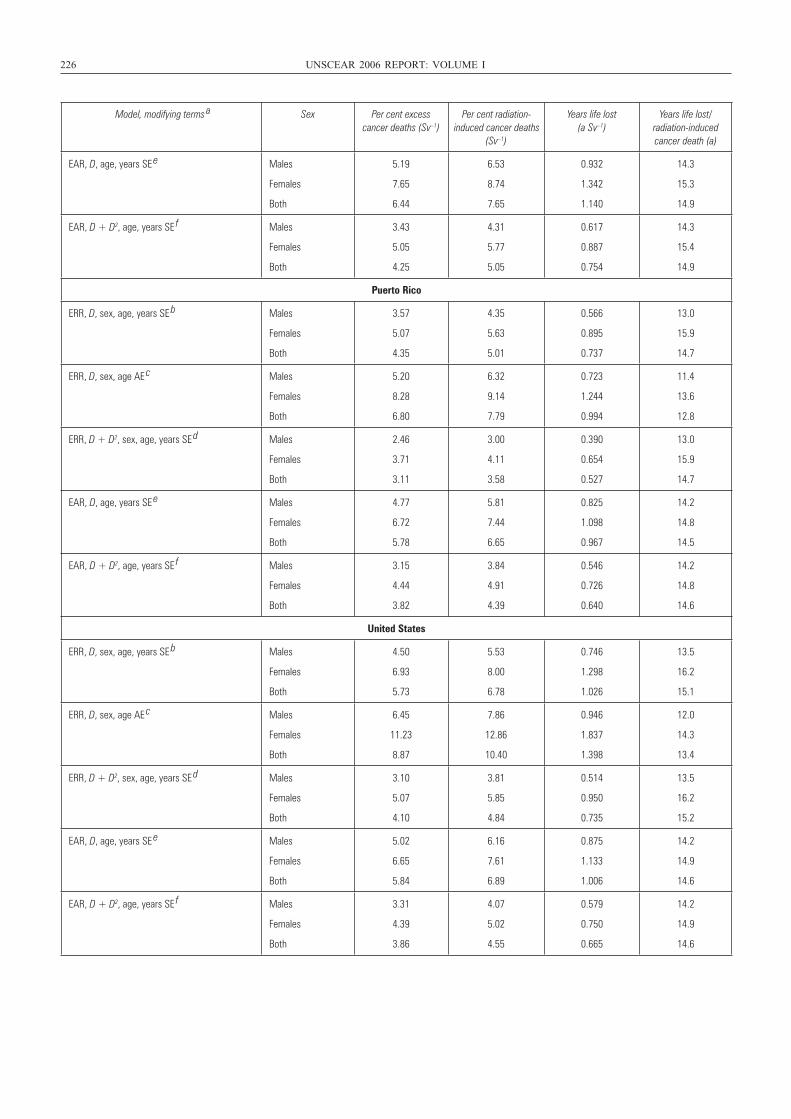
226 UNSCEAR 2006 REPORT: VOLUME I
Model, modifying terms a Sex Per cent excess
cancer deaths (Sv–1)Per cent radiation-
induced cancer deaths (Sv–1)
Years life lost (a Sv–1)
Years life lost/radiation-induced cancer death (a)
EAR, D, age, years SE e Males
Females
Both
5.19
7.65
6.44
6.53
8.74
7.65
0.932
1.342
1.140
14.3
15.3
14.9
EAR, D + D2, age, years SE f Males
Females
Both
3.43
5.05
4.25
4.31
5.77
5.05
0.617
0.887
0.754
14.3
15.4
14.9
Puerto Rico
ERR, D, sex, age, years SE b Males
Females
Both
3.57
5.07
4.35
4.35
5.63
5.01
0.566
0.895
0.737
13.0
15.9
14.7
ERR, D, sex, age AE c Males
Females
Both
5.20
8.28
6.80
6.32
9.14
7.79
0.723
1.244
0.994
11.4
13.6
12.8
ERR, D + D2, sex, age, years SE d Males
Females
Both
2.46
3.71
3.11
3.00
4.11
3.58
0.390
0.654
0.527
13.0
15.9
14.7
EAR, D, age, years SE e Males
Females
Both
4.77
6.72
5.78
5.81
7.44
6.65
0.825
1.098
0.967
14.2
14.8
14.5
EAR, D + D2, age, years SE f Males
Females
Both
3.15
4.44
3.82
3.84
4.91
4.39
0.546
0.726
0.640
14.2
14.8
14.6
United States
ERR, D, sex, age, years SE b Males
Females
Both
4.50
6.93
5.73
5.53
8.00
6.78
0.746
1.298
1.026
13.5
16.2
15.1
ERR, D, sex, age AE c Males
Females
Both
6.45
11.23
8.87
7.86
12.86
10.40
0.946
1.837
1.398
12.0
14.3
13.4
ERR, D + D2, sex, age, years SE d Males
Females
Both
3.10
5.07
4.10
3.81
5.85
4.84
0.514
0.950
0.735
13.5
16.2
15.2
EAR, D, age, years SE e Males
Females
Both
5.02
6.65
5.84
6.16
7.61
6.89
0.875
1.133
1.006
14.2
14.9
14.6
EAR, D + D2, age, years SE f Males
Females
Both
3.31
4.39
3.86
4.07
5.02
4.55
0.579
0.750
0.665
14.2
14.9
14.6
UNSCEAR REPORT-PART 4.qxp 10/7/08 3:39 pm Page 226
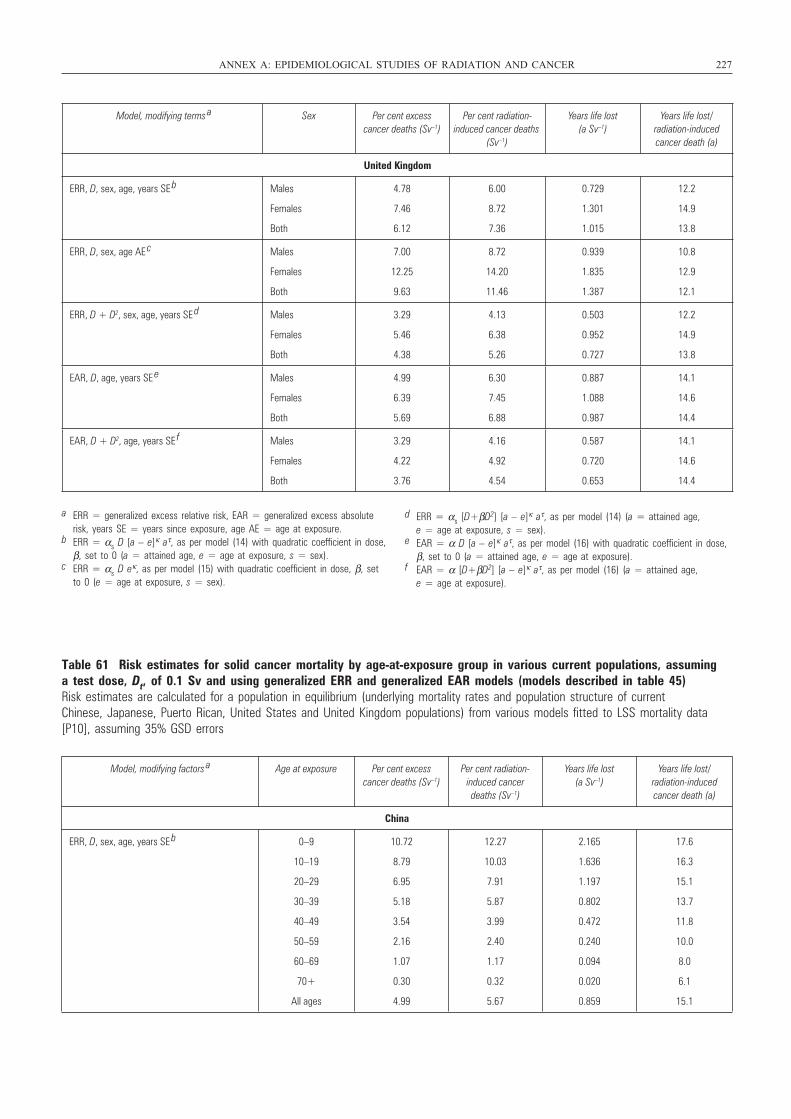
Table 61 Risk estimates for solid cancer mortality by age-at-exposure group in various current populations, assuming a test dose, Dt, of 0.1 Sv and using generalized ERR and generalized EAR models (models described in table 45)Risk estimates are calculated for a population in equilibrium (underlying mortality rates and population structure of current Chinese, Japanese, Puerto Rican, United States and United Kingdom populations) from various models fitted to LSS mortality data[P10], assuming 35% GSD errors
ANNEX A: EPIDEMIOLOGICAL STUDIES OF RADIATION AND CANCER 227
Model, modifying terms a Sex Per cent excess
cancer deaths (Sv–1)Per cent radiation-
induced cancer deaths (Sv–1)
Years life lost (a Sv–1)
Years life lost/radiation-induced cancer death (a)
United Kingdom
ERR, D, sex, age, years SE b Males
Females
Both
4.78
7.46
6.12
6.00
8.72
7.36
0.729
1.301
1.015
12.2
14.9
13.8
ERR, D, sex, age AE c Males
Females
Both
7.00
12.25
9.63
8.72
14.20
11.46
0.939
1.835
1.387
10.8
12.9
12.1
ERR, D + D2, sex, age, years SE d Males
Females
Both
3.29
5.46
4.38
4.13
6.38
5.26
0.503
0.952
0.727
12.2
14.9
13.8
EAR, D, age, years SE e Males
Females
Both
4.99
6.39
5.69
6.30
7.45
6.88
0.887
1.088
0.987
14.1
14.6
14.4
EAR, D + D2, age, years SE f Males
Females
Both
3.29
4.22
3.76
4.16
4.92
4.54
0.587
0.720
0.653
14.1
14.6
14.4
a ERR = generalized excess relative risk, EAR = generalized excess absoluterisk, years SE = years since exposure, age AE = age at exposure.
b ERR = αs D [a – e]κ aτ, as per model (14) with quadratic coefficient in dose,β, set to 0 (a = attained age, e = age at exposure, s = sex).
c ERR = αs D eκ, as per model (15) with quadratic coefficient in dose, β, setto 0 (e = age at exposure, s = sex).
d ERR = αs [D+βD2] [a – e]κ aτ, as per model (14) (a = attained age, e = age at exposure, s = sex).
e EAR = α D [a – e]κ aτ, as per model (16) with quadratic coefficient in dose,β, set to 0 (a = attained age, e = age at exposure).
f EAR = α [D+βD2] [a – e]κ aτ, as per model (16) (a = attained age, e = age at exposure).
Model, modifying factors a Age at exposure Per cent excess
cancer deaths (Sv–1)Per cent radiation-
induced cancer deaths (Sv–1)
Years life lost (a Sv–1)
Years life lost/radiation-induced cancer death (a)
China
ERR, D, sex, age, years SE b 0–9
10–19
20–29
30–39
40–49
50–59
60–69
70+
All ages
10.72
8.79
6.95
5.18
3.54
2.16
1.07
0.30
4.99
12.27
10.03
7.91
5.87
3.99
2.40
1.17
0.32
5.67
2.165
1.636
1.197
0.802
0.472
0.240
0.094
0.020
0.859
17.6
16.3
15.1
13.7
11.8
10.0
8.0
6.1
15.1
UNSCEAR REPORT-PART 4.qxp 10/7/08 3:39 pm Page 227
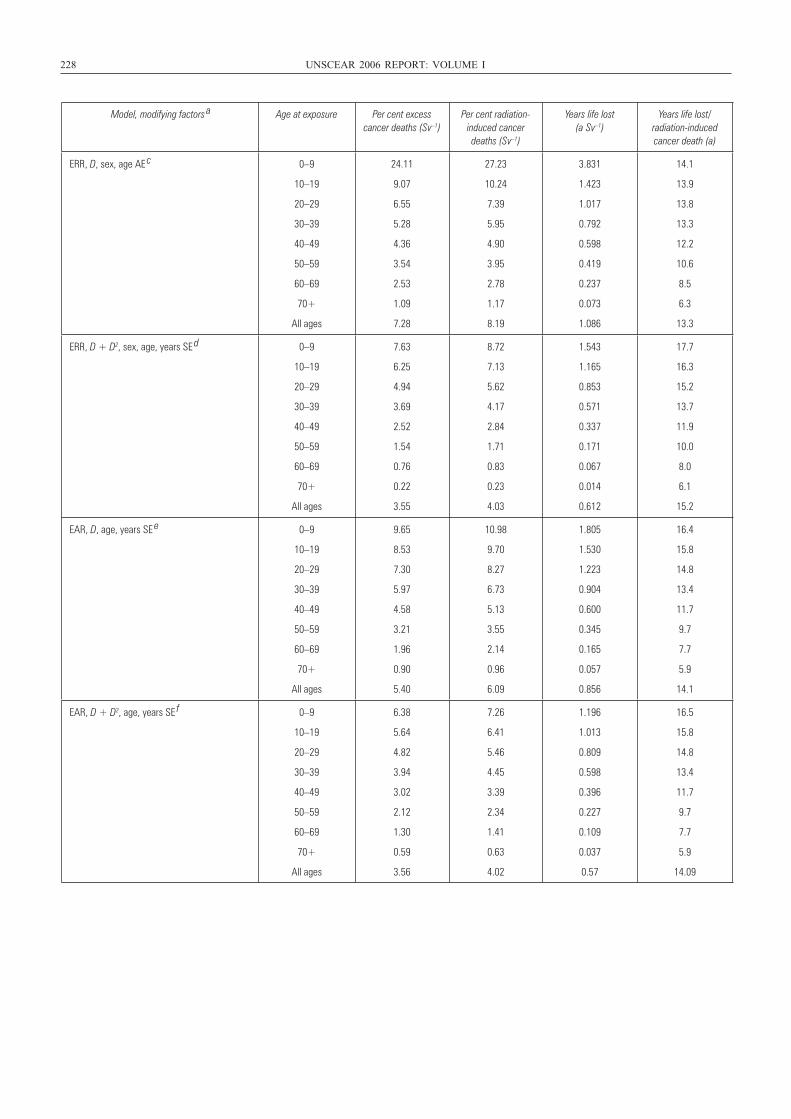
228 UNSCEAR 2006 REPORT: VOLUME I
Model, modifying factors a Age at exposure Per cent excess
cancer deaths (Sv–1)Per cent radiation-
induced cancer deaths (Sv–1)
Years life lost (a Sv–1)
Years life lost/radiation-induced cancer death (a)
ERR, D, sex, age AE c 0–9
10–19
20–29
30–39
40–49
50–59
60–69
70+
All ages
24.11
9.07
6.55
5.28
4.36
3.54
2.53
1.09
7.28
27.23
10.24
7.39
5.95
4.90
3.95
2.78
1.17
8.19
3.831
1.423
1.017
0.792
0.598
0.419
0.237
0.073
1.086
14.1
13.9
13.8
13.3
12.2
10.6
8.5
6.3
13.3
ERR, D + D2, sex, age, years SE d 0–9
10–19
20–29
30–39
40–49
50–59
60–69
70+
All ages
7.63
6.25
4.94
3.69
2.52
1.54
0.76
0.22
3.55
8.72
7.13
5.62
4.17
2.84
1.71
0.83
0.23
4.03
1.543
1.165
0.853
0.571
0.337
0.171
0.067
0.014
0.612
17.7
16.3
15.2
13.7
11.9
10.0
8.0
6.1
15.2
EAR, D, age, years SE e 0–9
10–19
20–29
30–39
40–49
50–59
60–69
70+
All ages
9.65
8.53
7.30
5.97
4.58
3.21
1.96
0.90
5.40
10.98
9.70
8.27
6.73
5.13
3.55
2.14
0.96
6.09
1.805
1.530
1.223
0.904
0.600
0.345
0.165
0.057
0.856
16.4
15.8
14.8
13.4
11.7
9.7
7.7
5.9
14.1
EAR, D + D2, age, years SE f 0–9
10–19
20–29
30–39
40–49
50–59
60–69
70+
All ages
6.38
5.64
4.82
3.94
3.02
2.12
1.30
0.59
3.56
7.26
6.41
5.46
4.45
3.39
2.34
1.41
0.63
4.02
1.196
1.013
0.809
0.598
0.396
0.227
0.109
0.037
0.57
16.5
15.8
14.8
13.4
11.7
9.7
7.7
5.9
14.09
UNSCEAR REPORT-PART 4.qxp 10/7/08 3:39 pm Page 228
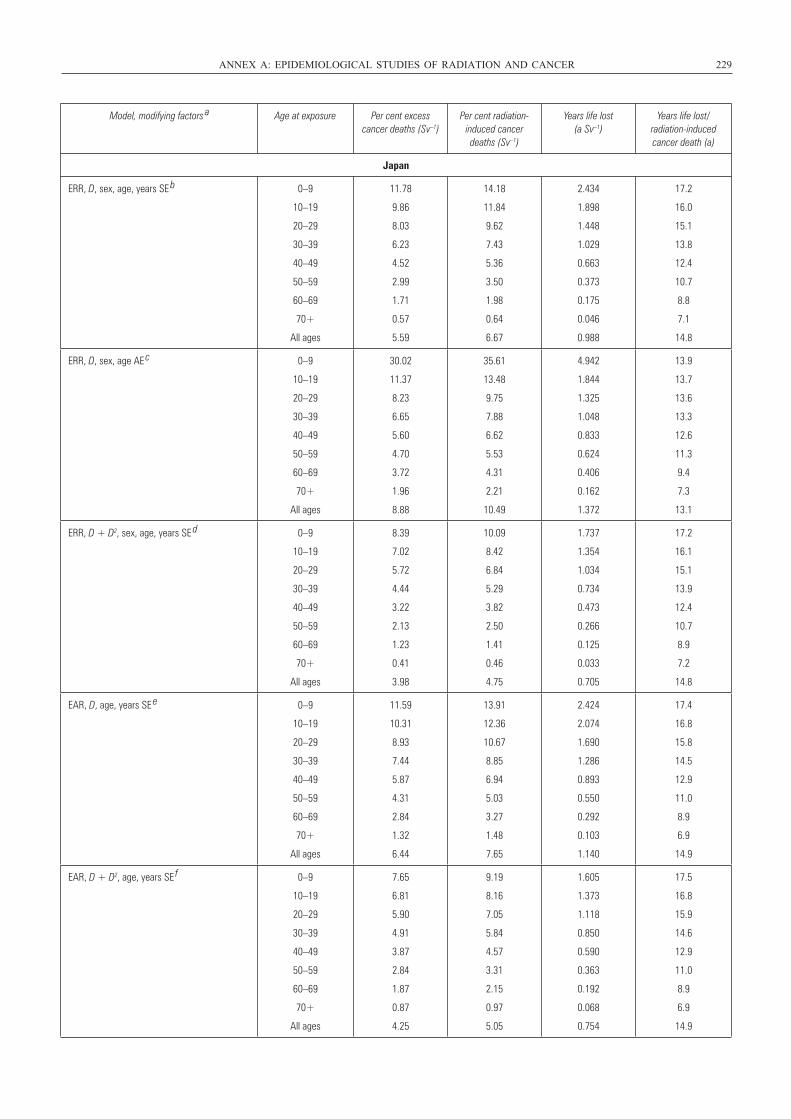
ANNEX A: EPIDEMIOLOGICAL STUDIES OF RADIATION AND CANCER 229
Model, modifying factors a Age at exposure Per cent excess
cancer deaths (Sv–1)Per cent radiation-
induced cancer deaths (Sv–1)
Years life lost (a Sv–1)
Years life lost/radiation-induced cancer death (a)
Japan
ERR, D, sex, age, years SE b 0–9
10–19
20–29
30–39
40–49
50–59
60–69
70+
All ages
11.78
9.86
8.03
6.23
4.52
2.99
1.71
0.57
5.59
14.18
11.84
9.62
7.43
5.36
3.50
1.98
0.64
6.67
2.434
1.898
1.448
1.029
0.663
0.373
0.175
0.046
0.988
17.2
16.0
15.1
13.8
12.4
10.7
8.8
7.1
14.8
ERR, D, sex, age AE c 0–9
10–19
20–29
30–39
40–49
50–59
60–69
70+
All ages
30.02
11.37
8.23
6.65
5.60
4.70
3.72
1.96
8.88
35.61
13.48
9.75
7.88
6.62
5.53
4.31
2.21
10.49
4.942
1.844
1.325
1.048
0.833
0.624
0.406
0.162
1.372
13.9
13.7
13.6
13.3
12.6
11.3
9.4
7.3
13.1
ERR, D + D2, sex, age, years SE d 0–9
10–19
20–29
30–39
40–49
50–59
60–69
70+
All ages
8.39
7.02
5.72
4.44
3.22
2.13
1.23
0.41
3.98
10.09
8.42
6.84
5.29
3.82
2.50
1.41
0.46
4.75
1.737
1.354
1.034
0.734
0.473
0.266
0.125
0.033
0.705
17.2
16.1
15.1
13.9
12.4
10.7
8.9
7.2
14.8
EAR, D, age, years SE e 0–9
10–19
20–29
30–39
40–49
50–59
60–69
70+
All ages
11.59
10.31
8.93
7.44
5.87
4.31
2.84
1.32
6.44
13.91
12.36
10.67
8.85
6.94
5.03
3.27
1.48
7.65
2.424
2.074
1.690
1.286
0.893
0.550
0.292
0.103
1.140
17.4
16.8
15.8
14.5
12.9
11.0
8.9
6.9
14.9
EAR, D + D2, age, years SE f 0–9
10–19
20–29
30–39
40–49
50–59
60–69
70+
All ages
7.65
6.81
5.90
4.91
3.87
2.84
1.87
0.87
4.25
9.19
8.16
7.05
5.84
4.57
3.31
2.15
0.97
5.05
1.605
1.373
1.118
0.850
0.590
0.363
0.192
0.068
0.754
17.5
16.8
15.9
14.6
12.9
11.0
8.9
6.9
14.9
UNSCEAR REPORT-PART 4.qxp 10/7/08 3:39 pm Page 229
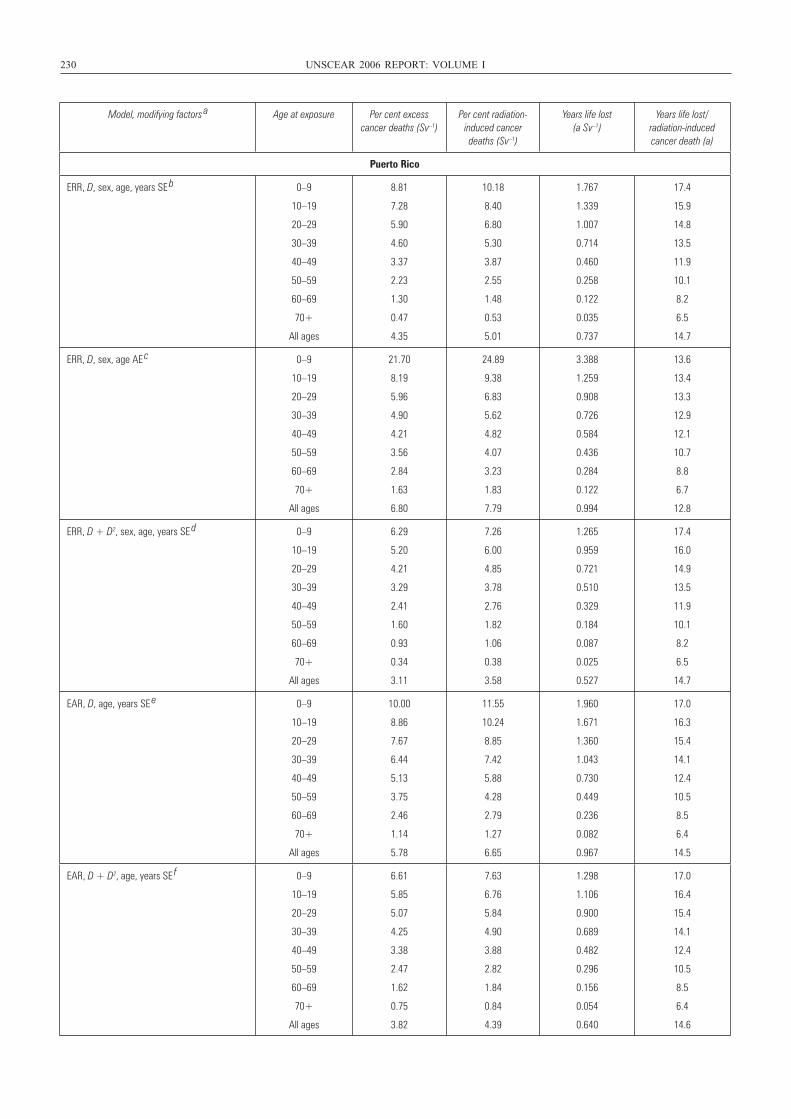
230 UNSCEAR 2006 REPORT: VOLUME I
Model, modifying factors a Age at exposure Per cent excess
cancer deaths (Sv–1)Per cent radiation-
induced cancer deaths (Sv–1)
Years life lost (a Sv–1)
Years life lost/radiation-induced cancer death (a)
Puerto Rico
ERR, D, sex, age, years SE b 0–9
10–19
20–29
30–39
40–49
50–59
60–69
70+
All ages
8.81
7.28
5.90
4.60
3.37
2.23
1.30
0.47
4.35
10.18
8.40
6.80
5.30
3.87
2.55
1.48
0.53
5.01
1.767
1.339
1.007
0.714
0.460
0.258
0.122
0.035
0.737
17.4
15.9
14.8
13.5
11.9
10.1
8.2
6.5
14.7
ERR, D, sex, age AE c 0–9
10–19
20–29
30–39
40–49
50–59
60–69
70+
All ages
21.70
8.19
5.96
4.90
4.21
3.56
2.84
1.63
6.80
24.89
9.38
6.83
5.62
4.82
4.07
3.23
1.83
7.79
3.388
1.259
0.908
0.726
0.584
0.436
0.284
0.122
0.994
13.6
13.4
13.3
12.9
12.1
10.7
8.8
6.7
12.8
ERR, D + D2, sex, age, years SE d 0–9
10–19
20–29
30–39
40–49
50–59
60–69
70+
All ages
6.29
5.20
4.21
3.29
2.41
1.60
0.93
0.34
3.11
7.26
6.00
4.85
3.78
2.76
1.82
1.06
0.38
3.58
1.265
0.959
0.721
0.510
0.329
0.184
0.087
0.025
0.527
17.4
16.0
14.9
13.5
11.9
10.1
8.2
6.5
14.7
EAR, D, age, years SE e 0–9
10–19
20–29
30–39
40–49
50–59
60–69
70+
All ages
10.00
8.86
7.67
6.44
5.13
3.75
2.46
1.14
5.78
11.55
10.24
8.85
7.42
5.88
4.28
2.79
1.27
6.65
1.960
1.671
1.360
1.043
0.730
0.449
0.236
0.082
0.967
17.0
16.3
15.4
14.1
12.4
10.5
8.5
6.4
14.5
EAR, D + D2, age, years SE f 0–9
10–19
20–29
30–39
40–49
50–59
60–69
70+
All ages
6.61
5.85
5.07
4.25
3.38
2.47
1.62
0.75
3.82
7.63
6.76
5.84
4.90
3.88
2.82
1.84
0.84
4.39
1.298
1.106
0.900
0.689
0.482
0.296
0.156
0.054
0.640
17.0
16.4
15.4
14.1
12.4
10.5
8.5
6.4
14.6
UNSCEAR REPORT-PART 4.qxp 10/7/08 3:39 pm Page 230
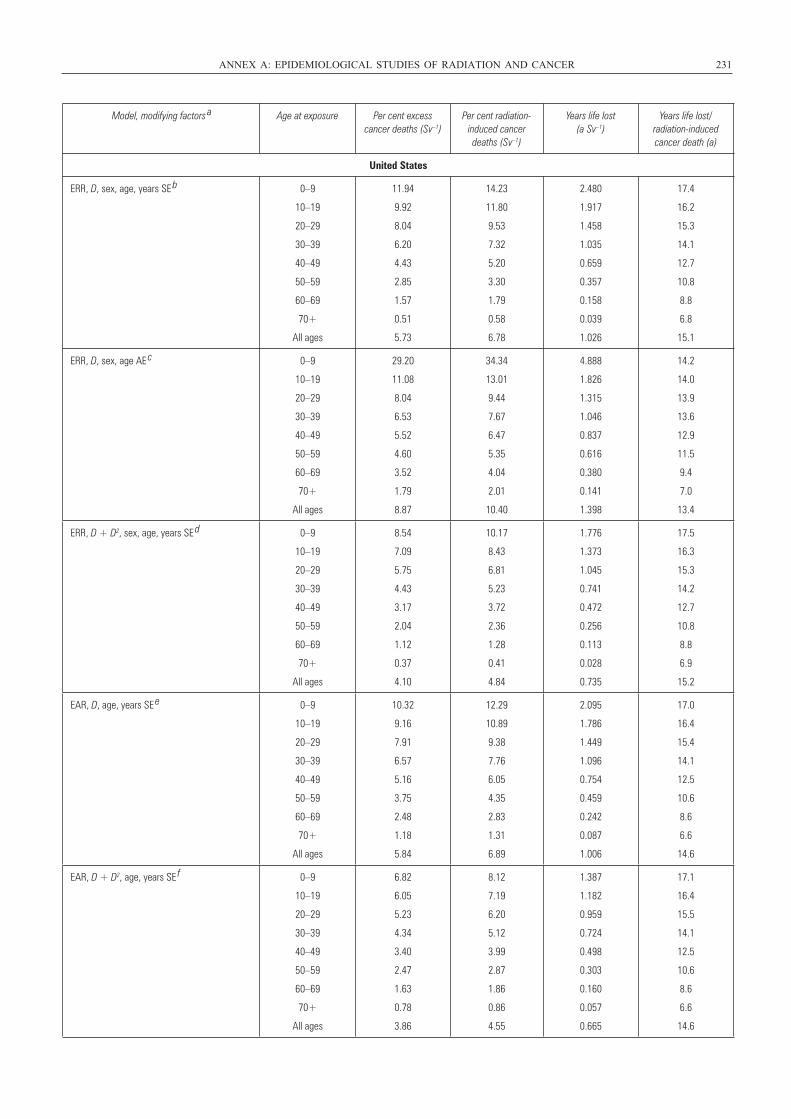
ANNEX A: EPIDEMIOLOGICAL STUDIES OF RADIATION AND CANCER 231
Model, modifying factors a Age at exposure Per cent excess
cancer deaths (Sv–1)Per cent radiation-
induced cancer deaths (Sv–1)
Years life lost (a Sv–1)
Years life lost/radiation-induced cancer death (a)
United States
ERR, D, sex, age, years SE b 0–9
10–19
20–29
30–39
40–49
50–59
60–69
70+
All ages
11.94
9.92
8.04
6.20
4.43
2.85
1.57
0.51
5.73
14.23
11.80
9.53
7.32
5.20
3.30
1.79
0.58
6.78
2.480
1.917
1.458
1.035
0.659
0.357
0.158
0.039
1.026
17.4
16.2
15.3
14.1
12.7
10.8
8.8
6.8
15.1
ERR, D, sex, age AE c 0–9
10–19
20–29
30–39
40–49
50–59
60–69
70+
All ages
29.20
11.08
8.04
6.53
5.52
4.60
3.52
1.79
8.87
34.34
13.01
9.44
7.67
6.47
5.35
4.04
2.01
10.40
4.888
1.826
1.315
1.046
0.837
0.616
0.380
0.141
1.398
14.2
14.0
13.9
13.6
12.9
11.5
9.4
7.0
13.4
ERR, D + D2, sex, age, years SE d 0–9
10–19
20–29
30–39
40–49
50–59
60–69
70+
All ages
8.54
7.09
5.75
4.43
3.17
2.04
1.12
0.37
4.10
10.17
8.43
6.81
5.23
3.72
2.36
1.28
0.41
4.84
1.776
1.373
1.045
0.741
0.472
0.256
0.113
0.028
0.735
17.5
16.3
15.3
14.2
12.7
10.8
8.8
6.9
15.2
EAR, D, age, years SE e 0–9
10–19
20–29
30–39
40–49
50–59
60–69
70+
All ages
10.32
9.16
7.91
6.57
5.16
3.75
2.48
1.18
5.84
12.29
10.89
9.38
7.76
6.05
4.35
2.83
1.31
6.89
2.095
1.786
1.449
1.096
0.754
0.459
0.242
0.087
1.006
17.0
16.4
15.4
14.1
12.5
10.6
8.6
6.6
14.6
EAR, D + D2, age, years SE f 0–9
10–19
20–29
30–39
40–49
50–59
60–69
70+
All ages
6.82
6.05
5.23
4.34
3.40
2.47
1.63
0.78
3.86
8.12
7.19
6.20
5.12
3.99
2.87
1.86
0.86
4.55
1.387
1.182
0.959
0.724
0.498
0.303
0.160
0.057
0.665
17.1
16.4
15.5
14.1
12.5
10.6
8.6
6.6
14.6
UNSCEAR REPORT-PART 4.qxp 10/7/08 3:39 pm Page 231
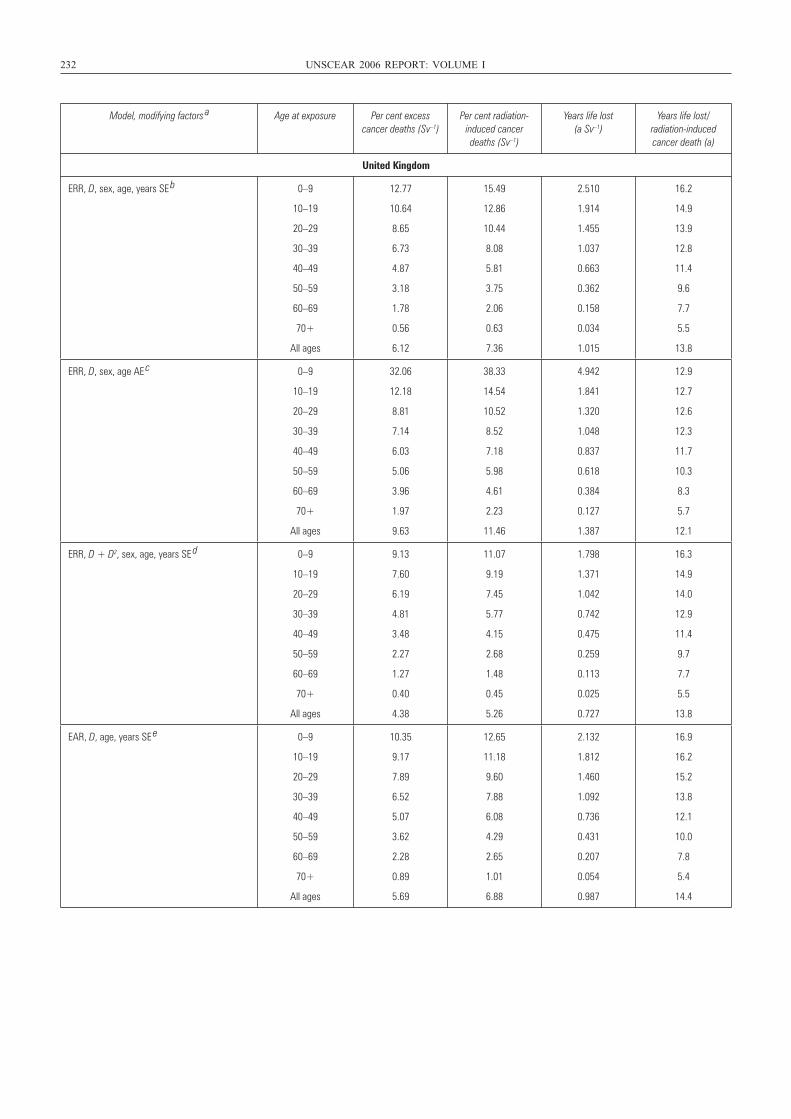
232 UNSCEAR 2006 REPORT: VOLUME I
Model, modifying factors a Age at exposure Per cent excess
cancer deaths (Sv–1)Per cent radiation-
induced cancer deaths (Sv–1)
Years life lost (a Sv–1)
Years life lost/radiation-induced cancer death (a)
United Kingdom
ERR, D, sex, age, years SE b 0–9
10–19
20–29
30–39
40–49
50–59
60–69
70+
All ages
12.77
10.64
8.65
6.73
4.87
3.18
1.78
0.56
6.12
15.49
12.86
10.44
8.08
5.81
3.75
2.06
0.63
7.36
2.510
1.914
1.455
1.037
0.663
0.362
0.158
0.034
1.015
16.2
14.9
13.9
12.8
11.4
9.6
7.7
5.5
13.8
ERR, D, sex, age AE c 0–9
10–19
20–29
30–39
40–49
50–59
60–69
70+
All ages
32.06
12.18
8.81
7.14
6.03
5.06
3.96
1.97
9.63
38.33
14.54
10.52
8.52
7.18
5.98
4.61
2.23
11.46
4.942
1.841
1.320
1.048
0.837
0.618
0.384
0.127
1.387
12.9
12.7
12.6
12.3
11.7
10.3
8.3
5.7
12.1
ERR, D + D2, sex, age, years SE d 0–9
10–19
20–29
30–39
40–49
50–59
60–69
70+
All ages
9.13
7.60
6.19
4.81
3.48
2.27
1.27
0.40
4.38
11.07
9.19
7.45
5.77
4.15
2.68
1.48
0.45
5.26
1.798
1.371
1.042
0.742
0.475
0.259
0.113
0.025
0.727
16.3
14.9
14.0
12.9
11.4
9.7
7.7
5.5
13.8
EAR, D, age, years SE e 0–9
10–19
20–29
30–39
40–49
50–59
60–69
70+
All ages
10.35
9.17
7.89
6.52
5.07
3.62
2.28
0.89
5.69
12.65
11.18
9.60
7.88
6.08
4.29
2.65
1.01
6.88
2.132
1.812
1.460
1.092
0.736
0.431
0.207
0.054
0.987
16.9
16.2
15.2
13.8
12.1
10.0
7.8
5.4
14.4
UNSCEAR REPORT-PART 4.qxp 10/7/08 3:39 pm Page 232
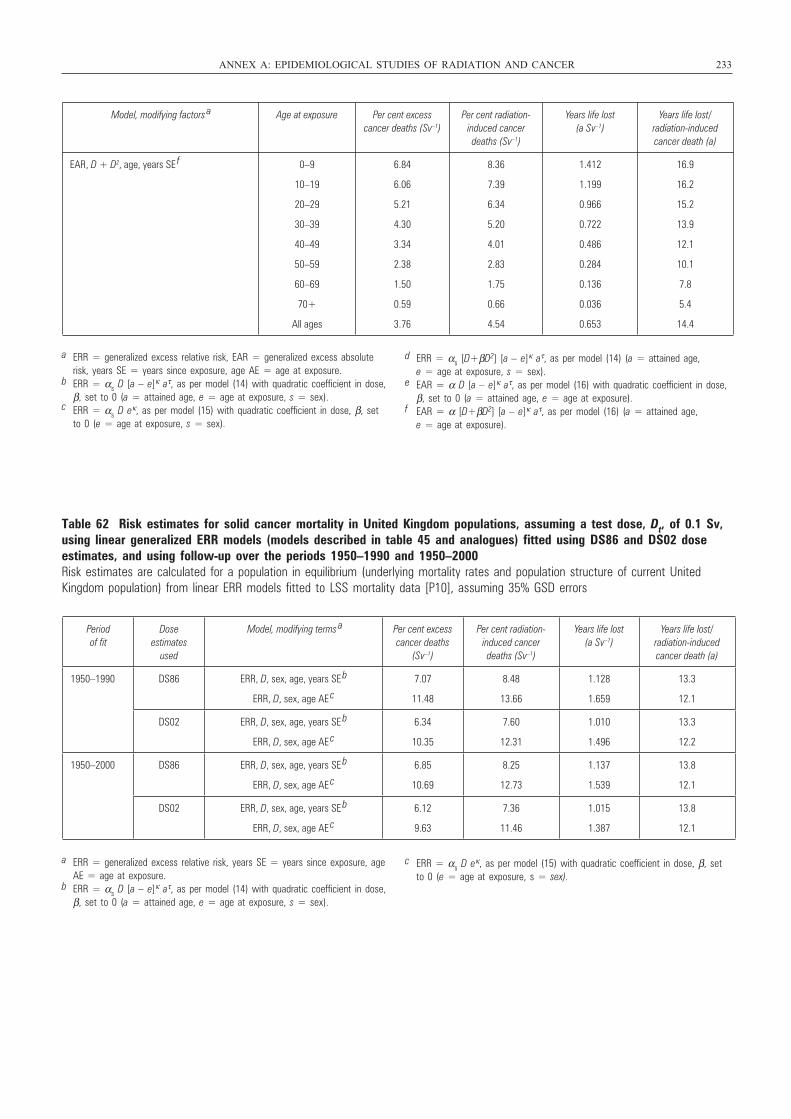
Table 62 Risk estimates for solid cancer mortality in United Kingdom populations, assuming a test dose, Dt, of 0.1 Sv,using linear generalized ERR models (models described in table 45 and analogues) fitted using DS86 and DS02 doseestimates, and using follow-up over the periods 1950–1990 and 1950–2000Risk estimates are calculated for a population in equilibrium (underlying mortality rates and population structure of current UnitedKingdom population) from linear ERR models fitted to LSS mortality data [P10], assuming 35% GSD errors
ANNEX A: EPIDEMIOLOGICAL STUDIES OF RADIATION AND CANCER 233
Model, modifying factors a Age at exposure Per cent excess
cancer deaths (Sv–1)Per cent radiation-
induced cancer deaths (Sv–1)
Years life lost (a Sv–1)
Years life lost/radiation-induced cancer death (a)
EAR, D + D2, age, years SE f 0–9
10–19
20–29
30–39
40–49
50–59
60–69
70+
All ages
6.84
6.06
5.21
4.30
3.34
2.38
1.50
0.59
3.76
8.36
7.39
6.34
5.20
4.01
2.83
1.75
0.66
4.54
1.412
1.199
0.966
0.722
0.486
0.284
0.136
0.036
0.653
16.9
16.2
15.2
13.9
12.1
10.1
7.8
5.4
14.4
a ERR = generalized excess relative risk, EAR = generalized excess absoluterisk, years SE = years since exposure, age AE = age at exposure.
b ERR = αs D [a – e]κ aτ, as per model (14) with quadratic coefficient in dose,β, set to 0 (a = attained age, e = age at exposure, s = sex).
c ERR = αs D eκ, as per model (15) with quadratic coefficient in dose, β, setto 0 (e = age at exposure, s = sex).
d ERR = αs [D+βD2] [a – e]κ aτ, as per model (14) (a = attained age, e = age at exposure, s = sex).
e EAR = α D [a – e]κ aτ, as per model (16) with quadratic coefficient in dose,β, set to 0 (a = attained age, e = age at exposure).
f EAR = α [D+βD2] [a – e]κ aτ, as per model (16) (a = attained age, e = age at exposure).
Period of fit
Dose estimates
used
Model, modifying terms a Per cent excess
cancer deaths (Sv–1)
Per cent radiation-induced cancer deaths (Sv–1)
Years life lost (a Sv–1)
Years life lost/radiation-induced cancer death (a)
1950–1990 DS86 ERR, D, sex, age, years SE b
ERR, D, sex, age AE c
7.07
11.48
8.48
13.66
1.128
1.659
13.3
12.1
DS02 ERR, D, sex, age, years SE b
ERR, D, sex, age AE c
6.34
10.35
7.60
12.31
1.010
1.496
13.3
12.2
1950–2000 DS86 ERR, D, sex, age, years SE b
ERR, D, sex, age AE c
6.85
10.69
8.25
12.73
1.137
1.539
13.8
12.1
DS02 ERR, D, sex, age, years SE b
ERR, D, sex, age AE c
6.12
9.63
7.36
11.46
1.015
1.387
13.8
12.1
a ERR = generalized excess relative risk, years SE = years since exposure, ageAE = age at exposure.
b ERR = αs D [a – e]κ aτ, as per model (14) with quadratic coefficient in dose,β, set to 0 (a = attained age, e = age at exposure, s = sex).
c ERR = αs D eκ, as per model (15) with quadratic coefficient in dose, β, setto 0 (e = age at exposure, s = sex).
UNSCEAR REPORT-PART 4.qxp 10/7/08 3:39 pm Page 233
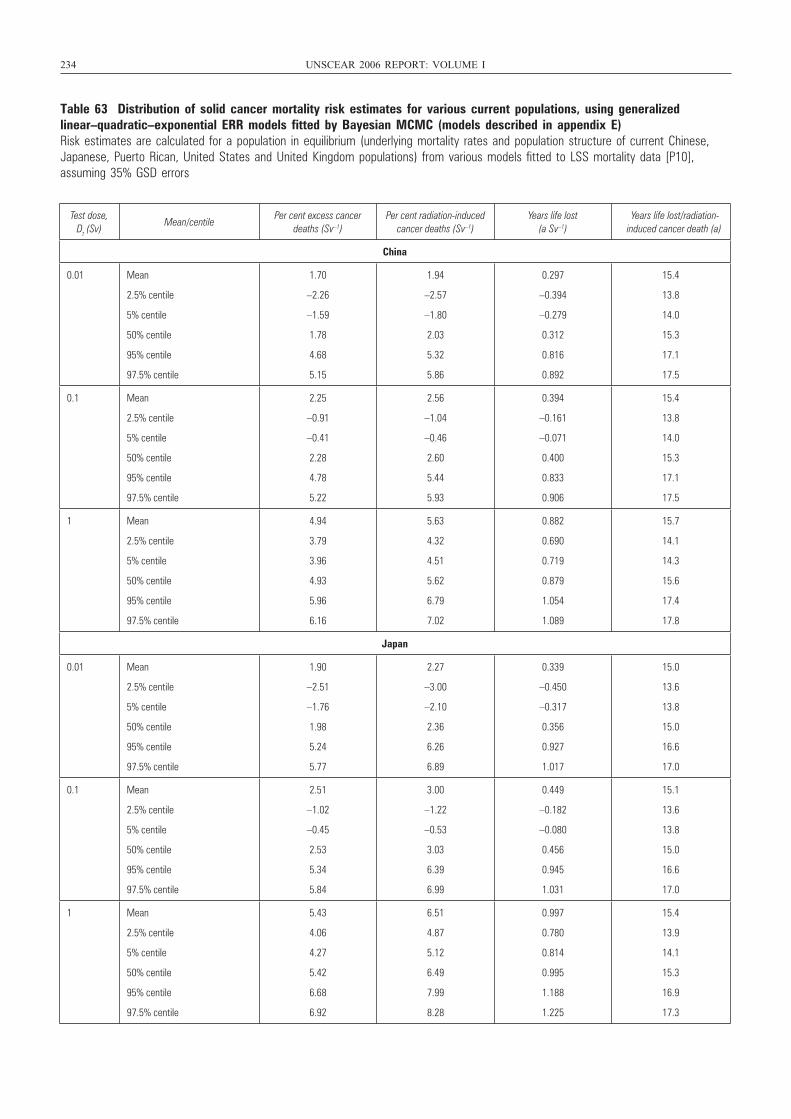
234 UNSCEAR 2006 REPORT: VOLUME I
Table 63 Distribution of solid cancer mortality risk estimates for various current populations, using generalizedlinear–quadratic–exponential ERR models fitted by Bayesian MCMC (models described in appendix E)Risk estimates are calculated for a population in equilibrium (underlying mortality rates and population structure of current Chinese,Japanese, Puerto Rican, United States and United Kingdom populations) from various models fitted to LSS mortality data [P10],assuming 35% GSD errors
Test dose, Dt (Sv)
Mean/centilePer cent excess cancer
deaths (Sv–1)Per cent radiation-induced
cancer deaths (Sv–1)Years life lost
(a Sv–1)Years life lost/radiation-
induced cancer death (a)
China
0.01 Mean
2.5% centile
5% centile
50% centile
95% centile
97.5% centile
1.70
–2.26
–1.59
1.78
4.68
5.15
1.94
–2.57
–1.80
2.03
5.32
5.86
0.297
–0.394
–0.279
0.312
0.816
0.892
15.4
13.8
14.0
15.3
17.1
17.5
0.1 Mean
2.5% centile
5% centile
50% centile
95% centile
97.5% centile
2.25
–0.91
–0.41
2.28
4.78
5.22
2.56
–1.04
–0.46
2.60
5.44
5.93
0.394
–0.161
–0.071
0.400
0.833
0.906
15.4
13.8
14.0
15.3
17.1
17.5
1 Mean
2.5% centile
5% centile
50% centile
95% centile
97.5% centile
4.94
3.79
3.96
4.93
5.96
6.16
5.63
4.32
4.51
5.62
6.79
7.02
0.882
0.690
0.719
0.879
1.054
1.089
15.7
14.1
14.3
15.6
17.4
17.8
Japan
0.01 Mean
2.5% centile
5% centile
50% centile
95% centile
97.5% centile
1.90
–2.51
–1.76
1.98
5.24
5.77
2.27
–3.00
–2.10
2.36
6.26
6.89
0.339
–0.450
–0.317
0.356
0.927
1.017
15.0
13.6
13.8
15.0
16.6
17.0
0.1 Mean
2.5% centile
5% centile
50% centile
95% centile
97.5% centile
2.51
–1.02
–0.45
2.53
5.34
5.84
3.00
–1.22
–0.53
3.03
6.39
6.99
0.449
–0.182
–0.080
0.456
0.945
1.031
15.1
13.6
13.8
15.0
16.6
17.0
1 Mean
2.5% centile
5% centile
50% centile
95% centile
97.5% centile
5.43
4.06
4.27
5.42
6.68
6.92
6.51
4.87
5.12
6.49
7.99
8.28
0.997
0.780
0.814
0.995
1.188
1.225
15.4
13.9
14.1
15.3
16.9
17.3
UNSCEAR REPORT-PART 4.qxp 10/7/08 3:39 pm Page 234
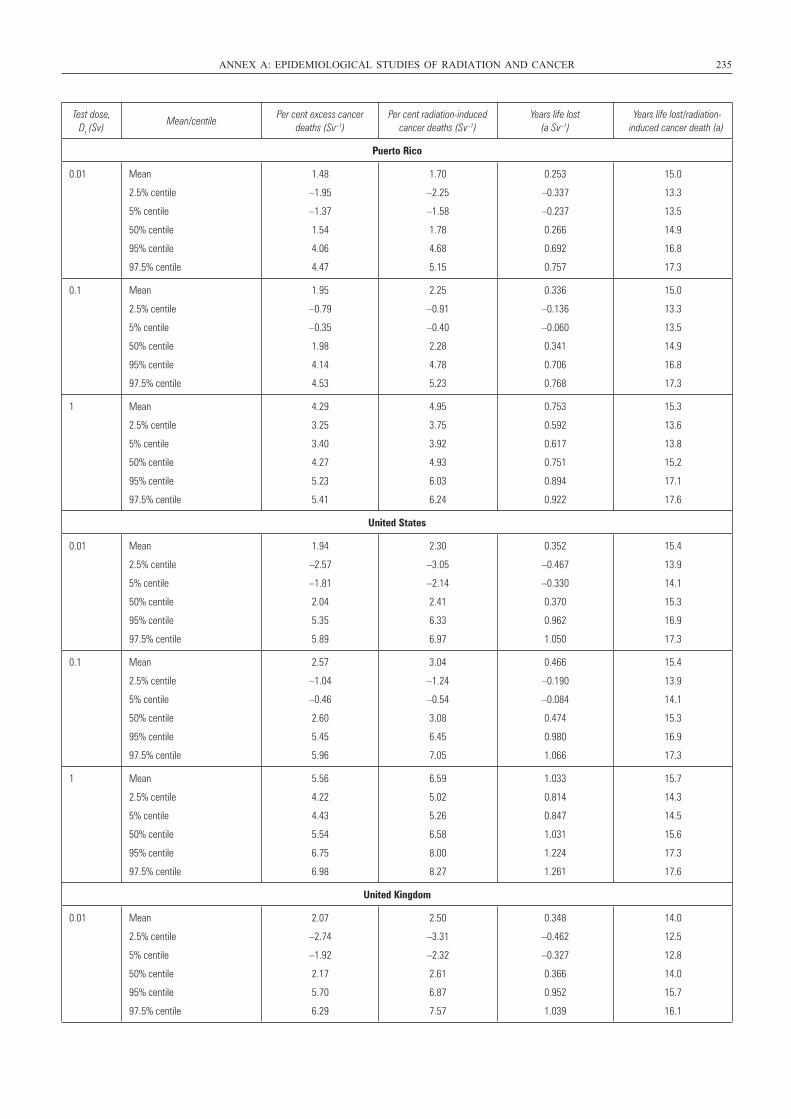
ANNEX A: EPIDEMIOLOGICAL STUDIES OF RADIATION AND CANCER 235
Test dose, Dt (Sv)
Mean/centilePer cent excess cancer
deaths (Sv–1)Per cent radiation-induced
cancer deaths (Sv–1)Years life lost
(a Sv–1)Years life lost/radiation-
induced cancer death (a)
Puerto Rico
0.01 Mean
2.5% centile
5% centile
50% centile
95% centile
97.5% centile
1.48
–1.95
–1.37
1.54
4.06
4.47
1.70
–2.25
–1.58
1.78
4.68
5.15
0.253
–0.337
–0.237
0.266
0.692
0.757
15.0
13.3
13.5
14.9
16.8
17.3
0.1 Mean
2.5% centile
5% centile
50% centile
95% centile
97.5% centile
1.95
–0.79
–0.35
1.98
4.14
4.53
2.25
–0.91
–0.40
2.28
4.78
5.23
0.336
–0.136
–0.060
0.341
0.706
0.768
15.0
13.3
13.5
14.9
16.8
17.3
1 Mean
2.5% centile
5% centile
50% centile
95% centile
97.5% centile
4.29
3.25
3.40
4.27
5.23
5.41
4.95
3.75
3.92
4.93
6.03
6.24
0.753
0.592
0.617
0.751
0.894
0.922
15.3
13.6
13.8
15.2
17.1
17.6
United States
0.01 Mean
2.5% centile
5% centile
50% centile
95% centile
97.5% centile
1.94
–2.57
–1.81
2.04
5.35
5.89
2.30
–3.05
–2.14
2.41
6.33
6.97
0.352
–0.467
–0.330
0.370
0.962
1.050
15.4
13.9
14.1
15.3
16.9
17.3
0.1 Mean
2.5% centile
5% centile
50% centile
95% centile
97.5% centile
2.57
–1.04
–0.46
2.60
5.45
5.96
3.04
–1.24
–0.54
3.08
6.45
7.05
0.466
–0.190
–0.084
0.474
0.980
1.066
15.4
13.9
14.1
15.3
16.9
17.3
1 Mean
2.5% centile
5% centile
50% centile
95% centile
97.5% centile
5.56
4.22
4.43
5.54
6.75
6.98
6.59
5.02
5.26
6.58
8.00
8.27
1.033
0.814
0.847
1.031
1.224
1.261
15.7
14.3
14.5
15.6
17.3
17.6
United Kingdom
0.01 Mean
2.5% centile
5% centile
50% centile
95% centile
97.5% centile
2.07
–2.74
–1.92
2.17
5.70
6.29
2.50
–3.31
–2.32
2.61
6.87
7.57
0.348
–0.462
–0.327
0.366
0.952
1.039
14.0
12.5
12.8
14.0
15.7
16.1
UNSCEAR REPORT-PART 4.qxp 10/7/08 3:39 pm Page 235
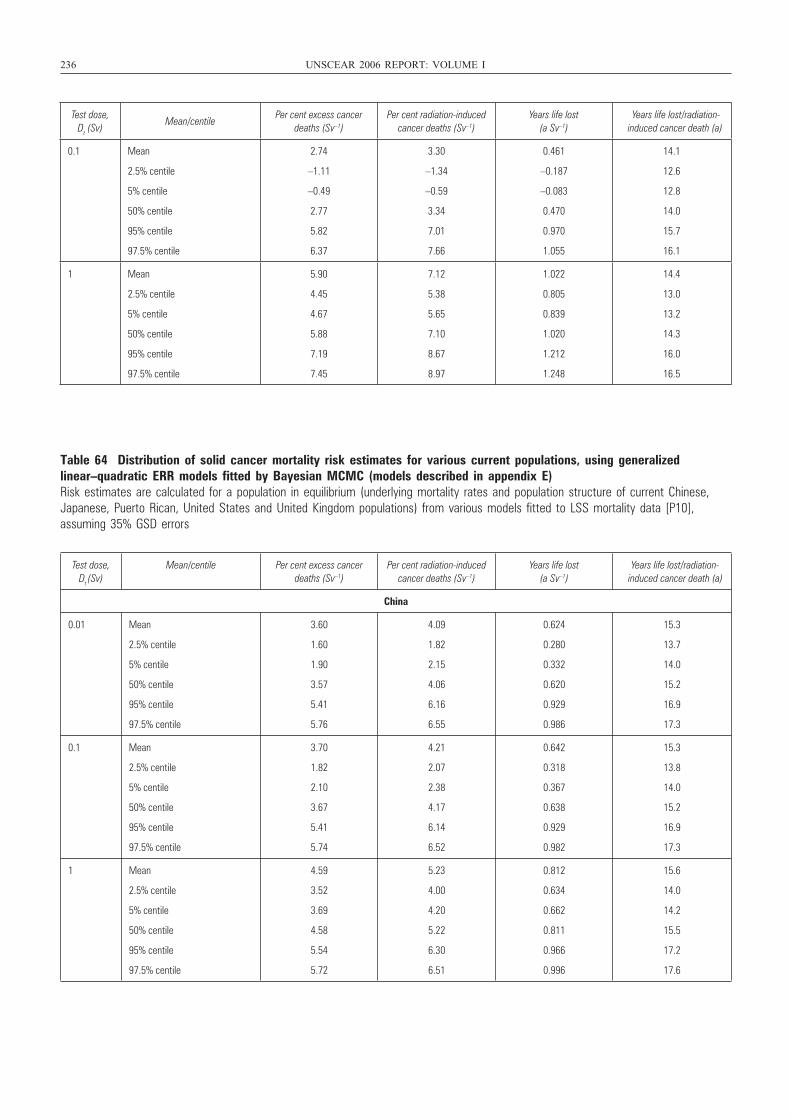
236 UNSCEAR 2006 REPORT: VOLUME I
Table 64 Distribution of solid cancer mortality risk estimates for various current populations, using generalizedlinear–quadratic ERR models fitted by Bayesian MCMC (models described in appendix E)Risk estimates are calculated for a population in equilibrium (underlying mortality rates and population structure of current Chinese,Japanese, Puerto Rican, United States and United Kingdom populations) from various models fitted to LSS mortality data [P10],assuming 35% GSD errors
Test dose, Dt (Sv)
Mean/centilePer cent excess cancer
deaths (Sv–1)Per cent radiation-induced
cancer deaths (Sv–1)Years life lost
(a Sv–1)Years life lost/radiation-
induced cancer death (a)
0.1 Mean
2.5% centile
5% centile
50% centile
95% centile
97.5% centile
2.74
–1.11
–0.49
2.77
5.82
6.37
3.30
–1.34
–0.59
3.34
7.01
7.66
0.461
–0.187
–0.083
0.470
0.970
1.055
14.1
12.6
12.8
14.0
15.7
16.1
1 Mean
2.5% centile
5% centile
50% centile
95% centile
97.5% centile
5.90
4.45
4.67
5.88
7.19
7.45
7.12
5.38
5.65
7.10
8.67
8.97
1.022
0.805
0.839
1.020
1.212
1.248
14.4
13.0
13.2
14.3
16.0
16.5
Test dose, Dt (Sv)
Mean/centile Per cent excess cancer deaths (Sv–1)
Per cent radiation-induced cancer deaths (Sv–1)
Years life lost (a Sv–1)
Years life lost/radiation-induced cancer death (a)
China
0.01 Mean
2.5% centile
5% centile
50% centile
95% centile
97.5% centile
3.60
1.60
1.90
3.57
5.41
5.76
4.09
1.82
2.15
4.06
6.16
6.55
0.624
0.280
0.332
0.620
0.929
0.986
15.3
13.7
14.0
15.2
16.9
17.3
0.1 Mean
2.5% centile
5% centile
50% centile
95% centile
97.5% centile
3.70
1.82
2.10
3.67
5.41
5.74
4.21
2.07
2.38
4.17
6.14
6.52
0.642
0.318
0.367
0.638
0.929
0.982
15.3
13.8
14.0
15.2
16.9
17.3
1 Mean
2.5% centile
5% centile
50% centile
95% centile
97.5% centile
4.59
3.52
3.69
4.58
5.54
5.72
5.23
4.00
4.20
5.22
6.30
6.51
0.812
0.634
0.662
0.811
0.966
0.996
15.6
14.0
14.2
15.5
17.2
17.6
UNSCEAR REPORT-PART 4.qxp 10/7/08 3:39 pm Page 236
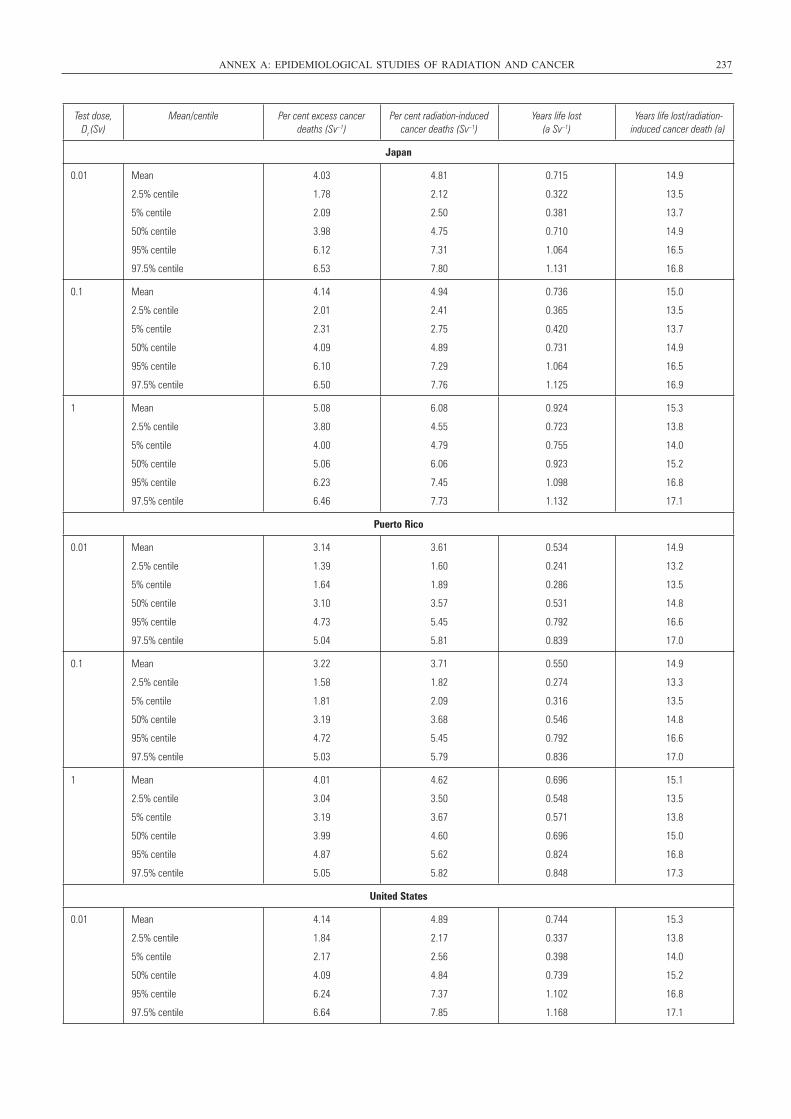
ANNEX A: EPIDEMIOLOGICAL STUDIES OF RADIATION AND CANCER 237
Test dose, Dt (Sv)
Mean/centile Per cent excess cancer deaths (Sv–1)
Per cent radiation-induced cancer deaths (Sv–1)
Years life lost (a Sv–1)
Years life lost/radiation-induced cancer death (a)
Japan
0.01 Mean
2.5% centile
5% centile
50% centile
95% centile
97.5% centile
4.03
1.78
2.09
3.98
6.12
6.53
4.81
2.12
2.50
4.75
7.31
7.80
0.715
0.322
0.381
0.710
1.064
1.131
14.9
13.5
13.7
14.9
16.5
16.8
0.1 Mean
2.5% centile
5% centile
50% centile
95% centile
97.5% centile
4.14
2.01
2.31
4.09
6.10
6.50
4.94
2.41
2.75
4.89
7.29
7.76
0.736
0.365
0.420
0.731
1.064
1.125
15.0
13.5
13.7
14.9
16.5
16.9
1 Mean
2.5% centile
5% centile
50% centile
95% centile
97.5% centile
5.08
3.80
4.00
5.06
6.23
6.46
6.08
4.55
4.79
6.06
7.45
7.73
0.924
0.723
0.755
0.923
1.098
1.132
15.3
13.8
14.0
15.2
16.8
17.1
Puerto Rico
0.01 Mean
2.5% centile
5% centile
50% centile
95% centile
97.5% centile
3.14
1.39
1.64
3.10
4.73
5.04
3.61
1.60
1.89
3.57
5.45
5.81
0.534
0.241
0.286
0.531
0.792
0.839
14.9
13.2
13.5
14.8
16.6
17.0
0.1 Mean
2.5% centile
5% centile
50% centile
95% centile
97.5% centile
3.22
1.58
1.81
3.19
4.72
5.03
3.71
1.82
2.09
3.68
5.45
5.79
0.550
0.274
0.316
0.546
0.792
0.836
14.9
13.3
13.5
14.8
16.6
17.0
1 Mean
2.5% centile
5% centile
50% centile
95% centile
97.5% centile
4.01
3.04
3.19
3.99
4.87
5.05
4.62
3.50
3.67
4.60
5.62
5.82
0.696
0.548
0.571
0.696
0.824
0.848
15.1
13.5
13.8
15.0
16.8
17.3
United States
0.01 Mean
2.5% centile
5% centile
50% centile
95% centile
97.5% centile
4.14
1.84
2.17
4.09
6.24
6.64
4.89
2.17
2.56
4.84
7.37
7.85
0.744
0.337
0.398
0.739
1.102
1.168
15.3
13.8
14.0
15.2
16.8
17.1
UNSCEAR REPORT-PART 4.qxp 10/7/08 3:39 pm Page 237
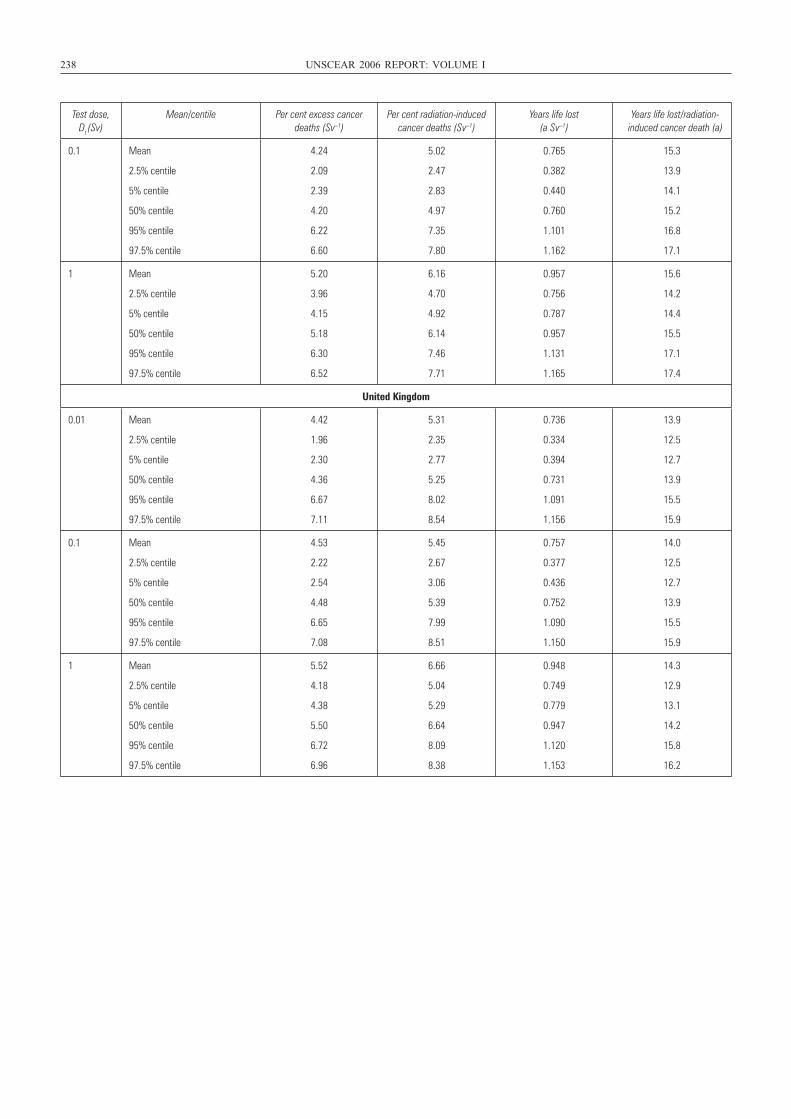
238 UNSCEAR 2006 REPORT: VOLUME I
Test dose, Dt (Sv)
Mean/centile Per cent excess cancer deaths (Sv–1)
Per cent radiation-induced cancer deaths (Sv–1)
Years life lost (a Sv–1)
Years life lost/radiation-induced cancer death (a)
0.1 Mean
2.5% centile
5% centile
50% centile
95% centile
97.5% centile
4.24
2.09
2.39
4.20
6.22
6.60
5.02
2.47
2.83
4.97
7.35
7.80
0.765
0.382
0.440
0.760
1.101
1.162
15.3
13.9
14.1
15.2
16.8
17.1
1 Mean
2.5% centile
5% centile
50% centile
95% centile
97.5% centile
5.20
3.96
4.15
5.18
6.30
6.52
6.16
4.70
4.92
6.14
7.46
7.71
0.957
0.756
0.787
0.957
1.131
1.165
15.6
14.2
14.4
15.5
17.1
17.4
United Kingdom
0.01 Mean
2.5% centile
5% centile
50% centile
95% centile
97.5% centile
4.42
1.96
2.30
4.36
6.67
7.11
5.31
2.35
2.77
5.25
8.02
8.54
0.736
0.334
0.394
0.731
1.091
1.156
13.9
12.5
12.7
13.9
15.5
15.9
0.1 Mean
2.5% centile
5% centile
50% centile
95% centile
97.5% centile
4.53
2.22
2.54
4.48
6.65
7.08
5.45
2.67
3.06
5.39
7.99
8.51
0.757
0.377
0.436
0.752
1.090
1.150
14.0
12.5
12.7
13.9
15.5
15.9
1 Mean
2.5% centile
5% centile
50% centile
95% centile
97.5% centile
5.52
4.18
4.38
5.50
6.72
6.96
6.66
5.04
5.29
6.64
8.09
8.38
0.948
0.749
0.779
0.947
1.120
1.153
14.3
12.9
13.1
14.2
15.8
16.2
UNSCEAR REPORT-PART 4.qxp 10/7/08 3:39 pm Page 238
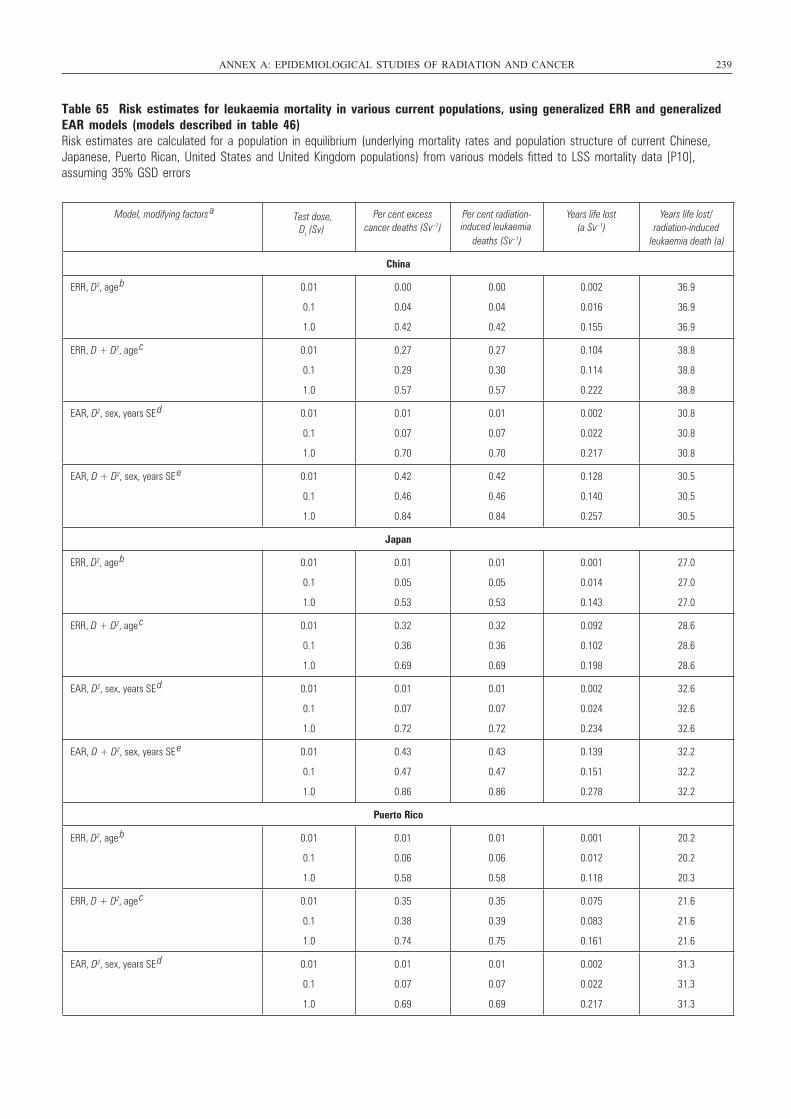
Table 65 Risk estimates for leukaemia mortality in various current populations, using generalized ERR and generalizedEAR models (models described in table 46)Risk estimates are calculated for a population in equilibrium (underlying mortality rates and population structure of current Chinese,Japanese, Puerto Rican, United States and United Kingdom populations) from various models fitted to LSS mortality data [P10], assuming 35% GSD errors
ANNEX A: EPIDEMIOLOGICAL STUDIES OF RADIATION AND CANCER 239
Model, modifying factors a Per cent excess
cancer deaths (Sv–1)Per cent radiation-
deaths (Sv–1)
Years life lost (a Sv–1)
Years life lost/radiation-induced
China
ERR, D2, age b 0.01
0.1
1.0
0.00
0.04
0.42
0.00
0.04
0.42
0.002
0.016
0.155
36.9
36.9
36.9
ERR, D + D2, age c 0.01
0.1
1.0
0.27
0.29
0.57
0.27
0.30
0.57
0.104
0.114
0.222
38.8
38.8
38.8
EAR, D2, sex, years SE d 0.01
0.1
1.0
0.01
0.07
0.70
0.01
0.07
0.70
0.002
0.022
0.217
30.8
30.8
30.8
EAR, D + D2, sex, years SE e 0.01
0.1
1.0
0.42
0.46
0.84
0.42
0.46
0.84
0.128
0.140
0.257
30.5
30.5
30.5
Japan
ERR, D2, age b 0.01
0.1
1.0
0.01
0.05
0.53
0.01
0.05
0.53
0.001
0.014
0.143
27.0
27.0
27.0
ERR, D + D2, age c 0.01
0.1
1.0
0.32
0.36
0.69
0.32
0.36
0.69
0.092
0.102
0.198
28.6
28.6
28.6
EAR, D2, sex, years SE d 0.01
0.1
1.0
0.01
0.07
0.72
0.01
0.07
0.72
0.002
0.024
0.234
32.6
32.6
32.6
EAR, D + D2, sex, years SE e 0.01
0.1
1.0
0.43
0.47
0.86
0.43
0.47
0.86
0.139
0.151
0.278
32.2
32.2
32.2
Puerto Rico
ERR, D2, age b 0.01
0.1
1.0
0.01
0.06
0.58
0.01
0.06
0.58
0.001
0.012
0.118
20.2
20.2
20.3
ERR, D + D2, age c 0.01
0.1
1.0
0.35
0.38
0.74
0.35
0.39
0.75
0.075
0.083
0.161
21.6
21.6
21.6
EAR, D2, sex, years SE d 0.01
0.1
1.0
0.01
0.07
0.69
0.01
0.07
0.69
0.002
0.022
0.217
31.3
31.3
31.3
Test dose,Dt (Sv) induced leukaemia
leukaemia death (a)
UNSCEAR REPORT-PART 4.qxp 10/7/08 3:39 pm Page 239
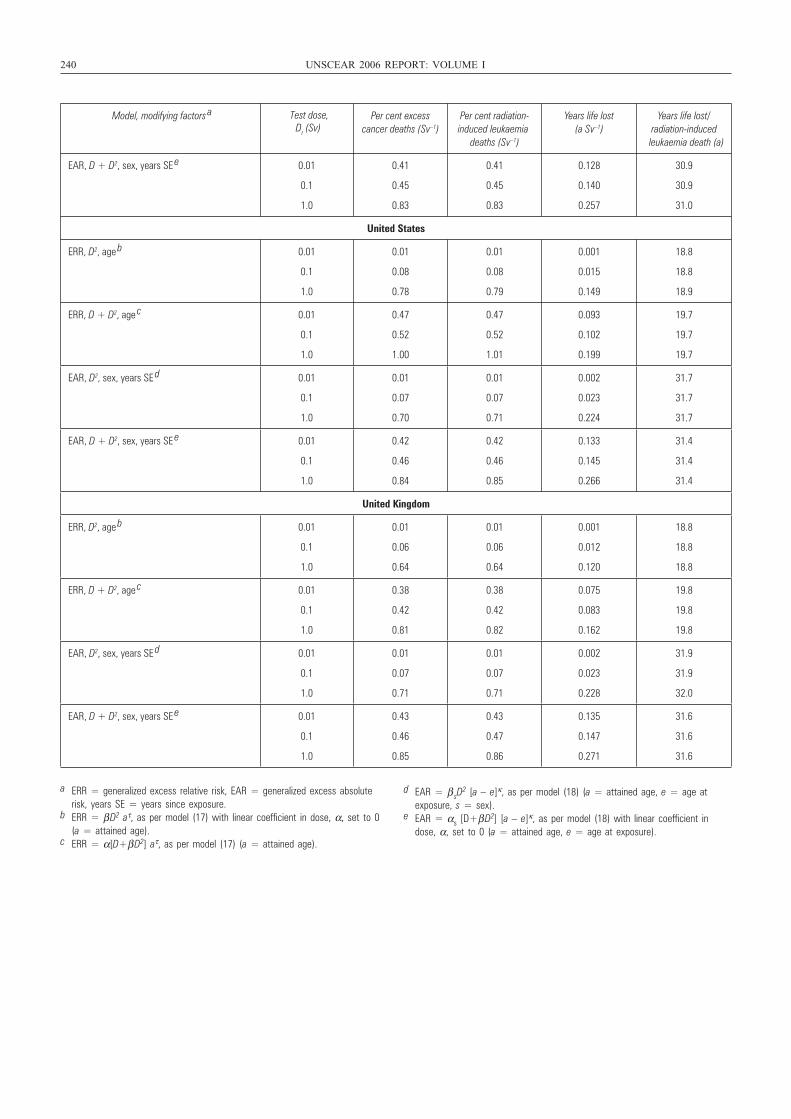
240 UNSCEAR 2006 REPORT: VOLUME I
Model, modifying factors a Test dose,
Dt (Sv) Per cent excess
cancer deaths (Sv–1)Per cent radiation-induced leukaemia
deaths (Sv–1)
Years life lost (a Sv–1)
Years life lost/radiation-induced leukaemia death (a)
EAR, D + D2, sex, years SE e 0.01
0.1
1.0
0.41
0.45
0.83
0.41
0.45
0.83
0.128
0.140
0.257
30.9
30.9
31.0
United States
ERR, D2, age b 0.01
0.1
1.0
0.01
0.08
0.78
0.01
0.08
0.79
0.001
0.015
0.149
18.8
18.8
18.9
ERR, D + D2, age c 0.01
0.1
1.0
0.47
0.52
1.00
0.47
0.52
1.01
0.093
0.102
0.199
19.7
19.7
19.7
EAR, D2, sex, years SE d 0.01
0.1
1.0
0.01
0.07
0.70
0.01
0.07
0.71
0.002
0.023
0.224
31.7
31.7
31.7
EAR, D + D2, sex, years SE e 0.01
0.1
1.0
0.42
0.46
0.84
0.42
0.46
0.85
0.133
0.145
0.266
31.4
31.4
31.4
United Kingdom
ERR, D2, age b 0.01
0.1
1.0
0.01
0.06
0.64
0.01
0.06
0.64
0.001
0.012
0.120
18.8
18.8
18.8
ERR, D + D2, age c 0.01
0.1
1.0
0.38
0.42
0.81
0.38
0.42
0.82
0.075
0.083
0.162
19.8
19.8
19.8
EAR, D2, sex, years SE d 0.01
0.1
1.0
0.01
0.07
0.71
0.01
0.07
0.71
0.002
0.023
0.228
31.9
31.9
32.0
EAR, D + D2, sex, years SE e 0.01
0.1
1.0
0.43
0.46
0.85
0.43
0.47
0.86
0.135
0.147
0.271
31.6
31.6
31.6
a ERR = generalized excess relative risk, EAR = generalized excess absoluterisk, years SE = years since exposure.
b ERR = β D2 aτ, as per model (17) with linear coefficient in dose, α, set to 0(a = attained age).
c ERR = α[D+β D2] aτ, as per model (17) (a = attained age).
d EAR = β sD2 [a – e]κ, as per model (18) (a = attained age, e = age at
exposure, s = sex).e EAR = αs [D+β D2] [a – e]κ, as per model (18) with linear coefficient in
dose, α, set to 0 (a = attained age, e = age at exposure).
UNSCEAR REPORT-PART 4.qxp 10/7/08 3:39 pm Page 240
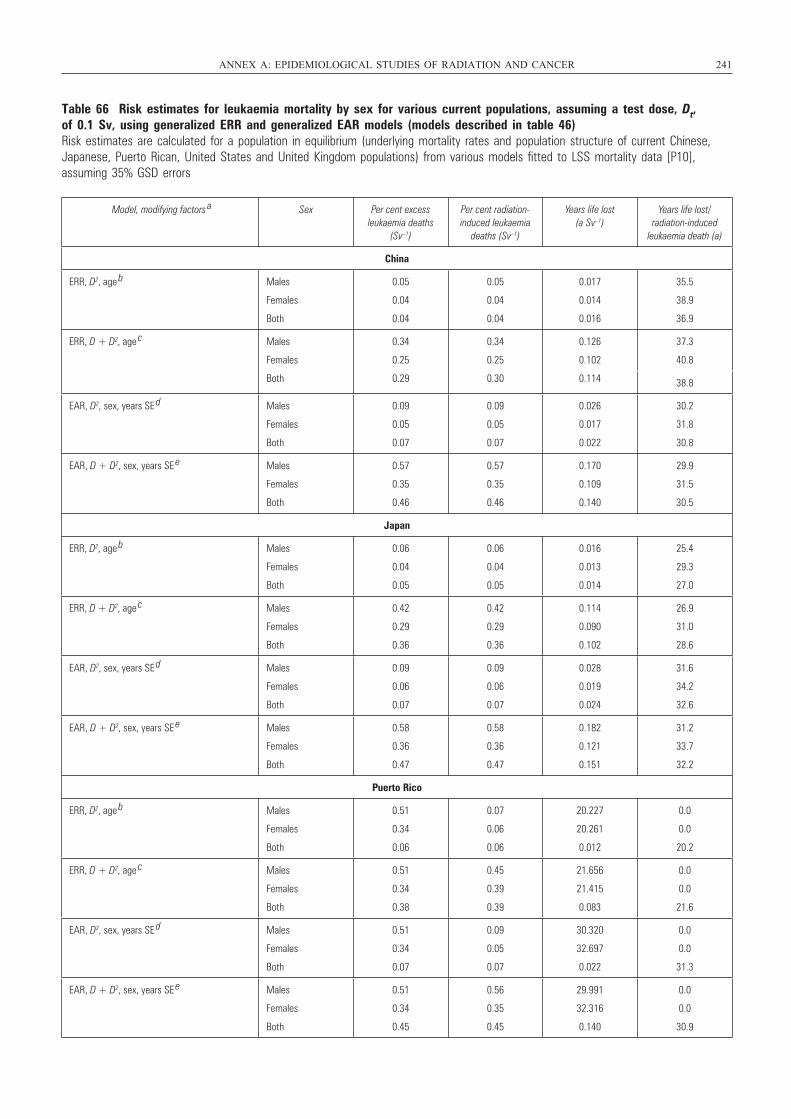
Table 66 Risk estimates for leukaemia mortality by sex for various current populations, assuming a test dose, Dt, of 0.1 Sv, using generalized ERR and generalized EAR models (models described in table 46)Risk estimates are calculated for a population in equilibrium (underlying mortality rates and population structure of current Chinese,Japanese, Puerto Rican, United States and United Kingdom populations) from various models fitted to LSS mortality data [P10],assuming 35% GSD errors
ANNEX A: EPIDEMIOLOGICAL STUDIES OF RADIATION AND CANCER 241
Model, modifying factors a Sex Per cent excess
leukaemia deaths (Sv–1)
Per cent radiation-induced leukaemia
deaths (Sv–1)
Years life lost (a Sv–1)
Years life lost/radiation-induced
leukaemia death (a)
China
ERR, D2, age b Males
Females
Both
0.05
0.04
0.04
0.05
0.04
0.04
0.017
0.014
0.016
35.5
38.9
36.9
ERR, D + D2, age c Males
Females
Both
0.34
0.25
0.29
0.34
0.25
0.30
0.126
0.102
0.114
37.3
40.8
38.8
EAR, D2, sex, years SE d Males
Females
Both
0.09
0.05
0.07
0.09
0.05
0.07
0.026
0.017
0.022
30.2
31.8
30.8
EAR, D + D2, sex, years SE e Males
Females
Both
0.57
0.35
0.46
0.57
0.35
0.46
0.170
0.109
0.140
29.9
31.5
30.5
Japan
ERR, D2, age b Males
Females
Both
0.06
0.04
0.05
0.06
0.04
0.05
0.016
0.013
0.014
25.4
29.3
27.0
ERR, D + D2, age c Males
Females
Both
0.42
0.29
0.36
0.42
0.29
0.36
0.114
0.090
0.102
26.9
31.0
28.6
EAR, D2, sex, years SE d
Males
Females
Both
0.09
0.06
0.07
0.09
0.06
0.07
0.028
0.019
0.024
31.6
34.2
32.6
EAR, D + D2, sex, years SE e Males
Females
Both
0.58
0.36
0.47
0.58
0.36
0.47
0.182
0.121
0.151
31.2
33.7
32.2
Puerto Rico
ERR, D2, age b Males
Females
Both
0.51
0.34
0.06
0.07
0.06
0.06
20.227
20.261
0.012
0.0
0.0
20.2
ERR, D + D2, age c Males
Females
Both
0.51
0.34
0.38
0.45
0.39
0.39
21.656
21.415
0.083
0.0
0.0
21.6
EAR, D2, sex, years SE d Males
Females
Both
0.51
0.34
0.07
0.09
0.05
0.07
30.320
32.697
0.022
0.0
0.0
31.3
EAR, D + D2, sex, years SE e Males
Females
Both
0.51
0.34
0.45
0.56
0.35
0.45
29.991
32.316
0.140
0.0
0.0
30.9
UNSCEAR REPORT-PART 4.qxp 10/7/08 3:39 pm Page 241
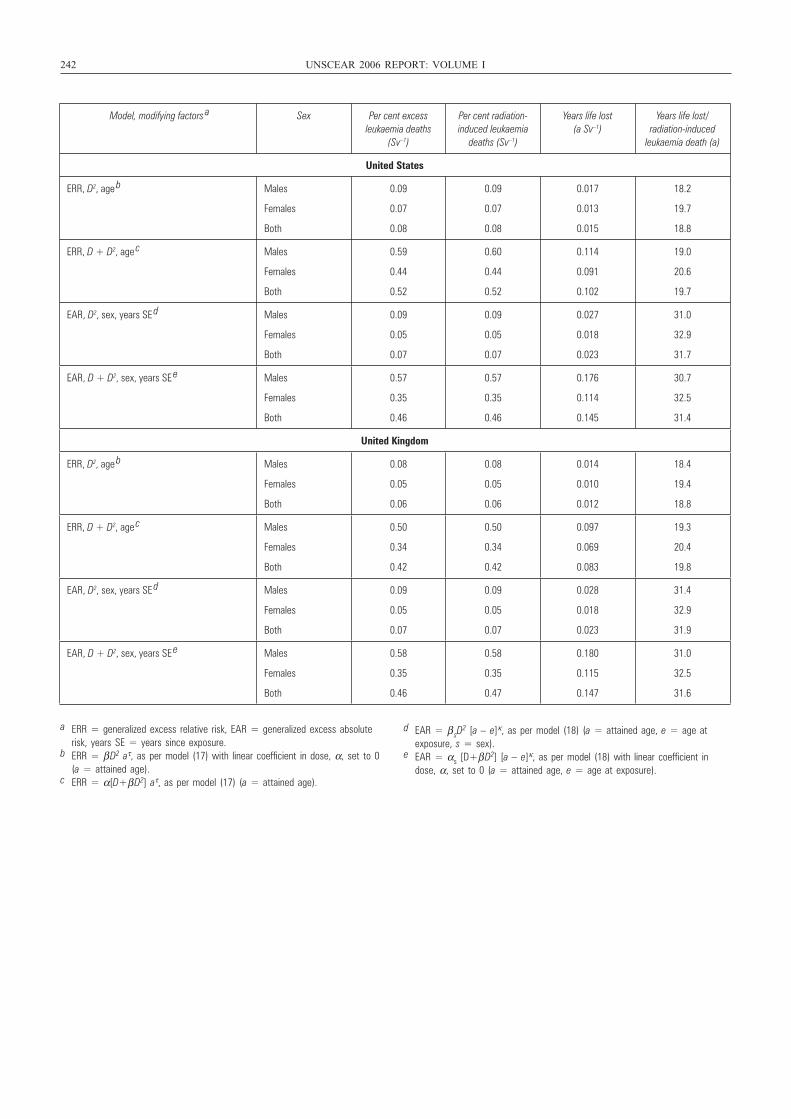
242 UNSCEAR 2006 REPORT: VOLUME I
Model, modifying factors a Sex Per cent excess leukaemia deaths
(Sv–1)
Per cent radiation-induced leukaemia
deaths (Sv–1)
Years life lost (a Sv–1)
Years life lost/radiation-induced
leukaemia death (a)
United States
ERR, D2, age b Males
Females
Both
0.09
0.07
0.08
0.09
0.07
0.08
0.017
0.013
0.015
18.2
19.7
18.8
ERR, D + D2, age c Males
Females
Both
0.59
0.44
0.52
0.60
0.44
0.52
0.114
0.091
0.102
19.0
20.6
19.7
EAR, D2, sex, years SE d Males
Females
Both
0.09
0.05
0.07
0.09
0.05
0.07
0.027
0.018
0.023
31.0
32.9
31.7
EAR, D + D2, sex, years SE e Males
Females
Both
0.57
0.35
0.46
0.57
0.35
0.46
0.176
0.114
0.145
30.7
32.5
31.4
United Kingdom
ERR, D2, age b Males
Females
Both
0.08
0.05
0.06
0.08
0.05
0.06
0.014
0.010
0.012
18.4
19.4
18.8
ERR, D + D2, age c Males
Females
Both
0.50
0.34
0.42
0.50
0.34
0.42
0.097
0.069
0.083
19.3
20.4
19.8
EAR, D2, sex, years SE d Males
Females
Both
0.09
0.05
0.07
0.09
0.05
0.07
0.028
0.018
0.023
31.4
32.9
31.9
EAR, D + D2, sex, years SE e Males
Females
Both
0.58
0.35
0.46
0.58
0.35
0.47
0.180
0.115
0.147
31.0
32.5
31.6
a ERR = generalized excess relative risk, EAR = generalized excess absoluterisk, years SE = years since exposure.
b ERR = β D2 aτ, as per model (17) with linear coefficient in dose, α, set to 0(a = attained age).
c ERR = α[D+β D2] aτ, as per model (17) (a = attained age).
d EAR = β sD2 [a – e]κ, as per model (18) (a = attained age, e = age at
exposure, s = sex).e EAR = αs [D+β D2] [a – e]κ, as per model (18) with linear coefficient in
dose, α, set to 0 (a = attained age, e = age at exposure).
UNSCEAR REPORT-PART 4.qxp 10/7/08 3:39 pm Page 242
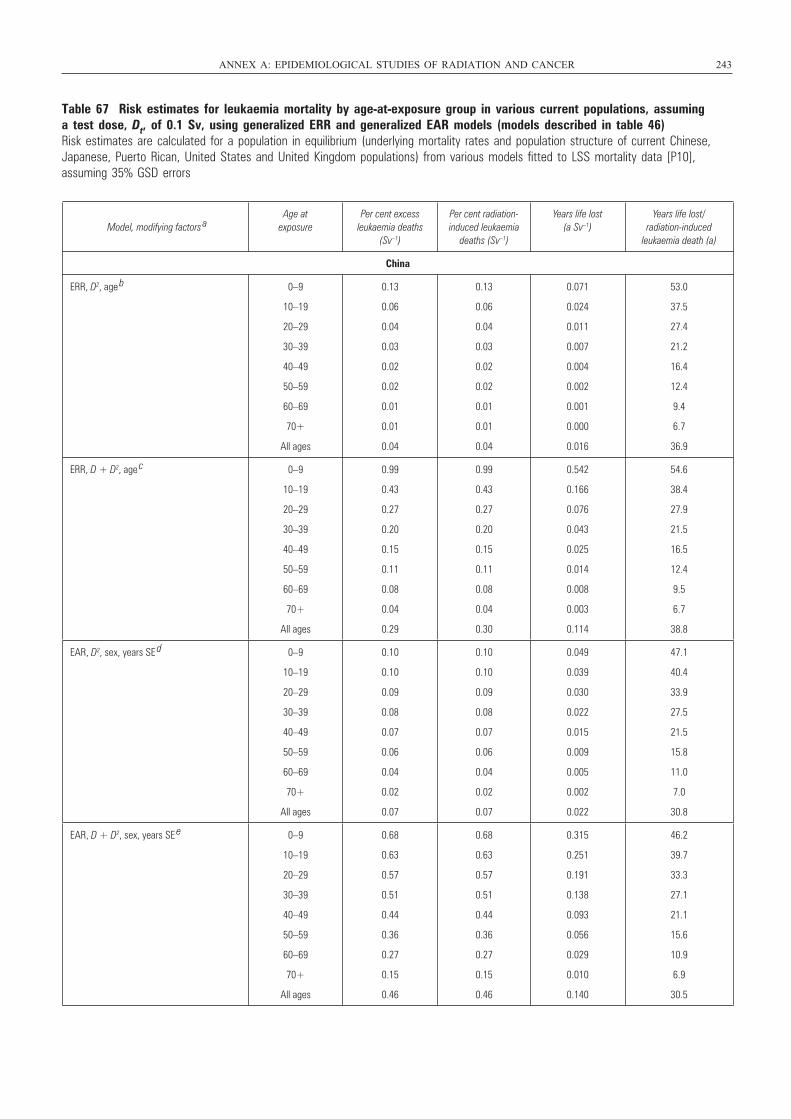
Table 67 Risk estimates for leukaemia mortality by age-at-exposure group in various current populations, assuming a test dose, Dt, of 0.1 Sv, using generalized ERR and generalized EAR models (models described in table 46)Risk estimates are calculated for a population in equilibrium (underlying mortality rates and population structure of current Chinese,Japanese, Puerto Rican, United States and United Kingdom populations) from various models fitted to LSS mortality data [P10],assuming 35% GSD errors
ANNEX A: EPIDEMIOLOGICAL STUDIES OF RADIATION AND CANCER 243
Model, modifying factors a
Age at exposure
Per cent excess leukaemia deaths
(Sv–1)
Per cent radiation-induced leukaemia
deaths (Sv–1)
Years life lost (a Sv–1)
Years life lost/radiation-induced
leukaemia death (a)
China
ERR, D2, age b 0–9
10–19
20–29
30–39
40–49
50–59
60–69
70+
All ages
0.13
0.06
0.04
0.03
0.02
0.02
0.01
0.01
0.04
0.13
0.06
0.04
0.03
0.02
0.02
0.01
0.01
0.04
0.071
0.024
0.011
0.007
0.004
0.002
0.001
0.000
0.016
53.0
37.5
27.4
21.2
16.4
12.4
9.4
6.7
36.9
ERR, D + D2, age c 0–9
10–19
20–29
30–39
40–49
50–59
60–69
70+
All ages
0.99
0.43
0.27
0.20
0.15
0.11
0.08
0.04
0.29
0.99
0.43
0.27
0.20
0.15
0.11
0.08
0.04
0.30
0.542
0.166
0.076
0.043
0.025
0.014
0.008
0.003
0.114
54.6
38.4
27.9
21.5
16.5
12.4
9.5
6.7
38.8
EAR, D2, sex, years SE d 0–9
10–19
20–29
30–39
40–49
50–59
60–69
70+
All ages
0.10
0.10
0.09
0.08
0.07
0.06
0.04
0.02
0.07
0.10
0.10
0.09
0.08
0.07
0.06
0.04
0.02
0.07
0.049
0.039
0.030
0.022
0.015
0.009
0.005
0.002
0.022
47.1
40.4
33.9
27.5
21.5
15.8
11.0
7.0
30.8
EAR, D + D2, sex, years SE e 0–9
10–19
20–29
30–39
40–49
50–59
60–69
70+
All ages
0.68
0.63
0.57
0.51
0.44
0.36
0.27
0.15
0.46
0.68
0.63
0.57
0.51
0.44
0.36
0.27
0.15
0.46
0.315
0.251
0.191
0.138
0.093
0.056
0.029
0.010
0.140
46.2
39.7
33.3
27.1
21.1
15.6
10.9
6.9
30.5
UNSCEAR REPORT-PART 4.qxp 10/7/08 3:39 pm Page 243
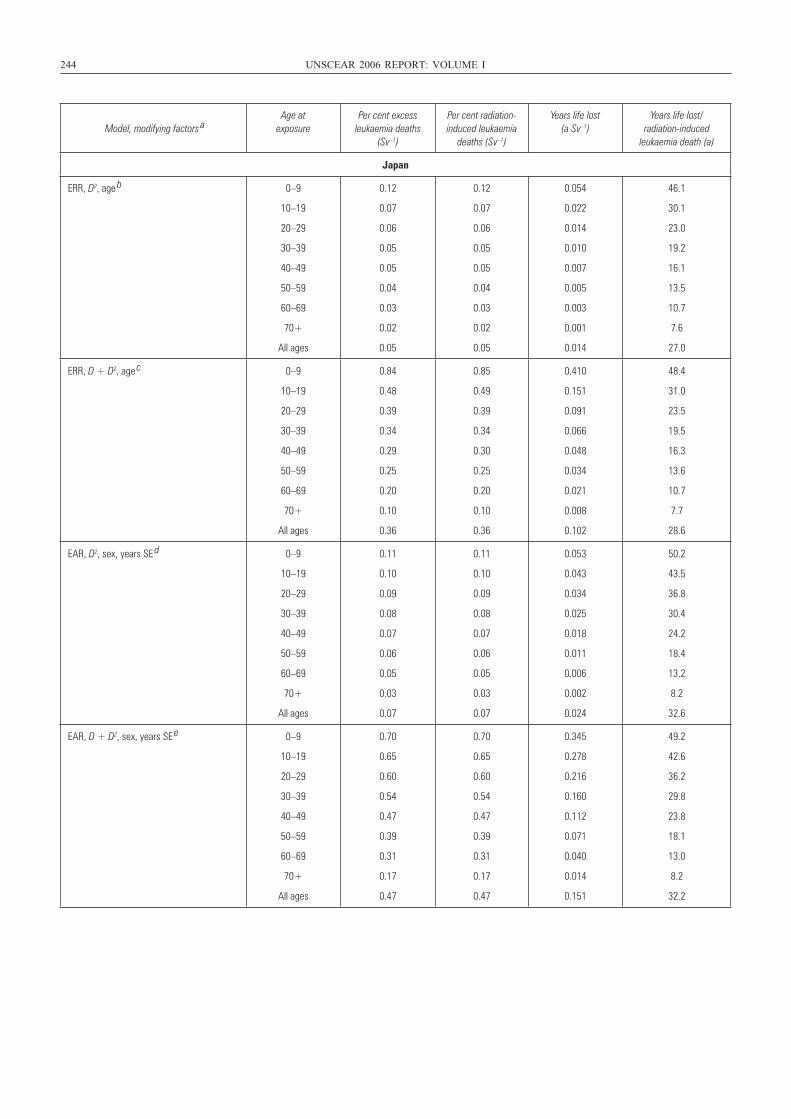
244 UNSCEAR 2006 REPORT: VOLUME I
Model, modifying factors a
Age at exposure
Per cent excess leukaemia deaths
(Sv–1)
Per cent radiation-induced leukaemia
deaths (Sv–1)
Years life lost (a Sv–1)
Years life lost/radiation-induced
leukaemia death (a)
Japan
ERR, D2, age b 0–9
10–19
20–29
30–39
40–49
50–59
60–69
70+
All ages
0.12
0.07
0.06
0.05
0.05
0.04
0.03
0.02
0.05
0.12
0.07
0.06
0.05
0.05
0.04
0.03
0.02
0.05
0.054
0.022
0.014
0.010
0.007
0.005
0.003
0.001
0.014
46.1
30.1
23.0
19.2
16.1
13.5
10.7
7.6
27.0
ERR, D + D2, age c 0–9
10–19
20–29
30–39
40–49
50–59
60–69
70+
All ages
0.84
0.48
0.39
0.34
0.29
0.25
0.20
0.10
0.36
0.85
0.49
0.39
0.34
0.30
0.25
0.20
0.10
0.36
0.410
0.151
0.091
0.066
0.048
0.034
0.021
0.008
0.102
48.4
31.0
23.5
19.5
16.3
13.6
10.7
7.7
28.6
EAR, D2, sex, years SE d 0–9
10–19
20–29
30–39
40–49
50–59
60–69
70+
All ages
0.11
0.10
0.09
0.08
0.07
0.06
0.05
0.03
0.07
0.11
0.10
0.09
0.08
0.07
0.06
0.05
0.03
0.07
0.053
0.043
0.034
0.025
0.018
0.011
0.006
0.002
0.024
50.2
43.5
36.8
30.4
24.2
18.4
13.2
8.2
32.6
EAR, D + D2, sex, years SE e 0–9
10–19
20–29
30–39
40–49
50–59
60–69
70+
All ages
0.70
0.65
0.60
0.54
0.47
0.39
0.31
0.17
0.47
0.70
0.65
0.60
0.54
0.47
0.39
0.31
0.17
0.47
0.345
0.278
0.216
0.160
0.112
0.071
0.040
0.014
0.151
49.2
42.6
36.2
29.8
23.8
18.1
13.0
8.2
32.2
UNSCEAR REPORT-PART 4.qxp 10/7/08 3:39 pm Page 244
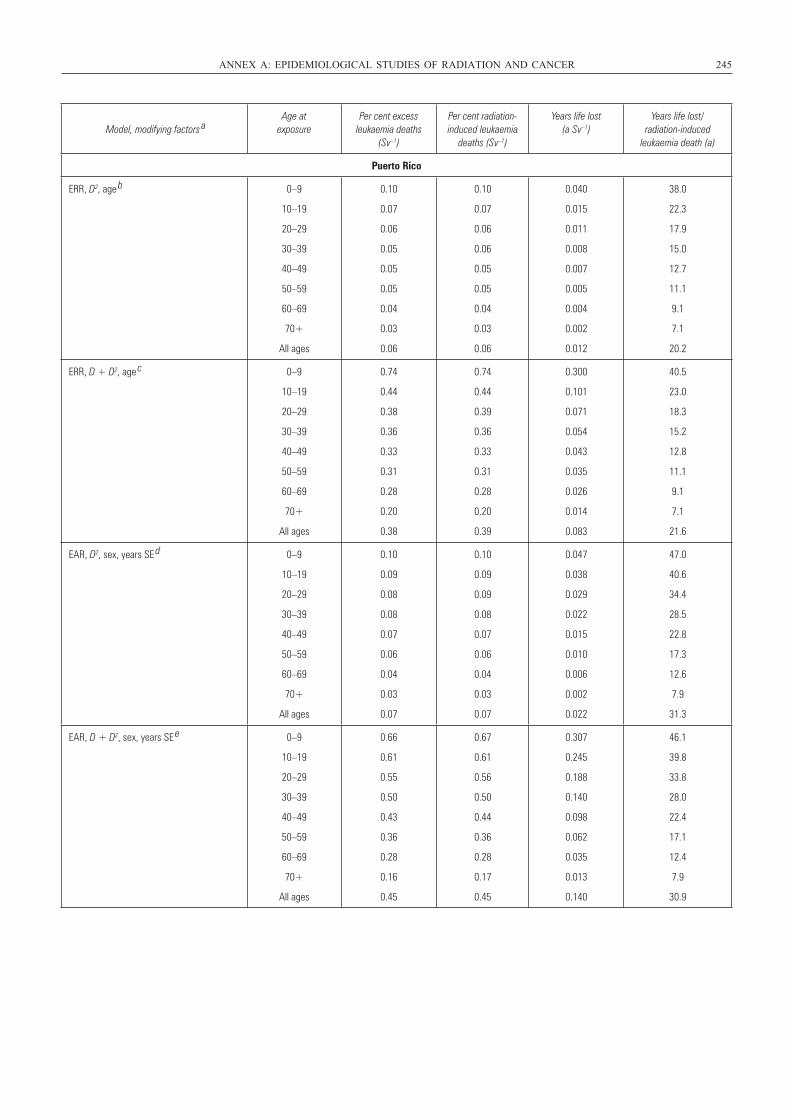
ANNEX A: EPIDEMIOLOGICAL STUDIES OF RADIATION AND CANCER 245
Model, modifying factors a
Age at exposure
Per cent excess leukaemia deaths
(Sv–1)
Per cent radiation-induced leukaemia
deaths (Sv–1)
Years life lost (a Sv–1)
Years life lost/radiation-induced
leukaemia death (a)
Puerto Rico
ERR, D2, age b 0–9
10–19
20–29
30–39
40–49
50–59
60–69
70+
All ages
0.10
0.07
0.06
0.05
0.05
0.05
0.04
0.03
0.06
0.10
0.07
0.06
0.06
0.05
0.05
0.04
0.03
0.06
0.040
0.015
0.011
0.008
0.007
0.005
0.004
0.002
0.012
38.0
22.3
17.9
15.0
12.7
11.1
9.1
7.1
20.2
ERR, D + D2, age c 0–9
10–19
20–29
30–39
40–49
50–59
60–69
70+
All ages
0.74
0.44
0.38
0.36
0.33
0.31
0.28
0.20
0.38
0.74
0.44
0.39
0.36
0.33
0.31
0.28
0.20
0.39
0.300
0.101
0.071
0.054
0.043
0.035
0.026
0.014
0.083
40.5
23.0
18.3
15.2
12.8
11.1
9.1
7.1
21.6
EAR, D2, sex, years SE d 0–9
10–19
20–29
30–39
40–49
50–59
60–69
70+
All ages
0.10
0.09
0.08
0.08
0.07
0.06
0.04
0.03
0.07
0.10
0.09
0.09
0.08
0.07
0.06
0.04
0.03
0.07
0.047
0.038
0.029
0.022
0.015
0.010
0.006
0.002
0.022
47.0
40.6
34.4
28.5
22.8
17.3
12.6
7.9
31.3
EAR, D + D2, sex, years SE e 0–9
10–19
20–29
30–39
40–49
50–59
60–69
70+
All ages
0.66
0.61
0.55
0.50
0.43
0.36
0.28
0.16
0.45
0.67
0.61
0.56
0.50
0.44
0.36
0.28
0.17
0.45
0.307
0.245
0.188
0.140
0.098
0.062
0.035
0.013
0.140
46.1
39.8
33.8
28.0
22.4
17.1
12.4
7.9
30.9
UNSCEAR REPORT-PART 4.qxp 10/7/08 3:39 pm Page 245
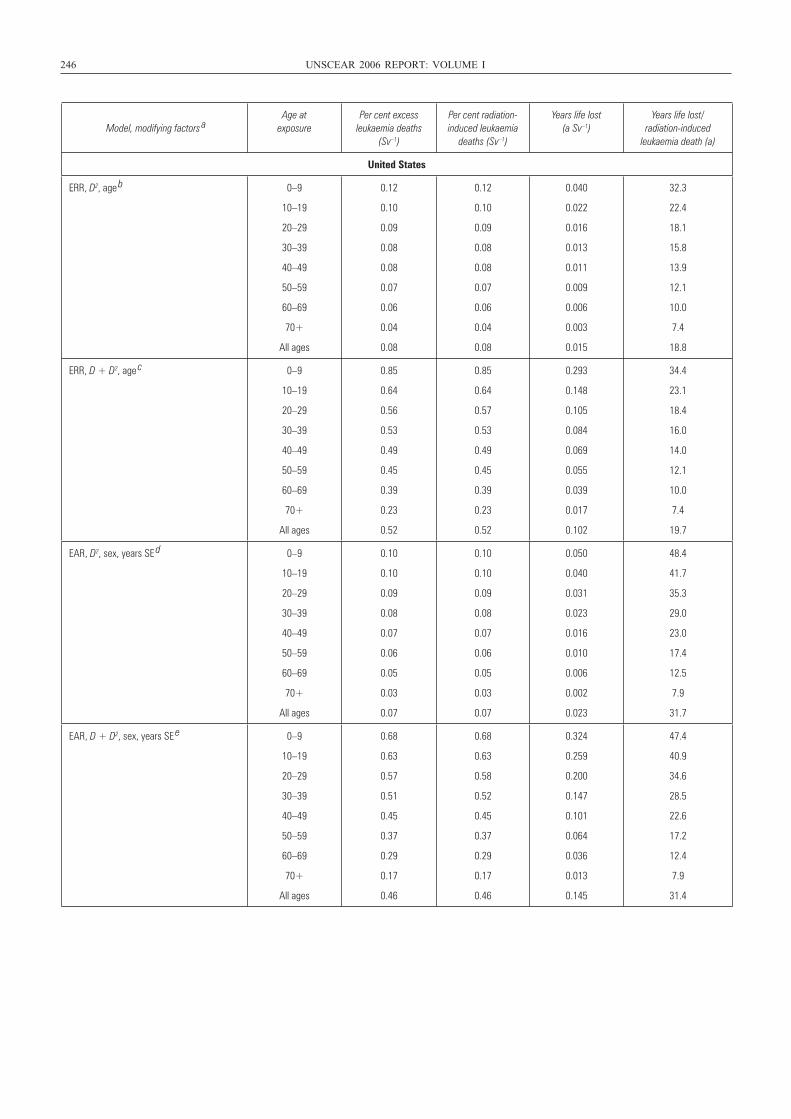
246 UNSCEAR 2006 REPORT: VOLUME I
Model, modifying factors a
Age at exposure
Per cent excess leukaemia deaths
(Sv–1)
Per cent radiation-induced leukaemia
deaths (Sv–1)
Years life lost (a Sv–1)
Years life lost/radiation-induced
leukaemia death (a)
United States
ERR, D2, age b 0–9
10–19
20–29
30–39
40–49
50–59
60–69
70+
All ages
0.12
0.10
0.09
0.08
0.08
0.07
0.06
0.04
0.08
0.12
0.10
0.09
0.08
0.08
0.07
0.06
0.04
0.08
0.040
0.022
0.016
0.013
0.011
0.009
0.006
0.003
0.015
32.3
22.4
18.1
15.8
13.9
12.1
10.0
7.4
18.8
ERR, D + D2, age c 0–9
10–19
20–29
30–39
40–49
50–59
60–69
70+
All ages
0.85
0.64
0.56
0.53
0.49
0.45
0.39
0.23
0.52
0.85
0.64
0.57
0.53
0.49
0.45
0.39
0.23
0.52
0.293
0.148
0.105
0.084
0.069
0.055
0.039
0.017
0.102
34.4
23.1
18.4
16.0
14.0
12.1
10.0
7.4
19.7
EAR, D2, sex, years SE d 0–9
10–19
20–29
30–39
40–49
50–59
60–69
70+
All ages
0.10
0.10
0.09
0.08
0.07
0.06
0.05
0.03
0.07
0.10
0.10
0.09
0.08
0.07
0.06
0.05
0.03
0.07
0.050
0.040
0.031
0.023
0.016
0.010
0.006
0.002
0.023
48.4
41.7
35.3
29.0
23.0
17.4
12.5
7.9
31.7
EAR, D + D2, sex, years SE e 0–9
10–19
20–29
30–39
40–49
50–59
60–69
70+
All ages
0.68
0.63
0.57
0.51
0.45
0.37
0.29
0.17
0.46
0.68
0.63
0.58
0.52
0.45
0.37
0.29
0.17
0.46
0.324
0.259
0.200
0.147
0.101
0.064
0.036
0.013
0.145
47.4
40.9
34.6
28.5
22.6
17.2
12.4
7.9
31.4
UNSCEAR REPORT-PART 4.qxp 10/7/08 3:39 pm Page 246
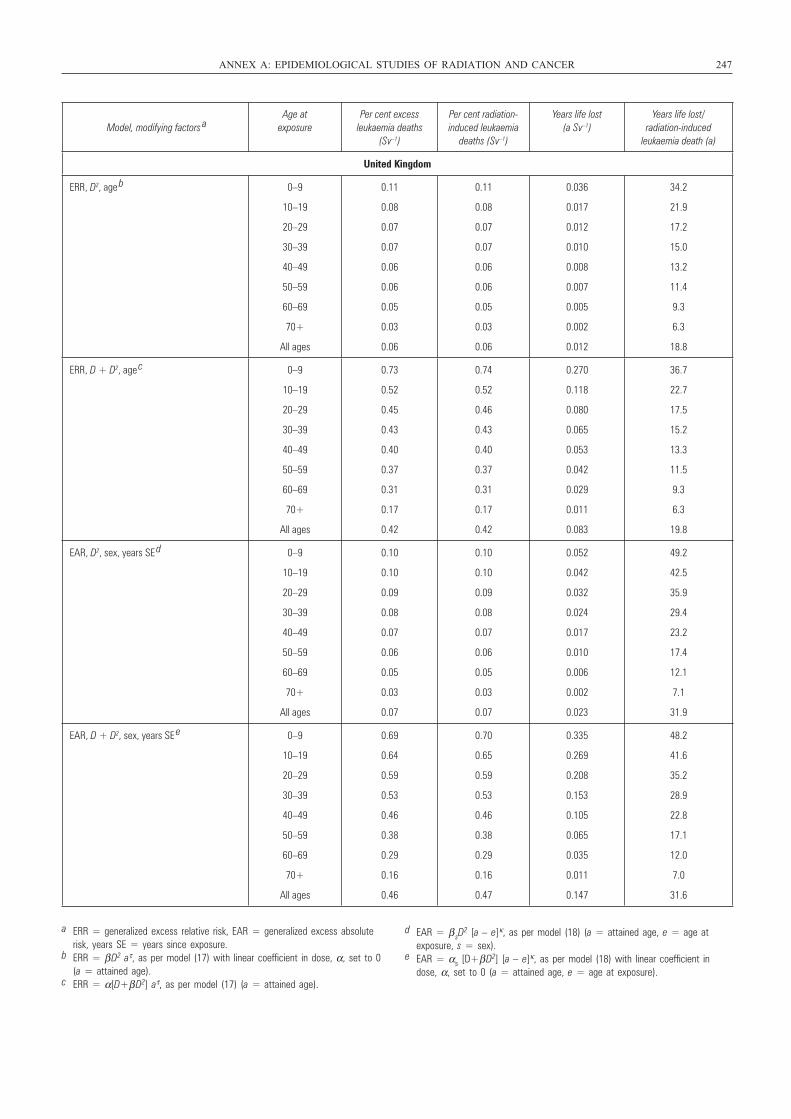
ANNEX A: EPIDEMIOLOGICAL STUDIES OF RADIATION AND CANCER 247
Model, modifying factors a
Age at exposure
Per cent excess leukaemia deaths
(Sv–1)
Per cent radiation-induced leukaemia
deaths (Sv–1)
Years life lost (a Sv–1)
Years life lost/radiation-induced
leukaemia death (a)
United Kingdom
ERR, D2, age b 0–9
10–19
20–29
30–39
40–49
50–59
60–69
70+
All ages
0.11
0.08
0.07
0.07
0.06
0.06
0.05
0.03
0.06
0.11
0.08
0.07
0.07
0.06
0.06
0.05
0.03
0.06
0.036
0.017
0.012
0.010
0.008
0.007
0.005
0.002
0.012
34.2
21.9
17.2
15.0
13.2
11.4
9.3
6.3
18.8
ERR, D + D2, age c 0–9
10–19
20–29
30–39
40–49
50–59
60–69
70+
All ages
0.73
0.52
0.45
0.43
0.40
0.37
0.31
0.17
0.42
0.74
0.52
0.46
0.43
0.40
0.37
0.31
0.17
0.42
0.270
0.118
0.080
0.065
0.053
0.042
0.029
0.011
0.083
36.7
22.7
17.5
15.2
13.3
11.5
9.3
6.3
19.8
EAR, D2, sex, years SE d 0–9
10–19
20–29
30–39
40–49
50–59
60–69
70+
All ages
0.10
0.10
0.09
0.08
0.07
0.06
0.05
0.03
0.07
0.10
0.10
0.09
0.08
0.07
0.06
0.05
0.03
0.07
0.052
0.042
0.032
0.024
0.017
0.010
0.006
0.002
0.023
49.2
42.5
35.9
29.4
23.2
17.4
12.1
7.1
31.9
EAR, D + D2, sex, years SE e 0–9
10–19
20–29
30–39
40–49
50–59
60–69
70+
All ages
0.69
0.64
0.59
0.53
0.46
0.38
0.29
0.16
0.46
0.70
0.65
0.59
0.53
0.46
0.38
0.29
0.16
0.47
0.335
0.269
0.208
0.153
0.105
0.065
0.035
0.011
0.147
48.2
41.6
35.2
28.9
22.8
17.1
12.0
7.0
31.6
a ERR = generalized excess relative risk, EAR = generalized excess absoluterisk, years SE = years since exposure.
b ERR = β D2 aτ, as per model (17) with linear coefficient in dose, α, set to 0(a = attained age).
c ERR = α[D+β D2] aτ, as per model (17) (a = attained age).
d EAR = β sD2 [a – e]κ, as per model (18) (a = attained age, e = age at
exposure, s = sex).e EAR = αs [D+β D2] [a – e]κ, as per model (18) with linear coefficient in
dose, α, set to 0 (a = attained age, e = age at exposure).
UNSCEAR REPORT-PART 4.qxp 10/7/08 3:39 pm Page 247
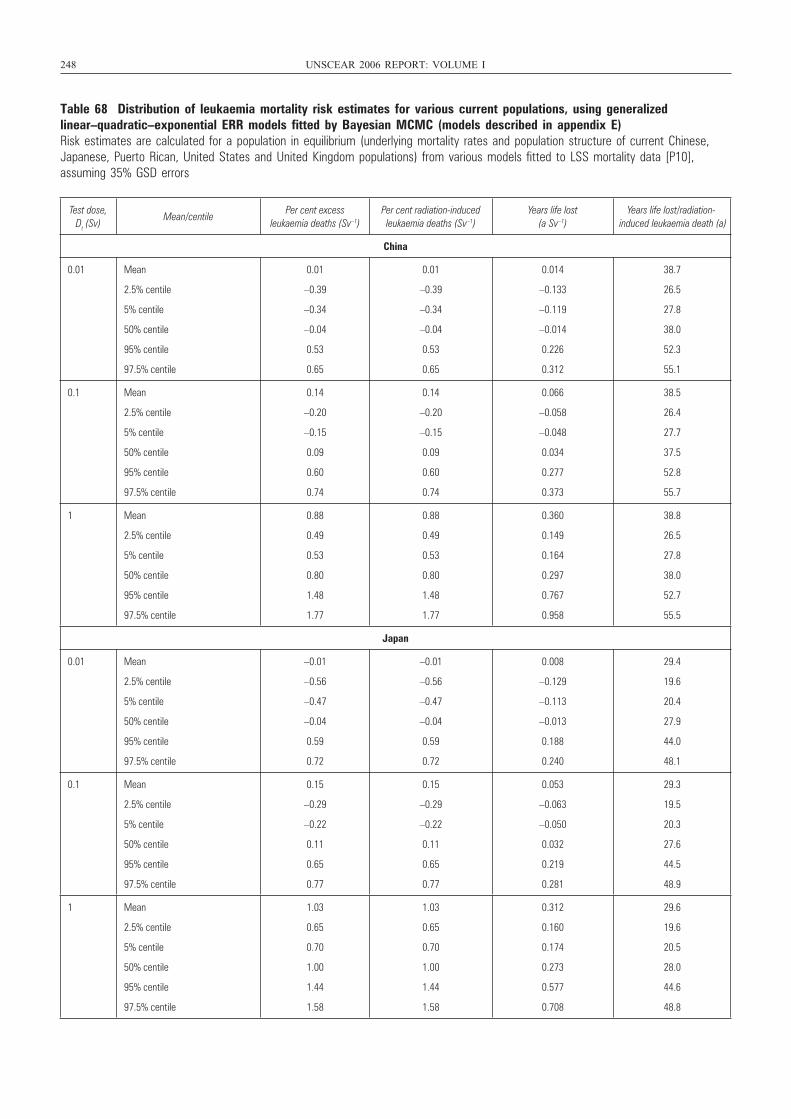
248 UNSCEAR 2006 REPORT: VOLUME I
Table 68 Distribution of leukaemia mortality risk estimates for various current populations, using generalizedlinear–quadratic–exponential ERR models fitted by Bayesian MCMC (models described in appendix E)Risk estimates are calculated for a population in equilibrium (underlying mortality rates and population structure of current Chinese,Japanese, Puerto Rican, United States and United Kingdom populations) from various models fitted to LSS mortality data [P10],assuming 35% GSD errors
Test dose, Dt (Sv)
Mean/centilePer cent excess
leukaemia deaths (Sv–1)Per cent radiation-induced leukaemia deaths (Sv–1)
Years life lost (a Sv–1)
Years life lost/radiation-induced leukaemia death (a)
China
0.01 Mean
2.5% centile
5% centile
50% centile
95% centile
97.5% centile
0.01
–0.39
–0.34
–0.04
0.53
0.65
0.01
–0.39
–0.34
–0.04
0.53
0.65
0.014
–0.133
–0.119
–0.014
0.226
0.312
38.7
26.5
27.8
38.0
52.3
55.1
0.1 Mean
2.5% centile
5% centile
50% centile
95% centile
97.5% centile
0.14
–0.20
–0.15
0.09
0.60
0.74
0.14
–0.20
–0.15
0.09
0.60
0.74
0.066
–0.058
–0.048
0.034
0.277
0.373
38.5
26.4
27.7
37.5
52.8
55.7
1 Mean
2.5% centile
5% centile
50% centile
95% centile
97.5% centile
0.88
0.49
0.53
0.80
1.48
1.77
0.88
0.49
0.53
0.80
1.48
1.77
0.360
0.149
0.164
0.297
0.767
0.958
38.8
26.5
27.8
38.0
52.7
55.5
Japan
0.01 Mean
2.5% centile
5% centile
50% centile
95% centile
97.5% centile
–0.01
–0.56
–0.47
–0.04
0.59
0.72
–0.01
–0.56
–0.47
–0.04
0.59
0.72
0.008
–0.129
–0.113
–0.013
0.188
0.240
29.4
19.6
20.4
27.9
44.0
48.1
0.1 Mean
2.5% centile
5% centile
50% centile
95% centile
97.5% centile
0.15
–0.29
–0.22
0.11
0.65
0.77
0.15
–0.29
–0.22
0.11
0.65
0.77
0.053
–0.063
–0.050
0.032
0.219
0.281
29.3
19.5
20.3
27.6
44.5
48.9
1 Mean
2.5% centile
5% centile
50% centile
95% centile
97.5% centile
1.03
0.65
0.70
1.00
1.44
1.58
1.03
0.65
0.70
1.00
1.44
1.58
0.312
0.160
0.174
0.273
0.577
0.708
29.6
19.6
20.5
28.0
44.6
48.8
UNSCEAR REPORT-PART 4.qxp 10/7/08 3:39 pm Page 248
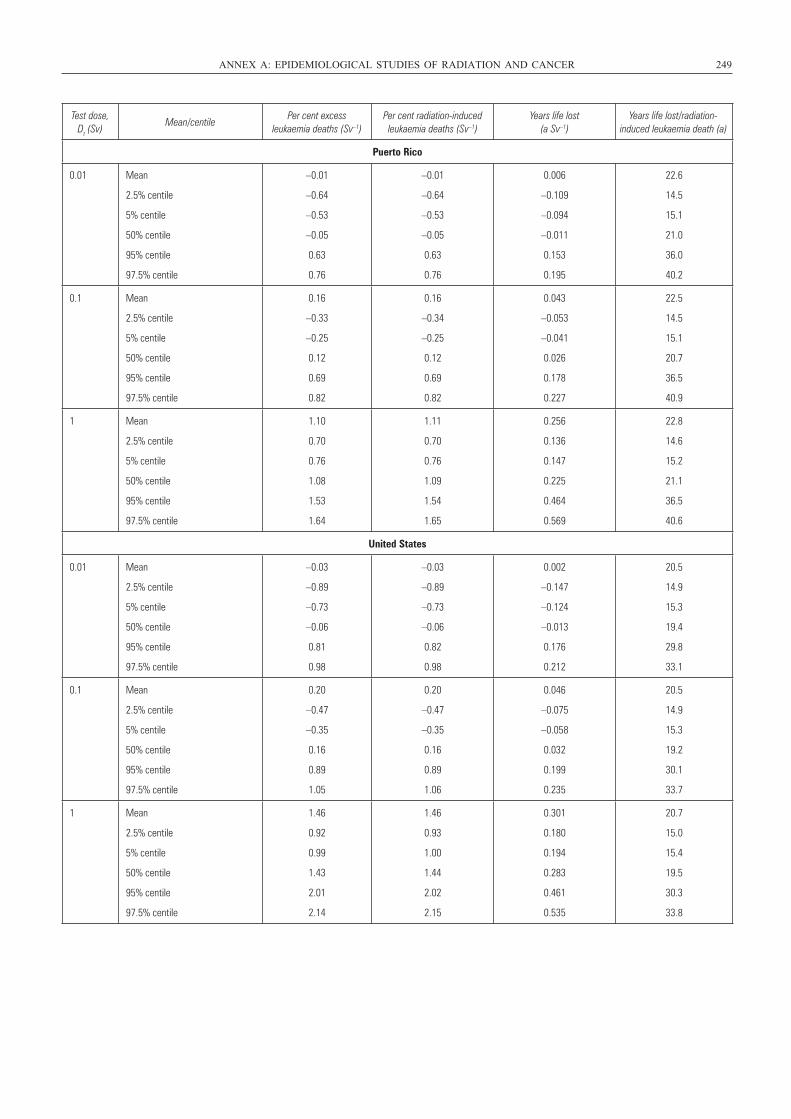
ANNEX A: EPIDEMIOLOGICAL STUDIES OF RADIATION AND CANCER 249
Test dose, Dt (Sv)
Mean/centilePer cent excess
leukaemia deaths (Sv–1)Per cent radiation-induced leukaemia deaths (Sv–1)
Years life lost (a Sv–1)
Years life lost/radiation-induced leukaemia death (a)
Puerto Rico
0.01 Mean
2.5% centile
5% centile
50% centile
95% centile
97.5% centile
–0.01
–0.64
–0.53
–0.05
0.63
0.76
–0.01
–0.64
–0.53
–0.05
0.63
0.76
0.006
–0.109
–0.094
–0.011
0.153
0.195
22.6
14.5
15.1
21.0
36.0
40.2
0.1 Mean
2.5% centile
5% centile
50% centile
95% centile
97.5% centile
0.16
–0.33
–0.25
0.12
0.69
0.82
0.16
–0.34
–0.25
0.12
0.69
0.82
0.043
–0.053
–0.041
0.026
0.178
0.227
22.5
14.5
15.1
20.7
36.5
40.9
1 Mean
2.5% centile
5% centile
50% centile
95% centile
97.5% centile
1.10
0.70
0.76
1.08
1.53
1.64
1.11
0.70
0.76
1.09
1.54
1.65
0.256
0.136
0.147
0.225
0.464
0.569
22.8
14.6
15.2
21.1
36.5
40.6
United States
0.01 Mean
2.5% centile
5% centile
50% centile
95% centile
97.5% centile
–0.03
–0.89
–0.73
–0.06
0.81
0.98
–0.03
–0.89
–0.73
–0.06
0.82
0.98
0.002
–0.147
–0.124
–0.013
0.176
0.212
20.5
14.9
15.3
19.4
29.8
33.1
0.1 Mean
2.5% centile
5% centile
50% centile
95% centile
97.5% centile
0.20
–0.47
–0.35
0.16
0.89
1.05
0.20
–0.47
–0.35
0.16
0.89
1.06
0.046
–0.075
–0.058
0.032
0.199
0.235
20.5
14.9
15.3
19.2
30.1
33.7
1 Mean
2.5% centile
5% centile
50% centile
95% centile
97.5% centile
1.46
0.92
0.99
1.43
2.01
2.14
1.46
0.93
1.00
1.44
2.02
2.15
0.301
0.180
0.194
0.283
0.461
0.535
20.7
15.0
15.4
19.5
30.3
33.8
UNSCEAR REPORT-PART 4.qxp 10/7/08 3:39 pm Page 249
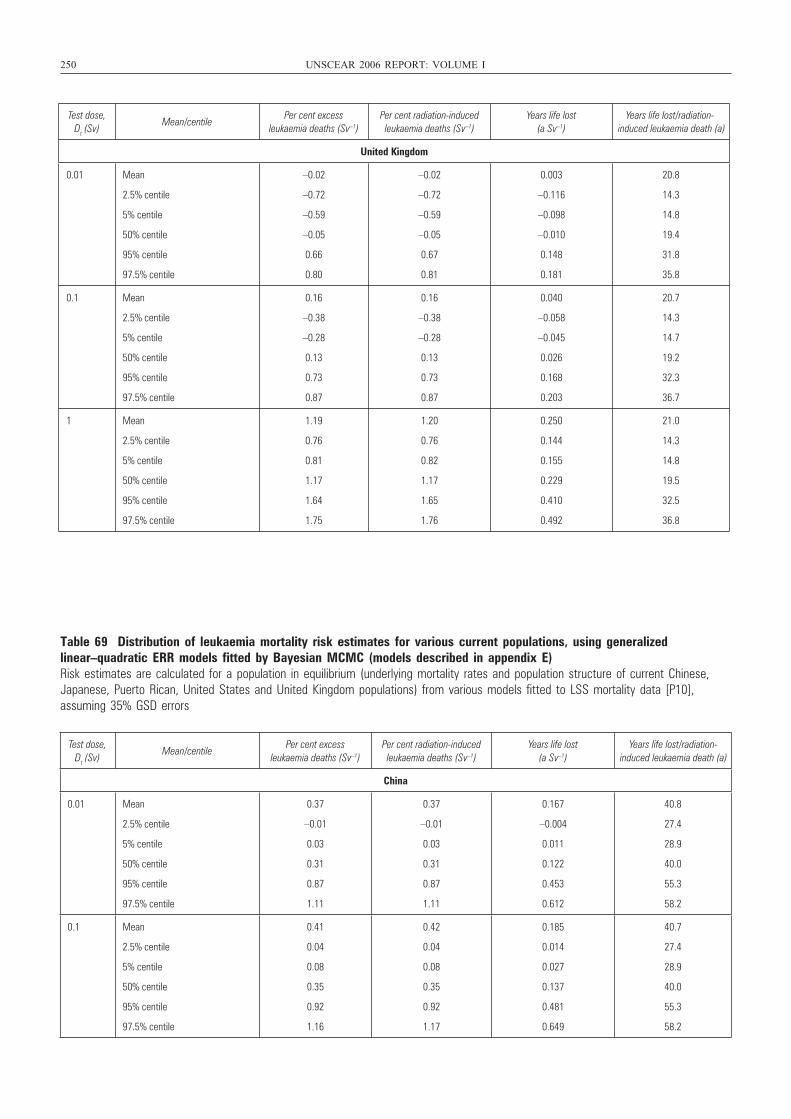
250 UNSCEAR 2006 REPORT: VOLUME I
Test dose, Dt (Sv)
Mean/centilePer cent excess
leukaemia deaths (Sv–1)Per cent radiation-induced leukaemia deaths (Sv–1)
Years life lost (a Sv–1)
Years life lost/radiation-induced leukaemia death (a)
United Kingdom
0.01 Mean
2.5% centile
5% centile
50% centile
95% centile
97.5% centile
–0.02
–0.72
–0.59
–0.05
0.66
0.80
–0.02
–0.72
–0.59
–0.05
0.67
0.81
0.003
–0.116
–0.098
–0.010
0.148
0.181
20.8
14.3
14.8
19.4
31.8
35.8
0.1 Mean
2.5% centile
5% centile
50% centile
95% centile
97.5% centile
0.16
–0.38
–0.28
0.13
0.73
0.87
0.16
–0.38
–0.28
0.13
0.73
0.87
0.040
–0.058
–0.045
0.026
0.168
0.203
20.7
14.3
14.7
19.2
32.3
36.7
1 Mean
2.5% centile
5% centile
50% centile
95% centile
97.5% centile
1.19
0.76
0.81
1.17
1.64
1.75
1.20
0.76
0.82
1.17
1.65
1.76
0.250
0.144
0.155
0.229
0.410
0.492
21.0
14.3
14.8
19.5
32.5
36.8
Table 69 Distribution of leukaemia mortality risk estimates for various current populations, using generalizedlinear–quadratic ERR models fitted by Bayesian MCMC (models described in appendix E)Risk estimates are calculated for a population in equilibrium (underlying mortality rates and population structure of current Chinese,Japanese, Puerto Rican, United States and United Kingdom populations) from various models fitted to LSS mortality data [P10],assuming 35% GSD errors
Test dose, Dt (Sv)
Mean/centilePer cent excess
leukaemia deaths (Sv–1)Per cent radiation-induced leukaemia deaths (Sv–1)
Years life lost (a Sv–1)
Years life lost/radiation-induced leukaemia death (a)
China
0.01 Mean
2.5% centile
5% centile
50% centile
95% centile
97.5% centile
0.37
–0.01
0.03
0.31
0.87
1.11
0.37
–0.01
0.03
0.31
0.87
1.11
0.167
–0.004
0.011
0.122
0.453
0.612
40.8
27.4
28.9
40.0
55.3
58.2
0.1 Mean
2.5% centile
5% centile
50% centile
95% centile
97.5% centile
0.41
0.04
0.08
0.35
0.92
1.16
0.42
0.04
0.08
0.35
0.92
1.17
0.185
0.014
0.027
0.137
0.481
0.649
40.7
27.4
28.9
40.0
55.3
58.2
UNSCEAR REPORT-PART 4.qxp 10/7/08 3:39 pm Page 250
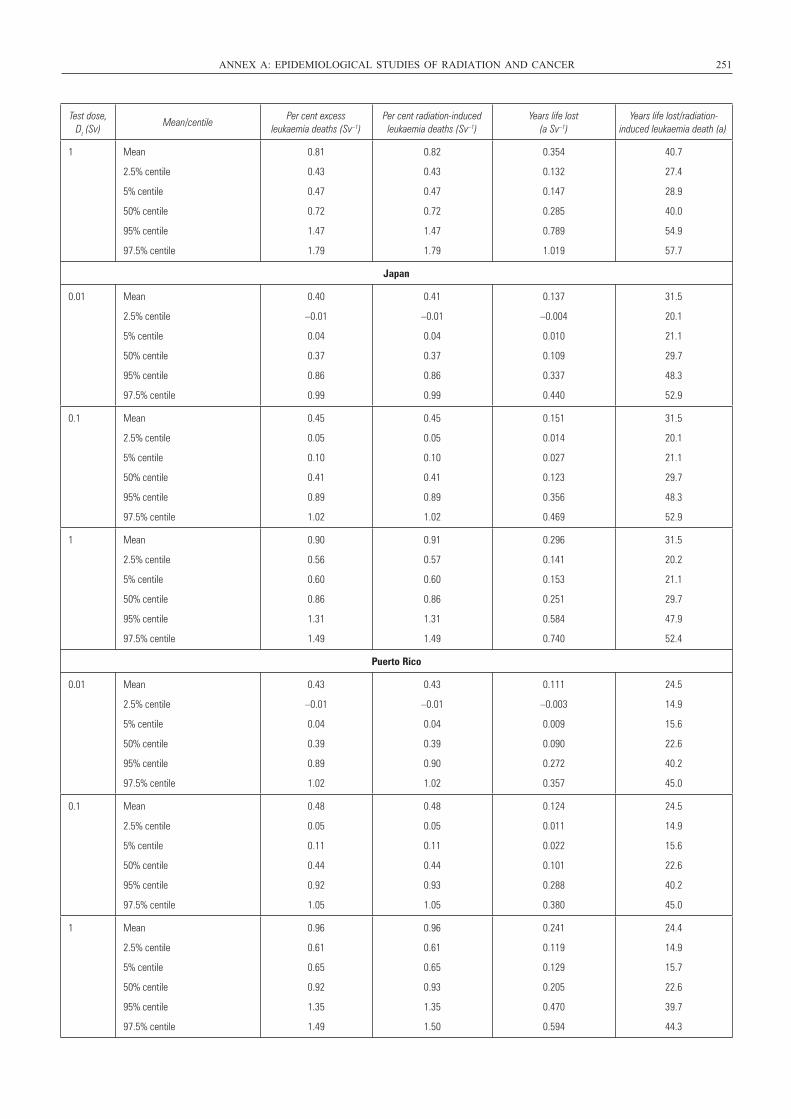
ANNEX A: EPIDEMIOLOGICAL STUDIES OF RADIATION AND CANCER 251
Test dose, Dt (Sv)
Mean/centilePer cent excess
leukaemia deaths (Sv–1)Per cent radiation-induced leukaemia deaths (Sv–1)
Years life lost (a Sv–1)
Years life lost/radiation-induced leukaemia death (a)
1 Mean
2.5% centile
5% centile
50% centile
95% centile
97.5% centile
0.81
0.43
0.47
0.72
1.47
1.79
0.82
0.43
0.47
0.72
1.47
1.79
0.354
0.132
0.147
0.285
0.789
1.019
40.7
27.4
28.9
40.0
54.9
57.7
Japan
0.01 Mean
2.5% centile
5% centile
50% centile
95% centile
97.5% centile
0.40
–0.01
0.04
0.37
0.86
0.99
0.41
–0.01
0.04
0.37
0.86
0.99
0.137
–0.004
0.010
0.109
0.337
0.440
31.5
20.1
21.1
29.7
48.3
52.9
0.1 Mean
2.5% centile
5% centile
50% centile
95% centile
97.5% centile
0.45
0.05
0.10
0.41
0.89
1.02
0.45
0.05
0.10
0.41
0.89
1.02
0.151
0.014
0.027
0.123
0.356
0.469
31.5
20.1
21.1
29.7
48.3
52.9
1 Mean
2.5% centile
5% centile
50% centile
95% centile
97.5% centile
0.90
0.56
0.60
0.86
1.31
1.49
0.91
0.57
0.60
0.86
1.31
1.49
0.296
0.141
0.153
0.251
0.584
0.740
31.5
20.2
21.1
29.7
47.9
52.4
Puerto Rico
0.01 Mean
2.5% centile
5% centile
50% centile
95% centile
97.5% centile
0.43
–0.01
0.04
0.39
0.89
1.02
0.43
–0.01
0.04
0.39
0.90
1.02
0.111
–0.003
0.009
0.090
0.272
0.357
24.5
14.9
15.6
22.6
40.2
45.0
0.1 Mean
2.5% centile
5% centile
50% centile
95% centile
97.5% centile
0.48
0.05
0.11
0.44
0.92
1.05
0.48
0.05
0.11
0.44
0.93
1.05
0.124
0.011
0.022
0.101
0.288
0.380
24.5
14.9
15.6
22.6
40.2
45.0
1 Mean
2.5% centile
5% centile
50% centile
95% centile
97.5% centile
0.96
0.61
0.65
0.92
1.35
1.49
0.96
0.61
0.65
0.93
1.35
1.50
0.241
0.119
0.129
0.205
0.470
0.594
24.4
14.9
15.7
22.6
39.7
44.3
UNSCEAR REPORT-PART 4.qxp 10/7/08 3:39 pm Page 251
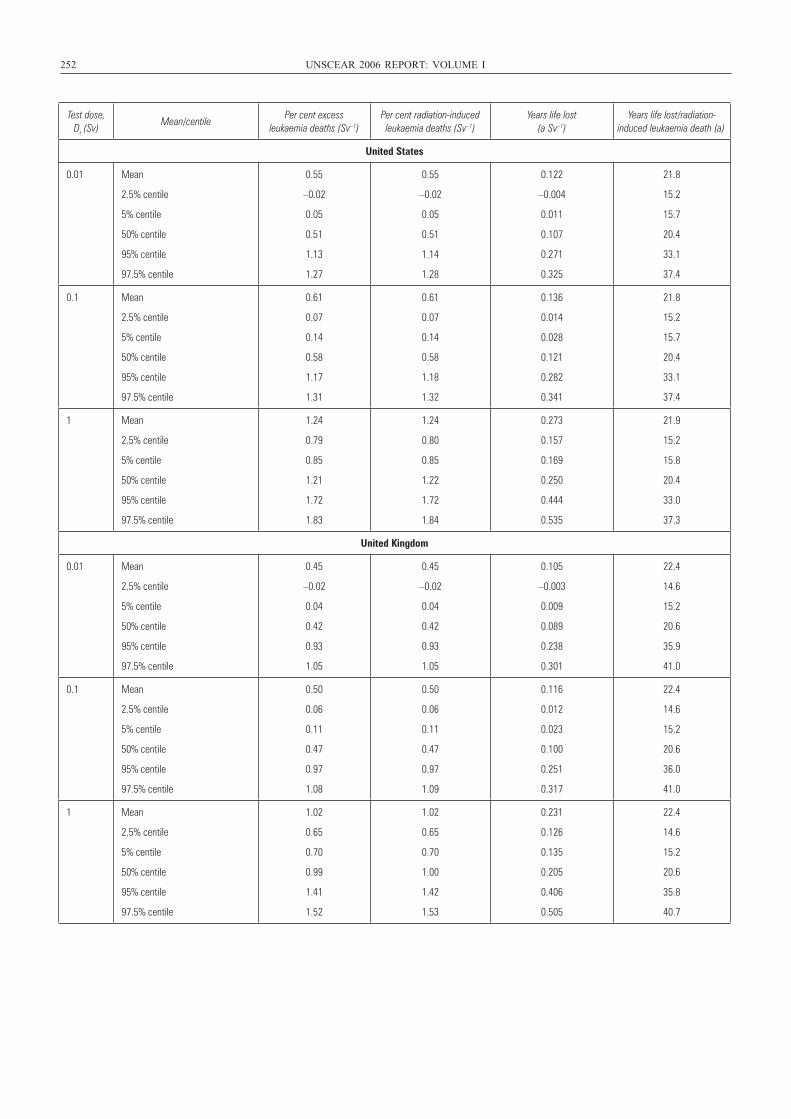
252 UNSCEAR 2006 REPORT: VOLUME I
Test dose, Dt (Sv)
Mean/centilePer cent excess
leukaemia deaths (Sv–1)Per cent radiation-induced leukaemia deaths (Sv–1)
Years life lost (a Sv–1)
Years life lost/radiation-induced leukaemia death (a)
United States
0.01 Mean
2.5% centile
5% centile
50% centile
95% centile
97.5% centile
0.55
–0.02
0.05
0.51
1.13
1.27
0.55
–0.02
0.05
0.51
1.14
1.28
0.122
–0.004
0.011
0.107
0.271
0.325
21.8
15.2
15.7
20.4
33.1
37.4
0.1 Mean
2.5% centile
5% centile
50% centile
95% centile
97.5% centile
0.61
0.07
0.14
0.58
1.17
1.31
0.61
0.07
0.14
0.58
1.18
1.32
0.136
0.014
0.028
0.121
0.282
0.341
21.8
15.2
15.7
20.4
33.1
37.4
1 Mean
2.5% centile
5% centile
50% centile
95% centile
97.5% centile
1.24
0.79
0.85
1.21
1.72
1.83
1.24
0.80
0.85
1.22
1.72
1.84
0.273
0.157
0.169
0.250
0.444
0.535
21.9
15.2
15.8
20.4
33.0
37.3
United Kingdom
0.01 Mean
2.5% centile
5% centile
50% centile
95% centile
97.5% centile
0.45
–0.02
0.04
0.42
0.93
1.05
0.45
–0.02
0.04
0.42
0.93
1.05
0.105
–0.003
0.009
0.089
0.238
0.301
22.4
14.6
15.2
20.6
35.9
41.0
0.1 Mean
2.5% centile
5% centile
50% centile
95% centile
97.5% centile
0.50
0.06
0.11
0.47
0.97
1.08
0.50
0.06
0.11
0.47
0.97
1.09
0.116
0.012
0.023
0.100
0.251
0.317
22.4
14.6
15.2
20.6
36.0
41.0
1
Mean
2.5% centile
5% centile
50% centile
95% centile
97.5% centile
1.02
0.65
0.70
0.99
1.41
1.52
1.02
0.65
0.70
1.00
1.42
1.53
0.231
0.126
0.135
0.205
0.406
0.505
22.4
14.6
15.2
20.6
35.8
40.7
UNSCEAR REPORT-PART 4.qxp 10/7/08 3:39 pm Page 252
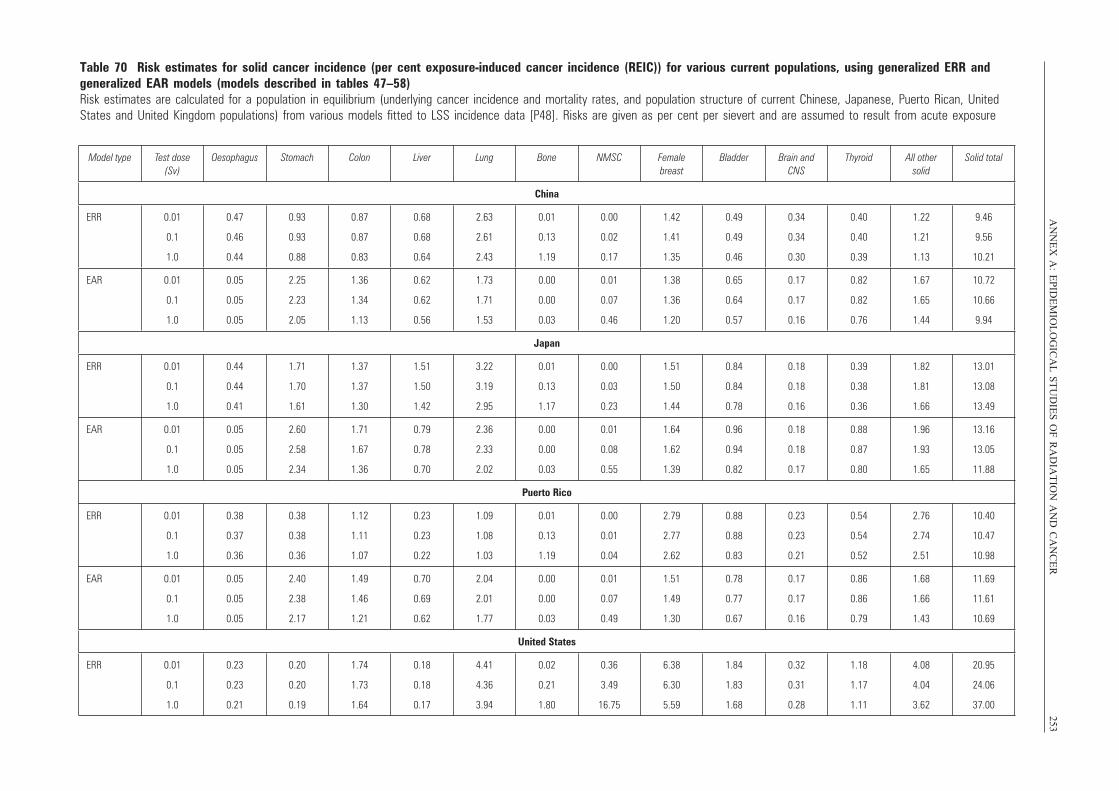
AN
NE
X A
:E
PID
EM
IOL
OG
ICA
L S
TU
DIE
S O
F R
AD
IAT
ION
AN
D C
AN
CE
R253
Table 70 Risk estimates for solid cancer incidence (per cent exposure-induced cancer incidence (REIC)) for various current populations, using generalized ERR and generalized EAR models (models described in tables 47–58)Risk estimates are calculated for a population in equilibrium (underlying cancer incidence and mortality rates, and population structure of current Chinese, Japanese, Puerto Rican, UnitedStates and United Kingdom populations) from various models fitted to LSS incidence data [P48]. Risks are given as per cent per sievert and are assumed to result from acute exposure
Model type Test dose (Sv)
Oesophagus Stomach Colon Liver Lung Bone NMSC Female breast
Bladder Brain and CNS
Thyroid All other solid
Solid total
China
ERR 0.01
0.1
1.0
0.47
0.46
0.44
0.93
0.93
0.88
0.87
0.87
0.83
0.68
0.68
0.64
2.63
2.61
2.43
0.01
0.13
1.19
0.00
0.02
0.17
1.42
1.41
1.35
0.49
0.49
0.46
0.34
0.34
0.30
0.40
0.40
0.39
1.22
1.21
1.13
9.46
9.56
10.21
EAR 0.01
0.1
1.0
0.05
0.05
0.05
2.25
2.23
2.05
1.36
1.34
1.13
0.62
0.62
0.56
1.73
1.71
1.53
0.00
0.00
0.03
0.01
0.07
0.46
1.38
1.36
1.20
0.65
0.64
0.57
0.17
0.17
0.16
0.82
0.82
0.76
1.67
1.65
1.44
10.72
10.66
9.94
Japan
ERR 0.01
0.1
1.0
0.44
0.44
0.41
1.71
1.70
1.61
1.37
1.37
1.30
1.51
1.50
1.42
3.22
3.19
2.95
0.01
0.13
1.17
0.00
0.03
0.23
1.51
1.50
1.44
0.84
0.84
0.78
0.18
0.18
0.16
0.39
0.38
0.36
1.82
1.81
1.66
13.01
13.08
13.49
EAR 0.01
0.1
1.0
0.05
0.05
0.05
2.60
2.58
2.34
1.71
1.67
1.36
0.79
0.78
0.70
2.36
2.33
2.02
0.00
0.00
0.03
0.01
0.08
0.55
1.64
1.62
1.39
0.96
0.94
0.82
0.18
0.18
0.17
0.88
0.87
0.80
1.96
1.93
1.65
13.16
13.05
11.88
Puerto Rico
ERR 0.01
0.1
1.0
0.38
0.37
0.36
0.38
0.38
0.36
1.12
1.11
1.07
0.23
0.23
0.22
1.09
1.08
1.03
0.01
0.13
1.19
0.00
0.01
0.04
2.79
2.77
2.62
0.88
0.88
0.83
0.23
0.23
0.21
0.54
0.54
0.52
2.76
2.74
2.51
10.40
10.47
10.98
EAR 0.01
0.1
1.0
0.05
0.05
0.05
2.40
2.38
2.17
1.49
1.46
1.21
0.70
0.69
0.62
2.04
2.01
1.77
0.00
0.00
0.03
0.01
0.07
0.49
1.51
1.49
1.30
0.78
0.77
0.67
0.17
0.17
0.16
0.86
0.86
0.79
1.68
1.66
1.43
11.69
11.61
10.69
United States
ERR 0.01
0.1
1.0
0.23
0.23
0.21
0.20
0.20
0.19
1.74
1.73
1.64
0.18
0.18
0.17
4.41
4.36
3.94
0.02
0.21
1.80
0.36
3.49
16.75
6.38
6.30
5.59
1.84
1.83
1.68
0.32
0.31
0.28
1.18
1.17
1.11
4.08
4.04
3.62
20.95
24.06
37.00
UNSCEAR REPORT-PART 4.qxp 10/7/08 3:39 pm Page 253
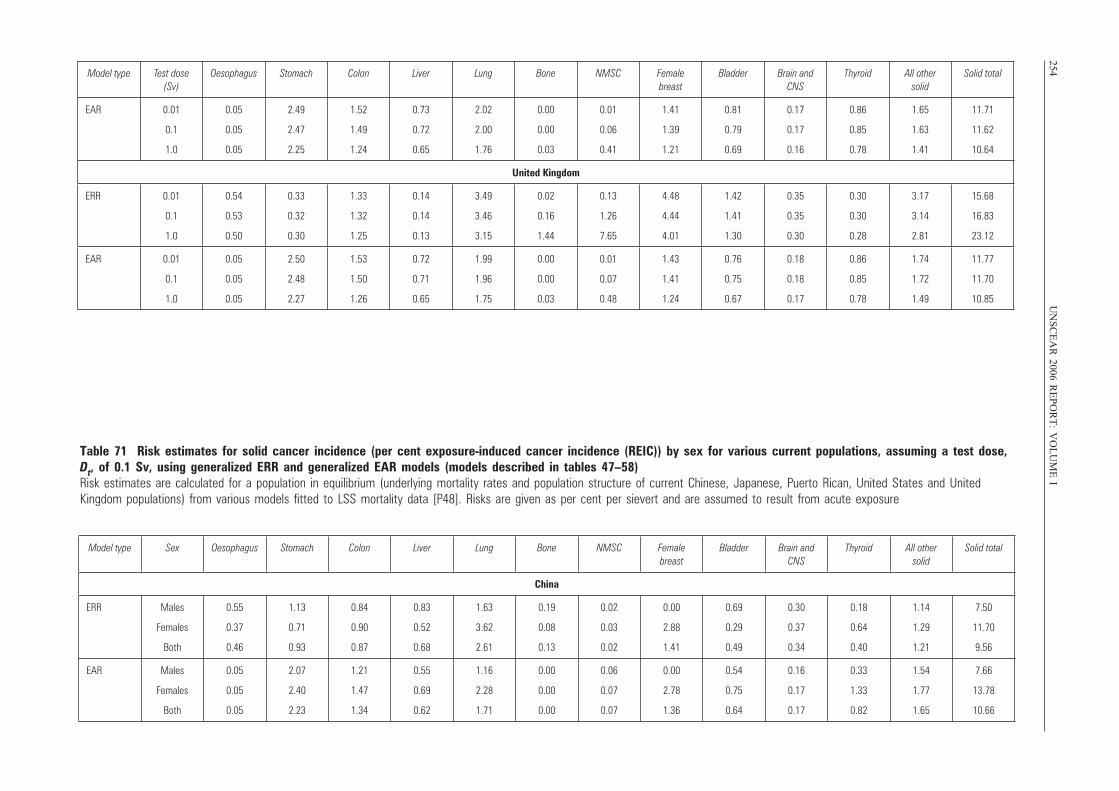
254U
NS
CE
AR
2006 RE
PO
RT
: VO
LU
ME
IModel type Test dose
(Sv)Oesophagus Stomach Colon Liver Lung Bone NMSC Female
breastBladder Brain and
CNSThyroid All other
solidSolid total
EAR 0.01
0.1
1.0
0.05
0.05
0.05
2.49
2.47
2.25
1.52
1.49
1.24
0.73
0.72
0.65
2.02
2.00
1.76
0.00
0.00
0.03
0.01
0.06
0.41
1.41
1.39
1.21
0.81
0.79
0.69
0.17
0.17
0.16
0.86
0.85
0.78
1.65
1.63
1.41
11.71
11.62
10.64
United Kingdom
ERR 0.01
0.1
1.0
0.54
0.53
0.50
0.33
0.32
0.30
1.33
1.32
1.25
0.14
0.14
0.13
3.49
3.46
3.15
0.02
0.16
1.44
0.13
1.26
7.65
4.48
4.44
4.01
1.42
1.41
1.30
0.35
0.35
0.30
0.30
0.30
0.28
3.17
3.14
2.81
15.68
16.83
23.12
EAR 0.01
0.1
1.0
0.05
0.05
0.05
2.50
2.48
2.27
1.53
1.50
1.26
0.72
0.71
0.65
1.99
1.96
1.75
0.00
0.00
0.03
0.01
0.07
0.48
1.43
1.41
1.24
0.76
0.75
0.67
0.18
0.18
0.17
0.86
0.85
0.78
1.74
1.72
1.49
11.77
11.70
10.85
Table 71 Risk estimates for solid cancer incidence (per cent exposure-induced cancer incidence (REIC)) by sex for various current populations, assuming a test dose,Dt, of 0.1 Sv, using generalized ERR and generalized EAR models (models described in tables 47–58)Risk estimates are calculated for a population in equilibrium (underlying mortality rates and population structure of current Chinese, Japanese, Puerto Rican, United States and UnitedKingdom populations) from various models fitted to LSS mortality data [P48]. Risks are given as per cent per sievert and are assumed to result from acute exposure
Model type Sex Oesophagus Stomach Colon Liver Lung Bone NMSC Female breast
Bladder Brain and CNS
Thyroid All other solid
Solid total
China
ERR Males
Females
Both
0.55
0.37
0.46
1.13
0.71
0.93
0.84
0.90
0.87
0.83
0.52
0.68
1.63
3.62
2.61
0.19
0.08
0.13
0.02
0.03
0.02
0.00
2.88
1.41
0.69
0.29
0.49
0.30
0.37
0.34
0.18
0.64
0.40
1.14
1.29
1.21
7.50
11.70
9.56
EAR Males
Females
Both
0.05
0.05
0.05
2.07
2.40
2.23
1.21
1.47
1.34
0.55
0.69
0.62
1.16
2.28
1.71
0.00
0.00
0.00
0.06
0.07
0.07
0.00
2.78
1.36
0.54
0.75
0.64
0.16
0.17
0.17
0.33
1.33
0.82
1.54
1.77
1.65
7.66
13.78
10.66
UNSCEAR REPORT-PART 4.qxp 10/7/08 3:39 pm Page 254
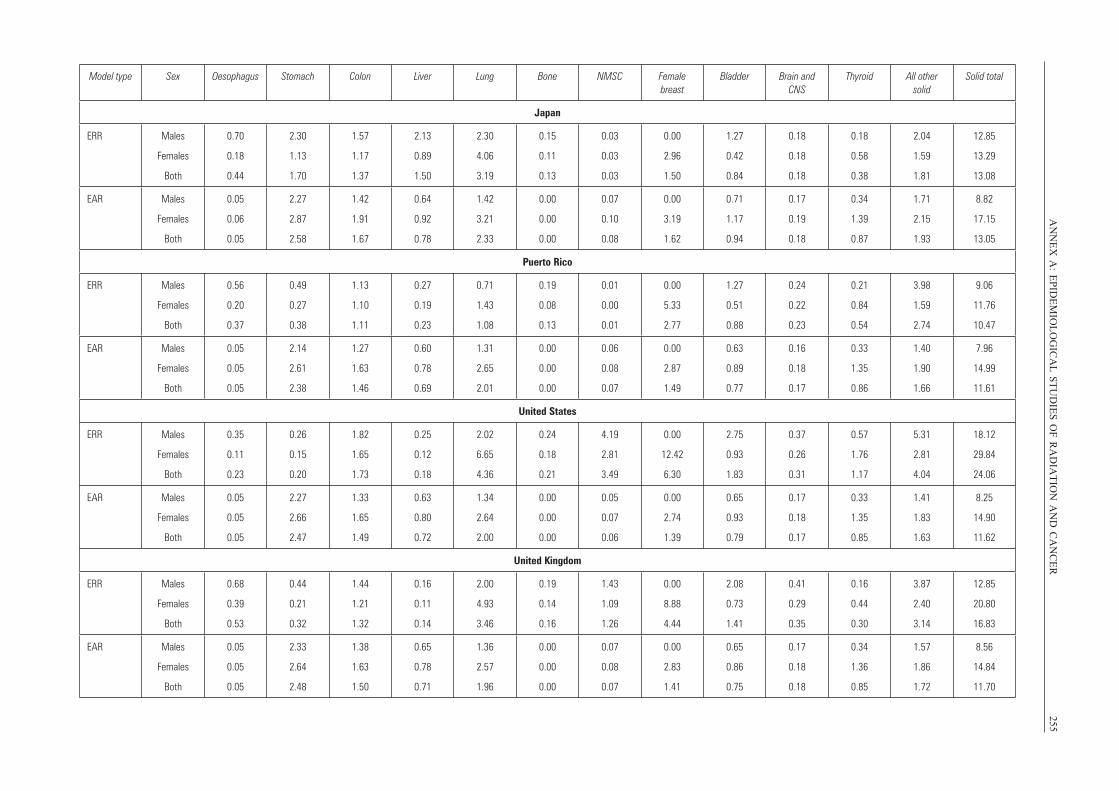
AN
NE
X A
:E
PID
EM
IOL
OG
ICA
L S
TU
DIE
S O
F R
AD
IAT
ION
AN
D C
AN
CE
R255
Model type Sex Oesophagus Stomach Colon Liver Lung Bone NMSC Female breast
Bladder Brain and CNS
Thyroid All other solid
Solid total
Japan
ERR Males
Females
Both
0.70
0.18
0.44
2.30
1.13
1.70
1.57
1.17
1.37
2.13
0.89
1.50
2.30
4.06
3.19
0.15
0.11
0.13
0.03
0.03
0.03
0.00
2.96
1.50
1.27
0.42
0.84
0.18
0.18
0.18
0.18
0.58
0.38
2.04
1.59
1.81
12.85
13.29
13.08
EAR Males
Females
Both
0.05
0.06
0.05
2.27
2.87
2.58
1.42
1.91
1.67
0.64
0.92
0.78
1.42
3.21
2.33
0.00
0.00
0.00
0.07
0.10
0.08
0.00
3.19
1.62
0.71
1.17
0.94
0.17
0.19
0.18
0.34
1.39
0.87
1.71
2.15
1.93
8.82
17.15
13.05
Puerto Rico
ERR Males
Females
Both
0.56
0.20
0.37
0.49
0.27
0.38
1.13
1.10
1.11
0.27
0.19
0.23
0.71
1.43
1.08
0.19
0.08
0.13
0.01
0.00
0.01
0.00
5.33
2.77
1.27
0.51
0.88
0.24
0.22
0.23
0.21
0.84
0.54
3.98
1.59
2.74
9.06
11.76
10.47
EAR Males
Females
Both
0.05
0.05
0.05
2.14
2.61
2.38
1.27
1.63
1.46
0.60
0.78
0.69
1.31
2.65
2.01
0.00
0.00
0.00
0.06
0.08
0.07
0.00
2.87
1.49
0.63
0.89
0.77
0.16
0.18
0.17
0.33
1.35
0.86
1.40
1.90
1.66
7.96
14.99
11.61
United States
ERR Males
Females
Both
0.35
0.11
0.23
0.26
0.15
0.20
1.82
1.65
1.73
0.25
0.12
0.18
2.02
6.65
4.36
0.24
0.18
0.21
4.19
2.81
3.49
0.00
12.42
6.30
2.75
0.93
1.83
0.37
0.26
0.31
0.57
1.76
1.17
5.31
2.81
4.04
18.12
29.84
24.06
EAR Males
Females
Both
0.05
0.05
0.05
2.27
2.66
2.47
1.33
1.65
1.49
0.63
0.80
0.72
1.34
2.64
2.00
0.00
0.00
0.00
0.05
0.07
0.06
0.00
2.74
1.39
0.65
0.93
0.79
0.17
0.18
0.17
0.33
1.35
0.85
1.41
1.83
1.63
8.25
14.90
11.62
United Kingdom
ERR Males
Females
Both
0.68
0.39
0.53
0.44
0.21
0.32
1.44
1.21
1.32
0.16
0.11
0.14
2.00
4.93
3.46
0.19
0.14
0.16
1.43
1.09
1.26
0.00
8.88
4.44
2.08
0.73
1.41
0.41
0.29
0.35
0.16
0.44
0.30
3.87
2.40
3.14
12.85
20.80
16.83
EAR Males
Females
Both
0.05
0.05
0.05
2.33
2.64
2.48
1.38
1.63
1.50
0.65
0.78
0.71
1.36
2.57
1.96
0.00
0.00
0.00
0.07
0.08
0.07
0.00
2.83
1.41
0.65
0.86
0.75
0.17
0.18
0.18
0.34
1.36
0.85
1.57
1.86
1.72
8.56
14.84
11.70
UNSCEAR REPORT-PART 4.qxp 10/7/08 3:39 pm Page 255
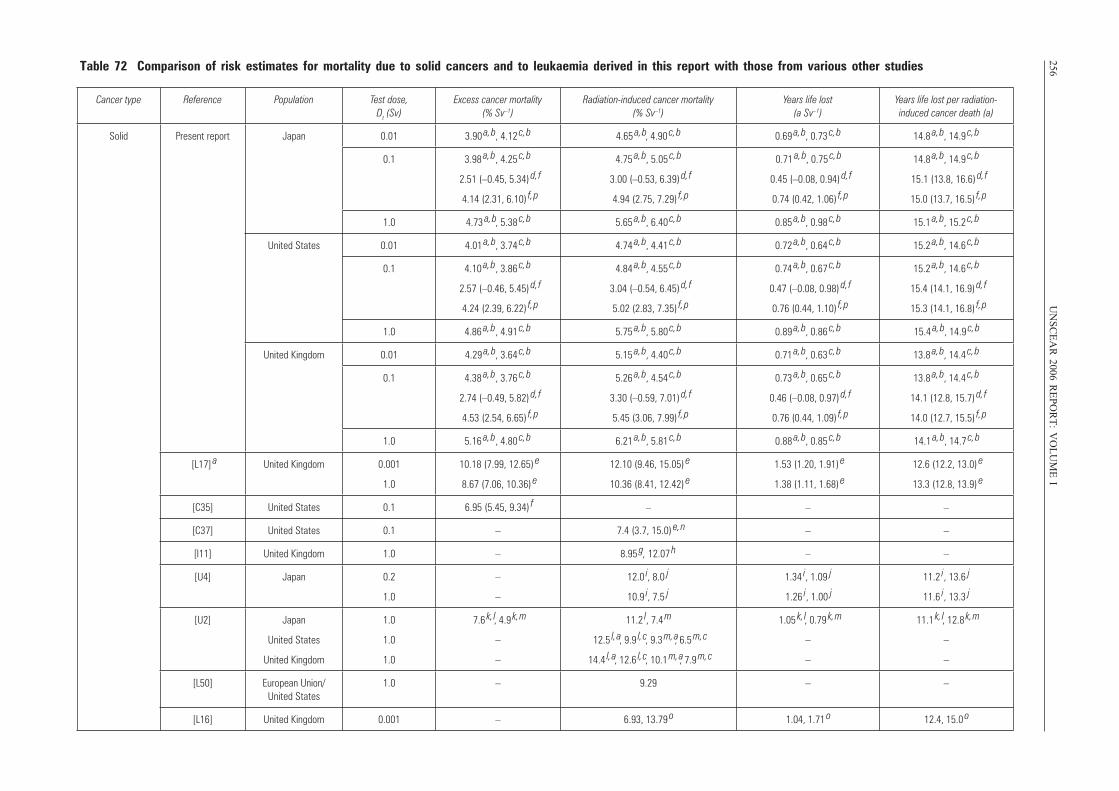
256U
NS
CE
AR
2006 RE
PO
RT
: VO
LU
ME
ITable 72 Comparison of risk estimates for mortality due to solid cancers and to leukaemia derived in this report with those from various other studies
Cancer type Reference Population Test dose, Dt (Sv)
Excess cancer mortality (% Sv–1)
Radiation-induced cancer mortality (% Sv–1)
Years life lost (a Sv–1)
Years life lost per radiation-induced cancer death (a)
Solid Present report Japan 0.01 3.90 a, b , 4.12
c, b 4.65 a, b, 4.90
c, b 0.69 a, b , 0.73
c, b 14.8 a, b , 14.9
c, b
0.1 3.98 a, b , 4.25
c, b
2.51 (–0.45, 5.34) d, f
4.14 (2.31, 6.10) f, p
4.75 a, b , 5.05
c, b
3.00 (–0.53, 6.39) d, f
4.94 (2.75, 7.29) f, p
0.71 a, b , 0.75
c, b
0.45 (–0.08, 0.94) d, f
0.74 (0.42, 1.06) f, p
14.8 a, b , 14.9
c, b
15.1 (13.8, 16.6) d, f
15.0 (13.7, 16.5) f, p
1.0 4.73 a, b , 5.38
c, b 5.65 a, b , 6.40
c, b 0.85 a, b , 0.98
c, b 15.1 a, b , 15.2
c, b
United States 0.01 4.01 a, b , 3.74
c, b 4.74 a, b , 4.41
c, b 0.72 a, b , 0.64
c, b 15.2 a, b , 14.6
c, b
0.1 4.10 a, b , 3.86
c, b
2.57 (–0.46, 5.45) d, f
4.24 (2.39, 6.22) f, p
4.84 a, b , 4.55
c, b
3.04 (–0.54, 6.45) d, f
5.02 (2.83, 7.35) f, p
0.74 a, b , 0.67
c, b
0.47 (–0.08, 0.98) d, f
0.76 (0.44, 1.10) f, p
15.2 a, b , 14.6
c, b
15.4 (14.1, 16.9) d, f
15.3 (14.1, 16.8) f, p
1.0 4.86 a, b , 4.91
c, b 5.75 a, b , 5.80
c, b 0.89 a, b , 0.86
c, b 15.4 a, b , 14.9
c, b
United Kingdom 0.01 4.29 a, b , 3.64
c, b 5.15 a, b , 4.40
c, b 0.71 a, b , 0.63
c, b 13.8 a, b , 14.4
c, b
0.1 4.38 a, b , 3.76
c, b
2.74 (–0.49, 5.82) d, f
4.53 (2.54, 6.65) f, p
5.26 a, b , 4.54
c, b
3.30 (–0.59, 7.01) d, f
5.45 (3.06, 7.99) f, p
0.73 a, b , 0.65
c, b
0.46 (–0.08, 0.97) d, f
0.76 (0.44, 1.09) f, p
13.8 a, b , 14.4
c, b
14.1 (12.8, 15.7) d, f
14.0 (12.7, 15.5) f, p
1.0 5.16 a, b , 4.80
c, b 6.21 a, b , 5.81
c, b 0.88 a, b , 0.85
c, b 14.1 a, b , 14.7
c, b
[L17] a United Kingdom 0.001
1.0
10.18 (7.99, 12.65) e
8.67 (7.06, 10.36) e
12.10 (9.46, 15.05) e
10.36 (8.41, 12.42) e
1.53 (1.20, 1.91) e
1.38 (1.11, 1.68) e
12.6 (12.2, 13.0) e
13.3 (12.8, 13.9) e
[C35] United States 0.1 6.95 (5.45, 9.34) f – – –
[C37] United States 0.1 – 7.4 (3.7, 15.0) e, n – –
[I11] United Kingdom 1.0 – 8.95 g , 12.07
h – –
[U4] Japan 0.2
1.0
–
–
12.0 i, 8.0 j
10.9 i, 7.5 j
1.34 i , 1.09 j
1.26 i , 1.00 j
11.2 i , 13.6 j
11.6 i , 13.3 j
[U2] Japan
United States
United Kingdom
1.0
1.0
1.0
7.6 k, l , 4.9
k, m
–
–
11.2 l, 7.4
m
12.5 l, a , 9.9
l, c , 9.3 m, a , 6.5
m, c
14.4 l, a , 12.6
l, c , 10.1 m, a , 7.9
m, c
1.05 k, l , 0.79
k, m
–
–
11.1 k, l , 12.8
k, m
–
–
[L50] European Union/United States
1.0 – 9.29 – –
[L16] United Kingdom 0.001 – 6.93, 13.79 o 1.04, 1.71
o 12.4, 15.0 o
UNSCEAR REPORT-PART 4.qxp 10/7/08 3:39 pm Page 256
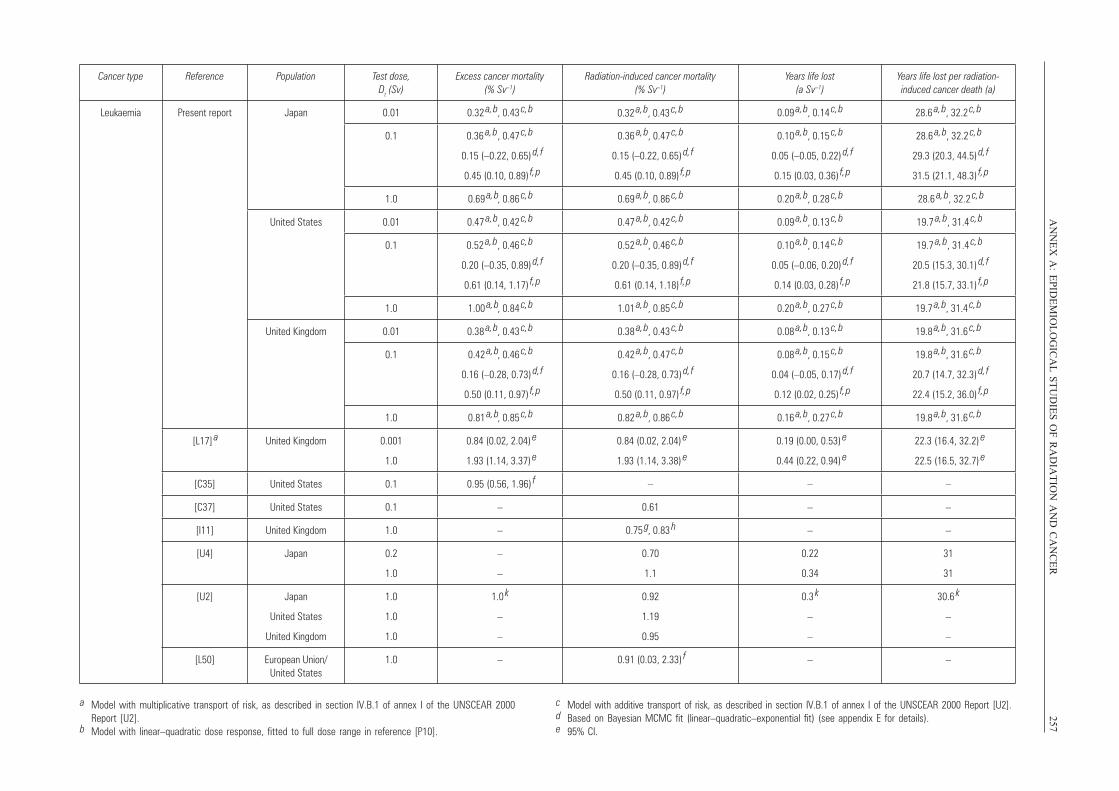
AN
NE
X A
:E
PID
EM
IOL
OG
ICA
L S
TU
DIE
S O
F R
AD
IAT
ION
AN
D C
AN
CE
R257
Cancer type Reference Population Test dose, Dt (Sv)
Excess cancer mortality (% Sv–1)
Radiation-induced cancer mortality (% Sv–1)
Years life lost (a Sv–1)
Years life lost per radiation-induced cancer death (a)
Leukaemia Present report Japan 0.01 0.32 a, b , 0.43
c, b 0.09 a, b , 0.14
c, b 28.6 a, b , 32.2
c, b
0.1 0.36 a, b , 0.47
c, b
0.15 (–0.22, 0.65) d, f
0.45 (0.10, 0.89) f, p
0.36 a, b , 0.47
c, b
0.15 (–0.22, 0.65) d, f
0.45 (0.10, 0.89) f, p
0.10 a, b , 0.15
c, b
0.05 (–0.05, 0.22) d, f
0.15 (0.03, 0.36) f, p
28.6 a, b , 32.2
c, b
29.3 (20.3, 44.5) d, f
31.5 (21.1, 48.3) f, p
1.0 0.69 a, b , 0.86
c, b 0.69 a, b , 0.86
c, b 0.20 a, b , 0.28
c, b 28.6 a, b, 32.2
c, b
United States 0.01 0.47 a, b , 0.42
c, b 0.47 a, b , 0.42
c, b 0.09 a, b , 0.13
c, b 19.7 a, b, 31.4
c, b
0.1 0.52 a, b , 0.46
c, b
0.20 (–0.35, 0.89) d, f
0.61 (0.14, 1.17) f, p
0.52 a, b , 0.46
c, b
0.20 (–0.35, 0.89) d, f
0.61 (0.14, 1.18) f, p
0.10 a, b , 0.14
c, b
0.05 (–0.06, 0.20) d, f
0.14 (0.03, 0.28) f, p
19.7 a, b, 31.4
c, b
20.5 (15.3, 30.1) d, f
21.8 (15.7, 33.1) f, p
1.0 1.00 a, b , 0.84
c, b 1.01 a, b , 0.85
c, b 0.20 a, b , 0.27
c, b 19.7 a, b , 31.4
c, b
United Kingdom 0.01 0.38 a, b , 0.43
c, b 0.38 a, b , 0.43
c, b 0.08 a, b , 0.13
c, b 19.8 a, b , 31.6
c, b
0.1 0.42 a, b , 0.46
c, b
0.16 (–0.28, 0.73) d, f
0.50 (0.11, 0.97) f, p
0.42 a, b , 0.47
c, b
0.16 (–0.28, 0.73) d, f
0.50 (0.11, 0.97) f, p
0.08 a, b , 0.15
c, b
0.04 (–0.05, 0.17) d, f
0.12 (0.02, 0.25) f, p
19.8 a, b , 31.6
c, b
20.7 (14.7, 32.3) d, f
22.4 (15.2, 36.0) f, p
1.0 0.81 a, b , 0.85
c, b 0.82 a, b , 0.86
c, b 0.16 a, b , 0.27
c, b 19.8 a, b , 31.6
c, b
[L17] a United Kingdom 0.001
1.0
0.84 (0.02, 2.04) e
1.93 (1.14, 3.37) e
0.84 (0.02, 2.04) e
1.93 (1.14, 3.38) e
0.19 (0.00, 0.53) e
0.44 (0.22, 0.94) e
22.3 (16.4, 32.2) e
22.5 (16.5, 32.7) e
[C35] United States 0.1 0.95 (0.56, 1.96) f – – –
[C37] United States 0.1 – 0.61 – –
[I11] United Kingdom 1.0 – 0.75 g , 0.83
h – –
[U4] Japan 0.2
1.0
–
–
0.70
1.1
0.22
0.34
31
31
[U2] Japan
United States
United Kingdom
1.0
1.0
1.0
1.0 k
–
–
0.92
1.19
0.95
0.3 k
–
–
30.6 k
–
–
[L50] European Union/United States
1.0 – 0.91 (0.03, 2.33) f – –
0.32 a, b , 0.43
c, b
a Model with multiplicative transport of risk, as described in section IV.B.1 of annex I of the UNSCEAR 2000Report [U2].
b Model with linear–quadratic dose response, fitted to full dose range in reference [P10].
c Model with additive transport of risk, as described in section IV.B.1 of annex I of the UNSCEAR 2000 Report [U2].d Based on Bayesian MCMC fit (linear–quadratic–exponential fit) (see appendix E for details).e 95% CI.
UNSCEAR REPORT-PART 4.qxp 10/7/08 3:39 pm Page 257
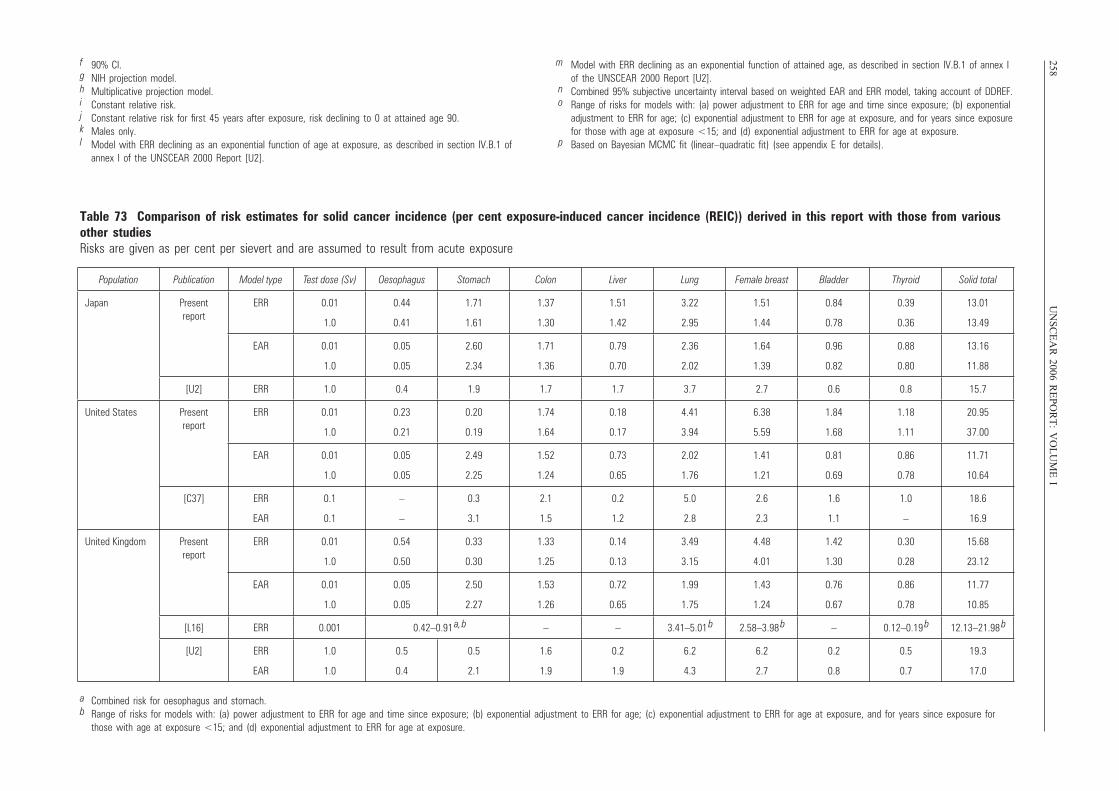
258U
NS
CE
AR
2006 RE
PO
RT
: VO
LU
ME
If 90% CI.g NIH projection model.h Multiplicative projection model.i Constant relative risk.j Constant relative risk for first 45 years after exposure, risk declining to 0 at attained age 90.k Males only.l Model with ERR declining as an exponential function of age at exposure, as described in section IV.B.1 of
annex I of the UNSCEAR 2000 Report [U2].
m Model with ERR declining as an exponential function of attained age, as described in section IV.B.1 of annex I of the UNSCEAR 2000 Report [U2].
n Combined 95% subjective uncertainty interval based on weighted EAR and ERR model, taking account of DDREF.o Range of risks for models with: (a) power adjustment to ERR for age and time since exposure; (b) exponential
adjustment to ERR for age; (c) exponential adjustment to ERR for age at exposure, and for years since exposurefor those with age at exposure <15; and (d) exponential adjustment to ERR for age at exposure.
p Based on Bayesian MCMC fit (linear–quadratic fit) (see appendix E for details).
Table 73 Comparison of risk estimates for solid cancer incidence (per cent exposure-induced cancer incidence (REIC)) derived in this report with those from variousother studiesRisks are given as per cent per sievert and are assumed to result from acute exposure
Population Publication Model type Test dose (Sv) Oesophagus Stomach Colon Liver Lung Female breast Bladder Thyroid Solid total
Japan Present report
ERR 0.01
1.0
0.44
0.41
1.71
1.61
1.37
1.30
1.51
1.42
3.22
2.95
1.51
1.44
0.84
0.78
0.39
0.36
13.01
13.49
EAR 0.01
1.0
0.05
0.05
2.60
2.34
1.71
1.36
0.79
0.70
2.36
2.02
1.64
1.39
0.96
0.82
0.88
0.80
13.16
11.88
[U2] ERR 1.0 0.4 1.9 1.7 1.7 3.7 2.7 0.6 0.8 15.7
United States Present report
ERR 0.01
1.0
0.23
0.21
0.20
0.19
1.74
1.64
0.18
0.17
4.41
3.94
6.38
5.59
1.84
1.68
1.18
1.11
20.95
37.00
EAR 0.01
1.0
0.05
0.05
2.49
2.25
1.52
1.24
0.73
0.65
2.02
1.76
1.41
1.21
0.81
0.69
0.86
0.78
11.71
10.64
[C37] ERR
EAR
0.1
0.1
–
–
0.3
3.1
2.1
1.5
0.2
1.2
5.0
2.8
2.6
2.3
1.6
1.1
1.0
–
18.6
16.9
United Kingdom Present report
ERR 0.01
1.0
0.54
0.50
0.33
0.30
1.33
1.25
0.14
0.13
3.49
3.15
4.48
4.01
1.42
1.30
0.30
0.28
15.68
23.12
EAR 0.01
1.0
0.05
0.05
2.50
2.27
1.53
1.26
0.72
0.65
1.99
1.75
1.43
1.24
0.76
0.67
0.86
0.78
11.77
10.85
[L16] ERR 0.001 0.42–0.91 a, b – – 3.41–5.01
b 2.58–3.98 b – 0.12–0.19
b 12.13–21.98 b
[U2] ERR
EAR
1.0
1.0
0.5
0.4
0.5
2.1
1.6
1.9
0.2
1.9
6.2
4.3
6.2
2.7
0.2
0.8
0.5
0.7
19.3
17.0
a Combined risk for oesophagus and stomach.b Range of risks for models with: (a) power adjustment to ERR for age and time since exposure; (b) exponential adjustment to ERR for age; (c) exponential adjustment to ERR for age at exposure, and for years since exposure for
those with age at exposure <15; and (d) exponential adjustment to ERR for age at exposure.
UNSCEAR REPORT-PART 4.qxp 10/7/08 3:39 pm Page 258
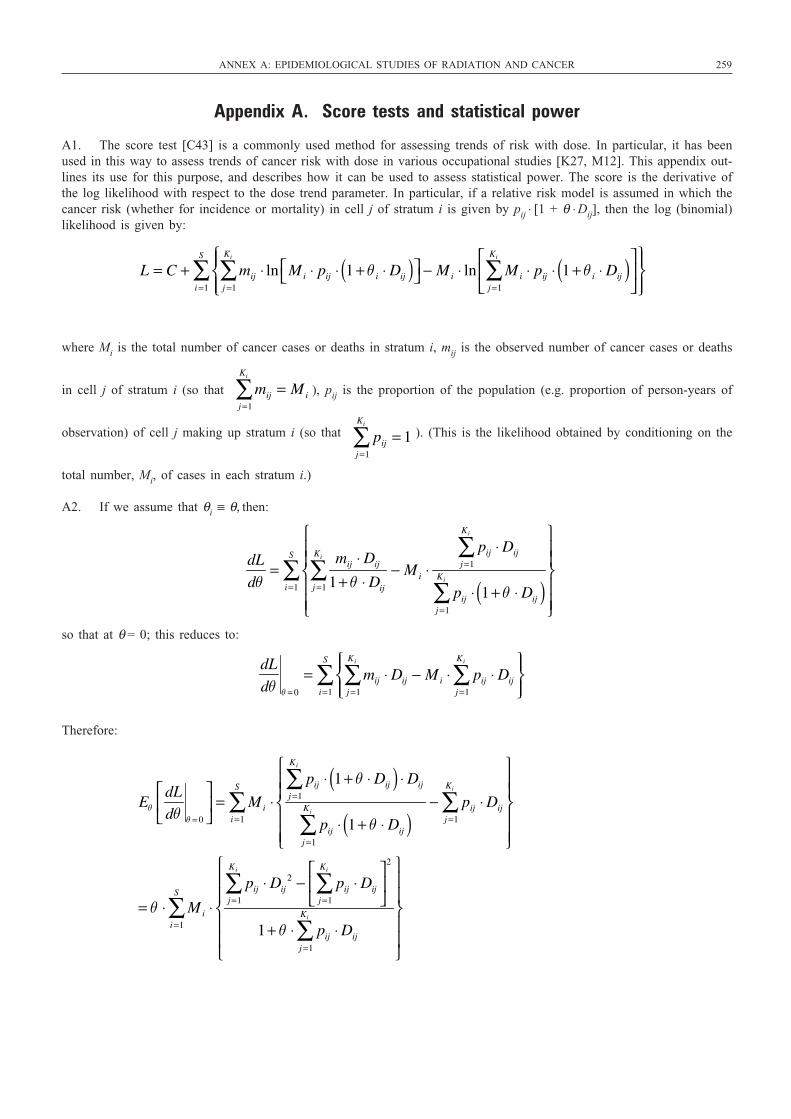
Appendix A. Score tests and statistical power
A1. The score test [C43] is a commonly used method for assessing trends of risk with dose. In particular, it has beenused in this way to assess trends of cancer risk with dose in various occupational studies [K27, M12]. This appendix out-lines its use for this purpose, and describes how it can be used to assess statistical power. The score is the derivative ofthe log likelihood with respect to the dose trend parameter. In particular, if a relative risk model is assumed in which thecancer risk (whether for incidence or mortality) in cell j of stratum i is given by pij ⋅ [1 + θ ⋅ Dij], then the log (binomial)likelihood is given by:
where Mi is the total number of cancer cases or deaths in stratum i, mij is the observed number of cancer cases or deaths
in cell j of stratum i (so that ), pij is the proportion of the population (e.g. proportion of person-years of
observation) of cell j making up stratum i (so that ). (This is the likelihood obtained by conditioning on the
total number, Mi, of cases in each stratum i.)
A2. If we assume that θi ≡ θ, then:
so that at θ = 0; this reduces to:
Therefore:
EθdL
dθ θ = 0
⎡
⎣⎢
⎤
⎦⎥ = Mi ⋅
pij ⋅ 1+ θ ⋅ Dij( ) ⋅ Dijj =1
Ki
∑
pij ⋅ 1+ θ ⋅ Dij( )j =1
Ki
∑− pij ⋅ Dij
j =1
Ki
∑⎧
⎨⎪⎪
⎩⎪⎪
⎫
⎬⎪⎪
⎭⎪⎪
i =1
S
∑
= θ ⋅ Mi ⋅pij ⋅ Dij
2
j =1
Ki
∑ − pij ⋅ Dijj =1
Ki
∑⎡
⎣⎢
⎤
⎦⎥
2
1+ θ ⋅ pij ⋅ Dijj =1
Ki
∑
⎧
⎨
⎪⎪
⎩
⎪⎪
⎫
⎬
⎪⎪
⎭
⎪⎪
i =1
S
∑
dL
dθ θ = 0
= mij ⋅ Dijj =1
Ki
∑ − Mi ⋅ pij ⋅ Dijj =1
Ki
∑⎧⎨⎪
⎩⎪
⎫⎬⎪
⎭⎪i=1
S
∑
dL
dθ=
mij ⋅ Dij
1+ θ ⋅ Dijj =1
Ki
∑ − Mi ⋅pij ⋅ Dij
j =1
Ki
∑
pij ⋅ 1+ θ ⋅ Dij( )j =1
Ki
∑
⎧
⎨⎪⎪
⎩⎪⎪
⎫
⎬⎪⎪
⎭⎪⎪
i=1
S
∑
pijj =1
Ki
∑ = 1
mijj =1
Ki
∑ = Mi
L = C + mij ⋅ ln Mi ⋅ pij ⋅ 1 + θ i ⋅ Dij( )⎡⎣ ⎤⎦j =1
Ki
∑ − Mi ⋅ ln Mi ⋅ pij ⋅ 1 + θ i ⋅ Dij( )j =1
Ki
∑⎡
⎣⎢
⎤
⎦⎥
⎧⎨⎪
⎩⎪
⎫⎬⎪
⎭⎪i =1
S
∑
ANNEX A: EPIDEMIOLOGICAL STUDIES OF RADIATION AND CANCER 259
UNSCEAR REPORT-PART 5.qxp 10/7/08 3:41 pm Page 259
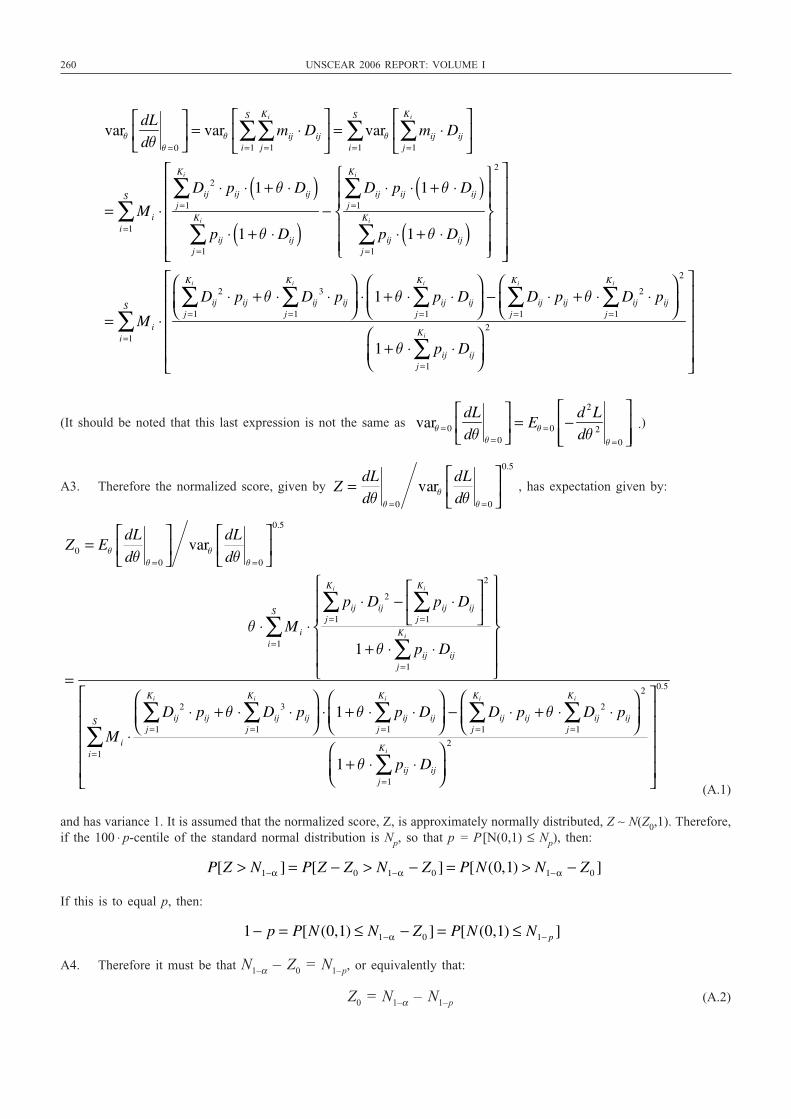
260 UNSCEAR 2006 REPORT: VOLUME I
(It should be noted that this last expression is not the same as .)
A3. Therefore the normalized score, given by , has expectation given by:
(A.1)
and has variance 1. It is assumed that the normalized score, Z, is approximately normally distributed, Z ∼ N(Z0,1). Therefore,if the 100 ⋅ p-centile of the standard normal distribution is Np, so that p = P[N(0,1) ≤ Np), then:
If this is to equal p, then:
A4. Therefore it must be that N1–α – Z0 = N1–p, or equivalently that:
Z0 = N1–α – N1–p (A.2)
1− p = P[N (0,1) ≤ N1−α − Z0 ] = P[N (0,1) ≤ N1− p ]
P[Z > N1−α ] = P[Z − Z0 > N1−α − Z0 ] = P[N(0,1) > N1−α − Z0 ]
Z0 = Eθ
dL
dθ θ =0
⎡
⎣⎢
⎤
⎦⎥ varθ
dL
dθ θ =0
⎡
⎣⎢
⎤
⎦⎥
0.5
=
θ ⋅ Mi ⋅pij ⋅ Dij
2
j =1
Ki
∑ − pij ⋅ Dijj =1
Ki
∑⎡
⎣⎢
⎤
⎦⎥
2
1 + θ ⋅ pij ⋅ Dijj =1
Ki
∑
⎧
⎨
⎪⎪
⎩
⎪⎪
⎫
⎬
⎪⎪
⎭
⎪⎪
i=1
S
∑
Mi ⋅Dij
2 ⋅ pijj =1
Ki
∑ + θ ⋅ Dij3 ⋅ pij
j =1
Ki
∑⎛
⎝⎜⎞
⎠⎟⋅ 1+ θ ⋅ pij ⋅ Dij
j =1
Ki
∑⎛
⎝⎜⎞
⎠⎟− Dij ⋅ pij
j =1
Ki
∑ + θ ⋅ Dij2 ⋅ pij
j =1
Ki
∑⎛
⎝⎜⎞
⎠⎟
2
1+ θ ⋅ pij ⋅ Dijj =1
Ki
∑⎛
⎝⎜⎞
⎠⎟
2i=1
S
∑
⎡
⎣
⎢⎢⎢⎢⎢
⎤
⎦
⎥⎥⎥⎥⎥
0.5
Z = dL
dθ θ =0
varθdL
dθ θ =0
⎡
⎣⎢
⎤
⎦⎥
0.5
varθ = 0
dL
dθ θ = 0
⎡
⎣⎢
⎤
⎦⎥ = Eθ = 0 − d 2L
dθ 2
θ =0
⎡
⎣⎢⎢
⎤
⎦⎥⎥
varθdL
dθ θ =0
⎡
⎣⎢
⎤
⎦⎥ = varθ mij ⋅ Dij
j =1
Ki
∑i=1
S
∑⎡
⎣⎢
⎤
⎦⎥ = varθ mij ⋅ Dij
j =1
Ki
∑⎡
⎣⎢
⎤
⎦⎥
i=1
S
∑
= Mi ⋅Dij
2 ⋅ pij ⋅ 1+ θ ⋅ Dij( )j =1
Ki
∑
pij ⋅ 1 + θ ⋅ Dij( )j =1
Ki
∑−
Dij ⋅ pij ⋅ 1+ θ ⋅ Dij( )j =1
Ki
∑
pij ⋅ 1+ θ ⋅ Dij( )j =1
Ki
∑
⎧
⎨⎪⎪
⎩⎪⎪
⎫
⎬⎪⎪
⎭⎪⎪
2⎡
⎣
⎢⎢⎢⎢⎢
⎤
⎦
⎥⎥⎥⎥⎥
i =1
S
∑
= Mi ⋅Dij
2 ⋅ pijj =1
Ki
∑ + θ ⋅ Dij3 ⋅ pij
j =1
Ki
∑⎛
⎝⎜⎞
⎠⎟⋅ 1+ θ ⋅ pij ⋅ Dij
j =1
Ki
∑⎛
⎝⎜⎞
⎠⎟− Dij ⋅ pij
j =1
Ki
∑ + θ ⋅ Dij2 ⋅ pij
j =1
Ki
∑⎛
⎝⎜⎞
⎠⎟
2
1+ θ ⋅ pij ⋅ Dijj =1
Ki
∑⎛
⎝⎜⎞
⎠⎟
2
⎡
⎣
⎢⎢⎢⎢⎢
⎤
⎦
⎥⎥⎥⎥⎥
i =1
S
∑
UNSCEAR REPORT-PART 5.qxp 10/7/08 3:41 pm Page 260
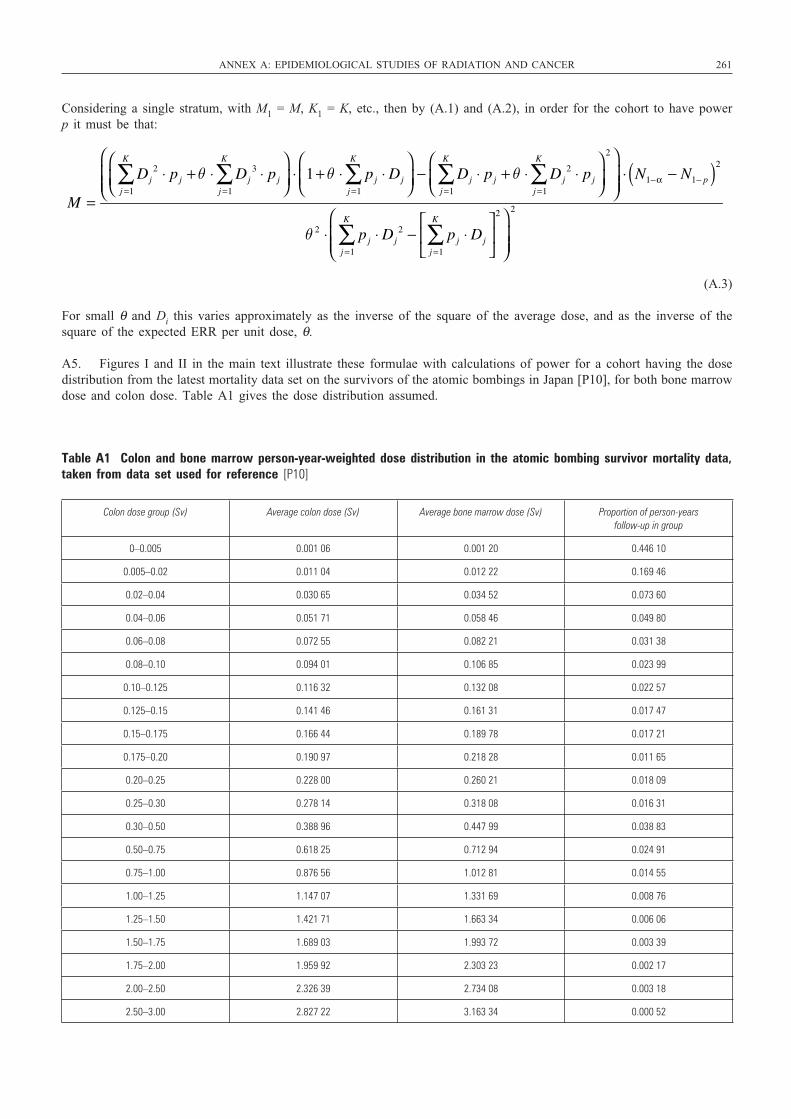
Considering a single stratum, with M1 = M, K1 = K, etc., then by (A.1) and (A.2), in order for the cohort to have powerp it must be that:
(A.3)
For small θ and Di this varies approximately as the inverse of the square of the average dose, and as the inverse of thesquare of the expected ERR per unit dose, θ.
A5. Figures I and II in the main text illustrate these formulae with calculations of power for a cohort having the dosedistribution from the latest mortality data set on the survivors of the atomic bombings in Japan [P10], for both bone marrowdose and colon dose. Table A1 gives the dose distribution assumed.
M =
Dj2 ⋅ pj
j =1
K
∑ + θ ⋅ Dj3 ⋅ pj
j =1
K
∑⎛
⎝⎜⎞
⎠⎟⋅ 1+ θ ⋅ pj ⋅ Dj
j =1
K
∑⎛
⎝⎜⎞
⎠⎟− Dj ⋅ pj
j =1
K
∑ + θ ⋅ Dj2 ⋅ pj
j =1
K
∑⎛
⎝⎜⎞
⎠⎟
2⎛
⎝⎜⎜
⎞
⎠⎟⎟
⋅ N1−α − N1− p( )2
θ 2 ⋅ pj ⋅ Dj2
j =1
K
∑ − pj ⋅ Djj =1
K
∑⎡
⎣⎢
⎤
⎦⎥
2⎛
⎝⎜⎜
⎞
⎠⎟⎟
2
ANNEX A: EPIDEMIOLOGICAL STUDIES OF RADIATION AND CANCER 261
Table A1 Colon and bone marrow person-year-weighted dose distribution in the atomic bombing survivor mortality data,taken from data set used for reference [P10]
Colon dose group (Sv) Average colon dose (Sv) Average bone marrow dose (Sv) Proportion of person-years follow-up in group
0–0.005 0.001 06 0.001 20 0.446 10
0.005–0.02 0.011 04 0.012 22 0.169 46
0.02–0.04 0.030 65 0.034 52 0.073 60
0.04–0.06 0.051 71 0.058 46 0.049 80
0.06–0.08 0.072 55 0.082 21 0.031 38
0.08–0.10 0.094 01 0.106 85 0.023 99
0.10–0.125 0.116 32 0.132 08 0.022 57
0.125–0.15 0.141 46 0.161 31 0.017 47
0.15–0.175 0.166 44 0.189 78 0.017 21
0.175–0.20 0.190 97 0.218 28 0.011 65
0.20–0.25 0.228 00 0.260 21 0.018 09
0.25–0.30 0.278 14 0.318 08 0.016 31
0.30–0.50 0.388 96 0.447 99 0.038 83
0.50–0.75 0.618 25 0.712 94 0.024 91
0.75–1.00 0.876 56 1.012 81 0.014 55
1.00–1.25 1.147 07 1.331 69 0.008 76
1.25–1.50 1.421 71 1.663 34 0.006 06
1.50–1.75 1.689 03 1.993 72 0.003 39
1.75–2.00 1.959 92 2.303 23 0.002 17
2.00–2.50 2.326 39 2.734 08 0.003 18
2.50–3.00 2.827 22 3.163 34 0.000 52
UNSCEAR REPORT-PART 5.qxp 10/7/08 3:41 pm Page 261
262 UNSCEAR 2006 REPORT: VOLUME I
Appendix B. Measures of radiation risk, including lifetime risk
B1. Fundamental to the calculation of measures of population risk is the estimation of the instantaneous cancer mortal-
ity rate, , expressed as cancer deaths per year, that will result for a given cancer type c at age t for per-
sons of sex s following some instantaneously administered radiation dose D given at age a. This is typically evaluated by
fitting a model for radiation risk to data corresponding to some exposed cohort. For example, the generalized relative risk
model assumes that the mortality rate for cancer type c at age t, y years after instantaneous exposure to a radiation dose
D administered at age a (so that t = a + y) is given by . Similar models
can also be fitted to cancer incidence data. Typically one can multiplicatively separate the radiation dose–response term
from the temporal modifiers in this expression, as for example .
For instance, one might use as the form of dose response the linear–quadratic–exponential expression
(a model suggested by much radiobiological data [U5]) (see also section I.K),
and as the temporal modifier term some empirical exponential function, .
B2. Once a model for radiation risk has been developed, it is in principle straightforward to use it to estimate the burden
of cancer in some hypothetically exposed population. Fundamental to assessment of risk in such a population, one must
assume “background” or “underlying” mortality rates, , that this population will experience in the absence of
radiation exposure, both overall and for each cancer type. Moreover, to calculate cancer risks for cancer incidence, cancer
incidence rates must also be specified. These background rates are generally estimated from national morbidity and
mortality rates. It is usual to calculate the consequence of an instantaneous exposure to a “test” dose Dt that is assumed
administered at some age a. However, other more general patterns of exposure are possible, and may be derived by
obvious generalizations of the calculations below. There are six commonly used measures of population cancer risk,
extensively reviewed elsewhere [B18, L17, T18]. The first measure is excess cancer deaths (ECD) per unit dose:
where is the instantaneous cancer mortality rate (cancers/year) for cancer type c at age t for persons of
sex s following the assumed dose Dt given at age a. As above, this is evaluated by some model fitted to data.
is the fraction of the population of sex s alive at age a who remain alive at age t (>a), and can be estimated
by
, where is the all-cause
mortality rate, a summation over the specific cancer type of interest, and all other cancer and non-cancer causes of death.
is the analogous survival probability at 0 radiation dose. If a generalized relative risk model were
to be fitted, in which for cancer type c the mortality rate at age t, y years after exposure to a dose Dt administered at age
a (so that t = a + y) is given by , then this risk can be written:
Persons are assumed capable of surviving in principle up to the age of yT, at which point they are assumed to die instan-taneously (i.e. the population is truncated at that age). The particular yT used does not much matter as long as it is
ECDc (s,a, Dt ) =
=
µc (s, t) ⋅[1+ ERRc (s,a,t − a, Dt )] ⋅ S(s, t) ⋅ exp − µc (s,w) ⋅ ERRc (s,a,w − a, Dt )dwa
t
∫⎡
⎣⎢
⎤
⎦⎥dt
a
yT
∫
− µc (s, t) ⋅ S(s,t )dta
yT
∫
⎧
⎨
⎪⎪
⎩
⎪⎪
⎫
⎬
⎪⎪
⎭
⎪⎪
Dt
µc (s, t | a, Dt ) = µc (s,t ) ⋅[1+ ERRc (s,a, y, Dt )]
S(s,t ) = Sc (s,t | a,0)
µ(s, t | a, Dt ) = µc (s,t | a, Dt ) + µl (s, t )l ≠c∑Sc (s,t | a, Dt ) = exp − µ(s,w | a, Dt )dw
a
t
∫⎡
⎣⎢
⎤
⎦⎥
Sc (s,t | a, Dt )
µc (s, t | a, Dt )
ECDc (s,a, Dt ) =µc (s,t | a, Dt ) ⋅ Sc (s,t | a, Dt )dt
a
yT
∫ − µc (s, t) ⋅ S(s, t | a)dta
yT
∫Dt
µc (s, t)
φc (s,a, y) = exp[κ0 +κ1 ⋅ s +κ 2 ⋅ a + κ 3 ⋅ y]Fc (D) = [a ⋅ D + β ⋅ D2 ] ⋅ exp[γ ⋅ D]
µc (s, t | a, D) = µc (s, t) ⋅[1 + Fc (D) ⋅φc (s,a, y)]
µc (s, t | a, D) = µc (s, t) ⋅[1 + ERRc (s,a, y, D)]
µc (s, t | a, D)
UNSCEAR REPORT-PART 5.qxp 10/7/08 3:41 pm Page 262
sufficiently large. Little et al. [L17] used a value of 121 years, as did Bennett et al. [B18]. This measure has been usedin the BEIR V report [C35] and elsewhere [L15, L16, L17]. A very similar measure, excess cancer incidence (ECI) perunit dose, can also be calculated.
B3. A population risk measure closely related to ECD is the risk of exposure-induced death (REID) per unit dose:
As above, when a generalized relative risk model,
, is assumed, this reduces to:
This risk measure has been employed by many scientific committees [I11, U2, U4] and others [L15, L16, L17], and isarguably the most commonly used such summary risk measure. The ECD measure, which is calculated by taking the dif-ference between the numbers of cancers that would occur in an irradiated population and in an otherwise equivalent unir-radiated population, in general gives a somewhat lower value than the REID measure. This is because the former quantitydoes not include that fraction (about 20% for the general population in equilibrium) of the people developing a fatal radi-ation-induced cancer who would have died from some sort of cancer anyway. The analogous quantity calculated for cancerincidence, risk of exposure-induced cancer incidence (REIC) per unit dose, can also be defined, and has been used bysome [B18].
B4. The measure of years of life lost (YLL) per unit dose is given by:
As above, when a relative risk model, , is assumed, this reduces to:
This measure has been used by many scientific committees [C35, I11, U2, U4] and others [L15, L16, L17]. A relatedmeasure, years of life lost per radiation-induced cancer (YLLRIC), which is given by:
has also been employed by some [C35, I11, L17, U2].
B5. The non-constancy of all six measures of risk as a function of the test dose Dt should be noted, even when theexcess relative risk ERR(s,a,t,Dt) is linear in Dt; this is a consequence of the non-linearity (in Dt) of the numerators of theabove expressions.
YLLRICc (s,a, Dt ) =YLLc (s,a, Dt )
REIDc (s,a, Dt )
YLLc (s,a, Dt ) =exp − µ(s,w)dw
a
t
∫⎡
⎣⎢
⎤
⎦⎥dt
a
yT
∫ − exp − µ(s,w) + µc (s,w) ⋅ RRc (s,a,w − a, Dt )dwa
t
∫⎡
⎣⎢
⎤
⎦⎥dt
a
yT
∫Dt
µc (s, t | a, Dt ) = µc (s,t ) ⋅[1+ ERRc (s,a, y, Dt )]
YLLc (s,a, Dt ) =S(s,t | a)dt
a
yT
∫ − Sc (s, t | a, Dt )dta
yT
∫Dt
REIDc (s,a, Dt ) =µc (s, t) ⋅ ERRc (s,a,t − a, Dt ) ⋅ S(t,a) ⋅ exp − µc (s,w) ⋅ ERRc (s,a,w − a, Dt )dw
a
t
∫⎡
⎣⎢
⎤
⎦⎥dt
a
yT
∫Dt
µc (s, t | a, Dt ) = µc (s,t ) ⋅[1+ ERRc (s,a, y, Dt )]
REIDc (s,a, Dt ) =[µc (s, t | a, Dt ) − µc (s, t )] ⋅ Sc (s,t | a, Dt )dt
a
yT
∫Dt
ANNEX A: EPIDEMIOLOGICAL STUDIES OF RADIATION AND CANCER 263
UNSCEAR REPORT-PART 5.qxp 10/7/08 3:41 pm Page 263
264 UNSCEAR 2006 REPORT: VOLUME I
B6. In calculation of an overall population risk, suitable averages of all of the above measures have to be taken, aver-aged over the age at exposure distribution in the hypothetical exposed population. Most scientific committees [C35, I11,U2, U4] and others [B18, L15, L16, L17] use the equilibrium population distribution in the absence of radiation exposure,
and weight across sexes by the relative birth rates of each sex (in most populations approximately equal). Using the equi-librium distribution has the advantage that the time distribution of the administered pattern of dose does not matter. Assuminglinearity of the excess relative risk ERR(s,a,t,D) in dose D, all risk measures are approximately (asymptotically in the low-dose limit) invariant to arbitrary fractionation of a given test dose, Dt, over time. In principle, other age/sex distributionscould be used to derive aggregate risks, for example the actual population distribution by age and sex at a given time forsome country. However, population risk measures for a population that is not in equilibrium when the radiation dose isgiven will not be (asymptotically in the low-dose limit) invariant to the pattern of test dose distribution.
Sc (s,a) = exp − µ(s,w)dw0
a
∫⎡
⎣⎢
⎤
⎦⎥
Appendix C. Modelling of dosimetric error for the data on the atomic bombing survivors
C1. This appendix details the methods used to model dosimetric error, in the data set on the atomic bombing survivorLSS cohort, for the purpose of fitting the risk models used for calculations of population cancer risk. The methods foradjusting for dosimetric error are reasonably similar to those employed by Pierce et al. [P2, P11, P16], Neriishi et al. [N7],and Little and colleagues [L29, L32, L33, L34, L35, L37]. In general, the true dose D is not known; the only observabledosimetric quantity in any stratum is the nominal (or estimated) (DS02) dose d. Approximately unbiased parameter esti-mates are obtained by replacing ERR(i,D) (or EAR(i,D)) by E[ERR(i,D) | d] (or by E[EAR(i,D) | d]) in the model fitting,in which this last expression represents the average of the excess relative risk ERR(i,D) (or the excess absolute risk EAR(i,D))over the stratum with average nominal (DS02) dose d. This approach to measurement error correction is an example of“regression calibration” [C12].
C2. When random errors are assumed to be present in the dose estimates, the true dose D in any stratum is not known;the only observable dosimetric quantity in any stratum is the nominal (or estimated) dose d. Jablon [J3] investigated theerrors in the Japanese atomic bombing dosimetry and found that these errors were most likely to be distributed log-normally, with a GSD of about 30%. Therefore it is assumed here that the distribution of the nominal dose d conditionalon the true dose D is given by the standard log-normal density function:
(C.1)
C3. Pierce et al. [P2, P11, P16] found that a Weibull distribution provided an adequate description of the true dose dis-tribution in the two cities, apart from a low-dose group, which they did not model. Following their example, the proba-bility density of the distribution of the true dose D in each sex (s = male, female) and city (c = Hiroshima, Nagasaki) ismodelled here by the superposition of an extended Weibull density function (similar to that used previously by Little [L32,L49]), with an additional uniform density on the true dose interval [0.0, 0.01] given by:
(C.2)
C4. In general, the canonical Weibull distribution (with ω4sc = 0) did not adequately fit the current LSS mortality data[P10], and neither did the density function without the uniform density in the range [0.0, 0.01] (with ω1sc = 1), but thisextended Weibull density function fitted the data very well over the full dose range (including the low-dose group excludedby Pierce et al. [P2, P11, P16]).
wsc (D) = ω 1sc ⋅ ω 2 sc ⋅ω 3sc ⋅ Dω 3sc −1 + ω 4 sc⎡⎣ ⎤⎦ ⋅ exp −ω 2 sc ⋅ Dω 3sc − ω 4 sc ⋅ D⎡⎣ ⎤⎦+[1− ω 1sc ] ⋅100 ⋅1D <0.01
f (d | D) =1
σ ⋅ d 2πexp −
(ln[d] − ln[D])2
2 ⋅σ 2
⎡
⎣⎢
⎤
⎦⎥
UNSCEAR REPORT-PART 5.qxp 10/7/08 3:41 pm Page 264
ANNEX A: EPIDEMIOLOGICAL STUDIES OF RADIATION AND CANCER 265
C5. The joint distribution of true dose D and nominal dose d is then given by the density function:
(C.3)
from which one can numerically integrate to obtain:
(C.4)
where Dmax is the maximum assumed true dose, taken to be 6 Sv for the colon and bone marrow. The fitting of the mod-ified Weibull distribution parameters (ω1sc, ω2sc, ω3sc, ω4sc,) for each sex (male, female) and city (Hiroshima, Nagasaki)separately, is achieved by maximizing the multinomial likelihood of the joint distribution of persons by nominal colon orbone marrow dose (using as dose groups 0.0–0.005, 0.005–0.02, 0.02–0.04, 0.04–0.06, 0.06–0.08, 0.08–0.10, 0.10–0.125,0.125–0.15, 0.15–0.175, 0.175–0.20, 0.20–0.25, 0.25–0.30, 0.30–0.50, 0.50–0.75, 0.75–1.00, 1.00–1.25, 1.25–1.50,1.50–1.75, 1.75–2.00, 2.00–2.50, 2.50–3.00, >3.00 Sv). In all fits of the extended Weibull distributions the DS02 colonand bone marrow dose estimates are used, unadjusted for dosimetric error and without the truncation of dose estimates at4 Sv that have been used in some of the most recent analyses [P10]. However, as noted above, it is implicitly assumedin the integrations involved in Eq. (C.4) that the true dose (colon, bone marrow) cannot exceed 6 Sv.
C6. It can be shown [C12] that approximately unbiased estimates of the parameters in ERR or EAR models expressedby Eqs (12) and (13) in the main text (particular cases of which are given by expressions (14)–(20)) are obtained by replac-ing ERR(i,D) or EAR(i,D) in the model fitting by E[ERR(i,D) | d] and E[EAR(i,D) | d], respectively. These last expressionsrepresent the conditional expectation of the excess relative risk ERR(i,D) or excess absolute risk EAR(i,D) at the true doseD, given the average nominal DS02 dose d; in other words, E[ERR(i,D) | d] is the average of the excess relative riskERR(i,D) at the true dose D over the stratum with (person-) averaged nominal dose d, and similarly for the excess absoluterisk. E[ERR(i,D) | d] and E[EAR(i,D) | d] are calculated by numerical integration of the product of the excess relative riskERR(i,D) and excess absolute risk EAR(i,D), for example as given by expressions (12)–(20), and the density function, Eq.(C.3), over the true dose range (0–6 Sv). Numerical integrations are performed using a Rosenbrock-type stiff integrationroutine (employing the Shampine parameter set) [P22].
Prsc (d ≤ d0 ) = dq psc (q, D)dD0
Dmax
∫0
d0
∫ = dq f (q | D) ⋅ wsc (D)dD0
Dmax
∫0
d0
∫
psc (d, D) = f (d | D) ⋅ wsc (D)
Appendix D. Risk models fitted to the atomic bombing survivor data by classical,likelihood-based methods
D1. This appendix presents the models used to fit the current LSS cancer mortality [P10] and cancer incidence data[P48] by classical, likelihood-based methods. The models fitted are of the general form described in section IV of the maintext, namely generalized ERR and generalized EAR models. Generalized ERR models were fitted in which the expectedcancer mortality or incidence rate at age a, for sex s and city c, following exposure at age e to a dose D of radiation isgiven by:
(D.1)
Likewise, generalized EAR models were fitted in which the expected cancer rate (for mortality or incidence) is given by:
(D.2)
D2. Poisson disease models were used for all fitting to the LSS data. The models that are used here are fundamentallyfunctions of the (unobserved) “true” organ dose D received by a survivor. In general, the true dose D is not known; theonly observable dosimetric quantity in any stratum i is the nominal (or estimated) (DS02) dose d. As discussed in appen-dix C, approximately unbiased parameter estimates are obtained by replacing ERR(D,a,e,c,s) (or EAR(D,a,e,c,s)) byEi[ERR(D,a,e,c,s)|d] (or by Ei[EAR(D,a,e,c,s)|d]) in the model fitting, in which this last expression represents the averageof the excess relative risk ERR(D,a,e,c,s) (or the excess absolute risk EAR(D,a,e,c,s)) over the stratum i with average nom-inal (DS02) dose d. Since the adjustment functions φ(a,e,c,s) and ψ(a,e,c,s) do not involve dose, this is equivalent to replac-ing the dose–response function F(D) by Ei[F(D)|d]. This approach to measurement error correction is an example of“regression calibration” [C12].
h0(a,e,c, s) + F(D) ⋅ψ (a,e,c, s) = h0 (a,e,c, s) + EAR(D,a,e,c,s)
h0(a,e,c, s) ⋅[1+ F(D) ⋅φ(a,e,c, s)] = h0 (a,e,c, s) ⋅[1+ ERR(D,a,e,c, s)]
UNSCEAR REPORT-PART 5.qxp 10/7/08 3:41 pm Page 265
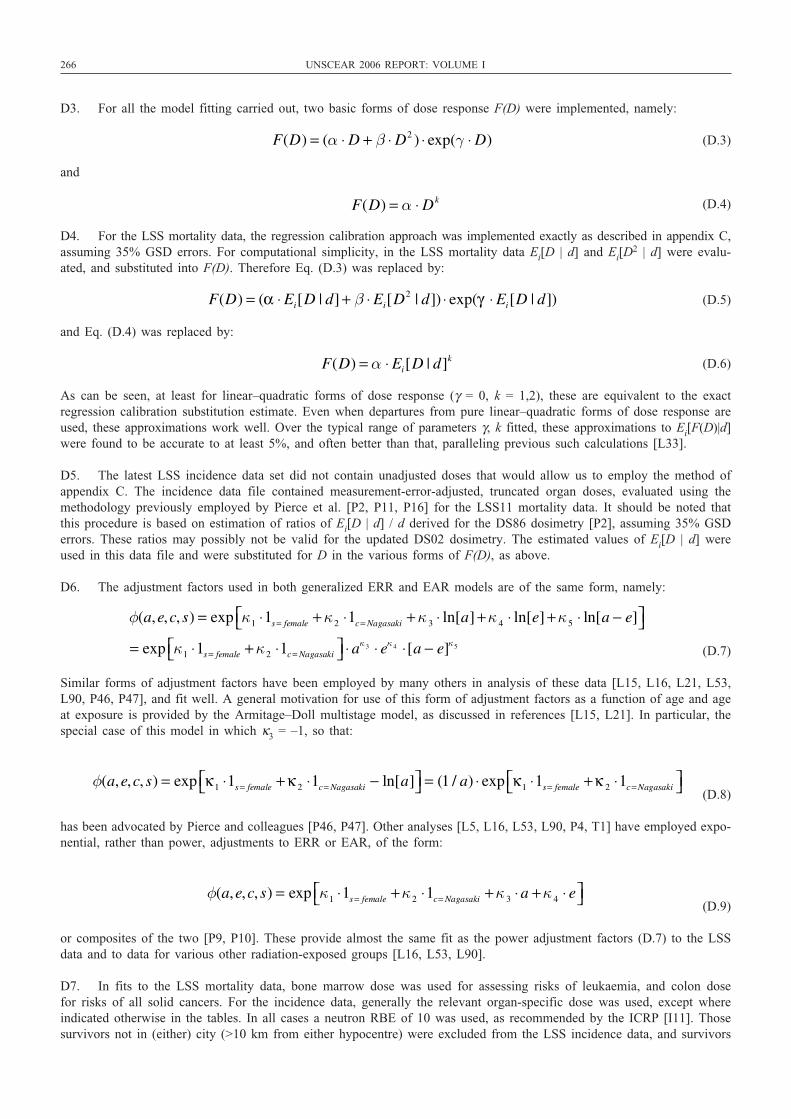
266 UNSCEAR 2006 REPORT: VOLUME I
D3. For all the model fitting carried out, two basic forms of dose response F(D) were implemented, namely:
(D.3)
and
(D.4)
D4. For the LSS mortality data, the regression calibration approach was implemented exactly as described in appendix C,assuming 35% GSD errors. For computational simplicity, in the LSS mortality data Ei[D | d] and Ei[D
2 | d] were evalu-ated, and substituted into F(D). Therefore Eq. (D.3) was replaced by:
(D.5)
and Eq. (D.4) was replaced by:
(D.6)
As can be seen, at least for linear–quadratic forms of dose response (γ = 0, k = 1,2), these are equivalent to the exactregression calibration substitution estimate. Even when departures from pure linear–quadratic forms of dose response areused, these approximations work well. Over the typical range of parameters γ, k fitted, these approximations to Ei[F(D)|d]were found to be accurate to at least 5%, and often better than that, paralleling previous such calculations [L33].
D5. The latest LSS incidence data set did not contain unadjusted doses that would allow us to employ the method ofappendix C. The incidence data file contained measurement-error-adjusted, truncated organ doses, evaluated using themethodology previously employed by Pierce et al. [P2, P11, P16] for the LSS11 mortality data. It should be noted thatthis procedure is based on estimation of ratios of Ei[D | d] / d derived for the DS86 dosimetry [P2], assuming 35% GSDerrors. These ratios may possibly not be valid for the updated DS02 dosimetry. The estimated values of Ei[D | d] wereused in this data file and were substituted for D in the various forms of F(D), as above.
D6. The adjustment factors used in both generalized ERR and EAR models are of the same form, namely:
(D.7)
Similar forms of adjustment factors have been employed by many others in analysis of these data [L15, L16, L21, L53,L90, P46, P47], and fit well. A general motivation for use of this form of adjustment factors as a function of age and ageat exposure is provided by the Armitage–Doll multistage model, as discussed in references [L15, L21]. In particular, thespecial case of this model in which κ3 = –1, so that:
(D.8)
has been advocated by Pierce and colleagues [P46, P47]. Other analyses [L5, L16, L53, L90, P4, T1] have employed expo-nential, rather than power, adjustments to ERR or EAR, of the form:
(D.9)
or composites of the two [P9, P10]. These provide almost the same fit as the power adjustment factors (D.7) to the LSSdata and to data for various other radiation-exposed groups [L16, L53, L90].
D7. In fits to the LSS mortality data, bone marrow dose was used for assessing risks of leukaemia, and colon dose for risks of all solid cancers. For the incidence data, generally the relevant organ-specific dose was used, except whereindicated otherwise in the tables. In all cases a neutron RBE of 10 was used, as recommended by the ICRP [I11]. Thosesurvivors not in (either) city (>10 km from either hypocentre) were excluded from the LSS incidence data, and survivors
φ(a,e,c, s) = exp κ1 ⋅1s = female +κ2 ⋅1c= Nagasaki +κ 3 ⋅ a +κ 4 ⋅ e⎡⎣ ⎤⎦
φ(a,e,c, s) = exp κ1 ⋅1s = female + κ 2 ⋅1c= Nagasaki − ln[a]⎡⎣ ⎤⎦ = (1 / a) ⋅ exp κ1 ⋅1s= female +κ 2 ⋅1c= Nagasaki⎡⎣ ⎤⎦
φ(a,e,c, s) = exp κ1 ⋅1s = female + κ2 ⋅1c= Nagasaki + κ 3 ⋅ ln[a] +κ 4 ⋅ ln[e] +κ5 ⋅ ln[a − e]⎡⎣ ⎤⎦= exp κ1 ⋅1s = female + κ2 ⋅1c= Nagasaki⎡⎣ ⎤⎦ ⋅ aκ 3 ⋅ eκ 4 ⋅[a − e]κ5
F(D) = α ⋅ Ei[D | d]k
F(D) = (α ⋅ Ei[D | d] + β ⋅ Ei[D2 | d]) ⋅ exp(γ ⋅ Ei[D | d])
F(D) = α ⋅ Dk
F(D) = (α ⋅ D + β ⋅ D2 ) ⋅ exp(γ ⋅ D)
UNSCEAR REPORT-PART 5.qxp 10/7/08 3:41 pm Page 266
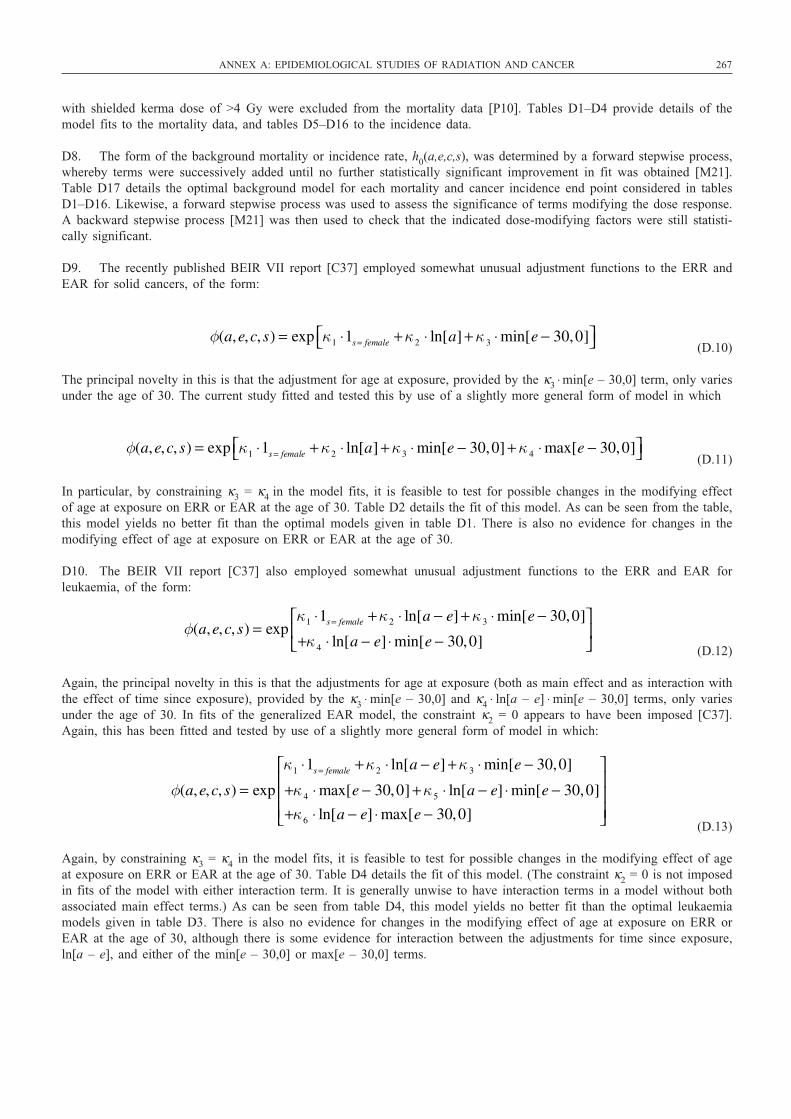
with shielded kerma dose of >4 Gy were excluded from the mortality data [P10]. Tables D1–D4 provide details of themodel fits to the mortality data, and tables D5–D16 to the incidence data.
D8. The form of the background mortality or incidence rate, h0(a,e,c,s), was determined by a forward stepwise process,whereby terms were successively added until no further statistically significant improvement in fit was obtained [M21].Table D17 details the optimal background model for each mortality and cancer incidence end point considered in tablesD1–D16. Likewise, a forward stepwise process was used to assess the significance of terms modifying the dose response.A backward stepwise process [M21] was then used to check that the indicated dose-modifying factors were still statisti-cally significant.
D9. The recently published BEIR VII report [C37] employed somewhat unusual adjustment functions to the ERR andEAR for solid cancers, of the form:
(D.10)
The principal novelty in this is that the adjustment for age at exposure, provided by the κ3 ⋅ min[e – 30,0] term, only variesunder the age of 30. The current study fitted and tested this by use of a slightly more general form of model in which
(D.11)
In particular, by constraining κ3 = κ4 in the model fits, it is feasible to test for possible changes in the modifying effectof age at exposure on ERR or EAR at the age of 30. Table D2 details the fit of this model. As can be seen from the table,this model yields no better fit than the optimal models given in table D1. There is also no evidence for changes in themodifying effect of age at exposure on ERR or EAR at the age of 30.
D10. The BEIR VII report [C37] also employed somewhat unusual adjustment functions to the ERR and EAR forleukaemia, of the form:
(D.12)
Again, the principal novelty in this is that the adjustments for age at exposure (both as main effect and as interaction withthe effect of time since exposure), provided by the κ3 ⋅ min[e – 30,0] and κ4 ⋅ ln[a – e] ⋅ min[e – 30,0] terms, only variesunder the age of 30. In fits of the generalized EAR model, the constraint κ2 = 0 appears to have been imposed [C37].Again, this has been fitted and tested by use of a slightly more general form of model in which:
(D.13)
Again, by constraining κ3 = κ4 in the model fits, it is feasible to test for possible changes in the modifying effect of ageat exposure on ERR or EAR at the age of 30. Table D4 details the fit of this model. (The constraint κ2 = 0 is not imposedin fits of the model with either interaction term. It is generally unwise to have interaction terms in a model without bothassociated main effect terms.) As can be seen from table D4, this model yields no better fit than the optimal leukaemiamodels given in table D3. There is also no evidence for changes in the modifying effect of age at exposure on ERR orEAR at the age of 30, although there is some evidence for interaction between the adjustments for time since exposure,ln[a – e], and either of the min[e – 30,0] or max[e – 30,0] terms.
φ(a,e,c, s) = exp
κ1 ⋅1s = female +κ2 ⋅ ln[a − e] +κ 3 ⋅ min[e − 30,0]
+κ 4 ⋅ max[e − 30,0] +κ5 ⋅ ln[a − e] ⋅ min[e − 30,0]
+κ6 ⋅ ln[a − e] ⋅ max[e − 30,0]
⎡
⎣
⎢⎢⎢
⎤
⎦
⎥⎥⎥
φ(a,e,c, s) = expκ1 ⋅1s = female +κ2 ⋅ ln[a − e] + κ 3 ⋅ min[e − 30,0]
+κ 4 ⋅ ln[a − e] ⋅ min[e − 30,0]
⎡
⎣⎢
⎤
⎦⎥
φ(a,e,c, s) = exp κ1 ⋅1s = female + κ2 ⋅ ln[a] + κ3 ⋅ min[e − 30,0] + κ 4 ⋅ max[e − 30,0]⎡⎣ ⎤⎦
φ(a,e,c, s) = exp κ1 ⋅1s = female +κ2 ⋅ ln[a] + κ 3 ⋅ min[e − 30,0]⎡⎣ ⎤⎦
ANNEX A: EPIDEMIOLOGICAL STUDIES OF RADIATION AND CANCER 267
UNSCEAR REPORT-PART 5.qxp 10/7/08 3:41 pm Page 267
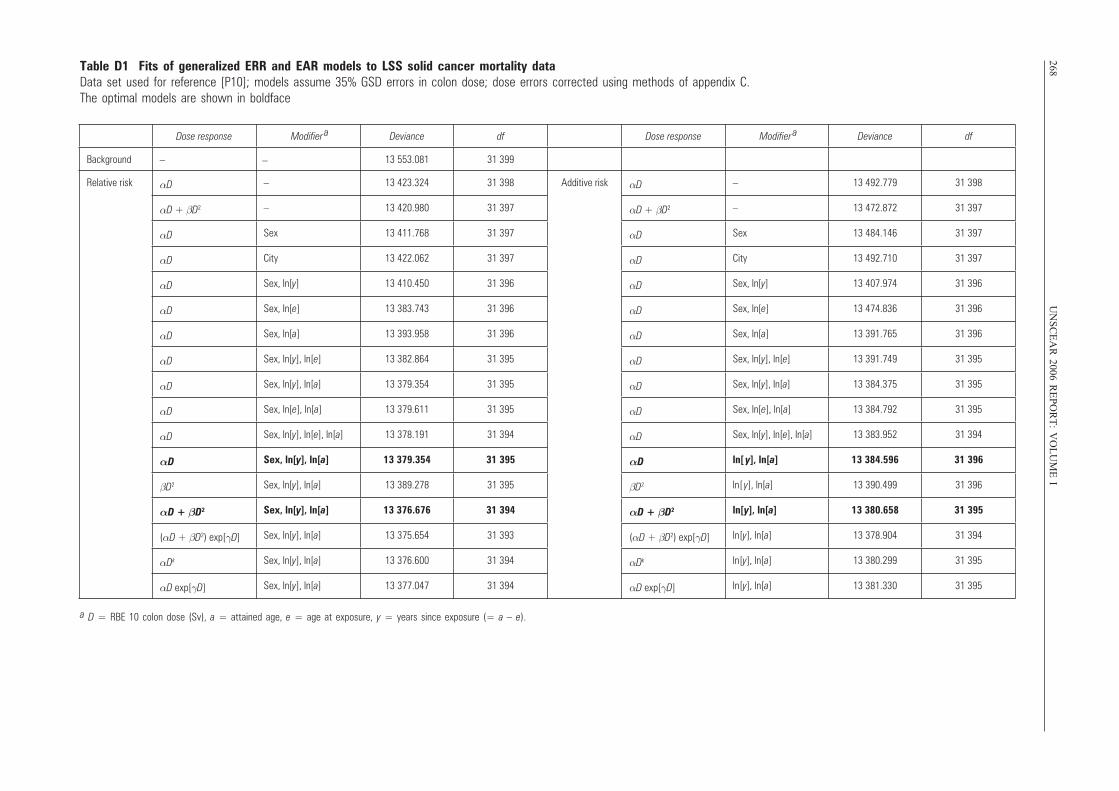
268U
NS
CE
AR
2006 RE
PO
RT
: VO
LU
ME
ITable D1 Fits of generalized ERR and EAR models to LSS solid cancer mortality dataData set used for reference [P10]; models assume 35% GSD errors in colon dose; dose errors corrected using methods of appendix C. The optimal models are shown in boldface
Dose response Modifier a Deviance df Dose response Modifier
a Deviance df
Background – 13 553.081 31 399
Relative risk αD – 13 423.324 31 398 Additive risk αD – 13 492.779 31 398
αD + βD2 – 13 420.980 31 397 αD + βD2 – 13 472.872 31 397
αD Sex 13 411.768 31 397 αD Sex 13 484.146 31 397
αD City 13 422.062 31 397 αD City 13 492.710 31 397
αD Sex, ln[y] 13 410.450 31 396 αD Sex, ln[y] 13 407.974 31 396
αD Sex, ln[e] 13 383.743 31 396 αD Sex, ln[e] 13 474.836 31 396
αD Sex, ln[a] 13 393.958 31 396 αD Sex, ln[a] 13 391.765 31 396
αD Sex, ln[y], ln[e] 13 382.864 31 395 αD Sex, ln[y], ln[e] 13 391.749 31 395
αD Sex, ln[y], ln[a] 13 379.354 31 395 αD Sex, ln[y], ln[a] 13 384.375 31 395
αD Sex, ln[e], ln[a] 13 379.611 31 395 αD Sex, ln[e], ln[a] 13 384.792 31 395
αD Sex, ln[y], ln[e], ln[a] 13 378.191 31 394 αD Sex, ln[y], ln[e], ln[a] 13 383.952 31 394
αD Sex, ln[y], ln[a] 13 379.354 31 395 αD ln[ y], ln[a] 13 384.596 31 396
βD2 Sex, ln[y], ln[a] 13 389.278 31 395 βD2 ln[ y], ln[a] 13 390.499 31 396
αD + βD2 Sex, ln[y], ln[a] 13 376.676 31 394 αD + βD2 ln[y], ln[a] 13 380.658 31 395
(αD + βD2) exp[γD] Sex, ln[y], ln[a] 13 375.654 31 393 (αD + βD2) exp[γD] ln[y], ln[a] 13 378.904 31 394
αDk Sex, ln[y], ln[a] 13 376.600 31 394 αDk ln[y], ln[a] 13 380.299 31 395
αD exp[γD] Sex, ln[y], ln[a] 13 377.047 31 394 αD exp[γD] ln[y], ln[a] 13 381.330 31 395
–
a D = RBE 10 colon dose (Sv), a = attained age, e = age at exposure, y = years since exposure (= a – e).
UNSCEAR REPORT-PART 5.qxp 10/7/08 3:41 pm Page 268
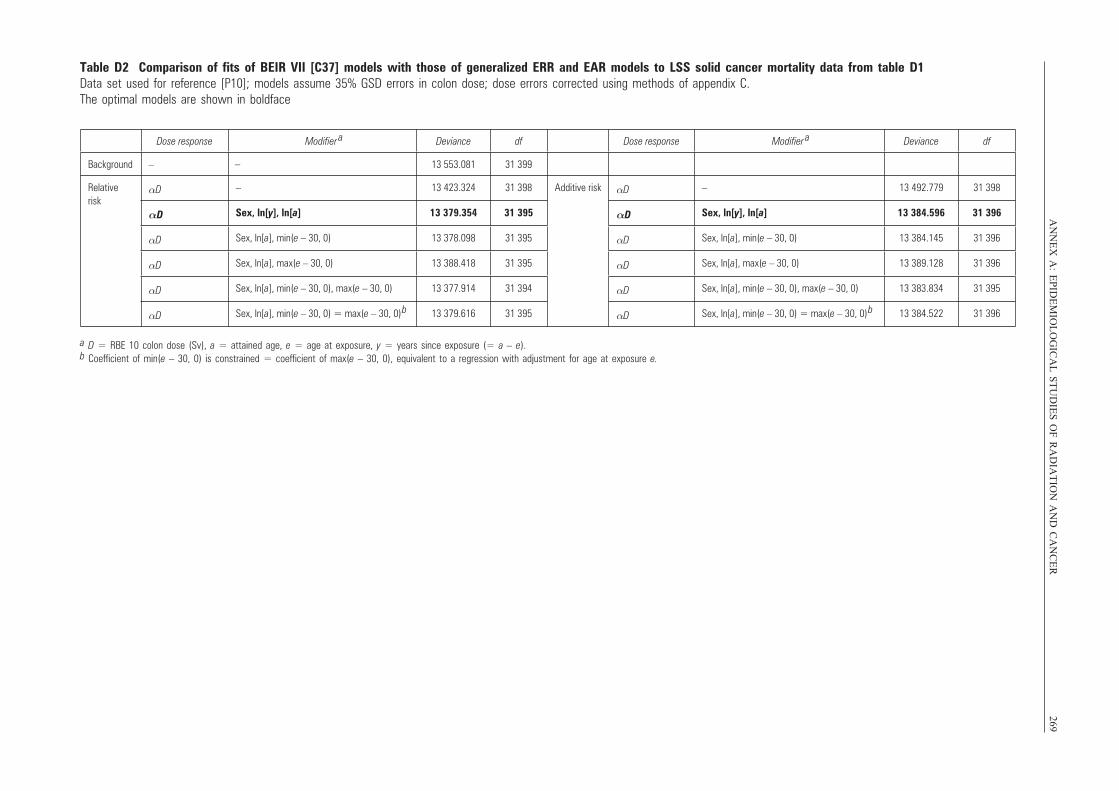
AN
NE
X A
: EP
IDE
MIO
LO
GIC
AL
ST
UD
IES
OF
RA
DIA
TIO
N A
ND
CA
NC
ER
269Table D2 Comparison of fits of BEIR VII [C37] models with those of generalized ERR and EAR models to LSS solid cancer mortality data from table D1Data set used for reference [P10]; models assume 35% GSD errors in colon dose; dose errors corrected using methods of appendix C. The optimal models are shown in boldface
Dose response Modifier a Deviance df Dose response Modifier
a Deviance df
Background – 13 553.081 31 399
Relative risk
αD – 13 423.324 31 398 Additive risk αD – 13 492.779 31 398
αD Sex, ln[y], ln[a] 13 379.354 31 395 αD Sex, ln[y], ln[a] 13 384.596 31 396
αD Sex, ln[a], min(e – 30, 0) 13 378.098 31 395 αD Sex, ln[a], min(e – 30, 0) 13 384.145 31 396
αD Sex, ln[a], max(e – 30, 0) 13 388.418 31 395 αD Sex, ln[a], max(e – 30, 0) 13 389.128 31 396
αD Sex, ln[a], min(e – 30, 0), max(e – 30, 0) 13 377.914 31 394 αD Sex, ln[a], min(e – 30, 0), max(e – 30, 0) 13 383.834 31 395
αD Sex, ln[a], min(e – 30, 0) = max(e – 30, 0)
b 13 379.616 31 395 αD Sex, ln[a], min(e – 30, 0) = max(e – 30, 0)
b 13 384.522 31 396
–
a D = RBE 10 colon dose (Sv), a = attained age, e = age at exposure, y = years since exposure (= a – e).b Coefficient of min(e – 30, 0) is constrained = coefficient of max(e – 30, 0), equivalent to a regression with adjustment for age at exposure e.
UNSCEAR REPORT-PART 5.qxp 10/7/08 3:41 pm Page 269
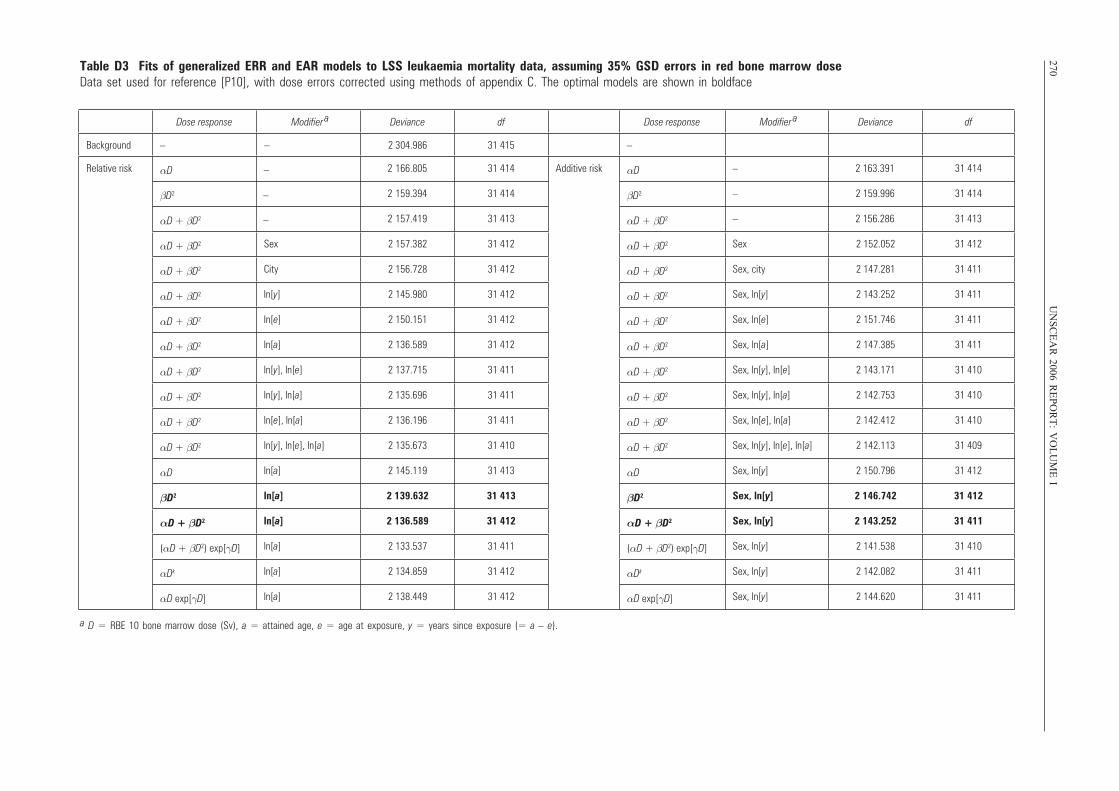
270U
NS
CE
AR
2006 RE
PO
RT
: VO
LU
ME
ITable D3 Fits of generalized ERR and EAR models to LSS leukaemia mortality data, assuming 35% GSD errors in red bone marrow doseData set used for reference [P10], with dose errors corrected using methods of appendix C. The optimal models are shown in boldface
Dose response Modifier a Deviance df Dose response Modifier
a Deviance df
Background – 2 304.986 31 415 –
Relative risk αD 2 166.805 31 414 Additive risk αD – 2 163.391 31 414
βD2 2 159.394 31 414 βD2 – 2 159.996 31 414
αD + βD2 2 157.419 31 413 αD + βD2 – 2 156.286 31 413
αD + βD2 Sex 2 157.382 31 412 αD + βD2 Sex 2 152.052 31 412
αD + βD2 City 2 156.728 31 412 αD + βD2 Sex, city 2 147.281 31 411
αD + βD2 ln[y] 2 145.980 31 412 αD + βD2 Sex, ln[y] 2 143.252 31 411
αD + βD2 ln[e] 2 150.151 31 412 αD + βD2 Sex, ln[e] 2 151.746 31 411
αD + βD2 ln[a] 2 136.589 31 412 αD + βD2 Sex, ln[a] 2 147.385 31 411
αD + βD2 ln[y], ln[e] 2 137.715 31 411 αD + βD2 Sex, ln[y], ln[e] 2 143.171 31 410
αD + βD2 ln[y], ln[a] 2 135.696 31 411 αD + βD2 Sex, ln[y], ln[a] 2 142.753 31 410
αD + βD2 ln[e], ln[a] 2 136.196 31 411 αD + βD2 Sex, ln[e], ln[a] 2 142.412 31 410
αD + βD2 ln[y], ln[e], ln[a] 2 135.673 31 410 αD + βD2 Sex, ln[y], ln[e], ln[a] 2 142.113 31 409
αD ln[a] 2 145.119 31 413 αD Sex, ln[y] 2 150.796 31 412
βD2 ln[a] 2 139.632 31 413 βD2 Sex, ln[y] 2 146.742 31 412
αD + βD2 ln[a] 2 136.589 31 412 αD + βD2 Sex, ln[y] 2 143.252 31 411
(αD + βD2) exp[γD] ln[a] 2 133.537 31 411 (αD + βD2) exp[γD] Sex, ln[y] 2 141.538 31 410
αDk ln[a] 2 134.859 31 412 αDk Sex, ln[y] 2 142.082 31 411
αD exp[γD] ln[a] 2 138.449 31 412 αD exp[γD] Sex, ln[y] 2 144.620 31 411
–
–
–
–
a D = RBE 10 bone marrow dose (Sv), a = attained age, e = age at exposure, y = years since exposure (= a – e).
UNSCEAR REPORT-PART 5.qxp 10/7/08 3:41 pm Page 270
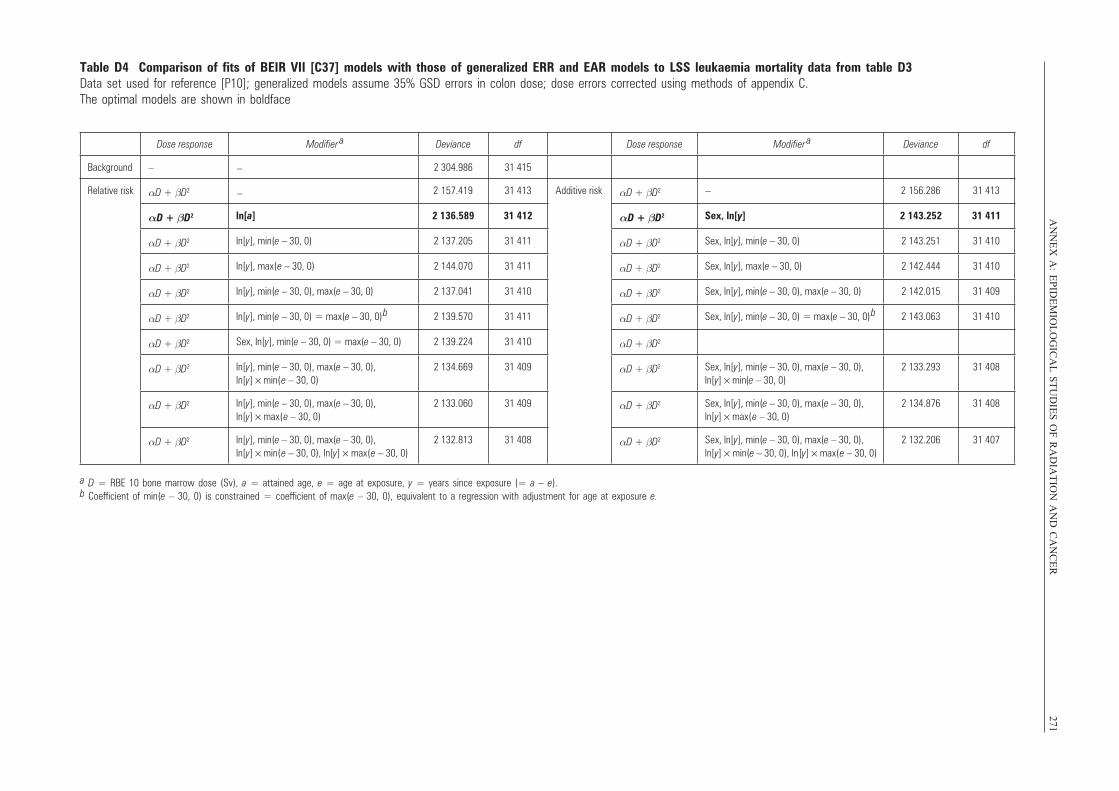
AN
NE
X A
: EP
IDE
MIO
LO
GIC
AL
ST
UD
IES
OF
RA
DIA
TIO
N A
ND
CA
NC
ER
271
Dose response Modifier a Deviance df Dose response Modifier
a Deviance df
Background – 2 304.986 31 415
Relative risk αD + βD2 2 157.419 31 413 Additive risk αD + βD2 2 156.286 31 413
αD + βD2 ln[a] 2 136.589 31 412 αD + βD2 Sex, ln[y] 2 143.252 31 411
αD + βD2 ln[y], min(e – 30, 0) 2 137.205 31 411 αD + βD2 Sex, ln[y], min(e – 30, 0) 2 143.251 31 410
αD + βD2 ln[y], max(e – 30, 0) 2 144.070 31 411 αD + βD2 Sex, ln[y], max(e – 30, 0) 2 142.444 31 410
αD + βD2 ln[y], min(e – 30, 0), max(e – 30, 0) 2 137.041 31 410 αD + βD2 Sex, ln[y], min(e – 30, 0), max(e – 30, 0) 2 142.015 31 409
αD + βD2 ln[y], min(e – 30, 0) = max(e – 30, 0)
b 2 139.570 31 411 αD + βD2 Sex, ln[y], min(e – 30, 0) = max(e – 30, 0)
b 2 143.063 31 410
αD + βD2 Sex, ln[y], min(e – 30, 0) = max(e – 30, 0) 2 139.224 31 410 αD + βD2
αD + βD2 ln[y], min(e – 30, 0), max(e – 30, 0), ln[y] × min(e – 30, 0)
2 134.669 31 409 αD + βD2 Sex, ln[y], min(e – 30, 0), max(e – 30, 0), ln[y] × min(e – 30, 0)
2 133.293 31 408
αD + βD2 ln[y], min(e – 30, 0), max(e – 30, 0), ln[y] × max(e – 30, 0)
2 133.060 31 409 αD + βD2 Sex, ln[y], min(e – 30, 0), max(e – 30, 0), ln[y] × max(e – 30, 0)
2 134.876 31 408
αD + βD2 ln[y], min(e – 30, 0), max(e – 30, 0), ln[y] × min(e – 30, 0), ln[y] × max(e – 30, 0)
2 132.813 31 408 αD + βD2 Sex, ln[y], min(e – 30, 0), max(e – 30, 0), ln[y] × min(e – 30, 0), ln[y] × max(e – 30, 0)
2 132.206 31 407
–
– –
Table D4 Comparison of fits of BEIR VII [C37] models with those of generalized ERR and EAR models to LSS leukaemia mortality data from table D3Data set used for reference [P10]; generalized models assume 35% GSD errors in colon dose; dose errors corrected using methods of appendix C.The optimal models are shown in boldface
a D = RBE 10 bone marrow dose (Sv), a = attained age, e = age at exposure, y = years since exposure (= a – e).b Coefficient of min(e – 30, 0) is constrained = coefficient of max(e – 30, 0), equivalent to a regression with adjustment for age at exposure e.
UNSCEAR REPORT-PART 5.qxp 10/7/08 3:41 pm Page 271
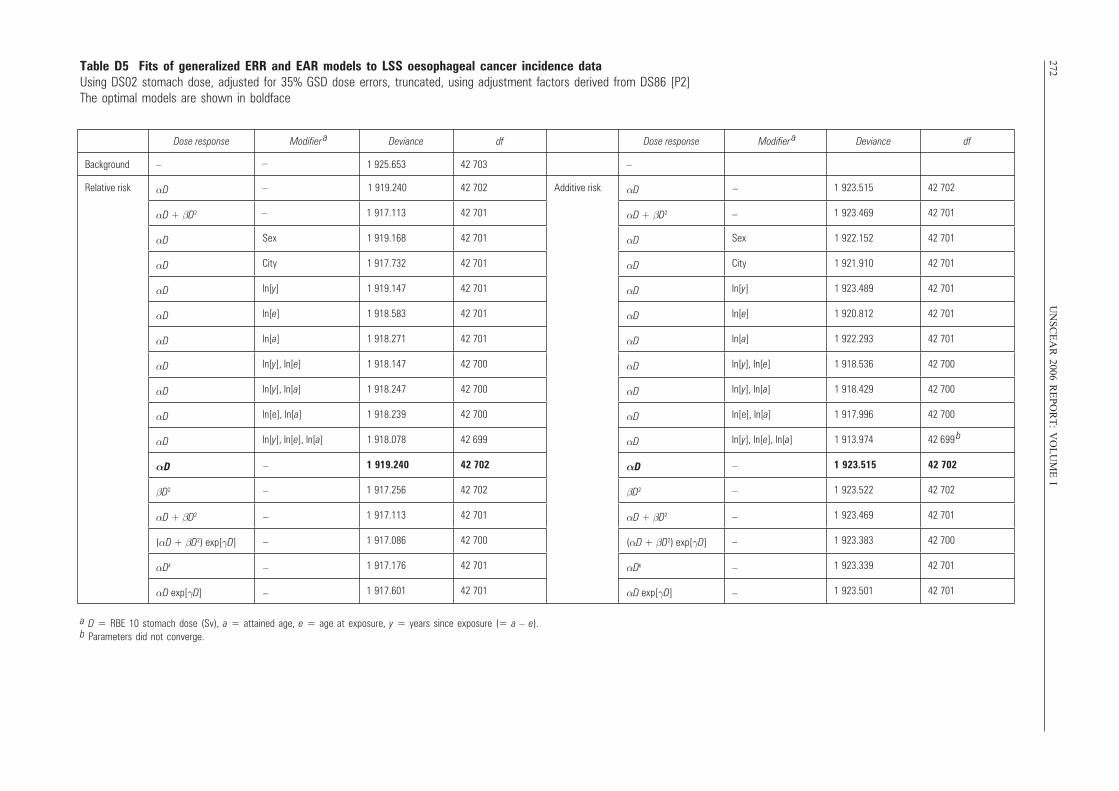
272U
NS
CE
AR
2006 RE
PO
RT
: VO
LU
ME
I
Dose response Modifier a Deviance df Dose response Modifier
a Deviance df
Background – 1 925.653 42 703 –
Relative risk αD – 1 919.240 42 702 Additive risk αD 1 923.515 42 702
αD + βD2 1 917.113 42 701 αD + βD2 1 923.469 42 701
αD Sex 1 919.168 42 701 αD Sex 1 922.152 42 701
αD City 1 917.732 42 701 αD City 1 921.910 42 701
αD ln[y] 1 919.147 42 701 αD ln[y] 1 923.489 42 701
αD ln[e] 1 918.583 42 701 αD ln[e] 1 920.812 42 701
αD ln[a] 1 918.271 42 701 αD ln[a] 1 922.293 42 701
αD ln[y], ln[e] 1 918.147 42 700 αD ln[y], ln[e] 1 918.536 42 700
αD ln[y], ln[a] 1 918.247 42 700 αD ln[y], ln[a] 1 918.429 42 700
αD ln[e], ln[a] 1 918.239 42 700 αD ln[e], ln[a] 1 917.996 42 700
αD ln[y], ln[e], ln[a] 1 918.078 42 699 αD ln[y], ln[e], ln[a] 1 913.974 42 699 b
αD 1 919.240 42 702 αD 1 923.515 42 702
βD2 1 917.256 42 702 βD2 1 923.522 42 702
αD + βD2 1 917.113 42 701 αD + βD2 1 923.469 42 701
(αD + βD2) exp[γD] 1 917.086 42 700 (αD + βD2) exp[γD] 1 923.383 42 700
αDk 1 917.176 42 701 αDk 1 923.339 42 701
αD exp[γD] 1 917.601 42 701 αD exp[γD] 1 923.501 42 701
–
–
–
–
–
–
–
–
–
–
–
–
–
–
–
–
Table D5 Fits of generalized ERR and EAR models to LSS oesophageal cancer incidence data Using DS02 stomach dose, adjusted for 35% GSD dose errors, truncated, using adjustment factors derived from DS86 [P2]The optimal models are shown in boldface
a D = RBE 10 stomach dose (Sv), a = attained age, e = age at exposure, y = years since exposure (= a – e).b Parameters did not converge.
UNSCEAR REPORT-PART 5.qxp 10/7/08 3:41 pm Page 272
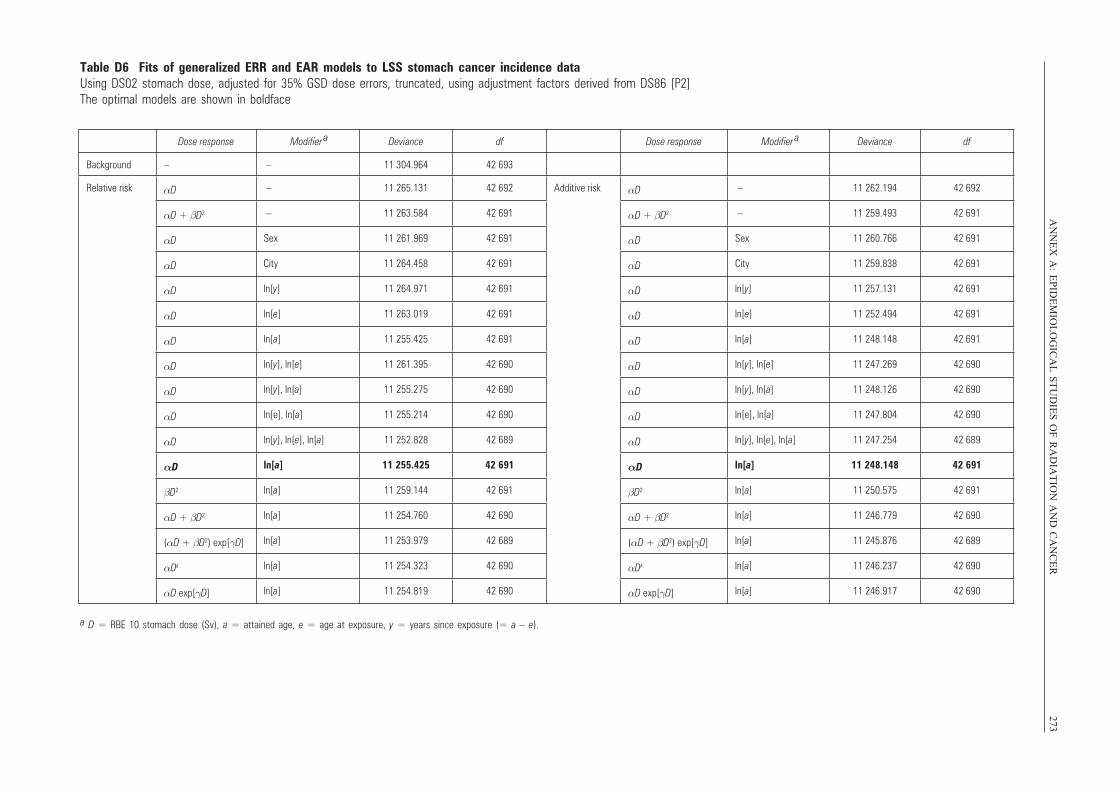
AN
NE
X A
: EP
IDE
MIO
LO
GIC
AL
ST
UD
IES
OF
RA
DIA
TIO
N A
ND
CA
NC
ER
273
Dose response Modifier a Deviance df Dose response Modifier
a Deviance df
Background – – 11 304.964 42 693
Relative risk αD – 11 265.131 42 692 Additive risk αD – 11 262.194 42 692
αD + βD2 – 11 263.584 42 691 αD + βD2 – 11 259.493 42 691
αD Sex 11 261.969 42 691 αD Sex 11 260.766 42 691
αD City 11 264.458 42 691 αD City 11 259.838 42 691
αD ln[y] 11 264.971 42 691 αD ln[y] 11 257.131 42 691
αD ln[e] 11 263.019 42 691 αD ln[e] 11 252.494 42 691
αD ln[a] 11 255.425 42 691 αD ln[a] 11 248.148 42 691
αD ln[y], ln[e] 11 261.395 42 690 αD ln[y], ln[e] 11 247.269 42 690
αD ln[y], ln[a] 11 255.275 42 690 αD ln[y], ln[a] 11 248.126 42 690
αD ln[e], ln[a] 11 255.214 42 690 αD ln[e], ln[a] 11 247.804 42 690
αD ln[y], ln[e], ln[a] 11 252.828 42 689 αD ln[y], ln[e], ln[a] 11 247.254 42 689
αD ln[a] 11 255.425 42 691 αD ln[a] 11 248.148 42 691
βD2 ln[a] 11 259.144 42 691 βD2 ln[a] 11 250.575 42 691
αD + βD2 ln[a] 11 254.760 42 690 αD + βD2 ln[a] 11 246.779 42 690
(αD + βD2) exp[γD] ln[a] 11 253.979 42 689 (αD + βD2) exp[γD] ln[a] 11 245.876 42 689
αDk ln[a] 11 254.323 42 690 αDk ln[a] 11 246.237 42 690
αD exp[γD] ln[a] 11 254.819 42 690 αD exp[γD] ln[a] 11 246.917 42 690
Table D6 Fits of generalized ERR and EAR models to LSS stomach cancer incidence data Using DS02 stomach dose, adjusted for 35% GSD dose errors, truncated, using adjustment factors derived from DS86 [P2]The optimal models are shown in boldface
a D = RBE 10 stomach dose (Sv), a = attained age, e = age at exposure, y = years since exposure (= a – e).
UNSCEAR REPORT-PART 5.qxp 10/7/08 3:41 pm Page 273
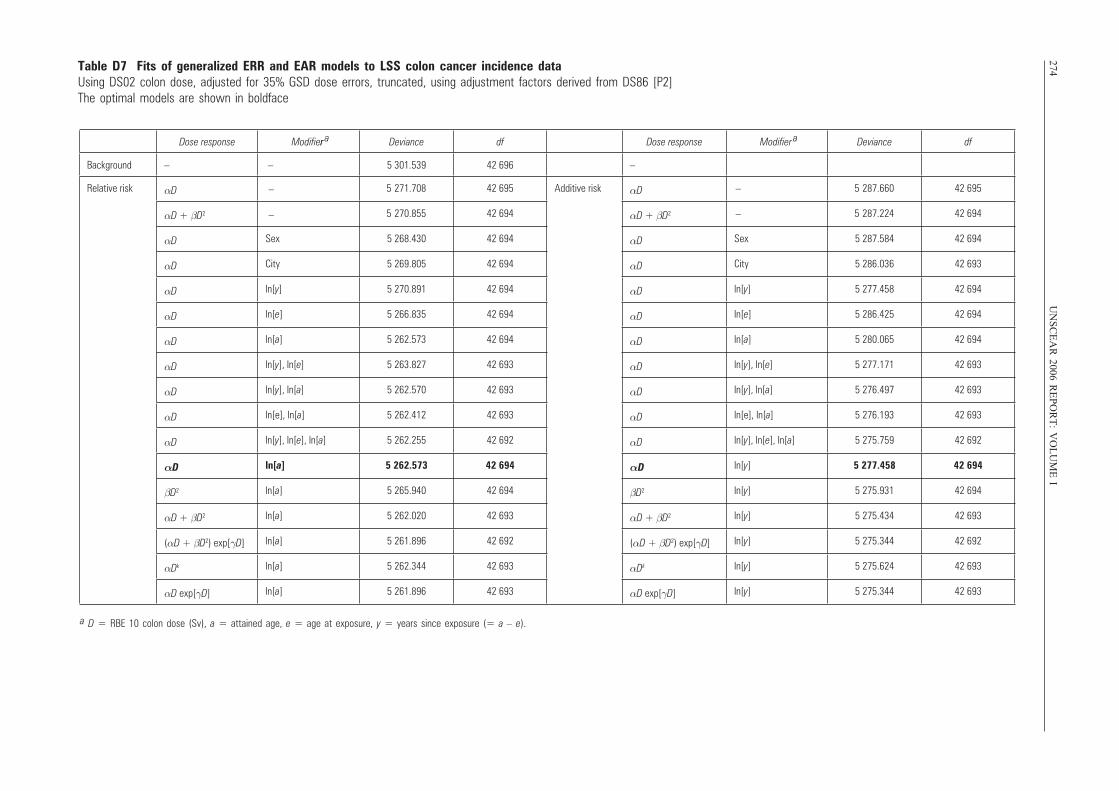
274U
NS
CE
AR
2006 RE
PO
RT
: VO
LU
ME
I
Dose response Modifier ar Deviance df Dose response Modifier
a Deviance df
Background – – 5 301.539 42 696 –
Relative risk αD 5 271.708 42 695 Additive risk αD 5 287.660 42 695
αD + βD2 5 270.855 42 694 αD + βD2 5 287.224 42 694
αD Sex 5 268.430 42 694 αD Sex 5 287.584 42 694
αD City 5 269.805 42 694 αD City 5 286.036 42 693
αD ln[y] 5 270.891 42 694 αD ln[y] 5 277.458 42 694
αD ln[e] 5 266.835 42 694 αD ln[e] 5 286.425 42 694
αD ln[a] 5 262.573 42 694 αD ln[a] 5 280.065 42 694
αD ln[y], ln[e] 5 263.827 42 693 αD ln[y], ln[e] 5 277.171 42 693
αD ln[y], ln[a] 5 262.570 42 693 αD ln[y], ln[a] 5 276.497 42 693
αD ln[e], ln[a] 5 262.412 42 693 αD ln[e], ln[a] 5 276.193 42 693
αD ln[y], ln[e], ln[a] 5 262.255 42 692 αD ln[y], ln[e], ln[a] 5 275.759 42 692
αD ln[a] 5 262.573 42 694 αD ln[y] 5 277.458 42 694
βD2 ln[a] 5 265.940 42 694 βD2 ln[y] 5 275.931 42 694
αD + βD2 ln[a] 5 262.020 42 693 αD + βD2 ln[y] 5 275.434 42 693
(αD + βD2) exp[γD] ln[a] 5 261.896 42 692 (αD + βD2) exp[γD] ln[y] 5 275.344 42 692
αDk ln[a] 5 262.344 42 693 αDk ln[y] 5 275.624 42 693
αD exp[γD] ln[a] 5 261.896 42 693 αD exp[γD] ln[y] 5 275.344 42 693
–
–
–
–
Table D7 Fits of generalized ERR and EAR models to LSS colon cancer incidence data Using DS02 colon dose, adjusted for 35% GSD dose errors, truncated, using adjustment factors derived from DS86 [P2]The optimal models are shown in boldface
a D = RBE 10 colon dose (Sv), a = attained age, e = age at exposure, y = years since exposure (= a – e).
UNSCEAR REPORT-PART 5.qxp 10/7/08 3:41 pm Page 274
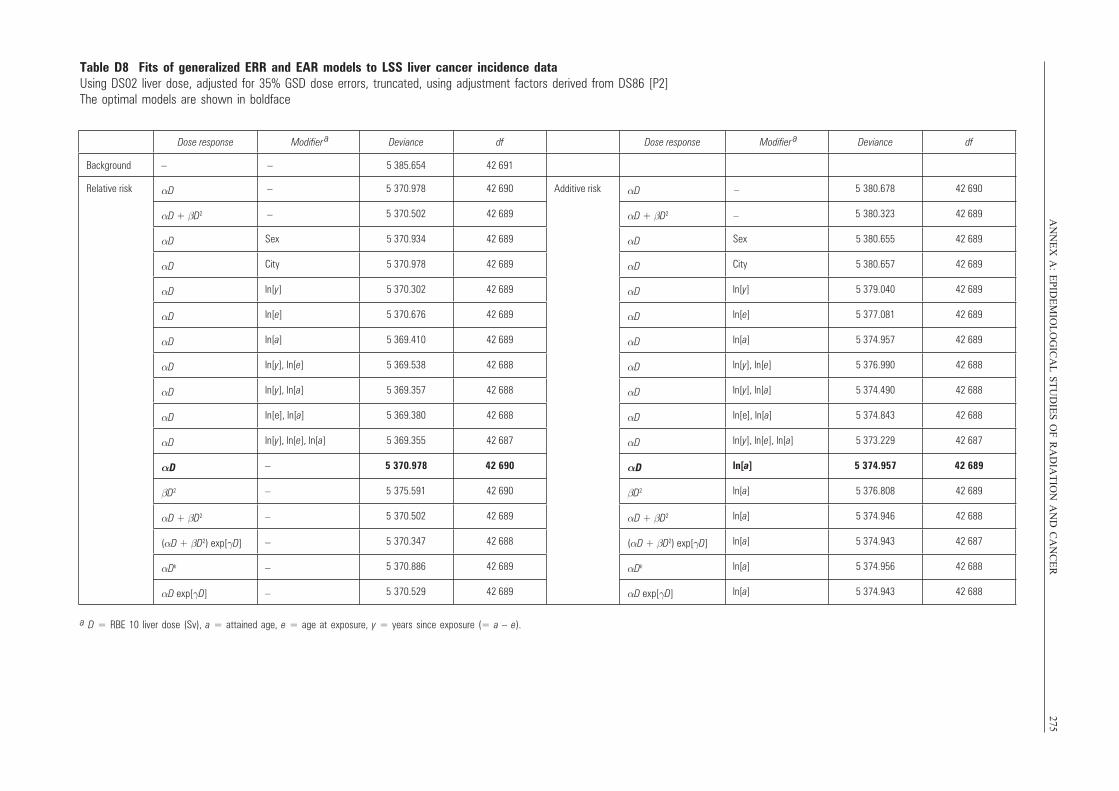
AN
NE
X A
: EP
IDE
MIO
LO
GIC
AL
ST
UD
IES
OF
RA
DIA
TIO
N A
ND
CA
NC
ER
275Table D8 Fits of generalized ERR and EAR models to LSS liver cancer incidence data Using DS02 liver dose, adjusted for 35% GSD dose errors, truncated, using adjustment factors derived from DS86 [P2]The optimal models are shown in boldface
Dose response Modifier a Deviance df Dose response Modifier
a Deviance df
Background – –
5 385.654 42 691
Relative risk αD 5 370.978 42 690 Additive risk αD 5 380.678 42 690
αD + βD2 5 370.502 42 689 αD + βD2 5 380.323 42 689
αD Sex 5 370.934 42 689 αD Sex 5 380.655 42 689
αD City 5 370.978 42 689 αD City 5 380.657 42 689
αD ln[y] 5 370.302 42 689 αD ln[y] 5 379.040 42 689
αD ln[e] 5 370.676 42 689 αD ln[e] 5 377.081 42 689
αD ln[a] 5 369.410 42 689 αD ln[a] 5 374.957 42 689
αD ln[y], ln[e] 5 369.538 42 688 αD ln[y], ln[e] 5 376.990 42 688
αD ln[y], ln[a] 5 369.357 42 688 αD ln[y], ln[a] 5 374.490 42 688
αD ln[e], ln[a] 5 369.380 42 688 αD ln[e], ln[a] 5 374.843 42 688
αD ln[y], ln[e], ln[a] 5 369.355 42 687 αD ln[y], ln[e], ln[a] 5 373.229 42 687
αD –
–
–
–
–
–
5 370.978 42 690 αD ln[a] 5 374.957 42 689
βD2 5 375.591 42 690 βD2 ln[a] 5 376.808 42 689
αD + βD2 5 370.502 42 689 αD + βD2 ln[a] 5 374.946 42 688
(αD + βD2) exp[γD] 5 370.347 42 688 (αD + βD2) exp[γD] ln[a] 5 374.943 42 687
αDk 5 370.886 42 689 αDk ln[a] 5 374.956 42 688
αD exp[γD] 5 370.529 42 689 αD exp[γD] ln[a] 5 374.943 42 688
–
–
–
–
a D = RBE 10 liver dose (Sv), a = attained age, e = age at exposure, y = years since exposure (= a – e).
UNSCEAR REPORT-PART 5.qxp 10/7/08 3:41 pm Page 275
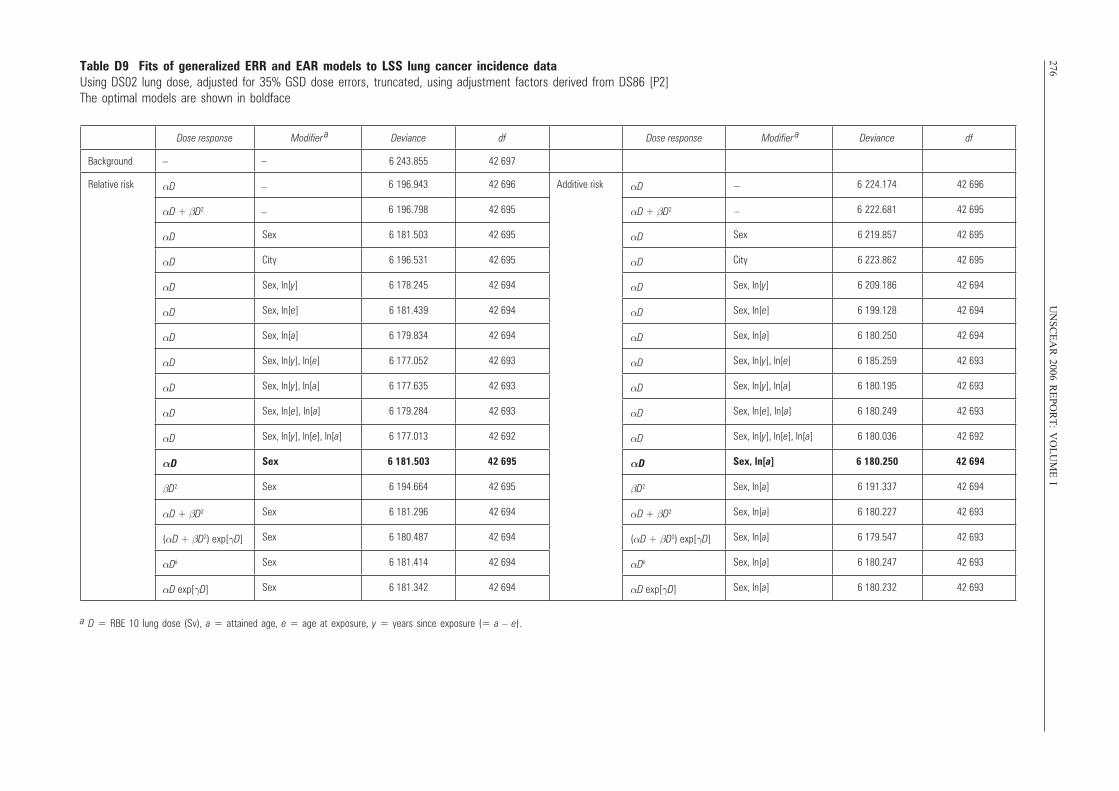
276U
NS
CE
AR
2006 RE
PO
RT
: VO
LU
ME
ITable D9 Fits of generalized ERR and EAR models to LSS lung cancer incidence data Using DS02 lung dose, adjusted for 35% GSD dose errors, truncated, using adjustment factors derived from DS86 [P2]The optimal models are shown in boldface
Dose response Modifier a Deviance df Dose response Modifier
a Deviance df
Background – 6 243.855 42 697
Relative risk αD 6 196.943 42 696 Additive risk αD 6 224.174 42 696
αD + βD2 6 196.798 42 695 αD + βD2 6 222.681 42 695
αD Sex 6 181.503 42 695 αD Sex 6 219.857 42 695
αD City 6 196.531 42 695 αD City 6 223.862 42 695
αD Sex, ln[y] 6 178.245 42 694 αD Sex, ln[y] 6 209.186 42 694
αD Sex, ln[e] 6 181.439 42 694 αD Sex, ln[e] 6 199.128 42 694
αD Sex, ln[a] 6 179.834 42 694 αD Sex, ln[a] 6 180.250 42 694
αD Sex, ln[y], ln[e] 6 177.052 42 693 αD Sex, ln[y], ln[e] 6 185.259 42 693
αD Sex, ln[y], ln[a] 6 177.635 42 693 αD Sex, ln[y], ln[a] 6 180.195 42 693
αD Sex, ln[e], ln[a] 6 179.284 42 693 αD Sex, ln[e], ln[a] 6 180.249 42 693
αD Sex, ln[y], ln[e], ln[a] 6 177.013 42 692 αD Sex, ln[y], ln[e], ln[a] 6 180.036 42 692
αD Sex 6 181.503 42 695 αD Sex, ln[a] 6 180.250 42 694
βD2 Sex 6 194.664 42 695 βD2 Sex, ln[a] 6 191.337 42 694
αD + βD2 Sex 6 181.296 42 694 αD + βD2 Sex, ln[a] 6 180.227 42 693
(αD + βD2) exp[γD] Sex 6 180.487 42 694 (αD + βD2) exp[γD] Sex, ln[a] 6 179.547 42 693
αDk Sex 6 181.414 42 694 αDk Sex, ln[a] 6 180.247 42 693
αD exp[γD] Sex 6 181.342 42 694 αD exp[γD] Sex, ln[a] 6 180.232 42 693
–
–
–
–
–
a D = RBE 10 lung dose (Sv), a = attained age, e = age at exposure, y = years since exposure (= a – e).
UNSCEAR REPORT-PART 5.qxp 10/7/08 3:41 pm Page 276
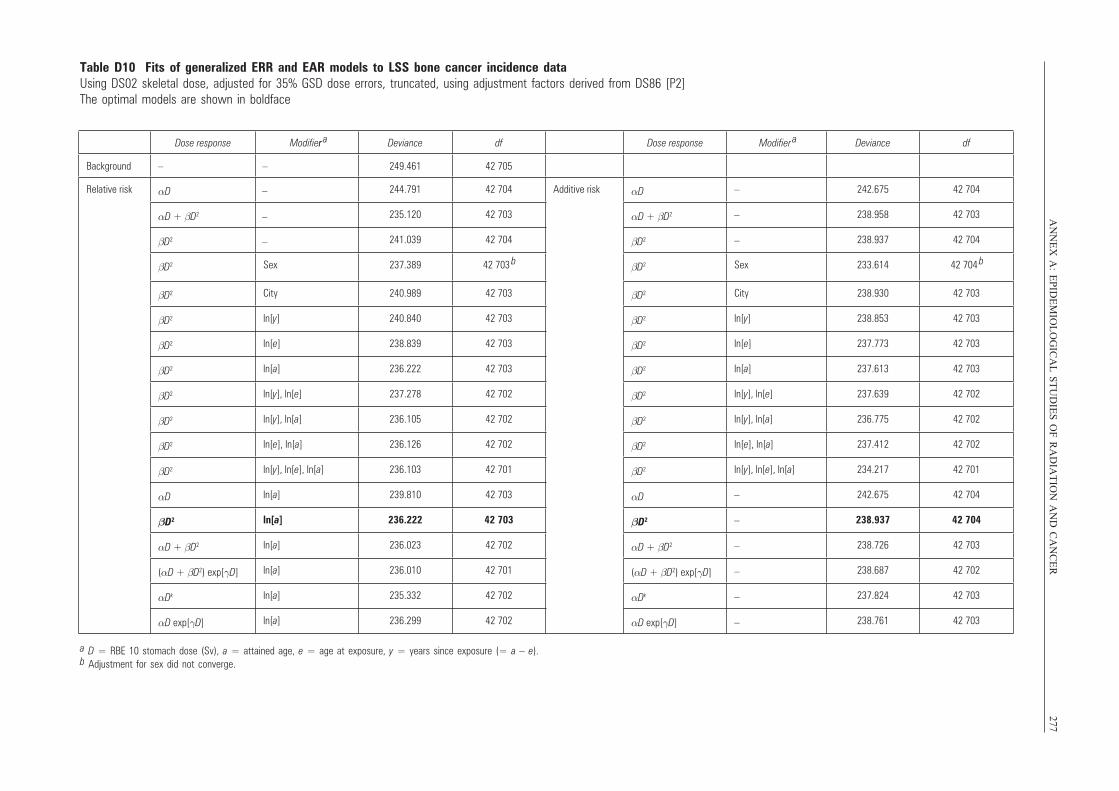
AN
NE
X A
: EP
IDE
MIO
LO
GIC
AL
ST
UD
IES
OF
RA
DIA
TIO
N A
ND
CA
NC
ER
277Table D10 Fits of generalized ERR and EAR models to LSS bone cancer incidence data Using DS02 skeletal dose, adjusted for 35% GSD dose errors, truncated, using adjustment factors derived from DS86 [P2]The optimal models are shown in boldface
Dose response Modifier ar Deviance df Dose response Modifier
a Deviance df
Background – – 249.461 42 705
Relative risk αD 244.791 42 704 Additive risk αD –
–
–
242.675 42 704
αD + βD2 235.120 42 703 αD + βD2 238.958 42 703
βD2 241.039 42 704 βD2 238.937 42 704
βD2 Sex 237.389 42 703 b βD2 Sex 233.614 42 704
b
βD2 City 240.989 42 703 βD2 City 238.930 42 703
βD2 ln[y] 240.840 42 703 βD2 ln[y] 238.853 42 703
βD2 ln[e] 238.839 42 703 βD2 ln[e] 237.773 42 703
βD2 ln[a] 236.222 42 703 βD2 ln[a] 237.613 42 703
βD2 ln[y], ln[e] 237.278 42 702 βD2 ln[y], ln[e] 237.639 42 702
βD2 ln[y], ln[a] 236.105 42 702 βD2 ln[y], ln[a] 236.775 42 702
βD2 ln[e], ln[a] 236.126 42 702 βD2 ln[e], ln[a] 237.412 42 702
βD2 ln[y], ln[e], ln[a] 236.103 42 701 βD2 ln[y], ln[e], ln[a] 234.217 42 701
αD ln[a] 239.810 42 703 αD –
–
–
–
–
–
242.675 42 704
βD2 ln[a] 236.222 42 703 βD2 238.937 42 704
αD + βD2 ln[a] 236.023 42 702 αD + βD2 238.726 42 703
(αD + βD2) exp[γD] ln[a] 236.010 42 701 (αD + βD2) exp[γD] 238.687 42 702
αDk ln[a] 235.332 42 702 αDk 237.824 42 703
αD exp[γD] ln[a] 236.299 42 702 αD exp[γD] 238.761 42 703
–
–
–
a D = RBE 10 stomach dose (Sv), a = attained age, e = age at exposure, y = years since exposure (= a – e).b Adjustment for sex did not converge.
UNSCEAR REPORT-PART 5.qxp 10/7/08 3:41 pm Page 277
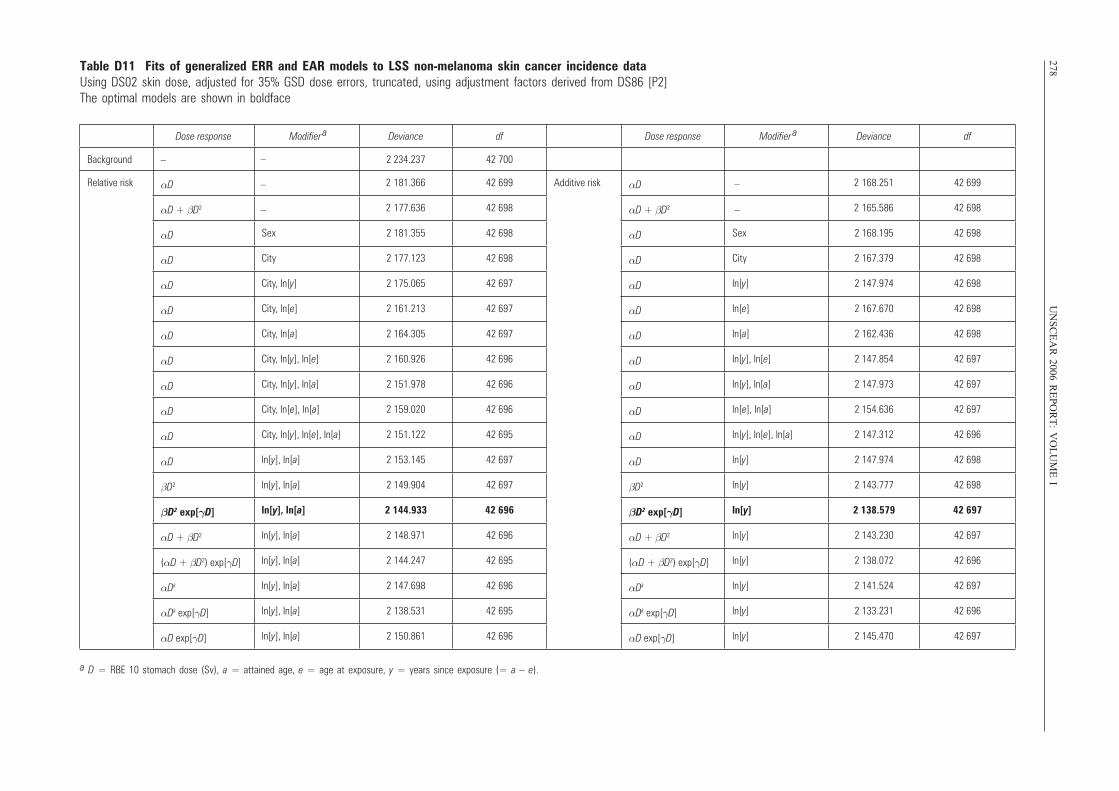
278U
NS
CE
AR
2006 RE
PO
RT
: VO
LU
ME
ITable D11 Fits of generalized ERR and EAR models to LSS non-melanoma skin cancer incidence data Using DS02 skin dose, adjusted for 35% GSD dose errors, truncated, using adjustment factors derived from DS86 [P2]The optimal models are shown in boldface
Dose response Modifier a Deviance df Dose response Modifier
a Deviance df
Background – 2 234.237 42 700
Relative risk αD 2 181.366 42 699 Additive risk αD 2 168.251 42 699
αD + βD2 2 177.636 42 698 αD + βD2 2 165.586 42 698
αD Sex 2 181.355 42 698 αD Sex 2 168.195 42 698
αD City 2 177.123 42 698 αD City 2 167.379 42 698
αD City, ln[y] 2 175.065 42 697 αD ln[y] 2 147.974 42 698
αD City, ln[e] 2 161.213 42 697 αD ln[e] 2 167.670 42 698
αD City, ln[a] 2 164.305 42 697 αD ln[a] 2 162.436 42 698
αD City, ln[y], ln[e] 2 160.926 42 696 αD ln[y], ln[e] 2 147.854 42 697
αD City, ln[y], ln[a] 2 151.978 42 696 αD ln[y], ln[a] 2 147.973 42 697
αD City, ln[e], ln[a] 2 159.020 42 696 αD ln[e], ln[a] 2 154.636 42 697
αD City, ln[y], ln[e], ln[a] 2 151.122 42 695 αD ln[y], ln[e], ln[a] 2 147.312 42 696
αD ln[y], ln[a] 2 153.145 42 697 αD ln[y] 2 147.974 42 698
βD2 ln[y], ln[a] 2 149.904 42 697 βD2 ln[y] 2 143.777 42 698
βD2 exp[γD] ln[y], ln[a] 2 144.933 42 696 βD2 exp[γD] ln[y] 2 138.579 42 697
αD + βD2 ln[y], ln[a] 2 148.971 42 696 αD + βD2 ln[y] 2 143.230 42 697
(αD + βD2) exp[γD] ln[y], ln[a] 2 144.247 42 695 (αD + βD2) exp[γD] ln[y] 2 138.072 42 696
αDk ln[y], ln[a] 2 147.698 42 696 αDk ln[y] 2 141.524 42 697
αDk exp[γD] ln[y], ln[a] 2 138.531 42 695 αDk exp[γD] ln[y] 2 133.231 42 696
αD exp[γD] ln[y], ln[a] 2 150.861 42 696 αD exp[γD] ln[y] 2 145.470 42 697
–
–
–
–
–
a D = RBE 10 stomach dose (Sv), a = attained age, e = age at exposure, y = years since exposure (= a – e).
UNSCEAR REPORT-PART 5.qxp 10/7/08 3:41 pm Page 278
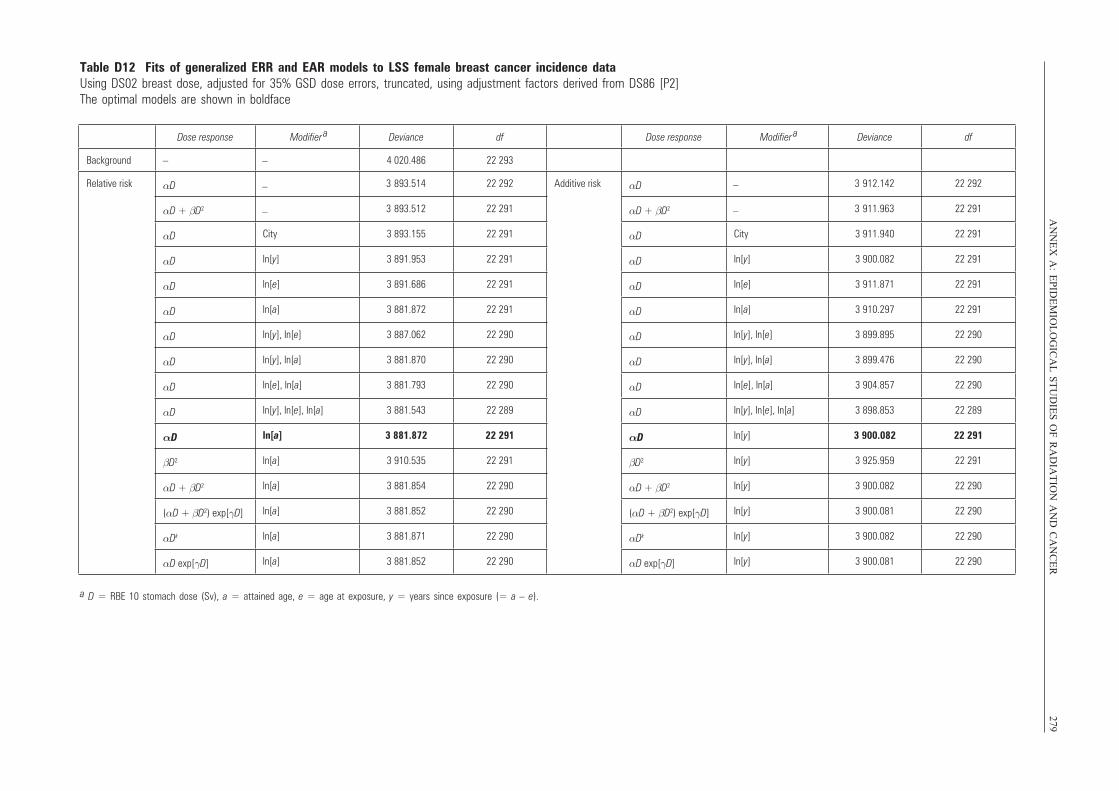
AN
NE
X A
: EP
IDE
MIO
LO
GIC
AL
ST
UD
IES
OF
RA
DIA
TIO
N A
ND
CA
NC
ER
279Table D12 Fits of generalized ERR and EAR models to LSS female breast cancer incidence data Using DS02 breast dose, adjusted for 35% GSD dose errors, truncated, using adjustment factors derived from DS86 [P2]The optimal models are shown in boldface
Dose response Modifier a Deviance df Dose response Modifier
a Deviance df
Background – 4 020.486 22 293
Relative risk αD 3 893.514 22 292 Additive risk αD 3 912.142 22 292
αD + βD2 3 893.512 22 291 αD + βD2 3 911.963 22 291
αD City 3 893.155 22 291 αD City 3 911.940 22 291
αD ln[y] 3 891.953 22 291 αD ln[y] 3 900.082 22 291
αD ln[e] 3 891.686 22 291 αD ln[e] 3 911.871 22 291
αD ln[a] 3 881.872 22 291 αD ln[a] 3 910.297 22 291
αD ln[y], ln[e] 3 887.062 22 290 αD ln[y], ln[e] 3 899.895 22 290
αD ln[y], ln[a] 3 881.870 22 290 αD ln[y], ln[a] 3 899.476 22 290
αD ln[e], ln[a] 3 881.793 22 290 αD ln[e], ln[a] 3 904.857 22 290
αD ln[y], ln[e], ln[a] 3 881.543 22 289 αD ln[y], ln[e], ln[a] 3 898.853 22 289
αD ln[a] 3 881.872 22 291 αD ln[y] 3 900.082 22 291
βD2 ln[a] 3 910.535 22 291 βD2 ln[y] 3 925.959 22 291
αD + βD2 ln[a] 3 881.854 22 290 αD + βD2 ln[y] 3 900.082 22 290
(αD + βD2) exp[γD] ln[a] 3 881.852 22 290 (αD + βD2) exp[γD] ln[y] 3 900.081 22 290
αDk ln[a] 3 881.871 22 290 αDk ln[y] 3 900.082 22 290
αD exp[γD] ln[a] 3 881.852 22 290 αD exp[γD] ln[y] 3 900.081 22 290
–
–
–
–
–
a D = RBE 10 stomach dose (Sv), a = attained age, e = age at exposure, y = years since exposure (= a – e).
UNSCEAR REPORT-PART 5.qxp 10/7/08 3:41 pm Page 279
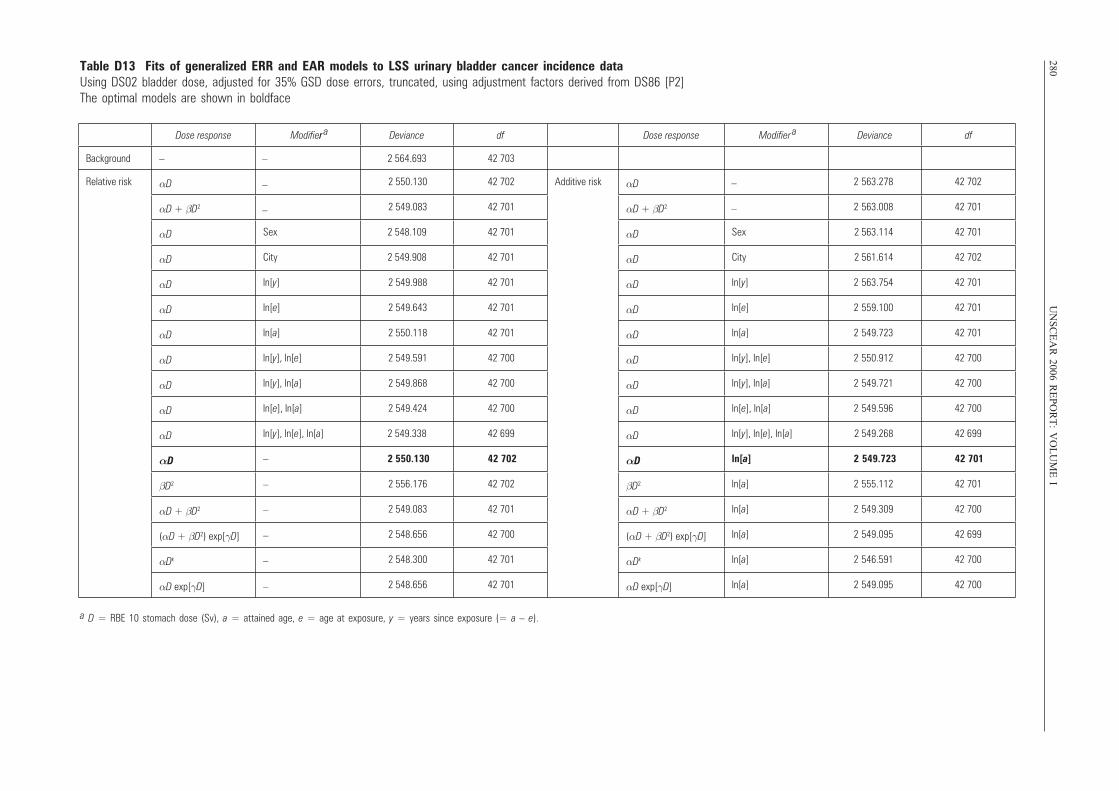
280U
NS
CE
AR
2006 RE
PO
RT
: VO
LU
ME
ITable D13 Fits of generalized ERR and EAR models to LSS urinary bladder cancer incidence data Using DS02 bladder dose, adjusted for 35% GSD dose errors, truncated, using adjustment factors derived from DS86 [P2]The optimal models are shown in boldface
Dose response Modifier ar Deviance df Dose response Modifier
a Deviance df
Background – 2 564.693 42 703
Relative risk αD 2 550.130 42 702 Additive risk αD 2 563.278 42 702
αD + βD2 2 549.083 42 701 αD + βD2 2 563.008 42 701
αD Sex 2 548.109 42 701 αD Sex 2 563.114 42 701
αD City 2 549.908 42 701 αD City 2 561.614 42 702
αD ln[y] 2 549.988 42 701 αD ln[y] 2 563.754 42 701
αD ln[e] 2 549.643 42 701 αD ln[e] 2 559.100 42 701
αD ln[a] 2 550.118 42 701 αD ln[a] 2 549.723 42 701
αD ln[y], ln[e] 2 549.591 42 700 αD ln[y], ln[e] 2 550.912 42 700
αD ln[y], ln[a] 2 549.868 42 700 αD ln[y], ln[a] 2 549.721 42 700
αD ln[e], ln[a] 2 549.424 42 700 αD ln[e], ln[a] 2 549.596 42 700
αD ln[y], ln[e], ln[a] 2 549.338 42 699 αD ln[y], ln[e], ln[a] 2 549.268 42 699
αD –
–
–
–
–
–
2 550.130 42 702 αD ln[a] 2 549.723 42 701
βD2 2 556.176 42 702 βD2 ln[a] 2 555.112 42 701
αD + βD2 2 549.083 42 701 αD + βD2 ln[a] 2 549.309 42 700
(αD + βD2) exp[γD] 2 548.656 42 700 (αD + βD2) exp[γD] ln[a] 2 549.095 42 699
αDk 2 548.300 42 701 αDk ln[a] 2 546.591 42 700
αD exp[γD] 2 548.656 42 701 αD exp[γD] ln[a] 2 549.095 42 700
–
–
–
–
–
a D = RBE 10 stomach dose (Sv), a = attained age, e = age at exposure, y = years since exposure (= a – e).
UNSCEAR REPORT-PART 5.qxp 10/7/08 3:41 pm Page 280
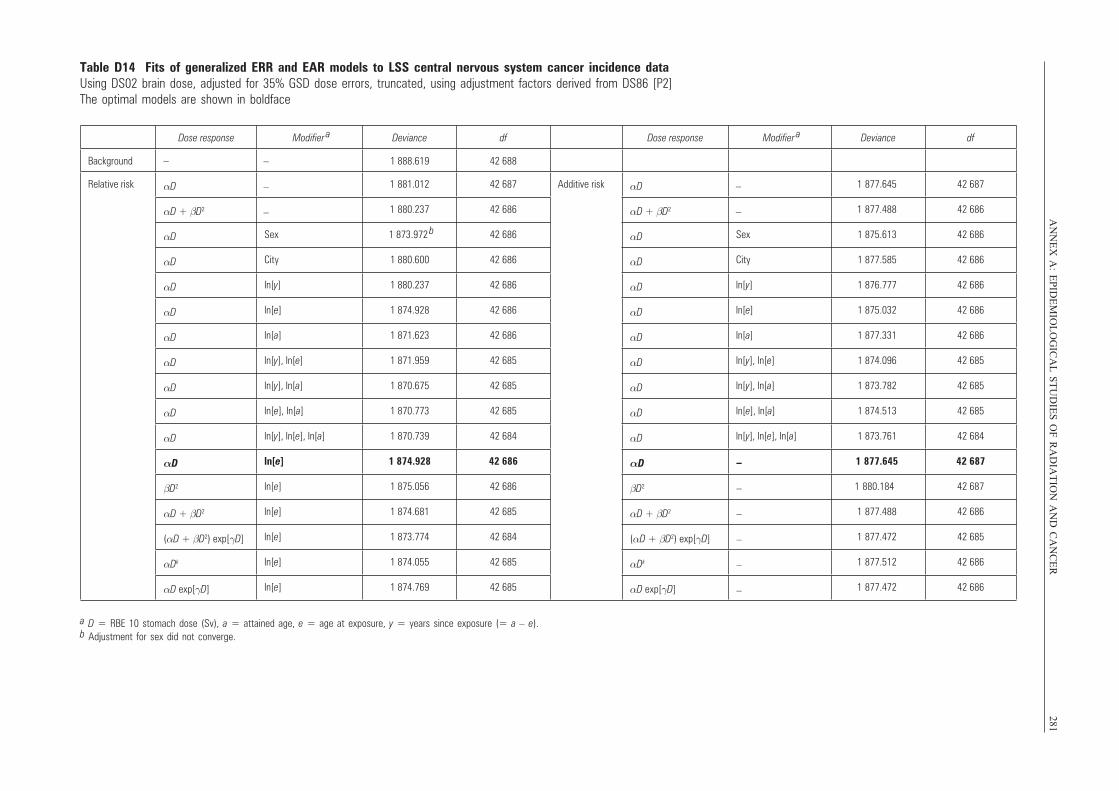
AN
NE
X A
: EP
IDE
MIO
LO
GIC
AL
ST
UD
IES
OF
RA
DIA
TIO
N A
ND
CA
NC
ER
281Table D14 Fits of generalized ERR and EAR models to LSS central nervous system cancer incidence data Using DS02 brain dose, adjusted for 35% GSD dose errors, truncated, using adjustment factors derived from DS86 [P2]The optimal models are shown in boldface
Dose response Modifier a Deviance df Dose response Modifier
a Deviance df
Background – 1 888.619 42 688
Relative risk αD 1 881.012 42 687 Additive risk αD 1 877.645 42 687
αD + βD2 1 880.237 42 686 αD + βD2 1 877.488 42 686
αD Sex 1 873.972 b 42 686 αD Sex 1 875.613 42 686
αD City 1 880.600 42 686 αD City 1 877.585 42 686
αD ln[y] 1 880.237 42 686 αD ln[y] 1 876.777 42 686
αD ln[e] 1 874.928 42 686 αD ln[e] 1 875.032 42 686
αD ln[a] 1 871.623 42 686 αD ln[a] 1 877.331 42 686
αD ln[y], ln[e] 1 871.959 42 685 αD ln[y], ln[e] 1 874.096 42 685
αD ln[y], ln[a] 1 870.675 42 685 αD ln[y], ln[a] 1 873.782 42 685
αD ln[e], ln[a] 1 870.773 42 685 αD ln[e], ln[a] 1 874.513 42 685
αD ln[y], ln[e], ln[a] 1 870.739 42 684 αD ln[y], ln[e], ln[a] 1 873.761 42 684
αD ln[e] 1 874.928 42 686 αD 1 877.645 42 687
βD2 ln[e] 1 875.056 42 686 βD2 1 880.184 42 687
αD + βD2 ln[e] 1 874.681 42 685 αD + βD2 1 877.488 42 686
(αD + βD2) exp[γD] ln[e] 1 873.774 42 684 (αD + βD2) exp[γD] 1 877.472 42 685
αDk ln[e] 1 874.055 42 685 αDk 1 877.512 42 686
αD exp[γD] ln[e] 1 874.769 42 685 αD exp[γD] 1 877.472 42 686
–
–
–
–
–
–
–
–
–
–
–
a D = RBE 10 stomach dose (Sv), a = attained age, e = age at exposure, y = years since exposure (= a – e).b Adjustment for sex did not converge.
UNSCEAR REPORT-PART 5.qxp 10/7/08 3:41 pm Page 281
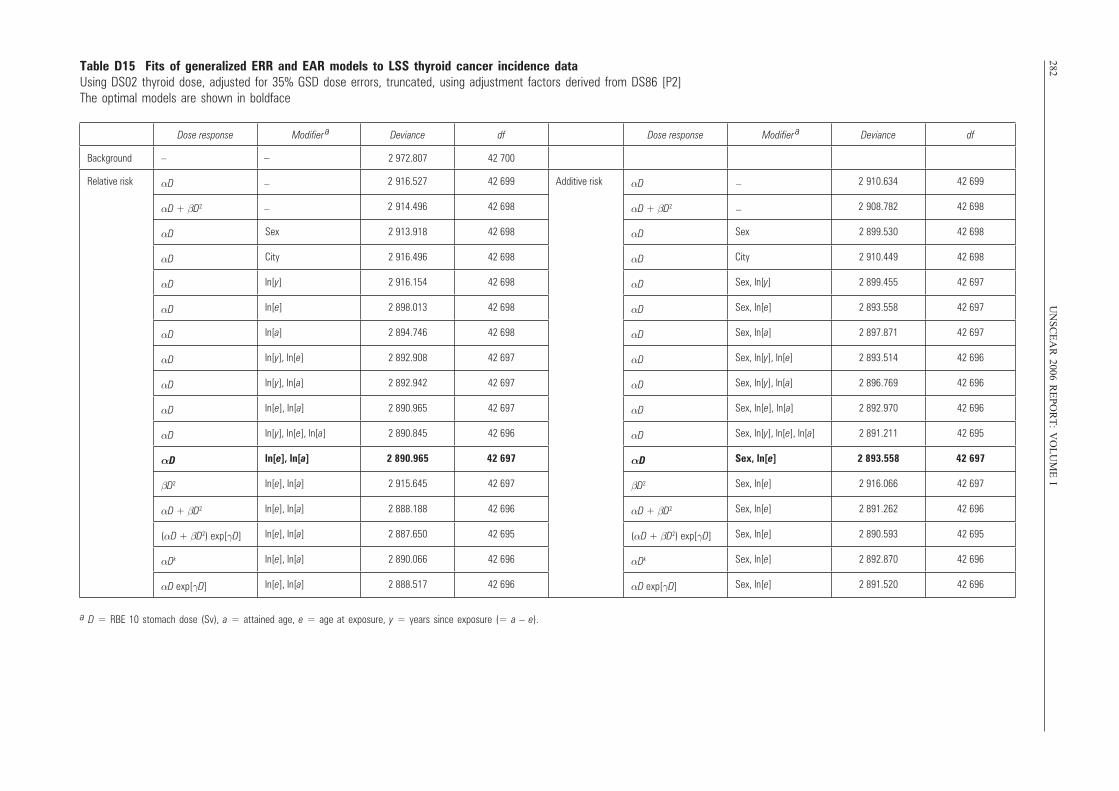
282U
NS
CE
AR
2006 RE
PO
RT
: VO
LU
ME
ITable D15 Fits of generalized ERR and EAR models to LSS thyroid cancer incidence data Using DS02 thyroid dose, adjusted for 35% GSD dose errors, truncated, using adjustment factors derived from DS86 [P2]The optimal models are shown in boldface
Dose response Modifier a Deviance df Dose response Modifier
a Deviance df
Background – 2 972.807 42 700
Relative risk αD 2 916.527 42 699 Additive risk αD 2 910.634 42 699
αD + βD2 2 914.496 42 698 αD + βD2 2 908.782 42 698
αD Sex 2 913.918 42 698 αD Sex 2 899.530 42 698
αD City 2 916.496 42 698 αD City 2 910.449 42 698
αD ln[y] 2 916.154 42 698 αD Sex, ln[y] 2 899.455 42 697
αD ln[e] 2 898.013 42 698 αD Sex, ln[e] 2 893.558 42 697
αD ln[a] 2 894.746 42 698 αD Sex, ln[a] 2 897.871 42 697
αD ln[y], ln[e] 2 892.908 42 697 αD Sex, ln[y], ln[e] 2 893.514 42 696
αD ln[y], ln[a] 2 892.942 42 697 αD Sex, ln[y], ln[a] 2 896.769 42 696
αD ln[e], ln[a] 2 890.965 42 697 αD Sex, ln[e], ln[a] 2 892.970 42 696
αD ln[y], ln[e], ln[a] 2 890.845 42 696 αD Sex, ln[y], ln[e], ln[a] 2 891.211 42 695
αD ln[e], ln[a] 2 890.965 42 697 αD Sex, ln[e] 2 893.558 42 697
βD2 ln[e], ln[a] 2 915.645 42 697 βD2 Sex, ln[e] 2 916.066 42 697
αD + βD2 ln[e], ln[a] 2 888.188 42 696 αD + βD2 Sex, ln[e] 2 891.262 42 696
(αD + βD2) exp[γD] ln[e], ln[a] 2 887.650 42 695 (αD + βD2) exp[γD] Sex, ln[e] 2 890.593 42 695
αDk ln[e], ln[a] 2 890.066 42 696 αDk Sex, ln[e] 2 892.870 42 696
αD exp[γD] ln[e], ln[a] 2 888.517 42 696 αD exp[γD] Sex, ln[e] 2 891.520 42 696
–
–
–
–
–
a D = RBE 10 stomach dose (Sv), a = attained age, e = age at exposure, y = years since exposure (= a – e).
UNSCEAR REPORT-PART 5.qxp 10/7/08 3:41 pm Page 282
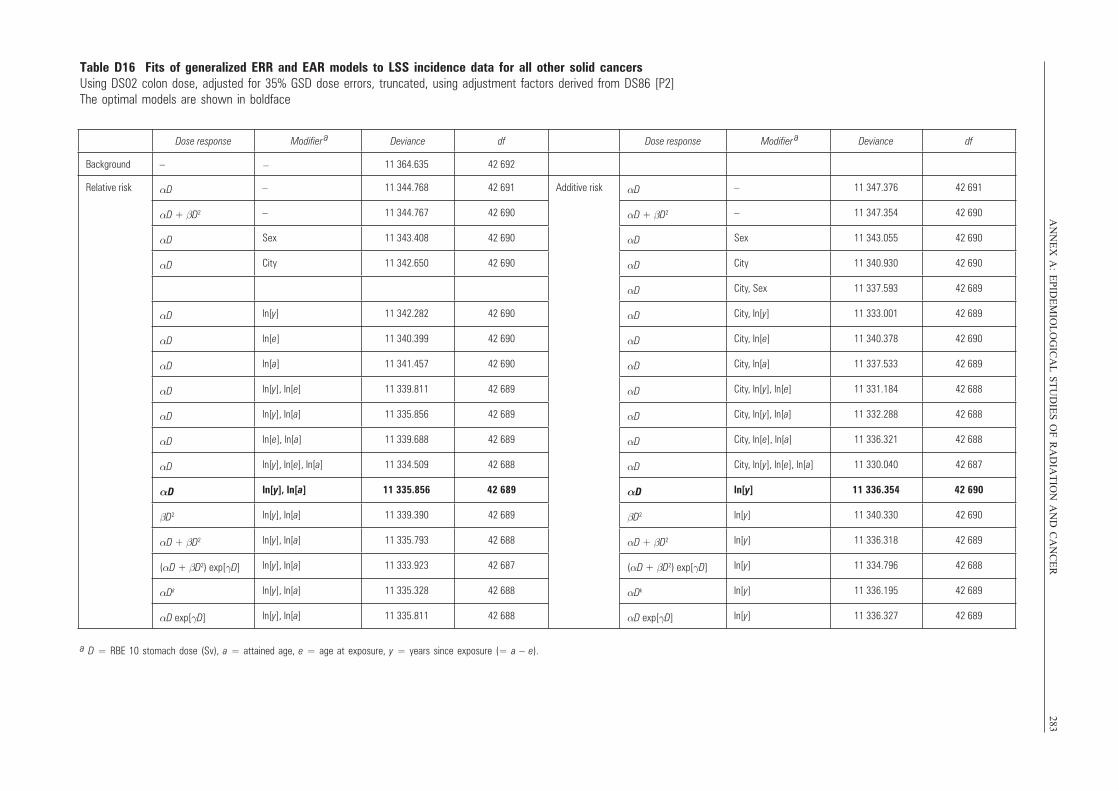
AN
NE
X A
: EP
IDE
MIO
LO
GIC
AL
ST
UD
IES
OF
RA
DIA
TIO
N A
ND
CA
NC
ER
283Table D16 Fits of generalized ERR and EAR models to LSS incidence data for all other solid cancersUsing DS02 colon dose, adjusted for 35% GSD dose errors, truncated, using adjustment factors derived from DS86 [P2]The optimal models are shown in boldface
Dose response Modifier a Deviance df Dose response Modifier
a Deviance df
Background – 11 364.635 42 692
Relative risk αD – 11 344.768 42 691 Additive risk αD – 11 347.376 42 691
αD + βD2 – 11 344.767 42 690 αD + βD2 – 11 347.354 42 690
αD Sex 11 343.408 42 690 αD Sex 11 343.055 42 690
αD City 11 342.650 42 690 αD City 11 340.930 42 690
αD City, Sex 11 337.593 42 689
αD ln[y] 11 342.282 42 690 αD City, ln[y] 11 333.001 42 689
αD ln[e] 11 340.399 42 690 αD City, ln[e] 11 340.378 42 690
αD ln[a] 11 341.457 42 690 αD City, ln[a] 11 337.533 42 689
αD ln[y], ln[e] 11 339.811 42 689 αD City, ln[y], ln[e] 11 331.184 42 688
αD ln[y], ln[a] 11 335.856 42 689 αD City, ln[y], ln[a] 11 332.288 42 688
αD ln[e], ln[a] 11 339.688 42 689 αD City, ln[e], ln[a] 11 336.321 42 688
αD ln[y], ln[e], ln[a] 11 334.509 42 688 αD City, ln[y], ln[e], ln[a] 11 330.040 42 687
αD ln[y], ln[a] 11 335.856 42 689 αD ln[y] 11 336.354 42 690
βD2 ln[y], ln[a] 11 339.390 42 689 βD2 ln[y] 11 340.330 42 690
αD + βD2 ln[y], ln[a] 11 335.793 42 688 αD + βD2 ln[y] 11 336.318 42 689
(αD + βD2) exp[γD] ln[y], ln[a] 11 333.923 42 687 (αD + βD2) exp[γD] ln[y] 11 334.796 42 688
αDk ln[y], ln[a] 11 335.328 42 688 αDk ln[y] 11 336.195 42 689
αD exp[γD] ln[y], ln[a] 11 335.811 42 688 αD exp[γD] ln[y] 11 336.327 42 689
–
a D = RBE 10 stomach dose (Sv), a = attained age, e = age at exposure, y = years since exposure (= a – e).
UNSCEAR REPORT-PART 5.qxp 10/7/08 3:41 pm Page 283
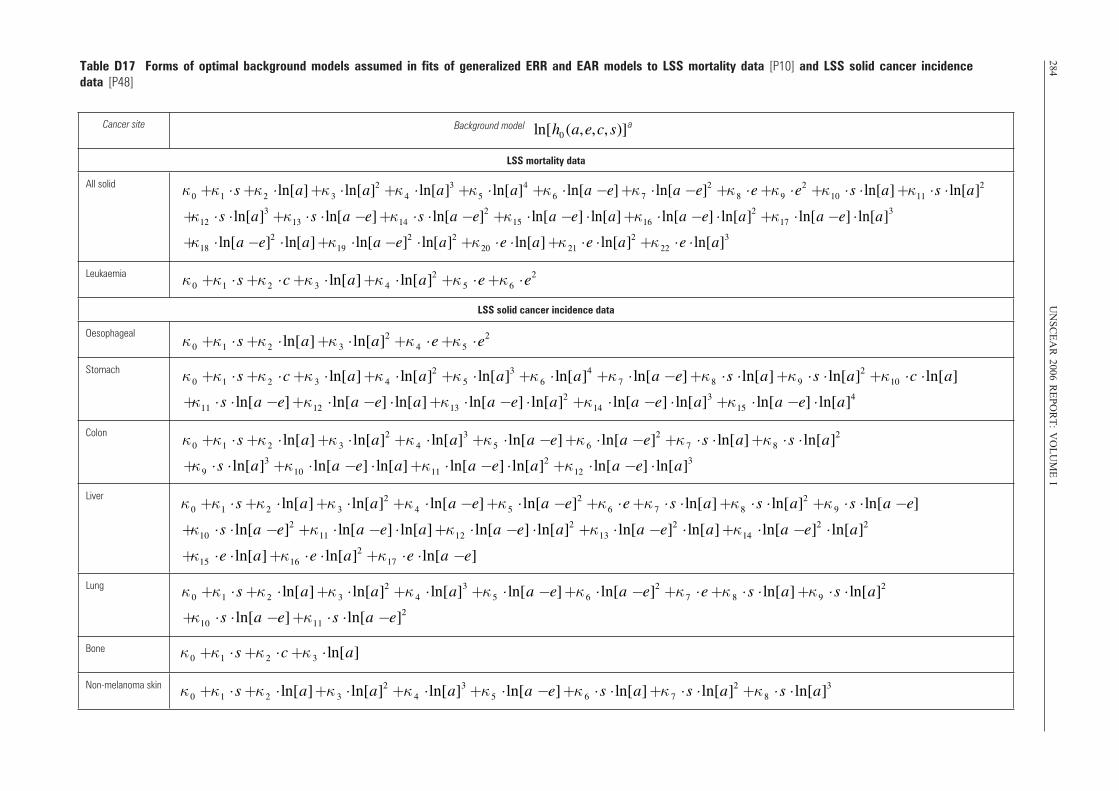
284U
NS
CE
AR
2006 RE
PO
RT
: VO
LU
ME
ITable D17 Forms of optimal background models assumed in fits of generalized ERR and EAR models to LSS mortality data [P10] and LSS solid cancer incidence data [P48]
Cancer site Background model
LSS mortality data
All solid
Leukaemia
LSS solid cancer incidence data
Oesophageal
Stomach
Colon
Liver
Lung
Bone
Non-melanoma skin
κ0 +κ1 ⋅ s+κ2 ⋅ ln[a]+κ 3 ⋅ ln[a]2 +κ 4 ⋅ ln[a]3 +κ5 ⋅ ln[a]4 +κ 6 ⋅ ln[a −e]+κ 7 ⋅ ln[a −e]2 +κ 8 ⋅e+κ9 ⋅e2 +κ10 ⋅ s ⋅ ln[a]+κ11 ⋅ s ⋅ ln[a]2
+κ12 ⋅ s ⋅ ln[a]3 +κ13 ⋅ s ⋅ ln[a −e]+κ14 ⋅ s ⋅ ln[a −e]2 +κ15 ⋅ ln[a −e] ⋅ ln[a]+κ16 ⋅ ln[a −e] ⋅ ln[a]2 +κ17 ⋅ ln[a −e] ⋅ ln[a]3
+κ18 ⋅ ln[a −e]2 ⋅ ln[a]+κ19 ⋅ ln[a −e]2 ⋅ ln[a]2 +κ20 ⋅e ⋅ ln[a]+κ 21 ⋅e ⋅ ln[a]2 +κ 22 ⋅e ⋅ ln[a]3
ln[h0 (a,e,c, s)]
κ0 +κ1 ⋅ s+κ2 ⋅c+κ 3 ⋅ ln[a]+κ 4 ⋅ ln[a]2 +κ 5 ⋅e+κ6 ⋅e2
κ0 +κ1 ⋅ s+κ2 ⋅ ln[a]+κ 3 ⋅ ln[a]2 +κ 4 ⋅e+κ5 ⋅e2
κ0 +κ1 ⋅ s+κ2 ⋅c+κ 3 ⋅ ln[a]+κ 4 ⋅ ln[a]2 +κ 5 ⋅ ln[a]3 +κ 6 ⋅ ln[a]4 +κ 7 ⋅ ln[a −e]+κ8 ⋅ s ⋅ ln[a]+κ 9 ⋅ s ⋅ ln[a]2 +κ10 ⋅c ⋅ ln[a]
+κ11 ⋅ s ⋅ ln[a −e]+κ12 ⋅ ln[a −e] ⋅ ln[a]+κ13 ⋅ ln[a −e] ⋅ ln[a]2 +κ14 ⋅ ln[a −e] ⋅ ln[a]3 +κ15 ⋅ ln[a −e] ⋅ ln[a]4
κ0 +κ1 ⋅ s+κ2 ⋅ ln[a]+κ 3 ⋅ ln[a]2 +κ 4 ⋅ ln[a]3 +κ5 ⋅ ln[a −e]+κ 6 ⋅ ln[a −e]2 +κ 7 ⋅ s ⋅ ln[a]+κ 8 ⋅ s ⋅ ln[a]2
+κ 9 ⋅ s ⋅ ln[a]3 +κ10 ⋅ ln[a −e] ⋅ ln[a]+κ11 ⋅ ln[a −e] ⋅ ln[a]2 +κ12 ⋅ ln[a −e] ⋅ ln[a]3
κ0 +κ1 ⋅ s+κ2 ⋅ ln[a]+κ 3 ⋅ ln[a]2 +κ 4 ⋅ ln[a −e]+κ5 ⋅ ln[a −e]2 +κ6 ⋅e+κ 7 ⋅ s ⋅ ln[a]+κ8 ⋅ s ⋅ ln[a]2 +κ 9 ⋅ s ⋅ ln[a −e]
+κ10 ⋅ s ⋅ ln[a −e]2 +κ11 ⋅ ln[a −e] ⋅ ln[a]+κ12 ⋅ ln[a −e] ⋅ ln[a]2 +κ13 ⋅ ln[a −e]2 ⋅ ln[a]+κ14 ⋅ ln[a −e]2 ⋅ ln[a]2
+κ15 ⋅e ⋅ ln[a]+κ16 ⋅e ⋅ ln[a]2 +κ17 ⋅e ⋅ ln[a −e]
κ0 +κ1 ⋅ s+κ2 ⋅ ln[a]+κ 3 ⋅ ln[a]2 +κ 4 ⋅ ln[a]3 +κ5 ⋅ ln[a −e]+κ6 ⋅ ln[a −e]2 +κ 7 ⋅e+κ 8 ⋅ s ⋅ ln[a]+κ9 ⋅ s ⋅ ln[a]2
+κ10 ⋅ s ⋅ ln[a −e]+κ11 ⋅ s ⋅ ln[a −e]2
κ0 +κ1 ⋅ s+κ 2 ⋅c+κ 3 ⋅ ln[a]
κ0 +κ1 ⋅ s+κ2 ⋅ ln[a]+κ 3 ⋅ ln[a]2 +κ 4 ⋅ ln[a]3 +κ5 ⋅ ln[a −e]+κ 6 ⋅ s ⋅ ln[a]+κ 7 ⋅ s ⋅ ln[a]2 +κ8 ⋅ s ⋅ ln[a]3
a
UNSCEAR REPORT-PART 5.qxp 10/7/08 3:41 pm Page 284
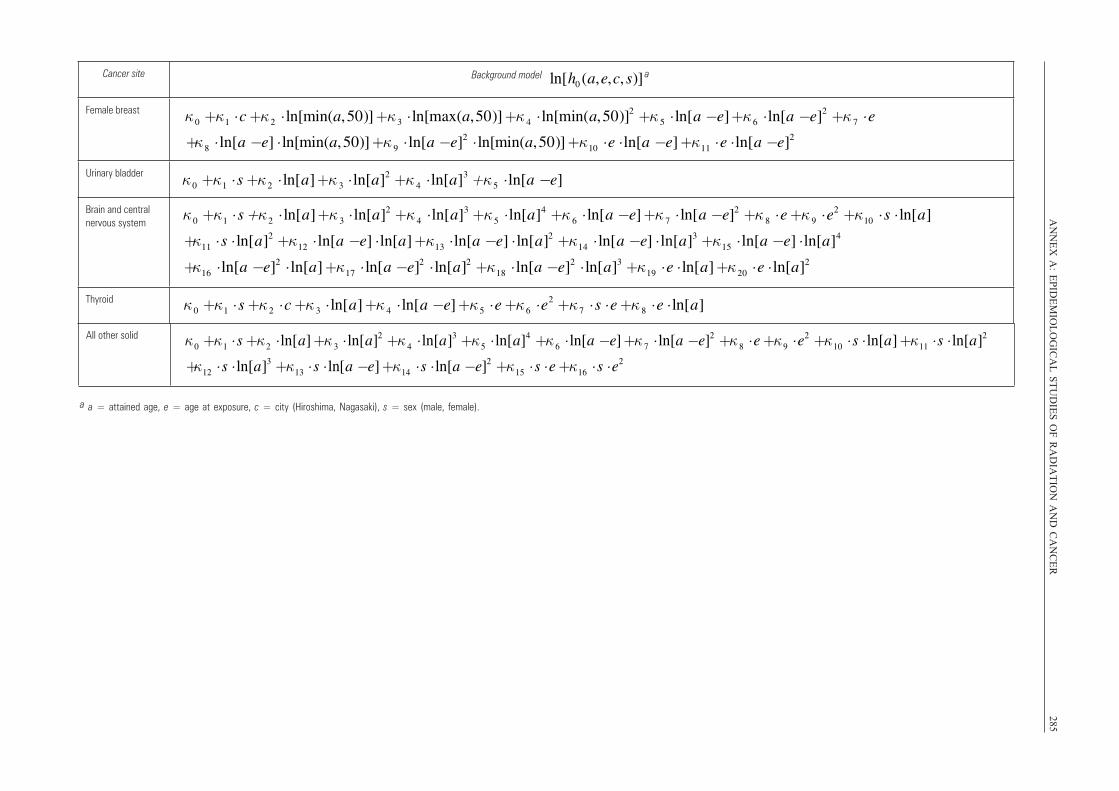
AN
NE
X A
: EP
IDE
MIO
LO
GIC
AL
ST
UD
IES
OF
RA
DIA
TIO
N A
ND
CA
NC
ER
285Cancer site
Female breast
Urinary bladder
Brain and central nervous system
Thyroid
Background model ln[h0 (a,e,c, s)]
κ0 +κ1 ⋅c+κ2 ⋅ ln[min(a,50)]+κ 3 ⋅ ln[max(a,50)]+κ 4 ⋅ ln[min(a,50)]2 +κ 5 ⋅ ln[a −e]+κ6 ⋅ ln[a −e]2 +κ 7 ⋅e
+κ 8 ⋅ ln[a −e] ⋅ ln[min(a,50)]+κ 9 ⋅ ln[a −e]2 ⋅ ln[min(a,50)]+κ10 ⋅e ⋅ ln[a −e]+κ11 ⋅e ⋅ ln[a −e]2
κ0 +κ1 ⋅ s+κ2 ⋅ ln[a]+κ 3 ⋅ ln[a]2 +κ 4 ⋅ ln[a]3 +κ5 ⋅ ln[a −e]
κ0 +κ1 ⋅ s +κ2 ⋅ ln[a]+κ 3 ⋅ ln[a]2 +κ 4 ⋅ ln[a]3 +κ5 ⋅ ln[a]4 +κ 6 ⋅ ln[a −e]+κ 7 ⋅ ln[a −e]2 +κ 8 ⋅e+κ 9 ⋅e2 +κ10 ⋅ s ⋅ ln[a]
+κ11 ⋅ s ⋅ ln[a]2 +κ12 ⋅ ln[a −e] ⋅ ln[a]+κ13 ⋅ ln[a −e] ⋅ ln[a]2 +κ14 ⋅ ln[a −e] ⋅ ln[a]3 +κ15 ⋅ ln[a −e] ⋅ ln[a]4
+κ16 ⋅ ln[a −e]2 ⋅ ln[a]+κ17 ⋅ ln[a −e]2 ⋅ ln[a]2 +κ18 ⋅ ln[a −e]2 ⋅ ln[a]3 +κ19 ⋅e ⋅ ln[a]+κ20 ⋅e ⋅ ln[a]2
κ0 +κ1 ⋅ s+κ2 ⋅c+κ 3 ⋅ ln[a]+κ 4 ⋅ ln[a −e]+κ5 ⋅e+κ6 ⋅e2 +κ7 ⋅ s ⋅e+κ 8 ⋅e ⋅ ln[a]
All other solid
κ0 +κ1 ⋅ s+κ2 ⋅ ln[a]+κ 3 ⋅ ln[a]2 +κ 4 ⋅ ln[a]3 +κ5 ⋅ ln[a]4 +κ 6 ⋅ ln[a −e]+κ 7 ⋅ ln[a −e]2 +κ 8 ⋅e+κ9 ⋅e2 +κ10 ⋅ s ⋅ ln[a]+κ11 ⋅ s ⋅ ln[a]2
+κ12 ⋅ s ⋅ ln[a]3 +κ13 ⋅ s ⋅ ln[a −e]+κ14 ⋅ s ⋅ ln[a −e]2 +κ15 ⋅ s ⋅e+κ16 ⋅ s ⋅e2
a
a a = attained age, e = age at exposure, c = city (Hiroshima, Nagasaki), s = sex (male, female).
UNSCEAR REPORT-PART 5.qxp 10/7/08 3:41 pm Page 285
286 UNSCEAR 2006 REPORT: VOLUME I
Appendix E. Risk models fitted to the atomic bombing survivor data by Bayesian Markov Chain Monte Carlo methods, and their use to obtain uncertainty
bounds on population risk
E1. In this appendix we detail the models used to fit the current LSS cancer mortality [P10] by Bayesian Markov chain
Monte Carlo (MCMC) methods. The models fitted are of the general form described in section IV of the main text, gen-
eralized ERR models. Generalized ERR models were fitted in which the expected cancer mortality rate at age a, for sex
s and city c, following exposure at age e to a dose D of radiation is given by:
(E.1)
E2. In modelling the latest solid cancer mortality data [P10] the following generalized ERR model was used, in which
the cancer mortality rate for age a, age at exposure e, city c, sex s and “true” colon dose D is given by:
(E.2)
This is a generalized ERR model that is linear–quadratic–exponential in dose, and that incorporates adjustment to the ERR
for sex s, attained age a and time since exposure a – e. It is very similar to model (14) described in section IV of the
main text, differing only in the exponential cell sterilization term exp[γ ⋅ D]. In addition, a variant of this model was fitted
in which the cell sterilization term γ was set to 0, i.e. the model is linear–quadratic in dose.
E3. Likewise, for leukaemia mortality the following generalized ERR model was used, in which the leukaemia mortal-
ity rate for age a, age at exposure e, city c, sex s and “true” bone marrow dose D is given by:
(E.3)
This is a generalized ERR model that is linear–quadratic–exponential in dose and that incorporates adjustment to the ERR
for attained age a and age at exposure e. It is very similar to model (17) described in section IV, differing only in the
exponential cell sterilization term, exp[γ ⋅ D], and in the additional adjustment for age at exposure, exp[κ4 ⋅ ln[e]]. In addi-
tion, a variant of this model was fitted in which the cell sterilization term γ was set to 0, i.e. the model is linear–quad-
ratic in dose. The parametric forms of the background models h0(a,e,c,s) used in models (E.2) and (E.3) are as described
in table D17 in appendix D.
E4. The natural modelling of measurement error in Bayesian MCMC methods is at the individual level. The stratifica-
tion creates groups of subjects, and so requires transfer of the modelling of measurement error on the individual dose to
the measurement error on the mean dose over the stratum. At an individual level, the “true” dose distribution in each of
the two cities (Hiroshima, Nagasaki) is modelled by an extended Weibull distribution, as described in appendix C. The
probability density of the distribution of true dose D in each sex (s = male, female) and city (c = Hiroshima, Nagasaki)
is modelled by the superposition of an extended Weibull density function (similar to that used previously by Little [L32,
L49]), with an additional uniform density on the true dose interval [0.0, 0.01] given by:
(E.4)
w sc (D) = ω1sc ⋅ ω 2 sc ⋅ω 3sc ⋅ Dω 3sc −1+ω4 sc⎡⎣ ⎤⎦ ⋅exp −ω 2 sc ⋅ Dω 3sc − ω 4 sc ⋅ D⎡⎣ ⎤⎦+[1−ω 1sc ] ⋅100 ⋅1D < 0.01
h0(a,e,c, s) ⋅ 1+(α ⋅ D+β ⋅ D2 ) ⋅exp[γ ⋅ D] ⋅exp[κ3 ⋅ ln[a]+κ 4 ⋅ ln[e]]⎡⎣ ⎤⎦
h0(a,e,c, s) ⋅1+(α ⋅ D+β ⋅ D2 ) ⋅exp[γ ⋅ D] ⋅exp[κ1 ⋅1s =female +κ2 ⋅ ln[a −e]+κ 3 ⋅ ln[a]]
⎡
⎣⎢
⎤
⎦⎥
h0(a,e,c, s) ⋅[1+F(D) ⋅φ(a,e,c, s)] =h0 (a,e,c, s) ⋅[1+ERR(D,a,e,c, s)]
UNSCEAR REPORT-PART 5.qxp 10/7/08 3:41 pm Page 286
E5. As in appendix C, a “classical” measurement error model is employed, since the main component of the measure-
ment error comes from the declaration by the survivor of their location and orientation with respect to the hypocentre at
the time of explosion [R12, R20]. Therefore the distribution of the “nominal” dose d, given the “true” individual dose D,
is assumed here to be log-normal with median D. As in appendix C, and following the example of Pierce and colleagues
[P2, P11, P16] and Little and colleagues [B18, L17, L29, L32, L33, L34, L35, L37], the “nominal” dose is assumed here
to be log-normally distributed with 35% GSD errors.
E6. A two-stage method is used for modelling the stratum-specific dosimetric uncertainties, very similar to the method
used by Little and colleagues in references [B18, L17] and described in more detail there. In the first stage, for each stra-
tum i (defined by city, sex and age at exposure group) and dose group j, the distribution of the “true” mean dose is
computed by Monte Carlo integration according to an iterative procedure that we now describe.
(a) Individual “nominal” doses are first sampled in the dose interval, using a trapezoidal distribution adapted to the
width of the dose interval and parameterized so that the resulting distribution has the mean value specified on the
data file.
(b) Individual “true” doses are then sampled for each of the nij individuals in the stratum, conditional on the sampled
individual “nominal” doses, the current extended Weibull exposure distribution (E.4) and the (fixed) log-normal
error model.
(c) The extended Weibull distribution parameters (E.4) are resampled.
(d) Steps (a–c) are repeated 5,500 times.
(e) By averaging all the nij individual contributions, the mean “true” organ dose for the stratum, , is thereby sim-
ulated. The 5000 iterations (discarding the initial “burn-in” 500 iterations) of this whole process yield a sample of
the stratum mean “true” organ dose .
(f) 500 replicates of steps (a–e) yield a sample of the stratum mean “true” organ dose , from which are computed
the sample mean, µij, and normalized variance, , of the mean “true” organ
dose in the stratum.
(g) This true stratum mean dose distribution is then approximated by a normal or gamma distribution having mean
µij and variance . For groups of 5 subjects or less, the distribution of is skewed, so that a gamma dis-
tribution is used, whereas for larger groups the normal distribution is a good approximation to the distribution
of .
Steps (a–g) were performed using a FORTRAN program. This procedure was necessitated by the grouped nature of the
data, in particular by the fact that individual “nominal” doses were not available. In the second stage, the derived distri-
bution of all the is then used together with the ERR–EAR disease models (E.2) and (E.3) to derive the posterior
distribution of the parameters of these ERR–EAR models. The Bayesian sampling was performed using WinBUGS [S89].
A total of 50,000 samples were taken for leukaemia and solid cancer, after 50,000 samples were discarded in each case
to allow the Markov chains to reach their stationary equilibrium distributions; convergence of the Markov chains was
assessed using the Gelman–Rubin statistic [G28]. Each set of model parameter values from this 50,000 sample was used
to calculate a measure of population cancer risk for the current Chinese, Japanese, Puerto Rican, United States and United
Kingdom populations, using the four risk measures detailed in appendix B and in section I.G of the main text. These sam-
ples of 50,000 parameter values are therefore associated with a sample of population cancer risks for these current five
populations. Tables E1 and E2 contain the parameter estimates (with 90% Bayesian CI) for the fitted models (linear–
quadratic–exponential and linear–quadratic) for solid cancers and leukaemia.
Dij
Dij
Dijσ ij
2nij−1
σ ij2nij
−1Dij
Dij
Dij
Dij
ANNEX A: EPIDEMIOLOGICAL STUDIES OF RADIATION AND CANCER 287
UNSCEAR REPORT-PART 5.qxp 10/7/08 3:41 pm Page 287
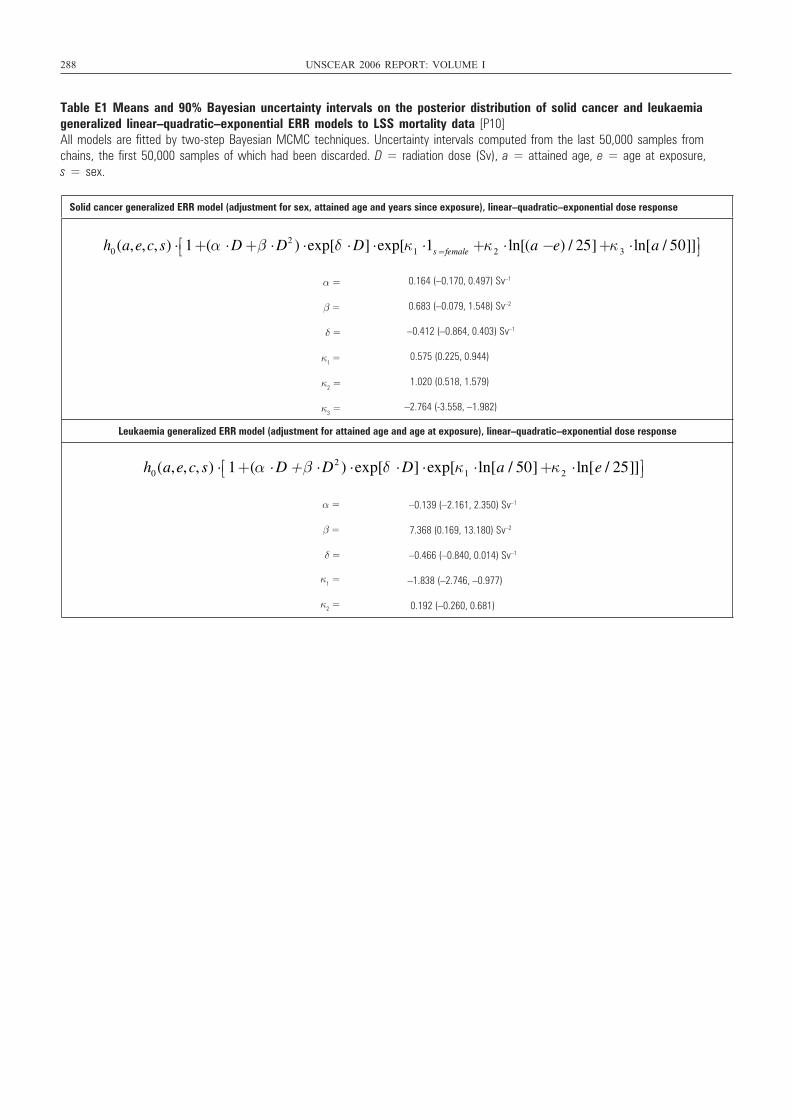
288 UNSCEAR 2006 REPORT: VOLUME I
Table E1 Means and 90% Bayesian uncertainty intervals on the posterior distribution of solid cancer and leukaemia generalized linear–quadratic–exponential ERR models to LSS mortality data [P10]All models are fitted by two-step Bayesian MCMC techniques. Uncertainty intervals computed from the last 50,000 samples fromchains, the first 50,000 samples of which had been discarded. D = radiation dose (Sv), a = attained age, e = age at exposure, s = sex.
Solid cancer generalized ERR model (adjustment for sex, attained age and years since exposure), linear–quadratic–exponential dose response
α = 0.164 (–0.170, 0.497) Sv–1
β = 0.683 (–0.079, 1.548) Sv–2
δ = –0.412 (–0.864, 0.403) Sv–1
κ =10.575 (0.225, 0.944)
κ =21.020 (0.518, 1.579)
κ =3 –2.764 (-3.558, –1.982)
Leukaemia generalized ERR model (adjustment for attained age and age at exposure), linear–quadratic–exponential dose response
–0.139 (–2.161, 2.350) Sv–1
7.368 (0.169, 13.180) Sv–2
–0.466 (–0.840, 0.014) Sv–1
κ =1 –1.838 (–2.746, –0.977)
κ =2 0.192 (–0.260, 0.681)
h0 (a,e,c, s) ⋅ 1+(α ⋅ D+β ⋅ D2 ) ⋅exp[δ ⋅ D] ⋅exp[κ1 ⋅1s= female +κ 2 ⋅ ln[(a −e) / 25]+κ 3 ⋅ ln[a / 50]]⎡⎣ ⎤ ⎦
h0(a,e,c, s) ⋅ 1+(α ⋅ D +β ⋅ D2 ) ⋅exp[δ ⋅ D] ⋅exp[κ1 ⋅ ln[a / 50]+κ2 ⋅ ln[e / 25]]⎡⎣ ⎤⎦
α =
β =
δ =
UNSCEAR REPORT-PART 5.qxp 10/7/08 3:41 pm Page 288
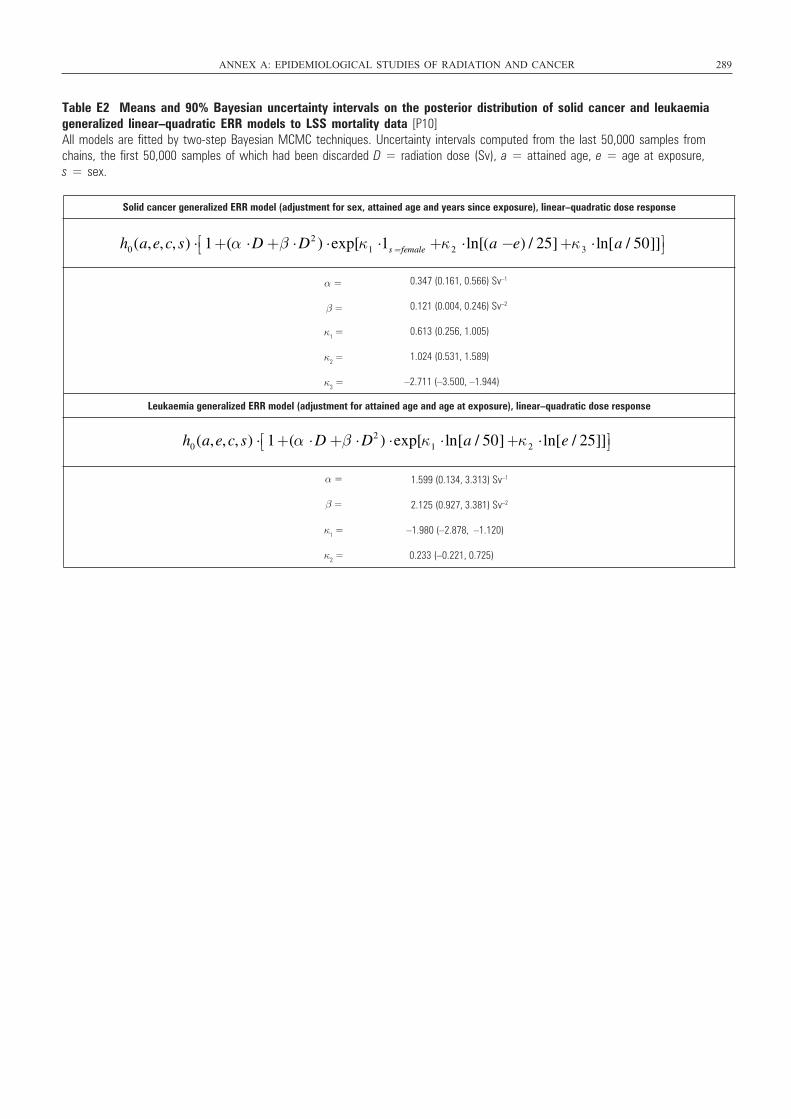
ANNEX A: EPIDEMIOLOGICAL STUDIES OF RADIATION AND CANCER 289
Table E2 Means and 90% Bayesian uncertainty intervals on the posterior distribution of solid cancer and leukaemiageneralized linear–quadratic ERR models to LSS mortality data [P10]All models are fitted by two-step Bayesian MCMC techniques. Uncertainty intervals computed from the last 50,000 samples fromchains, the first 50,000 samples of which had been discarded D = radiation dose (Sv), a = attained age, e = age at exposure, s = sex.
Solid cancer generalized ERR model (adjustment for sex, attained age and years since exposure), linear–quadratic dose response
α = 0.347 (0.161, 0.566) Sv–1
β = 0.121 (0.004, 0.246) Sv–2
κ =10.613 (0.256, 1.005)
κ =2 1.024 (0.531, 1.589)
κ =3–2.711 (–3.500, –1.944)
Leukaemia generalized ERR model (adjustment for attained age and age at exposure), linear–quadratic dose response
α = 1.599 (0.134, 3.313) Sv–1
β = 2.125 (0.927, 3.381) Sv–2
κ =1 –1.980 (–2.878, –1.120)
κ =2 0.233 (–0.221, 0.725)
h0(a,e,c, s) ⋅ 1+(α ⋅ D+β ⋅ D2 ) ⋅exp[κ1 ⋅1s =female +κ2 ⋅ ln[(a −e) / 25]+κ3 ⋅ ln[a / 50]]⎡⎣ ⎤⎦
h0(a,e,c, s) ⋅ 1+(α ⋅ D+β ⋅ D2 ) ⋅exp[κ1 ⋅ ln[a / 50]+κ2 ⋅ ln[e / 25]]⎡⎣ ⎤⎦
UNSCEAR REPORT-PART 5.qxp 10/7/08 3:41 pm Page 289
290 UNSCEAR 2006 REPORT: VOLUME I
A1 Armstrong, B.G. The effects of measurement errorson relative risk regressions. Am. J. Epidemiol. 132(6):1176-1184 (1990).
A2 Akhmedkhanov, A., A. Zeleniuch-Jacquotte and P.Toniolo. Role of exogenous and endogenous hor-mones in endometrial cancer. Review of the evidenceand research perspectives. Ann. N.Y. Acad. Sci. 943:296-315 (2001).
A3 Aoyama, T. Radiation risk of Japanese and Chinese lowdose-repeatedly irradiated population. J. Univ. Occup.Environ. Health Jpn. 11 (Suppl.): 432-442 (1989).
A4 Aoyama, T., Y. Yamamoto, H. Kato et al. Mortalitysurvey of Japanese radiological technologists duringthe period 1969-1993. Radiat. Prot. Dosim. 77(1):123-128 (1998).
A5 Andersson, M., B. Carstensen and H.H. Storm.Mortality and cancer incidence after cerebral arteri-ography with or without Thorotrast. Radiat. Res.142(3): 305-320 (1995).
A6 Andersson, M., G. Engholm, K. Ennow et al. Cancerrisk among staff at two radiotherapy departments inDenmark. Br. J. Radiol. 64(761): 455-460 (1991).
A7 Albert, R.E., R.E. Shore, N. Harley et al. Follow-upstudies of patients treated by x-ray epilation for tineacapitis. p. 1-25 in: Radiation Carcinogenesis and DNAAlterations (F.J. Burns, A.C. Upton and G. Silini,eds.). Plenum Press, New York and London, 1986.
A8 Ashmore, J.P., D. Krewski, J.M. Zielinski et al. Firstanalysis of mortality and occupational radiation expo-sure based on the National Dose Registry of Canada.Am. J. Epidemiol. 148(6): 564-574 (1998).
A9 Alavanja, M.C., J.H. Lubin, J.A. Mahaffey et al.Residential radon exposure and risk of lung cancer inMissouri. Am. J. Public Health 89(7): 1042-1048(1999).
A10 Astakhova, L.N., L.R. Anspaugh, G.W. Beebe et al.Chernobyl-related thyroid cancer in children ofBelarus: a case-control study. Radiat. Res. 150(3):349-356 (1998).
A11 Akiba, S., Q. Sun, Z. Tao et al. Infant leukemia mor-tality among the residents in high-background-radia-tion areas in Guang-dong, China. p. 255-262 in: HighLevels of Natural Radiation 96: Radiation Dose andHealth Effects (L. Wei et al., eds.). Elsevier,Amsterdam, 1997.
A12 Andersson, M., H. Wallin, M. Jönsson et al. Lung car-cinoma and malignant mesothelioma in patientsexposed to Thorotrast: incidence, histology and p53status. Int. J. Cancer 63(3): 330-336 (1995).
A13 Andersson, M. and H.H. Storm. Cancer incidenceamong Danish Thorotrast-exposed patients. J. Natl.Cancer Inst. 84(17): 1318-1325 (1992).
A14 Armstrong, B.K. and A. Kricker. Cutaneousmelanoma. Cancer Surv. 19: 219-240 (1994).
A15 Armstrong, B.K. Stratospheric ozone and health. Int.J. Epidemiol. 23(5): 873-885 (1994).
A16 Armstrong, B.K. and A. Kricker. How muchmelanoma is caused by sun exposure? Melanoma Res.3(6): 395-401 (1994).
A17 Armstrong, B.K. and A. Kricker. The epidemiologyof UV induced skin cancer. J. Photochem. Photobiol.B. 63(1-3): 8-18 (2001).
A18 Armstrong, B.K. and D.R. English. Cutaneous malig-nant melanoma. p. 1282-1312 in: CancerEpidemiology and Prevention, second edition (D.Schottenfeld and J.F. Fraumeni Jr., eds.). OxfordUniversity Press, New York, Oxford, 1996.
A19 Austin, D.F. and P. Reynolds. Investigation of anexcess of melanoma among employees of theLawrence Livermore National Laboratory. Am. J.Epidemiol. 145(6): 524-531 (1997).
A20 Advisory Group on Non-Ionising Radiation. Healtheffects from ultraviolet radiation. Doc. NRPB 13(1):1-282 (2002).
A21 American Cancer Society. Cancer Facts And Figures.American Cancer Society, Atlanta, GA, 1995.
A22 Atkinson, W.D., D.V. Law, K.J. Bromley et al.Mortality of employees of the United KingdomAtomic Energy Authority, 1946-97. Occup. Environ.Med. 61(7): 577-585 (2004).
A23 Abylkassimova, Z., B. Gusev, B. Grosche et al.Nested case-control study of leukemia among a cohortof persons exposed to ionizing radiation from nuclearweapon tests in Kazakhstan (1949-1963). Ann.Epidemiol. 10(7): 479 (2000).
A24 Axelson, O., M. Fredrikson, G. Akerblom et al.Leukemia in childhood and adolescence and exposureto ionizing radiation in homes built from uranium-containing alum shale concrete. Epidemiology 13(2):146-150 (2002).
A25 Auvinen, A., P. Kurttio, J. Pekkanen et al. Uraniumand other natural radionuclides in drinking water andrisk of leukemia: a case-cohort study in Finland.Cancer Causes Control 13(9): 825-829 (2002).
A26 Auvinen, A., I. Makelainen, M. Hakama et al. Indoorradon exposure and risk of lung cancer: a nested case-control study in Finland. J. Natl. Cancer Inst. 88(14):966-972 (1996). Erratum in: J. Natl. Cancer Inst.90(5): 401-402 (1998).
A27 Alavanja, M.C., R.C. Brownson, J.H. Lubin et al.Residential radon exposure and lung cancer amongnonsmoking women. J. Natl. Cancer Inst. 86(24):1829-1837 (1994).
A28 Andersson, M., M. Vyberg, J. Visfeldt et al. Primaryliver tumors among Danish patients exposed toThorotrast. Radiat. Res. 137(2): 262-273 (1994).
A29 Andersson, M. Long-term effects of internallydeposited alpha-particle emitting radionuclides.Epidemiological, pathological and molecular-biologi-cal studies of Danish Thorotrast-administered patientsand their offspring. Dan. Med. Bull. 44(2): 169-190(1997).
References
UNSCEAR REPORT-PART 5.qxp 10/7/08 3:41 pm Page 290
A30 Althuis, M.D., J.M. Dozier, W.F. Anderson et al.Global trends in breast cancer incidence and mortal-ity 1973-1997. Int. J. Epidemiol. 34(2): 405-412(2005).
A31 Aleman, B.M., A.W. van den Belt-Dusebout, W.J.Klokman et al. Long-term cause-specific mortality ofpatients treated for Hodgkin’s disease. J. Clin. Oncol.21(18): 3431-3439 (2003).
A32 Artalejo, F.R., S.C. Lara, B.A. Manzano et al.Occupational exposure to ionising radiation and mor-tality among workers of the former Spanish NuclearEnergy Board. Occup. Environ. Med. 54(3): 202-208(1997).
A33 Anderson, K.E., J.D. Potter and T.M. Mack.Pancreatic cancer. p. 725-771 in: CancerEpidemiology and Prevention, second edition (D.Schottenfeld and J.F. Fraumeni Jr., eds.). OxfordUniversity Press, New York, Oxford, 1996.
A34 Antonelli, A., G. Silvano, C. Gambuzza et al. Is occu-pationally induced exposure to radiation a risk factorof thyroid nodule formation? Arch. Environ. Health51(3): 177-180 (1996).
A35 Averkin, J.I., T. Abelin and J.P. Bleuer. Thyroidcancer in children in Belarus: ascertainment bias?Lancet 346(8984): 1223-1224 (1995).
A36 Auvinen, A., L. Salonen, J. Pekkanen et al. Radon andother natural radionuclides in drinking water and riskof stomach cancer: a case-cohort study in Finland. Int.J. Cancer 114(1): 109-113 (2005).
A37 Allan, J.M. and L.B. Travis. Mechanisms of therapy-related carcinogenesis. Nat. Rev. Cancer 5(12): 943-955 (2005).
B1 Benjamini, Y. and Y. Hochberg. Controlling the falsediscovery rate: a practical and powerful approach tomultiple testing. J.R. Stat. Soc. Ser. B 57(1): 289-300(1995).
B2 Berrington, A., S.C. Darby, H.A. Weiss et al. 100years of observation on British radiologists: mortalityfrom cancer and other causes 1897-1997. Br. J. Radiol.74(882): 507-519 (2001).
B3 Boice, J.D. Jr., D. Preston, F.G. Davis et al. Frequentchest x-ray fluoroscopy and breast cancer incidenceamong tuberculosis patients in Massachusetts. Radiat.Res. 125(2): 214-222 (1991).
B4 Blair, A. Occupational exposures and non-Hodgkinlymphoma: where do we stand? Occup. Environ. Med.63(1): 1-3 (2006).
B5 Boice, J.D. Jr., M. Blettner, R.A. Kleinerman et al.Radiation dose and leukemia risk in patients treatedfor cancer of the cervix. J. Natl. Cancer Inst. 79(6):1295-1311 (1987).
B6 Busby, C. and M. Scott Cato. Increases in leukaemiain infants in Wales and Scotland following Chernobyl:evidence for errors in statutory risk estimates. EnergyEnviron. 11(2): 127-139 (2000).
B7 Boice, J.D. Jr., M. Blettner, R.A. Kleinerman et al.Radiation dose and breast cancer risk in patientstreated for cancer of the cervix. Int. J. Cancer 44(1):7-16 (1989).
B8 Boice, J.D. Jr., G. Engholm, R.A. Kleinerman et al.Radiation dose and second cancer risk in patientstreated for cancer of the cervix. Radiat. Res. 116(1):3-55 (1988).
B9 Blettner, M. and J.D. Boice Jr. Radiation dose andleukaemia risk: general relative risk techniques fordose-response models in a matched case-control study.Stat. Med. 10(10): 1511-1526 (1991).
B10 Boice, J.D., E.B. Harvey, M. Blettner et al. Cancer inthe contralateral breast after radiotherapy for breastcancer. N. Engl. J. Med. 326(12): 781-785 (1992).
B11 Boice, J.D. Jr., N.E. Day, A. Andersen et al. Secondcancers following radiation treatment for cervicalcancer. An international collaboration among cancerregistries. J. Natl. Cancer Inst. 74(5): 955-975 (1985).
B12 Bithell, J.F. and A.M. Stewart. Pre-natal irradiationand childhood malignancy: a review of British datafrom the Oxford Survey. Br. J. Cancer 31(3): 271-287(1975).
B13 Brada, M., D. Ford, S. Ashley et al. Risk of secondbrain tumour after conservative surgery and radio-therapy for pituitary adenoma. Br. Med. J. 304(6838):1343-1346 (1992).
B14 Beral, V., P. Fraser, L. Carpenter et al. Mortality ofemployees of the Atomic Weapons Establishment,1951-82. Br. Med. J. 297(6651): 757-770 (1988).
B15 Binks, K., D.I. Thomas and D. McElvenny. Mortalityof workers at the Chapelcross plant of British NuclearFuels. p. 49-52 in: Radiation Protection Theory andPractice (E.P. Goldfinch, ed.). Institute of Physics,Bristol, 1989.
B16 Bhatia, S., L.L. Robison, O. Oberlin et al. Breastcancer and other second neoplasms after childhoodHodgkin’s disease. N. Engl. J. Med. 334(12): 745-751(1996).
B17 Boice, J.D. Jr., M.M. Morin, A.G. Glass et al.Diagnostic x-ray procedures and risk of leukemia,lymphoma and multiple myeloma. J. Am. Med. Assoc.265(10): 1290-1294 (1991).
B18 Bennett, J., M.P. Little and S. Richardson. Flexibledose-response models for Japanese atomic bomb sur-vivor data: Bayesian estimation and prediction ofcancer risk. Radiat. Environ. Biophys. 43(4): 233-245(2004).
B19 Bigbee, W.L., R.H. Jensen, T. Veidebaum et al.Biodosimetry of Chernobyl cleanup workers fromEstonia and Latvia using the glycophorin A in vivosomatic cell mutation assay. Radiat. Res. 147(2): 215-224 (1997).
B20 Bradford-Hill, A. The environment and disease: asso-ciation or causation? Proc. R. Soc. Med. 58: 295-300(1965).
B21 Baker, G.S. and D.G. Hoel. Corrections in the atomicbomb data to examine low dose risk. Health Phys.85(6): 709-720 (2003).
B22 Bagshaw, M., D. Irvine and D.M. Davies. Exposureto cosmic radiation of British Airways flying crew onultralonghaul routes. Occup. Environ. Med. 53(7):495-498 (1996).
ANNEX A: EPIDEMIOLOGICAL STUDIES OF RADIATION AND CANCER 291
UNSCEAR REPORT-PART 5.qxp 10/7/08 3:41 pm Page 291
292 UNSCEAR 2006 REPORT: VOLUME I
B23 Blettner, M., H. Zeeb, A. Auvinen et al. Mortalityfrom cancer and other causes among male airlinecockpit crew. Int. J. Cancer 106(6): 946-952 (2003).
B24 Buell, P. Changing incidence of breast cancer inJapanese-American women. J. Natl. Cancer Inst.51(5): 1479-1483 (1973).
B25 Brenner, D.J., J.B. Little and R.K. Sachs. Thebystander effect in radiation oncogenesis: II. A quan-titative model. Radiat. Res. 155(3): 402-408 (2001).
B26 Brenner, D.J., R. Doll, D.T. Goodhead et al. Cancerrisks attributable to low doses of ionizing radiation:assessing what we really know. Proc. Natl. Acad. Sci.U.S.A. 100(24): 13761-13766 (2003).
B27 Blot, W.J., J.K. McLaughlin, S.S. Devesa et al.Cancers of the oral cavity and pharynx. p. 666-680 in:Cancer Epidemiology and Prevention, second edition(D. Schottenfeld and J.F. Fraumeni Jr., eds.). OxfordUniversity Press, New York, Oxford, 1996.
B28 Bray, I., P. Brennan and P. Boffetta. Recent trendsand future projections of lymphoid neoplasms — aBayesian age-period-cohort analysis. Cancer CausesControl 12(9): 813-820 (2001).
B29 Boice, J.D. Jr., W.L. Bigbee, M.T. Mumma et al.Cancer incidence in municipalities near two formernuclear materials processing facilities in Pennsylvania.Health Phys. 85(6): 678-690 (2003).
B30 Boice, J.D. Jr., W.L. Bigbee, M.T. Mumma et al.Cancer mortality in counties near two former nuclearmaterials processing facilities in Pennsylvania, 1950-1995. Health Phys. 85(6): 691-700 (2003).
B31 Boice, J.D. Jr., M. Mumma, S. Schweitzer et al.Cancer mortality in a Texas county with prior uraniummining and milling activities, 1950-2001. J. Radiol.Prot. 23(3): 247-262 (2003).
B32 Band, P.R., N.D. Le, R. Fang et al. Cohort study of AirCanada pilots: mortality, cancer incidence, and leukemiarisk. Am. J. Epidemiol. 143(2): 137-143 (1996).
B33 Bennett, J.M., D. Catovsky, M.T. Daniel et al.Proposals for the classification of the myelodysplasticsyndromes. Br. J. Haematol. 51(2): 189-199 (1982).
B34 Blot, W.J. and J.F. Fraumeni Jr. Cancers of the lungand pleura. p. 637-665 in: Cancer Epidemiology andPrevention, second edition (D. Schottenfeld and J.F.Fraumeni Jr., eds.). Oxford University Press, NewYork, Oxford, 1996.
B35 Brown, S.C., M.F. Schonbeck, D. McClure et al. Lungcancer and internal lung doses among plutoniumworkers at the Rocky Flats Plant: A case-controlstudy. Am. J. Epidemiol. 160(2): 163-172 (2004).
B36 Brenner, D.J. and R.K. Sachs. Do low dose-ratebystander effects influence domestic radon risks? Int.J. Radiat. Biol. 78(7): 593-604 (2002).
B37 Blot, W.J., Z.Y. Xu, J.D. Boice Jr. et al. Indoor radonand lung cancer in China. J. Natl. Cancer Inst. 82(12):1025-1030 (1990).
B38 Bochicchio, F., F. Forastiere, S. Farchi et al.Residential radon exposure, diet and lung cancer: acase-control study in a Mediterranean region. Int. J.Cancer 114(6): 983-991 (2005).
B39 Barros-Dios, J.M., M.A. Barreiro, A. Ruano-Ravina etal. Exposure to residential radon and lung cancer inSpain: a population-based case-control study. Am. J.Epidemiol. 156(6): 548-555 (2002).
B40 Brenner, D.J. and R.K. Sachs. Domestic radon risksmay be dominated by bystander effects — but therisks are unlikely to be greater than we thought. HealthPhys. 85(1): 103-108 (2003).
B41 Baysson, H., M. Tirmarche, G. Tymen et al. Case-control study on lung cancer and indoor radon inFrance. Epidemiology 15: 709-716 (2004).
B42 Boice, J.D. Jr. and R.W. Miller. Childhood and adultcancer after intrauterine exposure to ionizing radia-tion. Teratology 59(4): 227-233 (1999).
B43 Bhatia, S., H.N. Sather, O.B. Pabustan et al. Low inci-dence of second neoplasms among children diagnosedwith acute lymphoblastic leukemia after 1983. Blood99(12): 4257-4264 (2002).
B44 Boice, J.D. Jr. Risk estimates for radiation exposures.p. 237-268 in: Health Effects of Exposure to Low-Level Ionizing Radiation (W.R. Hendee and F.M.Edwards, eds.). Institute of Physics Publishing,Philadelphia, 1996.
B45 Brenner, A.V., M.S. Linet, H.A. Fine et al. History ofallergies and autoimmune diseases and risk of braintumors in adults. Int. J. Cancer 99(2): 252-259 (2002).
B46 Bhatia, S., Y. Yasui, L.L. Robison et al. High risk ofsubsequent neoplasms continues with extendedfollow-up of childhood Hodgkin’s disease: reportfrom the Late Effects Study Group. J. Clin. Oncol.21(23): 4386-4394 (2003).
B47 Baade, P.D., M.D. Coory and J.F. Aitken.International trends in prostate-cancer mortality: thedecrease is continuing and spreading. Cancer CausesControl 15(3): 237-241 (2004).
B48 Beal, K.P., B. Singh, D. Kraus et al. Radiation-induced salivary gland tumors: a report of 18 casesand a review of the literature. Cancer J. 9(6): 467-471(2003).
B49 Brinkley, D. and J.L. Haybittle. The late effects ofartificial menopause by x-radiation. Br. J. Radiol.42(499): 519-521 (1969).
B50 Brenner, D.J., R.E. Curtis, E.J. Hall et al. Secondmalignancies in prostate carcinoma patients afterradiotherapy compared with surgery. Cancer 88(2):398-406 (2000).
B51 Baxter, N.N., J.E. Tepper, S.B. Durham et al.Increased risk of rectal cancer after prostate radiation:a population-based study. Gastro-enterology 128(4):819-824 (2005).
B52 Brenner, D.J. Communication to the UNSCEARSecretariat (2005).
B53 Becker, D.V. and J.R. Hurley. Radioiodine treatmentof hyperthyroidism. p. 943-958 in: Diagnostic NuclearMedicine (A. Gottschalk, P.B. Hoffer and E.J.Potchen, eds.). Williams & Wilkins, Baltimore, 1996.
B54 Baverstock, K.F., D. Papworth and J. Vennart. Risksof radiation at low dose rates. Lancet 1(8217): 430-433 (1981).
UNSCEAR REPORT-PART 5.qxp 10/7/08 3:41 pm Page 292
B55 Baverstock, K.F. and D.G. Papworth. The UK radiumluminiser survey. p. 72-76 in: Risks from Radium andThorotrast (D.M. Taylor et al., eds.). BIR Report 21(1989).
B56 Bailar, J.C. III. The practice of meta-analysis. J. Clin.Epidemiol. 48(1): 149-157 (1995).
B57 Bailar, J.C. III. The promise and problems of meta-analysis. N. Engl. J. Med. 337(8): 559-561 (1997).
B58 Bauer, S., B.I. Gusev, L.M. Pivina et al. Radiationexposure due to local fallout from Soviet atmosphericnuclear weapons testing in Kazakhstan: solid cancermortality in the Semipalatinsk historical cohort, 1960-1999. Radiat. Res. 164(1): 409-419 (2005). Erratumin: Radiat. Res. 165(3): 372 (2006).
B59 Beral, V., H. Inskip, P. Fraser et al. Mortality ofemployees of the United Kingdom Atomic EnergyAuthority, 1946-1979. Br. Med. J. 291(6493): 440-447(1985).
B60 Brugmans, M.J., S.M. Rispens, H. Bijwaard et al.Radon-induced lung cancer in French and Czechminer cohorts described with a two-mutation cancermodel. Radiat. Environ. Biophys. 43(3): 153-163(2004).
B61 Boice, J.D. Jr., M.T. Mumma and W.J. Blot. Cancermortality among populations residing in counties nearthe Hanford site, 1950-2000. Health Phys. 90(5): 431-445 (2006).
B62 Burkart, W., A.M. Kellerer, S. Bauer et al. Healtheffects. p. 179-228 in: Nuclear Test Explosion:Environmental and Human Impacts (F. Warner andR.J.C. Kirchmann, eds.). John Wiley & Sons Ltd,2000.
B63 Black, P., A. Straaten and P. Gutjahr. Secondary thy-roid carcinoma after treatment for childhood cancer.Med. Pediatr. Oncol. 31(2): 91-95 (1998).
B64 Boice, J.D. Jr., J.S. Mandel, M.M. Doody et al. Ahealth survey of radiologic technologists. Cancer69(2): 586-598 (1992).
B65 Buglova, E.E., J.E. Kenigsberg and N.V. Sergeeva.Cancer risk estimation in Belarussian children due tothyroid irradiation as a consequence of the Chernobylnuclear accident. Health Phys. 71(1): 45-49 (1996).
B66 Balonov, M., R. Alexakhin, A. Bouville et al. Reportfrom the Techa River dosimetry review workshop heldon 8-10 December 2003 at the State Research CentreInstitute of Biophysics, Moscow, Russia. Health Phys.90(2): 97-113 (2006).
B67 Boice, J.D. Jr. Ionizing radiation. p. 259-293 in:Cancer Epidemiology and Prevention, third edition (D.Schottenfeld and J.F. Fraumeni Jr., eds.). OxfordUniversity Press, New York, 2006.
B68 Boice, J.D., S.S. Cohen, M.T. Mumma et al. Mortalityamong radiation workers at Rocketdyne (AtomicsInternational), 1948-1999. Radiat. Res. 166(1): 98-115(2006).
B69 Boice, J.D. Jr., R.W. Leggett, E.D. Ellis et al. A com-prehensive dose reconstruction methodology forformer Rocketdyne/Atomics International radiationworkers. Health Phys. 90(5): 409-430 (2006).
C1 Chiu, B.C. and D.D. Weisenburger. An update of theepidemiology of non-Hodgkin’s lymphoma. Clin.Lymphoma 4(3): 161-168 (2003).
C2 Cardis, E., A. Kesminiene, V. Ivanov et al. Risk ofthyroid cancer after exposure to 131I in childhood. J.Natl. Cancer Inst. 97(10): 724-732 (2005).
C3 Cardis, E., E.S. Gilbert, L. Carpenter et al. Effects oflow doses and low dose rates of external ionizing radi-ation: cancer mortality among nuclear industry workersin three countries. Radiat. Res. 142(2): 117-132 (1995).
C4 Carr, Z.A., R.A. Kleinerman, M. Stovall et al.Malignant neoplasms after radiation therapy for pepticulcer. Radiat. Res. 157(6): 668-677 (2002).
C5 Challeton-de Vathaire, C., F. de Vathaire, B.L. Vu etal. Childhood malignancies in French Polynesiaduring the 1985-1995 period. Trop. Med. Int. Health9(9): 1005-1011 (2004).
C6 Checkoway, H., N. Pearce, D.J. Crawford-Brown etal. Radiation doses and cause-specific mortalityamong workers at a nuclear materials fabricationplant. Am. J. Epidemiol. 127(2): 255-266 (1988).
C7 Committee on Medical Aspects of Radiation in theEnvironment (COMARE). Tenth Report. The inci-dence of childhood cancer around nuclear installationsin Great Britain. Health Protection Agency,http://www.comare.org.uk/documents/COMARE10thReport.pdf (2005).
C8 Curtis, R.E., J.D. Boice Jr., M. Stovall et al.Relationship of leukemia risk to radiation dose fol-lowing cancer of the uterine corpus. J. Natl. CancerInst. 86(17): 1315-1324 (1994).
C9 Curtis, R.E., J.D. Boice, M. Stovall et al. Risk ofleukemia after chemotherapy and radiation treatmentfor breast cancer. N. Engl. J. Med. 326(26): 1745-1751(1992).
C10 Carpenter, L., C. Higgins, A. Douglas et al. Combinedanalysis of mortality in three United Kingdom nuclearindustry workforces, 1946-1988. Radiat. Res. 138(2):224-238 (1994).
C11 Carnes, B.A., P.G. Groer and T.J. Kotek. Radium dialworkers: issues concerning dose response and model-ing. Radiat. Res. 147(6): 707-714 (1997).
C12 Carroll, R.J., D. Ruppert, L.A. Stefanski et al.Measurement Error in Nonlinear Models: A ModernPerspective, Second Edition. Chapman and Hall/CRC,Boca Raton, 2006.
C13 Cullings, H.M. and S. Fujita. The way to DS02:resolving the neutron discrepancy. RERF Update14(Pt 1): 17-23 (2003).
C14 Cohen, B.L. Test of the linear-no threshold theory ofradiation carcinogenesis for inhaled radon decay prod-ucts. Health Phys. 68(2): 157-174 (1995).
C15 Clayton, D. The analysis of event history data: areview of progress and outstanding problems. Stat.Med. 7(8): 819-841 (1988).
C16 Chrouser, K., B. Leibovich, E. Bergstralh et al.Bladder cancer risk following primary and adjuvantexternal beam radiation for prostate cancer. J. Urol.174(1): 107-111 (2005).
ANNEX A: EPIDEMIOLOGICAL STUDIES OF RADIATION AND CANCER 293
UNSCEAR REPORT-PART 5.qxp 10/7/08 3:41 pm Page 293
294 UNSCEAR 2006 REPORT: VOLUME I
C17 Cantor, K.P., A. Blair, G. Everett et al. Pesticides andother agricultural risk factors for non-Hodgkin’s lym-phoma among men in Iowa and Minnesota. CancerRes. 52(9): 2447-2455 (1992).
C18 Correa, P. and V.W. Chen. Gastric cancer. p. 55-76in: Cancer Surveys. Trends in Cancer Incidence andMortality, Volumes 19/20 (R. Doll et al., eds.). ColdSpring Harbor Laboratory Press, Imperial CancerResearch Fund, 1994.
C19 Chameaud, J., R. Masse and J. Lafuma. Influence ofradon daughter exposure at low doses on occurrenceof lung cancer in rats. Radiat. Prot. Dosim. 7(1): 385-388 (1984).
C20 Cross, F.T. A review of experimental animal radonhealth effects data. p. 476-481 in: Radiation Research:A Twentieth-Century Perspective, Vol. II (J.D.Chapman et al., eds.). Academic Press, San Diego,1992.
C21 Cohen, B.L. and G.A. Colditz. Tests of the linear-nothreshold theory for lung cancer induced by exposureto radon. Environ. Res. 64(1): 65-89 (1994).
C22 Cohen, B.L. Testing a BEIR-VI suggestion forexplaining the lung cancer vs. radon relationship forU.S. counties. Health Phys. 78(5): 522-527 (2000).
C23 Cohen, B.L. Review: Cancer risk from low-level radi-ation. Am. J. Roentgenol. 179(5): 1137-1143 (2002).
C24 Cohen, B.L. Response to criticisms of Smith et al.Health Phys. 75(1): 23-28 (1998).
C25 Cologne, J.B., S. Tokuoka, G.W. Beebe et al. Effectsof radiation on incidence of primary liver canceramong atomic bomb survivors. Radiat. Res. 152(4):364-373 (1999).
C26 Curtis, R.E., P.A. Rowlings, H.J. Deeg et al. Solidcancers after bone marrow transplantation. N. Engl. J.Med. 336(13): 897-904 (1997).
C27 Cartwright, R.A. and G. Watkins. Epidemiology ofHodgkin’s disease: a review. Hematol. Oncol. 22(1):11-26 (2004).
C28 CERRIE. Report of the Committee ExaminingRadiation Risks of Internal Emitters (CERRIE).http://www.cerrie.org (2004).
C29 Collaborative Group on Hormonal Factors in BreastCancer. Breast cancer and hormonal contraceptives:collaborative reanalysis of individual data on 53 297women with breast cancer and 100 239 women with-out breast cancer from 54 epidemiological studies.Collaborative Group on Hormonal Factors in BreastCancer. Lancet 347(9017): 1713-1727 (1996).
C30 Collaborative Group on Hormonal Factors in BreastCancer. Familial breast cancer: collaborative reanaly-sis of individual data from 52 epidemiological studiesincluding 58,209 women with breast cancer and101,986 women without the disease. Lancet358(9291): 1389-1399 (2001).
C31 Cairns, J. Somatic stem cells and the kinetics of muta-genesis and carcinogenesis. Proc. Natl. Acad. Sci.U.S.A. 99(16): 10567-10570 (2002).
C32 Court Brown, W.M. and R. Doll. Mortality fromcancer and other causes after radiotherapy for anky-
losing spondylitis. Br. Med. J. 2(5474): 1327-1332(1965).
C33 Committee on the Biological Effects of IonizingRadiations (BEIR III). The Effects on Populations ofExposure to Low Levels of Ionizing Radiation: 1980.National Academy of Sciences, National ResearchCouncil. National Academy Press, Washington, 1980.
C34 Committee on the Biological Effects of IonizingRadiations (BEIR IV). Health Risks of Radon andOther Internally Deposited Alpha-Emitters. NationalAcademy of Sciences, National Research Council.National Academy Press, Washington, 1988.
C35 Committee on the Biological Effects of IonizingRadiations (BEIR V). Health Effects of Exposure toLow Levels of Ionizing Radiation. National Academyof Sciences, National Research Council. NationalAcademy Press, Washington, 1990.
C36 Committee on the Biological Effects of IonizingRadiations (BEIR VI). The Health Effects of Exposureto Indoor Radon. National Academy of Sciences,National Research Council. National Academy Press,Washington, 1999.
C37 Committee to Assess Health Risks from Exposure toLow Levels of Ionizing Radiation. Health Risks fromExposure to Low Levels of Ionizing Radiation: BEIR VII – Phase 2. National Academy of Sciences,National Research Council. National Academy Press,Washington, 2006.
C38 Cuzick, J. Multiple myeloma. p. 455-474 in: CancerSurveys. Trends in Cancer Incidence and Mortality,Volumes 19/20 (R. Doll et al., eds.). Cold SpringHarbor Laboratory Press, Imperial Cancer ResearchFund, 1994.
C39 Checkoway, H., N.J. Heyer and P.A. Demers. Anupdated mortality follow-up study of Florida phos-phate industry workers. Am. J. Ind. Med. 30(4): 452-460 (1996).
C40 Carpenter, L.M., C.D. Higgins, A.J. Douglas et al.Cancer mortality in relation to monitoring for radionu-clide exposure in three UK nuclear industry work-forces. Br. J. Cancer 78(9): 1224-1232 (1998).
C41 Cardis, E., M. Vrijheid, M. Blettner et al. Risk ofcancer after low doses of ionising radiation: retro-spective cohort study in 15 countries. Br. Med. J.331(7508): 77-80 (2005).
C42 Court Brown, W.M., R. Doll and R.B. Hill. Incidenceof leukaemia after exposure to diagnostic radiation inutero. Br. Med. J. 2(5212): 1539-1545 (1960).
C43 Cox, D.R. and D.V. Hinkley. Theoretical Statistics.Chapman and Hall, London, 1974.
C44 Cohen, A., A. Rovelli, M.T. van Lint et al. Secondarythyroid carcinoma after allogeneic bone marrow trans-plantation during childhood. Bone Marrow Transplant.28(12): 1125-1128 (2001).
C45 Conard, R.A. Late radiation effects in MarshallIslanders exposed to fallout 28 years ago. p. 57-71 in:Radiation Carcinogenesis: Epidemiology andBiological Significance (J.D. Boice Jr., J.F. FraumeniJr., eds.). Raven Press, New York, 1984.
UNSCEAR REPORT-PART 5.qxp 10/7/08 3:41 pm Page 294
C46 Carstensen, J.M., G. Wingren, T. Hatschek et al.Occupational risks of thyroid cancer: data from theSwedish Cancer-Environment Register, 1961-1979.Am. J. Ind. Med. 18(5): 535-540 (1990).
C47 Cohen, B.L. The Puskin observation on smoking as aconfounder in ecologic correlations of cancer mortal-ity rates with average county radon levels. HealthPhys. 86(2): 203-204 (2004).
C48 Cohen, B.L. Response to “Residential radon exposureand lung cancer risk: commentary on Cohen’s county-based study”. Health Phys. 87(6): 656-658 (2004).
C49 Cohen, B.L. Response to Lubin’s proposed explana-tions of our discrepancy. Health Phys. 75(1): 18-22(1998).
C50 Cardis, E., G. Howe, E. Ron et al. Cancer conse-quences of the Chernobyl accident: 20 years on. J.Radiol. Prot. 26(2): 127-140 (2006).
C51 Curtis, R.E., D.M. Freedman, E. Ron et al. (eds.). Newmalignancies among cancer survivors: SEER cancerregistries, 1973-2000. NIH Publication No. 05-5302(2006).
D1 Damber, L., L. Johansson, R. Johansson et al. Thyroidcancer after x-ray treatment of benign disorders of thecervical spine in adults. Acta Oncol. 41(1): 25-28(2002).
D2 Damber, L., L.G. Larsson, L. Johansson et al. A cohortstudy with regard to the risk of haematological malig-nancies in patients treated with x-rays for benignlesions in the locomotor system. I. Epidemiologicalanalyses. Acta Oncol. 34(6): 713-719 (1995).
D3 Doody, M.M., J.S. Mandel, J.H. Lubin et al. Mortalityamong United States radiologic technologists, 1926-90. Cancer Causes Control 9(1): 67-75 (1998).
D4 Davis, F.G., J.D. Boice Jr., Z. Hrubec et al. Cancermortality in a radiation-exposed cohort ofMassachusetts tuberculosis patients. Cancer Res.49(21): 6130-6136 (1989).
D5 Deacon, J.M., C.D. Evans, R. Yule et al. Sexualbehaviour and smoking as determinants of cervicalHPV infection and of CIN3 among those infected: acase-control study nested within the Manchestercohort. Br. J. Cancer 83(11): 1565-1572 (2000).
D6 Davis, F.G., J.D. Boice Jr., J.L. Kelsey et al. Cancermortality after multiple fluoroscopic examinations ofthe chest. J. Natl. Cancer Inst. 78(4): 645-652 (1987).
D7 Darby, S.C., G. Reeves, T. Key et al. Mortality in acohort of women given x-ray therapy for metropathiahaemorrhagica. Int. J. Cancer 56(6): 793-801 (1994).
D8 Degteva, M.O., N.B. Shagina, E.I. Tolstykh et al.Studies on the Techa river populations: dosimetry.Radiat. Environ. Biophys. 41(1): 41-44 (2002).
D9 DeGroot, L.J., M. Reilly, K. Pinnameneni et al.Retrospective and prospective study of radiation-induced thyroid disease. Am. J. Med. 74(5): 852-862(1983).
D10 Darby, S.C., E. Whitley, G.R. Howe et al. Radon andcancers other than lung cancer in underground miners:a collaborative analysis of 11 studies. J. Natl. CancerInst. 87(5): 378-384 (1995).
D11 Douglas, A.J., R.Z. Omar and P.G. Smith. Cancermortality and morbidity among workers at theSellafield plant of British Nuclear Fuels. Br. J. Cancer70(6): 1232-1243 (1994).
D12 Dobyns, B.M., G.E. Sheline, J.B. Workman et al.Malignant and benign neoplasms of the thyroid inpatients treated for hyperthyroidism: a report of theCooperative Thyrotoxicosis Therapy Follow-up Study.J. Clin. Endocrinol. Metab. 38(6): 976-998 (1974).
D13 Darby, S., E. Whitley, P. Silcocks et al. Risk of lungcancer associated with residential radon exposure insouth-west England: a case-control study. Br. J.Cancer 78(3): 394-408 (1998).
D14 Delongchamp, R.R., K. Mabuchi, Y. Yoshimoto et al.Cancer mortality among atomic bomb survivorsexposed in utero or as young children, October 1950-May 1992. Radiat. Res. 147(3): 385-395 (1997).
D15 dos Santos Silva, I., M. Jones, F. Malveiro et al.Mortality in the Portuguese Thorotrast study. Radiat.Res. 152 (6 Suppl.): S88-S92 (1999).
D16 de Vathaire, F., M. Hawkins, S. Campbell et al.Second malignant neoplasms after a first cancer inchildhood: temporal pattern of risk according to typeof treatment. Br. J. Cancer 79(11-12): 1884-1893(1999).
D17 Doody, M.M., J.E. Lonstein, M. Stovall et al. Breastcancer mortality after diagnostic radiography: findingsfrom the U.S. Scoliosis Cohort Study. Spine 25(16):2052-2063 (2000).
D18 de Vathaire, F., M. Schlumberger, M.J. Delisle et al.Leukaemias and cancers following iodine-131 admin-istration for thyroid cancer. Br. J. Cancer 75(5): 734-739 (1997).
D19 de Vathaire, F., A. Shamsaldin, E. Grimaud et al.Solid malignant neoplasms after childhood irradiation:decrease of the relative risk with time after irradia-tion. C.R. Acad. Sci. III. 318(4): 483-490 (1995).
D20 de Vathaire, F., E. Grimaud, I. Diallo et al. Thyroidtumours following fractionated irradiation in child-hood. p. 121-124 in: Low Doses of Ionizing Radiation:Biological Effects and Regulatory Control. IAEA-TECDOC-976. IAEA, Vienna (1997).
D21 dos Santos Silva, I., F. Malveiro, R. Portugal et al.Mortality from primary liver cancers in the PortugueseThorotrast cohort study. p. 229-233 in: Health Effectsof Internally Deposited Radionuclides: Emphasis onRadiation and Thorium (G. van Kaick et al., eds.).World Scientific, Singapore, 1995.
D22 Degteva, M.O., M.I. Vorobiova, V.P. Kozheurov et al.Dose reconstruction system for the exposed popula-tion living along the Techa River. Health Phys. 78(5):542-554 (2000).
D23 Delpla, M. and C. Chevalier. Negative leukaemiaexcess risk. p. 57-62 in: Health Effects of Low DoseIonising Radiation — Recent Advances and TheirImplications. British Nuclear Energy Society, London,1987.
D24 Darby, S., D. Hill, A. Auvinen et al. Radon in homesand risk of lung cancer: collaborative analysis of
ANNEX A: EPIDEMIOLOGICAL STUDIES OF RADIATION AND CANCER 295
UNSCEAR REPORT-PART 5.qxp 10/7/08 3:41 pm Page 295
296 UNSCEAR 2006 REPORT: VOLUME I
individual data from 13 European case-control studies. Br. Med. J. 330(7485): 223-226 (2005).
D25 Devesa, S.S., D.T. Silverman, J.L. Young Jr. et al.Cancer incidence and mortality trends among whitesin the United States, 1947-84. J. Natl. Cancer Inst.79(4): 701-770 (1987).
D26 da Cruz, A.D., J. Curry, M.P. Curado et al. Monitoringhprt mutant frequency over time in T-lymphocytes ofpeople accidentally exposed to high doses of ionizingradiation. Environ. Mol. Mutagen. 27(3): 165-175(1996).
D27 dos Santos Silva, I., F. Malveiro, M.E. Jones et al.Mortality after radiological investigation with radioac-tive Thorotrast: a follow-up study of up to fifty yearsin Portugal. Radiat. Res. 159(4): 521-534 (2003).
D28 Draper, G.J., M.E. Kroll and C.A. Stiller. Childhoodcancer. p. 493-517 in: Cancer Surveys. Trends inCancer Incidence and Mortality, Volumes 19/20 (R.Doll et al., eds.). Cold Spring Harbor LaboratoryPress, Imperial Cancer Research Fund, 1994.
D29 Duport, P. Is the radon risk overestimated? Neglecteddoses in the estimation of the risk of lung cancer inuranium underground miners. Radiat. Prot. Dosim.98(3): 329-338 (2002).
D30 Darby, S., D. Hill, H. Deo et al. Residential radon andlung cancer — detailed results of a collaborativeanalysis of individual data on 7148 persons with lungcancer and 14 208 persons without lung cancer from13 epidemiologic studies in Europe. Scand. J. WorkEnviron. Health 32 (Supp. 1): 1-84 (2006).
D31 Department of Energy/Commission of the EuropeanCommunities. Workshop on Residential RadonEpidemiology. CONF-8907178 (1989).
D32 Department of Energy/Commission of the EuropeanCommunities. Report of the International Workshopon Residential Radon. CONF-9107220 (1991).
D33 Department of Energy/Commission of the EuropeanCommunities. Third International DOE/CECResidential Radon Workshop, February 1995 (Part I).DOE/ER-0668 (1995).
D34 Department of Energy/Commission of the EuropeanCommunities. Planning Meeting of CombinedAnalysis of North American Residential RadonStudies, October 1995 (Part II). DOE/ER-0668 (1995).
D35 Dagle, G.E., E.P. Moen, R.R. Adee et al.Microdistribution and microdosimetry of thoriumdeposited in the liver. Health Phys. 63(1): 41-45(1992).
D36 da Motta, L.C., J. da Silva Horta and M.H. Tavares.Prospective epidemiological study of Thorotrast-exposed patients in Portugal. Environ. Res. 18(1): 152-172 (1979).
D37 Doll, R. and R. Wakeford. Risk of childhood cancerfrom fetal irradiation. Br. J. Radiol. 70(830): 130-139(1997).
D38 Dottorini, M.E., G. Lomuscio, L. Mazzucchelli et al.Assessment of female fertility and carcinogenesis afteriodine-131 therapy for differentiated thyroid carci-noma. J. Nucl. Med. 36(1): 21-27 (1995).
D39 De Stavola, B.L., I. dos Santos Silva, V. McCormacket al. Childhood growth and breast cancer. Am. J.Epidemiol. 159(7): 671-682 (2004).
D40 Degteva, M., V. Kozheurov, M. Vorobiova et al.Radiation exposure doses for residents of the Techariverside villages. In: Medical-Biological andEcological Impacts of Radioactive Contamination ofthe Techa River (A. Akleyev and M. Kisselyov, eds.).FREGAT, Chelyabinsk, 2002.
D41 Dickson, R.J. The late results of radium treatment forbenign uterine haemorrhage. Br. J. Radiol. 42(500):582-594 (1969).
D42 Dickman, P.W., L.E. Holm, G. Lundell et al. Thyroidcancer risk after thyroid examination with 131I: a pop-ulation-based cohort study in Sweden. Int. J. Cancer106(4): 580-587 (2003).
D43 Dupree, E.A., J.P. Watkins, J.N. Ingle et al. Uraniumdust exposure and lung cancer risk in four uraniumprocessing operations. Epidemiology 6(4): 370-375(1995).
D44 Doll, R. The age distribution of cancer: implicationsfor models of carcinogenesis. J. R. Stat. Soc. Ser. A134: 133-166 (1971).
D45 Diamond, E.L., H. Schmerler and A.M. Lilienfeld.The relationship of intra-uterine radiation to subse-quent mortality and development of leukemia in chil-dren. A prospective study. Am. J. Epidemiol. 97(5):283-313 (1973).
D46 Dores, G.M., C. Metayer, R.E. Curtis et al. Secondmalignant neoplasms among long-term survivors ofHodgkin’s disease: a population-based evaluation over25 years. J. Clin. Oncol. 20(16): 3484-3494 (2002).
D47 Demidchik, E.P., I.M. Drobyshevskaya, L.N.Cherstvoy et al. Thyroid cancer in children in Belarus.p. 677-682 in: The Radiological Consequences of theChernobyl Accident (A. Karaoglou et al., eds.). EUR16544 EN, 1996.
D48 Davis, S., K.J. Kopecky, T.E. Hamilton et al. Thyroidneoplasia, autoimmune thyroiditis, and hypothy-roidism in persons exposed to iodine 131 from theHanford nuclear site. J. Am. Med. Assoc. 292(21):2600-2613 (2004).
D49 Davis, S., V. Stepanenko, N. Rivkind et al. Risk ofthyroid cancer in the Bryansk Oblast of the RussianFederation after the Chernobyl power station accident.Radiat. Res. 162(3): 241-248 (2004).
D50 de Vathaire, F., C. Hardiman, A. Shamsaldin et al.Thyroid carcinomas after irradiation for a first cancerduring childhood. Arch. Intern. Med. 159(22): 2713-2719 (1999).
D51 Daniels, J.L., A.F. Olshan and D.A. Savitz. Pesticidesand childhood cancers. Environ. Health Perspect.105(10): 1068-1077 (1997).
D52 Davis, S., R.W. Day, K.J. Kopecky et al. Childhoodleukaemia in Belarus, Russia, and Ukraine followingthe Chernobyl power station accident: results from aninternational collaborative population-based case-control study. Int. J. Epidemiol. 35(2): 386-396(2006).
UNSCEAR REPORT-PART 5.qxp 10/7/08 3:41 pm Page 296
D53 Darby, S.C., R. Doll, S.K. Gill et al. Long term mor-tality after a single treatment course with x-rays inpatients treated for ankylosing spondylitis. Br. J.Cancer 55(2): 179-190 (1987).
D54 Deschavanne, P.J. and B. Fertil. A review of humancell radiosensitivity in vitro. Int. J. Radiat. Oncol. Biol.Phys. 34(1): 251-266 (1996).
E1 Evrard, A.-S., D. Hémon, S. Billon et al. Childhoodleukemia incidence and exposure to indoor radon, ter-restrial and cosmic gamma radiation. Health Phys.90(6): 569-579 (2006).
E2 Evans, H.S., C.M. Lewis, D. Robinson et al. Incidenceof multiple primary cancers in a cohort of womendiagnosed with breast cancer in southeast England. Br.J. Cancer 84(3): 435-440 (2001).
E3 Epidemiological Study Group of Nuclear Workers(Japan). First analysis of mortality of nuclear industryworkers in Japan, 1986-1992. J. Health Phys. 32(2):173-184 (1997).
E4 Epstein, E. Jr. Genetic determinants of basal cell carci-noma risk. Med. Pediatr. Oncol. 36(5): 555-558 (2001).
E5 Edwards, A.A., C. Lindholm, F. Darroudi et al.Review of translocations detected by FISH for retro-spective biological dosimetry applications. Radiat.Prot. Dosim. 113(4): 396-402 (2005).
E6 Environmental Protection Agency. Estimating radi-ogenic cancer risks. EPA Report 402-R-00-003(1999).
E7 Eng, C., F.P. Li, D.H. Abramson et al. Mortality fromsecond tumors among long-term survivors ofretinoblastoma. J. Natl. Cancer Inst. 85(14): 1121-1128 (1993).
E8 Edmonds, C.J. and T. Smith. The long-term hazardsof the treatment of thyroid cancer with radioiodine.Br. J. Radiol. 59(697): 45-51 (1986).
E9 Ewertz, M., S.G. Machado, J.D. Boice Jr. et al.Endometrial cancer following treatment for breastcancer: a case-control study in Denmark. Br. J. Cancer50(5): 687-692 (1984).
E10 Eheman, C.R., P.E. Tolbert, R.J. Coates et al. Case-control assessment of the association between non-Hodgkin’s lymphoma and occupational radiation withdoses assessed using a job exposure matrix. Am. J.Ind. Med. 38(1): 19-27 (2000).
E11 Evrard, A.S., D. Hémon, S. Billon et al. Ecologicalassociation between indoor radon concentration andchildhood leukaemia incidence in France, 1990-1998.Eur. J. Cancer Prev. 14(2): 147-157 (2005).
E12 Cardis, E. Communication to the UNSCEARSecretariat (2006).
E13 Evrard, A.-S., D. Hémon, A. Morin et al. Childhoodleukaemia incidence around French nuclear installa-tions using geographic zoning based on gaseous dis-charge dose estimates. Br. J. Cancer 94: 1342-1347(2006).
F1 Franklyn, J.A., P. Maisonneuve, M. Sheppard et al.Cancer incidence and mortality after radioiodine treat-ment for hyperthyroidism: a population-based cohortstudy. Lancet 353(9170): 2111-2115 (1999).
F2 Frome, E.L., D.L. Cragle and R.W. McLain. Poissonregression analysis of the mortality among a cohort ofWorld War II nuclear industry workers. Radiat. Res.123(2): 138-152 (1990).
F3 Fry, S.A., E.A. Dupree, A.H. Sipe et al. A study ofmortality and morbidity among persons occupationallyexposed to ≥50 mSv in a year: Phase I, mortalitythrough 1984. Appl. Occup. Environ. Hyg. 11(4): 334-343 (1996).
F4 Fry, S.A. Studies of U.S. radium dial workers: an epi-demiological classic. Radiat. Res. 150 (5 Suppl.): S21-S29 (1998).
F5 Frome, E.L., D.L. Cragle, J.P. Watkins et al. A mor-tality study of employees of the nuclear industry inOak Ridge, Tennessee. Radiat. Res. 148(1): 64-80(1997).
F6 Field, R.W., D.J. Steck, B.J. Smith et al. The Iowaradon lung cancer study — phase I: residential radongas exposure and lung cancer. Sci. Total Environ.272(1): 67-72 (2001).
F7 Forastiere, F., A. Sperati, G. Cherubini et al. Adultmyeloid leukaemia, geology, and domestic exposureto radon and gamma radiation: a case control study incentral Italy. Occup. Environ. Med. 55(2): 106-110(1998).
F8 Fraser, P., L. Carpenter, N. Maconochie et al. Cancermortality and morbidity in employees of the UnitedKingdom Atomic Energy Authority, 1946-86. Br. J.Cancer 67(3): 615-624 (1993).
F9 Fuller, W.A. Measurement Error Models. Wiley, NewYork, 1987.
F10 Fisher, B., H.E. Rockette, E.R. Fisher et al. Leukemiain breast cancer patients following adjuvantchemotherapy or post-operative radiation. TheNSABP experience. J. Clin. Oncol. 3(12): 1640-1658(1985).
F11 Freedman, D.M., A. Sigurdson, R.S. Rao et al. Riskof melanoma among radiologic technologists in theUnited States. Int. J. Cancer 103(4): 556-562 (2003).
F12 Field, R.W., D.J. Steck, B.J. Smith et al. Residentialradon gas exposure and lung cancer: the Iowa RadonLung Cancer Study. Am. J. Epidemiol. 151(11): 1091-1102 (2000).
F13 Fujiwara, S., G.B. Sharp, J.B. Cologne et al.Prevalence of hepatitis B virus infection among atomicbomb survivors. Radiat. Res. 159(6): 780-786 (2003).
F14 Ferlay, J., F. Bray, P. Pisani et al. GLOBOCAN 2000:Cancer Incidence, Mortality and PrevalenceWorldwide. Ver. 1 (CD-ROM). IARC Cancer BaseNo. 5. IARC Press (2001).
F15 Ford, M.B., A.J. Sigurdson, E.S. Petrulis et al. Effectsof smoking and radiotherapy on lung carcinoma inbreast carcinoma survivors. Cancer 98(7): 1457-1464(2003).
F16 Franceschi, S. and C. La Vecchia. Thyroid cancer. p.393-422 in: Cancer Surveys. Trends in CancerIncidence and Mortality, Volumes 19/20 (R. Doll et al., eds.). Cold Spring Harbor Laboratory Press,Imperial Cancer Research Fund, 1994.
ANNEX A: EPIDEMIOLOGICAL STUDIES OF RADIATION AND CANCER 297
UNSCEAR REPORT-PART 5.qxp 10/7/08 3:41 pm Page 297
298 UNSCEAR 2006 REPORT: VOLUME I
F17 Field, R.W., B.J. Smith and C.F. Lynch. Ecologic biasrevisited, a rejoinder to Cohen’s response to“Residential 222Rn exposure and lung cancer: Testingthe linear no-threshold theory with ecologic data”.Health Phys. 75(1): 31-33 (1998).
F18 Folley, J.H., W. Borges and T. Yamawaki. Incidenceof leukemia in survivors of the atomic bomb inHiroshima and Nagasaki, Japan. Am. J. Med. 13(3):311-321 (1952).
G1 Gilbert, E.S. Accounting for errors in dose estimatesused in studies of workers exposed to external radia-tion. Health Phys. 74(1): 22-29 (1998).
G2 Gilbert, E.S., N.A. Koshurnikova, M. Sokolnikov etal. Liver cancers in Mayak workers. Radiat. Res.154(3): 246-252 (2000).
G3 Gilliland, F.D., W.C. Hunt, V.E. Archer et al. Radonprogeny exposure and lung cancer risk among non-smoking uranium miners. Health Phys. 79(4): 365-372(2000).
G4 Gordeev, K., I. Vasilenko, A. Lebedev et al. Falloutfrom nuclear tests: dosimetry in Kazakhstan. Radiat.Environ. Biophys. 41(1): 61-67 (2002).
G5 Greenland, S. and J.M. Robins. Empirical-Bayesadjustments for multiple comparisons are sometimesuseful. Epidemiology 2(4): 244-251 (1991).
G6 Griem, M.L., R.A. Kleinerman, J.D. Boice Jr. et al.Cancer following radiotherapy for peptic ulcer. J. Natl.Cancer Inst. 86(11): 842-849 (1994).
G7 Grosche, B., C. Land, S. Bauer et al. Fallout fromnuclear tests: health effects in Kazakhstan. Radiat.Environ. Biophys. 41(1): 75-80 (2002).
G8 Gilbert, E.S., D.L. Cragle and L.D. Wiggs. Updatedanalyses of combined mortality data for workers at theHanford site, Oak Ridge National Laboratory, andRocky Flats Weapons Plant. Radiat. Res. 136(3): 408-421 (1993).
G9 Gribbin, M.A., J.L. Weeks and G.R. Howe. Cancermortality (1956-1985) among male employees ofAtomic Energy of Canada Limited with respect tooccupational exposure to external low-linear-energy-transfer ionizing radiation. Radiat. Res. 133(3): 375-380 (1993).
G10 Gilbert, E.S., E. Omohundro, J.A. Buchanan et al.Mortality of workers at the Hanford site: 1945-1986.Health Phys. 64(6): 577-590 (1993).
G11 Greenland, S. Multiple-bias modelling for analysis ofobservational data. J. R. Stat. Soc. Ser. A 168: 267-306 (2005).
G12 Gilbert, E.S., N.A. Koshurnikova, M.E. Sokolnikov etal. Lung cancer in Mayak workers. Radiat. Res.162(5): 505-516 (2004).
G13 Greenland, S. and J. Robins. Invited commentary: eco-logic studies — biases, misconceptions, and counter-examples. Am. J. Epidemiol. 139(8): 747-760 (1994).
G14 Greenland, S. The impact of prior distributions foruncontrolled confounding and response bias: a casestudy of the relation of wire codes and magnetic fieldsto childhood leukemia. J. Am. Stat. Assoc. 98(461):47-54 (2003).
G15 Grajewski, B., M.A. Waters, E.A. Whelan et al.Radiation dose estimation for epidemiologic studies offlight attendants. Am. J. Ind. Med. 41(1): 27-37(2002).
G16 Gilbert, E.S. Invited commentary: Studies of workersexposed to low doses of radiation. Am. J. Epidemiol.153(4): 319-322 (2001).
G17 Gilbert, E.S. Some effects of random dose measure-ment errors on analyses of atomic bomb survivor data.Radiat. Res. 98(3): 591-605 (1984).
G18 Greaves, M.F. Speculations on the cause of childhoodacute lymphoblastic leukemia. Leukemia 2(2): 120-125 (1988).
G19 Gapanovich, V.N., R.F. Iaroshevich, L.P. Shuvaeva etal. Childhood leukemia in Belarus before and after theChernobyl accident: continued follow-up. Radiat.Environ. Biophys. 40(4): 259-267 (2001).
G20 Gold, D.G., J.P. Neglia and K.E. Dusenbery. Secondneoplasms after megavoltage radiation for pediatrictumors. Cancer 97(10): 2588-2596 (2003).
G21 Gilbert, E.S., C.E. Land and S.L. Simon. Health effectsfrom fallout. Health Phys. 82(5): 726-735 (2002).
G22 Gundestrup, M. and H.H. Storm. Radiation-inducedacute myeloid leukaemia and other cancers in com-mercial jet cockpit crew: a population-based cohortstudy. Lancet 354(9195): 2029-2031 (1999).
G23 Gilbert, E.S., M. Stovall, M. Gospodarowicz et al.Lung cancer after treatment for Hodgkin’s disease:focus on radiation effects. Radiat. Res. 159(2): 161-173 (2003).
G24 Glanzmann, C. Subsequent malignancies in patientstreated with 131-iodine for thyroid cancer.Strahlenther. Onkol. 168(6): 337-343 (1992).
G25 Grady, D. and V.L. Ernster. Endometrial cancer. p. 1058-1089 in: Cancer Epidemiology andPrevention, second edition (D. Schottenfeld and J.F. Fraumeni Jr., eds.). Oxford University Press, New York, Oxford, 1996.
G26 Godley, P. and S.W. Kim. Renal cell carcinoma.Genitourinary system. Curr. Opin. Oncol. 14(3): 280-285 (2002).
G27 Gudbjartsson, T., T.J. Jonasdottir, A. Thoroddsen et al.A population-based familial aggregation analysis indi-cates genetic contribution in a majority of renal cellcarcinomas. Int. J. Cancer 100(4): 476-479 (2002).
G28 Gelman, A. and D.B. Rubin. Inference from iterativesimulation using multiple sequences. Stat. Sci. 7(4):457-511 (1992).
G29 Guibout, C., E. Adjadj, C. Rubino et al. Malignantbreast tumors after radiotherapy for a first cancerduring childhood. J. Clin. Oncol. 23(1): 197-204(2005).
G30 Garwicz, S., H. Anderson, J.H. Olsen et al. Secondmalignant neoplasms after cancer in childhood andadolescence: a population-based case-control study inthe 5 Nordic countries. The Nordic Society forPediatric Hematology and Oncology. The Associationof the Nordic Cancer Registries. Int. J. Cancer 88(4):672-678 (2000).
UNSCEAR REPORT-PART 5.qxp 10/7/08 3:41 pm Page 298
G31 Guerin, S., A. Dupuy, H. Anderson et al. Radiationdose as a risk factor for malignant melanoma follow-ing childhood cancer. Eur. J. Cancer 39(16): 2379-2386 (2003).
G32 Guerin, S., C. Guibout, A. Shamsaldin et al.Concomitant chemo-radiotherapy and local dose ofradiation as risk factors for second malignant neo-plasms after solid cancer in childhood: a case-controlstudy. Int. J. Cancer 120(1): 96-102 (2007).
H1 Hahn, K., P. Schnell-Inderst, B. Grosche et al. Thyroidcancer after diagnostic administration of iodine-131 inchildhood. Radiat. Res. 156(1): 61-70 (2001).
H2 Hall, P., L.E. Holm, G. Lundell et al. Cancer risks inthyroid cancer patients. Br. J. Cancer 64(1): 159-163(1991).
H3 Huang, J. and W.J. Mackillop. Increased risk of softtissue sarcoma after radiotherapy in women withbreast carcinoma. Cancer 92(1): 172-180 (2001).
H4 Hoffman, F.O., S.L. Simon and K.M. Thiessen. Therole of uncertainty analysis in dose reconstruction andrisk assessment. p. 107-134 in: Environmental DoseReconstruction and Risk Implications (J.E. Till, ed.).NCRP, Bethesda, MD, 1996.
H5 Hawkins, M.M. and J.E. Kingston. Malignant thyroidtumours following childhood cancer. Lancet 2(8614):804 (1988).
H6 Holm, L.E., P. Hall, K. Wiklund et al. Cancer riskafter iodine-131 therapy for hyper-thyroidism. J. Natl.Cancer Inst. 83(15): 1072-1077 (1991).
H7 Howe, G.R. Lung cancer mortality between 1950 and1987 after exposure to fractionated moderate-dose-rateionizing radiation in the Canadian fluoroscopy cohortstudy and a comparison with lung cancer mortality inthe atomic bomb survivors study. Radiat. Res. 142(3):295-304 (1995).
H8 Holm, L.E., K.E. Wiklund, G.E. Lundell et al. Cancerrisk in population examined with diagnostic doses of131I. J. Natl. Cancer Inst. 81(4): 302-306 (1989).
H9 Howe, G.R. and J. McLaughlin. Breast cancer mortality between 1950 and 1987 after exposure tofractionated moderate-dose-rate ionizing radiation inthe Canadian fluoroscopy cohort study and a com-parison with breast cancer mortality in the atomicbomb survivors study. Radiat. Res. 145(6): 694-707(1996).
H10 Hildreth, N.G., R.E. Shore and P.M. Dvoretsky. Therisk of breast cancer after irradiation of the thymus ininfancy. N. Engl. J. Med. 321(19): 1281-1284 (1989).
H11 Huang, J., R. Walker, P.G. Groome et al. Risk of thy-roid carcinoma in a female population after radiother-apy for breast carcinoma. Cancer 92(6): 1411-1418(2001).
H12 Hall, P., J.D. Boice Jr., G. Berg et al. Leukaemia inci-dence after iodine-131 exposure. Lancet 340(8810): 1-4 (1992).
H13 Hatch, M., E. Ron, A. Bouville et al. The Chernobyldisaster: cancer following the accident at theChernobyl nuclear power plant. Epidemiol. Rev.27(1): 56-66 (2005).
H14 Hall, P., A. Mattsson and J.D. Boice Jr. Thyroidcancer after diagnostic administration of iodine-131.Radiat. Res. 145(1): 86-92 (1996).
H15 Howe, G.R., R.C. Nair, H.B. Newcombe et al. Lungcancer mortality (1950-80) in relation to radon daugh-ter exposure in a cohort of workers at the EldoradoBeaverlodge uranium mine. J. Natl. Cancer Inst. 77(2):357-362 (1986).
H16 Howe, G.R., R.C. Nair, H.B. Newcombe et al. Lungcancer mortality (1950-80) in relation to radon daugh-ter exposure in a cohort of workers at the EldoradoPort Radium uranium mine: possible modification ofrisk by exposure rate. J. Natl. Cancer Inst. 79(6):1255-1260 (1987).
H17 Hornung, R.W. and T.J. Meinhardt. Quantitative riskassessment of lung cancer in U.S. uranium miners.Health Phys. 52(4): 417-430 (1987).
H18 Howe, G.R. and R.H. Stager. Risk of lung cancer mor-tality after exposure to radon decay products in theBeaverlodge cohort based on revised exposure esti-mates. Radiat. Res. 146(1): 37-42 (1996).
H19 Hancock, S.L., R.S. Cox and I.R. McDougall. Thyroiddiseases after treatment of Hodgkin’s disease. N. Engl.J. Med. 325(9): 599-605 (1991).
H20 Hancock, S.L., M.A. Tucker and R.T. Hoppe. Breastcancer after treatment of Hodgkin’s disease. J. Natl.Cancer Inst. 85(1): 25-31 (1993).
H21 Hawkins, M.M., L.M. Wilson, M.A. Stovall et al.Epipodophyllotoxins, alkylating agents, and radiationand risk of secondary leukaemia after childhoodcancer. Br. Med. J. 304(6832): 951-958 (1992).
H22 Hanford, J.M., E.H. Quimby and V.K. Frantz. Cancerarising many years after radiation therapy. J. Am.Med. Assoc. 181: 404-410 (1962).
H23 Hodgson, J.T. and R.D. Jones. Mortality of a cohortof tin miners 1941-86. Br. J. Ind. Med. 47(10): 665-676 (1990).
H24 Hall, P., G. Berg, G. Bjelkengren et al. Cancer mor-tality after iodine-131 therapy for hyperthyroidism.Int. J. Cancer 50(6): 886-890 (1992).
H25 Hamilton, T.E., G. van Belle and J.P. LoGerfo.Thyroid neoplasia in Marshall Islanders exposed tonuclear fallout. J. Am. Med. Assoc. 258(5): 629-636(1987).
H26 Hildreth, N.G., R.E. Shore, L.H. Hempelmann et al.Risk of extrathyroid tumors following radiation treat-ment in infancy for thymic enlargement. Radiat. Res.102(3): 378-391 (1985).
H27 Hawkins, M.M., L.M. Wilson, H.S. Burton et al.Radiotherapy, alkylating agents, and risk of bonecancer after childhood cancer. J. Natl. Cancer Inst.88(5): 270-278 (1996).
H28 Hsing, A.W., L. Tsao and S.S. Devesa. Internationaltrends and patterns of prostate cancer incidence andmortality. Int. J. Cancer 85(1): 60-67 (2000).
H29 Huet, S. and A. Kaddour. Maximum likelihood esti-mation in survival analysis with grouped data on cen-sored individuals and continuous data on failures.Appl. Stat. 43(2): 325-333 (1994).
ANNEX A: EPIDEMIOLOGICAL STUDIES OF RADIATION AND CANCER 299
UNSCEAR REPORT-PART 5.qxp 10/7/08 3:41 pm Page 299
300 UNSCEAR 2006 REPORT: VOLUME I
H30 Hoel, D.G. and P. Li. Threshold models in radiationcarcinogenesis. Health Phys. 75(3): 241-250 (1998).
H31 Hutchison, G.B. Leukemia in patients with cancer ofthe cervix uteri treated with radiation. A report cov-ering the first 5 years of an international study. J. Natl.Cancer Inst. 40(5): 951-982 (1968).
H32 Henshaw, D.L., J.P. Eatough and R.B. Richardson.Radon as a causative factor in induction of myeloidleukaemia and other cancers. Lancet 335(8696): 1008-1012 (1990).
H33 Herrington, L.J., N.S. Weiss and A.F. Olshan.Multiple myeloma. p. 946-970 in: CancerEpidemiology and Prevention, second edition (D.Schottenfeld and J.F. Fraumeni Jr., eds.). OxfordUniversity Press, New York, Oxford, 1996.
H34 Haenszel, W. and M. Kurihara. Studies of Japanesemigrants. I. Mortality from cancer and other diseasesamong Japanese in the United States. J. Natl. CancerInst. 40(1): 43-68 (1968).
H35 Haenszel, W., M. Kurihara, M. Segi et al. Stomachcancer among Japanese in Hawaii. J. Natl. Cancer Inst.49(4): 969-988 (1972).
H36 Haenszel, W. Migrant studies p. 194-207 in: CancerEpidemiology and Prevention, first edition (D.Schottenfeld and J.F. Fraumeni Jr., eds.). W.B.Saunders, Philadelphia, 1982.
H37 Hankey, B.F., D.T. Silverman and R. Kaplan. Urinarybladder. p. xxvi.1-xxvi.17 in: SEER Cancer StatisticsReview, 1973-1990 (B.A. Miller et al., eds.). NIHPublication No. 93-2789 (1993).
H38 Henderson, B.E., R.K. Ross, M.C. Pike et al.Endogenous hormones as a major factor in humancancer. Cancer Res. 42(8): 3232-3239 (1982).
H39 Hartge, P., S.S. Devesa and J.F. Fraumeni Jr.Hodgkin’s and non-Hodgkin’s lymphomas. p. 423-453in: Cancer Surveys. Trends in Cancer Incidence andMortality, Volumes 19/20 (R. Doll et al., eds.). ColdSpring Harbor Laboratory Press, Imperial CancerResearch Fund, 1994.
H40 Harrison, J.D. and C.R. Muirhead. Quantitative com-parisons of cancer induction in humans by internallydeposited radionuclides and external radiation. Int. J.Radiat. Biol. 79(1): 1-13 (2003).
H41 Hempelmann, L.H., W.J. Hall, M. Phillips et al.Neoplasms in persons treated with x-rays in infancy:fourth survey in 20 years. J. Natl. Cancer Inst. 55(3):519-530 (1975).
H42 Harris, N.L., E.S. Jaffe, H. Stein et al. A revisedEuropean-American classification of lymphoid neo-plasms: a proposal from the International LymphomaStudy Group. Blood 84(5): 1361-1392 (1994).
H43 Hoover, R. and J.F. Fraumeni Jr. Risk of cancer inrenal-transplant recipients. Lancet 2(7820): 55-57(1973).
H44 Howe, G.R., L.B. Zablotska, J.J. Fix et al. Analysisof the mortality experience amongst U.S. nuclearpower industry workers after chronic low-dose expo-sure to ionizing radiation. Radiat. Res. 162(5): 517-526 (2004).
H45 Heidenreich, W.F., P. Jacob, H.G. Paretzke et al. Two-step model for the risk of fatal and incidental lungtumors in rats exposed to radon. Radiat. Res. 151(2):209-217 (1999).
H46 Heath, C.W. Jr., P.D. Bond, D.G. Hoel et al.Residential radon exposure and lung cancer risk:Commentary on Cohen’s county-based study. HealthPhys. 87(6): 647-655 (2004).
H47 Hazelton, W.D., E.G. Luebeck, W.F. Heidenreich etal. Analysis of a historical cohort of Chinese tinminers with arsenic, radon, cigarette smoke, and pipesmoke exposures using the biologically based two-stage clonal expansion model. Radiat. Res. 156(1): 78-94 (2001).
H48 Heidenreich, W.F., L. Tomasek, A. Rogel et al.Studies of radon-exposed miner cohorts using a bio-logically based model: comparison of current Czechand French data with historic data from China andColorado. Radiat. Environ. Biophys. 43(4): 247-256(2004).
H49 Heidenreich, W.F. and H.G. Paretzke. Interpretationby modelling of observations in radon radiation car-cinogenesis. Radiat. Prot. Dosim. 112(4): 501-507(2004).
H50 Hemminki, K. and X. Li. Age-specific familial risksfor renal cell carcinoma with evidence on recessiveheritable effects. Kidney Int. 65(6): 2298-2302 (2004).
H51 Hill, D.A., S. Preston-Martin, R.K. Ross et al. Medicalradiation, family history of cancer, and benign breastdisease in relation to breast cancer risk in youngwomen, USA. Cancer Causes Control 13(8): 711-718(2002).
H52 Heidenreich, W.F., T.I. Bogdanova, A.G. Biryukov etal. Time trends of thyroid cancer incidence in Ukraineafter the Chernobyl accident. J. Radiol. Prot. 24(3):283-293 (2004).
H53 Henrichs, K., L. Bogner, E. Nekolla et al. Extendeddosimetry for studies with Ra-224 patients. p. 33-38in: Health Effects of Internally DepositedRadionuclides: Emphasis on Radium and Thorium (G.van Kaick et al., eds.). World Scientific, Singapore,1995.
H54 Haskell, E.H., R.B. Hayes, G.H. Kenner et al. Electronparamagnetic resonance techniques and space bio-dosimetry. Radiat. Res. 148 (5 Suppl.): S51-S59 (1997).
H55 Hayes, R.B., E.H. Haskell, A. Wieser et al.Assessment of an alanine EPR dosimetry techniquewith enhanced precision and accuracy. Nucl. Instrum.Methods Phys. Res. 440(2): 453-461 (2000).
H56 Harvey, E.B., J.D. Boice, M. Honeyman et al. Prenatalx-ray exposure and childhood cancer in twins. N.Engl. J. Med. 312(9): 541-545 (1985).
H57 Heidenreich, W.F., E.G. Luebeck, W.D. Hazelton etal. Multistage models and the incidence of cancer inthe cohort of atomic bomb survivors. Radiat. Res.158(5): 607-614 (2002).
H58 Haldorsen, T., J.B. Reitan and U. Tveten. Cancer inci-dence among Norwegian airline cabin attendants. Int.J. Epidemiol. 30(4): 825-830 (2001).
UNSCEAR REPORT-PART 5.qxp 10/7/08 3:41 pm Page 300
H59 Hill, D.A., E. Gilbert, G.M. Dores et al. Breast cancerrisk following radiotherapy for Hodgkin lymphoma:modification by other risk factors. Blood 106(10):3358-3365 (2005).
H60 Harley, N.H., E.C. Foulkes, L.H. Hiborne et al. AReview of the Scientific Literature as it Pertains toGulf War Illness. Depleted Uranium, Volume 7.RAND Corporation, Santa Monica, CA, 1999.
I1 Inskip, P.D., R.A. Kleinerman, M. Stovall et al.Leukemia, lymphoma, and multiple myeloma afterpelvic radiotherapy for benign disease. Radiat. Res.135(1): 108-124 (1993).
I2 IARC Study Group on Cancer Risk Among NuclearIndustry Workers. Direct estimates of cancer mortal-ity due to low doses of ionising radiation: an interna-tional study. Lancet 344(8929): 1039-1043 (1994).
I3 Inskip, P.D., R.R. Monson, J.K. Wagoner et al.Leukemia following radiotherapy for uterine bleeding.Radiat. Res. 122(2): 107-119 (1990).
I4 Inskip, P.D., R.R. Monson, J.K. Wagoner et al. Cancermortality following radium treatment for uterinebleeding. Radiat. Res. 123(3): 331-344 (1990).
I5 Ivanov, V.K., A.F. Tsyb, A.I. Gorsky et al. Leukaemiaand thyroid cancer in emergency workers of theChernobyl accident: estimation of radiation risks (1986-1995). Radiat. Environ. Biophys. 36(1): 9-16 (1997).
I6 Ivanov, V.K., A.F. Tsyb, A.P. Konogorov et al. Case-control analysis of leukaemia among Chernobyl acci-dent emergency workers residing in the RussianFederation, 1986-1993. J. Radiol. Prot. 17(3): 137-157(1997).
I7 Inskip, P.D., M. Stovall and J.T. Flannery. Lungcancer risk and radiation dose among women treatedfor breast cancer. J. Natl. Cancer Inst. 86(13): 983-988 (1994).
I8 Ivanov, V.K., E.M. Rastopchin, A.I. Gorsky et al.Cancer incidence among liquidators of the Chernobylaccident: solid tumors, 1986-1995. Health Phys. 74(3):309-315 (1998).
I9 Inskip, P.D., A. Ekbom, M.R. Galanti et al. Medicaldiagnostic x-rays and thyroid cancer. J. Natl. CancerInst. 87(21): 1613-1621 (1995).
I10 Inskip, P.D., M.F. Hartshorne, M. Tekkel et al.Thyroid nodularity and cancer among Chernobylcleanup workers from Estonia. Radiat. Res. 147(2):225-235 (1997).
I11 International Commission on Radiological Protection.1990 Recommendations of the InternationalCommission on Radiological Protection. Annals of theICRP 21(1-3). ICRP Publication 60. Pergamon Press,Oxford, 1991.
I12 International Commission on Radiological Protection.Genetic Susceptibility to Cancer. Annals of the ICRP28(1-2). ICRP Publication 79. Pergamon Press,Oxford, 1999.
I13 International Commission on Radiological Protection.The Biological Basis for Dose Limitation in the Skin.Annals of the ICRP 22(2). ICRP Publication 59.Pergamon Press, Oxford, 1992.
I14 Iwasaki, T., M. Murata, S. Ohshima et al. Second analy-sis of mortality of nuclear industry workers in Japan,1986-1997. Radiat. Res. 159(2): 228-238 (2003).
I15 Ishikawa, Y., T. Mori, Y. Kato et al. Systemic depositsof thorium in thorotrast patients with particular refer-ence to sites of minor storage. Radiat. Res. 135(2):244-248 (1993).
I16 Infante-Rivard, C., G. Mathonnet and D. Sinnett. Riskof childhood leukemia associated with diagnostic irra-diation and polymorphisms in DNA repair genes.Environ. Health Perspect. 108(6): 495-498 (2000).
I17 Institute of Medicine. The Five Series Study:Mortality of Military Participants in U.S. NuclearWeapons Tests. National Academy Press,Washington, 2000.
I18 International Commission on Radiological Protection.Lung Cancer Risk from Indoor Exposures to RadonDaughters. Annals of the ICRP 17(1). ICRPPublication 50. Pergamon Press, Oxford, 1987.
I19 Ishikawa, Y., J.A. Humphreys, C.G. Collier et al.Revised organ partition of thorium-232 in thorotrastpatients. Radiat. Res. 152(6): S102-S106 (1999).
I20 Inskip, P.D., M.S. Linet and E.F. Heineman. Etiologyof brain tumors in adults. Epidemiol. Rev. 17(2): 382-414 (1995).
I21 International Commission on Radiation Units andMeasurements. Retrospective assessment of exposuresto ionising radiation. ICRU Report 68 (2002).
I22 Ikeya, M., T. Miki, A. Kai et al. ESR dosimetry ofA-bomb radiation using tooth enamel and graniterocks. Radiat. Prot. Dosim. 17(1): 181-184 (1986).
I23 Ikeya, M. and H. Ishii. Atomic bomb and accidentdosimetry with ESR: natural rocks and human toothin-vivo spectrometer. Int. J. Radiat. Appl. Instrum. [A]40(10-12): 1021-1027 (1989).
I24 Ishii, H., M. Ikeya and M. Okano. ESR dosimetry ofteeth of residents close to Chernobyl reactor accident.J. Nucl. Sci. Technol. 27(12): 1153-1155 (1990).
I25 International Commission on Radiological Protection.Low-dose Extrapolation of Radiation-related CancerRisk. Annals of the ICRP 35(4). ICRP Publication 99.Pergamon Press, Oxford, 2005.
I26 Inskip, P.D., E.B. Harvey, J.D. Boice Jr. et al.Incidence of childhood cancer in twins. Cancer CausesControl 2(5): 315-324 (1991).
I27 Inskip, P.D. Thyroid cancer after radiotherapy forchildhood cancer. Med. Pediatr. Oncol. 36(5): 568-573(2001).
I28 Imaizumi, M., T. Usa, T. Tominaga et al. Radiationdose-response relationships for thyroid nodules andautoimmune thyroid diseases in Hiroshima andNagasaki atomic bomb survivors 55-58 years afterradiation exposure. J. Am. Med. Assoc. 295(9): 1011-1022 (2006).
I29 Ivanov, V.K., A.F. Tsyb, A.V. Petrov et al. Thyroidcancer incidence among liquidators of the Chernobylaccident. Absence of dependence of radiation risks onexternal radiation dose. Radiat. Environ. Biophys.41(3): 195-198 (2002).
ANNEX A: EPIDEMIOLOGICAL STUDIES OF RADIATION AND CANCER 301
UNSCEAR REPORT-PART 5.qxp 10/7/08 3:41 pm Page 301
302 UNSCEAR 2006 REPORT: VOLUME I
I30 Ivanov, V.K., A.F. Tsyb, A.I. Gorsky et al. Thyroidcancer among ‘‘liquidators’’ of the Chernobyl acci-dent. Br. J. Radiol. 70(837): 937-941 (1997).
I31 Ivanov, V.K., A.I. Gorski, M.A. Maksioutov et al.Thyroid cancer incidence among adolescents andadults in the Bryansk region of Russia following theChernobyl accident. Health Phys. 84(1): 46-60 (2003).
I32 Ivanov, V.K., A.I. Gorskii, A.F. Tsyb et al. Incidenceof post-Chernobyl leukemia and thyroid cancer inchildren and adolescents in the Briansk region: eval-uation of radiation risks. Vopr. Onkol. 49(4): 445-449(2003).
I33 International Commission on Radiological Protection.Biological Effects after Prenatal Irradiation (Embryoand Fetus). Annals of the ICRP 33(1-2). ICRPPublication 90. Pergamon Press, Oxford, 2003.
I34 International Agency for Research on Cancer. IARCMonographs on the Evaluation of Carcinogenic Risksto Humans. Volume 75. Ionizing Radiation, Part 1: X-and Gamma (γ)-Radiation, and Neutrons. IARC, Lyon,France, 2000.
I35 Institute of Medicine (IOM). Committee on the HealthEffects Associated with Exposures During the GulfWar. Gulf War and Health. Volume 1. DepletedUranium, Pyridostigmine Bromide, Sarin, Vaccines.National Academy Press, Washington, 2001.
I36 International Atomic Energy Agency. Cytogeneticanalysis for radiation dose assessment. A manual.Technical Reports Series No. 405. IAEA, Vienna(2001).
J1 Jenkinson, H.C., M.M. Hawkins, C.A. Stiller et al.Long-term population-based risks of second malignantneoplasms after childhood cancer in Britain. Br. J.Cancer 91(11): 1905-1910 (2004).
J2 Johansson, L., L.G. Larsson and L. Damber. A cohortstudy with regard to the risk of haematological malig-nancies in patients treated with x-rays for benignlesions in the locomotor system. II. Estimation ofabsorbed dose in the red bone marrow. Acta Oncol.34(6): 721-726 (1995).
J3 Jablon, S. Atomic bomb radiation dose estimation atABCC. ABCC TR/23-71 (1971).
J4 Jones, I.M., H. Galick, P. Kato et al. Three somaticgenetic biomarkers and covariates in radiation-exposed Russian cleanup workers of the Chernobylnuclear reactor 6-13 years after exposure. Radiat. Res.158(4): 424-442 (2002).
J5 Jacob, P., Y. Göksu, V. Taranenko et al. On an eval-uation of external dose values in the Techa RiverDosimetry System (TRDS) 2000. Radiat. Environ.Biophys. 42(3): 169-174 (2003).
J6 Janower, M.L. and O.S. Miettinen. Neoplasms afterchildhood irradiation of the thymus gland. J. Am.Med. Assoc. 215(5): 753-756 (1971).
J7 Jacob, P., G. Goulko, W.F. Heidenreich et al. Thyroidcancer risk to children calculated. Nature 392(6671):31-32 (1998).
J8 Jacob, P., Y. Kenigsberg, I. Zvonova et al. Childhoodexposure due to the Chernobyl accident and thyroid
cancer risk in contaminated areas of Belarus andRussia. Br. J. Cancer 80(9): 1461-1469 (1999).
J9 Jacob, P., T.I. Bogdanova, E. Buglova et al. Thyroidcancer risk in areas of Ukraine and Belarus affectedby the Chernobyl accident. Radiat. Res. 165(1): 1-8(2006).
J10 Jacob, V., P. Jacob, R. Meckbach et al. Lung cancerin Mayak workers: interaction of smoking and pluto-nium exposure. Radiat. Environ. Biophys. 44(2): 119-129 (2005).
J11 Jacob, P., T.I. Bogdanova, E. Buglova et al. Thyroidcancer among Ukrainians and Belarussians who werechildren or adolescents at the time of the Chernobylaccident. J. Radiol. Prot. 26(1): 51-67 (2006).
J12 Jaffe, E.S., M. Raffeld, L.J. Medeiros et al. Anoverview of the classification of non-Hodgkin’s lym-phomas: an integration of morphological and pheno-typical concepts. Cancer Res. 52 (Suppl. 19):5447s-5452s (1992).
K1 Kleinerman, R.A., J.D. Boice Jr., H.H. Storm et al.Second primary cancer after treatment for cervicalcancer. Cancer 76(3): 442-452 (1995).
K2 Koshurnikova, N.A., E.S. Gilbert, N.S. Shilnikova etal. Studies on the Mayak nuclear workers: healtheffects. Radiat. Environ. Biophys. 41(1): 29-31(2002).
K3 Konogorov, A.P., V.K. Ivanov, S.Y. Chekin et al. Acase-control analysis of leukemia in accident emer-gency workers of Chernobyl. J. Environ. Pathol.Toxicol. Oncol. 19(1-2): 143-151 (2000).
K4 Kossenko, M.M. and M.O. Degteva. Cancer mortalityand radiation risk evaluation for the Techa river pop-ulation. Sci. Total Environ. 142(1-2): 73-89 (1994).
K5 Kossenko, M.M., E. Ostroumova, F. Granath et al.Studies on the Techa river offspring cohort: healtheffects. Radiat. Environ. Biophys. 41(1): 49-52(2002).
K6 Kossenko, M.M., D.L. Preston, L.Y. Krestinina et al.Studies on the extended Techa river cohort: cancerrisk estimation. Radiat. Environ. Biophys. 41(1): 45-48 (2002).
K7 Kingston, J. Thyroid cancer after neck irradiationduring childhood. Lancet 365(9476): 1986-1987(2005).
K8 Kreisheimer, M., N.A. Koshurnikova, E. Nekolla etal. Lung cancer mortality among male nuclear work-ers of the Mayak facilities in the former Soviet Union.Radiat. Res. 154(1): 3-11 (2000).
K9 Kaldor, J.M., N.E. Day, J. Bell et al. Lung cancer fol-lowing Hodgkin’s disease: a case-control study. Int. J.Cancer 52(5): 677-681 (1992).
K10 Khrouch, V.T., Y.I. Gavrilin, Y.O. Konstantinov et al.Characteristics of the radionuclides inhalation intake.p. 76-87 in: Medical Aspects of the ChernobylAccident at the ChNPP. Proceedings of theInternational Conference, Kiev, Ukraine, May 11-13,1988. Zodorovie Publishing House, Kiev, 1988.
K11 Kenigsberg, J., E. Buglova, J. Kruk et al. Thyroidcancer among children and adolescents of Belarus
UNSCEAR REPORT-PART 5.qxp 10/7/08 3:41 pm Page 302
exposed due to the Chernobyl accident: dose and riskassessment. p. 293-300 in: Chernobyl: Message for the21st Century (S. Yamashita, Y. Shibata, M. Hoshi etal., eds.). International Congress Series 1234.Amsterdam, 2002.
K12 Kusiak, R.A., J. Springer, A.C. Ritchie et al.Carcinoma of the lung in Ontario gold miners: possi-ble aetiological factors. Br. J. Ind. Med. 48(12): 808-817 (1991).
K13 Kossenko, M.M., M.O. Degteva, O.V. Vyushkova etal. Issues in the comparison of risk estimates for thepopulation in the Techa River region and atomic bombsurvivors. Radiat. Res. 148(1): 54-63 (1997).
K14 Karlsson, P., E. Holmberg, L.M. Lundberg et al.Intracranial tumors after radium treatment for skinhemangioma during infancy — a cohort and case-control study. Radiat. Res. 148(2): 161-167 (1997).
K15 Karlsson, P., E. Holmberg, M. Lundell et al.Intracranial tumors after exposure to ionizing radia-tion during infancy. A pooled analysis of two Swedishcohorts of 28,008 infants with skin hemangioma.Radiat. Res. 150(3): 357-364 (1998).
K16 Koshurnikova, N.A., N.S. Shilnikova, P.V. Okatenkoet al. Characteristics of the cohort of workers at theMayak nuclear complex. Radiat. Res. 152(4): 352-363(1999).
K17 Koshurnikova, N.A., M.G. Bolotnikova, L.A. Ilyin etal. Lung cancer risk due to exposure to incorporatedplutonium. Radiat. Res. 149(4): 366-371 (1998).
K18 Karlsson, P., E. Holmberg, A. Samuelsson et al. Softtissue sarcoma after treatment for breast cancer: aSwedish population-based study. Eur. J. Cancer34(13): 2068-2075 (1998).
K19 Kerber, R.A., J.E. Till, S.L. Simon et al. A cohortstudy of thyroid disease in relation to fallout fromnuclear weapons testing. J. Am. Med. Assoc. 270(17):2076-2082 (1993).
K20 Kaldor, J.M., N.E. Day, E.A. Clarke et al. Leukemiafollowing Hodgkin’s disease. N. Engl. J. Med. 322(1):7-13 (1990).
K21 Kleinerman, R.A., L.G. Littlefield, R.E. Tarone et al.Chromosome aberrations in lymphocytes from womenirradiated for benign and malignant gynecological dis-ease. Radiat. Res. 139(1): 40-46 (1994).
K22 Kodama, Y., D. Pawel, N. Nakamura et al. Stablechromosome aberrations in atomic bomb survivors:results from 25 years of investigation. Radiat. Res.156(4): 337-346 (2001).
K23 Krahenbuhl, M.P., D.M. Slaughter, J.L. Wilde et al.The historical and current application of the FIB-1model to assess organ dose from plutonium intakes inMayak workers. Health Phys. 82(4): 445-454 (2002).
K24 Khokhryakov, V.F., K.G. Suslova, V.V. Vostrotin etal. The development of the plutonium lung clearancemodel for exposure estimation of the Mayak produc-tion association, nuclear plant workers. Health Phys.82(4): 425-431 (2002).
K25 Kony, S.J., F. de Vathaire, A. Chompret et al.Radiation and genetic factors in the risk of second
malignant neoplasms after a first cancer in childhood.Lancet 350(9071): 91-95 (1997).
K26 Kuha, J. Corrections for exposure measurement error in logistic regression models with an applicationto nutritional data. Stat. Med. 13(11): 1135-1148(1994).
K27 Kendall, G.M., C.R. Muirhead, B.H. MacGibbon et al.Mortality and occupational exposure to radiation: firstanalysis of the National Registry for RadiationWorkers. Br. Med. J. 304(6821): 220-225 (1992).
K28 Kite, A.V. and A.R. Britcher. Uncertainties inrecorded photon radiation doses at Sellafield. Radiat.Prot. Dosim. 67(1): 23-32 (1996).
K29 Karagas, M.R., J.A. McDonald, E.R. Greenberg et al.Risk of basal cell and squamous cell skin cancers afterionizing radiation therapy. For the Skin CancerPrevention Study Group. J. Natl. Cancer Inst. 88(24):1848-1853 (1996).
K30 Kyle, R.A. and P.R. Greipp. Plasma cell dyscrasias:current status. Crit. Rev. Oncol. Hematol. 8(2): 93-152 (1988).
K31 Kaldor, J.M., N.E. Day, B. Kittelmann et al. Bladdertumours following chemotherapy and radiotherapy forovarian cancer: a case-control study. Int. J. Cancer63(1): 1-6 (1995).
K32 Kinlen, L.J. Leukaemia. p. 475-491 in: CancerSurveys. Trends in Cancer Incidence and Mortality,Volumes 19/20 (R. Doll et al., eds.). Cold SpringHarbor Laboratory Press, Imperial Cancer ResearchFund, 1994.
K33 Kinlen, L.J. Incidence of cancer in rheumatoid arthritis and other disorders after immunosuppressivetherapy. Am. J. Med. 78(1A): 44-49 (1985).
K34 Kreisheimer, M., M.E. Sokolnikov, N.A.Koshurnikova et al. Lung cancer mortality amongnuclear workers of the Mayak facilities in the formerSoviet Union: an updated analysis considering smok-ing as the main confounding factor. Radiat. Environ.Biophys. 42(2): 129-135 (2003).
K35 Kopecky, K.J., E. Nakashima, T. Yamamoto et al.Lung cancer, radiation and smoking among A-bombsurvivors, Hiroshima and Nagasaki. RERF TR 13-86(1986).
K36 Kono, S. and T. Hirohata. Nutrition and stomachcancer. Cancer Causes Control 7(1): 41-55 (1996).
K37 Kreuzer, M., A. Brachner, F. Lehmann et al.Characteristics of the German uranium miners cohortstudy. Health Phys. 83(1): 26-34 (2002).
K38 Krewski, D., J.H. Lubin, J.M. Zielinski et al.Residential radon and risk of lung cancer: a combinedanalysis of 7 North American case-control studies.Epidemiology 16(2): 137-145 (2005).
K39 Krewski, D., J. Lubin, J. Zielinski et al. A combinedanalysis of North American case-control studies ofresidential radon and lung cancer. J. Toxicol. Environ.Health 69(7-8): 533-597 (2006).
K40 Kaiser, J.C., W.F. Heidenreich, G. Monchaux et al.Lung tumour risk in radon-exposed rats from different experiments: comparative analysis with
ANNEX A: EPIDEMIOLOGICAL STUDIES OF RADIATION AND CANCER 303
UNSCEAR REPORT-PART 5.qxp 10/7/08 3:41 pm Page 303
304 UNSCEAR 2006 REPORT: VOLUME I
biologically based models. Radiat. Environ. Biophys.43(3): 189-201 (2004).
K41 Kaul, A. and W. Noffz. Tissue dose in thorotrastpatients. Health Phys. 35(1): 113-121 (1978).
K42 Kaul, A. Biokinetic models and data. p. 53-67 in:Health Effects of Internally Deposited Radionuclides:Emphasis on Radium and Thorium (G. van Kaick etal., eds.). World Scientific, Singapore, 1995.
K43 Kleinerman, R.A., M.A. Tucker, R.E. Tarone et al.Risk of new cancers after radiotherapy in long-termsurvivors of retinoblastoma: an extended follow-up. J.Clin. Oncol. 23(10): 2272-2279 (2005).
K44 Kelsey, J.L. and N.G. Hildreth. Breast andGynecologic Cancer Epidemiology. CRC Press, BocaRaton, FL, 1983.
K45 Key, T., P. Appleby, I. Barnes et al. Endogenous sexhormones and breast cancer in postmenopausalwomen: reanalysis of nine prospective studies. J. Natl.Cancer Inst. 94(8): 606-616 (2002).
K46 Koshurnikova, N.A., E.S. Gilbert, M. Sokolnikov etal. Bone cancers in Mayak workers. Radiat. Res.154(3): 237-245 (2000).
K47 Kaletsch, U., P. Kaatsch, R. Meinert et al. Childhoodcancer and residential radon exposure — results of apopulation-based case-control study in Lower Saxony(Germany). Radiat. Environ. Biophys. 38(3): 211-215(1999).
K48 Kido, C., F. Sasaki, Y. Hirota et al. Cancer mortalityof thorotrast patients in Japan: the second seriesupdated 1998. Radiat. Res. 152 (Suppl. 6): S81-S83(1999).
K49 Kossenko, M.M., T.L. Thomas, A.V. Akleyev et al.The Techa River cohort: study design and follow-upmethods. Radiat. Res. 164(5): 591-601 (2005).
K50 Krestinina, L.Y., D.L. Preston, E.V. Ostroumova et al.Protracted radiation exposure and cancer mortality inthe Techa River cohort. Radiat. Res. 164(5): 602-611(2005).
K51 Krain, L.S. The rising incidence of carcinoma of thepancreas — real or apparent? J. Surg. Oncol. 2(2):115-124 (1970).
K52 Kofler, A. Factors related to latent period. In: Radiationand Thyroid Cancer. Proceedings of an InternalSeminar held in St. John’s College, Cambridge, UK,20-23 July 1998 (G. Thomas, A. Karaoglou and E.D.Williams, eds.). World Scientific, Singapore, 1999.
K53 Kazakov, V.S., E.P. Demidchik and L.N. Astakhova.Thyroid cancer after Chernobyl. Nature 359(6390): 21(1992).
K54 Kellerer, A.M. and H.H. Rossi. A generalized formu-lation of dual radiation action. Radiat. Res. 75(3): 471-488 (1978).
K55 Kojo, K., E. Pukkala and A. Auvinen. Breast cancerrisk among Finnish cabin attendants: a nested case-control study. Occup. Environ. Med. 62(7): 488-493(2005).
K56 Kurttio, P., L. Salonen, T. Ilus et al. Well waterradioactivity and risk of cancers of the urinary organs.Environ. Res. 102(3): 333-338 (2006).
K57 Kleinerman, R.A., C. Kosary and A. Hildesheim. Newmalignancies following cancer of the cervix uteri,vagina, and vulva. p. 207-230 in: New MalignanciesAmong Cancer Survivors: SEER Cancer Registries,1973-2000 (R.E. Curtis, D.M. Freedman, E. Ron etal., eds.). NIH Publication No. 05-5302 (2006).
K58 Kurttio, P., A. Auvinen, L. Salonen et al. Renal effectsof uranium in drinking water. Environ. HealthPerspect. 110(4): 337--342 (2002). Erratum in:Environ. Health Perspect. 111: 632 (2003).
K59 Kurttio, P., A. Harmoinen, H. Saha et al. Kidney tox-icity of ingested uranium from drinking water. Am. J.Kidney Dis. 47(6): 972-982 (2006).
K60 Kato, K., S. Antoku, S. Sawada et al. Organ dosesreceived by atomic bomb survivors during radiologi-cal examinations at the Radiation Effects ResearchFoundation. Br. J. Radiol. 64(764): 720-727 (1991).
K61 Kato, K., S. Antoku, K. Kodama et al. Organ dosesfrom radiotherapy in atomic bomb survivors. Radiat.Res. 155(6): 785-795 (2001).
L1 Lagarde, F., G. Pershagen, G. Åkerblom et al.Residential radon and lung cancer in Sweden: riskanalysis accounting for random error in the exposureassessment. Health Phys. 72(2): 269-276 (1997).
L2 Licciardone, J.C., R.C. Brownson, J.C. Chang et al.Uterine cervical cancer risk in cigarette smokers: a meta-analytic study. Am. J. Prev. Med. 6(5): 274-281 (1990).
L3 Land, C.E. Estimating cancer risks from low doses ofionizing radiation. Science 209(4462): 1197-1203(1980).
L4 Lindberg, S., P. Karlsson, B. Arvidsson et al. Cancerincidence after radiotherapy for skin haemangiomaduring infancy. Acta Oncol. 34(6): 735-740 (1995).
L5 Little, M.P. and J.D. Boice Jr. Comparison of breastcancer incidence in the Massachusetts tuberculosis flu-oroscopy cohort and in the Japanese atomic bomb sur-vivors. Radiat. Res. 151(2): 218-224 (1999).
L6 Lundell, M. and L.-E. Holm. Mortality from leukemiaafter irradiation in infancy for skin hemangioma.Radiat. Res. 145(5): 595-601 (1996).
L7 Lundell, M., A. Mattsson, T. Hakulinen et al. Breastcancer after radiotherapy for skin hemangioma ininfancy. Radiat. Res. 145(2): 225-230 (1996).
L8 Lubin, J.H., J.D. Boice Jr., C. Edling et al. Lungcancer in radon-exposed miners and estimation of riskfrom indoor exposure. J. Natl. Cancer Inst. 87(11):817-827 (1995).
L9 Little, M.P., C.R. Muirhead, R.G.E. Haylock et al.Relative risks of radiation-associated cancer: compar-ison of second cancer in therapeutically irradiatedpopulations with the Japanese atomic bomb survivors.Radiat. Environ. Biophys. 38(4): 267-283 (1999).
L10 Lundell, M. and L-E. Holm. Risk of solid tumors afterirradiation in infancy. Acta Oncol. 34(6): 727-734(1995).
L11 Linet, M.S., D.M. Freedman, A.K. Mohan et al.Incidence of haematopoietic malignancies in US radi-ologic technologists. Occup. Environ. Med. 62(12):861-867 (2005).
UNSCEAR REPORT-PART 5.qxp 10/7/08 3:41 pm Page 304
L12 Lundell, M., A. Mattsson, P. Karlsson et al. Breastcancer risk after radiotherapy in infancy: a pooledanalysis of two Swedish cohorts of 17,202 infants.Radiat. Res. 151(5): 626-632 (1999).
L13 Lundell, M., T. Hakulinen and L-E. Holm. Thyroidcancer after radiotherapy for skin hemangioma ininfancy. Radiat. Res. 140(3): 334-339 (1994).
L14 Lloyd, D.C. and A.A. Edwards. Communication to theUNSCEAR Secretariat (2005).
L15 Little, M.P., M.M. Hawkins, M.W. Charles et al.Fitting the Armitage–Doll model to radiation-exposedcohorts and implications for population cancer risks.Radiat. Res. 132(2): 207-221 (1992). Erratum in:Radiat. Res. 137(1): 124-128 (1994).
L16 Little, M.P., F. de Vathaire, M.W. Charles et al.Variations with time and age in the relative risks ofsolid cancer incidence after radiation exposure. J. Radiol. Prot. 17(3): 159-177 (1997).
L17 Little, M.P., I. Deltour and S. Richardson. Projectionof cancer risks from the Japanese atomic bomb sur-vivors to the England and Wales population takinginto account uncertainty in risk parameters. Radiat.Environ. Biophys. 39(4): 241-252 (2000). Erratum in:Radiat. Environ. Biophys. 40(3): 236 (2001).
L18 Littlefield, L.G., A.F. McFee, S.I. Salomaa et al. Dorecorded doses overestimate true doses received byChernobyl cleanup workers? Results of cytogeneticanalyses of Estonian workers by fluorescence in situhybridization. Radiat. Res. 150(2): 237-249 (1998).
L19 Lindholm, C. and A. Edwards. Long-term persistenceof translocations in stable lymphocytes from victimsof a radiological accident. Int. J. Radiat. Biol. 80(8):559-566 (2004).
L20 Little, M.P. Comparison of the risks of cancer inci-dence and mortality following radiation therapy forbenign and malignant disease with the cancer risksobserved in the Japanese A-bomb survivors. Int. J. Radiat. Biol. 77(4): 431-464 (2001). Erratum in: Int.J. Radiat. Biol. 77(6): 745-760 (2001).
L21 Little, M.P., C.R. Muirhead and M.W. Charles.Describing time and age variations in the risk of radi-ation-induced solid tumour incidence in the Japaneseatomic bomb survivors using generalized relative andabsolute risk models. Stat. Med. 18(1): 17-33 (1999).
L22 Leenhouts, H.P. and K.H. Chadwick. A two-mutationmodel of radiation carcinogenesis: application to lungtumours in rodents and implications for risk evalua-tion. J. Radiol. Prot. 14(2): 115-130 (1994).
L23 Little, M.P. Cancer after exposure to radiation in thecourse of treatment for benign and malignant disease.Lancet Oncol. 2(4): 212-220 (2001).
L24 Little, M.P., F. de Vathaire, A. Shamsaldin et al. Risksof brain tumour following treatment for cancer inchildhood: modification by genetic factors, radio-therapy and chemotherapy. Int. J. Cancer 78(3): 269-275 (1998).
L25 Little, M.P. Are two mutations sufficient to causecancer? Some generalizations of the two-mutationmodel of carcinogenesis of Moolgavkar, Venzon, and
Knudson, and of the multistage model of Armitageand Doll. Biometrics 51(4): 1278-1291 (1995).
L26 Little, M.P. and E.G. Wright. A stochastic carcino-genesis model incorporating genomic instability fittedto colon cancer data. Math. Biosci. 183(2): 111-134(2003).
L27 Little, M.P. Generalisations of the two-mutation andclassical multi-stage models of carcinogenesis fitted tothe Japanese atomic bomb survivor data. J. Radiol.Prot. 16(1): 7-24 (1996).
L28 Little, M.P. Estimates of neutron relative biologicaleffectiveness derived from the Japanese atomic bombsurvivors. Int. J. Radiat. Biol. 72(6): 715-726 (1997).
L29 Little, M.P. and C.R. Muirhead. Evidence for curvi-linearity in the cancer incidence dose-response in theJapanese atomic bomb survivors. Int. J. Radiat. Biol.70(1): 83-94 (1996).
L30 Little, M.P. and M.W. Charles. The risk of non-melanoma skin cancer incidence in the Japaneseatomic bomb survivors. Int. J. Radiat. Biol. 71(5):589-602 (1997).
L31 Little, M.P., H.A. Weiss, J.D. Boice Jr. et al. Risksof leukemia in Japanese atomic bomb survivors, inwomen treated for cervical cancer, and in patientstreated for ankylosing spondylitis. Radiat. Res. 152(3):280-292 (1999); and 153(2): 243 (2000).
L32 Little, M.P. Threshold and other departures fromlinear-quadratic curvature in the non-cancer mortalitydose-response curve in the Japanese atomic bomb sur-vivors. Radiat. Environ. Biophys. 43(2): 67-75 (2004).
L33 Little, M.P. and C.R. Muirhead. Curvilinearity in thedose-response curve for cancer in Japanese atomicbomb survivors. Environ. Health Perspect. 105 (Suppl.6): 1505-1509 (1997).
L34 Little, M.P. and C.R. Muirhead. Absence of evidencefor threshold departures from linear-quadratic curva-ture in the Japanese A-bomb cancer incidence andmortality data. Int. J. Low Radiat. 1(2): 242-255(2004).
L35 Little, M.P. and C.R. Muirhead. Curvature in thecancer mortality dose response in Japanese atomicbomb survivors: absence of evidence of threshold. Int.J. Radiat. Biol. 74(4): 471-480 (1998).
L36 Little, M.P. Comments on “Threshold models in radi-ation carcinogenesis” by D.G. Hoel and P. Li (Letterto the editor). Health Phys. 76(4): 432-434 (1999).
L37 Little, M.P. and C.R. Muirhead. Derivation of low-dose extrapolation factors from analysis of curvaturein the cancer incidence dose response in Japaneseatomic bomb survivors. Int. J. Radiat. Biol. 76(7):939-953 (2000).
L38 Langholz, B. and L. Goldstein. Conditional logisticanalysis of case-control studies with complex sampling. Biostatistics 2(1): 63-84 (2001).
L39 Little, M.P. Comparisons of lung tumour mortalityrisk in the Japanese A-bomb survivors and in theColorado Plateau uranium miners: support for theICRP lung model. Int. J. Radiat. Biol. 78(3): 145-163(2002).
ANNEX A: EPIDEMIOLOGICAL STUDIES OF RADIATION AND CANCER 305
UNSCEAR REPORT-PART 5.qxp 10/7/08 3:41 pm Page 305
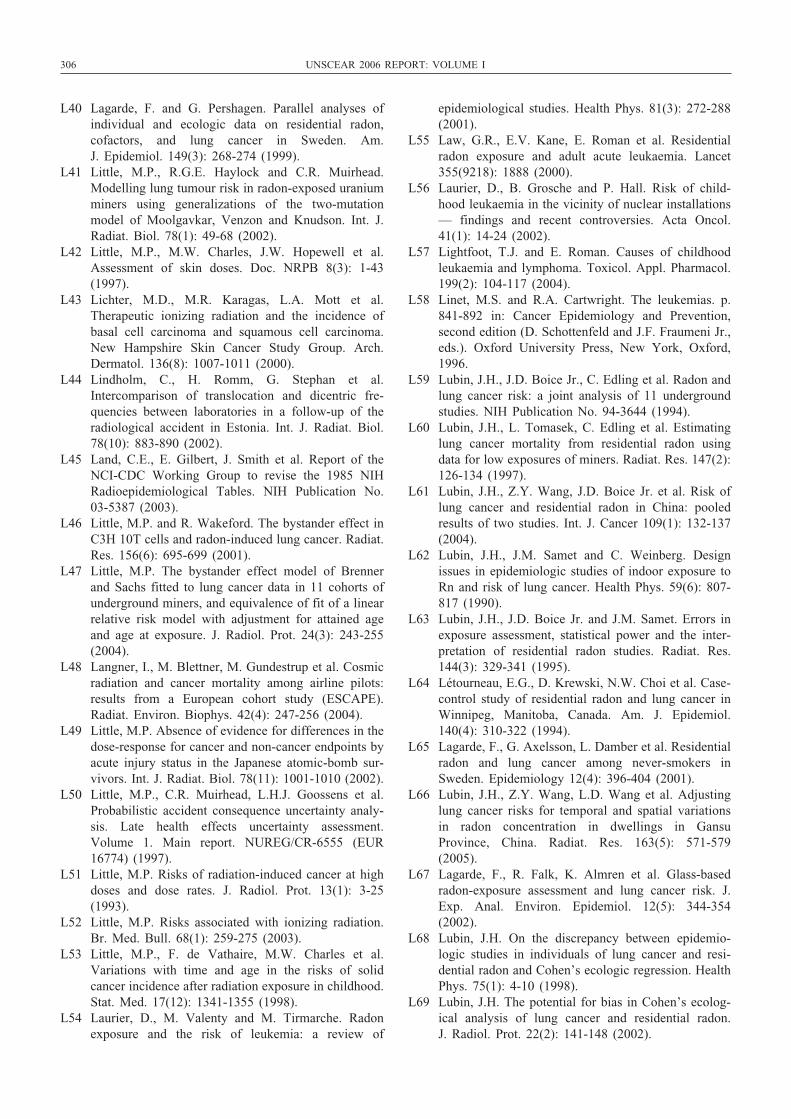
306 UNSCEAR 2006 REPORT: VOLUME I
L40 Lagarde, F. and G. Pershagen. Parallel analyses ofindividual and ecologic data on residential radon,cofactors, and lung cancer in Sweden. Am. J. Epidemiol. 149(3): 268-274 (1999).
L41 Little, M.P., R.G.E. Haylock and C.R. Muirhead.Modelling lung tumour risk in radon-exposed uraniumminers using generalizations of the two-mutationmodel of Moolgavkar, Venzon and Knudson. Int. J.Radiat. Biol. 78(1): 49-68 (2002).
L42 Little, M.P., M.W. Charles, J.W. Hopewell et al.Assessment of skin doses. Doc. NRPB 8(3): 1-43(1997).
L43 Lichter, M.D., M.R. Karagas, L.A. Mott et al.Therapeutic ionizing radiation and the incidence ofbasal cell carcinoma and squamous cell carcinoma.New Hampshire Skin Cancer Study Group. Arch.Dermatol. 136(8): 1007-1011 (2000).
L44 Lindholm, C., H. Romm, G. Stephan et al.Intercomparison of translocation and dicentric fre-quencies between laboratories in a follow-up of theradiological accident in Estonia. Int. J. Radiat. Biol.78(10): 883-890 (2002).
L45 Land, C.E., E. Gilbert, J. Smith et al. Report of theNCI-CDC Working Group to revise the 1985 NIHRadioepidemiological Tables. NIH Publication No.03-5387 (2003).
L46 Little, M.P. and R. Wakeford. The bystander effect inC3H 10T cells and radon-induced lung cancer. Radiat.Res. 156(6): 695-699 (2001).
L47 Little, M.P. The bystander effect model of Brennerand Sachs fitted to lung cancer data in 11 cohorts ofunderground miners, and equivalence of fit of a linearrelative risk model with adjustment for attained ageand age at exposure. J. Radiol. Prot. 24(3): 243-255(2004).
L48 Langner, I., M. Blettner, M. Gundestrup et al. Cosmicradiation and cancer mortality among airline pilots:results from a European cohort study (ESCAPE).Radiat. Environ. Biophys. 42(4): 247-256 (2004).
L49 Little, M.P. Absence of evidence for differences in thedose-response for cancer and non-cancer endpoints byacute injury status in the Japanese atomic-bomb sur-vivors. Int. J. Radiat. Biol. 78(11): 1001-1010 (2002).
L50 Little, M.P., C.R. Muirhead, L.H.J. Goossens et al.Probabilistic accident consequence uncertainty analy-sis. Late health effects uncertainty assessment.Volume 1. Main report. NUREG/CR-6555 (EUR16774) (1997).
L51 Little, M.P. Risks of radiation-induced cancer at highdoses and dose rates. J. Radiol. Prot. 13(1): 3-25(1993).
L52 Little, M.P. Risks associated with ionizing radiation.Br. Med. Bull. 68(1): 259-275 (2003).
L53 Little, M.P., F. de Vathaire, M.W. Charles et al.Variations with time and age in the risks of solidcancer incidence after radiation exposure in childhood.Stat. Med. 17(12): 1341-1355 (1998).
L54 Laurier, D., M. Valenty and M. Tirmarche. Radonexposure and the risk of leukemia: a review of
epidemiological studies. Health Phys. 81(3): 272-288(2001).
L55 Law, G.R., E.V. Kane, E. Roman et al. Residentialradon exposure and adult acute leukaemia. Lancet355(9218): 1888 (2000).
L56 Laurier, D., B. Grosche and P. Hall. Risk of child-hood leukaemia in the vicinity of nuclear installations— findings and recent controversies. Acta Oncol.41(1): 14-24 (2002).
L57 Lightfoot, T.J. and E. Roman. Causes of childhoodleukaemia and lymphoma. Toxicol. Appl. Pharmacol.199(2): 104-117 (2004).
L58 Linet, M.S. and R.A. Cartwright. The leukemias. p.841-892 in: Cancer Epidemiology and Prevention,second edition (D. Schottenfeld and J.F. Fraumeni Jr.,eds.). Oxford University Press, New York, Oxford,1996.
L59 Lubin, J.H., J.D. Boice Jr., C. Edling et al. Radon andlung cancer risk: a joint analysis of 11 undergroundstudies. NIH Publication No. 94-3644 (1994).
L60 Lubin, J.H., L. Tomasek, C. Edling et al. Estimatinglung cancer mortality from residential radon usingdata for low exposures of miners. Radiat. Res. 147(2):126-134 (1997).
L61 Lubin, J.H., Z.Y. Wang, J.D. Boice Jr. et al. Risk oflung cancer and residential radon in China: pooledresults of two studies. Int. J. Cancer 109(1): 132-137(2004).
L62 Lubin, J.H., J.M. Samet and C. Weinberg. Designissues in epidemiologic studies of indoor exposure toRn and risk of lung cancer. Health Phys. 59(6): 807-817 (1990).
L63 Lubin, J.H., J.D. Boice Jr. and J.M. Samet. Errors inexposure assessment, statistical power and the inter-pretation of residential radon studies. Radiat. Res.144(3): 329-341 (1995).
L64 Létourneau, E.G., D. Krewski, N.W. Choi et al. Case-control study of residential radon and lung cancer inWinnipeg, Manitoba, Canada. Am. J. Epidemiol.140(4): 310-322 (1994).
L65 Lagarde, F., G. Axelsson, L. Damber et al. Residentialradon and lung cancer among never-smokers inSweden. Epidemiology 12(4): 396-404 (2001).
L66 Lubin, J.H., Z.Y. Wang, L.D. Wang et al. Adjustinglung cancer risks for temporal and spatial variationsin radon concentration in dwellings in GansuProvince, China. Radiat. Res. 163(5): 571-579(2005).
L67 Lagarde, F., R. Falk, K. Almren et al. Glass-basedradon-exposure assessment and lung cancer risk. J.Exp. Anal. Environ. Epidemiol. 12(5): 344-354(2002).
L68 Lubin, J.H. On the discrepancy between epidemio-logic studies in individuals of lung cancer and resi-dential radon and Cohen’s ecologic regression. HealthPhys. 75(1): 4-10 (1998).
L69 Lubin, J.H. The potential for bias in Cohen’s ecolog-ical analysis of lung cancer and residential radon. J. Radiol. Prot. 22(2): 141-148 (2002).
UNSCEAR REPORT-PART 5.qxp 10/7/08 3:41 pm Page 306
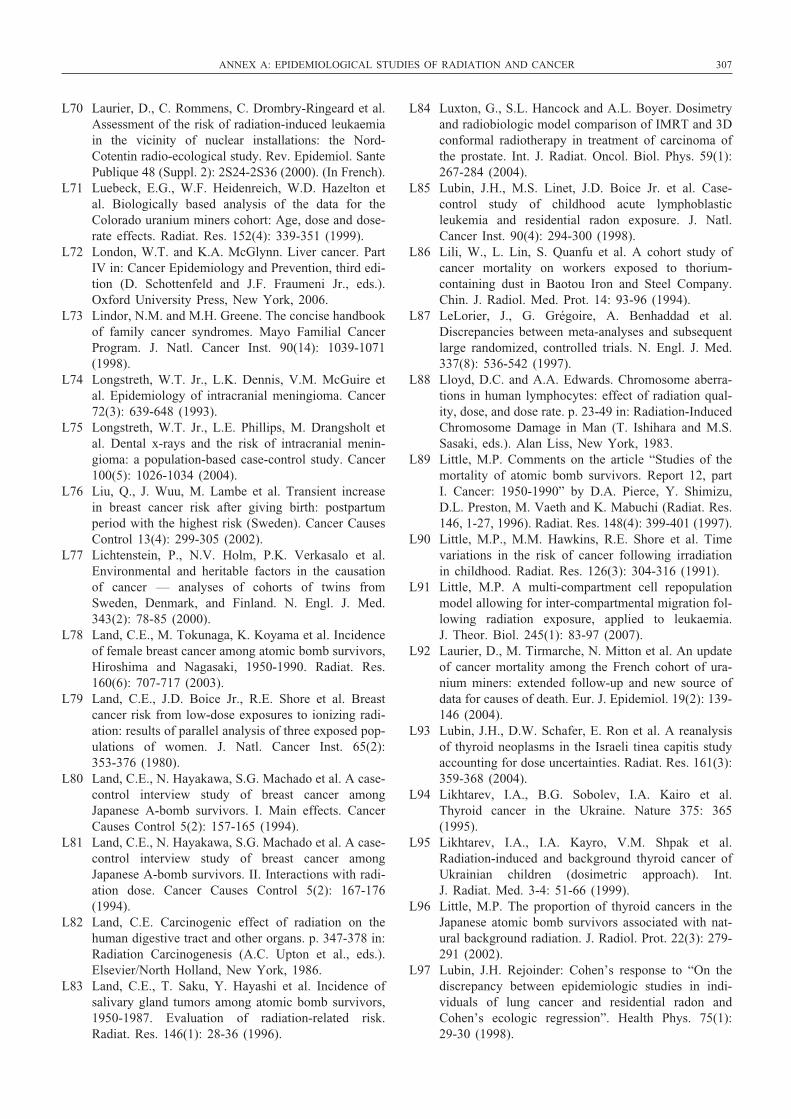
L70 Laurier, D., C. Rommens, C. Drombry-Ringeard et al.Assessment of the risk of radiation-induced leukaemiain the vicinity of nuclear installations: the Nord-Cotentin radio-ecological study. Rev. Epidemiol. SantePublique 48 (Suppl. 2): 2S24-2S36 (2000). (In French).
L71 Luebeck, E.G., W.F. Heidenreich, W.D. Hazelton etal. Biologically based analysis of the data for theColorado uranium miners cohort: Age, dose and dose-rate effects. Radiat. Res. 152(4): 339-351 (1999).
L72 London, W.T. and K.A. McGlynn. Liver cancer. PartIV in: Cancer Epidemiology and Prevention, third edi-tion (D. Schottenfeld and J.F. Fraumeni Jr., eds.).Oxford University Press, New York, 2006.
L73 Lindor, N.M. and M.H. Greene. The concise handbookof family cancer syndromes. Mayo Familial CancerProgram. J. Natl. Cancer Inst. 90(14): 1039-1071(1998).
L74 Longstreth, W.T. Jr., L.K. Dennis, V.M. McGuire etal. Epidemiology of intracranial meningioma. Cancer72(3): 639-648 (1993).
L75 Longstreth, W.T. Jr., L.E. Phillips, M. Drangsholt etal. Dental x-rays and the risk of intracranial menin-gioma: a population-based case-control study. Cancer100(5): 1026-1034 (2004).
L76 Liu, Q., J. Wuu, M. Lambe et al. Transient increasein breast cancer risk after giving birth: postpartumperiod with the highest risk (Sweden). Cancer CausesControl 13(4): 299-305 (2002).
L77 Lichtenstein, P., N.V. Holm, P.K. Verkasalo et al.Environmental and heritable factors in the causationof cancer — analyses of cohorts of twins fromSweden, Denmark, and Finland. N. Engl. J. Med.343(2): 78-85 (2000).
L78 Land, C.E., M. Tokunaga, K. Koyama et al. Incidenceof female breast cancer among atomic bomb survivors,Hiroshima and Nagasaki, 1950-1990. Radiat. Res.160(6): 707-717 (2003).
L79 Land, C.E., J.D. Boice Jr., R.E. Shore et al. Breastcancer risk from low-dose exposures to ionizing radi-ation: results of parallel analysis of three exposed pop-ulations of women. J. Natl. Cancer Inst. 65(2):353-376 (1980).
L80 Land, C.E., N. Hayakawa, S.G. Machado et al. A case-control interview study of breast cancer amongJapanese A-bomb survivors. I. Main effects. CancerCauses Control 5(2): 157-165 (1994).
L81 Land, C.E., N. Hayakawa, S.G. Machado et al. A case-control interview study of breast cancer amongJapanese A-bomb survivors. II. Interactions with radi-ation dose. Cancer Causes Control 5(2): 167-176(1994).
L82 Land, C.E. Carcinogenic effect of radiation on thehuman digestive tract and other organs. p. 347-378 in:Radiation Carcinogenesis (A.C. Upton et al., eds.).Elsevier/North Holland, New York, 1986.
L83 Land, C.E., T. Saku, Y. Hayashi et al. Incidence ofsalivary gland tumors among atomic bomb survivors,1950-1987. Evaluation of radiation-related risk.Radiat. Res. 146(1): 28-36 (1996).
L84 Luxton, G., S.L. Hancock and A.L. Boyer. Dosimetryand radiobiologic model comparison of IMRT and 3Dconformal radiotherapy in treatment of carcinoma ofthe prostate. Int. J. Radiat. Oncol. Biol. Phys. 59(1):267-284 (2004).
L85 Lubin, J.H., M.S. Linet, J.D. Boice Jr. et al. Case-control study of childhood acute lymphoblasticleukemia and residential radon exposure. J. Natl.Cancer Inst. 90(4): 294-300 (1998).
L86 Lili, W., L. Lin, S. Quanfu et al. A cohort study ofcancer mortality on workers exposed to thorium-containing dust in Baotou Iron and Steel Company.Chin. J. Radiol. Med. Prot. 14: 93-96 (1994).
L87 LeLorier, J., G. Grégoire, A. Benhaddad et al.Discrepancies between meta-analyses and subsequentlarge randomized, controlled trials. N. Engl. J. Med.337(8): 536-542 (1997).
L88 Lloyd, D.C. and A.A. Edwards. Chromosome aberra-tions in human lymphocytes: effect of radiation qual-ity, dose, and dose rate. p. 23-49 in: Radiation-InducedChromosome Damage in Man (T. Ishihara and M.S.Sasaki, eds.). Alan Liss, New York, 1983.
L89 Little, M.P. Comments on the article “Studies of themortality of atomic bomb survivors. Report 12, partI. Cancer: 1950-1990” by D.A. Pierce, Y. Shimizu,D.L. Preston, M. Vaeth and K. Mabuchi (Radiat. Res.146, 1-27, 1996). Radiat. Res. 148(4): 399-401 (1997).
L90 Little, M.P., M.M. Hawkins, R.E. Shore et al. Timevariations in the risk of cancer following irradiationin childhood. Radiat. Res. 126(3): 304-316 (1991).
L91 Little, M.P. A multi-compartment cell repopulationmodel allowing for inter-compartmental migration fol-lowing radiation exposure, applied to leukaemia. J. Theor. Biol. 245(1): 83-97 (2007).
L92 Laurier, D., M. Tirmarche, N. Mitton et al. An updateof cancer mortality among the French cohort of ura-nium miners: extended follow-up and new source ofdata for causes of death. Eur. J. Epidemiol. 19(2): 139-146 (2004).
L93 Lubin, J.H., D.W. Schafer, E. Ron et al. A reanalysisof thyroid neoplasms in the Israeli tinea capitis studyaccounting for dose uncertainties. Radiat. Res. 161(3):359-368 (2004).
L94 Likhtarev, I.A., B.G. Sobolev, I.A. Kairo et al.Thyroid cancer in the Ukraine. Nature 375: 365(1995).
L95 Likhtarev, I.A., I.A. Kayro, V.M. Shpak et al.Radiation-induced and background thyroid cancer ofUkrainian children (dosimetric approach). Int. J. Radiat. Med. 3-4: 51-66 (1999).
L96 Little, M.P. The proportion of thyroid cancers in theJapanese atomic bomb survivors associated with nat-ural background radiation. J. Radiol. Prot. 22(3): 279-291 (2002).
L97 Lubin, J.H. Rejoinder: Cohen’s response to “On thediscrepancy between epidemiologic studies in indi-viduals of lung cancer and residential radon andCohen’s ecologic regression”. Health Phys. 75(1): 29-30 (1998).
ANNEX A: EPIDEMIOLOGICAL STUDIES OF RADIATION AND CANCER 307
UNSCEAR REPORT-PART 5.qxp 10/7/08 3:41 pm Page 307
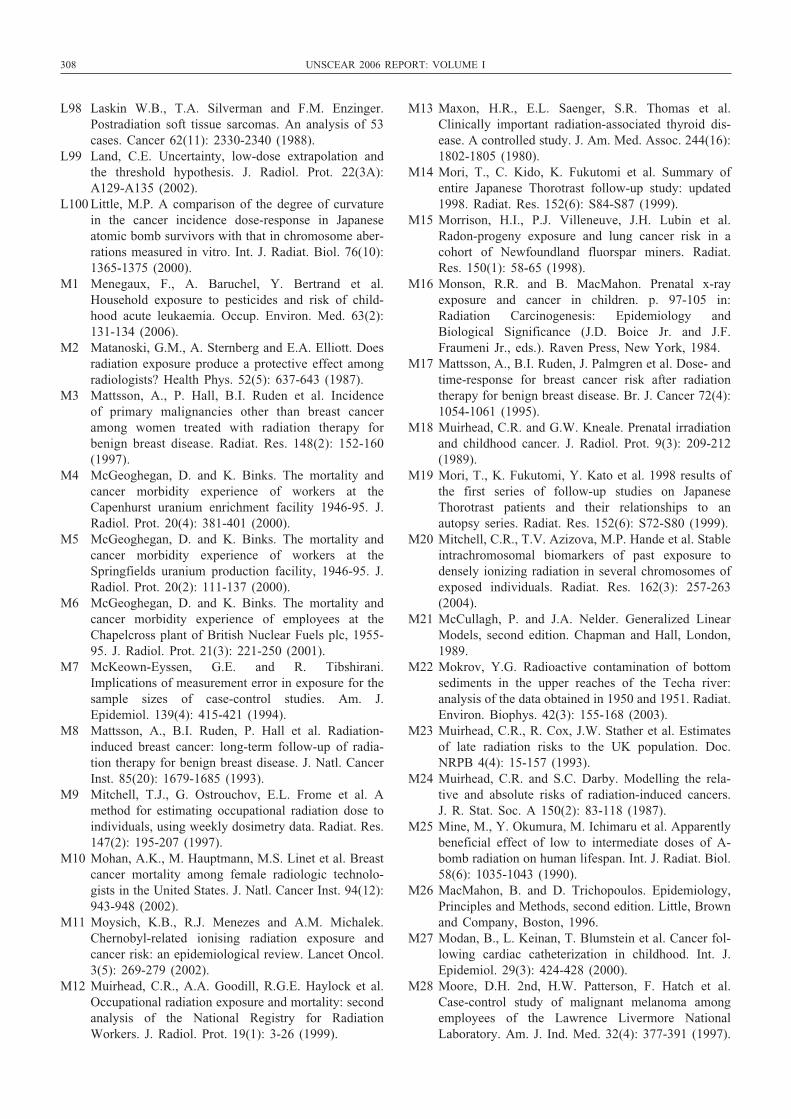
308 UNSCEAR 2006 REPORT: VOLUME I
L98 Laskin W.B., T.A. Silverman and F.M. Enzinger.Postradiation soft tissue sarcomas. An analysis of 53cases. Cancer 62(11): 2330-2340 (1988).
L99 Land, C.E. Uncertainty, low-dose extrapolation andthe threshold hypothesis. J. Radiol. Prot. 22(3A):A129-A135 (2002).
L100 Little, M.P. A comparison of the degree of curvaturein the cancer incidence dose-response in Japaneseatomic bomb survivors with that in chromosome aber-rations measured in vitro. Int. J. Radiat. Biol. 76(10):1365-1375 (2000).
M1 Menegaux, F., A. Baruchel, Y. Bertrand et al.Household exposure to pesticides and risk of child-hood acute leukaemia. Occup. Environ. Med. 63(2):131-134 (2006).
M2 Matanoski, G.M., A. Sternberg and E.A. Elliott. Doesradiation exposure produce a protective effect amongradiologists? Health Phys. 52(5): 637-643 (1987).
M3 Mattsson, A., P. Hall, B.I. Ruden et al. Incidence of primary malignancies other than breast canceramong women treated with radiation therapy forbenign breast disease. Radiat. Res. 148(2): 152-160(1997).
M4 McGeoghegan, D. and K. Binks. The mortality andcancer morbidity experience of workers at theCapenhurst uranium enrichment facility 1946-95. J.Radiol. Prot. 20(4): 381-401 (2000).
M5 McGeoghegan, D. and K. Binks. The mortality andcancer morbidity experience of workers at theSpringfields uranium production facility, 1946-95. J.Radiol. Prot. 20(2): 111-137 (2000).
M6 McGeoghegan, D. and K. Binks. The mortality andcancer morbidity experience of employees at theChapelcross plant of British Nuclear Fuels plc, 1955-95. J. Radiol. Prot. 21(3): 221-250 (2001).
M7 McKeown-Eyssen, G.E. and R. Tibshirani.Implications of measurement error in exposure for thesample sizes of case-control studies. Am. J.Epidemiol. 139(4): 415-421 (1994).
M8 Mattsson, A., B.I. Ruden, P. Hall et al. Radiation-induced breast cancer: long-term follow-up of radia-tion therapy for benign breast disease. J. Natl. CancerInst. 85(20): 1679-1685 (1993).
M9 Mitchell, T.J., G. Ostrouchov, E.L. Frome et al. Amethod for estimating occupational radiation dose toindividuals, using weekly dosimetry data. Radiat. Res.147(2): 195-207 (1997).
M10 Mohan, A.K., M. Hauptmann, M.S. Linet et al. Breastcancer mortality among female radiologic technolo-gists in the United States. J. Natl. Cancer Inst. 94(12):943-948 (2002).
M11 Moysich, K.B., R.J. Menezes and A.M. Michalek.Chernobyl-related ionising radiation exposure andcancer risk: an epidemiological review. Lancet Oncol.3(5): 269-279 (2002).
M12 Muirhead, C.R., A.A. Goodill, R.G.E. Haylock et al.Occupational radiation exposure and mortality: secondanalysis of the National Registry for RadiationWorkers. J. Radiol. Prot. 19(1): 3-26 (1999).
M13 Maxon, H.R., E.L. Saenger, S.R. Thomas et al.Clinically important radiation-associated thyroid dis-ease. A controlled study. J. Am. Med. Assoc. 244(16):1802-1805 (1980).
M14 Mori, T., C. Kido, K. Fukutomi et al. Summary ofentire Japanese Thorotrast follow-up study: updated1998. Radiat. Res. 152(6): S84-S87 (1999).
M15 Morrison, H.I., P.J. Villeneuve, J.H. Lubin et al.Radon-progeny exposure and lung cancer risk in acohort of Newfoundland fluorspar miners. Radiat.Res. 150(1): 58-65 (1998).
M16 Monson, R.R. and B. MacMahon. Prenatal x-rayexposure and cancer in children. p. 97-105 in:Radiation Carcinogenesis: Epidemiology andBiological Significance (J.D. Boice Jr. and J.F.Fraumeni Jr., eds.). Raven Press, New York, 1984.
M17 Mattsson, A., B.I. Ruden, J. Palmgren et al. Dose- andtime-response for breast cancer risk after radiationtherapy for benign breast disease. Br. J. Cancer 72(4):1054-1061 (1995).
M18 Muirhead, C.R. and G.W. Kneale. Prenatal irradiationand childhood cancer. J. Radiol. Prot. 9(3): 209-212(1989).
M19 Mori, T., K. Fukutomi, Y. Kato et al. 1998 results ofthe first series of follow-up studies on JapaneseThorotrast patients and their relationships to anautopsy series. Radiat. Res. 152(6): S72-S80 (1999).
M20 Mitchell, C.R., T.V. Azizova, M.P. Hande et al. Stableintrachromosomal biomarkers of past exposure todensely ionizing radiation in several chromosomes ofexposed individuals. Radiat. Res. 162(3): 257-263(2004).
M21 McCullagh, P. and J.A. Nelder. Generalized LinearModels, second edition. Chapman and Hall, London,1989.
M22 Mokrov, Y.G. Radioactive contamination of bottomsediments in the upper reaches of the Techa river:analysis of the data obtained in 1950 and 1951. Radiat.Environ. Biophys. 42(3): 155-168 (2003).
M23 Muirhead, C.R., R. Cox, J.W. Stather et al. Estimatesof late radiation risks to the UK population. Doc.NRPB 4(4): 15-157 (1993).
M24 Muirhead, C.R. and S.C. Darby. Modelling the rela-tive and absolute risks of radiation-induced cancers.J. R. Stat. Soc. A 150(2): 83-118 (1987).
M25 Mine, M., Y. Okumura, M. Ichimaru et al. Apparentlybeneficial effect of low to intermediate doses of A-bomb radiation on human lifespan. Int. J. Radiat. Biol.58(6): 1035-1043 (1990).
M26 MacMahon, B. and D. Trichopoulos. Epidemiology,Principles and Methods, second edition. Little, Brownand Company, Boston, 1996.
M27 Modan, B., L. Keinan, T. Blumstein et al. Cancer fol-lowing cardiac catheterization in childhood. Int. J.Epidemiol. 29(3): 424-428 (2000).
M28 Moore, D.H. 2nd, H.W. Patterson, F. Hatch et al.Case-control study of malignant melanoma amongemployees of the Lawrence Livermore NationalLaboratory. Am. J. Ind. Med. 32(4): 377-391 (1997).
UNSCEAR REPORT-PART 5.qxp 10/7/08 3:41 pm Page 308
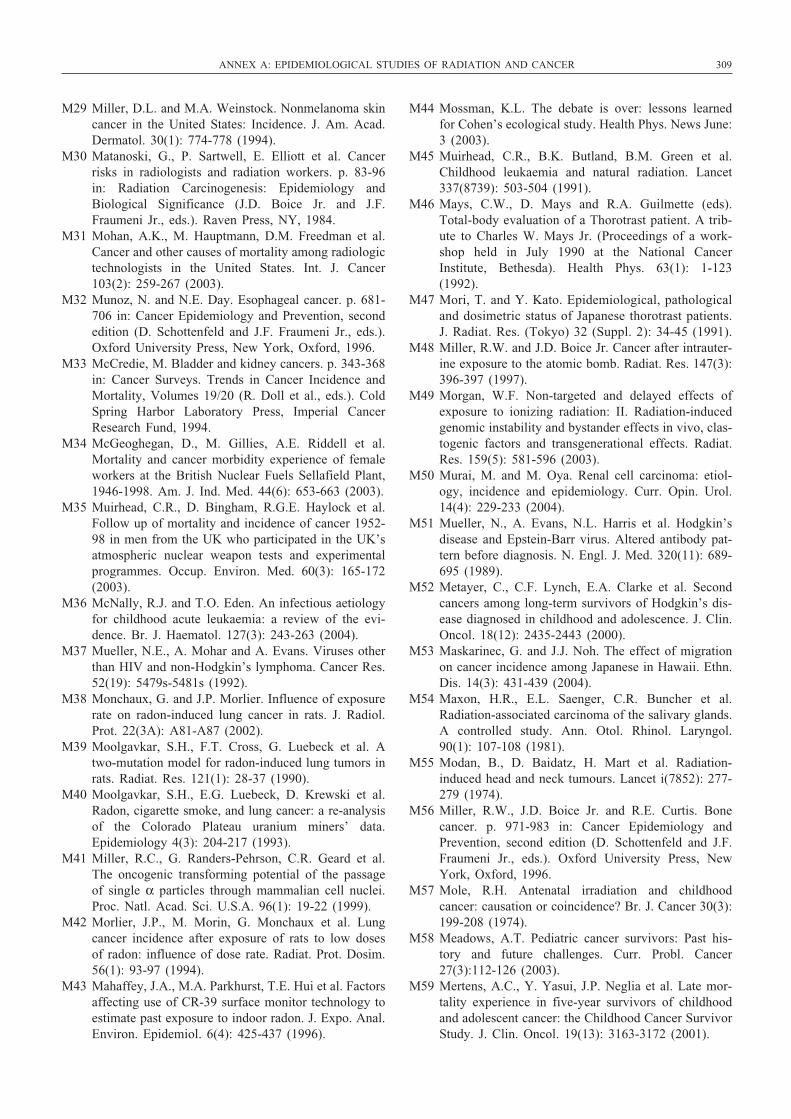
M29 Miller, D.L. and M.A. Weinstock. Nonmelanoma skincancer in the United States: Incidence. J. Am. Acad.Dermatol. 30(1): 774-778 (1994).
M30 Matanoski, G., P. Sartwell, E. Elliott et al. Cancerrisks in radiologists and radiation workers. p. 83-96in: Radiation Carcinogenesis: Epidemiology andBiological Significance (J.D. Boice Jr. and J.F.Fraumeni Jr., eds.). Raven Press, NY, 1984.
M31 Mohan, A.K., M. Hauptmann, D.M. Freedman et al.Cancer and other causes of mortality among radiologictechnologists in the United States. Int. J. Cancer103(2): 259-267 (2003).
M32 Munoz, N. and N.E. Day. Esophageal cancer. p. 681-706 in: Cancer Epidemiology and Prevention, secondedition (D. Schottenfeld and J.F. Fraumeni Jr., eds.).Oxford University Press, New York, Oxford, 1996.
M33 McCredie, M. Bladder and kidney cancers. p. 343-368in: Cancer Surveys. Trends in Cancer Incidence andMortality, Volumes 19/20 (R. Doll et al., eds.). ColdSpring Harbor Laboratory Press, Imperial CancerResearch Fund, 1994.
M34 McGeoghegan, D., M. Gillies, A.E. Riddell et al.Mortality and cancer morbidity experience of femaleworkers at the British Nuclear Fuels Sellafield Plant,1946-1998. Am. J. Ind. Med. 44(6): 653-663 (2003).
M35 Muirhead, C.R., D. Bingham, R.G.E. Haylock et al.Follow up of mortality and incidence of cancer 1952-98 in men from the UK who participated in the UK’satmospheric nuclear weapon tests and experimentalprogrammes. Occup. Environ. Med. 60(3): 165-172(2003).
M36 McNally, R.J. and T.O. Eden. An infectious aetiologyfor childhood acute leukaemia: a review of the evi-dence. Br. J. Haematol. 127(3): 243-263 (2004).
M37 Mueller, N.E., A. Mohar and A. Evans. Viruses otherthan HIV and non-Hodgkin’s lymphoma. Cancer Res.52(19): 5479s-5481s (1992).
M38 Monchaux, G. and J.P. Morlier. Influence of exposurerate on radon-induced lung cancer in rats. J. Radiol.Prot. 22(3A): A81-A87 (2002).
M39 Moolgavkar, S.H., F.T. Cross, G. Luebeck et al. Atwo-mutation model for radon-induced lung tumors inrats. Radiat. Res. 121(1): 28-37 (1990).
M40 Moolgavkar, S.H., E.G. Luebeck, D. Krewski et al.Radon, cigarette smoke, and lung cancer: a re-analysisof the Colorado Plateau uranium miners’ data.Epidemiology 4(3): 204-217 (1993).
M41 Miller, R.C., G. Randers-Pehrson, C.R. Geard et al.The oncogenic transforming potential of the passageof single α particles through mammalian cell nuclei.Proc. Natl. Acad. Sci. U.S.A. 96(1): 19-22 (1999).
M42 Morlier, J.P., M. Morin, G. Monchaux et al. Lungcancer incidence after exposure of rats to low dosesof radon: influence of dose rate. Radiat. Prot. Dosim.56(1): 93-97 (1994).
M43 Mahaffey, J.A., M.A. Parkhurst, T.E. Hui et al. Factorsaffecting use of CR-39 surface monitor technology toestimate past exposure to indoor radon. J. Expo. Anal.Environ. Epidemiol. 6(4): 425-437 (1996).
M44 Mossman, K.L. The debate is over: lessons learnedfor Cohen’s ecological study. Health Phys. News June:3 (2003).
M45 Muirhead, C.R., B.K. Butland, B.M. Green et al.Childhood leukaemia and natural radiation. Lancet337(8739): 503-504 (1991).
M46 Mays, C.W., D. Mays and R.A. Guilmette (eds).Total-body evaluation of a Thorotrast patient. A trib-ute to Charles W. Mays Jr. (Proceedings of a work-shop held in July 1990 at the National CancerInstitute, Bethesda). Health Phys. 63(1): 1-123(1992).
M47 Mori, T. and Y. Kato. Epidemiological, pathologicaland dosimetric status of Japanese thorotrast patients.J. Radiat. Res. (Tokyo) 32 (Suppl. 2): 34-45 (1991).
M48 Miller, R.W. and J.D. Boice Jr. Cancer after intrauter-ine exposure to the atomic bomb. Radiat. Res. 147(3):396-397 (1997).
M49 Morgan, W.F. Non-targeted and delayed effects ofexposure to ionizing radiation: II. Radiation-inducedgenomic instability and bystander effects in vivo, clas-togenic factors and transgenerational effects. Radiat.Res. 159(5): 581-596 (2003).
M50 Murai, M. and M. Oya. Renal cell carcinoma: etiol-ogy, incidence and epidemiology. Curr. Opin. Urol.14(4): 229-233 (2004).
M51 Mueller, N., A. Evans, N.L. Harris et al. Hodgkin’sdisease and Epstein-Barr virus. Altered antibody pat-tern before diagnosis. N. Engl. J. Med. 320(11): 689-695 (1989).
M52 Metayer, C., C.F. Lynch, E.A. Clarke et al. Secondcancers among long-term survivors of Hodgkin’s dis-ease diagnosed in childhood and adolescence. J. Clin.Oncol. 18(12): 2435-2443 (2000).
M53 Maskarinec, G. and J.J. Noh. The effect of migrationon cancer incidence among Japanese in Hawaii. Ethn.Dis. 14(3): 431-439 (2004).
M54 Maxon, H.R., E.L. Saenger, C.R. Buncher et al.Radiation-associated carcinoma of the salivary glands.A controlled study. Ann. Otol. Rhinol. Laryngol.90(1): 107-108 (1981).
M55 Modan, B., D. Baidatz, H. Mart et al. Radiation-induced head and neck tumours. Lancet i(7852): 277-279 (1974).
M56 Miller, R.W., J.D. Boice Jr. and R.E. Curtis. Bonecancer. p. 971-983 in: Cancer Epidemiology andPrevention, second edition (D. Schottenfeld and J.F.Fraumeni Jr., eds.). Oxford University Press, NewYork, Oxford, 1996.
M57 Mole, R.H. Antenatal irradiation and childhoodcancer: causation or coincidence? Br. J. Cancer 30(3):199-208 (1974).
M58 Meadows, A.T. Pediatric cancer survivors: Past his-tory and future challenges. Curr. Probl. Cancer27(3):112-126 (2003).
M59 Mertens, A.C., Y. Yasui, J.P. Neglia et al. Late mor-tality experience in five-year survivors of childhoodand adolescent cancer: the Childhood Cancer SurvivorStudy. J. Clin. Oncol. 19(13): 3163-3172 (2001).
ANNEX A: EPIDEMIOLOGICAL STUDIES OF RADIATION AND CANCER 309
UNSCEAR REPORT-PART 5.qxp 10/7/08 3:41 pm Page 309
310 UNSCEAR 2006 REPORT: VOLUME I
M60 Mason, T.J., J.F. Fraumeni Jr. and F.W. McKay Jr.Uranium mill tailings and cancer mortality inColorado. J. Natl. Cancer Inst. 49(3): 661-664 (1972).
M61 Morgan, W.F. Non-targeted and delayed effects ofexposure to ionizing radiation: I. Radiation-inducedgenomic instability and bystander effects in vitro.Radiat. Res. 159(5): 567-580 (2003).
N1 Nyberg, U., B. Nilsson, L.B. Travis et al. Cancer inci-dence among Swedish patients exposed to radioactivethorotrast: A forty-year follow-up survey. Radiat. Res.157(4): 419-425 (2002).
N2 Nekolla, E.A., A.M. Kellerer, M. Kuse-Isingschulte etal. Malignancies in patients treated with high doses ofradium-224. Radiat. Res. 152 (6 Suppl.): S3-S7 (1999).
N3 Nekolla, E.A., M. Kreisheimer, A.M. Kellerer et al.Induction of malignant bone tumors in radium-224patients: risk estimates based on the improved dosime-try. Radiat. Res. 153(1): 93-103 (2000).
N4 Naumburg, E., R. Bellocco, S. Cnattingius et al.Intrauterine exposure to diagnostic x-rays and risk ofchildhood leukemia subtypes. Radiat. Res. 156(6):718-723 (2001).
N5 Noshchenko, A.G., K.B. Moysich, A. Bondar et al.Patterns of acute leukaemia occurrence among chil-dren in the Chernobyl region. Int. J. Epidemiol. 30(1):125-129 (2001).
N6 Noshchenko, A.G., P.V. Zamostyan, O.Y. Bondar etal. Radiation-induced leukemia risk among those aged0-20 at the time of the Chernobyl accident: a case-control study in the Ukraine. Int. J. Cancer 99(4): 609-618 (2002).
N7 Neriishi, K., D.O. Stram, M. Vaeth et al. The observedrelationship between the occurrence of acute radiationeffects and leukemia mortality among A-bomb sur-vivors. Radiat. Res. 125(2): 206-213 (1991).
N8 National Council on Radiation Protection andMeasurements. The relative biological effectiveness ofradiations of different quality. NCRP Report No. 104(1990).
N9 Neugut, A.I., H. Ahsan, E. Robinson et al. Bladdercarcinoma and other second malignancies after radio-therapy for prostate carcinoma. Cancer 79(8): 1600-1604 (1997).
N10 Nomura, A. Stomach cancer. p. 707-724 in: CancerEpidemiology and Prevention, second edition (D.Schottenfeld and J.F. Fraumeni Jr., eds.). OxfordUniversity Press, New York, Oxford, 1996.
N11 National Institutes of Health. Report of the NationalInstitutes of Health Ad Hoc Working Group toDevelop Radioepidemiological Tables. p. 355 in: NIHPublication No. 85-2748 (1985).
N12 Nakatsuka, H., Y. Shimizu, T. Yamamoto et al.Colorectal cancer incidence among atomic bomb sur-vivors, 1950-80. J. Radiat. Res. (Tokyo) 33(4): 342-361(1992).
N13 National Council on Radiation Protection andMeasurements. Evaluation of occupational and envi-ronmental exposures to radon and radon daughters inthe United States. NCRP Report No. 78 (1984).
N14 Neglia, J.P., A.T. Meadows, L.I. Robison et al. Secondneoplasms after acute lymphoblastic leukemia in child-hood. N. Engl. J. Med. 325(19): 1330-1336 (1991).
N15 Nelson, H.D., L.L. Humphrey, P. Nygren et al.Postmenopausal hormone replacement therapy: scien-tific review. J. Am. Med. Assoc. 288(7): 872-881(2002).
N16 National Council on Radiation Protection andMeasurements. Influence of dose and its distributionin time on dose-response relationships for low-LETradiations. NCRP Report No. 64 (1980).
N17 National Council on Radiation Protection andMeasurements. Uncertainties in fatal cancer risk esti-mates used in radiation protection. NCRP Report No.126 (1997).
N18 National Academy of Sciences. Review of theHanford thyroid disease study draft final report.National Academy Press, Washington, 2000.
N19 National Council on Radiation Protection andMeasurements. General concepts for the dosimetry ofinternally deposited radionuclides. NCRP Report No.84 (1985).
N20 Neglia, J.P., L.L. Robison, M. Stovall et al. New pri-mary neoplasms of the central nervous system in sur-vivors of childhood cancer: A Report from theChildhood Cancer Survivor Study. J. Natl. CancerInst. 98(21): 1528-1537 (2006).
N21 Neglia, J.P., D.L. Friedman, Y. Yasui et al. Secondmalignant neoplasms in five-year survivors of child-hood cancer: childhood cancer survivor study. J. Natl.Cancer Inst. 93(8): 618-629 (2001).
N22 National Council on Radiation Protection andMeasurements. Radiation protection in the mineralextraction industry. NCRP Report No. 118 (1993).
N23 Neronova, E., N. Slozina and A. Nikiforov.Chromosome alterations in cleanup workers sampledyears after the Chernobyl accident. Radiat. Res.160(1): 46-51 (2003).
N24 National Cancer Institute. Report of the NCI-CDCWorking Group to revise the 1985 NIHRadioepidemiological Tables. NIH Report 03-5387(2003).
O1 Omar, R.Z., J.A. Barber and P.G. Smith. Cancer mor-tality and morbidity among plutonium workers at theSellafield plant of British Nuclear Fuels. Br. J. Cancer79(7-8): 1288-1301 (1999).
O2 Ostroumova, E.V. and A.V. Akleyev. Cancer mortal-ity among Techa riverside residents (Southern Urals),chronically exposed to radiation during the prenatalperiod and in childhood. In: Proceedings of the 11thIRPA International Congress, Madrid, 24-28 May2004. http://www.irpa11.com/ (2004).
O3 Otake, M., W.J. Schull and H. Yoshimaru. A reviewof radiation-related brain damage in the prenatallyexposed atomic bomb survivors. RERF CR/4-89(1990).
O4 Otake, M. and W.J. Schull. Radiation-related smallhead sizes among prenatally exposed A-bomb sur-vivors. Int. J. Radiat. Biol. 63(2): 255-270 (1993).
UNSCEAR REPORT-PART 5.qxp 10/7/08 3:41 pm Page 310
O5 Office for National Statistics. Cancer StatisticsRegistrations. Series MB1 No. 30. Stationery Office,London, 2002.
O6 Office for National Statistics. Mortality StatisticsCause. Review of the Registrar General on Deaths byCause, Sex and Age, in England and Wales, 1999.Series DH2 No. 26. Stationery Office, London, 2000.
O7 Osserman, E.F., G. Merlini and V.P. Butler Jr.Multiple myeloma and related plasma cell dyscrasias.J. Am. Med. Assoc. 258(20): 2930-2937 (1987).
O8 Office for National Statistics. Mortality StatisticsCause. Review of the Registrar General on Deaths byCause, Sex and Age, in England and Wales, 2003.Series DH2 No. 30. Stationery Office, London, 2004.
O9 Olsen, J.H., J.M. Hahnemann, A.L. Borresen-Dale etal. Cancer in patients with ataxia-telangiectasia and intheir relatives in the Nordic countries. J. Natl. CancerInst. 93(2): 121-127 (2001).
O10 Oberaigner, W., L. Kreienbrock, A. Schaffrath Rosarioet al. Radon und Lungenkrebs im Bezirk Imst/Österreich. Fortschritte in der Umweltmedizin. EcomedVerlags-gesellschaft, Landsberg am Lech, 2002.
O11 Osborne, J.W., D.P. Nicholson and K.N. Prasad.Induction of intestinal carcinoma in the rat by x-irra-diation of the small intestine. Radiat. Res. 18: 76-85(1963).
O12 Office for National Statistics. Cancer StatisticsRegistrations. Registrations of Cancer Diagnosed in2001, England. Series MB1 No. 32. Stationery Office,London, 2004.
O13 Ostroumova, E., B. Gagnière, D. Laurier et al. Riskanalysis of leukaemia incidence among people livingalong the Techa River: a nested case-control study. J.Radiol. Prot. 26(1): 17-32 (2006).
P1 Pierce, D.A., Y. Shimizu, D.L. Preston et al. Studiesof the mortality of atomic bomb survivors. Report 12,Part I. Cancer: 1950-1990. Radiat. Res. 146(1): 1-27(1996).
P2 Pierce, D.A., D.O. Stram and M. Vaeth. Allowing forrandom errors in radiation dose estimates for theatomic bomb survivor data. Radiat. Res. 123(3): 275-284 (1990).
P3 Preston, D.L., A. Mattsson, E. Holmberg et al.Radiation effects on breast cancer risk: a pooled analy-sis of eight cohorts. Radiat. Res. 158(2): 220-235(2002).
P4 Preston, D.L., S. Kusumi, M. Tomonaga et al. Cancerincidence in atomic bomb survivors. Part III:Leukemia, lymphoma and multiple myeloma, 1950-1987. Radiat. Res. 137(2): S68-S97 (1994).
P5 Pottern, L.M., M.M. Kaplan, P.R. Larsen et al.Thyroid nodularity after childhood irradiation for lym-phoid hyperplasia: a comparison of questionnaire andclinical findings. J. Clin. Epidemiol. 43(5): 449-460(1990).
P6 Preston-Martin, S., D.C. Thomas, M.C. Yu et al.Diagnostic radiography as a risk factor for chronicmyeloid and monocytic leukaemia (CML). Br. J.Cancer 59(4): 639-644 (1989).
P7 Preston-Martin, S., D.C. Thomas, S.C. White et al.Prior exposure to medical and dental x-rays related totumors of the parotid gland. J. Natl. Cancer Inst.80(12): 943-949 (1988).
P8 Peto, R., S. Darby, H. Deo et al. Smoking, smokingcessation, and lung cancer in the UK since 1950: com-bination of national statistics with two case-controlstudies. Br. Med. J. 321(7257): 323-329 (2000).
P9 Preston, D.L., Y. Shimizu, D.A. Pierce et al. Studiesof mortality of atomic bomb survivors. Report 13:solid cancer and noncancer disease mortality: 1950-1997. Radiat. Res. 160(4): 381-407 (2003).
P10 Preston, D.L., D.A. Pierce, Y. Shimizu et al. Effectof recent changes in atomic bomb survivor dosimetryon cancer mortality risk estimates. Radiat. Res.162(4): 377-389 (2004).
P11 Pierce, D.A. and M. Vaeth. The shape of the cancermortality dose-response curve for the A-bomb sur-vivors. Radiat. Res. 126(1): 36-42 (1991).
P12 Pierce, D.A. and D.L. Preston. Radiation-relatedcancer risks at low doses among atomic bomb sur-vivors. Radiat. Res. 154(2): 178-186 (2000).
P13 Prentice, R.L. A case-cohort design for epidemiologiccohort studies and disease prevention trials.Biometrika 73(1): 1-11 (1986).
P14 Preston, D.L. Cigarette smoking and radiation dose inthe Life Span Study. RERF Update 10(2): 9 (1999).
P15 Piantadosi, S. Invited commentary: Ecologic biases.Am. J. Epidemiol. 139(8): 761-764 (1994).
P16 Pierce, D.A., D.O. Stram, M. Vaeth et al. The errors-in-variables problem: considerations providedby radiation dose-response analyses of the A-bombsurvivor data. J. Am. Stat. Assoc. 87(418): 351-359(1992).
P17 Pierce, D.A., G.B. Sharp and K. Mabuchi. Joint effectsof radiation and smoking on lung cancer risk amongatomic bomb survivors. Radiat. Res. 159(4): 511-520(2003).
P18 Pershagen, G., G. Åkerblom, O. Axelson et al.Residential radon exposure and lung cancer inSweden. N. Engl. J. Med. 330(3): 159-164 (1994).
P19 Parkin, D.M., S.L. Whelan, J. Ferlay et al. Cancerincidence in five continents. Volume VIII. IARCScientific Publications No. 155 (2002).
P20 Preston, D.S. and R.S. Stern. Nonmelanoma cancersof the skin. N. Engl. J. Med. 327(23): 1649-1662(1992).
P21 Pukkala, E., R. Aspholm, A. Auvinen et al. Incidenceof cancer among Nordic airline pilots over fivedecades: occupational cohort study. Br. Med. J.325(7364): 567-569 (2002).
P22 Press, W.H., S.A. Teukolsky, W.T. Vetterling et al.Numerical Recipes in FORTRAN. The Art ofScientific Computing, second edition. CambridgeUniversity Press, Cambridge, 1992.
P23 Pawlish, K.S., D. Schottenfeld, R. Severson et al. Riskof multiple primary cancers in prostate cancer patientsin the Detroit metropolitan area: a retrospective cohortstudy. Prostate 33(2): 75-86 (1997).
ANNEX A: EPIDEMIOLOGICAL STUDIES OF RADIATION AND CANCER 311
UNSCEAR REPORT-PART 5.qxp 10/7/08 3:41 pm Page 311
312 UNSCEAR 2006 REPORT: VOLUME I
P24 Pickles, T. and N. Phillips. The risk of second malig-nancy in men with prostate cancer treated with orwithout radiation in British Columbia, 1984-2000.Radiother. Oncol. 65(3): 145-151 (2002).
P25 Pinkerton, L.E., T.F. Bloom, M.J. Hein et al. Mortalityamong a cohort of uranium mill workers: an update.Occup. Environ. Med. 61(1): 57-64 (2004).
P26 Prentice, R.L., Y. Yoshimoto and M.W. Mason.Relationship of cigarette smoking and radiation expo-sure to cancer mortality in Hiroshima and Nagasaki.J. Natl. Cancer Inst. 70(4): 611-622 (1983).
P27 Prentice, R.L. and L. Sheppard. Aggregate data stud-ies of disease risk factors. Biometrika 82(1): 113-125(1995).
P28 Piantadosi, S., D.P. Byar and S.B. Green. The eco-logical fallacy. Am. J. Epidemiol. 127(5): 893-904(1988).
P29 Puskin, J.S. Smoking as a confounder in ecologic cor-relations of cancer mortality rates with average countyradon levels. Health Phys. 84(4): 526-532 (2003).
P30 Pershagen, G., Z-H. Liang, Z. Hrubec et al.Residential radon exposure and lung cancer inSwedish women. Health Phys. 63(2): 179-186 (1992).
P31 Parkin, D.M., P. Pisani and J. Ferlay. Estimates of theworldwide incidence of eighteen major cancers in1985. Int. J. Cancer 54(4): 594-606 (1993).
P32 Preston-Martin, S. and W.J. Mack. Neoplasms of thenervous system. p. 1231-1281 in: CancerEpidemiology and Prevention, second edition (D.Schottenfeld and J.F. Fraumeni Jr., eds.). OxfordUniversity Press, New York, Oxford, 1996.
P33 Preston, D.L., E. Ron, S. Yonehara et al. Tumors ofthe nervous system and pituitary gland associated withatomic bomb radiation exposure. J. Natl. Cancer Inst.94(20): 1555-1563 (2002).
P34 Preston-Martin, S., D.C. Thomas, W.E. Wright et al.Noise trauma in the aetiology of acoustic neuromas inmen in Los Angeles County, 1978-1985. Br. J. Cancer59(5): 783-786 (1989).
P35 Preston-Martin, S., M.C. Yu, B.E. Henderson et al.Risk factors for meningiomas in men in Los AngelesCounty. J. Natl. Cancer Inst. 70(5): 863-866 (1983).
P36 Preston-Martin, S., W. Mack and B.E. Henderson.Risk factors for gliomas and meningiomas in males inLos Angeles County. Cancer Res. 49(21): 6137-6143(1989).
P37 Polednak, A.P., A.F. Stehney and H.F. Lucas.Mortality among male workers at a thorium-processing plant. Health Phys. 44 (Suppl. 1): 239-251(1983).
P38 Parkin, D.M., F. Bray, J. Ferlay et al. Global cancer sta-tistics, 2002. CA Cancer J. Clin. 55(2): 74-108 (2005).
P39 Pike, M.C., M.D. Krailo, B.E. Henderson et al.“Hormonal” risk factors, “breast tissue age” and theage-incidence of breast cancer. Nature 303(5920):767-770 (1983).
P40 Page, D.L. and W.D. Dupont. Benign breast disease:indicators of increased breast cancer risk. CancerDetect. Prev. 16(2): 93-97 (1992).
P41 Potten, C.S., G. Owen and D. Booth. Intestinal stemcells protect their genome by selective segregation oftemplate DNA strands. J. Cell Sci. 114(11): 2381-2388 (2002).
P42 Potten, C.S., Y.Q. Li, P.J. O’Connor et al. A possibleexplanation for the differential cancer incidence in theintestine, based on distribution of the cytotoxic effectsof carcinogens in the murine large bowel.Carcinogenesis 13(12): 2305-2312 (1992).
P43 Pollack, A., G.K. Zagars, G. Starkschall et al.Conventional vs. conformal radiotherapy for prostatecancer: preliminary results of dosimetry and acute tox-icity. Int. J. Radiat. Oncol. Biol. Phys. 34(3): 555-564(1996).
P44 Pacini, F., T. Vorontsova, E.P. Demidchik et al. Post-Chernobyl thyroid carcinoma in Belarus children andadolescents: comparison with naturally occurring thyroid carcinoma in Italy and France. J. Clin.Endocrinol. Metab. 82(11): 3563-3569 (1997).
P45 Pierce, D.A., Y. Shimizu, D.L. Preston et al. Responseto the Letter of M.P. Little. Radiat. Res. 148(4): 400-401 (1997).
P46 Pierce, D.A. and M. Vaeth. Age-time patterns ofcancer to be anticipated from exposure to generalmutagens. Biostatistics 4(2): 231-248 (2003).
P47 Pierce, D.A. and M.L. Mendelsohn. A model for radi-ation-related cancer suggested by the atomic bombsurvivor data. Radiat. Res. 152(6): 642-654 (1999).
P48 Preston, D., E. Ron, S. Tokuoka et al. Solid cancerincidence in atomic bomb survivors: 1958–1998.Radiat. Res. 168(1): 1-64 (2007).
P49 Puskin, J.S., A.C. James and N.S. Nelson. Responseto Cohen (letter). Health Phys. 86(2): 204-205 (2004).
R1 Ritz, B., H. Morgenstern, D. Crawford-Brown et al.The effects of internal radiation exposure on cancermortality in nuclear workers at Rocketdyne/AtomicsInternational. Environ. Health Perspect. 108(8): 743-751 (2000).
R2 Romanov, S.A., E.K. Vasilenko, V.F. Khokhryakov etal. Studies on the Mayak nuclear workers: dosimetry.Radiat. Environ. Biophys. 41(1): 23-28 (2002).
R3 Ron, E., M.M. Doody, D.V. Becker et al. Cancer mor-tality following treatment for adult hyperthyroidism.J. Am. Med. Assoc. 280(4): 347-355 (1998).
R4 Ronckers, C.M., C.E. Land, P.G. Verduijn et al.Cancer mortality after nasopharyngeal radium irradi-ation in the Netherlands: a cohort study. J. Natl.Cancer Inst. 93(13): 1021-1027 (2001).
R5 Ron, E., B. Modan and J.D. Boice Jr. Mortality afterradiotherapy for ringworm of the scalp. Am. J.Epidemiol. 127(4): 713-725 (1988).
R6 Ron, E., J.H. Lubin, R.E. Shore et al. Thyroid cancerafter exposure to external radiation: a pooled analysisof seven studies. Radiat. Res. 141(3): 259-277 (1995).
R7 Ron, E. Communication to the UNSCEAR Secretariat(1994).
R8 Radford, E.P. and K.G. St. Clair Renard. Lung cancerin Swedish iron miners exposed to low doses of radon
UNSCEAR REPORT-PART 5.qxp 10/7/08 3:41 pm Page 312
daughters. N. Engl. J. Med. 310(23): 1485-1494(1984).
R9 Ron, E., B. Modan, D. Preston et al. Thyroid neopla-sia following low-dose radiation in childhood. Radiat.Res. 120(3): 516-531 (1989).
R10 Ron, E., D.L. Preston, K. Mabuchi et al. Cancer inci-dence in atomic bomb survivors. Part IV: Comparisonof cancer incidence and mortality. Radiat. Res. 137(2):S98-S112 (1994).
R11 Rahu, M., M. Tekkel, T. Veidebaum et al. TheEstonian study of Chernobyl cleanup workers: II.Incidence of cancer and mortality. Radiat. Res. 147(5):653-657 (1997).
R12 Report of the Joint US-Japan Working Group.Reassessment of the Atomic Bomb RadiationDosimetry for Hiroshima and Nagasaki (R.W. Youngand G.D. Kerr, eds.). Radiation Effects ResearchFoundation, Hiroshima, 2005.
R13 Robbins, J. and W. Adams. Radiation effects in theMarshall Islands. p. 11-24 in: Radiation and theThyroid (S. Nagataki, ed.). Excepta Medica, Tokyo,1989.
R14 Rooney, C., V. Beral, N. Maconochie et al. Case-con-trol study of prostatic cancer in employees of theUnited Kingdom Atomic Energy Authority. Br. Med.J. 307(6916): 1391-1397 (1993).
R15 Ritz, B., H. Morgenstern, J. Froines et al. Effects ofexposure to external ionizing radiation on cancer mor-tality in nuclear workers monitored for radiation atRocketdyne/Atomics International. Am. J. Ind. Med.35(1): 21-31 (1999).
R16 Ron, E., B. Modan, D. Preston et al. Radiation-induced skin carcinomas of the head and neck. Radiat.Res. 125(3): 318-325 (1991).
R17 Ron, E., B. Modan, J.D. Boice Jr. et al. Tumors ofthe brain and nervous system after radiotherapy inchildhood. N. Engl. J. Med. 319(16): 1033-1039(1988).
R18 Rowland, R.E. Dose-response relationships for femaleradium dial workers: a new look. p. 135-143 in: HealthEffects of Internally Deposited Radionuclides:Emphasis on Radium and Thorium (G. van Kaick etal., eds.). World Scientific, Singapore, 1995.
R19 Reeves, G.K., D.R. Cox, S.C. Darby et al. Someaspects of measurement error in explanatory variablesfor continuous and binary regression models. Stat.Med. 17(19): 2157-2177 (1998).
R20 Roesch, W.C. (ed.). US-Japan Joint Reassessment ofAtomic Bomb Radiation Dosimetry in Hiroshima andNagasaki. Volume 1. Radiation Effects ResearchFoundation, Hiroshima, 1987.
R21 Rosner, B., W.C. Willett and D. Spiegelman.Correction of logistic regression relative risk estimatesand confidence intervals for systematic within-personmeasurement error. Stat. Med. 8(9): 1051-1069 (1989).
R22 Richardson, S. and W.R. Gilks. Conditional inde-pendence models for epidemiological studies withcovariate measurement error. Stat. Med. 12(18): 1703-1722 (1993).
R23 Richardson, S. and W.R. Gilks. A Bayesian approachto measurement error problems in epidemiology usingconditional independence models. Am. J. Epidemiol.138(6): 430-442 (1993).
R24 Richardson, S., L. Leblond, I. Jaussent et al. Mixturemodels in measurement error problems, with referenceto epidemiological studies. J. R. Stat. Soc. Ser. A165(3): 549-566 (2002).
R25 Ron, E., D.L. Preston, M. Kishikawa et al. Skin tumorrisk among atomic-bomb survivors in Japan. CancerCauses Control 9(4): 393-401 (1998).
R26 Ryberg, M., M. Lundell, B. Nilsson et al. Malignantdisease after radiation treatment of benign gynaeco-logical disorders: a study of a cohort of metropathiapatients. Acta Oncol. 29(5): 563-567 (1990).
R27 Rowland, R.E., A.F. Stehney and H.F. Lucas Jr. Dose-response relationships for female radium dial workers.Radiat. Res. 76(2): 368-383 (1978).
R28 Ries, L.A.G., M.P. Eisner, C.L. Kosary et al. (eds.).SEER Cancer Statistics Review, 1975-2000.http://seer.cancer.gov/csr/1975-2000/. National CancerInstitute, Bethesda, MD, 2003.
R29 Ron, E., J.D. Boice Jr., S. Hamburger et al. Mortalityfollowing radiation treatment for infertility of hor-monal origin or amenorrhea. Int. J. Epidemiol. 23(6):1165-1173 (1994).
R30 Ron, E., A. Auvinen, E. Alfandary et al. Cancer riskfollowing radiotherapy for infertility or menstrual dis-orders. Int. J. Cancer 82(6): 795-798 (1999).
R31 Ryan, P., M.W. Lee, B. North et al. Amalgam fill-ings, diagnostic dental x-rays and tumours of the brainand meninges. Eur. J. Cancer B Oral Oncol. 28B(2):91-95 (1992).
R32 Ronckers, C.M., C.A. Erdmann and C.E. Land.Radiation and breast cancer: a review of current evi-dence. Breast Cancer Res. 7(1): 21-32 (2005).
R33 Ron, E., T. Ikeda, D.L. Preston et al. Male breastcancer incidence among atomic bomb survivors. J.Natl. Cancer Inst. 97(8): 603-605 (2005).
R34 Ross, R.K. and D. Schottenfeld. Prostate cancer. p. 1180-1206 in: Cancer Epidemiology and Prevention, secondedition (D. Schottenfeld and J.F. Fraumeni Jr., eds.).Oxford University Press, New York, Oxford, 1996.
R35 Ron, E., F.L. Wong and K. Mabuchi. Incidence ofbenign gastrointestinal tumors among atomic bombsurvivors. Am. J. Epidemiol. 142(1): 68-75 (1995).
R36 Rubino, C., F. de Vathaire, I. Diallo et al. Increasedrisk of second cancers following breast cancer: role ofthe initial treatment. Breast Cancer Res. Treat. 61(3):183-195 (2000).
R37 Richardson, D.B., S. Wing, J. Schroeder et al. Ionizingradiation and chronic lymphocytic leukemia. Environ.Health Perspect. 113(1): 1-5 (2005).
R38 Rubino, C., F. de Vathaire, M.E. Dottorini et al.Second primary malignancies in thyroid cancerpatients. Br. J. Cancer 89(9): 1638-1644 (2003).
R39 Rogel, A., D. Laurier, M. Tirmarche et al. Lung cancerrisk in the French cohort of uranium miners. J. Radiol.Prot. 22(3A): A101-A106 (2002).
ANNEX A: EPIDEMIOLOGICAL STUDIES OF RADIATION AND CANCER 313
UNSCEAR REPORT-PART 5.qxp 10/7/08 3:41 pm Page 313
314 UNSCEAR 2006 REPORT: VOLUME I
R40 Ruosteenoja, E., I. Mäkeläinen, T. Rytömaa et al.Radon and lung cancer in Finland. Health Phys. 71(2):185-189 (1996).
R41 Ronckers, C.M., F.E. van Leeuwen, R.B. Hayes et al.Cancer incidence after nasopharyngeal radium irradi-ation. Epidemiology 13(5): 552-560 (2002).
R42 Ron, E. The epidemiology of thyroid cancer. p. 1000-1021 in: Cancer Epidemiology and Prevention, secondedition (D. Schottenfeld and J.F. Fraumeni Jr., eds.).Oxford University Press, New York, Oxford, 1996.
R43 Ritz, B. Radiation exposure and cancer mortality inuranium processing workers. Epidemiology 10(5):531-538 (1999).
R44 Romanyukha, A.A., D. Regulla, E. Vasilenko et al.South Ural nuclear workers: comparison of individualdoses from retrospective EPR dosimetry and opera-tional personal monitoring. Appl. Radiat. Isot. 45(12):1195-1199 (1994).
R45 Romanyukha, A.A., E.A. Ignatiev, E.K. Vasilenko etal. EPR dose reconstruction for Russian nuclear work-ers. Health Phys. 78(1): 15-20 (2000).
R46 Rodvall, Y., Z. Hrubec, G. Pershagen et al. Childhoodcancer among Swedish twins. Cancer Causes Control3(6): 527-532 (1992).
R47 Rubino, C., E. Adjadj, S. Guerin et al. Long-term riskof second malignant neoplasms after neuroblastoma inchildhood: role of treatment. Int. J. Cancer 107(5):791-796 (2003).
R48 Ronckers, C.M., A.J. Sigurdson, M. Stovall et al.Thyroid cancer in childhood cancer survivors: adetailed evaluation of radiation dose-response and itsmodifiers. Radiat. Res. 166(4): 618-628 (2006).
R49 Rahu, M., K. Rahu, A. Auvinen et al. Cancer risk amongChernobyl cleanup workers in Estonia and Latvia, 1986-1998. Int. J. Cancer 119(1): 162-168 (2006).
R50 Rommens, C., D. Laurier and A. Sugier. Methodologyand results of the Nord-Cotentin radioecological study.J. Radiol. Prot. 20(4): 361-380 (2000).
R51 Rosenson, R., B. Gusev, M. Hoshi et al. A brief sum-mary of radiation studies on residents in theSemipalatinsk area 1957-1993. p. 127-146 in:Nagasaki Symposium, Radiation and Human Health:Proposal from Nagasaki. Elsevier, Amsterdam, 1996.
R52 Rubino, C., A. Shamsaldin, M.G. Lê et al. Radiationdose and risk of soft tissue and bone sarcoma afterbreast cancer treatment. Breast Cancer Res. Treat.89(3): 277-288 (2005).
R53 Rafnsson, V., P. Sulem, H. Tulinius et al. Breastcancer risk in airline cabin attendants: a nested case-control study in Iceland. Occup. Environ. Med.60(11): 807-809 (2003).
R54 Rogel, A., N. Carre, E. Amoros et al. Mortality ofworkers exposed to ionising radiation at the Frenchnational electricity company. Am. J. Ind. Med. 47(1):72-82 (2005).
S1 Schafer, D.W., J.H. Lubin, E. Ron et al. Thyroidcancer following scalp irradiation: a reanalysisaccounting for uncertainty in dosimetry. Biometrics57(3): 689-697 (2001).
S2 Stevens, W., D.C. Thomas, J.L. Lyon et al. Leukemiain Utah and radioactive fallout from the Nevada testsite. J. Am. Med. Assoc. 264(5): 585-591 (1990).
S3 Shimizu, Y., H. Kato and W.J. Schull. Studies of themortality of A-bomb survivors. 9. Mortality, 1950-1985: Part 2. Cancer mortality based on the recentlyrevised doses (DS86). Radiat. Res. 121(2): 120-141(1990).
S4 Shakhtarin,V.V., A.F. Tsyb, V.F. Stepanenko et al.Iodine deficiency, radiation dose, and the risk of thyroid cancer among children and adolescents in theBryansk region of Russia following the Chernobylpower station accident. Int. J. Epidemiol. 32(4): 584-591 (2003).
S5 Shore, R.E., N. Hildreth, E. Woodard et al. Breastcancer among women given x-ray therapy for acutepostpartum mastitis. J. Natl. Cancer Inst. 77(3): 689-696 (1986).
S6 Shore, R.E. Epidemiological issues related to dosereconstruction. p. 245-260 in: Environmental DoseReconstruction and Risk Implications (J.E. Till, ed.).NCRP, Bethesda, MD, 1995.
S7 Shore, R.E., M. Moseson, X. Xue et al. Skin cancerafter x-ray treatment for scalp ringworm. Radiat. Res.157(4): 410-418 (2002).
S8 Sont, W.N., J.M. Zielinski, J.P. Ashmore et al. Firstanalysis of cancer incidence and occupational radia-tion exposure based on the National Dose Registry ofCanada. Am. J. Epidemiol. 153(4): 309-318 (2001).
S9 Shoikhet, Y.N., V.I. Kiselev, A.I. Algazin et al.Fallout from nuclear tests: health effects in the Altairegion. Radiat. Environ. Biophys. 41(1): 69-73 (2002).
S10 Shoikhet, Y., V. Loborev, V. Sudakov et al. Falloutfrom nuclear tests: dosimetry in the Altai region.Radiat. Environ. Biophys. 41(1): 57-60 (2002).
S11 Stewart, A., J. Webb and D. Hewitt. A survey of child-hood malignancies. Br. Med. J. 1(5086): 1495-1508(1958).
S12 Stehney, A.F. Survival times of pre-1950 US womenradium dial workers. p. 149-155 in: Health Effects ofInternally Deposited Radionuclides: Emphasis onRadium and Thorium (G. van Kaick et al., eds.).World Scientific, Singapore, 1995.
S13 Spiers, F.W., H.F. Lucas, J. Rundo et al. Leukemiaincidence in the U.S. dial workers. Health Phys. 44(Suppl. 1): 65-72 (1983).
S14 Shore, R.E. Issues and epidemiological evidenceregarding radiation-induced thyroid cancer. Radiat.Res. 131(1): 98-111 (1992).
S15 Shore, R.E., R.E. Albert, M. Reed et al. Skin cancerincidence among children irradiated for ringworm ofthe scalp. Radiat. Res. 100(1): 192-204 (1984).
S16 Stebbings, J.H., H.F. Lucas and A.F. Stehney.Mortality from cancers of major sites in female radiumdial workers. Am. J. Ind. Med. 5(6): 435-459 (1984).
S17 Schneider, A.B., E. Shore-Freedman, U.Y. Ryo et al.Radiation-induced tumors of the head and neck fol-lowing childhood irradiation. Prospective studies.Medicine 64(1): 1-15 (1985).
UNSCEAR REPORT-PART 5.qxp 10/7/08 3:41 pm Page 314
S18 Shore, R.E., N. Hildreth, P. Dvoretsky et al. Thyroidcancer among persons given x-ray treatment in infancyfor an enlarged thymus gland. Am. J. Epidemiol.137(10): 1068-1080 (1993).
S19 Samet, J.M., D.R. Pathak, M.V. Morgan et al. Lungcancer mortality and exposure to radon progeny in acohort of New Mexico underground uranium miners.Health Phys. 61(6): 745-752 (1991).
S20 Storm, H.H., M. Andersson, J.D. Boice Jr. et al.Adjuvant radiotherapy and risk of contralateral breastcancer. J. Natl. Cancer Inst. 84(16): 1245-1250 (1992).
S21 Schneider, A.B., E. Ron, J. Lubin et al. Dose-responserelationships for radiation-induced thyroid cancer andthyroid nodules: evidence for the prolonged effects ofradiation on the thyroid. J. Clin. Endocrinol. Metab.77(2): 362-369 (1993).
S22 Shore, R.E. Overview of radiation-induced skin cancerin humans. Int. J. Radiat. Biol. 57(4): 809-827 (1990).
S23 Sun, Q., S. Akiba, J. Zou et al. Databases and statis-tical methods of cohort studies (1979-90) inYangjiang. p. 241-248 in: High Levels of NaturalRadiation 96: Radiation Dose and Health Effects (L.Wei et al., eds.). Elsevier, Amsterdam, 1997.
S24 Saenger, E.L., G.E. Thoma and E.A. Tompkins.Incidence of leukemia following treatment of hyper-thyroidism: Preliminary report of the CooperativeThyrotoxicosis Therapy Follow-up Study. J. Am. Med.Assoc. 205(12): 855-862 (1968).
S25 Stebbings, J.H. Radium and leukemia: is currentdogma valid? Health Phys. 74(4): 486-488 (1998).
S26 Salomaa, S., C. Lindholm, M.K. Tankimanova et al.Stable chromosome aberrations in the lymphocytes ofa population living in the vicinity of the Semipalatinsknuclear test site. Radiat. Res. 158(5): 591-596 (2002).
S27 Sevan’kaev, A.V., D.C. Lloyd, A.A. Edwards et al. Acytogenetic follow-up of some highly irradiated vic-tims of the Chernobyl accident. Radiat. Prot. Dosim.113(2): 152-161 (2005).
S28 Shilnikova, N.S., D.L. Preston, E. Ron et al. Cancermortality risk among workers at the Mayak nuclearcomplex. Radiat. Res. 159(6): 787-798 (2003).
S29 Sigurdson, A.J., M.M. Doody, R.S. Rao et al. Cancerincidence in the U.S. radiologic technologists healthstudy, 1983-1998. Cancer 97(12): 3080-3089 (2003).
S30 Storm, H.H., E. Iversen and J.D. Boice Jr. Breastcancer following multiple chest fluoroscopies amongtuberculosis patients. A case-control study in Denmark.Acta Radiol. Oncol. 25(4-6): 233-238 (1986).
S31 Straume, T. High-energy gamma rays in Hiroshimaand Nagasaki: implications for risk and wR. HealthPhys. 69(6): 954-956 (1995).
S32 Smith, P.G. and R. Doll. Mortality among patientswith ankylosing spondylitis after a single treatmentcourse with x-rays. Br. Med. J. 284(6314): 449-460(1982).
S33 Schervish, M.J. Theory of Statistics. Springer-Verlag,New York, 1995.
S34 Sackett, D.L. Bias in analytic research. J. Chronic Dis.32(1-2): 51-63 (1979).
S35 Sigurdson, A.J. and E. Ron. Cosmic radiation expo-sure and cancer risk among flight crew. Cancer Invest.22(5): 743-761 (2004).
S36 Scotto, J., T. Fears, K.H. Kraemer et al. Nonmelanomaskin cancer. p. 1313-1330 in: Cancer Epidemiologyand Prevention, second edition (D. Schottenfeld andJ.F. Fraumeni Jr., eds.). Oxford University Press, NewYork, Oxford, 1996.
S37 Sober, A.J. and J.M. Burstein. Precursors to skincancer. Cancer 75 (2 Suppl.): 645-650 (1995).
S38 Scotto, J., T. Fears and J. Fraumeni. Incidence of non-melanoma skin cancer in the United States. NIHPublication No. 83-2433 (1983).
S39 Straume, T., S.D. Egbert, W.A. Woolson et al.Neutron discrepancies in the DS86 Hiroshima dosimetry system. Health Phys. 63(4): 421-426(1992).
S40 Straume, T., L.J. Harris, A.A. Marchetti et al.Neutrons confirmed in Nagasaki and at the ArmyPulsed Radiation Facility: implications for Hiroshima.Radiat. Res. 138(2): 193-200 (1994).
S41 Straume, T., G. Rugel, A.A. Marchetti et al.Measuring fast neutrons in Hiroshima at distances rel-evant to atomic-bomb survivors. Nature 424(6948):539-542 (2003).
S42 Sauvaget, C., F. Kasagi and C.A. Waldren. Dietaryfactors and cancer mortality among atomic-bomb sur-vivors. Mutat. Res. 551(1-2): 145-152 (2004).
S43 Sawant, S.G., G. Randers-Pehrson, C.R. Geard et al.The bystander effect in radiation oncogenesis: I. Transformation in C3H 10T1⁄2 cells in vitro can beinitiated in the unirradiated neighbors of irradiatedcells. Radiat. Res. 155(3): 397-401 (2001).
S44 Silverman, D.T., A.S. Morrison and S.S. Devesa.Bladder cancer. p. 1156-1179 in: CancerEpidemiology and Prevention, second edition (D.Schottenfeld and J.F. Fraumeni Jr., eds.). OxfordUniversity Press, New York, Oxford, 1996.
S45 Sznajder, L., C. Abrahams, D.M. Parry et al. Multipleschwannomas and meningiomas associated with irra-diation in childhood. Arch. Intern. Med. 156(16):1873-1878 (1996).
S46 Schonfeld, S.J., E.S. Gilbert, G.M. Dores et al. Acutemyeloid leukemia following Hodgkin lymphoma: apopulation-based study of 35,511 patients. J. Natl.Cancer Inst. 98(3): 215-218 (2006).
S47 Svahn-Tapper, G., S. Garwicz, H. Anderson et al.Radiation dose and relapse are predictors for devel-opment of second malignant solid tumors after cancerin childhood and adolescence: a population-basedcase-control study in the five Nordic countries. ActaOncol. 45(4): 438-448 (2006).
S48 Sadetzki, S., A. Chetrit, L. Freedman et al. Long-termfollow-up for brain tumor development after child-hood exposure to ionizing radiation for tinea capitis.Radiat. Res. 163(4): 424-432 (2005).
S49 Swerdlow, A.J. Epidemiology of Hodgkin’s diseaseand non-Hodgkin’s lymphoma. Eur. J. Nucl. Med.Mol. Imaging 30 (Suppl. 1): S3-S12 (2003).
ANNEX A: EPIDEMIOLOGICAL STUDIES OF RADIATION AND CANCER 315
UNSCEAR REPORT-PART 5.qxp 10/7/08 3:41 pm Page 315
316 UNSCEAR 2006 REPORT: VOLUME I
S50 Stebbings, J.H. and W. Semkiw. Central nervoussystem tumours and related intracranial pathologies inradium dial workers. p. 63-67 in: Risks from Radiumand Thorotrast (D.M. Taylor et al., eds.). BIR Report21 (1989).
S51 Schiffman, M.H., L.A. Brinton, S.S. Devesa et al.Cervical cancer. p. 1090-1116 in: CancerEpidemiology and Prevention, second edition (D.Schottenfeld and J.F. Fraumeni Jr., eds.). OxfordUniversity Press, New York, Oxford, 1996.
S52 Schlehofer, B., M. Blettner, S. Preston-Martin et al.Role of medical history in brain tumour development.Results from the international adult brain tumourstudy. Int. J. Cancer 82(2): 155-160 (1999).
S53 Shore, R.E., R.E. Albert and B.S. Pasternack. Follow-up study of patients treated by x-ray epilation for tineacapitis. Resurvey of post-treatment illness and mortalityexperience. Arch. Environ. Health 31(1): 21-28 (1976).
S54 Shore-Freedman, E., C. Abrahams, W. Recant et al.Neurilemomas and salivary gland tumors of the headand neck following childhood irradiation. Cancer51(12): 2159-2163 (1983).
S55 Serraino, D., G. Salamina, S. Franceschi et al. Theepidemiology of AIDS-associated non-Hodgkin’s lym-phoma in the World Health Organization Europeanregion. Br. J. Cancer 66: 912-916 (1992).
S56 Silver, S.R., R.D. Daniels, T.D. Taulbee et al.Differences in mortality by radiation monitoring statusin an expanded cohort of Portsmouth Naval Shipyardworkers. J. Occup. Environ. Med. 46(7): 677-690(2004).
S57 Schottenfeld, D. and S.S. Islam. Cancers of the smallintestine. p. 806-812 in: Cancer Epidemiology andPrevention, second edition (D. Schottenfeld and J.F.Fraumeni Jr., eds.). Oxford University Press, NewYork, Oxford, 1996.
S58 Schottenfeld, D. and S.J. Winawer. Cancers of thelarge intestine. p. 813-840 in: Cancer Epidemiologyand Prevention, second edition (D. Schottenfeld andJ.F. Fraumeni Jr., eds.). Oxford University Press, NewYork, Oxford, 1996.
S59 Stewart, B.W. and P. Kleihues (eds.). World CancerReport. IARC Press, Lyon, 2003.
S60 Swerdlow, A.J., M.J. Shoemaker, R. Allerton et al.Lung cancer after Hodgkin’s disease: A nested case-control study of the relation to treatment. J. Clin.Oncol. 19(6): 1610-1618 (2001).
S61 Stram, D.O., B. Langholz, M. Huberman et al.Correcting for exposure measurement error in areanalysis of lung cancer mortality for the ColoradoPlateau Uranium Miners cohort. Health Phys. 77(3):265-275 (1999).
S62 Schoenberg, J.B., J.B. Klotz, H.B. Wilcox et al. Case-control study of residential radon and lung canceramong New Jersey women. Cancer Res. 150(20):6520-6524 (1990).
S63 Steck, D.J., R.W. Field and C.F. Lynch. Exposure toatmospheric radon. Environ. Health Perspect. 107(2):123-127 (1999).
S64 Sheppard, L. and R.L. Prentice. On the reliability andprecision of within- and between-population estimatesof relative rate parameters. Biometrics 51(3): 853-863(1995).
S65 Smith, B.J., R.W. Field and C.F. Lynch. Residential222Rn exposure and lung cancer: Testing the linear no-threshold theory with ecologic data. Health Phys.75(1): 11-17 (1998).
S66 Sandler, D.P., C.R. Weinberg, D.L. Shore et al. Indoorradon and lung cancer risk in Connecticut and Utah. J. Toxicol. Environ. Health A. 69(7): 633-654(2006).
S67 Shu, X.O., J.D. Potter, M.S. Linet et al. DiagnosticX-rays and ultrasound exposure and risk of childhoodacute lymphoblastic leukemia by immuno-phenotype.Cancer Epidemiol. Biomarkers Prev. 11(2): 177-185(2002).
S68 Shore, R.E., M. Moseson, N. Harley et al. Tumors andother diseases following childhood x-ray treatment forringworm of the scalp (tinea capitis). Health Phys.85(4): 404-408 (2003).
S69 Sack, R.B., K. Gyr and R. Leon-Barua. Proceedingsof the Second International Workshop on Helicobacterpylori infections in the developing world. Lima, Peru,28-31 January 1996. Introduction. Clin. Infect. Dis.25(5): 971-972 (1997).
S70 Sharp, G.B., T. Mizuno, J.B. Cologne et al.Hepatocellular carcinoma among atomic bomb sur-vivors: significant interaction of radiation with hepa-titis C virus infections. Int. J. Cancer 103(4): 531-537(2003).
S71 Saenger, E.L., F.N. Silverman, T.D. Sterling et al.Neoplasia following therapeutic irradiation for benignconditions in childhood. Radiology 74: 889-904(1960).
S72 Schneider, A.B., M.J. Favus, M.E. Stachura et al.Salivary gland neoplasms as a late consequence ofhead and neck irradiation. Ann. Intern. Med. 87(2):160-164 (1977).
S73 Saku, T., Y. Hayashi, O. Takahara et al. Salivarygland tumors among atomic bomb survivors, 1950-1987. Cancer 79(8): 1465-1475 (1997).
S74 Schneider, A.B., J. Lubin, E. Ron et al. Salivary glandtumors after childhood radiation treatment for benignconditions of the head and neck: dose-response rela-tionships. Radiat. Res. 149(6): 625-630 (1998).
S75 Smith, P.G. and R. Doll. Late effects of x irradiationin patients treated for metropathia haemorrhagica. Br.J. Radiol. 49(579): 224-232 (1976).
S76 Sasco, A.J., R. Kaaks and R.E. Little. Breast cancer:occurrence, risk factors and hormone metabolism.Expert Rev. Anticancer Ther. 3(4): 546-562 (2003).
S77 Swerdlow, A.J., J.A. Barber, G.V. Hudson et al. Riskof second malignancy after Hodgkin’s disease in a col-laborative British cohort: the relation to age at treat-ment. J. Clin. Oncol. 18(3): 498-509 (2000).
S78 Sim, H.G. and C.W. Cheng. Changing demography ofprostate cancer in Asia. Eur. J. Cancer 41(6): 834-845(2005).
UNSCEAR REPORT-PART 5.qxp 10/7/08 3:41 pm Page 316
S79 Spiess, H. The Ra-224 study: past, present and future.p. 157-163 in: Health Effects of Internally DepositedRadionuclides: Emphasis on Radium and Thorium (G.van Kaick et al., eds.). World Scientific, Singapore,1995.
S80 Steinbuch, M., C.R. Weinberg, J.D. Buckley et al.Indoor residential radon exposure and risk of child-hood acute myeloid leukaemia. Br. J. Cancer 81(5):900-906 (1999).
S81 Sasaki, M.S. and H. Miyata. Biological dosimetry inatomic bomb survivors. Nature 220(173): 1189-1193(1968).
S82 Serezhenkov, V.A., E.V. Domracheva, G.A. Klevezalet al. Radiation dosimetry for residents of theChernobyl Region: a comparison of cytogenetic andelectron spin resonance methods. Radiat. Prot. Dosim.42(1): 33-36 (1992).
S83 Surveillance, Epidemiology and End Results (SEER)Program. SEER 1973-2002 Public-Use data. URL:http://seer.cancer.gov/publicdata/ (2005).
S84 Sachs, R.K. and D.J. Brenner. Solid tumor risks afterhigh doses of ionizing radiation. Proc. Natl. Acad. Sci.U.S.A. 102(37): 13040-13045 (2005).
S85 Shuryak, I., R.K. Sachs, L. Hlatky et al. Radiation-induced leukemia at doses relevant to radiation ther-apy: modeling mechanisms and estimating risks. J.Natl. Cancer Inst. 98(24): 1794-1806 (2006).
S86 Sobolev, B., I. Likhtarev, I. Kairo et al. Radiation riskassessment of the thyroid cancer in Ukrainian childrenexposed due to Chernobyl. p. 741-748 in: TheRadiological Consequences of the Chernobyl Accident(A. Karaoglou et al., eds.). EUR 16544 (1996).
S87 Schneider, A.B. and D.H. Sarne. Long-term risks forthyroid cancer and other neoplasms after exposure toradiation. Nature Clin. Practice Endocrinol. Metab.1(2): 82-91 (2005).
S88 Sigurdson, A.J., C.M. Ronckers, A.C. Mertens et al.Primary thyroid cancer after a first tumour in child-hood (the Childhood Cancer Survivor Study): a nestedcase-control study. Lancet 365(9476): 2014-2023(2005).
S89 Spiegelhalter, D.J., A. Thomas, N. Best et al.WinBUGS version 1.4. http://www.mrc-bsu.cam.ac.uk/bugs/welcome.shtml. MRC Biostatistics Unit,Cambridge (2003).
S90 Sobolev, B., W.F. Heidenreich, I. Kairo et al. Thyroidcancer incidence in the Ukraine after the Chernobylaccident: comparison with spontaneous incidences.Radiat. Environ. Biophys. 36(3): 195-199 (1997).
T1 Thompson, D.E., K. Mabuchi, E. Ron et al. Cancerincidence in atomic bomb survivors. Part II. Solidtumors, 1958-1987. Radiat. Res. 137(2): S17-S67(1994).
T2 Tarone, R.E. A modified Bonferroni method for dis-crete data. Biometrics 46(2): 515-522 (1990).
T3 Travis, L.B., M. Gospodarowicz, R.E. Curtis et al.Lung cancer following chemotherapy and radiother-apy for Hodgkin’s disease. J. Natl. Cancer Inst. 94(3):182-192 (2002).
T4 Travis, L.B., C.E. Land, M. Andersson et al. Mortalityafter cerebral angiography with or without radioactivethorotrast: An international cohort of 3,143 two-yearsurvivors. Radiat. Res. 156(2): 136-150 (2001).
T5 Tucker, M.A., P.H. Morris Jones, J.D. Boice Jr. et al.Therapeutic radiation at a young age is linked to sec-ondary thyroid cancer. Cancer Res. 51(11): 2885-2888(1991).
T6 Travis, L.B., R.E. Curtis, M. Stovall et al. Risk ofleukemia following treatment for non-Hodgkin’s lym-phoma. J. Natl. Cancer Inst. 86(19): 1450-1457(1994).
T7 Tucker, M.A., A.T. Meadows, J.D. Boice Jr. et al.Leukemia after therapy with alkylating agents forchildhood cancer. J. Natl. Cancer Inst. 78(3): 459-464(1987).
T8 Tirmarche, M., A. Raphalen, F. Allin et al. Mortalityof a cohort of French uranium miners exposed to rel-atively low radon concentrations. Br. J. Cancer 67(5):1090-1097 (1993).
T9 Tokarskaya, Z.B., N.D. Okladnikova, Z.D. Belyaevaet al. The influence of radiation and nonradiation fac-tors on the lung cancer incidence among the workersof the nuclear enterprise Mayak. Health Phys. 69(3):356-366 (1995).
T10 Tucker, M.A., G.J. D’Angio, J.D. Boice Jr. et al. Bonesarcomas linked to radiotherapy and chemotherapy inchildren. N. Engl. J. Med. 317(10): 588-593 (1987).
T11 Tomasek, L. and V. Placek. Radon exposure and lungcancer risk: Czech cohort study. Radiat. Res. 152(6):S59-S63 (1999).
T12 Tao, Z.-F., H. Kato, Y.-R. Zha et al. Study on cancermortality among the residents in high backgroundradiation area of Yangjiang, China. p. 249-254 in:High Levels of Natural Radiation 96: Radiation Doseand Health Effects (L. Wei et al., eds.). Elsevier,Amsterdam, 1997.
T13 Tekkel, M., M. Rahu, T. Veidebaum et al. TheEstonian study of Chernobyl cleanup workers: I. Design and questionnaire data. Radiat. Res. 147(5):641-652 (1997).
T14 Tao, Z., S. Akiba, Y. Zha et al. Analysis of data(1987-1995) from investigation of cancer mortality inhigh background radiation area of Yangjiang, China.Chin. J. Radiol. Med. Prot. 19(2): 75-82 (1999).
T15 Travis, L.B., J. Weeks, R.E. Curtis et al. Leukemiafollowing low-dose total body irradiation andchemotherapy for non-Hodgkin’s lymphoma. J. Clin.Oncol. 14(2): 565-571 (1996).
T16 Tao, Z., Y. Zha, Q. Sun et al. Cancer mortality in highbackground radiation area of Yangjiang, China, 1979-1995. Natl. Med. J. China 79(7): 487-492 (1999). (InChinese).
T17 Thomas, D., D. Stram and J. Dwyer. Exposure meas-urement error: influence on exposure-disease.Relationships and methods of correction. Annu. Rev.Public Health 14: 69-93 (1993).
T18 Thomas, D., S. Darby, F. Fagnani et al. Definition andestimation of lifetime detriment from radiation
ANNEX A: EPIDEMIOLOGICAL STUDIES OF RADIATION AND CANCER 317
UNSCEAR REPORT-PART 5.qxp 10/7/08 3:41 pm Page 317
318 UNSCEAR 2006 REPORT: VOLUME I
exposures: principles and methods. Health Phys.63(3): 259-272 (1992).
T19 Tawn, E.J., C.A. Whitehouse and R.E. Tarone. FISHchromosome aberration analysis on retired radiationworkers from the Sellafield nuclear facility. Radiat.Res. 162(2): 249-256 (2004).
T20 Tawn, E.J. and C.A. Whitehouse. Persistence oftranslocation frequencies in blood lymphocytes fol-lowing radiotherapy: implications for retrospectiveradiation biodosimetry. J. Radiol. Prot. 23(4): 423-430(2003).
T21 Thomas, D.C., M. Blettner and N.E. Day. Use ofexternal rates in nested case-control studies with appli-cation to the international radiation study of cervicalcancer patients. Biometrics 48(3): 781-794 (1992).
T22 Tucker, M.A. and A.M. Goldstein. Melanoma etiol-ogy: where are we? Oncogene 22(20): 3042-3052(2003).
T23 Turesson, I., O. Zettervall, J. Cuzick et al. Comparisonof trends in the incidence of multiple myeloma inMalmo, Sweden, and other countries, 1950-1979. N.Engl. J. Med. 310(7): 421-424 (1984).
T24 Travis, L.B., M. Andersson, M. Gospodarowicz et al.Treatment-associated leukemia following testicularcancer. J. Natl. Cancer Inst. 92(14): 1165-1171 (2000).
T25 Travis, L.B., D.A. Hill, G.M. Dores et al. Breastcancer following radiotherapy and chemotherapyamong young women with Hodgkin disease. J. Am.Med. Assoc. 290(4): 465-475 (2003).
T26 Thomas, R.G. The US radium luminisers: a case fora policy of “below regulatory concern”. J. Radiol.Prot. 14(2): 141-153 (1994).
T27 Travis, L.B., R.E. Curtis, J.D. Boice Jr. et al. Secondmalignant neoplasms among long-term survivors ofovarian cancer. Cancer Res. 56(7): 1564-1570 (1996).
T28 Travis, L.B., R.E. Curtis, H. Storm et al. Risk ofsecond malignant neoplasms among long-term sur-vivors of testicular cancer. J. Natl. Cancer Inst. 89(19):1429-1439 (1997).
T29 Travis, L.B., R.E. Curtis, B. Glimelius et al. Bladderand kidney cancer following cyclophosphamide ther-apy for non-Hodgkin’s lymphoma. J. Natl. CancerInst. 87(7): 524-531 (1995).
T30 Travis, L.B., M. Hauptmann, L.K. Gaul et al. Site-specific cancer incidence and mortality after cerebralangiography with radioactive Thorotrast. Radiat. Res.160(6): 691-706 (2003).
T31 Tirmarche, M., H. Baysson and M. Telle-Lamberton.Uranium exposure and cancer risk: a review of epi-demiological studies. Rev. Epidemiol. Sante Publique52(1): 81-90 (2004). (In French).
T32 The Royal Society. The Health Hazards of DepletedUranium Munitions, Part I. Royal Society, London,2001.
T33 Tomasek, L. Czech miner studies of lung cancer riskfrom radon. J. Radiol. Prot. 22(3A): A107-A112 (2002).
T34 Tomasek, L. and H. Zarska. Lung cancer risk amongCzech tin and uranium miners — comparison of life-time detriment. Neoplasma 51(4): 255-260 (2004).
T35 Tomasek, L., T. Muller, E. Kunz et al. Study of lungcancer and residential radon in the Czech Republic.Cent. Eur. J. Public Health 9(3): 150-153 (2001).
T36 Thomas, R.K., D. Re, T. Zander et al. Epidemiologyand etiology Hodgkin’s lymphoma. Ann. Oncol. 13(Suppl. 4): 147-152 (2002).
T37 Thompson, D. and D. Easton. The genetic epidemiol-ogy of breast cancer genes. J. Mammary Gland Biol.Neoplasia 9(3): 221-236 (2004).
T38 Tomasek, L., E. Kunz, T. Muller et al. Radon expo-sure and lung cancer risk — Czech cohort study onresidential radon. Sci. Total Environ. 272(1-3): 43-51(2001).
T39 Thomas, D.B. and M.R. Karagas. Migrant studies. p.236-254 in: Cancer Epidemiology and Prevention,second edition (D. Schottenfeld and J.F. Fraumeni Jr.,eds.). Oxford University Press, New York, Oxford,1996.
T40 Tronko, M.D., T.I. Bogdanova, I.V. Komissarenko etal. Thyroid carcinoma in children and adolescents inUkraine after the Chernobyl nuclear accident: statisti-cal data and clinicomorphologic characteristics.Cancer 86(1): 149-156 (1999).
T41 Takahashi, T., K.R. Trott, K. Fujimori et al. ThyroidDisease in the Marshall Islands. Findings from 10Years of Study. Tohoku University Press, Sendai,Japan, 2001.
T42 Takahashi, T., M.J. Schoemaker, K.R. Trott et al. Therelationship of thyroid cancer with radiation exposurefrom nuclear weapon testing in the Marshall Islands.J. Epidemiol. 13(2): 99-107 (2003).
T43 Tronko, N.D., T.I. Bogdanova, O.V. Epstein et al.Thyroid cancer in children and adolescents of Ukrainehaving been exposed as a result of the Chornobyl acci-dent (15-year expertise of investigations). Int. J.Radiat. Med. 4(1-4): 222-232 (2002).
T44 Tsyb, A.F., E.M. Parshkov, V.V. Shakhtarin et al.Thyroid cancer in children and adolescents of Bryanskand Kaluga regions. p. 691-698 in: The RadiologicalConsequences of the Chernobyl Accident (A.Karaoglou et al., eds.). EUR 16544 EN (1996).
T45 Talbott, E.O., A.O. Youk, K.P. McHugh-Pemu et al.Long-term follow-up of the residents of the ThreeMile Island accident area: 1979-1998. Environ. HealthPerspect. 111(3): 341-348 (2003).
T46 Torok, S., G. Borgulya, P. Lobmayer et al. Childhoodleukaemia incidence in Hungary, 1973-2002.Interpolation model for analysing the possible effectsof the Chernobyl accident. Eur. J. Epidemiol. 20(11):899-906 (2005).
T47 Tondel, M., P. Hjalmarsson, L. Hardell et al. Increaseof regional total cancer incidence in north Sweden dueto the Chernobyl accident? J. Epidemiol. CommunityHealth 58(12): 1011-1016 (2004).
T48 Tomasek, L., V. Placek, T. Muller et al. Czech stud-ies of lung cancer risk from radon. Int. J. Low Radiat.1(1): 50-62 (2003).
T49 Travis, L.B., C.S. Rabkin, L.M. Brown et al. Cancersurvivorship — genetic susceptibility and second
UNSCEAR REPORT-PART 5.qxp 10/7/08 3:41 pm Page 318
primary cancers: research strategies and recommenda-tions. J. Natl. Cancer Inst. 98(1): 15-25 (2006).
T50 Travis, L.B. Therapy-associated solid tumors. ActaOncol. 41(4): 323-333 (2002).
T51 Travis, L.B., D. Hill, G.M. Dores et al. Cumulativeabsolute breast cancer risk for young women treatedfor Hodgkin lymphoma. J. Natl. Cancer Inst. 97(19):1428-1437 (2005).
T52 The Royal Society. The Health Hazards of DepletedUranium Munitions, Part II. Royal Society, London,2002.
U2 United Nations. Sources and Effects of IonizingRadiation. Volume I: Sources; Volume II: Effects.United Nations Scientific Committee on the Effects ofAtomic Radiation, 2000 Report to the GeneralAssembly, with scientific annexes. United Nationssales publications E.00.IX.3 and E.00.IX.4. UnitedNations, New York, 2000.
U4 United Nations. Sources and Effects of IonizingRadiation. United Nations Scientific Committee on theEffects of Atomic Radiation, 1994 Report to theGeneral Assembly, with scientific annexes. UnitedNations sales publication E.94.IX.11. United Nations,New York, 1994.
U5 United Nations. Sources and Effects of IonizingRadiation. United Nations Scientific Committee on theEffects of Atomic Radiation, 1993 Report to theGeneral Assembly, with scientific annexes. UnitedNations sales publication E.94.IX.2. United Nations,New York, 1993.
U6 United Nations. Sources, Effects and Risks of IonizingRadiation. United Nations Scientific Committee on theEffects of Atomic Radiation, 1988 Report to theGeneral Assembly, with annexes. United Nations salespublication E.88.IX.7. United Nations, New York,1988.
U7 United Nations. Genetic and Somatic Effects ofIonizing Radiation. United Nations ScientificCommittee on the Effects of Atomic Radiation, 1986Report to the General Assembly, with annexes. UnitedNations sales publication E.86.IX.9. United Nations,New York, 1986.
([U1-U15] are reserved for UNSCEAR publications)U16 UK Childhood Cancer Study Investigators. The United
Kingdom Childhood Cancer Study of exposure todomestic sources of ionising radiation: 1: radon gas.Br. J. Cancer 86(11): 1721-1726 (2002).
U17 UK Childhood Cancer Study Investigators. The UnitedKingdom Childhood Cancer Study of exposure todomestic sources of ionising radiation: 2: gamma radi-ation. Br. J. Cancer 86(11): 1727-1731 (2002).
U18 Umeki, S., S. Kyoizumi, Y. Kusunoki et al. Somaticmutation at the TCR loci as a biological dosimeter of radiation-exposed people. p. 151-154 in:International Conference on Radiation Effects andProtection. Japan Atomic Energy Research Institute,Tokyo, 1993.
V1 van Kaick, G., H. Welsch, H. Luehrs et al.Epidemiological results and dosimetric calculations —
an update of the German Thorotrast study. p. 171-175in: Health Effects of Internally DepositedRadionuclides: Emphasis on Radium and Thorium (G.van Kaick et al., eds.). World Scientific, Singapore,1995.
V2 van Leeuwen, F.E., W.J. Klokman, M. Stovall et al.Roles of radiotherapy and smoking in lung cancer fol-lowing Hodgkin’s disease. J. Natl. Cancer Inst. 87(20):1530-1537 (1995).
V3 van Kaick, G., H. Welsh, H. Luehrs et al. The GermanThorotrast study — report on 20 years follow-up. p.98-104 in: Risks from Radium and Thorotrast (D.M.Taylor et al., eds.). BIR Report 21 (1989).
V4 van Kaick, G., A. Dalheimer, S. Hornik et al. TheGerman Thorotrast study: recent results and assess-ment of risks. Radiat. Res. 152(6): 64-71 (1999).
V5 Vaeth, M., D.L. Preston and K. Mabuchi. The shapeof the cancer incidence dose-response curve for theA-bomb survivors. p. 75-78 in: Low Dose Irradiationand Biological Defense Mechanisms. (T. Sugahara,L.A. Sagan, T. Aoyama, eds.). Elsevier, Amsterdam,1992.
V6 van Leeuwen, F.E. and L.B. Travis. Second cancers.p. 2575-2602 in: Cancer Principles & Practice ofOncology, seventh edition (V.T. DeVita Jr., S.Hellman and S.A. Rosenberg, eds.). LippincottWilliams & Wilkins, Philadelphia, 2005.
V7 van Kaick, G., H. Wesch, H. Luhrs et al. Neoplasticdiseases induced by chronic alpha-irradiation — epi-demiological, biophysical and clinical results of theGerman Thorotrast study. J. Radiat. Res. (Tokyo) 32(Suppl. 2): 20-33 (1991).
V8 van Leeuwen, F.E., W.J. Klokman, M. Stovall et al.Roles of radiation dose, chemotherapy, and hormonalfactors in breast cancer following Hodgkin’s disease.J. Natl. Cancer Inst. 95(13): 971-980 (2003).
V9 van Leeuwen, F.E., W.J. Klokman, M.B. Veer et al.Long-term risk of second malignancy in survivors ofHodgkin’s disease treated during adolescence oryoung adulthood. J. Clin. Oncol. 18(3): 487-497(2000).
V10 von Hafe, P., F. Pina, A. Perez et al. Visceral fat accu-mulation as a risk factor for prostate cancer. Obes.Res. 12(12): 1930-1935 (2004).
V11 Virtanen, A., E. Pukkala and A. Auvinen. Incidenceof bone and soft tissue sarcoma after radiotherapy: Acohort study of 295,712 Finnish cancer patients. Int.J. Cancer 118(4): 1017-1021 (2006).
W1 Witte, J.S., S. Greenland, R.W. Haile et al.Hierarchical regression analysis applied to a study ofmultiple dietary exposures and breast cancer.Epidemiology 5(6): 612-621 (1994).
W2 Weiss, H.A., S.C. Darby, T. Fearn et al. Leukemiamortality after x-ray treatment for ankylosingspondylitis. Radiat. Res. 142(1): 1-11 (1995).
W3 Wang, J.X., L.A. Zhang, B.X. Li et al. Cancer inci-dence and risk estimation among medical x-ray work-ers in China, 1950-1995. Health Phys. 82(4): 455-466(2002).
ANNEX A: EPIDEMIOLOGICAL STUDIES OF RADIATION AND CANCER 319
UNSCEAR REPORT-PART 5.qxp 10/7/08 3:41 pm Page 319
320 UNSCEAR 2006 REPORT: VOLUME I
W4 Wang, Z.Q., X.P. Liu, J. Li et al. Retrospective dosereconstruction for medical diagnostic x-ray workers inChina using stable chromosome aberrations. Radiat.Prot. Dosim. 77(1-2): 87-89 (1998).
W5 Wiggs, L.D., C.A. Cox-DeVore, G.S. Wilkinson et al.Mortality among workers exposed to external ionizingradiation at a nuclear facility in Ohio. J. Occup. Med.33(5): 632-637 (1991).
W6 Wiggs, L.D., E.R. Johnson, C.A. Cox-Devore et al.Mortality through 1990 among white male workers atthe Los Alamos National Laboratory: consideringexposures to plutonium and external ionizing radia-tion. Health Phys. 67(6): 577-588 (1994).
W7 Wing, S., D. Richardson, S. Wolf et al. A case con-trol study of multiple myeloma at four nuclear facili-ties. Ann. Epidemiol. 10(3): 144-153 (2000).
W8 Weiss, H.A., S.C. Darby and R. Doll. Cancer mortal-ity following x-ray treatment for ankylosing spondyli-tis. Int. J. Cancer 59(3): 327-338 (1994).
W9 Wick, R.R., D. Chmelevsky and W. Gössner. Currentstatus of the follow-up of radium-224 treated ankylosing spondylitis patients. p. 165-169 in: HealthEffects of Internally Deposited Radionuclides:Emphasis on Radium and Thorium (G. van Kaick etal., eds.). World Scientific, Singapore, 1995.
W10 Woodward, A., D. Roder, A.J. McMichael et al.Radon daughter exposures at the Radium Hill uraniummine and lung cancer rates among former workers,1952-87. Cancer Causes Control 2(4): 213-220 (1991).
W11 Wong, F.L., J.D. Boice Jr., D.H. Abramson et al.Cancer incidence after retinoblastoma. Radiation doseand sarcoma risk. J. Am. Med. Assoc. 278(15): 1262-1267 (1997).
W12 Wilkinson, G.S., G.L. Tietjen, L.D. Wiggs et al.Mortality among plutonium and other radiation work-ers at a plutonium weapons facility. Am. J. Epidemiol.125(2): 231-250 (1987).
W13 Williams, D. Cancer after nuclear fallout: lessons fromthe Chernobyl accident. Nat. Rev. Cancer 2(7): 543-549 (2002).
W14 Williams, E.D., A. Abrosimov, T. Bogdanova et al.Thyroid carcinoma after Chernobyl latent period, mor-phology and aggressiveness. Br. J. Cancer 90(11):2219-2224 (2004).
W15 Wick, R.R., E.A. Nekolla, W. Gössner et al. Lateeffects in ankylosing spondylitis patients treated with224Ra. Radiat. Res. 152 (6 Suppl.): S8-S11 (1999).
W16 Wing, S., C.M. Shy, J.L. Wood et al. Mortality amongworkers at Oak Ridge National Laboratory. Evidenceof radiation effects in follow-up through 1984. J. Am.Med. Assoc. 265(11): 1397-1402 (1991).
W17 Wong, F.L., M. Yamada, H. Sasaki et al. Noncancerdisease incidence in the atomic bomb survivors: 1958-1986. Radiat. Res. 135(3): 418-430 (1993).
W18 Weinstock, M.A. Epidemiologic investigation of non-melanoma skin cancer mortality: the Rhode Islandfollow-back study. J. Invest. Dermatol. 102(6): 6S-9S(1994).
W19 Whitehouse, C.A., A.A. Edwards, E.J. Tawn et al.Translocation yields in peripheral blood lymphocytesfrom control populations. Int. J. Radiat. Biol. 81(2):139-145 (2005).
W20 Walsh, L., W. Rühm and A.M. Kellerer. Cancer riskestimates for gamma-rays with regard to organ-specific doses. Part II: site-specific solid cancers.Radiat. Environ. Biophys. 43(4): 225-231 (2004).
W21 Wiklund, K., J. Dich and L.E. Holm. Risk of malig-nant lymphoma in Swedish pesticide appliers. Br. J.Cancer 56(4): 505-508 (1987).
W22 Wing, S., D. Richardson, S. Wolf et al. Plutonium-related work and cause-specific mortality at the UnitedStates Department of Energy Hanford Site. Am. J. Ind.Med. 45(2): 153-164 (2004).
W23 Wakeford, R. and M.P. Little. Risk coefficients forchildhood cancer after intrauterine irradiation: areview. Int. J. Radiat. Biol. 79(5): 293-309 (2003).
W24 White-Koning, M.L., D. Hémon, D. Laurier et al.Incidence of childhood leukaemia in the vicinity ofnuclear sites in France, 1990-1998. Br. J. Cancer91(5): 916-922 (2004).
W25 Weiss, N.S., L.S. Cook, D.C. Farrow et al. Ovariancancer. p. 1040-1058 in: Cancer Epidemiology andPrevention, second edition (D. Schottenfeld and J.F.Fraumeni Jr., eds.). Oxford University Press, NewYork, Oxford, 1996.
W26 Weinberg, C.R. Potential for bias in epidemiologicstudies that rely on glass-based retrospective assess-ment of radon. Environ. Health Perspect. 103(11):1042-1046 (1995).
W27 Wang, Z.Y., J.H. Lubin, L.D. Wang et al. Residentialradon and lung cancer risk in a high-exposure area ofGansu Province, China. Am. J. Epidemiol. 155(6):554-564 (2002).
W28 Wichmann, H.E., A.S. Rosario, I.M. Heid et al.Increased lung cancer risk due to residential radon ina pooled and extended analysis of studies in Germany.Health Phys. 88(1): 71-79 (2005).
W29 Wang, J.X., P.D. Inskip, J.D. Boice Jr. et al. Cancerincidence among medical diagnostic x-ray workers inChina, 1950 to 1985. Int. J. Cancer 45(5): 889-895(1990).
W30 Wagoner, J.K. Leukemia and other malignancies fol-lowing radiation therapy for gynecological disorders.p. 153-159 in: Radiation Carcinogenesis:Epidemiology and Biological Significance (J.D. BoiceJr. and J.F. Fraumeni Jr., eds.). Raven Press, NewYork, 1984.
W31 Wiemels, J.L., J.K. Wiencke, J.D. Sison et al. Historyof allergies among adults with glioma and controls.Int. J. Cancer 98(4): 609-615 (2002).
W32 Wiemels, J.L., J.K. Wiencke, J. Patoka et al. Reducedimmuno-globulin E and allergy among adults withglioma compared with controls. Cancer Res. 64(22):8468-8473 (2004).
W33 Whittemore, A.S., L.N. Kolonel, A.H. Wu et al.Prostate cancer in relation to diet, physical activity,and body size in blacks, whites, and Asians in the
UNSCEAR REPORT-PART 5.qxp 10/7/08 3:41 pm Page 320
United States and Canada. J. Natl. Cancer Inst. 87(9):652-661 (1995).
W34 Wilson, R.T., L.E. Moore and M. Dosemeci.Occupational exposures and salivary gland cancermortality among African American and white work-ers in the United States. J. Occup. Environ. Med.46(3): 287-297 (2004).
W35 Walter, A.W., M.L. Hancock, C.H. Pui et al.Secondary brain tumors in children treated for acutelymphoblastic leukemia at St Jude Children’sResearch Hospital. J. Clin. Oncol. 16(12): 3761-3767(1998).
W36 Wiggs, L.D., C.A. Cox-DeVore and G.L. Voelz.Mortality among a cohort of workers monitored for210Po exposure: 1944-1972. Health Phys. 61(1): 71-76(1991).
W37 Wakeford, R. Cancer risk among nuclear workers. J. Radiol. Prot. 25(3): 225-228 (2005).
W38 World Health Organization. WHO Mortality Database.WHO Statistical Information System (WHOSIS),2006.
W39 Whorton, M.D., D.N. Moore, J.P. Seward et al. Cancerincidence rates among Lawrence Livermore NationalLaboratory (LLNL) employees: 1974-1997. Am. J.Ind. Med. 45(1): 24-33 (2004).
X1 Xue, X. and R.E. Shore. A method for estimatingoccupational radiation doses subject to minimumdetection levels. Health Phys. 84(1): 61-71 (2003).
X2 Xuan, X.Z., J.H. Lubin, J.Y. Li et al. A cohort studyin southern China of tin miners exposed to radon and radon decay products. Health Phys. 64(2): 120-131 (1993).
Y1 Yoshimoto, Y., H. Kato and W.J. Schull. Risk ofcancer among children exposed in utero to A-bombradiations 1950-84. Lancet 2(8612): 665-669 (1988).
Y2 Young, R.C., C.A. Perez and W.J. Hoskins. Cancer ofthe ovary. p. 1226-1265 in: Cancer Principles &Practice of Oncology, fourth edition (V.T. DeVita Jr.,S. Hellman and S.A. Rosenberg, eds.). LippincottWilliams & Wilkins, Philadelphia, 1993.
Y3 Yamada, M., F.L. Wong, S. Fujiwara et al. Noncancerdisease incidence in atomic bomb survivors: 1958-1998. Radiat. Res. 161(6): 622-632 (2004).
Y4 Yoshinaga, S., M. Hauptmann, A.J. Sigurdson et al.Nonmelanoma skin cancer in relation to ionizing radi-ation exposure among U.S. radiologic technologists.Int. J. Cancer 115(5): 828-834 (2005).
Y5 Yoshinaga, S., K. Mabuchi, A.J. Sigurdson et al.Cancer risks among radiologists and radiologic tech-nologists: review of epidemiologic studies. Radiology233(2): 313-321 (2004).
Y6 Yonehara, S., A. Brenner, M. Kishikawa et al. Clinicaland epidemiologic characteristics of first primarytumors of the central nervous system and relatedorgans among atomic bomb survivors in Hiroshimaand Nagasaki, 1958-1995. Cancer 101(7): 1644-1654(2004).
Y7 Yeh, H., G.M. Matanoski, N. Wang et al. Cancer incidence after childhood nasopharyngeal radium irra-
diation: a follow-up study in Washington County,Maryland. Am. J. Epidemiol. 153(8): 749-756 (2001).
Y8 Yap, J., P.J. Chuba, R. Thomas et al. Sarcoma as asecond malignancy after treatment for breast cancer.Int. J. Radiat. Oncol. Biol. Phys. 52(5): 1231-1237(2002).
Y9 Yoshimoto, Y., S. Yoshinaga, K. Yamamoto et al.Research on potential radiation risks in areas withnuclear power plants in Japan: leukaemia and malig-nant lymphoma mortality between 1972 and 1997 in100 selected municipalities. J. Radiol. Prot. 24(4):343-368 (2004).
Y10 Yiin, J.H., M.K. Schubauer-Berigan, S.R. Silver et al.Risk of lung cancer and leukemia from exposure toionizing radiation and potential confounders amongworkers at the Portsmouth Naval Shipyard. Radiat.Res. 163(6): 603-613 (2005).
Z1 Zhang, L., D. Jia, H. Chang et al. A retrospectivedosimetry method for occupational dose for Chinesemedical diagnostic x-ray workers. Radiat. Prot.Dosim. 77(1): 69-72 (1998).
Z2 Zha, Y.-R., J.-M. Zou, Z.-X. Lin et al. Confoundingfactors in radiation epidemiology and their compara-bility between the high background radiation areas andcontrol areas in Guangdong, China. p. 263-269 in:High Levels of Natural Radiation 96: Radiation Doseand Health Effects (L. Wei et al., eds.). Elsevier,Amsterdam, 1997.
Z3 Zhuntova, G.V., Z.B. Tokarskaya, N.D. Okladnikovaet al. The importance of radiation and non-radiation-factors for the stomach cancer incidence in workersof the atomic plant Mayak. p. 324-327 in: IRPA9,1996 International Congress on Radiation Protection.Proceedings, Volume 2. IRPA, Vienna, 1996.
Z4 Zeeb, H., M. Blettner, I. Langner et al. Mortality fromcancer and other causes among airline cabin attendantsin Europe: a collaborative cohort study in eight coun-tries. Am. J. Epidemiol. 158(1): 35-46 (2003).
Z5 Ziegler, R.G., R.N. Hoover, M.C. Pike et al. Migrationpatterns and breast cancer risk in Asian-Americanwomen. J. Natl. Cancer Inst. 85(22): 1819-1827(1993).
Z6 Zablotska, L.B., J. Patrick Ashmore and G.R. Howe.Analysis of mortality among Canadian nuclear powerindustry workers after chronic low-dose exposure toionizing radiation. Radiat. Res. 161(6): 633-641(2004).
Z7 Zeeb, H. and M. Blettner. Increasing incidence andmortality of non-Hodgkin lymphomas. An epidemio-logical review of recent studies on risk factors for non-Hodgkin lymphoma. Med. Klin. (Munich) 96(2):87-100 (2001). (In German).
Z8 Zablotska, L.B. and A.I. Neugut. Lung carcinoma afterradiation therapy in women treated with lumpectomyor mastectomy for primary breast carcinoma. Cancer97(6): 1404-1411 (2003).
Z9 Zahm, S.H., M.A. Tucker and J.F. Fraumeni Jr. Softtissue sarcomas. p. 984-999 in: Cancer Epidemiology
ANNEX A: EPIDEMIOLOGICAL STUDIES OF RADIATION AND CANCER 321
UNSCEAR REPORT-PART 5.qxp 10/7/08 3:41 pm Page 321
322 UNSCEAR 2006 REPORT: VOLUME I
and Prevention, second edition (D. Schottenfeld andJ.F. Fraumeni Jr., eds.). Oxford University Press, NewYork, Oxford, 1996.
Z10 Zahm, S.H. and M.H. Ward. Pesticides and childhoodcancer. Environ. Health Perspect. 106 (Suppl. 3): 893-908 (1998).
Z11 Zablotska, L.B., A. Chak, A. Das et al. Increased riskof squamous cell esophageal cancer after adjuvant
radiation therapy for primary breast cancer. Am. J.Epidemiol. 161(4): 330-337 (2005).
Z12 Ziegler, B.L., P.S. Sandor, U. Plappert et al. Short-term effects of early-acting and multilineagehematopoietic growth factors on the repair and pro-liferation of irradiated pure cord blood (CB) CD34+
hematopoietic progenitor cells. Int. J. Radiat. Oncol.Biol. Phys. 40(5): 1193-1203 (1998).
UNSCEAR REPORT-PART 5.qxp 10/7/08 3:41 pm Page 322