Embed Size (px)
Citation preview
Epidemiological perspectives of Acute Lower
Respiratory Infections in young Western
Australian Aboriginal and non-Aboriginal
children
Hannah Catherine Moore
BSc(Hons) GradDipClinEpi
This thesis is presented for the degree of Doctor of Philosophy
School of Paediatrics and Child Health
2011
i
Abstract
Background and Objectives
Acute lower respiratory infections (ALRI), predominantly of viral origin, are a major
cause of paediatric morbidity in developed countries. This thesis aimed to broaden the
knowledge of ALRI epidemiology in Aboriginal and non-Aboriginal children in Australia,
specifically Western Australia (WA), by examining the age-specific trends in incidence
over time, risk factors and aetiological aspects using a variety of data sources and
statistical methods.
Methods
Using the unique Western Australian Data Linkage System, a retrospective population-
based data linkage cohort study of singleton live births between 1996 and 2005 in WA
was undertaken. Hospitalisations for ALRI in Aboriginal and non-Aboriginal children up
to the age of 9 years were extracted and grouped according to specific ALRI
diagnoses. Trends in age-specific incidence rates were examined by log-linear
modeling using negative binomial regression and population attributable fractions
(PAF) of known maternal and infant risk factors for hospitalisation with ALRI were
calculated using multiple logistic regression.
To examine the aetiology of ALRI, three datasets were used. First, data were extracted
on respiratory viruses identified in nasopharyngeal or throat specimens collected
between 1997 and 2005 at WA’s only paediatric hospital in metropolitan Perth.
Binomial regression incorporating harmonic analysis was used to examine the
variations in seasonality of RSV, influenza viruses A and B, parainfluenza viruses types
1-3 and adenoviruses with Aboriginality and age. Secondly, statewide laboratory data
were linked to hospitalisations for ALRI between 2000 and 2005 among children in the
retrospective birth cohort to investigate age-specific identification rates of respiratory
ii
viruses and bacteria from ALRI hospitalisations. Finally, the identification of viruses
alone and in combination with Streptococcus pneumoniae, Moraxella catarrhalis and
Haemophilus influenzae from nasopharyngeal aspirates collected from healthy children
was determined. These data from a longitudinal community-based cohort study in rural
WA were analysed by logistic regression models incorporating generalized estimating
equations.
Results
From the retrospective cohort of 245, 249 births, of which 7.1% (17,466) identified as
Aboriginal, there were 26,106 episodes of ALRI. The overall admission rate was
16.1/1000 person-years for non-Aboriginal children and 93.0/1000 person-years for
Aboriginal children. Bronchiolitis accounted for 45.9% of ALRI episodes while
pneumonia accounted for 29.6%. Between 1996-2000 and 2001-2005 all-cause
pneumonia hospitalisations fell in Aboriginal children aged 6-35 months with no
equivalent decline in non-Aboriginal children, partly attributable to the introduction of
pneumococcal conjugate vaccine. The disparity for pneumonia between Aboriginal and
non-Aboriginal children declined by a third.
In non-Aboriginal children, being born in autumn accounted for 12.3% of the PAF for
ALRI and being born to a mother with three or more previous pregnancies accounted
for 15.4%. Elective caesarean delivery was associated with an increased number of
admissions for bronchiolitis in young non-Aboriginal children independent of maternal
factors and pregnancy complications. In Aboriginal children, a remote location at birth
accounted for 11.7%, maternal age <20 years accounted for 11.2% and being in the
most disadvantaged socio-economic group accounted for 18.4% of the PAF for ALRI.
From the 8980 hospitalisations for ALRI that were linked to a laboratory record, 57.9%
recorded a positive identification of a respiratory virus or bacteria. RSV was the virus
most commonly identified among children in the metropolitan area (18.6%) and among
iii
children throughout WA represented in the population-based data linkage analyses
(39.5%). Other common identified viruses from population-based data linkage were
influenza viruses, parainfluenza virus type 3 and picornaviruses. Bordetella pertussis
was identified in 21.2% of children tested overall and was identified not only in
whooping cough-coded hospitalisations but also hospital admissions coded for
bronchiolitis, pneumonia, influenza and unspecified ALRI. Invasive bacterial disease
was under-represented in the dataset. In the metropolitan area, seasonality differed
between all viruses and varied with age for RSV, influenza viruses and adenoviruses.
Influenza virus activity peaked earlier in the season in Aboriginal children than non-
Aboriginal children. Rhinoviruses were identified in 23.6% of healthy Aboriginal children
and 16.5% in healthy non-Aboriginal children and were associated with carriage of H.
influenzae and M. catarrhalis. Adenoviruses were also frequently identified in healthy
Aboriginal and non-Aboriginal children and were negatively associated with carriage of
S. pneumoniae.
Conclusions
This thesis demonstrates the usefulness of population-based data linkage to explore
epidemiological aspects of ALRI and for the first time, has linked statewide laboratory
data to other administrative health datasets. The variability in seasonality of ALRI
hospitalisations and virus identifications with age, Aboriginality and geographical area
needs to be taken into account when identifying target groups and timing for
vaccination and other interventions. Specific key target areas for prevention of ALRI
are maternal smoking during pregnancy, reducing elective caesareans in non-
Aboriginal women and improved access to clinical services and living conditions for the
Aboriginal population. In light of current and future interventions, it is important to
continue monitoring the burden of ALRI.

iv
v
Table of Contents
Acknowledgements ........................................................................................ x
Statement of Contribution .............................................................................xii
List of Tables.................................................................................................xiii
List of Figures.................................................................................................xv
List of Abbreviations .....................................................................................xvi
Chapter 1: Introduction................................................................................... 1
1.1 Overview ................................................................................................................................. 2
1.2 Outline of chapters ................................................................................................................. 2
Chapter 2: Literature Review .......................................................................... 5
2.1 Preamble................................................................................................................................. 6
2.2 Introduction ............................................................................................................................ 6
2.3 Burden of ALRI in hospitalised children .................................................................................. 7
2.3.1 Non-Indigenous populations................................................................................... 7
2.3.2 Indigenous populations .......................................................................................... 8
2.3.3 Limitations of hospitalisation studies ................................................................... 10
2.4 Aetiology ............................................................................................................................... 12
2.4.1 Viruses................................................................................................................... 12
2.4.2 Bacteria ................................................................................................................. 15
2.4.3 Co-infection........................................................................................................... 15
2.4.4 Seasonality ............................................................................................................ 16
2.5 Causal pathways to hospitalisation....................................................................................... 16
2.6 Interventions for ALRI ........................................................................................................... 18
2.7 What role can data linkage play in investigating ALRI? ........................................................ 21
2.8 Conclusions ........................................................................................................................... 22
Chapter 3: Aims and Objectives .................................................................... 23
3.1 Overall aim ............................................................................................................................ 24
3.2 Research Objectives.............................................................................................................. 24
Chapter 4: Methodology ............................................................................... 26
vi
4.1 Preamble................................................................................................................................27
4.2 Study population and setting ................................................................................................27
4.3 Data linkage in Western Australia .........................................................................................28
4.4 Datasets .................................................................................................................................29
4.4.1 Midwives’ Notification System..............................................................................29
4.4.2 Birth and Death Register .......................................................................................29
4.4.3 Hospital Morbidity Data System............................................................................29
4.5 Data cleaning .........................................................................................................................30
4.5.1 Birth cohort ...........................................................................................................30
4.5.2 Hospitalisation for ALRI .........................................................................................31
4.6 Laboratory Data.....................................................................................................................32
4.6.1 Metropolitan virology data: PathWest Laboratory Database ...............................33
4.6.2 Rural bacteriology and virology data: Kalgoorlie Otitis Media Research Project..34
4.6.3 State-wide pathology data: PathWest Laboratory Database................................35
4.7 Statistical analysis..................................................................................................................36
4.8 Ethical approval .....................................................................................................................37
Chapter 5: Hospitalised ALRI ......................................................................... 38
5.1 Preamble................................................................................................................................39
5.2 Age-specific trends of ALRI hospitalisation ...........................................................................39
5.2.1 Introduction...........................................................................................................39
5.2.2 Methods ................................................................................................................41
5.2.2.1 Setting and data source......................................................................................41
5.2.2.2 Statistical analysis...............................................................................................41
5.2.3 Results ...................................................................................................................42
5.2.4 Discussion ..............................................................................................................52
5.3 Seasonality of bronchiolitis hospitalisations .........................................................................55
Chapter 6: Causal Pathways to Hospitalisation Part I - Target Areas for
Prevention .................................................................................................... 58
6.1 Preamble................................................................................................................................59
6.2 Introduction...........................................................................................................................59
6.2 Methods ................................................................................................................................61
vii
6.2.1 Setting and data sources....................................................................................... 61
6.2.2 Risk factors............................................................................................................ 61
6.2.3 Statistical analysis ................................................................................................. 62
6.3 Results................................................................................................................................... 63
6.4 Discussion.............................................................................................................................. 75
6.5 Conclusion............................................................................................................................. 79
Chapter 7: Causal Pathways to Hospitalisation Part II - Elective Caesarean
Delivery and Repeated Bronchiolitis Hospitalisations.................................... 80
7.1 Preamble............................................................................................................................... 81
7.2 Introduction .......................................................................................................................... 81
7.3 Methods................................................................................................................................ 82
7.3.1 Data Source........................................................................................................... 82
7.3.2 Statistical Analysis................................................................................................. 83
7.4 Results................................................................................................................................... 84
7.5 Discussion.............................................................................................................................. 91
Chapter 8: Aetiology of ALRI Part I - Seasonality of Viruses Identified in
Metropolitan Perth....................................................................................... 95
8.1 Preamble............................................................................................................................... 96
8.2 Introduction .......................................................................................................................... 96
8.3 Methods................................................................................................................................ 97
8.3.1 Setting and data extraction................................................................................... 97
8.3.2 Microbiologic investigation................................................................................... 98
8.3.3 Statistical analysis ................................................................................................. 98
8.4 Results................................................................................................................................... 99
8.4.1 Specimens collected ............................................................................................. 99
8.4.2 Respiratory viruses identified ............................................................................. 100
8.4.3 Seasonality and temporal trends........................................................................ 105
8.4.3.1 Respiratory syncytial virus ............................................................................... 105
8.4.3.2 Influenza viruses .............................................................................................. 105
8.4.3.3 Parainfluenza virus........................................................................................... 110
8.4.3.4 Adenovirus ....................................................................................................... 111
viii
8.5 Discussion ............................................................................................................................111
Chapter 9: Aetiology of ALRI Part II - Interactions Between Respiratory Viruses
and Pathogenic Bacteria.............................................................................. 115
9.1 Preamble..............................................................................................................................116
9.2 Introduction.........................................................................................................................116
9.3 Materials and Methods .......................................................................................................118
9.3.1 Study population .................................................................................................118
9.3.2 Laboratory methods ............................................................................................118
9.3.3 Statistical analysis................................................................................................119
9.3.4 Ethical approval ...................................................................................................120
9.4 Results .................................................................................................................................120
9.4.1 Nasopharyngeal specimens.................................................................................120
9.4.2 Viruses identified in nasopharyngeal specimens ................................................120
9.4.3 Associations between viruses and bacterial OM pathogens...............................122
9.4.3 Associations between viruses and bacterial OM pathogens...............................123
9.4.4 Simultaneous identification of viruses ................................................................127
9.5 Discussion ............................................................................................................................127
Chapter 10: Aetiology of ALRI Part III - Acquisition of Statewide Laboratory
Data ............................................................................................................ 132
10.1 Preamble............................................................................................................................133
10.2 Introduction.......................................................................................................................133
10.2.1 Metropolitan Corporate Laboratory Information System (ULTRA)...................134
10.2.2 Branch Laboratory Information System ............................................................134
10.3 Acquisition of data.............................................................................................................135
10.4 Data cleaning .....................................................................................................................136
10.4.1 Description of data ............................................................................................136
10.4.2 Episodes.............................................................................................................137
10.4.3 Development of coding guidelines....................................................................138
10.4.3.1 Flag 1: Serology...............................................................................................140
10.4.3.2 Flag 2: Complement Fixation Testing .............................................................140
10.4.3.3 Flag 3: Viral PCR..............................................................................................141
10.4.3.4 Flag 4: Alpha result code ................................................................................141
ix
10.4.3.5 Specimen........................................................................................................ 142
10.4.3 Implementation of coding guidelines ............................................................... 143
10.5 Results............................................................................................................................... 146
10.6 Conclusions ....................................................................................................................... 148
Chapter 11: Aetiology of ALRI Part III - Analysis of Statewide Laboratory Data
and ALRI Hospitalisations............................................................................ 149
11.1 Preamble........................................................................................................................... 150
11.2 Introduction ...................................................................................................................... 150
11.3 Methods............................................................................................................................ 151
11.3.1 Hospital morbidity data .................................................................................... 151
11.3.2 Laboratory data................................................................................................. 152
11.3.3 Data linkage and statistical analysis.................................................................. 153
11.4 Results............................................................................................................................... 154
11.4.1 Overall laboratory data linkage ........................................................................ 154
11.4.2 Identification of viruses and bacteria ............................................................... 156
11.4.3 Aetiology by ALRI diagnosis .............................................................................. 158
11.5 Discussion.......................................................................................................................... 164
Chapter 12: Discussion................................................................................ 168
12.1 Summary of findings ......................................................................................................... 169
12.2 Strengths........................................................................................................................... 171
12.3 Limitations......................................................................................................................... 173
12.4 Originality.......................................................................................................................... 177
12.5 Implications and recommendations for policy ................................................................. 177
12.6 Directions for future research........................................................................................... 182
12.7 Conclusions ....................................................................................................................... 187
Chapter 13: References............................................................................... 188
Appendix 1: Outputs arising from Chapter 5 ............................................... 212
Appendix 2: Outputs arising from Chapter 6 .........Error! Bookmark not defined.
Appendix 3: Outputs arising from Chapter 8 .........Error! Bookmark not defined.
Appendix 4: Outputs arising from Chapter 9 .........Error! Bookmark not defined.
x
Acknowledgements
First of all, I must sincerely thank my three supervisors, Deborah Lehmann, Nicholas de Klerk
and Peter Richmond who have taught me so much over the past 4-5 years and have provided
support and encouragement throughout my candidature. I am very grateful for the
opportunity that Deborah gave me to join the infectious diseases team and allow me time to
choose a PhD topic that I really wanted to do. Deborah has given me many opportunities to
travel to conferences to present my work and attend courses throughout my PhD candidature
and I am grateful to her for teaching me so much over the years. Nick has always been very
supportive and helpful and was always able to put things into perspective and for that I thank
him. Peter, aka the running man, has offered much support and advice throughout my PhD
candidature and although he has a busy schedule, he was a very caring supervisor and his
clinical input was invaluable. I thank all three of my supervisors for introducing me to
numerous researchers and networks in order for me to develop my career path.
I would like to thank the Western Australian Data Linkage Branch, in particular Di Rosman and
Carol Garfield who assisted with my application to access laboratory data from PathWest
Laboratory data. It has been a great experience to be involved with the development of the
Memorandum of Understanding to link laboratory data for the first time. To personnel within
PathWest Laboratory Medicine including Graham Francis, Brett Cawley, Rodney Bowman,
Simon Williams, Deborah Hoddy, Katie Lindsay and Anthony Jones who have helped me with
the acquisition, coding and interpreting laboratory data; thank you. In particular I would like to
thank David Smith and Tony Keil who have always been very supportive and encouraging in my
research and have helped me understand the intricacies of laboratory procedures and data. I
would also like to thank colleagues at the Telethon Institute for Child Health research, in
particular Peter Jacoby, Peter Cosgrove, Margaret Wood and Kim Carter who have helped with
data extraction, coding and analysis whenever I needed it.
The Telethon Institute for Child Health Research has a very supportive culture for students and
I acknowledge the support from the postgraduate student group and fellow PhD students who
have helped me persist through this journey. To other colleagues at the Telethon Institute for
Child Health Research past and present that have helped me and supported me, I thank you. In
particular I would like to thank a past colleague and a dear friend, Glenys Dixon, who taught
me that it’s just a PhD, not a Nobel Peace Prize.
xi
I also thank the many groups that have provided me with funding throughout my candidature
to travel to conferences and present my research findings. In particular I thank the Stan Perron
Charitable Foundation who provided me with funds through the Stan and Jean Perron Award
for Meritorious Performance in 2010. I also thank the National Health and Medical Research
Council for funding the project grant that allowed me to complete this PhD.
Finally and most importantly, I would like to thank my family and friends for their never-ending
love and support. No one ever said doing a PhD was easy but with the backing of friends and
family, it was achievable. Above all, Willow, my fiancé who proposed to me during the last year
of my PhD, has believed in me, encouraged me and never once doubted my intellectual or
emotional ability to complete whatever task needed to be done in order to produce this thesis.
Willow, my family and friends have supported me through the emotional rollercoaster that is
doing a PhD and have ridden with me the highs and the lows. I am sure I will have their
continuing support as I embark post PhD life; whatever that might be.
xii
Statement of Contribution
This thesis has been completed during my period of candidature for the degree of Doctor of
Philosophy at the University of Western Australia. The thesis comprises my own original work
except where otherwise stated. Some of the published work or work prepared for publication
has been co-authored. Co-authors have given permissions for the work to be included in this
thesis and the contribution of each co-author to the published work arising from this thesis is
detailed in signed statements which are included in the Appendices. The work contained in this
thesis has not been submitted for any other degree.
Hannah Catherine Moore
14 July 2011
xiii
List of Tables
TABLE 2.1 Incidence rates of hospitalisations for ALRI for non-Indigenous and
Indigenous children in developed countries
9
TABLE 2.2 Viral and bacterial pathogens associated with ALRI hospitalisations 14
TABLE 4.1 International Classification of Diseases (ICD) diagnosis codes 9th
and 10th
version used to identify ALRI hospitalisations
32
TABLE 5.1 Hospitalisation rates and rate ratios for all-cause pneumonia, bronchiolitis
and other ALRIs in Aboriginal and non-Aboriginal children in the period
1996-2000 and 2001-2005
45
TABLE 5.2 Trend estimates for all-cause pneumonia, pneumococcal pneumonia,
bronchiolitis and other ALRIs 1996 to 2005 by age group and Aboriginality
47
TABLE 6.1 Frequency of hospitalisations by ALRI diagnosis and age group in Aboriginal
and non-Aboriginal children
65
TABLE 6.2 Frequency of births admitted at least once for ALRI before age 2 years by
risk factor
67
TABLE 6.3 Odds ratios and population attributable fractions for ALRI hospitalisation
before age 2 years in non-Aboriginal children
72
TABLE 6.4 Odds ratios and population attributable fractions for ALRI hospitalisation
before age 2 years in Aboriginal children
74
TABLE 7.1 Delivery method of singleton non-Aboriginal infants 37-42 weeks gestation
and the proportion admitted to hospital at least once for bronchiolitis and
pneumonia
86
TABLE 7.2 Associations between mode of delivery and other maternal and infant
factors and number of bronchiolitis hospital admissions in non-Aboriginal
children <12 months and 12-23 months
88
TABLE 7.3 Associations between mode of delivery and other maternal and infant
factors and number of pneumonia hospital admissions in non-Aboriginal
children <12 months and 12-23 months
90
TABLE 8.1 Number (percent) of specimens collected between May 1997 and
December 2005 for detection of respiratory viruses and number (percent)
positive by age in Aboriginal and non-Aboriginal children
102
xiv
TABLE 8.2 Number (percent), identification rate and median age (months) at time of
identification of the most common viruses identified from nasopharyngeal
or throat specimens, in Aboriginal and non-Aboriginal children between
May 1997 and December 2005
103
TABLE 8.3 Results of generalised linear models using seasonal harmonic analysis 107
TABLE 9.1 Respiratory viruses identified in nasopharyngeal samples collected from
asymptomatic Aboriginal and non-Aboriginal children
121
TABLE 9.2 The co-occurrence of bacterial OM pathogens with rhinoviruses and
adenoviruses in nasopharyngeal specimens from asymptomatic Aboriginal
and non-Aboriginal children
125
TABLE 9.3 Associations between isolation of bacterial OM pathogens and rhinoviruses
in asymptomatic Aboriginal and non-Aboriginal children
126
TABLE 9.4 Associations between isolation of bacterial OM pathogens and
adenoviruses in asymptomatic Aboriginal and non-Aboriginal children
126
TABLE 10.1 Specimen groups coded from PathWest Laboratory Database 143
TABLE 10.2 Indicator fields representing ALRI viruses and bacteria and method of
laboratory identification coded from PathWest Laboratory Database
145
TABLE 11.1 Characteristics of hospital admissions for ALRI 2000-2005 with and without
laboratory data
155
TABLE 11.2 Number and proportion of ALRI hospital admissions that linked to
laboratory data with a positive (virus or bacteria from sterile or non-sterile
site), negative or no coded laboratory result
158
TABLE 11.3 Frequency of respiratory pathogens identified in ALRI hospital admissions,
2000-2005
161
TABLE 11.4 Frequency of respiratory pathogens identified in bronchiolitis-coded
hospital admissions, 2000-2005 by age group
162
TABLE 11.5 Frequency of respiratory pathogens investigated in pneumonia-coded
hospital admissions, 2000-2005 by age group
163
TABLE 12.1 Summary of results and policy recommendations 181
TABLE 12.2 Novel results and directions for future research 186
xv
List of Figures
FIGURE 2.1 Possible causal pathways to hospitalisation with ALRI 19
FIGURE 5.1 Annual age-specific incidence rates for all-cause pneumonia in non-Aboriginal
and Aboriginal children, 1996 to 2005
49
FIGURE 5.2 Smoothed (3-year moving average) age-specific incidence rates for
pneumococcal pneumonia in non-Aboriginal and Aboriginal children, 1996 to
2005
50
FIGURE 5.3 Annual age-specific incidence rates for bronchiolitis and all other ALRIs
(whooping cough, influenza, bronchitis, unspecified ALRI) in non-Aboriginal and
Aboriginal children, 1996 to 2005
51
FIGURE 5.4 Monthly distribution of bronchiolitis hospitalisations by region of child’s birth,
1996-2005
57
FIGURE 8.1 Viral identification rates for RSV (A), influenza viruses (B), PIV1-3 (C) and
adenovirus (D) by age in Aboriginal and non-Aboriginal children 1997-2005
104
FIGURE 8.2 Overall temporal trends of identification rates for RSV, influenza virus A and B,
PIV1, PIV3 and adenovirus 1997-2005
106
FIGURE 8.3 Fitted values of the proportion positive by month of identification of RSV (A),
influenza viruses A and B (B), PIV1 (C), PIV3 (D), and adenovirus (E) generated
by generalized linear models
108
FIGURE 8.4 Fitted values of the proportion positive by month of identification of RSV for
Aboriginal and non-Aboriginal children generated by a generalised linear model
with age interaction terms
109
FIGURE 8.5 Fitted values of the proportion positive by month of identification of influenza
viruses A and B for Aboriginal children aged 12-23 months generated by a
generalized linear model with year interaction terms
109
FIGURE 8.6 Fitted values of the proportion positive by month of identification of influenza
viruses A and B for non-Aboriginal children of varying age in 2003 generated by
a generalized linear model with age interaction terms
110
FIGURE 9.1 Proportion of rhinoviruses and adenoviruses identified in nasopharyngeal
specimens of asymptomatic Aboriginal and non-Aboriginal children by age
group
122
FIGURE 10.1 Map of PathWest regional laboratories 135
FIGURE 10.2 Process of data cleaning of PathWest Laboratory Databases 139
FIGURE 11.1 Number of ALRI admissions tested and found positive for respiratory pathogens 159
xvi
List of Abbreviations
7vPCV 7-valent pneumococcal conjugate vaccine
ALRI Acute lower respiratory infection
BLIS Branch Laboratory Information System
CI Confidence interval
GAPP Global Action Plan for the Prevention and Control of Pneumonia
GEE Generalized estimating equations
HMDS Hospital morbidity data system
hMPV Human metapneumovirus
ICD International classification of diseases
IF Immunofluorescence
IRR Incidence rate ratio
KOMRP Kalgoorlie Otitis Media Research Project
NPA Nasopharyngeal aspirate
NT Northern Territory
OM Otitis media
OR Odds ratio
PAF Population attributable fraction
PCR Polymerase chain reaction
PIV Parainfluenza virus
PMH Princess Margaret Hospital for Children
PTAR Person-time-at-risk
RSV Respiratory syncytial virus
ULTRA Metropolitan Corporate Laboratory Information System
USA United States of America
WA Western Australia
WADLS Western Australian Data Linkage System

1
CHAPTER 1
Introduction
2
1.1 Overview
This thesis is presented as a series of papers exploring the epidemiology of acute
lower respiratory infections (ALRI) in children of Western Australia (WA). Chapters 2, 5
through 9 and 11 take the format of papers and have either been published or been
submitted for publication and are now under review. Each of these chapters contains
an introduction, methods specific to the study, results and discussion. Copies of the
published papers and author declarations are attached in the Appendices. The
remaining chapters (Chapters 3, 4, 10 and 12) are not formatted as papers and have
not been submitted for publication. Each chapter is prefaced with a preamble to explain
the format and aim of the chapter and how it relates to the overall aim of the thesis.
1.2 Outline of chapters
The next chapter (Chapter 2) is a review of the current literature around the
epidemiology of ALRI in children relevant to this thesis. I review the burden of ALRI
hospitalisations with a focus on developed countries, aetiology, causal pathways to
hospitalisation, current available interventions and consider the role of data linkage in
future epidemiological studies of ALRI. Chapter 2 forms the background on which the
aims of this thesis were based. This chapter has been submitted in part, for publication
in the Australasian Epidemiologist.
Chapters 3 outlines the research aims of the thesis and Chapter 4, the methodologies
that were common to each of the results chapters. These chapters have not been
submitted for publication. Chapter 5 consists of two papers focusing on the burden of
hospitalised ALRI in WA children. The first is a paper documenting the population-
based age-specific trends of pneumonia and other diagnostic categories of ALRI in
Aboriginal and non-Aboriginal children. This has been published in the Journal of
Epidemiology and Community Health. The second is a letter to the editor published in
3
the Medical Journal of Australia documenting the seasonal distribution of
hospitalisations for bronchiolitis in different geographical areas of WA.
Chapters 6 and 7 focus on the causal pathways to hospitalisation with ALRI and
consist of one paper per chapter. The first paper in Chapter 6 investigates maternal
and infant risk factors for hospitalisation with ALRI separately in Aboriginal and non-
Aboriginal children and estimates population attributable fractions in order to guide
public health prevention policies. This has been published in BMC Public Health. The
second paper is an extended analysis of this work investigating the relationship
between mode of delivery, in particular elective caesarean deliveries, and risk of
recurrent hospital admissions for both bronchiolitis and pneumonia in the first 2 years
of life in non-Aboriginal children only. This has been submitted for publication in
Archives of Disease in Childhood.
Chapters 8 through 11 explore the aetiology of ALRI in three different settings. Chapter
8 investigates the seasonal and age distribution of respiratory viruses identified in
Aboriginal and non-Aboriginal children living in Perth. This study assesses the
feasibility of extracting and coding routinely collected laboratory data and was an
important basis for the broader population-based laboratory data linkages. This paper
was published in The Pediatric Infectious Disease Journal. Chapter 9 investigates the
viral and bacterial interactions in healthy Aboriginal and non-Aboriginal children in a
rural area of WA. This paper was also published in The Pediatric Infectious Disease
Journal. Chapters 10 and 11 explore the use of state-wide laboratory data in order to
investigate the aetiology of ALRI in children throughout the state. Chapter 10 outlines
the acquisition, cleaning and coding of the data and has not been submitted for
publication. Chapter 11 links the laboratory data to the ALRI hospitalisation data used
in Chapters 5 through 7 and investigates the predictors of successful linkage and
reports on the proportion of various ALRI-coded admissions where a respiratory

4
pathogen has been identified. This paper has been submitted to the Journal of
Paediatrics and Child Health.
The final chapter, Chapter 12, summarises the major findings from this body of work,
discusses the implications, recommendations for policy and future directions for data
analysis and research.
5
CHAPTER 2
Literature Review:
Acute lower respiratory infections in children: burden,
aetiology and causal pathways to hospitalisation
6
2.1 Preamble
This chapter provides an overview of the literature and an introduction to the topic of
this thesis. The aim of this literature review is to describe the epidemiology of ALRI in
hospitalised children with a focus on developed countries, including aetiology and
causal pathways to hospitalisation, as well as current interventions, and how data
linkage studies can play a role in ongoing investigations. This chapter was submitted in
part as a review article to Australasian Epidemiologist.
2.2 Introduction
In Australia and many other developed countries, ALRI is one of the most common
reasons for hospitalisation in young children,1 and worldwide ALRI is the most common
cause of death in children aged less than 5 years.2 An ALRI is any acute infection
involving the lower part of the respiratory system from the trachea to the lung
parenchyma. As a result, ALRI has a broad clinical spectrum incorporating whooping
cough, pneumonia, bronchiolitis, bronchitis, influenza and bronchopneumonia and the
epidemiology of these clinical diagnostic categories varies. Bronchiolitis is
characterised by swelling of the bronchioles, the smallest passages in the lung and
therefore narrowing of the airways. Bronchiolitis is mainly characterised by wheezing
but is also a clinical syndrome of cough, tachypnoea, and difficulties with breathing and
feeding.3 Bronchiolitis or viral-induced wheeze can also increase the risk of asthma in
children,4, 5 and therefore asthma is often included in investigations of ALRI.
Pneumonia is inflammation of the lung which is usually diagnosed by a chest
radiograph and is characterised by fever, difficulty in breathing and cough. Influenza is
an acute respiratory illness characterised by high fever and one or more respiratory
symptoms including cough, malaise, myalgia, sore throat and headache. Whooping
cough is characterised by prolonged paroxysmal coughing that may be associated with
vomiting and an inspiratory whooping sound; it may be complicated by pneumonia. As
7
pneumonia and bronchiolitis account for 80-91% of all ALRI admissions in children,6
and the International Classification of Diseases (ICD) diagnostic coding of different
ALRIs in hospitalised children is not always consistent, many studies focus on ALRI as
an aggregated group of diagnoses.
2.3 Burden of ALRI in hospitalised children
Beyond the neonatal period, infection is by far the most common reason for
hospitalisation in children aged under 2 years in WA, with ALRI contributing to 21% of
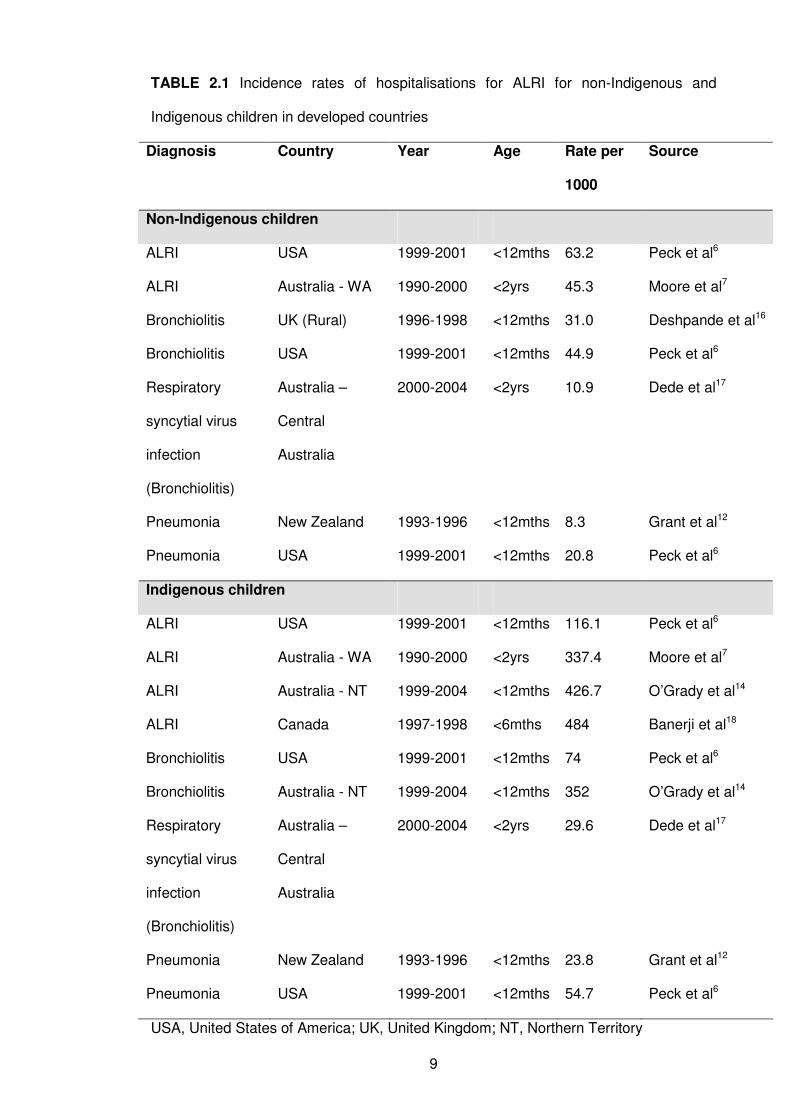
all admissions due to infection.1 The reported incidence of ALRI hospitalisations has
varied between countries, geographic areas, age groups investigated and the definition
of ALRI (Table 2.1).
Children living in rural and remote areas tend to have higher hospitalisation rates, even
though they have less access to health services. In a previous analysis of ALRI
hospitalisations in children under the age of 2 years in WA, we reported hospitalisation
rates for pneumonia in children living in rural and remote areas of WA approximately 2
times higher than those children residing in metropolitan areas.7 The burden of ALRI is
greater in Indigenous populations than in non-Indigenous populations; in WA ALRI
admission rates were 7.5 (95% confidence interval (CI) 7.2-7.7) times higher in
Indigenous children in the period 1990-2000 than in non-Indigenous children in the
same period.7 Therefore, in countries with a significant Indigenous population, like
Australia, it is necessary to disaggregate hospitalisation estimates according to
Indigenous status.
2.3.1 Non-Indigenous populations
In WA, the ALRI hospital admission rate in children under the age of 2 years was
45.3/1000 live births in the period 1990-2000.7 However, as ALRI rates are highest in
infants, defined as under the age of 12 months, most international comparisons are
8
based on this age group (Table 2.1). In WA during the 1990s, ALRI hospitalisation
rates, in particular for bronchiolitis increased from 25 to 40/1000 live births in non-
Aboriginal infants.7 Increasing bronchiolitis rates were not only occurring in Australia
during this time but also in Sweden,8 the United States of America (USA),6 the
Netherlands9 and Canada.10 Hospitalisation rates for pneumonia are generally lower
than those for bronchiolitis (Table 2.1) but pneumonia is considered to be more severe,
caused by bacterial coinfection and associated with high mortality especially in
developing countries. Influenza hospitalisation rates are again lower than bronchiolitis
and pneumonia; for example in WA children aged less than 2 years in the 1990s the
rate of influenza hospitalisation was 1.6/1000 live births.7 In general, ALRI
hospitalisation rates for non-Indigenous Australian children are comparable to other
international estimates in developed countries (Table 2.1). However, the rates of ALRI
in the WA non-Aboriginal population have not been documented since 2000 and in light
of increasing rates of bronchiolitis in 1990s, it is important to ascertain whether this
increase has levelled off in more recent years.
2.3.2 Indigenous populations
A higher burden of ALRI has been reported among American Indian and Alaskan
Natives, New Zealand Maoris, Canadian Aboriginal and Australian Aboriginal children
compared to their non-Indigenous counterparts.1, 6, 11, 12 According to the Australian
Bureau of Statistics, Aboriginal Australians are hospitalised for influenza and
pneumonia around 5 times more often than other Australians.13 In the Northern
Territory of Australia (NT), 1 in 5 Indigenous infants are hospitalised with ALRI before
their first birthday,14 and in WA in the 1990s, 1 in 8 Indigenous infants were
hospitalised with bronchiolitis in the first 2 years of life.1 As seen from Table 2.1, the
rates of ALRI, specifically bronchiolitis and pneumonia, are markedly higher in
Indigenous populations than non-Indigenous populations. In addition, Australian
Aboriginal children have a longer duration of stay in hospital for ALRI than non-
Aboriginal children.1, 15
9
TABLE 2.1 Incidence rates of hospitalisations for ALRI for non-Indigenous and
Indigenous children in developed countries
Diagnosis Country Year Age Rate per
1000
Source
Non-Indigenous children
ALRI USA 1999-2001 <12mths 63.2 Peck et al6
ALRI Australia - WA 1990-2000 <2yrs 45.3 Moore et al7
Bronchiolitis UK (Rural) 1996-1998 <12mths 31.0 Deshpande et al16
Bronchiolitis USA 1999-2001 <12mths 44.9 Peck et al6
Respiratory
syncytial virus
infection
(Bronchiolitis)
Australia –
Central
Australia
2000-2004 <2yrs 10.9 Dede et al17
Pneumonia New Zealand 1993-1996 <12mths 8.3 Grant et al12
Pneumonia USA 1999-2001 <12mths 20.8 Peck et al6
Indigenous children
ALRI USA 1999-2001 <12mths 116.1 Peck et al6
ALRI Australia - WA 1990-2000 <2yrs 337.4 Moore et al7
ALRI Australia - NT 1999-2004 <12mths 426.7 O’Grady et al14
ALRI Canada 1997-1998 <6mths 484 Banerji et al18
Bronchiolitis USA 1999-2001 <12mths 74 Peck et al6
Bronchiolitis Australia - NT 1999-2004 <12mths 352 O’Grady et al14
Respiratory
syncytial virus
infection
(Bronchiolitis)
Australia –
Central
Australia
2000-2004 <2yrs 29.6 Dede et al17
Pneumonia New Zealand 1993-1996 <12mths 23.8 Grant et al12
Pneumonia USA 1999-2001 <12mths 54.7 Peck et al6
USA, United States of America; UK, United Kingdom; NT, Northern Territory
10
Although pneumonia is associated with the largest relative disparity between
Indigenous and non-Indigenous children (in the 1990s WA hospitalisation rates for
pneumonia were 17.6 times higher in Aboriginal than non-Aboriginal infants7),
bronchiolitis admissions are more common and similar to non-Aboriginal children,
hospitalisation rates are higher for bronchiolitis than for pneumonia (Table 2.1).
Hospitalisation rates in Indigenous children from developed countries suggest that,
apart from Canada, hospitalisation rates for ALRI are higher among Australian
Indigenous children than among Indigenous children from New Zealand and USA.
2.3.3 Limitations of hospitalisation studies
There are limitations to using hospitalisation data to assess the burden of ALRI caused
by different pathogens. First, hospital admissions represent more severe ALRI and
underestimate the true burden of ALRI. To prevent transmission and population spread
of these infections, we need to investigate the burden of ALRI at the community level,
but there are few such published studies. One Australian study using parent-reported
episodes of acute respiratory illness estimated an incidence rate of 5.8 episodes per
child-year, or 0.48 per child-month with a peak of 0.87 episodes per child-month in
winter.19 Another study from WA documented the epidemiological characteristics of
emergency department presentations to the four major teaching hospitals in
metropolitan Perth in children and adults diagnosed with an upper respiratory
infection.20 These data, which were not stratified according to Aboriginality showed that
acute upper respiratory infections, predominantly tonsillitis and croup, accounted for
3.6% of all emergency department presentations across all ages and 81% of these
admissions were in children under the age of 15 years.20 There are no published data
documenting the out-of-hospital burden of ALRI in WA or in Aboriginal children.
Nevertheless, hospitalisation studies represent the greater burden on the health
system and are more likely to capture ALRI-associated morbidity and mortality.
11
The second major limitation is the lack of laboratory data to confirm the clinical
diagnoses recorded on hospital morbidity databases. Numerous studies have
attempted to estimate the burden of pathogen-specific ALRI using an excess
hospitalisation method which involves measuring the excess rates of hospitalisation
due to acute respiratory illness when circulation of a virus (e.g. influenza) is high
compared with when it is low.21 A weakness of this method is the lack of confirmatory
laboratory data and the reliance on ICD coding. Nicholson et al incorporated limited
virology data into a hospitalisation study and reported alarming results: none of the
influenza-positive cases were allocated to influenza ICD codes, only 58% were coded
as acute respiratory disease and there was considerable overlap between respiratory
syncytial virus (RSV) and influenza seasonal activity and a lack of distinctive clinical
features.22 Another study reported a sensitivity of influenza ICD9 codes of 65%
(95%CI: 61-68%).23 These findings highlight the need to include virology data to
accurately assess pathogen-specific burden of ALRI. However, despite the lack of
recent published validity studies of hospital discharge coding in WA and Australia,
clinical coders are trained specifically for translating medical discharge summaries to
ICD codes. Additionally, clinical coders only code what is documented in the medical
notes or hospital discharge summaries. The training clinical coders receive is
standardised across Australia24 and therefore would be homogenous throughout WA.
As ALRI incidence varies with age (in particular in those aged less than 2 years), it is
important to calculate age-specific incidence rates using an accurate denominator such
as person-time-at-risk which can only be achieved by linking hospitalisation datasets
with population-based birth or census data.
12
2.4 Aetiology
The aetiology of ALRI hospitalisations can vary according to clinical diagnosis and
severity, age and the diagnostic methods used such as tissue culture, blood culture,
direct immunofluorescence and molecular-based methods such as polymerase chain
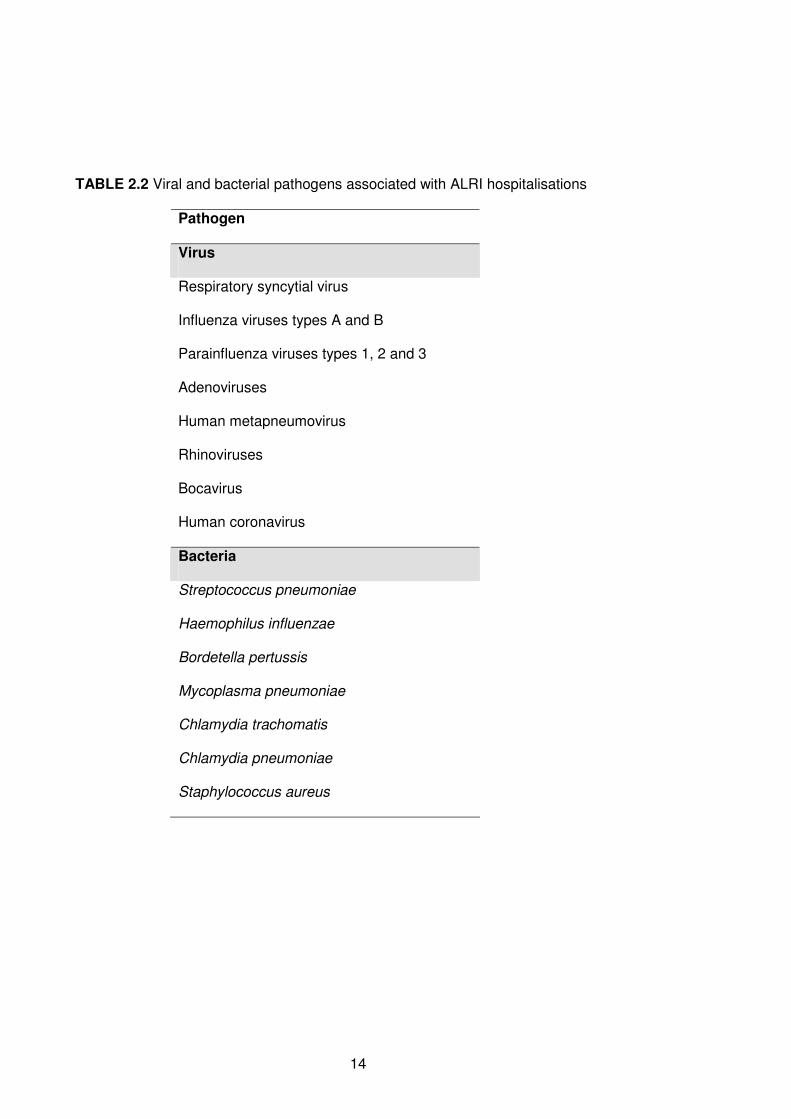
reaction (PCR). I focus here on the major viral and bacterial pathogens known to cause
severe ALRI resulting in hospitalisation (Table 2.2).
2.4.1 Viruses
For children hospitalised with ALRI before age 2 years, tissue culture methods have
yielded a viral identification rate of 66%25 whereas in infants PCR has yielded a higher
viral identification rate of 87%.26 Viral identification rates are higher when the clinical
diagnosis of ALRI is restricted to bronchiolitis in those under 2 years of age, ranging
from 87% to 93%.27-29 When the age group is extended to all children aged under 5
years, viral identification rates by PCR range from 23-78%.30-34 In older age groups up
to 12 years, viral identification rates are approximately 50% regardless of laboratory
method used.35, 36 The higher identification rates in younger children may reflect a
higher viral load in younger children.
RSV is most often associated with bronchiolitis and pneumonia and is considered the
leading pathogen of ALRI in young children. Many studies have shown that RSV is the
virus most commonly identified in children aged under 5 years hospitalised with ALRI
with identification rates of 15-20%,30-32, 37 although rates are higher in children aged
under 3 years: 25-52%.25, 26, 38, 39 Rhinoviruses have been identified more frequently
than RSV in hospitalised children with community-acquired pneumonia in Brazil
(21%)33 and in the USA (49%),40 although the age group studied included children up
to the age of 18 years. In view of the broader age range, the identification rate of RSV
in this study was much lower (2%).40 Rhinoviruses have also been identified in children
hospitalised for bronchiolitis with an identification rate of 28%,28 with speculation that
13
rhinoviruses are likely to be the second most important viral pathogen in ALRI.
Rhinoviruses have also been shown to be associated with severe asthma attacks in a
study in WA where rhinoviruses were detected in 87.5% of children suffering from
acute asthma.41 However, rhinoviruses are also commonly found in asymptomatic
children. In one study, rhinoviruses were identified in 28% of specimens collected from
children at routine health checks at age 12 months42 so the attribution of rhinoviruses to
causality of ALRI cannot be certain. The absence of pathogens in healthy children
would add more conviction to the claim of causality so it is important for studies to
investigate the viral identification rates in asymptomatic children.43 This was done in a
community-based study of mild ALRI in WA, not admitted to hospital, which identified
viruses in 25% of control samples, but was able to estimate an attributable risk of 32%
for ALRI from rhinoviruses, compared with 10% from RSV.44 However children
recruited in this study had atopic parents with higher than average rates of asthma and
therefore may not be representative of the general population of WA. More studies are
needed to investigate the identification rates of respiratory viruses, including viruses
other than rhinoviruses, in asymptomatic children.
Other viruses that are frequently identified in children hospitalised with ALRI are
influenza virus (identification rates 3-13%), parainfluenza viruses (3-17%), adenovirus
(8-14%), and more recently, human metapneumovirus and bocavirus (5-6%).25, 26, 30-32,
37, 38 While influenza is not the most frequently identified virus, it is associated with
severe morbidity and intensive seasonal epidemics and pandemics.45 It is not known if
viral identification rates differ between Aboriginal and non-Aboriginal children
hospitalised with ALRI.
14
TABLE 2.2 Viral and bacterial pathogens associated with ALRI hospitalisations
Pathogen
Virus
Respiratory syncytial virus
Influenza viruses types A and B
Parainfluenza viruses types 1, 2 and 3
Adenoviruses
Human metapneumovirus
Rhinoviruses
Bocavirus
Human coronavirus
Bacteria
Streptococcus pneumoniae
Haemophilus influenzae
Bordetella pertussis
Mycoplasma pneumoniae
Chlamydia trachomatis
Chlamydia pneumoniae
Staphylococcus aureus
15
2.4.2 Bacteria
Although most hospitalised ALRI is likely to have a viral aetiology, especially in
developed countries, the role of bacterial infection is also important. However, the
diagnosis of bacterial ALRI is more difficult than viral ALRI leading to an under-
representation of bacterial pathogens in many studies. Streptococcus pneumoniae is
an important cause of pneumonia. In specimens collected from hospitalised children
aged under 5 years in a developing country with community-acquired pneumonia, S.
pneumoniae was identified in 21% of specimens and Haemophilus influenzae was
identified in 8% of specimens.33 Another important bacterial pathogen of ALRI is
Bordetella pertussis, the agent responsible for whooping cough, which has been
identified in 6% of specimens from children hospitalised with ALRI.28 Other bacterial
pathogens implicated in ALRI are Mycoplasma pneumoniae, Chlamydia trachomatis
and Chlamydia pneumoniae.33, 34 It is important to distinguish between asymptomatic
bacterial carriage, most often from non-sterile sites such as nasal washes or
nasopharyngeal aspirates (NPAs) and active bacterial infection, most often from sterile
sites such as blood, pleural fluid and cerebrospinal fluid. Sensitive and specific
molecular-based diagnostic techniques are required to detect bacterial pathogens in
children hospitalised with ALRI when attributing causality, as many of these bacterial
pathogens can be carried in the nasopharynx of asymptomatic children. While high
levels of bacterial carriage have been noted in Aboriginal children aged less than 2
years in WA,46 the proportion of children, in particular Aboriginal children, hospitalised
with ALRI with active laboratory-confirmed bacterial infection is unknown.
2.4.3 Co-infection
The importance of co-infection and the co-occurrence of viruses and bacteria must also
not be overlooked. Such viral-bacterial interactions were first identified in the 1918
influenza pandemic when it was found that bacterial superinfections with S.
pneumoniae contributed significantly to high rates of mortality and morbidity.47
16
Identification rates of multiple pathogens in children hospitalised with ALRI, either co-
infection with multiple viruses or viral-bacterial co-infection, have ranged from 23 to
47%.27, 28, 40 This has implications for preventative measures such as vaccines
targeting a single pathogen and highlights the importance of linking clinical data to
virology and bacteriology data when investigating the epidemiology of ALRI. For
example, viral vaccines, in particular influenza vaccines48, 49 might play a role in
preventing secondary bacterial infection and subsequent bacterial diseases such as
otitis media (OM).
2.4.4 Seasonality
It is important to understand the seasonal characteristics of ALRI to identify the target
groups for interventions and more importantly, the appropriate timing of interventions in
order to maximise their impact. Knowledge of seasonality can also improve the
accuracy of surveillance systems to help predict when epidemics will occur.50 The
identification rate of viruses varies with calendar month and there are clear seasonal
patterns seen in ALRI hospitalisation rates. In Central Australia, which has a desert
arid climate of hot dry summer and cold dry winter, RSV infections were found
throughout the year with peaks from March to August.17 Additionally, studies have
reported associations in seasonal trends for ALRI with climatic factors such as relative
humidity, temperatures and rainfall.51-53 This highlights the importance of characterizing
seasonality of respiratory pathogens in different geographical areas and investigating
whether seasonality of various viruses and bacteria differs between subgroups such as
Aboriginal and non-Aboriginal children and children of different ages.
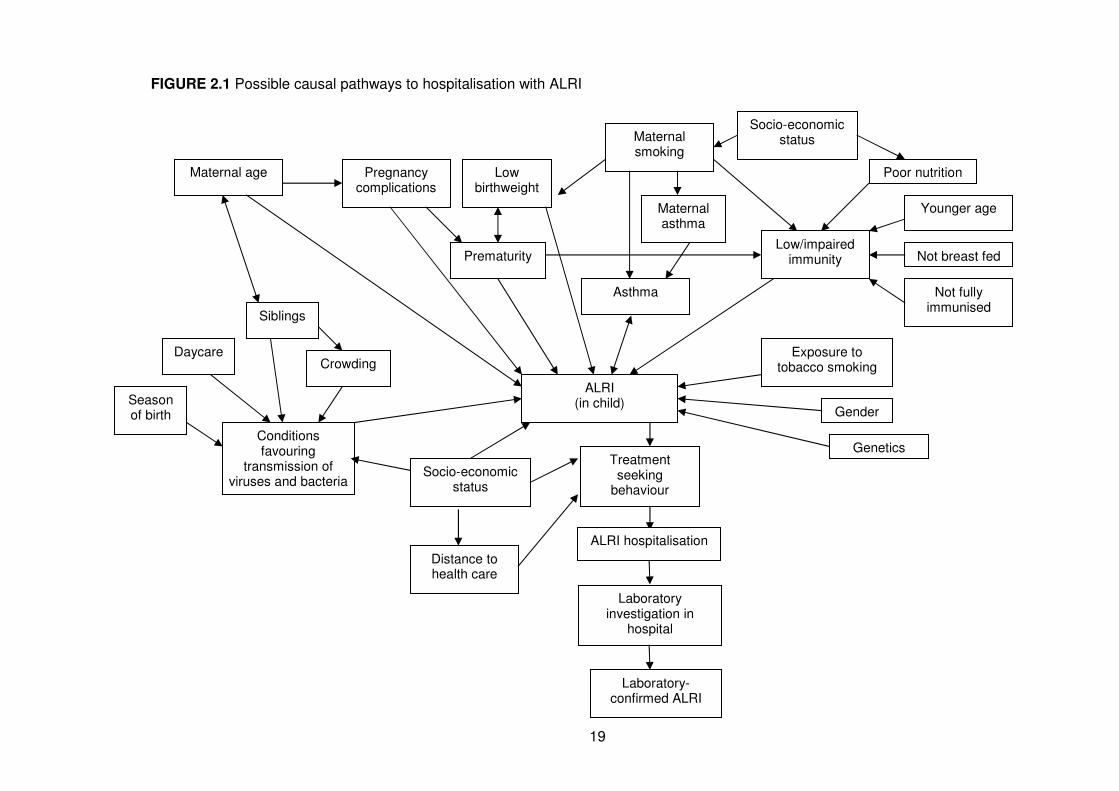
2.5 Causal pathways to hospitalisation
Many studies have investigated associations between single risk factors and
hospitalisation of children with ALRI, but few have investigated the causal pathways to
17
hospitalisation incorporating conditions favouring transmission, maternal factors, infant
factors and socio-demographic factors. By addressing these distal factors on the
causal pathways to disease, implementation of more targeted interventions and the
ultimate goal of prevention can be achieved.54 Based on previous findings, I have
constructed a causal network diagram that illustrates some of the possible pathways to
hospitalisation for ALRI (Figure 2.1). This network can be applied to Indigenous and
non-Indigenous populations, although the pathways and risk factor patterns are likely to
differ between the two populations.
Foetal growth measures (prematurity and birthweight) are the most commonly
investigated risk factors, but with discrepant results. For example, prematurity
independent of birthweight,55, 56 low birthweight independent of prematurity,57 both
prematurity and low birthweight58 and extremes of birthweight59 have been identified as
risk factors for RSV infections. These conflicting reports can be addressed by using a
more accurate marker of foetal growth and appropriateness of foetal growth in the form
of ‘proportion of optimal birthweight’ or POBW, which takes into account gestational
duration, foetal gender, maternal age, maternal height and parity.60 A New Zealand
study reported that being born in autumn was a risk factor for RSV hospitalisation.56
Maternal smoking during pregnancy has also been documented as an independent risk
factor for hospitalisation with ALRI.61 Few studies have investigated socio-demographic
characteristics and ALRI. However, Savitha et al found a clear socio-economic
gradient: those families from lower socio-economic groups had significantly more ALRI
episodes than those from higher groups,62 whereas a study in New Zealand found that
socioeconomic status was not an independent risk factor.56 Poor education, a proxy for
low socioeconomic status is strongly associated with hospitalisations for pneumonia
and influenza.63 Poor education may affect treatment-seeking behaviour at the primary
care level and adherence to medical regimes and therefore could result in higher
hospitalisation rates.63
18
Few studies have investigated risk factors separately for Indigenous and non-
Indigenous populations but instead have included Indigenous status as a risk factor.56,
64 Such research is now becoming less valuable since we know Indigenous populations
are at a higher risk of ALRI than non-Indigenous populations and the causal pathways
to hospitalisation are likely to be different. Large scale epidemiological studies are
therefore needed to ensure adequate numbers and power for statistical analyses when
conducting separate analysis for Indigenous and non-Indigenous children.
2.6 Interventions for ALRI
The most effective intervention for ALRI is vaccination. Current vaccines for prevention
of ALRI include Haemophilus influenzae type b (Hib) vaccine, 7-valent pneumococcal
conjugate vaccine (7vPCV), 23-valent pneumococcal polysaccharide vaccine
(23vPPV), diphtheria-tetanus-acellular pertussis vaccine (DTPa) and influenza vaccine.
These vaccines have been gradually introduced into the National Immunisation
Program in Australia.65 Hib vaccine, available for infants primarily for prevention of
meningitis, epiglottitis and pneumonia, has been available since 1993. DTPa, for
prevention of pertussis (whooping cough), diphtheria and tetanus has been available
for infants since 1999. Pneumococcal vaccines, intended for reduction in rates of
invasive pneumococcal disease, have had a particularly staggered introduction. 7vPCV
in WA has been available since 2001 for Aboriginal children in a 2-4-6 month schedule
before being universally funded for all Australian children in 2005. In addition,
Aboriginal children receive a 23vPPV booster at age 18 months. Influenza vaccine is
not currently listed on the National Immunisation Program, however it has been
available free of charge to children in WA aged between 6 months and 5 years during
the winter season since 2008.66
19
FIGURE 2.1 Possible causal pathways to hospitalisation with ALRI
Laboratory-confirmed ALRI
Laboratory investigation in
hospital
Treatment seeking
behaviour
ALRI (in child)
Socio-economic status
Distance to health care
Conditions favouring
transmission of viruses and bacteria
Season of birth
Crowding Daycare
Siblings
Maternal smoking
Maternal asthma
Asthma
Low/impaired immunity
Not fully immunised
Not breast fed
Low birthweight
Prematurity
Pregnancy complications
Maternal age
Gender
Poor nutrition
Socio-economic status
Exposure to tobacco smoking
ALRI hospitalisation
Genetics
Younger age
20
The impact of vaccine programs requires constant monitoring. Vaccines could reduce
hospitalisation rates for both viral and bacterial infections as pneumococcal conjugate
vaccines have done in South Africa.67 In particular, the disease burden that might be
prevented by a universal childhood influenza vaccination program needs to be
addressed. Additionally, evaluation of the impact of pneumococcal vaccines on
pneumonia and viral ALRI-associated morbidity, in addition to their direct and indirect
impact on invasive pneumococcal disease, is needed. Although there has been a clear
decline in invasive pneumococcal disease in children, including WA Aboriginal and
non-Aboriginal children,68 there is conflicting evidence in Australia regarding the impact
of pneumococcal vaccination on hospitalised pneumonia, with studies using different
methodologies, reporting either a decline in pneumonia hospitalisations following
vaccination69 or no impact.70 It is not known whether pneumococcal vaccination has
had an impact on population-based trends of pneumonia hospitalisations in children of
WA. We need to have optimal estimates of vaccination coverage, or ideally vaccination
status at the individual level through population-based data linkage, to monitor the
impact of vaccination programs. This is particularly important with the emergence of
second generation vaccines such as the higher valency pneumococcal vaccines that
are now becoming available.
There is as yet no vaccine for the prevention of bronchiolitis and RSV-related illness,
but RSV immunoprophylaxis with the monoclonal antibody palivizumab has been found
to be effective in reducing severe RSV-related illness.71 However, monthly
immunoprophylaxis is expensive and is currently aimed at high-risk children during
peak periods of RSV circulation. This highlights the importance of knowing when the
peak period of RSV circulation occurs and if the peak is consistent across various
geographical areas and climates.
21
In addition to direct and indirect effects of vaccination, it is important to maintain
adequate surveillance of ALRI hospitalisations and other factors that could influence
disease trends. These include changes or improvements in risk factors such as
socioeconomic status, nutrition and other non-pharmaceutical interventions.72 In
particular, hygiene interventions such as hand-washing has been shown to reduce the
incidence of ALRI.73, 74
2.7 What role can data linkage play in investigating ALRI?
It should now be apparent that in order to adequately investigate ALRI, data must be
pooled from numerous resources encompassing clinical, laboratory, socio-economic
and other risk factors and vaccination status data on an individual basis. Information on
all aspects may not be measurable in any one study. However, population-based data
(or record) linkage could address some of these limitations and is a powerful tool for
research. In WA we have the rare opportunity to utilise total population-based
resources through the WA Data Linkage System (WADLS) (http://www.datalinkage-
wa.org.au/).75 This system links population-level data on all births and deaths,
midwives’ notifications of births and hospital morbidity data for every birth in WA. Links
between records from various administrative health datasets are linked by probabilistic
matching on identifying details such as surname, first given name, date of birth, sex,
address and unit medical record number (unique only to metropolitan public
hospitals).75 De-identified data are then available for researchers to use, following
ethical approval and compliance with stringent confidentiality policies. There is also the
ability for data within the WADLS to be linked to other datasets such as state-wide
laboratory data or national immunisation data.
Accurate baseline data using population denominators on pathogen-specific burden of
ALRI can be used as a platform for the evaluation of current and future interventions. It
is important to have adequate data in order to stratify results according to age,
22
ethnicity, and clinical and laboratory outcome, with numbers large enough for adequate
statistical power. Population-based data linkage provides the necessary depth and
breadth of information to conduct such meaningful analyses.
2.8 Conclusions
ALRI is a significant cause of paediatric morbidity with infants and Indigenous children
suffering the highest burden. With new pathogens being identified, future studies, using
a causal pathway framework and pathogen-specific ALRI in Indigenous and non-
Indigenous children, will inform strategies for the development of appropriate
interventions to move towards the goal of ALRI prevention. By examining the causal
pathways to different types of ALRIs we will identify distal as well as proximal
antecedents to disease. Prevention of distal factors on the causal pathway may not
only be more effective and cheaper, but essential to reduce the overwhelming burden
of disease. Large population-based epidemiological studies are needed in order to
obtain the latest estimates of the burden, seasonality, risk factors and aetiology of ALRI
in Aboriginal and non-Aboriginal children. Such stratified analyses will identify target
groups who would benefit most from a variety of interventions aimed at WA children but
likely to have an impact throughout Australia and in similar populations worldwide.

23
CHAPTER 3
Aims and Objectives
24
3.1 Overall aim
Chapter 2 provided an overview of the current literature on the burden, causal
pathways and aetiology of ALRI in children from developed countries. It also
highlighted the current knowledge gaps in understanding the epidemiology of ALRI in
Aboriginal and non-Aboriginal children of Australia. The overall aim of this thesis is to
investigate epidemiological perspectives of ALRI in WA Aboriginal and non-Aboriginal
children under the age of 10 years to address the current knowledge gaps.
Epidemiological perspectives in this context have been broadly defined as the burden,
the aetiology and the causal pathways to hospitalisation. These aims will be
predominantly achieved using population-based data linkage methodology and
analysis of retrospectively collected data, while one chapter will involve analysis of
prospectively collected data.
3.2 Research Objectives
The specific research objectives for this thesis are as follows:
1. To use population-based data linkage of a retrospective population cohort of
singleton live-born children born between 1996 and 2005 in WA to:
a. quantify the burden of ALRI in terms of hospital admissions throughout
WA (Chapters 5 and 6),
b. describe the age-specific trends of hospitalisation for ALRI in
Aboriginal and non-Aboriginal children from 1996 to 2005 (Chapter 5),
c. determine the relationship between maternal and infant antecedent
factors and ALRI hospitalisation episodes in a causal pathway
framework in Aboriginal and non-Aboriginal children (Chapters 6 and
7), and
d. assess the feasibility of linking routinely collected statewide laboratory
data to hospital admissions for ALRI and document the proportion of

25
ALRI-coded admissions with a positive identification of a respiratory
pathogen (Chapters 10 and 11).
2. To describe the seasonal and age distribution of respiratory viruses identified in
Aboriginal and non-Aboriginal children living in Perth, WA (Chapter 8).
3. To describe the asymptomatic identification rate of viruses in Aboriginal and non-
Aboriginal children and investigate the associations between simultaneous
identification of respiratory viruses and pathogenic bacteria (Chapter 9).

26
CHAPTER 4
Methodology
27
4.1 Preamble
This chapter provides details of the study population, setting and the methods used
throughout the results section of the thesis (Chapters 5 through to 11). Some of the
methods are common to all the chapters while others are unique to individual chapters.
Chapters 5, 6, 7, 10 and 11 utilise population-based linked data from the WADLS while
Chapters 8 and 9 utilise smaller datasets restricted to certain geographical areas.
As this thesis is primarily based on analysis of retrospectively collected data, I did not
collect any data for this project. Along with my supervisors, I developed the project
protocol and developed the research questions. Negotiation with data custodians of the
laboratory data to link these data with other population-based data was developed as
part of this thesis and contributes to the uniqueness of this project. I conducted all data
cleaning, coding and analysis unless otherwise stated. While I was not involved in the
data collection for the prospective cohort study described in Chapter 9, I did conduct
the statistical analysis. Details are provided here of ethical approvals and data cleaning
common to the results chapters. These details have been removed from each chapter
to minimise duplication.
4.2 Study population and setting
WA covers an area of 2.5 million km2, and in 2009 had a population of 2.2 million,76
3.6% of whom identified as Aboriginal or Torres Strait Islander. In 2006, there was an
estimated 143,035 children aged less than 5 years living in WA of which 8461 (5.9%)
were Aboriginal or Torres Strait Islander.76 As <1% of WA births identify as Torres
Strait Islanders, herein and throughout this thesis, Indigenous Western Australians will
be referred to as Aboriginal. The Western Australian Department of Health classifies
postcodes in WA into three geographical areas: metropolitan (Perth and surroundings),
rural and remote loosely based on access to services and distances from major cities.
28
Perth, the capital city of WA, experiences a temperate climate with average
temperatures ranging between 31°C in summer (December to February), coinciding
with the lowest average rainfall of 6mm, and 18°C in winter (June to August), coinciding
with the highest average rainfall of 150mm per month.77 However the northern areas of
WA experience more of a tropical climate with average monthly temperatures
throughout the year between 31°C and 37°C with highest monthly rainfall in the
summer months of 270mm.77
4.3 Data linkage in Western Australia
Data linkage is the process whereby records that are derived from different sources but
relating to the same individual, are linked together using a best-practice protocol. Data
sources are usually derived from administrative health datasets where data can be
linked on a series of health outcomes. There are few such data linkage systems in the
world. In WA we have the opportunity to utilise total population-based record linked
data through the WADLS.75 This system links population-level data from core
administrative datasets including the birth, death and marriages register, hospital
morbidity data system, cancer register, mental health register, electoral roll, midwives’
notification system and emergency department data collection. Data are available for
the total population of WA with some linked data available from the WADLS dating
back to 1970. There is also the ability for data within WADLS to be linked to other
datasets such as state-wide laboratory data or national immunisation data. Records are
linked by probabilistic matching on identifying details such as unit medical record
number (unique only to metropolitan public hospitals), surname, first given name, date
of birth, sex and address.75 Approximately 5-10% of all records are checked for links
that fall into a grey area of doubtful links. Once manual checking of data and data
extraction are completed, de-identified linked data are then available for researchers to
use following ethical approval and compliance with stringent confidentiality policies.
29
This thesis utilises data from three core health administrative datasets and for the first
time establishes links to state-wide laboratory data.
4.4 Datasets
4.4.1 Midwives’ Notification System
The Midwives’ Notification System was introduced in WA in 1974. It is a requirement
under the Health Act 1911 (section 335) that the midwife in attendance at any birth
complete a Notification of Case Attended form which is then entered into the Midwives’
Notification System.78 The form includes demographic details of the mother, pregnancy
complications, maternal medical conditions, complications of labour and delivery and
baby details including, but not limited to, mode of delivery, gender, infant weight and
estimated gestation.
4.4.2 Birth and Death Register
The Birth and Death Register contains details from all registered births and deaths in
WA. The Births, Deaths and Marriages Registration Act 1998 in WA requires that a
child’s birth is registered within 60 days of the birth and that both parents complete and
sign a birth registration form provided to them by the hospital or midwife. The Act also
requires that a person’s death is registered within 14 days of the date of death.
Through the WADLS, data from the birth register are available from 1974 and from the
death register from 1969.
4.4.3 Hospital Morbidity Data System
The Hospital Morbidity Data System (HMDS) commenced in WA in 1970 and records
all inpatient episodes for patients admitted to public, private and freestanding day
hospitals in WA with 100% coverage of data.79 The HMDS currently contains
information on 20,000,000 inpatient episodes and is the largest of the Department of
30
Health Western Australia’s core datasets.79 Trained clinical coders are responsible for
translating written medical discharge summaries into diagnosis codes using the
International Classification of Diseases (ICD) diagnosis codes. There is a principal
diagnosis code (first-listed diagnosis) which records the main reason for the hospital
admission plus an additional 20 secondary diagnosis codes.
4.5 Data cleaning
4.5.1 Birth cohort
Data were extracted from the Midwives’ Notification System and the Birth and Death
Register for all births in WA between 1st January 1996 and 31st December 2005
inclusive. Only month and year of birth were available. The day of birth was set to the
15th of each month. I was responsible for merging these datasets together using the
unique de-identified child identification code (a 13 string character code termed the root
number) and all data cleaning. The resultant dataset was checked for duplicates and
missing data. For complete ascertainment of all births in WA, data were used from the
Midwives’ Notification System and the Birth Register. The data were then restricted to
singleton live births to mothers residing in WA at time of delivery. The resultant dataset
contained 245,249 records of which 239,204 (97.5%) contained information from both
the midwives’ record and birth register, 5364 (2.2%) contained information only from
the midwives record and 681 (0.3%) contained information only from the birth register.
We identified births that were of Aboriginal descent from the Midwives’ Notification
System reporting the mothers’ Indigenous status, the birth register and the HMDS
reporting the child’s Indigenous status and the birth register reporting the fathers’
Indigenous status. If any record in any dataset relating to a child indicated an
Aboriginal child or parent then the child was recorded as Aboriginal. This method may
slightly overestimate the true number of Aboriginal children in the birth cohort but, as
recording of Aboriginal status is considered to have high specificity, it was thought this
31
method would be the most accurate. Of the 245, 249 children in the birth cohort,
17,466 (7.1%) were identified as Aboriginal. This proportion is similar to our previous
studies using data form the WADLS.1, 7
Specific details of coding other variables from the midwives’ notification form are
outlined in future chapters relating to specific research questions.
4.5.2 Hospitalisation for ALRI
Data were extracted from the HMDS for all hospital admissions between 1st January
1996 and 31st December 2005 inclusive for children in the birth cohort. Full dates of
admission and separation were available. I was responsible for merging the
hospitalisation dataset with the birth cohort dataset and all data cleaning. Hospital
admissions for children that were not in the birth cohort (ie children who were not born
in WA or multiple births) were removed. Inter-hospital transfers with the same
diagnosis codes were merged into a single hospital admission.
We used the principal diagnosis field and the 20 additional diagnosis codes to identify
admissions for ALRI. The Australian version of ICD, 9th revision80 was used until 1999,
when the 10th version (ICD-10 AM)81 was introduced. Using a Perl program developed
by a colleague at the Telethon Institute for Child Health Research and the mapping
tables provided by the Australian National Centre for Classification in Health,82 all ICD9
codes were forward mapped into ICD10 codes to standardise and compare across all
years. Relevant ICD10 diagnosis codes were then flagged for specific ALRI diagnoses
for every hospital admission in the dataset (Table 4.1). The resultant dataset contained
27,771 admissions for ALRI. ALRI admissions within 14 days of a previous ALRI
admission were classified as a single episode as it was thought this would represent a
readmission from the same infection. Using this method 26,106 episodes of ALRI were
identified. To avoid episodes with multiple ALRI diagnoses, a hierarchical diagnosis
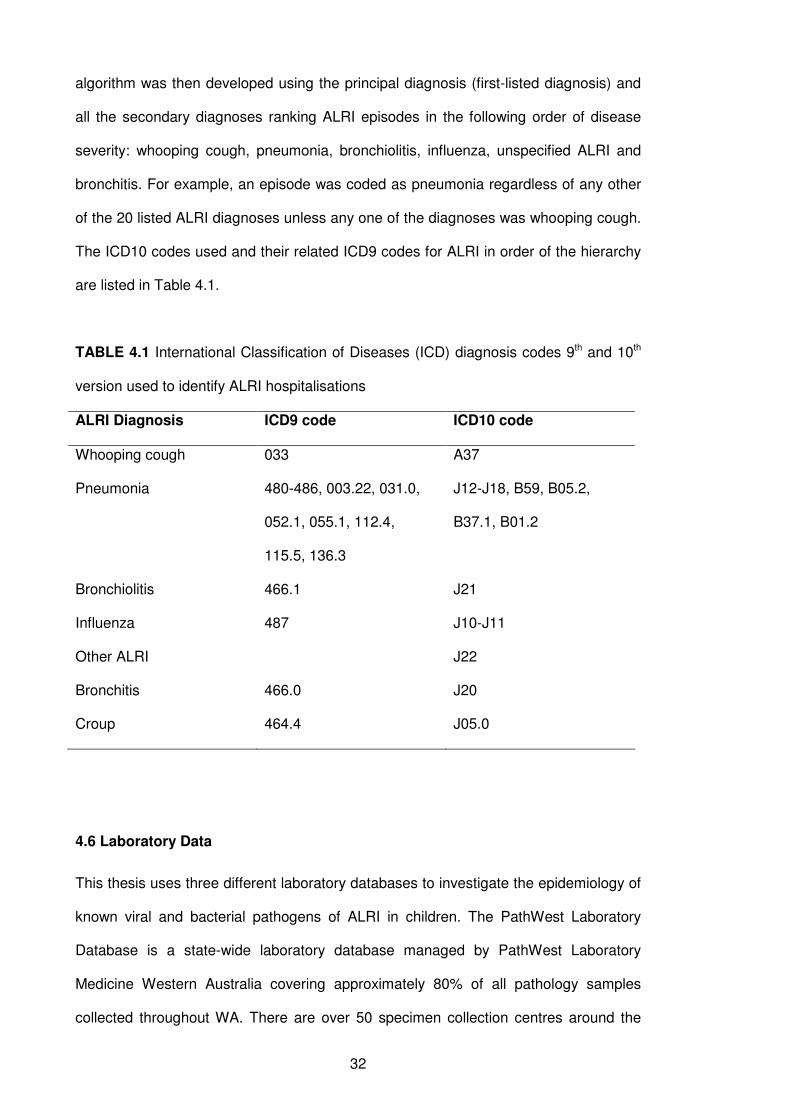
32
algorithm was then developed using the principal diagnosis (first-listed diagnosis) and
all the secondary diagnoses ranking ALRI episodes in the following order of disease
severity: whooping cough, pneumonia, bronchiolitis, influenza, unspecified ALRI and
bronchitis. For example, an episode was coded as pneumonia regardless of any other
of the 20 listed ALRI diagnoses unless any one of the diagnoses was whooping cough.
The ICD10 codes used and their related ICD9 codes for ALRI in order of the hierarchy
are listed in Table 4.1.
TABLE 4.1 International Classification of Diseases (ICD) diagnosis codes 9th and 10th
version used to identify ALRI hospitalisations
ALRI Diagnosis ICD9 code ICD10 code
Whooping cough 033 A37
Pneumonia 480-486, 003.22, 031.0,
052.1, 055.1, 112.4,
115.5, 136.3
J12-J18, B59, B05.2,
B37.1, B01.2
Bronchiolitis 466.1 J21
Influenza 487 J10-J11
Other ALRI J22
Bronchitis 466.0 J20
Croup 464.4 J05.0
4.6 Laboratory Data
This thesis uses three different laboratory databases to investigate the epidemiology of
known viral and bacterial pathogens of ALRI in children. The PathWest Laboratory
Database is a state-wide laboratory database managed by PathWest Laboratory
Medicine Western Australia covering approximately 80% of all pathology samples
collected throughout WA. There are over 50 specimen collection centres around the
33
state of WA. The PathWest Laboratory Database also includes nasopharyngeal
aspirates collected for the Sentinel Practitioners Network of Western Australia thus
providing some information at the community level. Up until 2007, the PathWest
Laboratory Database consisted of a series of databases specific to each hospital site.
Linkage between these state-wide pathology data and the core datasets within the
WADLS had never before been attempted. In preparation for this unique linkage and
while a Memorandum of Understanding was being negotiated between PathWest
Laboratory Medicine WA and the Department of Health WA for population-based data
linkage to the birth cohort datasets and the HMDS, smaller laboratory datasets were
extracted and analysed. This was to investigate the feasibility and validity of analysing
routinely collected laboratory data and to investigate other aspects related to the
aetiology of ALRI.
4.6.1 Metropolitan virology data: PathWest Laboratory Database
As a pilot study to test the feasibility of extracting and linking laboratory data to other
datasets, a sample of routinely collected nasopharyngeal aspirates (NPA) or throat
specimens collected between May 1997 and December 2005 for respiratory viral
testing at the Microbiology Department at Princess Margaret Hospital for Children in
Perth was extracted. These data were from one microbiology department attached to
WA’s only dedicated paediatric hospital located in Perth and therefore linking to
demographic data was an easier task than it would be for statewide data linkage. The
laboratory database for this pilot study consisted of 32,741 records and provided
information on specimen types, diagnostic methods, virology result, patient name, full
date of birth and gender. These identified data were linked to the hospital’s
demographic database to obtain data on Aboriginality, which was available for 95% of
specimens. All data were then de-identified and made available. The extraction and
linkage of the datasets was conducted by personnel at PathWest Laboratory Medicine
and I was responsible for all data cleaning, recoding of laboratory results and data
34
analysis. Grouped laboratory results for each specimen were entered in the laboratory
database as free text so large volumes of computation and coding was needed to
prepare the data for analysis. The initial data manipulation of free text fields was
carried out by a data programmer at the Telethon Institute for Child Health Research.
These data were used in Chapter 8 to investigate the age and seasonal distribution of
respiratory viruses identified in children residing in metropolitan Perth. The specific
laboratory methods are described in Chapter 8.
4.6.2 Rural bacteriology and virology data: Kalgoorlie Otitis Media Research
Project
The Kalgoorlie Otitis Media Research Project (KOMRP) was designed and led by D
Lehmann to investigate the causal pathways to otitis media in Aboriginal and non-
Aboriginal children of the Kalgoorlie-Boulder region. Kalgoorlie is a town in a semi-arid
zone 600km east of Perth. The collection of the data was not conducted as part of this
thesis. Details on the KOMRP are described in detail elsewhere.83 In brief, between
April 1999 and January 2003, 100 Aboriginal and 180 non-Aboriginal children born at
Kalgoorlie Regional Hospital were enrolled at birth and followed up regularly to age 2
years. NPAs were collected during routine follow-up visits at 1-3 weeks, 6-8 weeks and
again at 4, 6, 12, 18 and 24 months. NPAs were cultured to identify bacterial
pathogens and tested by PCR for the presence of respiratory viruses.
The data collected in the study were used for the analysis in Chapter 9 investigating
viral and bacterial interactions and asymptomatic viral identification in children in a rural
area of WA. Further details regarding these data and laboratory methods are provided
in Chapter 9.
35
4.6.3 State-wide pathology data: PathWest Laboratory Database
A Memorandum of Understanding was established between PathWest Laboratory
Medicine WA and the Department of Health WA for extraction and linkage of laboratory
data to other core datasets within WADLS as outlined in Sections 4.4 and 4.5. State-
wide laboratory data were available from 2000. The data extraction request consisted
of all specimens collected between 2000 and 2005 for detection of respiratory bacteria
and viruses from children in the 10-year birth cohort. Specimens include NPAs, nasal
washes, nasal swabs, throat swabs, sputum, lung aspirates, blood cultures,
bronchoalveolar lavages, bronchial washings and tracheal aspirates. As many fields
consisted of free text, large volumes of computation and data manipulation were
required to allow the data to be merged to the birth cohort and prepare ALRI
hospitalisation datasets for analysis. I developed coding guidelines for each laboratory
episode according to the test that was conducted, the specimen tested and the result of
that test with guidance from laboratory and clinical personnel within PathWest
Laboratory Medicine WA and Princess Margaret Hospital. Data manipulation using
these coding guidelines was conducted by a data programmer at the Telethon Institute
for Child Health Research. The data contained information on the identification of 13
respiratory viruses and 23 respiratory bacteria. More details of the data acquisition and
cleaning process are given in Chapter 10.
These data were linked to the HMDS in Chapter 11 in order to document the proportion
of ALRI-coded hospital admissions with a positive identification of a respiratory virus
and/or bacteria. Details of the linkage process between these datasets are given in
Chapter 11. Further analyses of these data are outlined in future recommendations
included in Chapter 12.
36
4.7 Statistical analysis
This thesis uses various statistical methods to investigate the epidemiology of ALRI
including interrupted time-series trend analysis to investigate age-specific population
trends of ALRI hospitalisation (Chapter 5), estimating population attributable fractions
through logistic regression separately for Aboriginal and non-Aboriginal children to
investigate the clinical significance of a set of risk factors to ALRI hospitalisation
(Chapter 6), harmonic analysis to investigate the variations in seasonality of respiratory
viruses identified in children living in metropolitan WA (Chapter 8), logistic regression
models incorporating generalised estimating equations to investigate associations
between viruses and simultaneous carriage of bacteria in a sample of asymptomatic
children (Chapter 9) and descriptive analysis to investigate the validity of hospitalisation
diagnostic coding and laboratory results on a population scale (Chapter 11). Each
chapter will explain statistical methods used in detail. Provided here are details of
analysis common to Chapters 5, 6, 7 and 11.
In order to calculate accurate age-specific incidence rates of hospitalisation for
Aboriginal and non-Aboriginal children, person-time-at-risk (PTAR) was estimated. A
program was developed by a biostatistician at the Telethon Institute for Child Health
Research to calculate PTAR for each individual as the time between their date of birth
and either their date of death or the 31st of December 2005, whichever came first, as
this signifies the time that the child was at risk of hospitalisation in WA. This calculation
method does not take into account migration out of WA of those in the birth cohort and
therefore those who are no longer at risk of hospitalisation. However, as the out-
migration rate from WA is low, especially in children aged less than 5 years,84 our
estimates of PTAR are not likely to be overestimates. PTARs were calculated for the
following age groups for every year between 1996 and 2005: <1, 1-2, 3-5, 6-11, 12-23
months, 2-4 and 5-9 years. As the date of birth was set to the 15th of each month, if the
resultant age was negative (ie the date of hospital admission occurred before the 15th
of their birth month), the day of birth was reset as the 1st of the month. This ensured
37
that all ages were meaningful; however it must be noted that admission rates <1 month
need to be interpreted with caution. If age groups or years were to be combined in
analyses, the PTAR were summed. For calculating all incidence rates, the numerator is
the number of hospitalisations and the denominator is the PTAR. This fraction is then
multiplied by 1000 to give an incidence rate per 1000 person-years.
4.8 Ethical approval
Approval for the population-based data linkage components of the thesis was sought
and provided by the Princess Margaret Hospital for Children Ethics Committee
(1350/EP), the Western Australian Aboriginal Health Information and Ethics Committee
(164-05/07) and the Confidentiality of Health Information Committee (#2007/09).
Access to data from WADLS was approved by the Western Australian Data Linkage
Branch (#200711.01). This included approved access to state-wide laboratory data
from PathWest Laboratory Medicine WA. The metropolitan sample of PathWest
laboratory data was approved separately by the Princess Margaret Hospital for
Children Ethics Committee (Audit 46QP). The Kalgoorlie Otitis Media Research Project
was approved by the Western Australian Aboriginal Health Information and Ethics
Committee, the Northern Goldfields Health Service and Nursing Education Ethics
Committee in Kalgoorlie, Princess Margaret Hospital for Children Ethics Committee
and the Confidentiality of Health Information Committee of the Health Department of
Western Australia.
38
CHAPTER 5
Hospitalised ALRI
Reduction in disparity for pneumonia hospitalisations
between Australian Indigenous and non-Indigenous children
&
Timing of bronchiolitis hospitalisation and RSV
immunoprophylaxis in non-metropolitan Western Australia
39
5.1 Preamble
This chapter investigates the burden of hospitalised ALRI in WA children. It consists of
two sections each focusing on separate aspects of hospitalisation.
Section 5.2 reports on the age-specific trends of hospitalised ALRI with a focus on
hospitalisations for pneumonia over the period 1996-2005 in Aboriginal and non-
Aboriginal children in WA as a measure of the burden of ALRI in the population. This
addresses objectives 1a and 1b. These results were accepted for publication in the
Journal of Epidemiology and Community Health in December 2010. A copy of the
accepted paper is in Appendix 1. This section reflects the manuscript with the
exception that the details of data cleaning common to those presented in the methods
chapter (Chapter 4) have been omitted to minimise duplication.
Section 5.3 reports on the seasonality of bronchiolitis hospitalisations in different
geographical regions of WA and the implications for RSV immunoprophylaxis and also
contributes to objective 1a. This section was published in the Medical Journal of
Australia as a letter to the editor in November 2009. A copy of the published letter is in
Appendix 1. This section reflects the publication in its entirety.
5.2 Age-specific trends of ALRI hospitalisation
5.2.1 Introduction
Pneumonia causes one-fifth of all childhood deaths globally, approximately 2 million
per year.2 In recognition of this high burden, the Global Action Plan for the Prevention
and Control of Pneumonia (GAPP) has been established to accelerate pneumonia
prevention and control.85 In industrialised countries, Indigenous populations suffer a
higher burden of pneumonia and have poorer health outcomes compared with non-
Indigenous populations.86, 87 The disparity between WA Aboriginal and non-Aboriginal
40
children is unacceptably high with rates of pneumonia in Aboriginal children aged <2
years being 13.5 times higher than in non-Aboriginal children.7
To reduce rates of invasive disease, 7vPCV was introduced and funded in Australia
from July 2001 for all Aboriginal and Torres Strait Islander children <2 years of age and
for all children with predisposing medical conditions aged <5 years with a unique 2-4-6-
month schedule with no 7vPCV booster.65 From January 2005, 7vPCV has been
funded for all children <2 years of age. The coverage of 7vPCV (which is assessed by
determining receipt of the third dose at age 12 months) for Aboriginal children in WA
has ranged from 47-55% in 2002-2004 (B. Hull, personal communication). In 2005, the
coverage of 3 doses of 7vPCV was 75% for Aboriginal children and 88% for non-
Aboriginal children.88 In addition to 7vPCV, Aboriginal children are offered a booster of
23vPPV at age 18 months,65 but reported coverage in WA is low: 41% in 2004 (B. Hull,
personal communication).
Where pneumococcal conjugate vaccination programs have been introduced, rates of
invasive disease have declined68, 89, 90 and randomised controlled trials have shown
vaccine efficacy against radiologically-confirmed pneumonia91-93 and clinical
pneumonia.67 However, recently the Northern Territory (NT) has reported an increased
risk of ALRI hospitalisation in Indigenous infants following 7vPCV and 23vPPV
vaccination.70 In light of this and the limited data on population trends of pneumonia
hospitalisation in indigenous populations, an investigation of trends in pneumonia
incidence covering the period of introduction of pneumococcal vaccination is
warranted.
Previously, we reported declining pneumonia hospitalisation rates in WA between 1990
and 2000 in Aboriginal children aged <2 years but increasing rates in non-Aboriginal
children.7 In this chapter we extend our previous work and assess population trends for
ALRI hospitalisations up to 2005 covering 5 years of 7vPCV and 23vPPV availability for
41
Aboriginal children and limited 7vPCV availability for non-Aboriginal children. The aim
was to determine whether pneumonia hospitalisation rates have continued to decline in
Aboriginal children and whether there has been a reduction in disparity for pneumonia
hospitalisation rates between Aboriginal and non-Aboriginal children.
5.2.2 Methods
5.2.2.1 Setting and data source
I used data from the birth cohort and the hospital admissions dataset as explained in
Chapter 4. Using the hierarchical diagnosis algorithm that was developed, we classified
ALRI episodes into all-cause pneumonia (ICD10 codes J12-J18, B59, B05.2, B37.1,
B01.2), bronchiolitis (J21), and all other ALRIs comprising coding as whooping cough
(A37), influenza (J10-J11), bronchitis (J20) and unspecified ALRI (J22). Pneumococcal
pneumonia episodes were a subset of the all-cause pneumonia episodes and were
identified if any one of the diagnosis fields was ICD10 code J13.
5.2.2.2 Statistical analysis
Using person-time-at-risk for the relevant time period and age group, we calculated
annual age-specific incidence rates of ALRI episodes per 1000 child-years. We
compared the incidence rate ratio (IRR) of the Aboriginal with the non-Aboriginal rate
for different diagnoses and different age groups between the period before 7vPCV
(1996-2000) and the period after 7vPCV became available for Aboriginal children and
for non-Aboriginal children at high risk of invasive disease (2001-2005). Incidence rate
ratios are presented with 95% confidence intervals (CI). To examine whether IRRs
were different between the two time periods, p-values testing that the ratio of IRRs is
different to 1 were calculated and presented. The year-to-year trends in incidence were
analysed by log-linear modelling using negative binomial regression with nbreg in
Stata. We report on the percentage change per year with 95% CI and graphically
42
present the data as log-transformed rates. If annual numbers of hospitalisations were
small, rates are graphically presented as 3-year moving averages where the incidence
for a specific year is calculated as the mean for that year and the preceding and
succeeding years. In view of the cohort study design not all years could be included in
the trend analysis. For example, in the 48-59-month-age-group, only data from 2000 to
2005 were available for analysis as this represented the years for which children in this
age group were at risk for hospitalisation. To test whether the population-based trends
of pneumonia were influenced by 7vPCV introduction for Aboriginal children in 2001,
we conducted further interrupted linear time trend models and graphically present the
fitted trends from these models. Data checking and editing was completed using SPSS
version 15.0 and analysis was conducted using Stata version 10.
5.2.3 Results
There were 245,249 births between 1996 and 2005, 7.1% of which were Aboriginal,
giving rise to a total of 1,219,082 child-years-at-risk (1,134,516 non-Aboriginal child-
years and 84,566 Aboriginal child-years). There were 26,106 hospital episodes of
ALRI between 1996 and 2005 of which 7727 (29.6%) were coded as pneumonia.
Pneumonia rates were highest for Aboriginal children at age 6-11 months (71.7/1000
child-years) and for non-Aboriginal children at age 12-23 months (8.4/1000 child-
years). There were 78 ALRI-coded deaths in the birth cohort between 1996 and 2005,
70 of which were recorded as pneumonia (46 non-Aboriginal and 24 Aboriginal).
Comparing the periods before (1996-2000) and after (2001-2005) introduction of
7vPCV for Aboriginal children, all-cause pneumonia hospitalisation rates fell in
Aboriginal children at all ages but most notably by 34% at age 12-23 months and by
44% at age 24-35 months with the only declines in non-Aboriginal children being in
those aged less than 1 month (Table 5.1). The IRR of Aboriginal to non-Aboriginal
children for all-cause pneumonia declined between 1996-2000 and 2001-2005 in all
43
age groups greater than 1 month (Table 5.1). For children aged 6-11 months, the
incidence rate for pneumonia was 14.6 (95%CI, 12.3-17.2) times higher in Aboriginal
children (85/1000 child-years) than in non-Aboriginal children (6/1000 child-years) in
1996-2000; the IRR reduced to 9.9 (95%CI, 8.4-11.6) in 2001-2005. Similarly for
children aged 12-23 months, the IRR reduced from 7.7 in 1996-2000 to 4.9 in 2001-
2005 (Table 5.1). These were significant declines in disparity (p<0.001). Pneumococcal
pneumonia was coded in 222 (2.9%) of the pneumonia episodes (141 non-Aboriginal
and 81 Aboriginal episodes). Hospitalisation rates for pneumococcal pneumonia in
1996-2000 were 15.6 times higher in Aboriginal than non-Aboriginal children aged 6-11
months; the IRR reduced to 1.3 in 2001-2005. Apart from a decline in disparity for
bronchiolitis in those aged 6-11 months (p=0.0003), there was no significant decline in
disparity in incidence of bronchiolitis or other ALRIs over the two time periods (Table
5.1).
We used log-linear modelling to investigate the annual changes in incidence from 1996
to 2005. The annual incidence of all-cause pneumonia declined in Aboriginal and non-
Aboriginal children in all age groups with Aboriginal children experiencing the largest
declines (Figure 5.1). Annual percentage changes per year for each age group are
shown in Table 5.2. The largest annual declines were seen in Aboriginal children aged
24-35 months (12.6%/annum) and those aged 48-59 months (17.1%/annum). Further
analyses using interrupted time trend models were able to test whether there was a
difference in the log linear time trend between the pre and post 2001 periods and also
whether there was an additional step change in 2001 corresponding to introduction of
7vPCV vaccination. The annual reduction in pneumonia rates for Aboriginal children
was not statistically different in the pre and post 2001 periods for both 6-11 (p=0.49)
and 12-23 (p=0.75) month age groups, but there was an additional non-significant
reduction in rates in 2001 for both groups (Figure 5.1).
44
All-cause pneumonia rates declined in non-Aboriginal children aged less than 6 months
at a similar rate to Aboriginal children of the same age (Table 5.2). Declines in other
age groups were much less in non-Aboriginal children compared with Aboriginal
children and did not reach statistical significance except at age 48-59 months where
there was an estimated decline of 12.8% per year. The incidence of pneumococcal
pneumonia declined in Aboriginal and non-Aboriginal children of all ages with
significant declines in Aboriginal children of 37.0% per year in those aged 6-11 months
and 26.6% per year in those aged 12-23 months (Figure 5.2 and Table 5.2).
There were no significant changes in trend for bronchiolitis over the same time period
in either Aboriginal or non-Aboriginal children (Figure 5.3), except for a decline in
Aboriginal children aged 24-35 months of 10.1% per year (Table 5.2) although the
rates for bronchiolitis are considerably lower in older children than younger children
(Table 5.1). There was no consistent trend in incidence of other ALRIs, comprising
whooping cough, influenza, bronchitis and unspecified ALRI (Figure 5.3). There were
declines in Aboriginal and non-Aboriginal children aged 48-59 months, but incidence of
other ALRIs increased by 11.5% per year in Aboriginal children aged 12-23 months
(Table 5.2). Trends in annual incidence for all-cause pneumonia and bronchiolitis were
similar across metropolitan, rural and remote regions of WA.
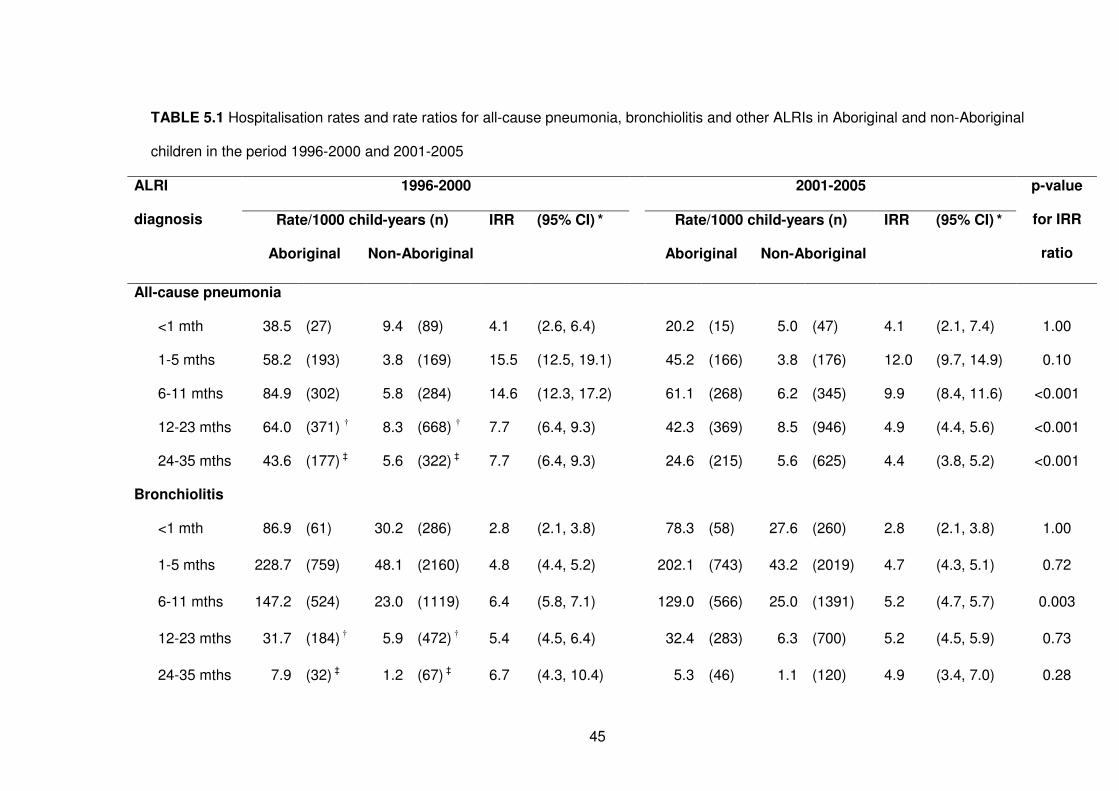
45
TABLE 5.1 Hospitalisation rates and rate ratios for all-cause pneumonia, bronchiolitis and other ALRIs in Aboriginal and non-Aboriginal
children in the period 1996-2000 and 2001-2005
1996-2000 2001-2005
Rate/1000 child-years (n) IRR (95% CI) * Rate/1000 child-years (n) IRR (95% CI) *
ALRI
diagnosis
Aboriginal Non-Aboriginal
Aboriginal Non-Aboriginal
p-value
for IRR
ratio
All-cause pneumonia
<1 mth 38.5 (27) 9.4 (89) 4.1 (2.6, 6.4) 20.2 (15) 5.0 (47) 4.1 (2.1, 7.4) 1.00
1-5 mths 58.2 (193) 3.8 (169) 15.5 (12.5, 19.1) 45.2 (166) 3.8 (176) 12.0 (9.7, 14.9) 0.10
6-11 mths 84.9 (302) 5.8 (284) 14.6 (12.3, 17.2) 61.1 (268) 6.2 (345) 9.9 (8.4, 11.6) <0.001
12-23 mths 64.0 (371) † 8.3 (668) † 7.7 (6.4, 9.3) 42.3 (369) 8.5 (946) 4.9 (4.4, 5.6) <0.001
24-35 mths 43.6 (177) ‡ 5.6 (322) ‡ 7.7 (6.4, 9.3) 24.6 (215) 5.6 (625) 4.4 (3.8, 5.2) <0.001
Bronchiolitis
<1 mth 86.9 (61) 30.2 (286) 2.8 (2.1, 3.8) 78.3 (58) 27.6 (260) 2.8 (2.1, 3.8) 1.00
1-5 mths 228.7 (759) 48.1 (2160) 4.8 (4.4, 5.2) 202.1 (743) 43.2 (2019) 4.7 (4.3, 5.1) 0.72
6-11 mths 147.2 (524) 23.0 (1119) 6.4 (5.8, 7.1) 129.0 (566) 25.0 (1391) 5.2 (4.7, 5.7) 0.003
12-23 mths 31.7 (184) † 5.9 (472) † 5.4 (4.5, 6.4) 32.4 (283) 6.3 (700) 5.2 (4.5, 5.9) 0.73
24-35 mths 7.9 (32) ‡ 1.2 (67) ‡ 6.7 (4.3, 10.4) 5.3 (46) 1.1 (120) 4.9 (3.4, 7.0) 0.28
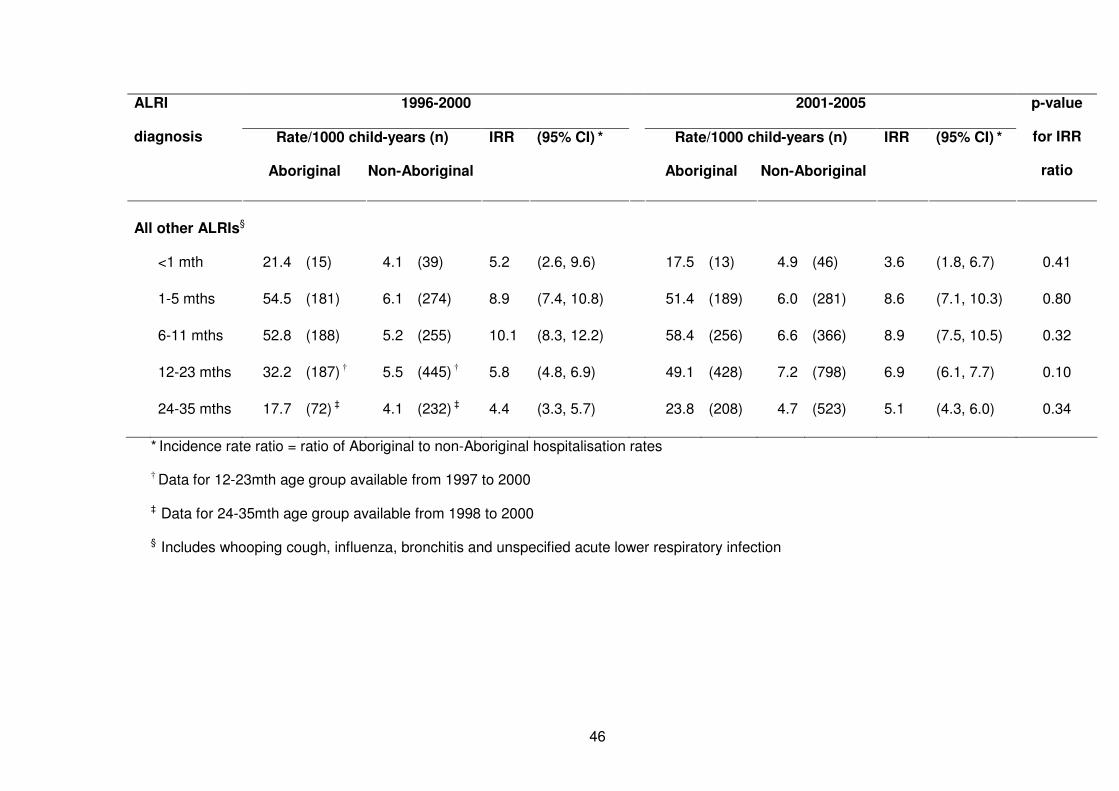
46
1996-2000 2001-2005
Rate/1000 child-years (n) IRR (95% CI) * Rate/1000 child-years (n) IRR (95% CI) *
ALRI
diagnosis
Aboriginal Non-Aboriginal
Aboriginal Non-Aboriginal
p-value
for IRR
ratio
All other ALRIs§
<1 mth 21.4 (15) 4.1 (39) 5.2 (2.6, 9.6) 17.5 (13) 4.9 (46) 3.6 (1.8, 6.7) 0.41
1-5 mths 54.5 (181) 6.1 (274) 8.9 (7.4, 10.8) 51.4 (189) 6.0 (281) 8.6 (7.1, 10.3) 0.80
6-11 mths 52.8 (188) 5.2 (255) 10.1 (8.3, 12.2) 58.4 (256) 6.6 (366) 8.9 (7.5, 10.5) 0.32
12-23 mths 32.2 (187) † 5.5 (445) † 5.8 (4.8, 6.9) 49.1 (428) 7.2 (798) 6.9 (6.1, 7.7) 0.10
24-35 mths 17.7 (72) ‡ 4.1 (232) ‡ 4.4 (3.3, 5.7) 23.8 (208) 4.7 (523) 5.1 (4.3, 6.0) 0.34
* Incidence rate ratio = ratio of Aboriginal to non-Aboriginal hospitalisation rates
† Data for 12-23mth age group available from 1997 to 2000
‡ Data for 24-35mth age group available from 1998 to 2000
§ Includes whooping cough, influenza, bronchitis and unspecified acute lower respiratory infection
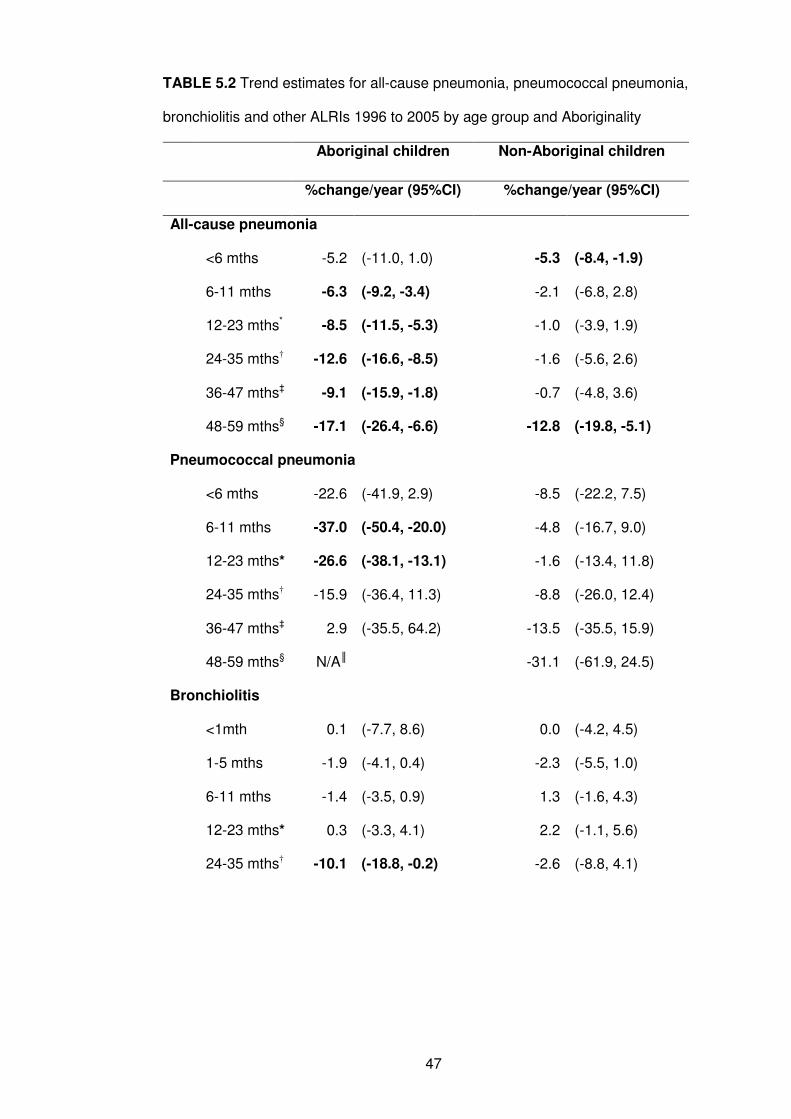
47
TABLE 5.2 Trend estimates for all-cause pneumonia, pneumococcal pneumonia,
bronchiolitis and other ALRIs 1996 to 2005 by age group and Aboriginality
Aboriginal children Non-Aboriginal children
%change/year (95%CI) %change/year (95%CI)
All-cause pneumonia
<6 mths -5.2 (-11.0, 1.0) -5.3 (-8.4, -1.9)
6-11 mths -6.3 (-9.2, -3.4) -2.1 (-6.8, 2.8)
12-23 mths* -8.5 (-11.5, -5.3) -1.0 (-3.9, 1.9)
24-35 mths† -12.6 (-16.6, -8.5) -1.6 (-5.6, 2.6)
36-47 mths‡ -9.1 (-15.9, -1.8) -0.7 (-4.8, 3.6)
48-59 mths§ -17.1 (-26.4, -6.6) -12.8 (-19.8, -5.1)
Pneumococcal pneumonia
<6 mths -22.6 (-41.9, 2.9) -8.5 (-22.2, 7.5)
6-11 mths -37.0 (-50.4, -20.0) -4.8 (-16.7, 9.0)
12-23 mths* -26.6 (-38.1, -13.1) -1.6 (-13.4, 11.8)
24-35 mths† -15.9 (-36.4, 11.3) -8.8 (-26.0, 12.4)
36-47 mths‡ 2.9 (-35.5, 64.2) -13.5 (-35.5, 15.9)
48-59 mths§ N/A║ -31.1 (-61.9, 24.5)
Bronchiolitis
<1mth 0.1 (-7.7, 8.6) 0.0 (-4.2, 4.5)
1-5 mths -1.9 (-4.1, 0.4) -2.3 (-5.5, 1.0)
6-11 mths -1.4 (-3.5, 0.9) 1.3 (-1.6, 4.3)
12-23 mths* 0.3 (-3.3, 4.1) 2.2 (-1.1, 5.6)
24-35 mths† -10.1 (-18.8, -0.2) -2.6 (-8.8, 4.1)
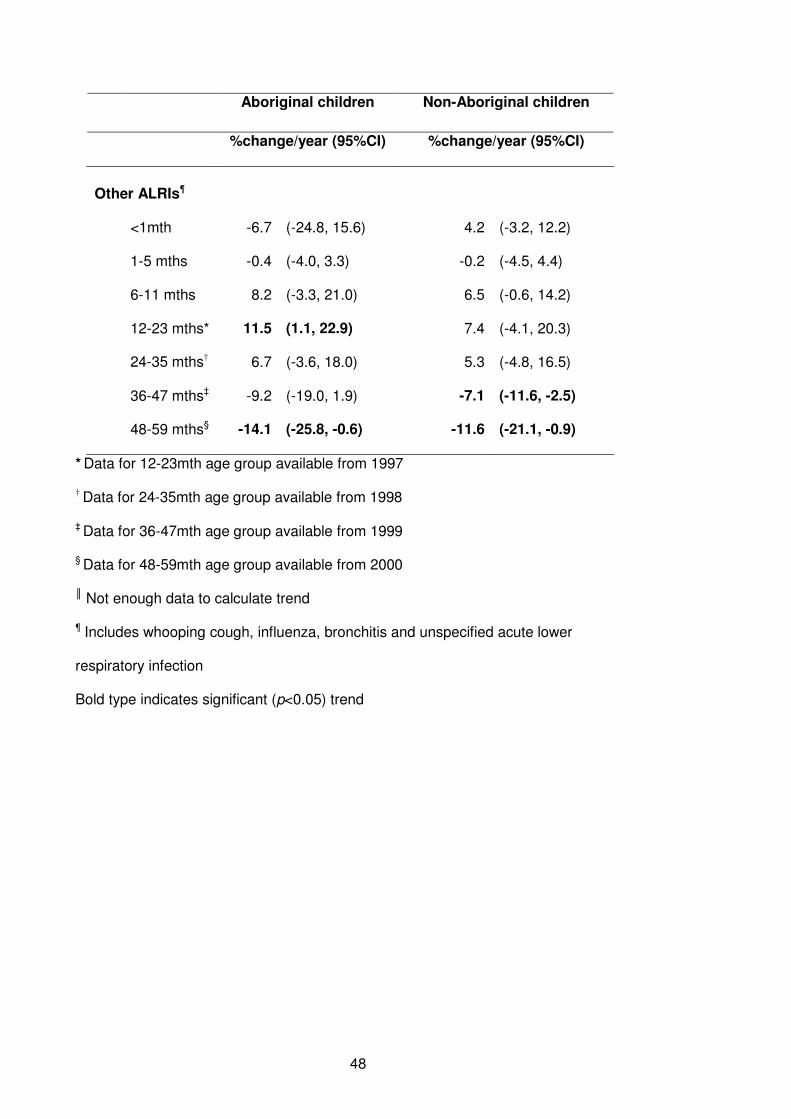
48
Aboriginal children Non-Aboriginal children
%change/year (95%CI) %change/year (95%CI)
Other ALRIs¶
<1mth -6.7 (-24.8, 15.6) 4.2 (-3.2, 12.2)
1-5 mths -0.4 (-4.0, 3.3) -0.2 (-4.5, 4.4)
6-11 mths 8.2 (-3.3, 21.0) 6.5 (-0.6, 14.2)
12-23 mths* 11.5 (1.1, 22.9) 7.4 (-4.1, 20.3)
24-35 mths† 6.7 (-3.6, 18.0) 5.3 (-4.8, 16.5)
36-47 mths‡ -9.2 (-19.0, 1.9) -7.1 (-11.6, -2.5)
48-59 mths§ -14.1 (-25.8, -0.6) -11.6 (-21.1, -0.9)
* Data for 12-23mth age group available from 1997
† Data for 24-35mth age group available from 1998
‡ Data for 36-47mth age group available from 1999
§ Data for 48-59mth age group available from 2000
║ Not enough data to calculate trend
¶ Includes whooping cough, influenza, bronchitis and unspecified acute lower
respiratory infection
Bold type indicates significant (p<0.05) trend
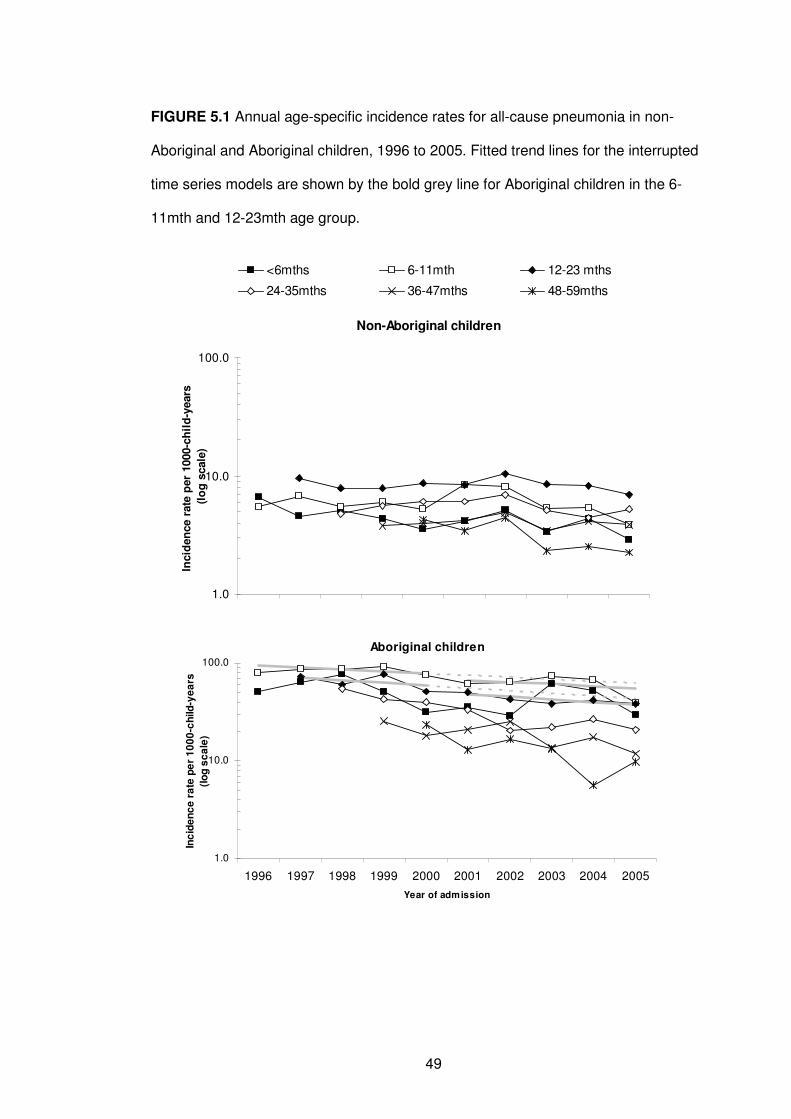
49
FIGURE 5.1 Annual age-specific incidence rates for all-cause pneumonia in non-
Aboriginal and Aboriginal children, 1996 to 2005. Fitted trend lines for the interrupted
time series models are shown by the bold grey line for Aboriginal children in the 6-
11mth and 12-23mth age group.
Aboriginal children
1.0
10.0
100.0
1996 1997 1998 1999 2000 2001 2002 2003 2004 2005
Year of admission
Inc
ide
nc
e r
ate
pe
r 1
00
0-c
hild
-ye
ars
(lo
g s
ca
le)
Non-Aboriginal children
1.0
10.0
100.0
Incid
en
ce r
ate
per
1000-c
hil
d-y
ears
(lo
g s
cale
)
<6mths 6-11mth 12-23 mths
24-35mths 36-47mths 48-59mths
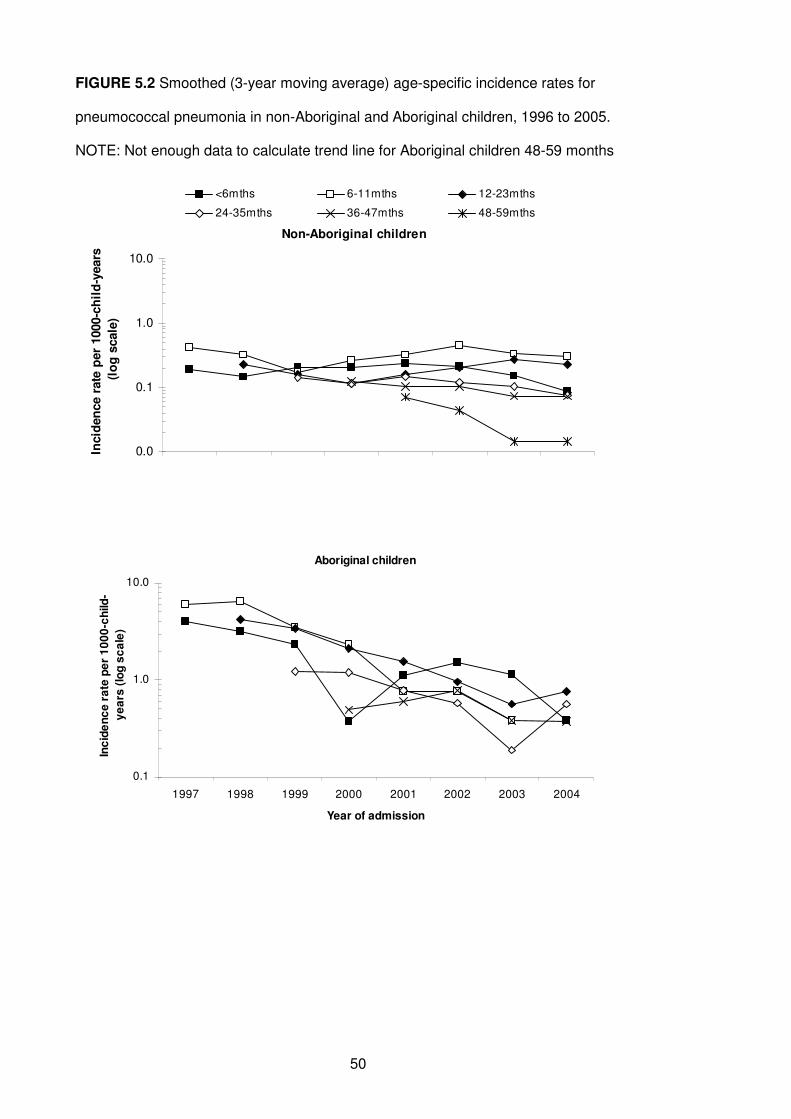
50
FIGURE 5.2 Smoothed (3-year moving average) age-specific incidence rates for
pneumococcal pneumonia in non-Aboriginal and Aboriginal children, 1996 to 2005.
NOTE: Not enough data to calculate trend line for Aboriginal children 48-59 months
Non-Aboriginal children
0.0
0.1
1.0
10.0
Incid
en
ce r
ate
per
1000-c
hil
d-y
ears
(lo
g s
cale
)
<6mths 6-11mths 12-23mths
24-35mths 36-47mths 48-59mths
Aboriginal children
0.1
1.0
10.0
1997 1998 1999 2000 2001 2002 2003 2004
Year of admission
Inc
ide
nc
e r
ate
pe
r 1
00
0-c
hild
-
ye
ars
(lo
g s
ca
le)
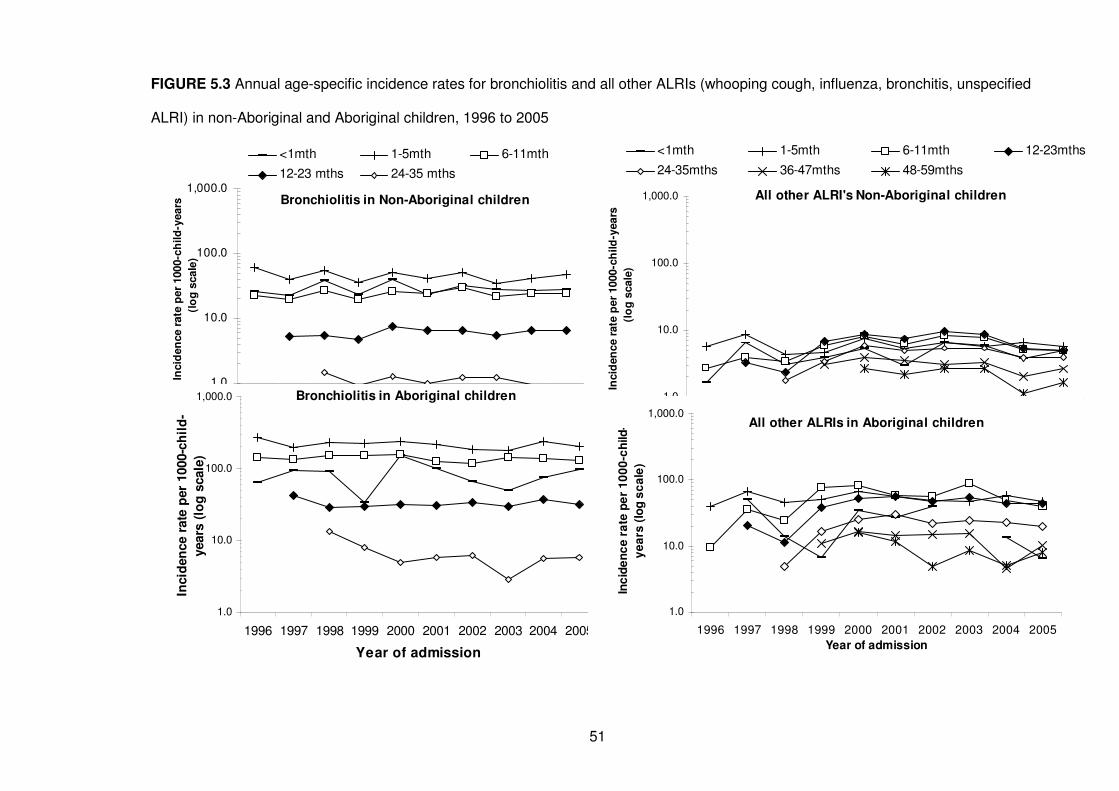
51
FIGURE 5.3 Annual age-specific incidence rates for bronchiolitis and all other ALRIs (whooping cough, influenza, bronchitis, unspecified
ALRI) in non-Aboriginal and Aboriginal children, 1996 to 2005
Bronchiolitis in Non-Aboriginal children
1.0
10.0
100.0
1,000.0In
cid
en
ce r
ate
per
1000-c
hild
-years
(lo
g s
cale
)
<1mth 1-5mth 6-11mth
12-23 mths 24-35 mths
Bronchiolitis in Aboriginal children
1.0
10.0
100.0
1,000.0
1996 1997 1998 1999 2000 2001 2002 2003 2004 2005
Year of admission
Incid
en
ce r
ate
per
1000-c
hil
d-
years
(lo
g s
cale
)All other ALRI's Non-Aboriginal children
1.0
10.0
100.0
1,000.0
Incid
en
ce r
ate
per
1000-c
hild
-years
(lo
g s
cale
)
<1mth 1-5mth 6-11mth 12-23mths
24-35mths 36-47mths 48-59mths
All other ALRIs in Aboriginal children
1.0
10.0
100.0
1,000.0
1996 1997 1998 1999 2000 2001 2002 2003 2004 2005
Year of admission
Inc
ide
nc
e r
ate
pe
r 1
00
0-c
hild
-
ye
ars
(lo
g s
ca
le)
52
5.2.4 Discussion
We have seen a decline in all-cause pneumonia and pneumococcal pneumonia
hospitalisations in WA children, particularly in the Aboriginal population. This has
resulted in a decline in disparity between Aboriginal and non-Aboriginal children for
pneumonia in the range of 32-36%; a positive step towards closing the gap in
Indigenous health94, 95 and reducing the burden of pneumonia. Although the declines in
our study are slightly smaller, our findings are consistent with studies from the northern
hemisphere that have reported declines for pneumonia hospitalisations in the range of
13-53% and declines for pneumococcal pneumonia hospitalisations in the range of 65-
72% in the pre and post pneumococcal vaccination period.96-98 We have not seen
consistent declines, or increases, for bronchiolitis and other ALRIs and shifts in clinical
diagnosis are unlikely to be responsible for observed population trends in pneumonia
hospitalisation. The likely explanations for the decline in pneumonia are multifactorial
including gradual improvements in Aboriginal health and socio-economic indicators, the
Australian pneumococcal vaccination program, and the management of pneumonia at
a primary health care level.
In contrast to NT,70 we have not seen any evidence of a deleterious effect of
pneumococcal vaccination on ALRI hospitalisation rates in our population-based study
of 245,249 births. The increases in pneumonia in non-Aboriginal children that we
reported previously7 have now levelled off and we note significant declines in
Aboriginal children whereas O’Grady reported a 55% increased risk of pneumonia in
Indigenous infants aged 5-23 months following 23vPPV vaccination, and 33% increase
after 2 doses of 7vPCV compared with no dose.70 There are important methodological
differences between the NT and this current analysis. That study had access to
individual immunisation data to link with hospitalisation data, whereas we have not yet
obtained individual immunisation data. O’Grady et al sought to examine the
effectiveness of the 3-dose 7vPCV plus 23vPPV booster schedule in Indigenous
53
infants whereas our ecological study investigated population-based trends in incidence
in all WA children. The population structure differs between NT and WA: 44% of the
population aged under 5 years in NT are Indigenous compared with 6% in WA,99, 100 so
it is plausible to suggest that the impact of a vaccination program could differ between
the two areas. Other Australian studies have reported declines in pneumonia in
Indigenous children across four Australian states and territories and attributed the
declines to 7vPCV vaccination,101 and now in non-Indigenous children, declines in
pneumonia after the introduction of the universal 7vPCV program in 2005.69
It is thought that hospitalisations coded as pneumococcal pneumonia do not represent
all hospitalisations for pneumonia due to S. pneumoniae. Three percent of pneumonia
admissions in our study were coded as due to S. pneumoniae, similar to a large study
in the USA that identified 2% of pneumonia admissions in children aged less than 2
years as pneumococcal pneumonia.97 Therefore some declines seen in all-cause
pneumonia are likely to be a result of declines in pneumonia due to S. pneumoniae and
represent the positive impact of Australia’s unique pneumococcal vaccination program.
Moreover we have recently shown significant declines in the incidence of invasive
pneumococcal disease in WA Aboriginal and non-Aboriginal children from 1997 to
2007 with declines in invasive disease due to 7vPCV serotypes, notably by 94% in
Aboriginal children and by 86% in non-Aboriginal children.68
We are reluctant to attribute the decline in pneumonia seen in WA solely to a beneficial
impact of pneumococcal vaccination since we observed declines in pneumonia prior to
2001 in the Aboriginal population as well as some declines in the non-Aboriginal
population for whom 7vPCV was not universally funded until 2005. This highlights the
importance of investigating annual changes in incidence in addition to a pre- and post-
vaccination comparison and suggests that there must be other factors playing a role.
Firstly, these trends could be due to the natural fluctuations of disease. Secondly, there
is likely to have been increases in out-of-hospital (or emergency department) treatment
54
for pneumonia. Thirdly, while improvements in general living and socio-economic
status tend to occur slowly, there is evidence to suggest that lifestyle factors such as
education, income, treatment of water supplies and household crowding have
improved in the WA Aboriginal population between 1996 and 2004,102 covering the
years of our observed trends. These improvements could have contributed to the
observed declines in hospitalisations with pneumonia. It is unlikely that the changes in
trend represent a change in Aboriginal identification, or changes in coding from ICD9 to
ICD10.
The WADLS provided us with the opportunity to use total population-based linked data
to calculate accurate hospitalisation rates per population at risk and assess population
trends. These trends are not overshadowed by complex analyses. We have complete
data on Indigenous status allowing us to compare trends between Aboriginal and non-
Aboriginal children, where other studies have not had adequate data on ethnicity.97
This adds to the strengths of our study. However, there are some limitations. We do not
have individual immunisation data and the reported estimates of 7vPCV coverage
during the study period are low. As there are many bacteria and viruses that cause
pneumonia, the lack of pathogen-specific diagnoses limits our ability to quantify the
contribution of pneumococcal vaccines to declines in pneumonia hospitalisation. In
view of this aetiological diversity, the impact of currently available vaccines alone on
overall burden of pneumonia will be limited,85 and other aetiological agents of
pneumonia need to be investigated. We have started the process of linking statewide
pathology data into the WADLS to further investigate trends on laboratory-confirmed
outcomes (see Chapters 10 and 11). It is important that researchers are able to access
individualised immunisation data through established data linkage mechanisms not
only to evaluate impact of vaccination on disease burden and vaccine effectiveness but
also for adverse event surveillance.
55
The decreasing disparity in pneumonia hospitalisations between Aboriginal and non-
Aboriginal children has relevance for the developing world and countries with
disadvantaged indigenous populations as the ultimate goal is to close the gap in health
inequities between disadvantaged and more privileged children. Other non-
pharmaceutical interventions such as improved family and community hygiene (ie
handwashing) and provision of adequate housing87 are needed to close the gap further.
In summary, we have seen a reduction in hospitalisation for severe respiratory infection
in children, an encouraging finding and important in the context of the GAPP, which
aims to accelerate pneumonia prevention and control, as Indigenous children in
Australia have previously had one of the highest hospitalisation rates for pneumonia in
the developed world. Part of this reduction is likely to be due to the unique Australian
pneumococcal vaccine schedule, but other factors are also likely to have contributed to
this decline. It is important to continue monitoring population-based trends of
pneumonia in Australia and other high risk or indigenous populations to fully
understand the impact of pneumococcal vaccination and other public health
interventions.
5.3 Seasonality of bronchiolitis hospitalisations
Bronchiolitis, most often associated with RSV, is a major cause of hospitalisation in
young children and those with chronic lung and congenital heart disease (the later
affecting approximately 192 births annually in WA)103 are particularly at high risk.71
Immunoprophylaxis with RSV monoclonal antibody palivizumab, is effective in reducing
severe RSV-related hospitalisations and monthly immunoprophylaxis is recommended
in high-risk children.71, 104 Monthly immunoprophylaxis is costly; therefore the most cost-
effective schedule follows the times of peak RSV activity105, usually during the winter
months May to October.
56
Using the WADLS75 we investigated the seasonality of bronchiolitis hospitalisations
(ICD10 code J21) from 1996 to 2005 as a proxy for RSV-related illness since some
children were not tested for RSV, test results were not documented on hospital
discharge notes or RSV immunofluorescence test may have been falsely negative.
Furthermore, RSV codes (B97.4, J12.1, J20.5, J21.0) were not used until July 1999.
We investigated the timing of bronchiolitis hospitalisations in the different health
regions of WA.
We identified 11,988 hospitalisations for bronchiolitis throughout WA among 245,249
births. The majority (81%) of bronchiolitis admissions were in children aged less than
12 months. In Perth metropolitan region there was a clear winter seasonal pattern
with hospitalisations peaking in July. However, in the Kimberley region in northern WA
there was a sustained bimodal seasonality with a peak in April and second peak in
August (Figure 5.4). Moreover, only 51.5% (n=469) of bronchiolitis admissions in the
Kimberley and 61.5% (n=444) in the Pilbara-Gascoyne (located in mid-north WA)
occurred between May and October as opposed to 84.3% (n=6354) in the metropolitan
region. These data support an earlier implementation and longer dosing schedule with
palivizumab where it is to be used in high-risk children in the Kimberley and Pilbara-
Gascoyne than in Perth.
This analysis has some limitations. Not all bronchiolitis hospitalisations may be caused
by RSV. However, when we investigated only those hospitalisations with an RSV code,
the monthly distribution showed a similar pattern. Additionally, timing of RSV activity
and therefore bronchiolitis, may vary from year to year. Although the numbers were too
small to allow separate analysis by calendar year, bronchiolitis hospitalisations in the
Kimberley showed an extended season in 8 of the 10 years.

57
These findings support the need for each jurisdiction to know their seasonal pattern of
bronchiolitis/RSV hospitalisations and implement recommended palivizumab schedules
accordingly. Such use of extended prophylactic regimens may well require re-
consideration of its cost effectiveness. This analysis highlights the relevance of
population-based data linkage studies to clinical care policy.
FIGURE 5.4 Monthly distribution of bronchiolitis hospitalisations by region of child’s
birth, 1996-2005
0
20
40
60
80
100
120
140
Jan Feb Mar Apr May Jun Jul Aug Sep Oct Nov Dec
Month of admission
No
. o
f h
os
pit
alis
ati
on
s (
Kim
be
rle
y a
nd
Pilb
ara
-Ga
sc
oy
ne
)
0
500
1000
1500
2000
2500
No
. o
f h
os
pit
alis
ati
on
s (
Me
tro
po
lita
n)
Kimberley Pilbara-Gascoyne Metropolitan Perth
58
CHAPTER 6
Causal Pathways to Hospitalisation Part I:
A retrospective population-based cohort study identifying
target areas for prevention of acute lower respiratory
infections in children
59
6.1 Preamble
This chapter is the first of two chapters investigating the causal pathways to
hospitalisation with ALRI. This chapter documents the frequency of ALRI admissions in
Aboriginal and non-Aboriginal children up to the age of 9 years and estimates
population attributable fractions (PAFs) of certain maternal and infant risk factors
separately in non-Aboriginal and Aboriginal children for ALRI before age 2 years in
order to guide the development of future preventive measures. This addresses
objectives 1a and 1c.
This chapter was published in BMC Public Health in December 2010. A copy of the
published paper is in Appendix 2. Details regarding the study setting and methodology
already explained in Chapters 2 and 4 have been removed here to minimise
duplication.
6.2 Introduction
As previously outlined, ALRIs are a leading cause of hospitalisation in young children,
particularly in those under the age of 2 years.1 Factors leading to an increased risk of
ALRI in young children include foetal growth measures, male gender, number of
children in the household, maternal education, maternal age, maternal smoking and
asthma and low socio-economic status.31, 55, 57-59, 62, 106 Foetal growth measures (short
gestation and birthweight) are the most commonly investigated risk factors, but studies
have shown discrepant results.55, 57, 58 Additionally, studies investigating the factors
associated with increased risk of ALRI in children have generally been conducted in
small community settings giving results that may not be generalisable to the wider
population,58, 106, 107 or have been conducted over a decade ago.59
60
While several factors have been associated with ALRI, the clinical significance of each
factor and the context of developing preventive measures at a population level has
generally been overlooked. This can be overcome by assessing the PAF which takes
into account the level of the exposure in the population and estimates the proportion of
the disease risk in a population that can be attributed to the causal effects of a risk
factor or set of risk factors.108, 109 By estimating PAFs we can determine the proportion
of disease that might be prevented if an exposure could be eliminated and hence help
plan appropriate public health preventive measures.110 Interactions between foetal
growth measures and socio-economic status, maternal asthma and smoking and the
modifying effect of some of these risk factors on others needs to be explored, but the
attributable fraction of risk factors alone can provide the basis on which to develop
targeted interventions to those most in need.
In industrialised countries, Indigenous populations, including Aboriginal Australians,
suffer high rates of ALRI,1, 7 and rates of pneumonia hospitalisations in those under the
age of 2 years are 13.5 times higher in Aboriginal than in non-Aboriginal children.7 Few
studies have investigated risk factors for ALRI separately for Indigenous and non-
Indigenous populations. Rather, studies have included ethnicity as a risk factor and
report that Indigenous or minority groups have an increased risk of ALRI.111-113 We
know that in WA the age and seasonal distribution of respiratory viruses differs
between Aboriginal and non-Aboriginal children (see Chapter 8). It is therefore
reasonable to expect that the relative importance of infant and maternal risk factors for
ALRI will differ between Aboriginal and non-Aboriginal children. Using the total
population-based WADLS,75 we have sufficient power and accurate identification of
Aboriginal status to investigate a substantial number of risk factors for severe ALRI at a
population level over many years. Here we have used the WADLS to investigate risk
factors for those children who have been admitted to hospital with ALRI on one or more
occasion. In particular, we investigate whether the combined and individual PAFs of
known infant and maternal risk factors for hospitalisation for ALRI at the antenatal and
61
natal period vary between Aboriginal and non-Aboriginal children. We hypothesise that
the PAF of individual risk factors is low.
6.2 Methods
6.2.1 Setting and data sources
I used data from the birth cohort and the hospital admissions dataset as explained in
Chapter 4. The analysis was limited to singleton births as multiple births are associated
with more pregnancy complications compared to single gestations114 and therefore are
likely to have a different risk profile with respect to ALRI. We identified hospital
admissions for ALRI using ICD diagnosis codes.80, 81 As explained in Chapter 4, a Perl
program was designed to forward map codes from the 9th version to the 10th version
using available mapping tables.82 I used the principal diagnosis code and 20 additional
diagnosis codes to identify admissions for ALRI in the following categories: pneumonia
(J12-J18, B59, B05.2, B37.1, B01.2), bronchiolitis (J21), influenza (J10-J11), whooping
cough (A37), bronchitis (J20) and unspecified ALRI (J22). ALRI admissions within 14
days of a previous ALRI admission were classified as a single episode.
6.2.2 Risk factors
The following maternal and infant risk factors were available from the WADLS for data
analysis: maternal age (<20, 20-24, 25-29, 30-34 or ≥35 years), presence of smoking
during pregnancy (yes/no), presence of maternal asthma during pregnancy (yes/no),
gestational age (<33, 33-34, 35-36 or ≥37 weeks, to examine effects of prematurity),
infant gender, number of previous pregnancies (0, 1, 2 or ≥3), mode of delivery
(vaginal, instrumental, elective caesarean or emergency caesarean as recorded on the
Midwives’ Notification Form), and season of birth (summer, autumn, winter or spring).
An elective caesarean is defined as a planned procedure prior to the onset of labour
and before spontaneous rupture of membranes and without any procedure to induce
62
labour. POBW, the measure which takes into account gestational duration, foetal
gender, maternal age, maternal height and parity,60 was used as a measure of
gestational age-specific appropriateness of foetal growth, rather than birthweight alone.
POBW was grouped into three categories (low <85%, normal 85-114% or high ≥115%).
The Socio-Economic Index for Area (SEIFA) is comprised of several indices, the main
index being the index for relative disadvantage which is derived from low income, low
educational attainment, high unemployment and jobs in unskilled occupations.115 This
was used as a measure of disadvantage for each collection district (grouping of
approximately 200 dwellings) in Australia. The collection district is the smallest unit
available for population-based analyses. SEIFA scores are grouped into quantiles
based on national statistics corresponding to the closest census year, either 1996 or
2001.116, 117 The Accessibility/Remoteness Index of Australia was used as a specific
measure of remoteness and access to services.118 This index classifies the population
into five categories (major cities, inner regional, outer regional, remote, or very remote)
based on postcode of residence recorded at the time of birth.
6.2.3 Statistical analysis
Person-time-at-risk was used to calculate age-specific incidence rates separately for
Aboriginal and non-Aboriginal children for the following age groups: <1, 1-2, 3-5, 6-11,
12-23 months, 2-4 and 5-9 years. The proportion of children admitted at least once
between 1996 and 2005 for pneumonia, bronchiolitis or influenza with each of the risk
factors was first assessed to determine the direction of risk for each factor and to
inform multivariate analysis. Multiple logistic regression was then used to generate
separate models for Aboriginal and non-Aboriginal children with the outcome being at
least one admission for ALRI before age 2 years (ie any admission versus no
admission). Adjusted PAFs and a combined PAF were calculated using the aflogit
command in Stata119 where the combined PAF estimates the proportional amount by
which disease risk would be reduced if all the risk factors were simultaneously
63
eliminated from the population.108 While non-modifiable factors cannot be eliminated,
the combined PAF is useful to highlight how much of the disease risk is attributed to all
the factors included in the model. Dummy variables for all risk factors were generated
with the reference level for each factor being the category with the lowest risk as
determined by the initial descriptive analysis. This was to ensure that the PAFs were
derived from positive associations with the outcome. We report odds ratios (ORs) and
95% CIs from univariate analyses for each risk factor separately in Aboriginal and non-
Aboriginal children adjusted only for year of birth and then adjusted ORs, PAF and
95%CIs from multivariate models including all the risk factors. All data cleaning was
conducted in SPSS version 15.0 and analysis was conducted in Stata version 10.0.
6.3 Results
Between 1996 and 2005, there were 26,106 episodes of ALRI identified in the birth
cohort of 245,249 children, 7.1% (17,466) of whom identified as Aboriginal. The overall
ALRI admission rate was 16.1/1,000 person-years for non-Aboriginal children and
93.0/1,000 person-years for Aboriginal children. Bronchiolitis accounted for 11,988
(45.9%) ALRI episodes (8,710 non-Aboriginal and 3,278 Aboriginal). Pneumonia was
the next most common ALRI diagnosis, accounting for 29.6% of all episodes (5,181
non-Aboriginal and 2,546 Aboriginal) and influenza accounted for 4.7%.
The highest hospitalisation rate for bronchiolitis in non-Aboriginal children was in those
aged 1-2 months and in Aboriginal children aged 3-5 months, for influenza in children
aged 1-5 months and for pneumonia, the highest hospitalisation rate in non-Aboriginal
children was in those aged 12-23 months and in Aboriginal children aged 6-11 months
(Table 6.1). Generally, ALRI admission rates were lower in children aged 2 years or
more compared with rates in younger children (Table 6.1). The biggest relative
disparity in admission rates between Aboriginal and non-Aboriginal children was for
64
pneumonia; for example, in children aged 3-5 months the hospitalisation rate for
pneumonia was 15 times higher in Aboriginal than in non-Aboriginal children.
One in four (25.6%) Aboriginal children were hospitalised at least once for ALRI
compared with one in 15 (6.5%) non-Aboriginal children. The proportions of children
admitted at least once for each level of the risk factors considered, were distributed
similarly for pneumonia, bronchiolitis and influenza (Table 6.2). Therefore, male
gender, POBW <85%, gestational age <33 weeks, ≥3 previous pregnancies, being
born in autumn or by caesarean section, maternal age <20 years, maternal smoking
and asthma during pregnancy, most disadvantaged families or those residing in outer
regional or remote areas with moderate to low access to services were identified as
those groups with the highest proportion of children hospitalised for ALRI before age 2
years (Table 6.2). As the risk factors were similar for pneumonia, bronchiolitis and
influenza, logistic regression models were conducted using the outcome of ALRI rather
than individual diagnostic categories of ALRI.
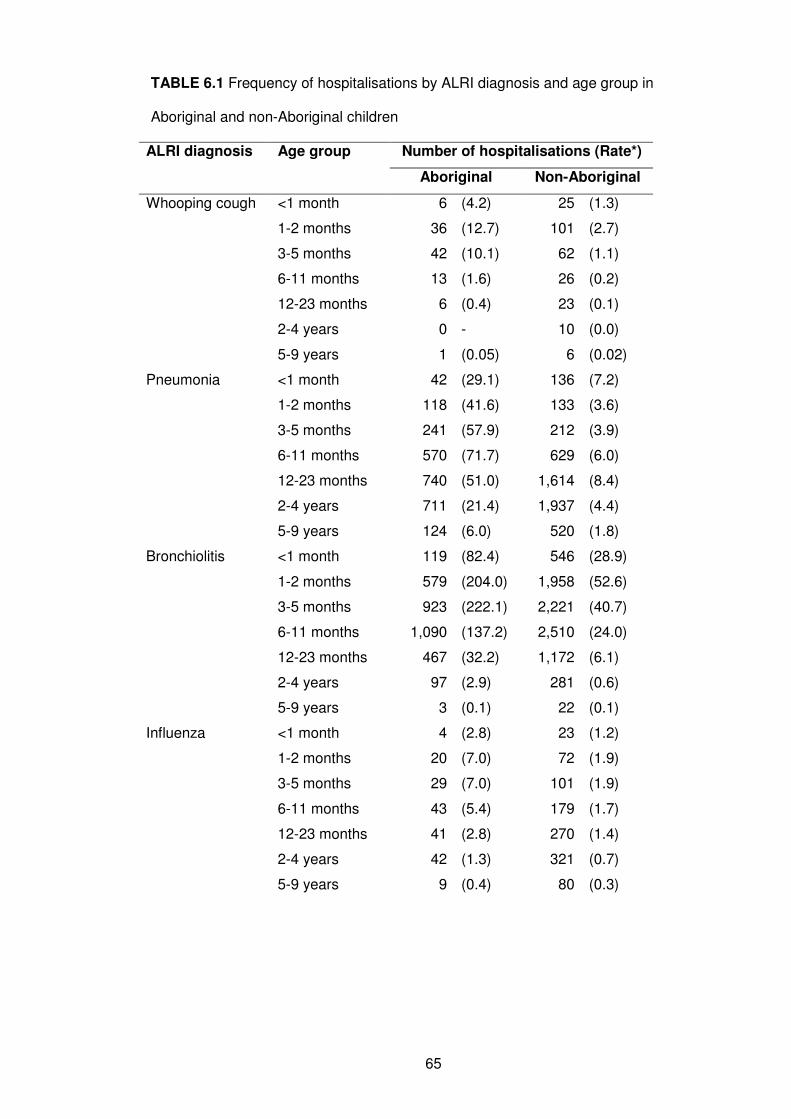
65
TABLE 6.1 Frequency of hospitalisations by ALRI diagnosis and age group in
Aboriginal and non-Aboriginal children
ALRI diagnosis Age group Number of hospitalisations (Rate*)
Aboriginal Non-Aboriginal
Whooping cough <1 month 6 (4.2) 25 (1.3)
1-2 months 36 (12.7) 101 (2.7)
3-5 months 42 (10.1) 62 (1.1)
6-11 months 13 (1.6) 26 (0.2)
12-23 months 6 (0.4) 23 (0.1)
2-4 years 0 - 10 (0.0)
5-9 years 1 (0.05) 6 (0.02)
Pneumonia <1 month 42 (29.1) 136 (7.2)
1-2 months 118 (41.6) 133 (3.6)
3-5 months 241 (57.9) 212 (3.9)
6-11 months 570 (71.7) 629 (6.0)
12-23 months 740 (51.0) 1,614 (8.4)
2-4 years 711 (21.4) 1,937 (4.4)
5-9 years 124 (6.0) 520 (1.8)
Bronchiolitis <1 month 119 (82.4) 546 (28.9)
1-2 months 579 (204.0) 1,958 (52.6)
3-5 months 923 (222.1) 2,221 (40.7)
6-11 months 1,090 (137.2) 2,510 (24.0)
12-23 months 467 (32.2) 1,172 (6.1)
2-4 years 97 (2.9) 281 (0.6)
5-9 years 3 (0.1) 22 (0.1)
Influenza <1 month 4 (2.8) 23 (1.2)
1-2 months 20 (7.0) 72 (1.9)
3-5 months 29 (7.0) 101 (1.9)
6-11 months 43 (5.4) 179 (1.7)
12-23 months 41 (2.8) 270 (1.4)
2-4 years 42 (1.3) 321 (0.7)
5-9 years 9 (0.4) 80 (0.3)
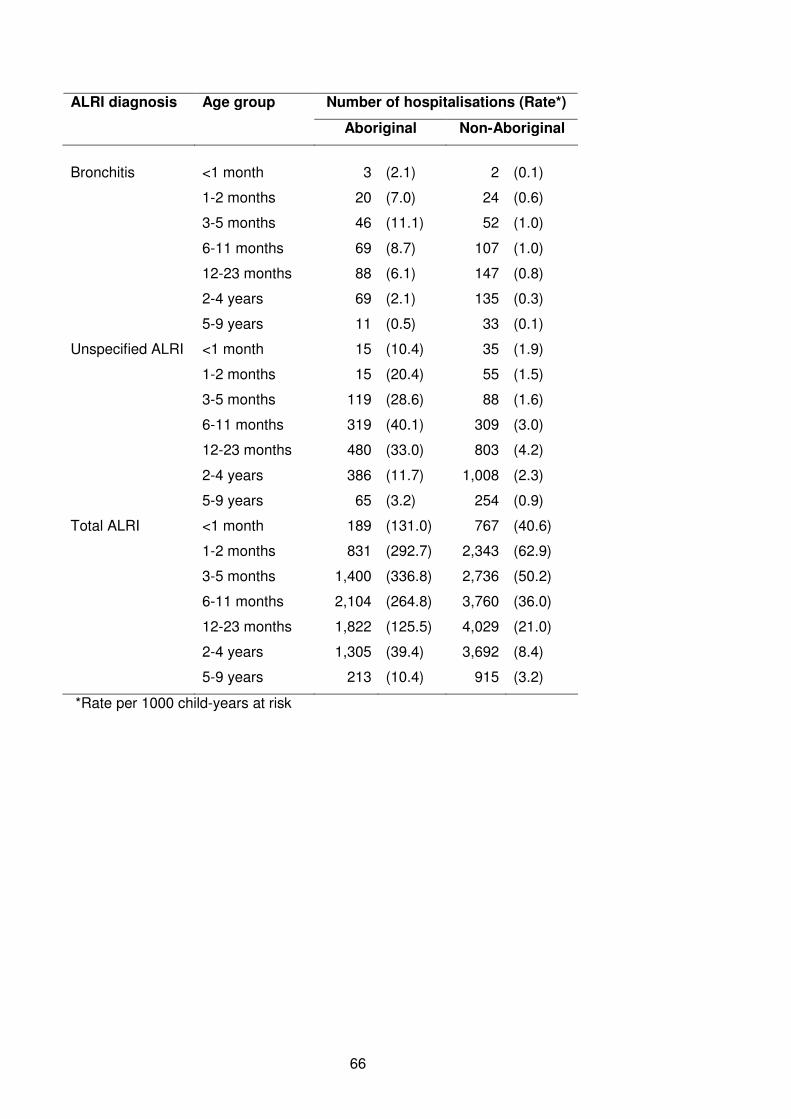
66
ALRI diagnosis Age group Number of hospitalisations (Rate*)
Aboriginal Non-Aboriginal
Bronchitis <1 month 3 (2.1) 2 (0.1)
1-2 months 20 (7.0) 24 (0.6)
3-5 months 46 (11.1) 52 (1.0)
6-11 months 69 (8.7) 107 (1.0)
12-23 months 88 (6.1) 147 (0.8)
2-4 years 69 (2.1) 135 (0.3)
5-9 years 11 (0.5) 33 (0.1)
Unspecified ALRI <1 month 15 (10.4) 35 (1.9)
1-2 months 15 (20.4) 55 (1.5)
3-5 months 119 (28.6) 88 (1.6)
6-11 months 319 (40.1) 309 (3.0)
12-23 months 480 (33.0) 803 (4.2)
2-4 years 386 (11.7) 1,008 (2.3)
5-9 years 65 (3.2) 254 (0.9)
Total ALRI <1 month 189 (131.0) 767 (40.6)
1-2 months 831 (292.7) 2,343 (62.9)
3-5 months 1,400 (336.8) 2,736 (50.2)
6-11 months 2,104 (264.8) 3,760 (36.0)
12-23 months 1,822 (125.5) 4,029 (21.0)
2-4 years 1,305 (39.4) 3,692 (8.4)
5-9 years 213 (10.4) 915 (3.2)
*Rate per 1000 child-years at risk
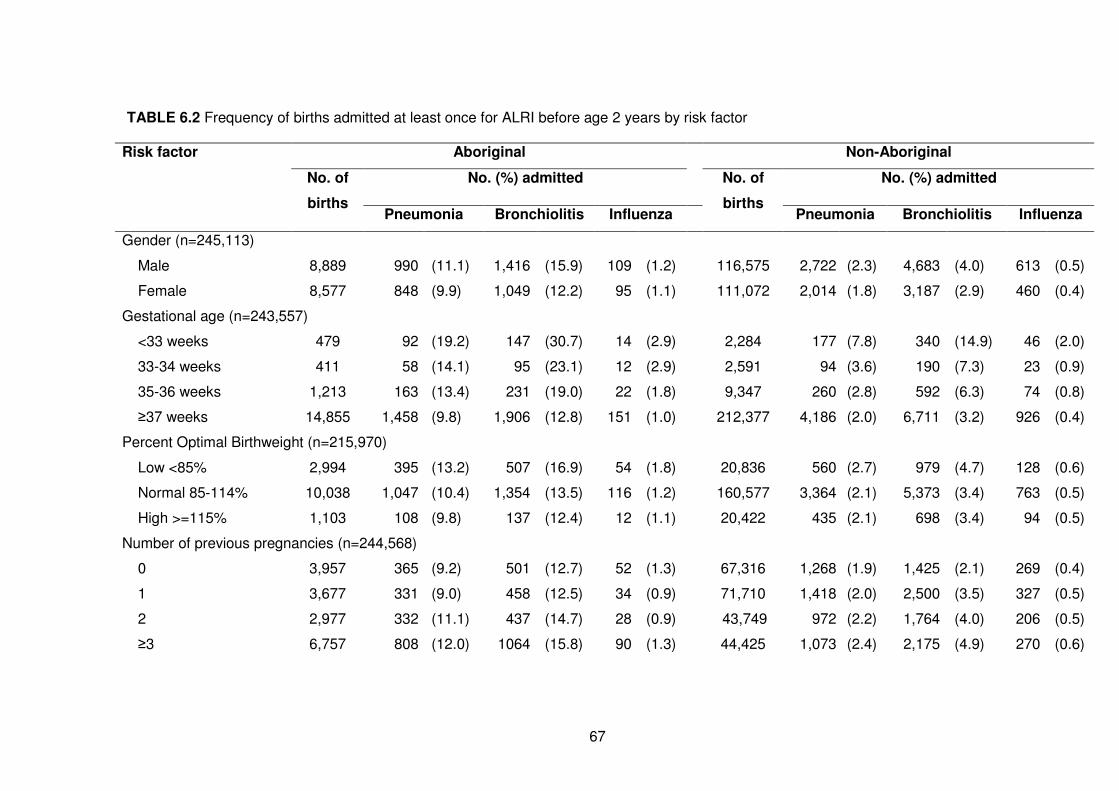
67
TABLE 6.2 Frequency of births admitted at least once for ALRI before age 2 years by risk factor
Risk factor Aboriginal Non-Aboriginal
No. (%) admitted No. (%) admitted No. of
births Pneumonia Bronchiolitis Influenza
No. of
births Pneumonia Bronchiolitis Influenza
Gender (n=245,113)
Male 8,889 990 (11.1) 1,416 (15.9) 109 (1.2) 116,575 2,722 (2.3) 4,683 (4.0) 613 (0.5)
Female 8,577 848 (9.9) 1,049 (12.2) 95 (1.1) 111,072 2,014 (1.8) 3,187 (2.9) 460 (0.4)
Gestational age (n=243,557)
<33 weeks 479 92 (19.2) 147 (30.7) 14 (2.9) 2,284 177 (7.8) 340 (14.9) 46 (2.0)
33-34 weeks 411 58 (14.1) 95 (23.1) 12 (2.9) 2,591 94 (3.6) 190 (7.3) 23 (0.9)
35-36 weeks 1,213 163 (13.4) 231 (19.0) 22 (1.8) 9,347 260 (2.8) 592 (6.3) 74 (0.8)
≥37 weeks 14,855 1,458 (9.8) 1,906 (12.8) 151 (1.0) 212,377 4,186 (2.0) 6,711 (3.2) 926 (0.4)
Percent Optimal Birthweight (n=215,970)
Low <85% 2,994 395 (13.2) 507 (16.9) 54 (1.8) 20,836 560 (2.7) 979 (4.7) 128 (0.6)
Normal 85-114% 10,038 1,047 (10.4) 1,354 (13.5) 116 (1.2) 160,577 3,364 (2.1) 5,373 (3.4) 763 (0.5)
High >=115% 1,103 108 (9.8) 137 (12.4) 12 (1.1) 20,422 435 (2.1) 698 (3.4) 94 (0.5)
Number of previous pregnancies (n=244,568)
0 3,957 365 (9.2) 501 (12.7) 52 (1.3) 67,316 1,268 (1.9) 1,425 (2.1) 269 (0.4)
1 3,677 331 (9.0) 458 (12.5) 34 (0.9) 71,710 1,418 (2.0) 2,500 (3.5) 327 (0.5)
2 2,977 332 (11.1) 437 (14.7) 28 (0.9) 43,749 972 (2.2) 1,764 (4.0) 206 (0.5)
≥3 6,757 808 (12.0) 1064 (15.8) 90 (1.3) 44,425 1,073 (2.4) 2,175 (4.9) 270 (0.6)
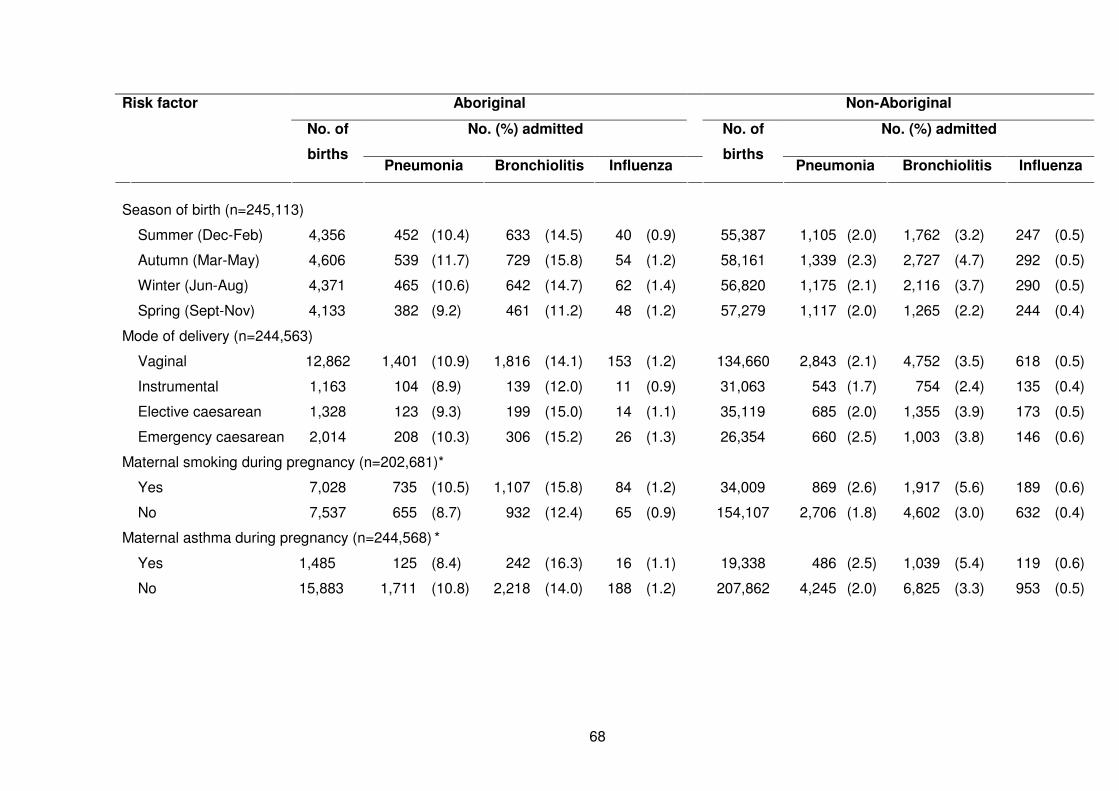
68
Risk factor Aboriginal Non-Aboriginal
No. (%) admitted No. (%) admitted No. of
births Pneumonia Bronchiolitis Influenza
No. of
births Pneumonia Bronchiolitis Influenza
Season of birth (n=245,113)
Summer (Dec-Feb) 4,356 452 (10.4) 633 (14.5) 40 (0.9) 55,387 1,105 (2.0) 1,762 (3.2) 247 (0.5)
Autumn (Mar-May) 4,606 539 (11.7) 729 (15.8) 54 (1.2) 58,161 1,339 (2.3) 2,727 (4.7) 292 (0.5)
Winter (Jun-Aug) 4,371 465 (10.6) 642 (14.7) 62 (1.4) 56,820 1,175 (2.1) 2,116 (3.7) 290 (0.5)
Spring (Sept-Nov) 4,133 382 (9.2) 461 (11.2) 48 (1.2) 57,279 1,117 (2.0) 1,265 (2.2) 244 (0.4)
Mode of delivery (n=244,563)
Vaginal 12,862 1,401 (10.9) 1,816 (14.1) 153 (1.2) 134,660 2,843 (2.1) 4,752 (3.5) 618 (0.5)
Instrumental 1,163 104 (8.9) 139 (12.0) 11 (0.9) 31,063 543 (1.7) 754 (2.4) 135 (0.4)
Elective caesarean 1,328 123 (9.3) 199 (15.0) 14 (1.1) 35,119 685 (2.0) 1,355 (3.9) 173 (0.5)
Emergency caesarean 2,014 208 (10.3) 306 (15.2) 26 (1.3) 26,354 660 (2.5) 1,003 (3.8) 146 (0.6)
Maternal smoking during pregnancy (n=202,681)*
Yes 7,028 735 (10.5) 1,107 (15.8) 84 (1.2) 34,009 869 (2.6) 1,917 (5.6) 189 (0.6)
No 7,537 655 (8.7) 932 (12.4) 65 (0.9) 154,107 2,706 (1.8) 4,602 (3.0) 632 (0.4)
Maternal asthma during pregnancy (n=244,568) *
Yes 1,485 125 (8.4) 242 (16.3) 16 (1.1) 19,338 486 (2.5) 1,039 (5.4) 119 (0.6)
No 15,883 1,711 (10.8) 2,218 (14.0) 188 (1.2) 207,862 4,245 (2.0) 6,825 (3.3) 953 (0.5)
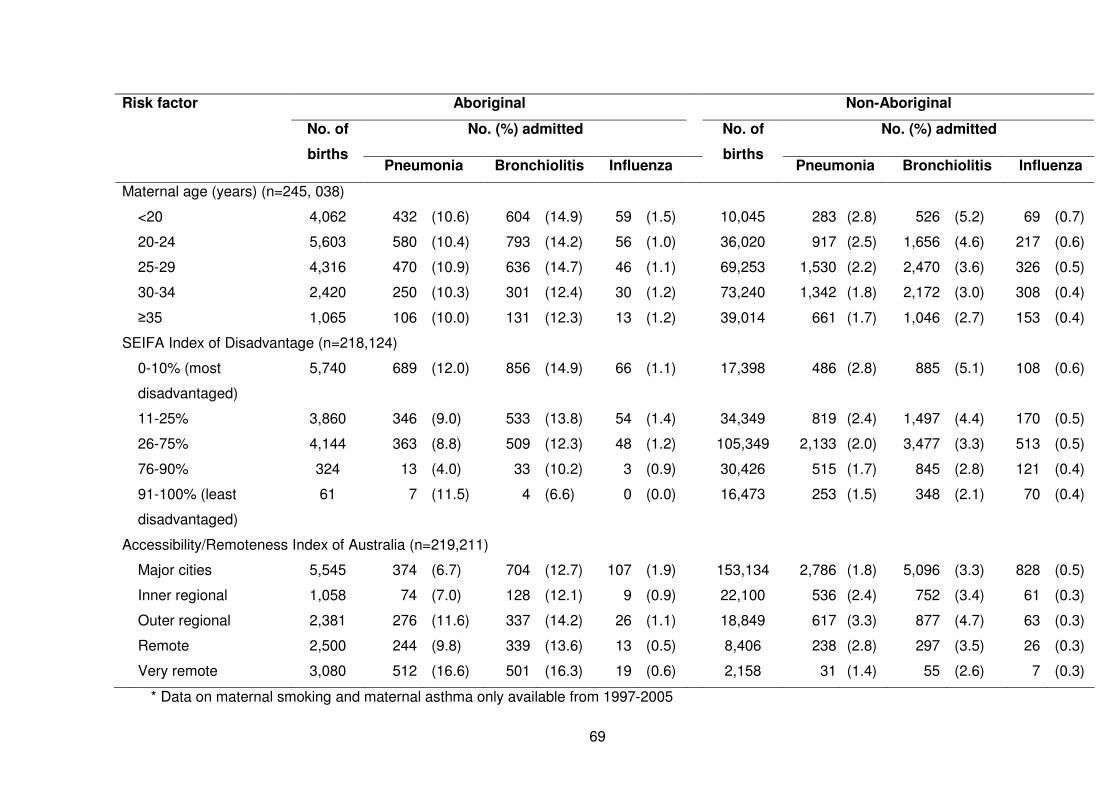
69
Risk factor Aboriginal Non-Aboriginal
No. (%) admitted No. (%) admitted No. of
births Pneumonia Bronchiolitis Influenza
No. of
births Pneumonia Bronchiolitis Influenza
Maternal age (years) (n=245, 038)
<20 4,062 432 (10.6) 604 (14.9) 59 (1.5) 10,045 283 (2.8) 526 (5.2) 69 (0.7)
20-24 5,603 580 (10.4) 793 (14.2) 56 (1.0) 36,020 917 (2.5) 1,656 (4.6) 217 (0.6)
25-29 4,316 470 (10.9) 636 (14.7) 46 (1.1) 69,253 1,530 (2.2) 2,470 (3.6) 326 (0.5)
30-34 2,420 250 (10.3) 301 (12.4) 30 (1.2) 73,240 1,342 (1.8) 2,172 (3.0) 308 (0.4)
≥35 1,065 106 (10.0) 131 (12.3) 13 (1.2) 39,014 661 (1.7) 1,046 (2.7) 153 (0.4)
SEIFA Index of Disadvantage (n=218,124)
0-10% (most
disadvantaged)
5,740 689 (12.0) 856 (14.9) 66 (1.1) 17,398 486 (2.8) 885 (5.1) 108 (0.6)
11-25% 3,860 346 (9.0) 533 (13.8) 54 (1.4) 34,349 819 (2.4) 1,497 (4.4) 170 (0.5)
26-75% 4,144 363 (8.8) 509 (12.3) 48 (1.2) 105,349 2,133 (2.0) 3,477 (3.3) 513 (0.5)
76-90% 324 13 (4.0) 33 (10.2) 3 (0.9) 30,426 515 (1.7) 845 (2.8) 121 (0.4)
91-100% (least
disadvantaged)
61 7 (11.5) 4 (6.6) 0 (0.0) 16,473 253 (1.5) 348 (2.1) 70 (0.4)
Accessibility/Remoteness Index of Australia (n=219,211)
Major cities 5,545 374 (6.7) 704 (12.7) 107 (1.9) 153,134 2,786 (1.8) 5,096 (3.3) 828 (0.5)
Inner regional 1,058 74 (7.0) 128 (12.1) 9 (0.9) 22,100 536 (2.4) 752 (3.4) 61 (0.3)
Outer regional 2,381 276 (11.6) 337 (14.2) 26 (1.1) 18,849 617 (3.3) 877 (4.7) 63 (0.3)
Remote 2,500 244 (9.8) 339 (13.6) 13 (0.5) 8,406 238 (2.8) 297 (3.5) 26 (0.3)
Very remote 3,080 512 (16.6) 501 (16.3) 19 (0.6) 2,158 31 (1.4) 55 (2.6) 7 (0.3)
* Data on maternal smoking and maternal asthma only available from 1997-2005
70
Logistic regression models calculating PAFs were restricted to ALRI episodes before
age 2 years as the majority of ALRI episodes occurred in this age group. As no
differences with regard to patterns of risk between pneumonia, bronchiolitis and
influenza were observed, logistic regression models were generated with the outcome
of any ALRI diagnosis.
In non-Aboriginal children the strongest association was for gestational age where for
very preterm children (gestational age <33 weeks), the odds of an ALRI admission was
5 times higher compared with children born at ≥37 weeks gestation, independent of
other risk factors (adjusted OR 4.70, 95% CI: 4.08, 5.41) (Table 6.3). In the adjusted
analysis there was a 33% increase in the odds of ALRI admission if the mother smoked
during pregnancy and a 47% increase if the mother had asthma during pregnancy
(Table 6.3). There was a positive association between younger maternal age and risk
of ALRI admission. The highest odds of ALRI was in children of teenage mothers
(adjusted OR 2.60, 95% CI: 2.3, 2.94) compared to children of mothers aged 35 years
or more. The combined PAF for non-Aboriginal children was 88.3% (95% CI: 84.3,
91.3), indicating that the factors included in the model accounted for most of the risk of
hospitalisation. Adjusting for all other risk factors, the factors with the highest PAFs
were male gender (16%), being born to a mother who already had three or more
pregnancies (15%) and being born in autumn (months March to May, 12%). Maternal
smoking during pregnancy accounted for 6% of the PAF, maternal asthma during
pregnancy accounted for 5% and elective caesarean deliveries accounted for 4%
(Table 6.3).
In Aboriginal children the largest association with ALRI admission was also with
gestational age, independent of other risk factors; in this case very preterm children
had an OR of 3.18 (Table 6.4). Similar to non-Aboriginal children, children of teenage
mothers had the highest odds of ALRI compared to older mothers. Although the
71
combined PAF for Aboriginal children was slightly higher than for non-Aboriginal
children at 91.3% (95% CI: 76.0, 96.9), the individual PAFs were lower for several
factors. The most disadvantaged children, with a SEIFA score in the 0-10% quantile,
and those in very remote locations with poor access to services accounted for the
highest PAFs for ALRI admission (18% for most disadvantaged and 12% for those in
very remote locations) (Table 6.4). Similar to non-Aboriginal children, being of male
gender accounted for 13% and being born to a mother with three or more previous
pregnancies accounted for 17%. Adjusting for all other risk factors, maternal smoking
during pregnancy accounted for 5% of the PAF and being born to a teenage mother
accounted for 11% (Table 6.4). The results were similar when the outcome was
restricted to admission for ALRI before age 6 months in both Aboriginal and non-
Aboriginal children.
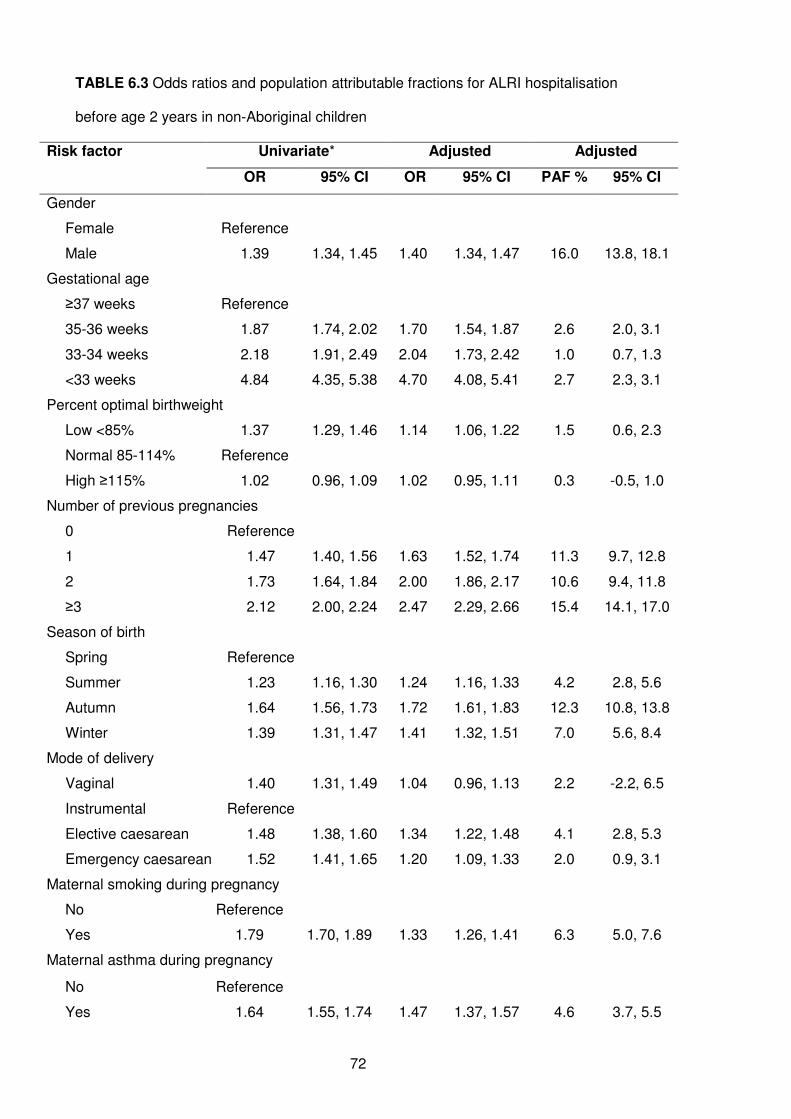
72
TABLE 6.3 Odds ratios and population attributable fractions for ALRI hospitalisation
before age 2 years in non-Aboriginal children
Risk factor Univariate* Adjusted Adjusted
OR 95% CI OR 95% CI PAF % 95% CI
Gender
Female Reference
Male 1.39 1.34, 1.45 1.40 1.34, 1.47 16.0 13.8, 18.1
Gestational age
≥37 weeks Reference
35-36 weeks 1.87 1.74, 2.02 1.70 1.54, 1.87 2.6 2.0, 3.1
33-34 weeks 2.18 1.91, 2.49 2.04 1.73, 2.42 1.0 0.7, 1.3
<33 weeks 4.84 4.35, 5.38 4.70 4.08, 5.41 2.7 2.3, 3.1
Percent optimal birthweight
Low <85% 1.37 1.29, 1.46 1.14 1.06, 1.22 1.5 0.6, 2.3
Normal 85-114% Reference
High ≥115% 1.02 0.96, 1.09 1.02 0.95, 1.11 0.3 -0.5, 1.0
Number of previous pregnancies
0 Reference
1 1.47 1.40, 1.56 1.63 1.52, 1.74 11.3 9.7, 12.8
2 1.73 1.64, 1.84 2.00 1.86, 2.17 10.6 9.4, 11.8
≥3 2.12 2.00, 2.24 2.47 2.29, 2.66 15.4 14.1, 17.0
Season of birth
Spring Reference
Summer 1.23 1.16, 1.30 1.24 1.16, 1.33 4.2 2.8, 5.6
Autumn 1.64 1.56, 1.73 1.72 1.61, 1.83 12.3 10.8, 13.8
Winter 1.39 1.31, 1.47 1.41 1.32, 1.51 7.0 5.6, 8.4
Mode of delivery
Vaginal 1.40 1.31, 1.49 1.04 0.96, 1.13 2.2 -2.2, 6.5
Instrumental Reference
Elective caesarean 1.48 1.38, 1.60 1.34 1.22, 1.48 4.1 2.8, 5.3
Emergency caesarean 1.52 1.41, 1.65 1.20 1.09, 1.33 2.0 0.9, 3.1
Maternal smoking during pregnancy
No Reference
Yes 1.79 1.70, 1.89 1.33 1.26, 1.41 6.3 5.0, 7.6
Maternal asthma during pregnancy
No Reference
Yes 1.64 1.55, 1.74 1.47 1.37, 1.57 4.6 3.7, 5.5
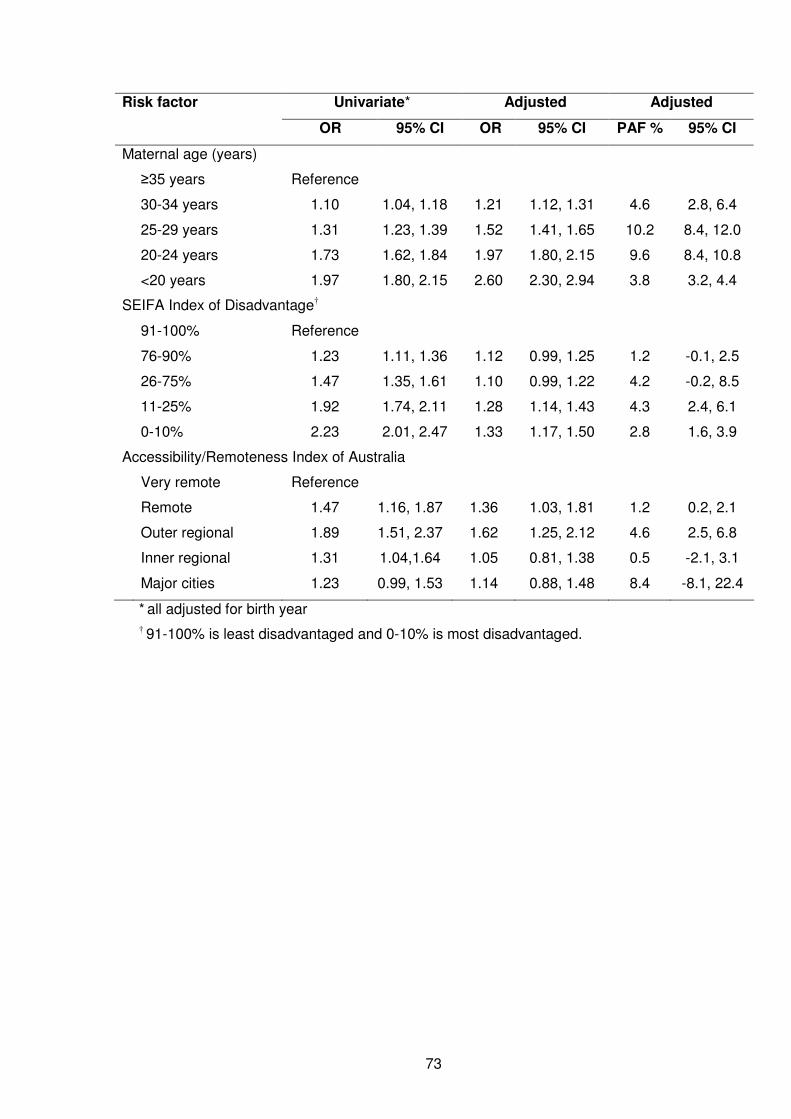
73
Risk factor Univariate* Adjusted Adjusted
OR 95% CI OR 95% CI PAF % 95% CI
Maternal age (years)
≥35 years Reference
30-34 years 1.10 1.04, 1.18 1.21 1.12, 1.31 4.6 2.8, 6.4
25-29 years 1.31 1.23, 1.39 1.52 1.41, 1.65 10.2 8.4, 12.0
20-24 years 1.73 1.62, 1.84 1.97 1.80, 2.15 9.6 8.4, 10.8
<20 years 1.97 1.80, 2.15 2.60 2.30, 2.94 3.8 3.2, 4.4
SEIFA Index of Disadvantage†
91-100% Reference
76-90% 1.23 1.11, 1.36 1.12 0.99, 1.25 1.2 -0.1, 2.5
26-75% 1.47 1.35, 1.61 1.10 0.99, 1.22 4.2 -0.2, 8.5
11-25% 1.92 1.74, 2.11 1.28 1.14, 1.43 4.3 2.4, 6.1
0-10% 2.23 2.01, 2.47 1.33 1.17, 1.50 2.8 1.6, 3.9
Accessibility/Remoteness Index of Australia
Very remote Reference
Remote 1.47 1.16, 1.87 1.36 1.03, 1.81 1.2 0.2, 2.1
Outer regional 1.89 1.51, 2.37 1.62 1.25, 2.12 4.6 2.5, 6.8
Inner regional 1.31 1.04,1.64 1.05 0.81, 1.38 0.5 -2.1, 3.1
Major cities 1.23 0.99, 1.53 1.14 0.88, 1.48 8.4 -8.1, 22.4
* all adjusted for birth year
† 91-100% is least disadvantaged and 0-10% is most disadvantaged.
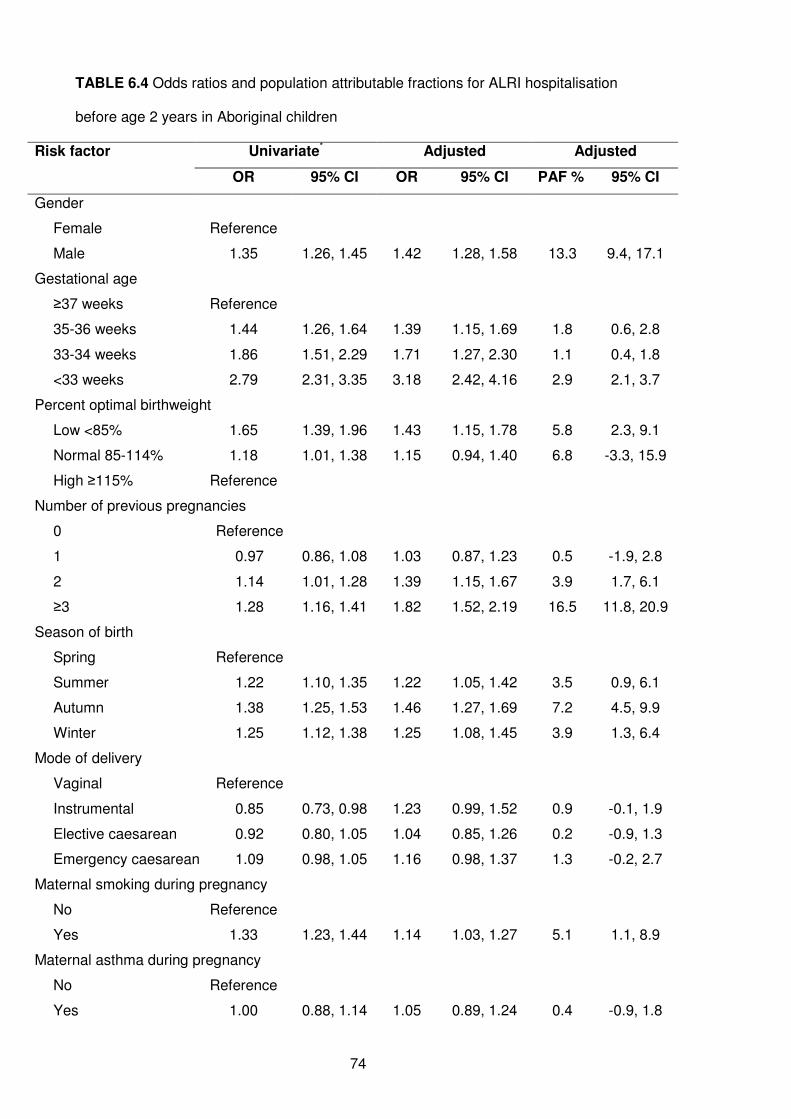
74
TABLE 6.4 Odds ratios and population attributable fractions for ALRI hospitalisation
before age 2 years in Aboriginal children
Risk factor Univariate* Adjusted Adjusted
OR 95% CI OR 95% CI PAF % 95% CI
Gender
Female Reference
Male 1.35 1.26, 1.45 1.42 1.28, 1.58 13.3 9.4, 17.1
Gestational age
≥37 weeks Reference
35-36 weeks 1.44 1.26, 1.64 1.39 1.15, 1.69 1.8 0.6, 2.8
33-34 weeks 1.86 1.51, 2.29 1.71 1.27, 2.30 1.1 0.4, 1.8
<33 weeks 2.79 2.31, 3.35 3.18 2.42, 4.16 2.9 2.1, 3.7
Percent optimal birthweight
Low <85% 1.65 1.39, 1.96 1.43 1.15, 1.78 5.8 2.3, 9.1
Normal 85-114% 1.18 1.01, 1.38 1.15 0.94, 1.40 6.8 -3.3, 15.9
High ≥115% Reference
Number of previous pregnancies
0 Reference
1 0.97 0.86, 1.08 1.03 0.87, 1.23 0.5 -1.9, 2.8
2 1.14 1.01, 1.28 1.39 1.15, 1.67 3.9 1.7, 6.1
≥3 1.28 1.16, 1.41 1.82 1.52, 2.19 16.5 11.8, 20.9
Season of birth
Spring Reference
Summer 1.22 1.10, 1.35 1.22 1.05, 1.42 3.5 0.9, 6.1
Autumn 1.38 1.25, 1.53 1.46 1.27, 1.69 7.2 4.5, 9.9
Winter 1.25 1.12, 1.38 1.25 1.08, 1.45 3.9 1.3, 6.4
Mode of delivery
Vaginal Reference
Instrumental 0.85 0.73, 0.98 1.23 0.99, 1.52 0.9 -0.1, 1.9
Elective caesarean 0.92 0.80, 1.05 1.04 0.85, 1.26 0.2 -0.9, 1.3
Emergency caesarean 1.09 0.98, 1.05 1.16 0.98, 1.37 1.3 -0.2, 2.7
Maternal smoking during pregnancy
No Reference
Yes 1.33 1.23, 1.44 1.14 1.03, 1.27 5.1 1.1, 8.9
Maternal asthma during pregnancy
No Reference
Yes 1.00 0.88, 1.14 1.05 0.89, 1.24 0.4 -0.9, 1.8
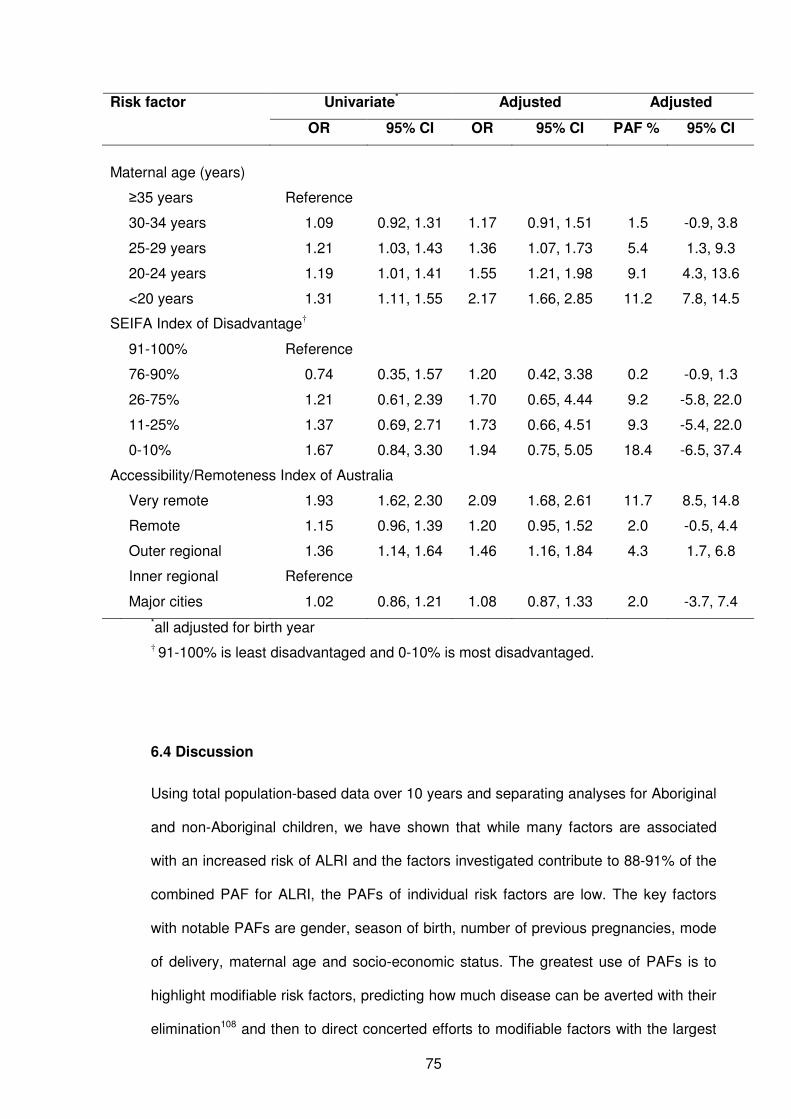
75
Risk factor Univariate* Adjusted Adjusted
OR 95% CI OR 95% CI PAF % 95% CI
Maternal age (years)
≥35 years Reference
30-34 years 1.09 0.92, 1.31 1.17 0.91, 1.51 1.5 -0.9, 3.8
25-29 years 1.21 1.03, 1.43 1.36 1.07, 1.73 5.4 1.3, 9.3
20-24 years 1.19 1.01, 1.41 1.55 1.21, 1.98 9.1 4.3, 13.6
<20 years 1.31 1.11, 1.55 2.17 1.66, 2.85 11.2 7.8, 14.5
SEIFA Index of Disadvantage†
91-100% Reference
76-90% 0.74 0.35, 1.57 1.20 0.42, 3.38 0.2 -0.9, 1.3
26-75% 1.21 0.61, 2.39 1.70 0.65, 4.44 9.2 -5.8, 22.0
11-25% 1.37 0.69, 2.71 1.73 0.66, 4.51 9.3 -5.4, 22.0
0-10% 1.67 0.84, 3.30 1.94 0.75, 5.05 18.4 -6.5, 37.4
Accessibility/Remoteness Index of Australia
Very remote 1.93 1.62, 2.30 2.09 1.68, 2.61 11.7 8.5, 14.8
Remote 1.15 0.96, 1.39 1.20 0.95, 1.52 2.0 -0.5, 4.4
Outer regional 1.36 1.14, 1.64 1.46 1.16, 1.84 4.3 1.7, 6.8
Inner regional Reference
Major cities 1.02 0.86, 1.21 1.08 0.87, 1.33 2.0 -3.7, 7.4
*all adjusted for birth year
† 91-100% is least disadvantaged and 0-10% is most disadvantaged.
6.4 Discussion
Using total population-based data over 10 years and separating analyses for Aboriginal
and non-Aboriginal children, we have shown that while many factors are associated
with an increased risk of ALRI and the factors investigated contribute to 88-91% of the
combined PAF for ALRI, the PAFs of individual risk factors are low. The key factors
with notable PAFs are gender, season of birth, number of previous pregnancies, mode
of delivery, maternal age and socio-economic status. The greatest use of PAFs is to
highlight modifiable risk factors, predicting how much disease can be averted with their
elimination108 and then to direct concerted efforts to modifiable factors with the largest
76
PAFs. Not all risk factors we have presented here are amenable to intervention or are
even modifiable, but our analysis has highlighted differences and similarities in the
level of importance of risk factors for ALRI in Aboriginal and non-Aboriginal singleton
children and we highlight the areas that need to be targeted for ALRI prevention in
these populations.
Similar to a retrospective cohort study in the United States of America,120 we found a
strong association between seasonality of births and risk of ALRI with the highest risk
in autumn-born children who were then aged 1-5 months in winter, the time when RSV
is circulating (see Chapter 8) and infants are at the highest risk of ALRI, especially
bronchiolitis.107 This would suggest that, in order to reduce cost of RSV
immunoprophylaxis with monoclonal antibody palivizumab which is recommended for
high risk children,71 it might be better to target children based on their month of birth
rather than on the timing of the RSV season alone. The relationship between number
of previous pregnancies and risk of ALRI for Aboriginal and non-Aboriginal children
could be seen as a proxy for crowding, where the highest risk of ALRI is in a child born
to a mother who has previously had three or more pregnancies, although we
acknowledge the outcome of these previous pregnancies is unknown. However, the
likelihood of these families having a child of preschool age in the house is high,
representing conditions favouring transmission of respiratory pathogens.121 The
increased risk with multiple number of pregnancies has also been reported in another
Australian study with a combined analysis of Aboriginal and non-Aboriginal children.64
Maternal smoking during pregnancy is an independent risk factor for ALRI and
increases in risk in the order of 19-29% have been found in mothers who smoked
during pregnancy.61, 106, 122 We add to this evidence and report a 33% increase in odds
for non-Aboriginal children and a 14% increase in odds for Aboriginal children;
however, few other studies have used PAFs to compare to our estimates. In our study,
in the presence of other factors, 6% of ALRI in non-Aboriginal children and 5% in

77
Aboriginal children could be prevented if maternal smoking was eliminated. This is
lower than a study conducted in an Indigenous population of Greenland that found a
PAF of 47%, but this related to exposure to passive smoking around the time after birth
and risk of ALRI in a community setting.107 However, parental smoking should continue
to be a priority for public health intervention as it is a modifiable risk factor. Gestational
age has previously been identified as an important risk factor for ALRI.55, 58, 123 Even
though the odds of ALRI were almost 5-fold for non-Aboriginal and 3-fold for Aboriginal
very preterm infants in our study, the PAF was only 3%.
We report differences in importance of various risk factors between Aboriginal and non-
Aboriginal children indicating that different public health interventions need to be
designed and implemented accordingly. For non-Aboriginal children, results suggest
that 4% of ALRI could be prevented if there were no elective caesarean sections and
lowest risk was in mothers who had an instrumental delivery, if the association is
causal. This association with elective caesareans has been reported previously
concentrating on neonatal respiratory morbidity,124 but the mechanisms underlying this
association remain unclear and further studies are needed to understand this
relationship. Similarly, maternal asthma was a significant risk factor in non-Aboriginal
children but not in Aboriginal children. Maternal asthma has been found to be a more
important risk factor for ALRI than smoking,125, 126 but we found a similar PAF of
maternal smoking and maternal asthma in pregnancy in non-Aboriginal children and
maternal smoking is more amenable to intervention than maternal asthma.
There was an inverse relationship with maternal age with the highest risk of ALRI in
children of teenage mothers, a finding that has also been reported previously.106 This
was especially in Aboriginal children in whom 11% of ALRI could be prevented if the
association is causal and if there were no births to teenage mothers who represented
almost a quarter of all Aboriginal mothers. More awareness is needed regarding the
risks of teenage pregnancies and efforts to reduce the teenage pregnancy rate in the
78
Aboriginal population need to be enhanced. Also, for Aboriginal children, the most
disadvantaged socio-economic groups and those located in the very remote regions
accounted for the highest PAFs. These results suggest that if living conditions and
access to services were improved, a substantial proportion of ALRI hospitalisations
could be prevented in this population and this would have a higher impact than
prevention of smoking in pregnancy. However for general living conditions to improve
in the Aboriginal population a multifaceted approach involving infrastructure such as
housing and management,127 children’s education and training of healthcare providers
at the state government and local community level is needed.
While migration out of WA for children aged less than four years is small,84 we are
unable to estimate the proportion of individuals that moved around the state from their
area of birth. This is due to privacy and confidentiality restrictions associated with
obtaining data from the WADLS. Therefore socio-economic status and the
accessibility/remoteness index may have changed between birth and time of
hospitalisation, but we believe this to have little impact on our results. There are other
potential risk factors that were not available in our current dataset such as paternal
smoking, whether assisted reproduction was used, presence and duration of
breastfeeding, immunisation status and child care attendance. Instead our emphasis
has been on maternal and infant factors in the antenatal and natal period. We are
currently unable to assess the impact of vaccines due to the non-availability of data,
although we are planning to link individual immunisation data to the WADLS to address
this issue at an individual level. Another limitation of our study is the quality of the data
on risk factors especially in regards to maternal smoking and asthma. Recording of
these measures on the Midwives’ Notification System only commenced in 1997 and
has not been validated. One study alluded that several other measures on the
Midwives’ Notification System, including mode of delivery, have high specificity but low
sensitivity (E Blair, personal communication 2009). Therefore we may be
underestimating the relationship between some of these factors and risk of ALRI and
79
therefore underestimating the PAF. In multiple risk factor analysis there is the inherent
problem of colinearity between factors. This has been noted previously in one study
where gestational age was not an independent risk factor as it was related to so many
other factors111 and another where the presence of maternal asthma modified the risk
of preterm delivery.128
6.5 Conclusion
This is one of the few studies to report PAFs for ALRI and the first study to assess
PAFs separately for Aboriginal and non-Aboriginal populations. The WADLS captures
information on >99% of births in WA with accurate identification of Aboriginal status
and this has given us the opportunity to conduct meaningful analyses with sufficient
power. We have highlighted areas that require a more targeted approach for
intervention, those factors that need to be targeted separately in Aboriginal and non-
Aboriginal children and those factors that are not modifiable but highlight susceptible
subgroups that need to have increased awareness of the higher risk of ALRI. As there
are many factors that span lifestyle, environmental and social aspects leading to ALRI,
a multifaceted approach is needed to move towards prevention. In the first instance,
increased RSV immunoprophylaxis measures for autumn-born babies with other risk
factors, and interventions targeting maternal smoking during pregnancy need attention
and further analysis is needed to understand the associations with teenage
pregnancies in Aboriginal women and elective caesareans in non-Aboriginal women
(see Table 12.2). Infants in the first six months of life are at a high risk of ALRI and
efforts such as education around infection control measures and hygiene including
hand-washing need to be reinforced. Finally, PAFs are useful in determining the areas
that need to be targeted for prevention, especially where causality can be assumed,
and they should be reported more widely.
80
CHAPTER 7
Causal Pathways to Hospitalisation Part II:
Repeated bronchiolitis hospitalisation in infants is
associated with elective caesarean delivery
81
7.1 Preamble
This chapter follows on the previous chapter and further explores risk factors to
hospitalisation with ALRI. In Chapter 6, there was a significant relationship between
elective caesarean delivery and ALRI admissions in non-Aboriginal children but not in
Aboriginal children. As this was a novel finding, I conducted further, more detailed
analyses, investigating the relationship between mode of delivery and repeated
hospitalisations for the two most common ALRI diagnoses: bronchiolitis and
pneumonia. This chapter therefore also addresses objective 1c of the thesis.
This chapter has been submitted for publication to Archives of Disease in Childhood.
7.2 Introduction
The rates of elective caesarean delivery are increasing in the Western world. In
Sweden the proportion of children delivered by elective caesarean increased from
5.1% in 1992 to 19.3% in 2005129 and in Canada from 13.4-17.5% between 1988 and
2000.130 In WA, the proportion of deliveries that were by elective caesarean increased
from 6.4% in 1984-1988 to 13.2% in 1999-2003 and this increase was thought to be
probably due to maternal request.131
There have been numerous reports associating elective caesarean deliveries with poor
outcomes, including birth trauma in infants,132 respiratory morbidity of the newborn,133
respiratory distress syndrome,134 admissions to advanced care nursery and transient
tachypnoea of the newborn.135 Furthermore, compared with normal vaginal delivery,
children delivered by caesarean section have a 20-60% increased risk of asthma in
childhood136, 137 and a 3-fold increased risk in adulthood,138 although it is not known if
these associations were found with elective caesareans or emergency caesareans. In
the previous chapter, we noted an increased risk of hospitalisation for ALRI before age
82
24 months in non-Aboriginal children, who were delivered by elective caesarean (OR:
1.34, 95% CI: 1.22-1.48 with a PAF of 4.1%, 95% CI: 2.8-5.3). In this chapter, this
association is explored further. Such an association was not found in the Aboriginal
population.
Early viral illness, in particular bronchiolitis caused by RSV, has been shown to be
associated with increased risk of asthma in children,4, 5 and the risk of persistent
wheeze in children increases with increasing number of viral infection episodes.139 If
elective caesarean delivery heightens the risk of ALRI, or specifically bronchiolitis, it
may explain the relationship noted between caesarean delivery and subsequent
asthma.
Previously, we investigated the risk factors of children admitted at least once to hospital
for ALRI (Chapter 6). In this current analysis we used the number of hospital
admissions as a continuous measure of severity. We examined the relationship
between mode of delivery and ALRI, independent of pregnancy-related and other
maternal and infant risk factors, by investigating the associations with the number of
hospital admissions for both bronchiolitis and pneumonia in children before the age of
12 months and in those aged 12-23 months.
7.3 Methods
7.3.1 Data Source
I used data from the birth cohort and the hospital admissions dataset as explained in
Chapter 4. The ICD10 code J21 was used to identify bronchiolitis admissions and the
ICD10 codes J12-J18, B59, B05.2, B37.1 and B01.2 were used to identify pneumonia
admissions.
83
Information on mode of delivery was obtained from the Midwives’ Notification System.
As many births had multiple modes of delivery recorded (for example spontaneous
vaginal and successful use of forceps), an algorithm was developed that ranked the
different delivery methods in the following order: emergency caesarean, elective
caesarean, instrumental (combining vacuum and forceps) and spontaneous vaginal so
that mode of delivery was classified as an elective caesarean regardless of other
information on the midwives’ form unless an emergency caesarean was noted.
According to the Western Australian Department of Health’s guidelines for completion
of the midwife form,78 an elective caesarean is defined as a planned procedure prior to
the onset of labour and before spontaneous rupture of membranes and without any
procedure used to induce labour. These guidelines also state that if a woman is
scheduled for an elective caesarean and either goes into spontaneous labour or has a
spontaneous rupture of membranes and the caesarean section is performed in
advance of the elective caesarean section, then the delivery method is recorded as
emergency caesarean.78 Therefore, according to the guidelines, elective caesareans
recorded on the Midwives’ Notification Form should reflect true elective caesareans
and can be considered as delivery in the absence of labour.
7.3.2 Statistical Analysis
Factors were included in the analysis based on their significant association with ALRI
hospitalisation from logistic regression analyses conducted in the previous chapter. In
addition to these factors, we controlled for other factors such as pregnancy
complications that might both predispose a woman to deliver a child through elective
caesarean and increase risk of ALRI in her offspring. The analysis therefore included
the following maternal and infant risk factors: maternal age (categorised into <20, 20-
24, 25-29, 30-34 or ≥35 years), number of previous pregnancies (0, 1, 2 or ≥3), pre-
eclampsia (yes/no), gestational diabetes (yes/no), breech presentation (yes/no),
maternal smoking during pregnancy (yes/no), maternal asthma (yes/no), infant gender
84
(male/female), season of birth (summer, autumn, winter or spring), gestational age in
weeks, birth year and POBW. As in the previous chapter, POBW was used as a
measure of appropriateness of foetal growth instead of birthweight alone and was
grouped into three categories (low <85%, normal 85-114% or high ≥115%). Socio-
economic status was measured by the SEIFA index for relative disadvantage, derived
from low income, low educational attainment, high unemployment and jobs in unskilled
occupations.115 SEIFA scores for each collection district (grouping of approximately 200
dwellings) are categorised into quintiles based on national statistics corresponding to
the closest census year, either 1996 or 2001.115, 116
Analysis was restricted to births of 37-42 weeks gestation. Because of the differing risk
patterns between Aboriginal and non-Aboriginal children and the lack of association
between mode of delivery and ALRI hospitalisation in Aboriginal children (Chapter 6),
analyses were restricted to non-Aboriginal children. We used negative binomial
regression, using nbreg in STATA, to assess the relationship between mode of delivery
and both the number of hospitalisations for bronchiolitis before age 12 months and at
age 12-23 months and the number of hospitalisations for pneumonia in the same age
groups. We report incidence rate ratios (IRRs) and 95% confidence intervals (CIs) for
each risk factor from the fully adjusted models for each of the four outcomes. For the
number of bronchiolitis and pneumonia hospitalisations at age 12-23 months, we
included the number of bronchiolitis or pneumonia hospitalisations before age 12
months in the model as a continuous covariate. All data cleaning was conducted in
SPSS version 15.0 and analysis was conducted in Stata version 10.0.
7.4 Results
The population cohort consisted of 212,068 singleton live non-Aboriginal births of 37-42
weeks gestation in WA between 1996 and 2005. Information on mode of delivery was
available for all births. Overall, the proportion of elective caesarean deliveries was
85
15.8% (n = 33,421; Table 7.1); however this increased from 11.7% in 1996 to 20.6% in
2005. Over 90% (n = 30,353) of elective caesareans deliveries occurred between 37
and 39 weeks gestation. Of the 212,068 pregnancies, 51% were male, 4.8% had pre-
eclampsia recorded on the midwives form, 2.9% had gestational diabetes, 3.4%
recorded a breech presentation, 17.8% reported smoking during pregnancy and 8.4%
reported maternal asthma during pregnancy.
The proportion of children with one or more hospital admissions for bronchiolitis or
pneumonia at age <12 months and 12-23 months is shown in Table 7.1. A higher
proportion of infants delivered by elective caesarean than by other modes of delivery
were admitted to hospital at least once for bronchiolitis (Table 7.1). The total number of
admissions for bronchiolitis between 1996 and 2005 in children before age 12 months
was 6104 (5102 children had 1 admission, 377 children had 2 admissions, 65 children
had 3 admissions, 12 children had 4 admissions and 1 child had 5 admissions) and
958 (889 children had 1 admission, 30 children had 2 admissions and 3 children had 3
admissions) at age 12-23 months. The total number of admissions for pneumonia in
children before age 12 months between 1996 and 2005 was 948 (904 children had 1
admission and 22 children had 2 admissions) and 1425 (1,334 children had 1
admission, 37 had 2 admissions, 3 children had 3 admissions and 2 children had 4
admissions) at age 12-23 months. In total, from 1996-2005, bronchiolitis was
responsible for 21,336 hospital bed-days (18,882 days for admissions <12 months and
2454 days for admissions at age 12-23 months) and pneumonia was responsible for
10,168 hospital bed-days (4809 days <12 months and 5359 days 12-23 months).
In a univariate analysis, those delivered by elective caesarean were 17% (95% CI, 9-
25%) more likely to have multiple hospital admissions for bronchiolitis before age 12
months compared with those who had a spontaneous vaginal delivery. In the full
models adjusted for all other covariates, the IRR was slightly lower (IRR 1.11; 95% CI,
1.01-1.23; Table 7.2).
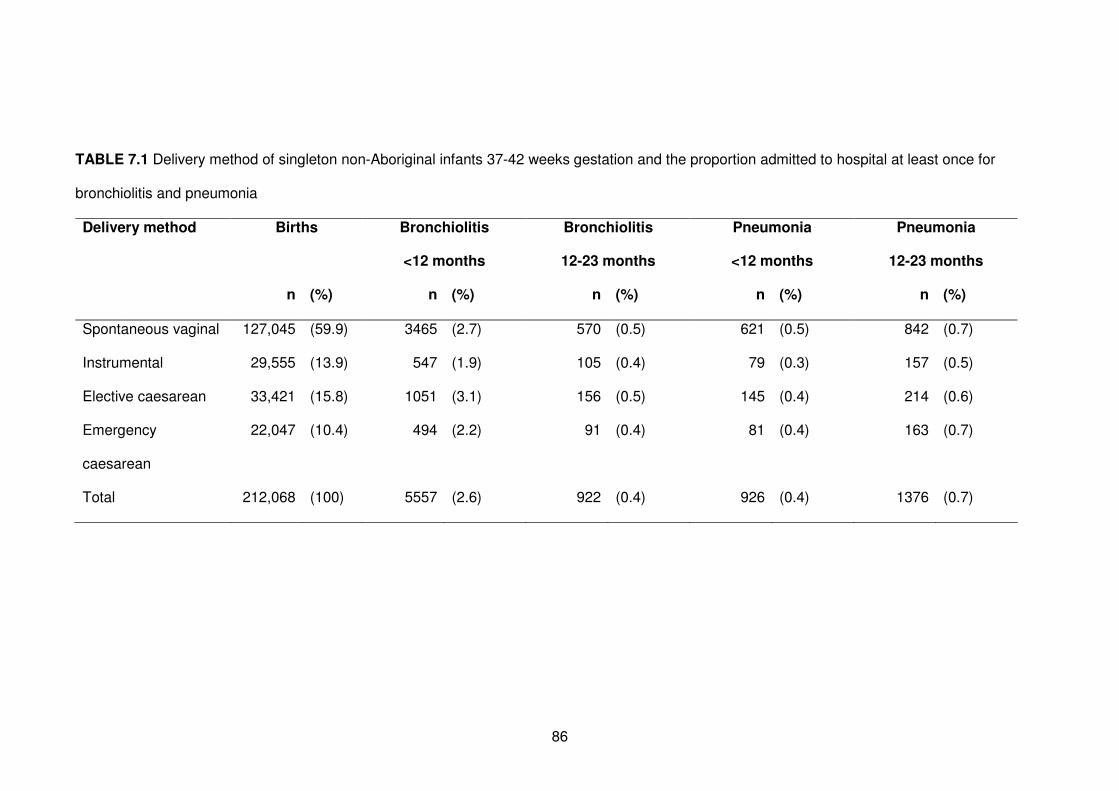
86
TABLE 7.1 Delivery method of singleton non-Aboriginal infants 37-42 weeks gestation and the proportion admitted to hospital at least once for
bronchiolitis and pneumonia
Delivery method Births Bronchiolitis
<12 months
Bronchiolitis
12-23 months
Pneumonia
<12 months
Pneumonia
12-23 months
n (%) n (%) n (%) n (%) n (%)
Spontaneous vaginal 127,045 (59.9) 3465 (2.7) 570 (0.5) 621 (0.5) 842 (0.7)
Instrumental 29,555 (13.9) 547 (1.9) 105 (0.4) 79 (0.3) 157 (0.5)
Elective caesarean 33,421 (15.8) 1051 (3.1) 156 (0.5) 145 (0.4) 214 (0.6)
Emergency
caesarean
22,047 (10.4) 494 (2.2) 91 (0.4) 81 (0.4) 163 (0.7)
Total 212,068 (100) 5557 (2.6) 922 (0.4) 926 (0.4) 1376 (0.7)
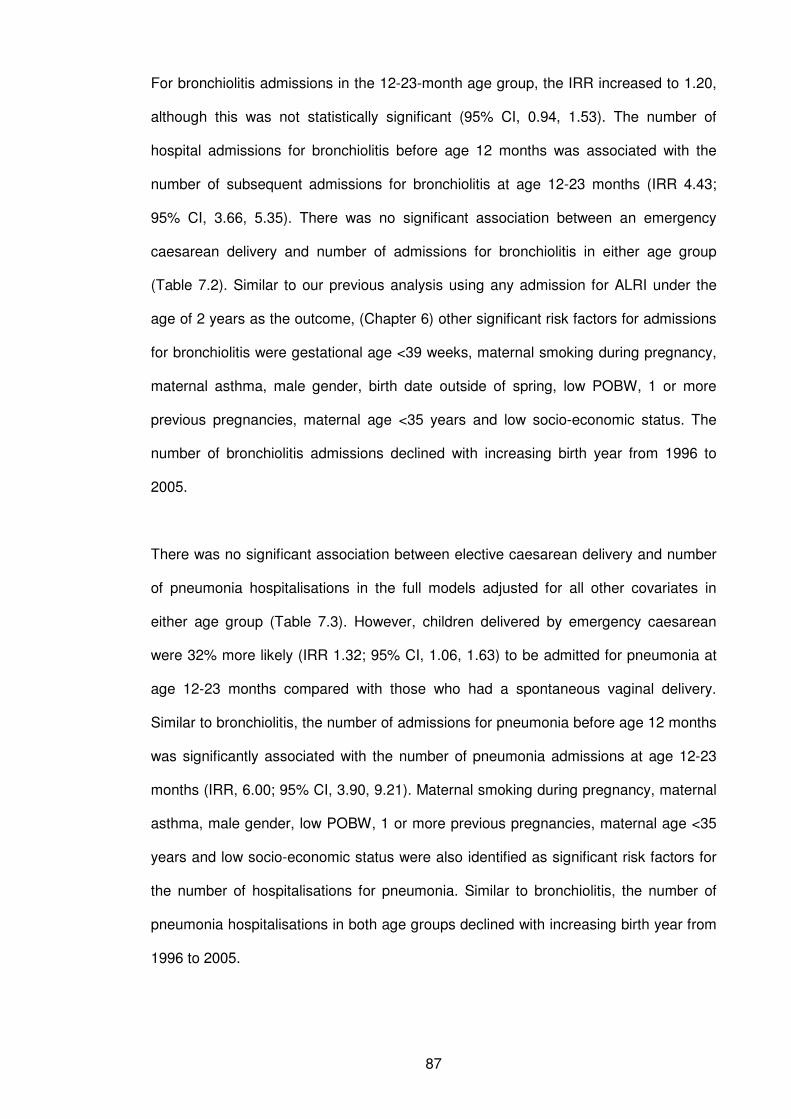
87
For bronchiolitis admissions in the 12-23-month age group, the IRR increased to 1.20,
although this was not statistically significant (95% CI, 0.94, 1.53). The number of
hospital admissions for bronchiolitis before age 12 months was associated with the
number of subsequent admissions for bronchiolitis at age 12-23 months (IRR 4.43;
95% CI, 3.66, 5.35). There was no significant association between an emergency
caesarean delivery and number of admissions for bronchiolitis in either age group
(Table 7.2). Similar to our previous analysis using any admission for ALRI under the
age of 2 years as the outcome, (Chapter 6) other significant risk factors for admissions
for bronchiolitis were gestational age <39 weeks, maternal smoking during pregnancy,
maternal asthma, male gender, birth date outside of spring, low POBW, 1 or more
previous pregnancies, maternal age <35 years and low socio-economic status. The
number of bronchiolitis admissions declined with increasing birth year from 1996 to
2005.
There was no significant association between elective caesarean delivery and number
of pneumonia hospitalisations in the full models adjusted for all other covariates in
either age group (Table 7.3). However, children delivered by emergency caesarean
were 32% more likely (IRR 1.32; 95% CI, 1.06, 1.63) to be admitted for pneumonia at
age 12-23 months compared with those who had a spontaneous vaginal delivery.
Similar to bronchiolitis, the number of admissions for pneumonia before age 12 months
was significantly associated with the number of pneumonia admissions at age 12-23
months (IRR, 6.00; 95% CI, 3.90, 9.21). Maternal smoking during pregnancy, maternal
asthma, male gender, low POBW, 1 or more previous pregnancies, maternal age <35
years and low socio-economic status were also identified as significant risk factors for
the number of hospitalisations for pneumonia. Similar to bronchiolitis, the number of
pneumonia hospitalisations in both age groups declined with increasing birth year from
1996 to 2005.
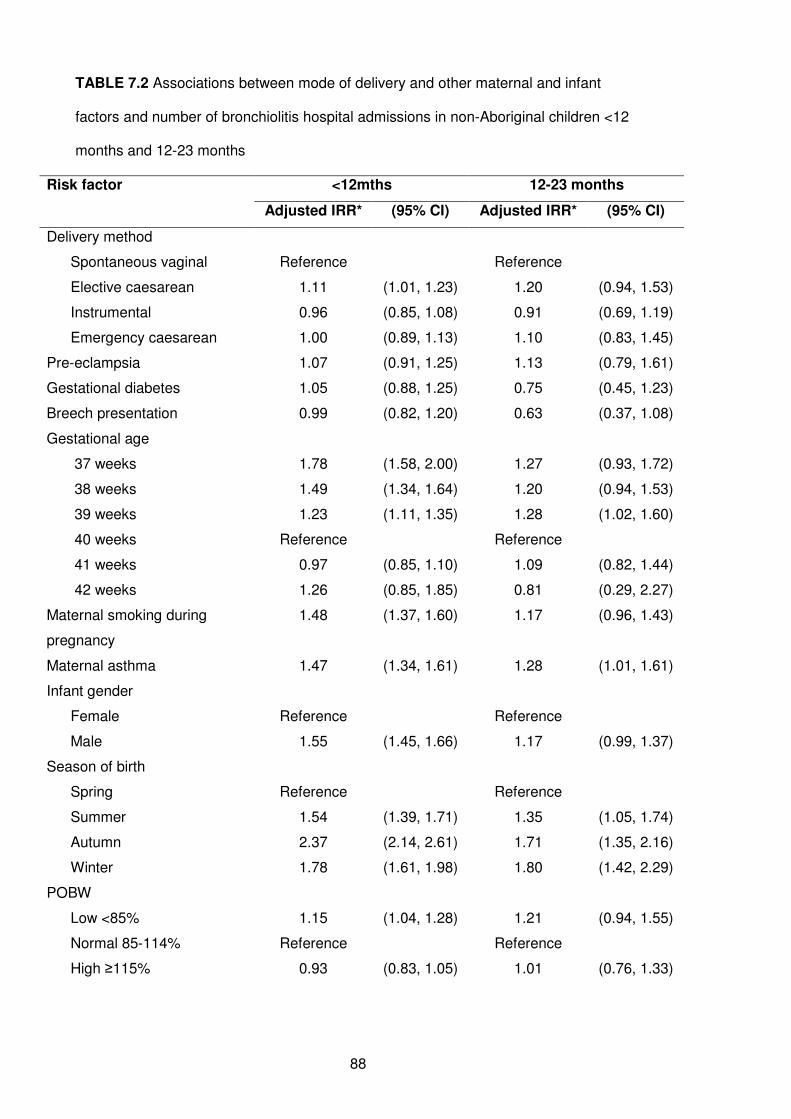
88
TABLE 7.2 Associations between mode of delivery and other maternal and infant
factors and number of bronchiolitis hospital admissions in non-Aboriginal children <12
months and 12-23 months
Risk factor <12mths 12-23 months
Adjusted IRR* (95% CI) Adjusted IRR* (95% CI)
Delivery method
Spontaneous vaginal Reference Reference
Elective caesarean 1.11 (1.01, 1.23) 1.20 (0.94, 1.53)
Instrumental 0.96 (0.85, 1.08) 0.91 (0.69, 1.19)
Emergency caesarean 1.00 (0.89, 1.13) 1.10 (0.83, 1.45)
Pre-eclampsia 1.07 (0.91, 1.25) 1.13 (0.79, 1.61)
Gestational diabetes 1.05 (0.88, 1.25) 0.75 (0.45, 1.23)
Breech presentation 0.99 (0.82, 1.20) 0.63 (0.37, 1.08)
Gestational age
37 weeks 1.78 (1.58, 2.00) 1.27 (0.93, 1.72)
38 weeks 1.49 (1.34, 1.64) 1.20 (0.94, 1.53)
39 weeks 1.23 (1.11, 1.35) 1.28 (1.02, 1.60)
40 weeks Reference Reference
41 weeks 0.97 (0.85, 1.10) 1.09 (0.82, 1.44)
42 weeks 1.26 (0.85, 1.85) 0.81 (0.29, 2.27)
Maternal smoking during
pregnancy
1.48 (1.37, 1.60) 1.17 (0.96, 1.43)
Maternal asthma 1.47 (1.34, 1.61) 1.28 (1.01, 1.61)
Infant gender
Female Reference Reference
Male 1.55 (1.45, 1.66) 1.17 (0.99, 1.37)
Season of birth
Spring Reference Reference
Summer 1.54 (1.39, 1.71) 1.35 (1.05, 1.74)
Autumn 2.37 (2.14, 2.61) 1.71 (1.35, 2.16)
Winter 1.78 (1.61, 1.98) 1.80 (1.42, 2.29)
POBW
Low <85% 1.15 (1.04, 1.28) 1.21 (0.94, 1.55)
Normal 85-114% Reference Reference
High ≥115% 0.93 (0.83, 1.05) 1.01 (0.76, 1.33)
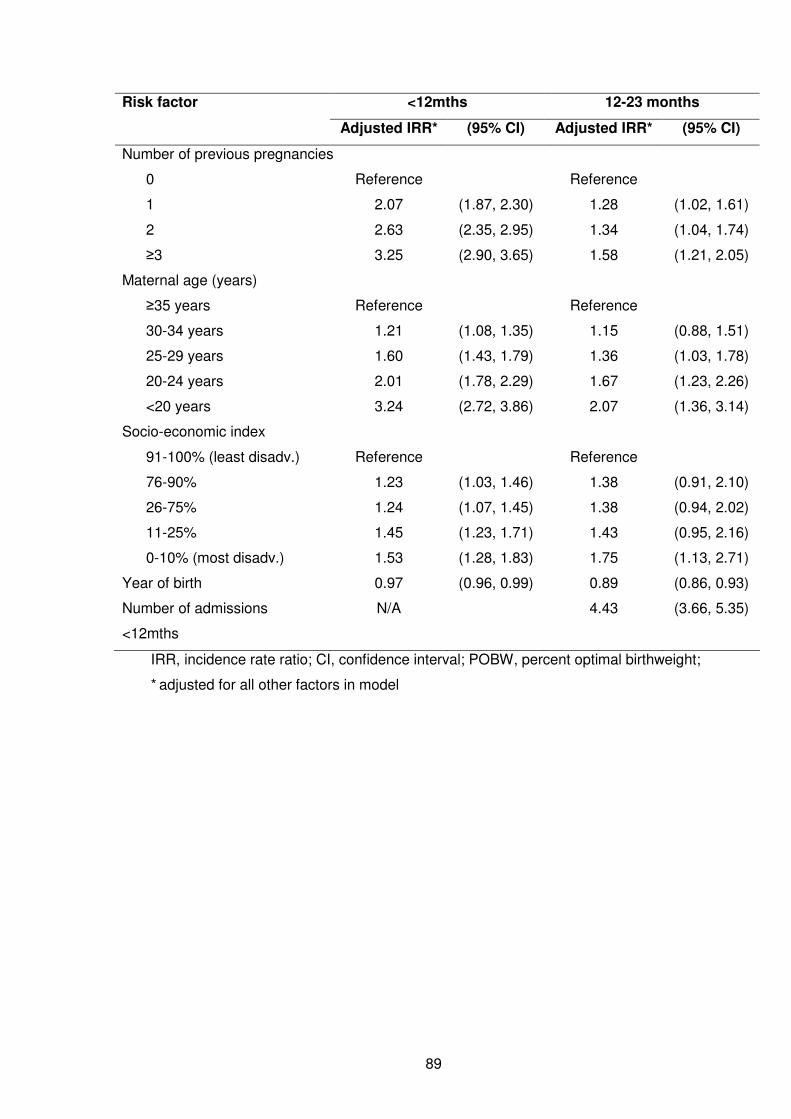
89
Risk factor <12mths 12-23 months
Adjusted IRR* (95% CI) Adjusted IRR* (95% CI)
Number of previous pregnancies
0 Reference Reference
1 2.07 (1.87, 2.30) 1.28 (1.02, 1.61)
2 2.63 (2.35, 2.95) 1.34 (1.04, 1.74)
≥3 3.25 (2.90, 3.65) 1.58 (1.21, 2.05)
Maternal age (years)
≥35 years Reference Reference
30-34 years 1.21 (1.08, 1.35) 1.15 (0.88, 1.51)
25-29 years 1.60 (1.43, 1.79) 1.36 (1.03, 1.78)
20-24 years 2.01 (1.78, 2.29) 1.67 (1.23, 2.26)
<20 years 3.24 (2.72, 3.86) 2.07 (1.36, 3.14)
Socio-economic index
91-100% (least disadv.) Reference Reference
76-90% 1.23 (1.03, 1.46) 1.38 (0.91, 2.10)
26-75% 1.24 (1.07, 1.45) 1.38 (0.94, 2.02)
11-25% 1.45 (1.23, 1.71) 1.43 (0.95, 2.16)
0-10% (most disadv.) 1.53 (1.28, 1.83) 1.75 (1.13, 2.71)
Year of birth 0.97 (0.96, 0.99) 0.89 (0.86, 0.93)
Number of admissions
<12mths
N/A 4.43 (3.66, 5.35)
IRR, incidence rate ratio; CI, confidence interval; POBW, percent optimal birthweight;
* adjusted for all other factors in model
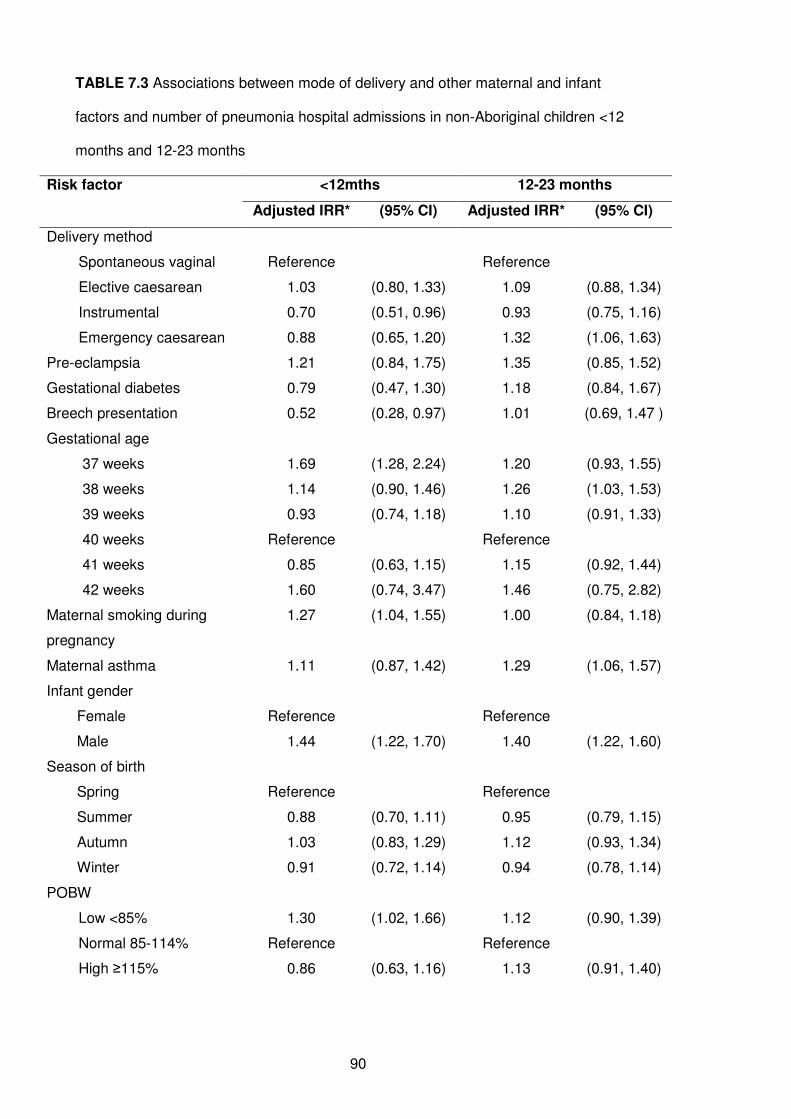
90
TABLE 7.3 Associations between mode of delivery and other maternal and infant
factors and number of pneumonia hospital admissions in non-Aboriginal children <12
months and 12-23 months
Risk factor <12mths 12-23 months
Adjusted IRR* (95% CI) Adjusted IRR* (95% CI)
Delivery method
Spontaneous vaginal Reference Reference
Elective caesarean 1.03 (0.80, 1.33) 1.09 (0.88, 1.34)
Instrumental 0.70 (0.51, 0.96) 0.93 (0.75, 1.16)
Emergency caesarean 0.88 (0.65, 1.20) 1.32 (1.06, 1.63)
Pre-eclampsia 1.21 (0.84, 1.75) 1.35 (0.85, 1.52)
Gestational diabetes 0.79 (0.47, 1.30) 1.18 (0.84, 1.67)
Breech presentation 0.52 (0.28, 0.97) 1.01 (0.69, 1.47 )
Gestational age
37 weeks 1.69 (1.28, 2.24) 1.20 (0.93, 1.55)
38 weeks 1.14 (0.90, 1.46) 1.26 (1.03, 1.53)
39 weeks 0.93 (0.74, 1.18) 1.10 (0.91, 1.33)
40 weeks Reference Reference
41 weeks 0.85 (0.63, 1.15) 1.15 (0.92, 1.44)
42 weeks 1.60 (0.74, 3.47) 1.46 (0.75, 2.82)
Maternal smoking during
pregnancy
1.27 (1.04, 1.55) 1.00 (0.84, 1.18)
Maternal asthma 1.11 (0.87, 1.42) 1.29 (1.06, 1.57)
Infant gender
Female Reference Reference
Male 1.44 (1.22, 1.70) 1.40 (1.22, 1.60)
Season of birth
Spring Reference Reference
Summer 0.88 (0.70, 1.11) 0.95 (0.79, 1.15)
Autumn 1.03 (0.83, 1.29) 1.12 (0.93, 1.34)
Winter 0.91 (0.72, 1.14) 0.94 (0.78, 1.14)
POBW
Low <85% 1.30 (1.02, 1.66) 1.12 (0.90, 1.39)
Normal 85-114% Reference Reference
High ≥115% 0.86 (0.63, 1.16) 1.13 (0.91, 1.40)
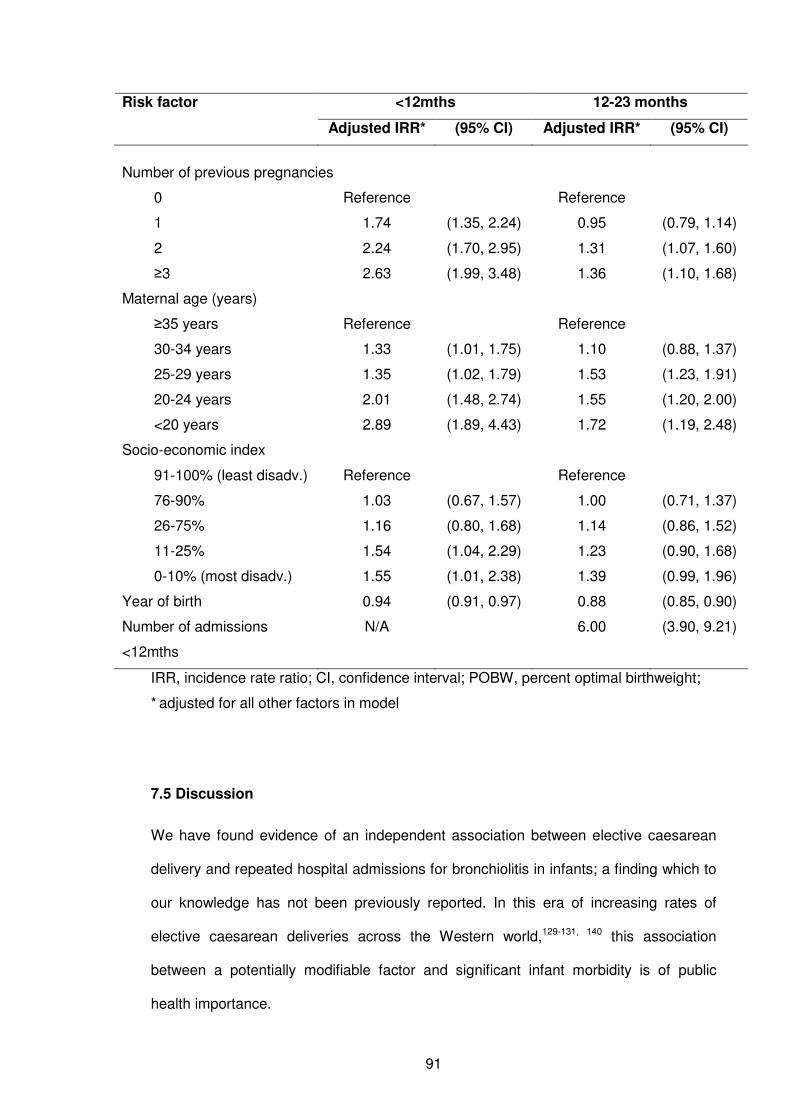
91
Risk factor <12mths 12-23 months
Adjusted IRR* (95% CI) Adjusted IRR* (95% CI)
Number of previous pregnancies
0 Reference Reference
1 1.74 (1.35, 2.24) 0.95 (0.79, 1.14)
2 2.24 (1.70, 2.95) 1.31 (1.07, 1.60)
≥3 2.63 (1.99, 3.48) 1.36 (1.10, 1.68)
Maternal age (years)
≥35 years Reference Reference
30-34 years 1.33 (1.01, 1.75) 1.10 (0.88, 1.37)
25-29 years 1.35 (1.02, 1.79) 1.53 (1.23, 1.91)
20-24 years 2.01 (1.48, 2.74) 1.55 (1.20, 2.00)
<20 years 2.89 (1.89, 4.43) 1.72 (1.19, 2.48)
Socio-economic index
91-100% (least disadv.) Reference Reference
76-90% 1.03 (0.67, 1.57) 1.00 (0.71, 1.37)
26-75% 1.16 (0.80, 1.68) 1.14 (0.86, 1.52)
11-25% 1.54 (1.04, 2.29) 1.23 (0.90, 1.68)
0-10% (most disadv.) 1.55 (1.01, 2.38) 1.39 (0.99, 1.96)
Year of birth 0.94 (0.91, 0.97) 0.88 (0.85, 0.90)
Number of admissions
<12mths
N/A 6.00 (3.90, 9.21)
IRR, incidence rate ratio; CI, confidence interval; POBW, percent optimal birthweight;
* adjusted for all other factors in model
7.5 Discussion
We have found evidence of an independent association between elective caesarean
delivery and repeated hospital admissions for bronchiolitis in infants; a finding which to
our knowledge has not been previously reported. In this era of increasing rates of
elective caesarean deliveries across the Western world,129-131, 140 this association
between a potentially modifiable factor and significant infant morbidity is of public
health importance.
92
There have been reported associations between caesarean delivery and subsequent
asthma in childhood and adulthood.136-138 There are also now numerous reports linking
early viral infections such as bronchiolitis and subsequent asthma in children.4, 5, 141 The
association we report here between elective caesarean and recurrent bronchiolitis
follows on from these previous findings and biologically plausible explanations are now
needed. The essential difference between elective caesarean deliveries and other
modes of delivery is the absence of labour.78 The act of labour promotes the production
of various cytokines and activates the infants’ and mothers’ immune system.142, 143
Therefore the cytokine environment differs in a newborn delivered by elective
caesarean compared with other delivery methods as shown by the detection of lower
levels of interleukin-6 and interleukin-10 in cord-blood of those delivered by elective
caesarean than in those with normal vaginal delivery.144 In addition, a clear linear
relationship between the concentration of interleukin-6 in cord blood with delivery
method has been shown, with elective caesareans having the lowest levels and
emergency caesareans having the highest levels.144 The differing cytokine environment
with elective caesarean delivery may therefore lead to an increased susceptibility to
respiratory infections in infancy. It could be that elective caesarean deliveries lead to a
polarisation towards Th2 immunity in the newborn and/or impaired development of
antiviral immunity and hence a higher susceptibility to recurrent symptomatic viral
illness requiring hospitalisation in infancy. Furthermore, lack of exposure to maternal
vaginal faecal flora through elective caesarean section145 might also reduce exposure
to microbial stimuli which are essential for driving postnatal maturation of immune
functions (the hygiene hypothesis) and thus increase susceptibility of viral illness.
We did not see an association between elective caesarean delivery and repeated
pneumonia hospitalisations. While bronchiolitis is most often caused by respiratory
syncytial virus, pneumonia has a varied aetiology with an increased frequency of
bacterial infection,85 and is a more severe, although less common, illness than
bronchiolitis. Therefore it is plausible to have different patterns of risk or mechanisms of
93
susceptibility for the two respiratory conditions. We did see an association with
emergency caesarean delivery and number of pneumonia hospitalisations at age 12-23
months which could reflect diagnostic shift in hospital coding for viral ALRI in older
children or different immunological mechanisms.
We do not believe that the association we have seen with bronchiolitis and elective
caesarean relates to the treatment-seeking behaviour of women, in that those who are
more likely to opt for an elective caesarean would also be more likely to seek treatment
for their child. This would be plausible if we were investigating emergency department
presentations or general practitioner visits. However an admission to hospital, which
we have used in this study, should reflect disease severity as opposed to treatment-
seeking behaviour.
We have used a population-based record linkage system which allows us to investigate
associations at a population level with adequate numbers and power for meaningful
statistical analyses, which is a strength of this analysis. These linked longitudinal data
will allow further studies to investigate risk factors in children who are hospitalised for
ALRI and are then hospitalised for asthma in subsequent years in order to understand
the relationship between mode of delivery, bronchiolitis and asthma. In addition, coding
of data contained in the WADLS, such as hospital diagnosis coding is homogeneous
throughout the state, thereby reducing any bias in our study. Using the Midwives’
Notification System, we have been able to distinguish between elective caesarean,
emergency caesarean, instrumental and spontaneous vaginal deliveries, where other
studies have not.132
However, our study does have some limitations. We were unable to determine if the
elective caesarean was purely by maternal request or whether the physician
recommended an elective caesarean on medical advice. To account for this, we have
restricted our analysis to singleton births, as multiple births are increasingly likely to be
94
delivered via caesarean section.146 In our analysis we also adjusted for pregnancy
factors such as pre-eclampsia and breech presentation that may lead the physician to
recommend an elective caesarean delivery over a vaginal delivery,147, 148 and we also
adjusted for various socio-economic factors such as maternal smoking and the national
socio-economic index that may influence the physician or the mother‘s decision to have
an elective caesarean. There was minimal change in the IRR between the unadjusted
and adjusted analyses; therefore we believe there is little residual confounding in the
relationship between elective caesarean and bronchiolitis.
Caesarean delivery is a major abdominal surgical operation and can present a greater
risk of maternal morbidity compared with spontaneous vaginal delivery.149 Maternal
request and a mother’s right to choose her delivery method needs to be respected, but
also viewed in terms of the unnecessary use of health care funds.150 A hypothetical
model using population-based data has also demonstrated that as caesarean section
rates rise, so too will the cost of intrapartum and postpartum care.151 We have now
highlighted an association between elective caesarean deliveries and number of
hospitalisations for bronchiolitis in infants which adds to the body of evidence
surrounding the different immunological environment of elective caesarean delivery
and the relationship between early viral illness and subsequent asthma. Physicians and
expectant parents need to be made aware of this additional risk of elective caesareans
and associated infant morbidity to aid in deciding mode of delivery.
Further analyses are planned to investigate the causal pathways to hospitalisations for
recurrent bronchiolitis and subsequent risk of asthma using linked data in WA. In
addition, qualitative studies are now needed to understand women’s and physicians’
views on elective caesarean delivery, and laboratory studies should be undertaken to
test the hypothesis that elective caesareans or delivery in absence of labour results in
impaired immunity in the newborn.
95
CHAPTER 8
Aetiology of ALRI Part I:
Seasonality of respiratory viral identification varies with
age and Aboriginality in metropolitan Western Australia
96
8.1 Preamble
This chapter is the first of a series of chapters investigating the aetiology of ALRI. This
particular chapter reports on the age and seasonal distribution of respiratory viruses
routinely identified in Aboriginal and non-Aboriginal children aged less than 17 years of
metropolitan Perth and how the seasonality differs between age groups and according
to Aboriginality. This addresses objective 2 of the thesis. Acquisition, linkage and
analysis of these laboratory data were used as a pilot study to test the feasibility of
using routinely collected laboratory data to answer specific research objectives.
Lessons and skills learnt associated with this study were relevant and were applied to
the acquisition and cleaning of data in Chapter 10.
This chapter was published in the Pediatric Infectious Disease Journal in July 2009. A
copy of the published paper is in Appendix 3. Details regarding the study setting and
methodology already explained in Chapters 2 and 4 have been removed here to
minimise duplication. Tables and Figures that were provided as Supplemental Digital
Content for the published paper have been included in this chapter.
8.2 Introduction
Viral respiratory infections are a major cause of morbidity worldwide, particularly in
children. RSV, influenza viruses A and B, PIV types 1, 2 and 3 and adenovirus are the
viruses most commonly associated with respiratory infections.26, 152, 153 More recently,
rhinovirus,44 hMPV, coronavirus and bocavirus37, 154, 155 have also been implicated. An
understanding of the local epidemiology, including temporal and seasonal
characteristics of these viruses, is crucial for identifying target groups and appropriate
timing of public health preventive measures such as vaccination.156 An understanding
of seasonality can also enhance the accuracy of surveillance systems and improve our
ability to predict epidemics.50
97
Seasonal characteristics of respiratory viruses relate to temperature and relative
humidity.51, 52 In temperate climates such as that in most of Australia, peaks in RSV and
influenza virus identifications occur in autumn (March to May) or winter (June to
August) when temperatures are lower.52, 157-159 In tropical and subtropical climates,
seasonal patterns for RSV and influenza viruses are less clearly defined156 and peaks
in influenza viruses have been observed in spring and summer.153 Seasonality of RSV
may vary even between adjacent geographic regions, suggesting that characteristics of
the community and not just climatic characteristics, might affect the spread of
infection156 and hence seasonality.
Seasonal patterns are less clear for other viruses. In the northern hemisphere, peaks in
PIV occur in winter160 and autumn (PIV1) or in spring (PIV3),52, 161 while adenovirus
shows no apparent seasonal trend.52
The variability in seasonality of respiratory viruses by age and gender has not been
thoroughly investigated, nor has the seasonality of respiratory viruses been compared
between Aboriginal and non-Aboriginal children. A high identification rate of respiratory
viruses in Aboriginal children has previously been shown in central Australia,36 and
there is a high burden of respiratory infections in Aboriginal children of WA.7 We aimed
to show how identification rates of respiratory viruses vary with season, age, gender
and Aboriginality and how seasonality varies with age and Aboriginality.
8.3 Methods
8.3.1 Setting and data extraction
Data were extracted for all nasopharyngeal or throat specimens collected for
respiratory viral testing between May 1997 and December 2005 through routine
microbiology laboratory services at Princess Margaret Hospital for Children (PMH),
98
WA’s only dedicated paediatric hospital. The specimens were collected almost entirely
from children residing in metropolitan WA. The laboratory database provided
information on specimen types, diagnostic methods, virology result, patient name, date
of birth and gender. These identified data were linked to the hospital’s demographic
database to obtain data on Aboriginality, which was available for 95% of specimens.
All data were then de-identified.
8.3.2 Microbiologic investigation
Nasopharyngeal aspirates were tested for viral pathogens by direct
immunofluorescence and cell culture using standard laboratory methods.162
Monoclonal antibodies specific for RSV, influenza viruses A and B, PIV1, PIV2, PIV3
and adenoviruses were used to identify these viruses. No data were available on
respiratory viruses identified through molecular techniques (rhinoviruses or hMPV)
which were not carried out routinely during the study period.
8.3.3 Statistical analysis
Data cleaning was completed in FileMaker Pro version 8.0, Perl version 5.8.8 and
SPSS version 15.0. Data analysis was conducted in STATA version 10.0. Statistical
significance was set at the p < 0.05 level. The viral identification rate was defined as
the proportion of specimens positive for a particular virus. Median age at time of
identification was compared between Aboriginal and non-Aboriginal children using the
nonparametric equality-of-medians test. Chi-squared tests were used to compare
proportions between groups of interest. Binomial regression was used to determine
whether seasonality of viruses varied according to Aboriginality or age, using binreg in
Stata. Using the method described in detail by Stolwijk, Straatman and Zielhuis (but
with binomial regression instead of logistic regression),163 harmonic analysis was used
to control for seasonality by inclusion of the functions:
α sin(2πkt/12) + β cos(2πkt/12)
99
for k = 0.5, 1, 2, 3, 4, 5, 6 and t = 1 to 12 (months in a year). This method allows for
any type of varying seasonal pattern, with each pair of terms adding increasing
complexity to the pattern. Using forward stepwise binomial regression, pairs of sine
and cosine terms for increasing values of k were added to the models until no
significant improvement was made. Year of specimen collection was added to the
model to control for yearly fluctuations in seasonality as well as any overall trend. To
determine whether seasonality varied by Aboriginality we added interaction terms
between Aboriginal status and the included sine and cosine terms in the model. The
linear predictors for these regression models were then calculated and plotted on a log
scale for the age group that contained the median age for identification of a particular
virus and the year for which identification rates were the highest so as to capture the
majority of positive viral identifications (i.e. including fixed values for the other terms in
the binomial model). Interaction terms for age were added in a similar fashion to
determine whether seasonal patterns of individual viruses varied with age. We used
the likelihood ratio test to determine whether the interaction model including the
interaction terms was a better fit than the base model adjusting for Aboriginality, age,
year of specimen collection and no interaction terms. Results of these likelihood ratio
tests are presented testing the null hypothesis that the interaction terms do not improve
the model.
8.4 Results
8.4.1 Specimens collected
Between 1997 and 2005, 32,741 nasopharyngeal or throat specimens were collected
from children aged <18 years. Approximately half of these specimens (52.6%) were in
infants aged <12 months, 36.3% in children aged 1 to 4 years and 11.2% in those aged
5 years or more (Table 8.1). In Aboriginal children, a higher proportion of specimens
were collected before age 12 months than in non-Aboriginal children (χ2=400.8, d.f.=7,
p <0.001, Table 8.1). More specimens were collected from boys (57.3%) than girls
100
(42.7%). Most specimens (79%) were collected from children attending the paediatric
hospital (where they are collected on admission for infection control and diagnostic
purposes), a further 10% were from private laboratories or referred from general
practitioners and the remaining 11% were from non-paediatric hospitals in Perth.
8.4.2 Respiratory viruses identified
One or more viruses were identified in 10,571 specimens, giving an overall
identification rate of 32.3%. The overall viral identification rate was highest in the 3-5-
month age group (37%) and generally did not differ between Aboriginal and non-
Aboriginal children except for those aged 10-17 years when the identification rate was
22% for non-Aboriginal children and 8% for Aboriginal children (χ2=5.6, d.f.=1, p =0.02,
Table 8.1). The viral identification rate did not differ between boys (32.8%) and girls
(32.3%). The number of virus-positive identifications remained constant from year to
year, although the number of specimens collected annually increased and therefore the
viral identification rate declined from 37.6% in 1998 to 27.2% in 2005 (χ2=365.7, d.f.=8,
p<0.001).
RSV accounted for more than half of all viruses identified (56.0%), followed by
influenza viruses A and B (18.2%), PIV1-3 (17.3%) and adenovirus (6.2%) (Table 8.2).
Aboriginal and non-Aboriginal children had similar rates for all viruses. More than one
virus was identified in 127 specimens (1.2% of all specimens), RSV being identified in
86 (68%) of them.
Generally, the median age of viral identification was lower in Aboriginal children than in
non-Aboriginal children but particularly for PIV1 (p = 0.03), influenza virus A, PIV3 and
adenovirus (all p <0.0005) (Table 8.2). The greatest difference was for influenza virus
B: the median age at time of identification was 11 months for Aboriginal children but 50
months for non-Aboriginal children (p = 0.002, Table 8.2). There was no difference in
101
the median age for RSV between Aboriginal and non-Aboriginal children (p = 0.23).
The age distribution also varied among viruses. Identification rates for RSV peaked at
27% in the 1-2-month age group (Figure 8.1), while identification rates for influenza
viruses A and B were lowest in the 1-2-month age group (1.4%) and increased steadily
to 15.3% in those aged 10 years and above (Figure 8.1). Identification rates for PIV1,
PIV2, PIV3 and adenovirus peaked in the 6-23-month age group (Figure 8.1).
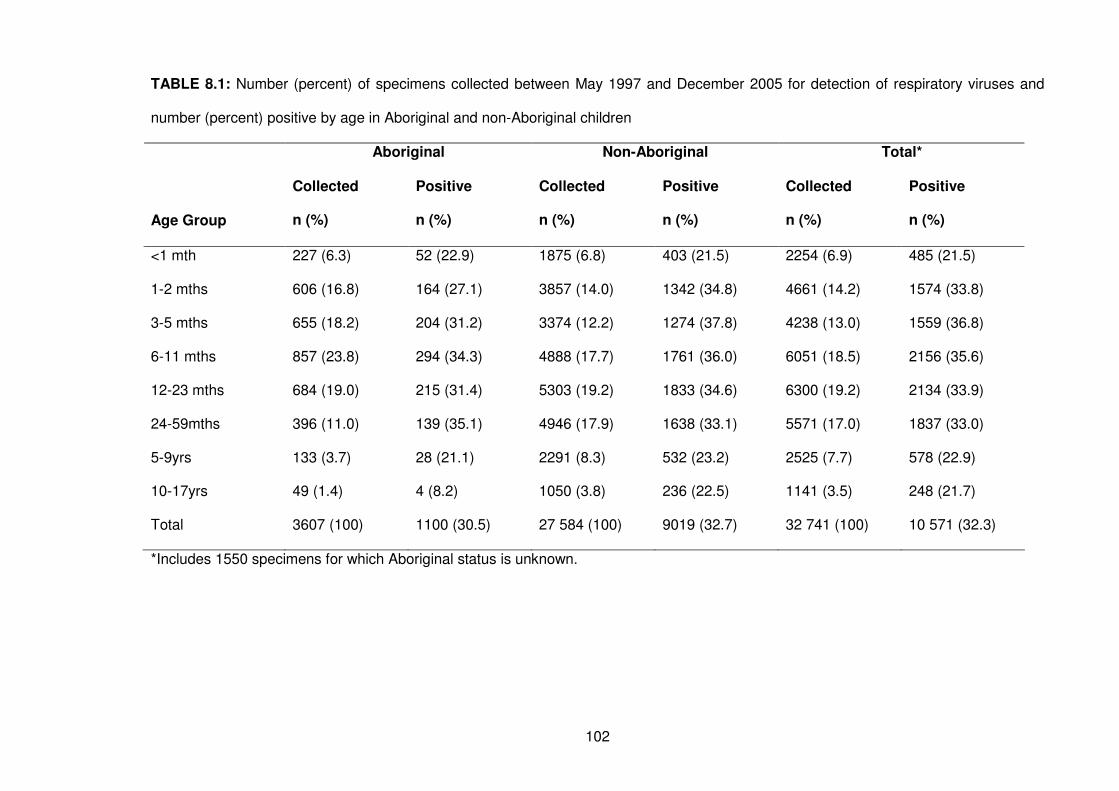
102
TABLE 8.1: Number (percent) of specimens collected between May 1997 and December 2005 for detection of respiratory viruses and
number (percent) positive by age in Aboriginal and non-Aboriginal children
Aboriginal Non-Aboriginal Total*
Age Group
Collected
n (%)
Positive
n (%)
Collected
n (%)
Positive
n (%)
Collected
n (%)
Positive
n (%)
<1 mth 227 (6.3) 52 (22.9) 1875 (6.8) 403 (21.5) 2254 (6.9) 485 (21.5)
1-2 mths 606 (16.8) 164 (27.1) 3857 (14.0) 1342 (34.8) 4661 (14.2) 1574 (33.8)
3-5 mths 655 (18.2) 204 (31.2) 3374 (12.2) 1274 (37.8) 4238 (13.0) 1559 (36.8)
6-11 mths 857 (23.8) 294 (34.3) 4888 (17.7) 1761 (36.0) 6051 (18.5) 2156 (35.6)
12-23 mths 684 (19.0) 215 (31.4) 5303 (19.2) 1833 (34.6) 6300 (19.2) 2134 (33.9)
24-59mths 396 (11.0) 139 (35.1) 4946 (17.9) 1638 (33.1) 5571 (17.0) 1837 (33.0)
5-9yrs 133 (3.7) 28 (21.1) 2291 (8.3) 532 (23.2) 2525 (7.7) 578 (22.9)
10-17yrs 49 (1.4) 4 (8.2) 1050 (3.8) 236 (22.5) 1141 (3.5) 248 (21.7)
Total 3607 (100) 1100 (30.5) 27 584 (100) 9019 (32.7) 32 741 (100) 10 571 (32.3)
*Includes 1550 specimens for which Aboriginal status is unknown.
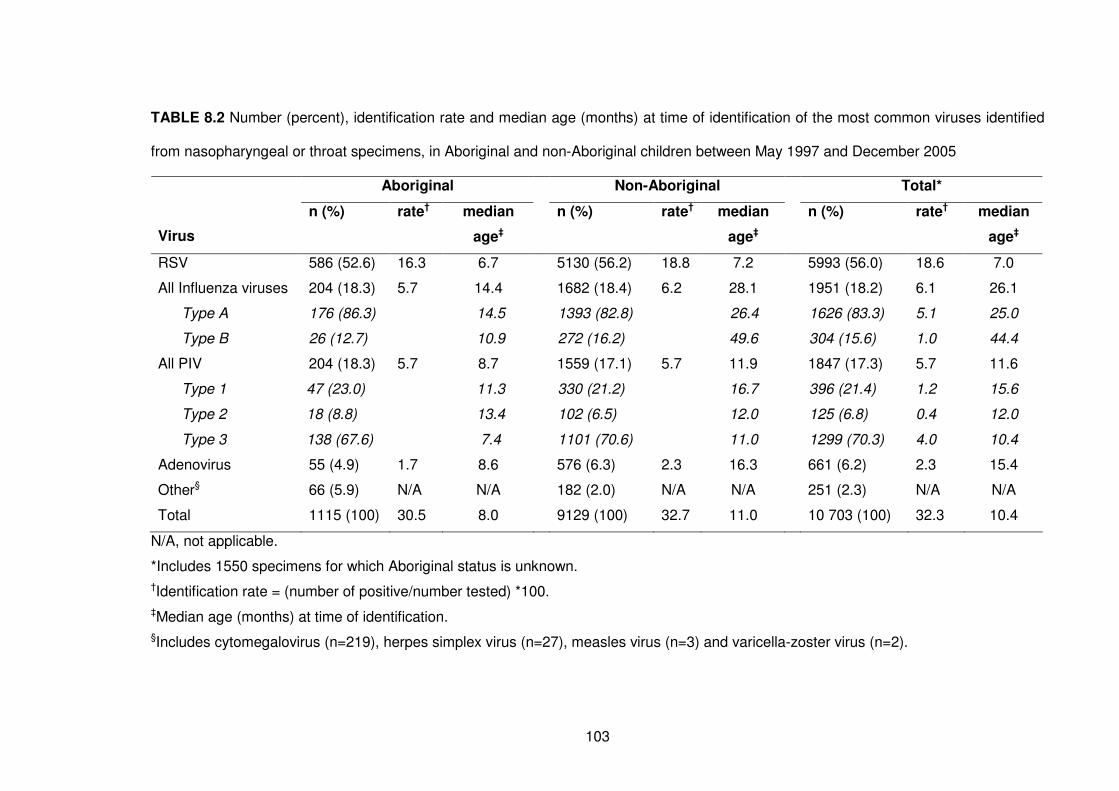
103
TABLE 8.2 Number (percent), identification rate and median age (months) at time of identification of the most common viruses identified
from nasopharyngeal or throat specimens, in Aboriginal and non-Aboriginal children between May 1997 and December 2005
Aboriginal Non-Aboriginal Total*
Virus
n (%) rate† median
age‡
n (%) rate† median
age‡
n (%) rate† median
age‡
RSV 586 (52.6) 16.3 6.7 5130 (56.2) 18.8 7.2 5993 (56.0) 18.6 7.0
All Influenza viruses 204 (18.3) 5.7 14.4 1682 (18.4) 6.2 28.1 1951 (18.2) 6.1 26.1
Type A 176 (86.3) 14.5 1393 (82.8) 26.4 1626 (83.3) 5.1 25.0
Type B 26 (12.7) 10.9 272 (16.2) 49.6 304 (15.6) 1.0 44.4
All PIV 204 (18.3) 5.7 8.7 1559 (17.1) 5.7 11.9 1847 (17.3) 5.7 11.6
Type 1 47 (23.0) 11.3 330 (21.2) 16.7 396 (21.4) 1.2 15.6
Type 2 18 (8.8) 13.4 102 (6.5) 12.0 125 (6.8) 0.4 12.0
Type 3 138 (67.6) 7.4 1101 (70.6) 11.0 1299 (70.3) 4.0 10.4
Adenovirus 55 (4.9) 1.7 8.6 576 (6.3) 2.3 16.3 661 (6.2) 2.3 15.4
Other§ 66 (5.9) N/A N/A 182 (2.0) N/A N/A 251 (2.3) N/A N/A
Total 1115 (100) 30.5 8.0 9129 (100) 32.7 11.0 10 703 (100) 32.3 10.4
N/A, not applicable.
*Includes 1550 specimens for which Aboriginal status is unknown.
†Identification rate = (number of positive/number tested) *100.
‡Median age (months) at time of identification.
§Includes cytomegalovirus (n=219), herpes simplex virus (n=27), measles virus (n=3) and varicella-zoster virus (n=2).
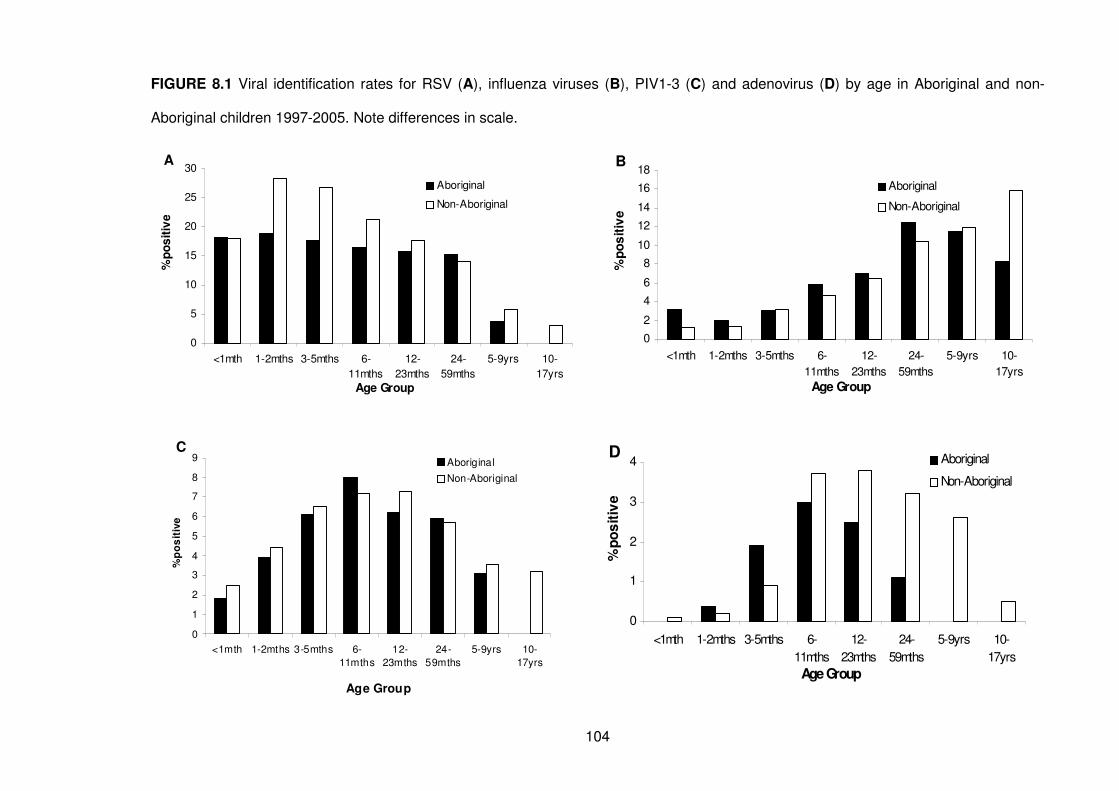
104
FIGURE 8.1 Viral identification rates for RSV (A), influenza viruses (B), PIV1-3 (C) and adenovirus (D) by age in Aboriginal and non-
Aboriginal children 1997-2005. Note differences in scale.
A
0
5
10
15
20
25
30
<1mth 1-2mths 3-5mths 6-
11mths
12-
23mths
24-
59mths
5-9yrs 10-
17yrs
Age Group
%p
os
itiv
e
Aboriginal
Non-Aboriginal
B
0
2
4
6
8
10
12
14
16
18
<1mth 1-2mths 3-5mths 6-
11mths
12-
23mths
24-
59mths
5-9yrs 10-
17yrs
Age Group
%p
os
itiv
e
Aboriginal
Non-Aboriginal
D
0
1
2
3
4
<1mth 1-2mths 3-5mths 6-
11mths
12-
23mths
24-
59mths
5-9yrs 10-
17yrs
Age Group
%p
os
itiv
e
Aboriginal
Non-Aboriginal
C
0
1
2
3
4
5
6
7
8
9
<1mth 1-2mths 3-5mths 6-
11mths
12-
23mths
24-
59mths
5-9yrs 10-
17yrs
Age Group
%p
os
itiv
e
Aboriginal
Non-Aboriginal
105
8.4.3 Seasonality and temporal trends
RSV, influenza viruses A and B, PIV1, PIV3 and adenovirus showed distinct temporal
patterns and these viruses displayed considerable but differing seasonal components
before and after adjusting for Aboriginality, age and year of specimen collection (Table
8.3).
8.4.3.1 Respiratory syncytial virus
The RSV identification rate showed consistent biennial peaks in even-numbered years
with a decline from 23% in 2000 to 17% in 2004 (Figure 8.2). RSV demonstrated clear
seasonality with a single peak in July, the middle of winter (eg. maximum identification
rate in July was 45% for Aboriginal children aged 6-11 months and 54% for non-
Aboriginal children of the same age, Figure 8.3A). The model did not improve with the
addition of interaction terms between Aboriginality and the seasonal components (p =
0.25). However, the model was improved with the addition of age interaction terms (p
<0.0005). For both Aboriginal and non-Aboriginal children the seasonal peak for RSV
in children aged 12 months and older was earlier (June) than for children aged <12
months who showed a seasonal peak in July (Figure 8.4).
8.4.3.2 Influenza viruses
Identification rates of influenza viruses A and B combined declined from 1997 to 2001,
then showed a large peak in 2003 (identification rate of 10%, Figure 8.2). Temporal
patterns were similar for influenza virus A and influenza virus B. The seasonal model
for influenza viruses improved with the addition of Aboriginality interaction terms (p
<0.001). For non-Aboriginal children, there was a single peak in influenza virus
identifications in late winter (eg. 31% in August for children aged 24-59 months), but in
Aboriginal children there was a bimodal seasonal pattern: one peak in autumn and one
peak in spring (eg. 16% in May and 25% in September for children aged 12-23 months,
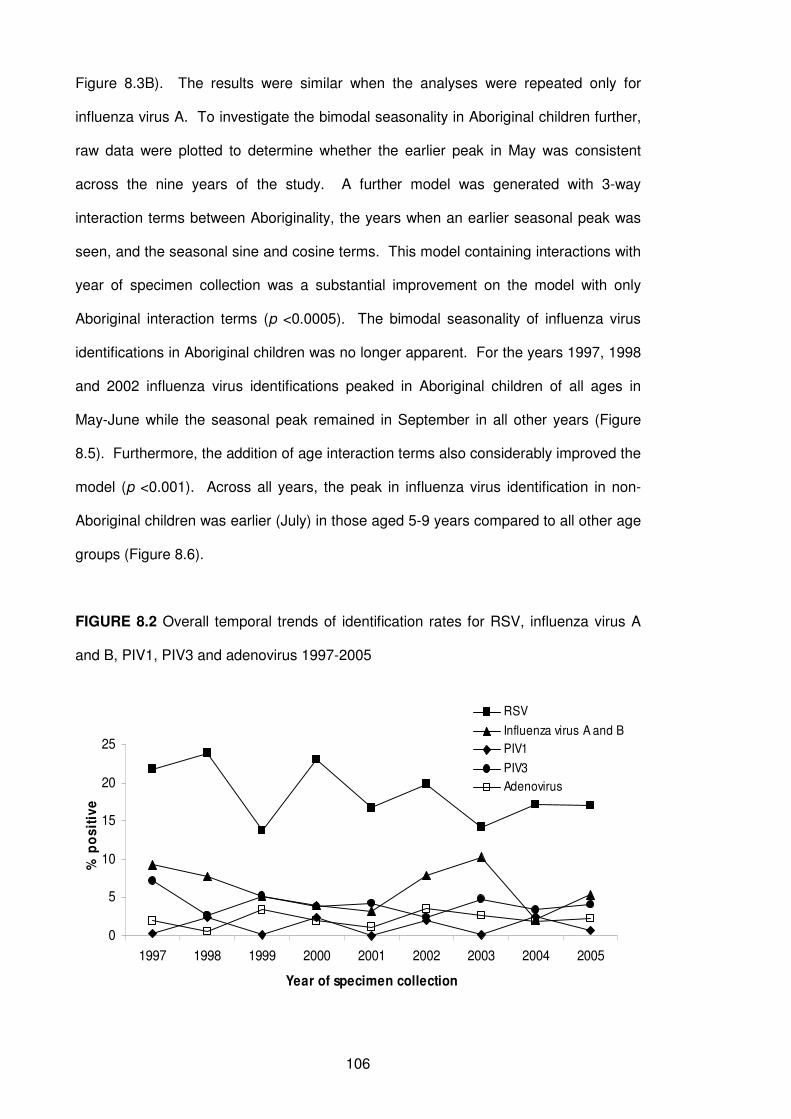
106
Figure 8.3B). The results were similar when the analyses were repeated only for
influenza virus A. To investigate the bimodal seasonality in Aboriginal children further,
raw data were plotted to determine whether the earlier peak in May was consistent
across the nine years of the study. A further model was generated with 3-way
interaction terms between Aboriginality, the years when an earlier seasonal peak was
seen, and the seasonal sine and cosine terms. This model containing interactions with
year of specimen collection was a substantial improvement on the model with only
Aboriginal interaction terms (p <0.0005). The bimodal seasonality of influenza virus
identifications in Aboriginal children was no longer apparent. For the years 1997, 1998
and 2002 influenza virus identifications peaked in Aboriginal children of all ages in
May-June while the seasonal peak remained in September in all other years (Figure
8.5). Furthermore, the addition of age interaction terms also considerably improved the
model (p <0.001). Across all years, the peak in influenza virus identification in non-
Aboriginal children was earlier (July) in those aged 5-9 years compared to all other age
groups (Figure 8.6).
FIGURE 8.2 Overall temporal trends of identification rates for RSV, influenza virus A
and B, PIV1, PIV3 and adenovirus 1997-2005
0
5
10
15
20
25
1997 1998 1999 2000 2001 2002 2003 2004 2005
Year of specimen collection
% p
os
itiv
e
RSV
Influenza virus A and B
PIV1
PIV3
Adenovirus
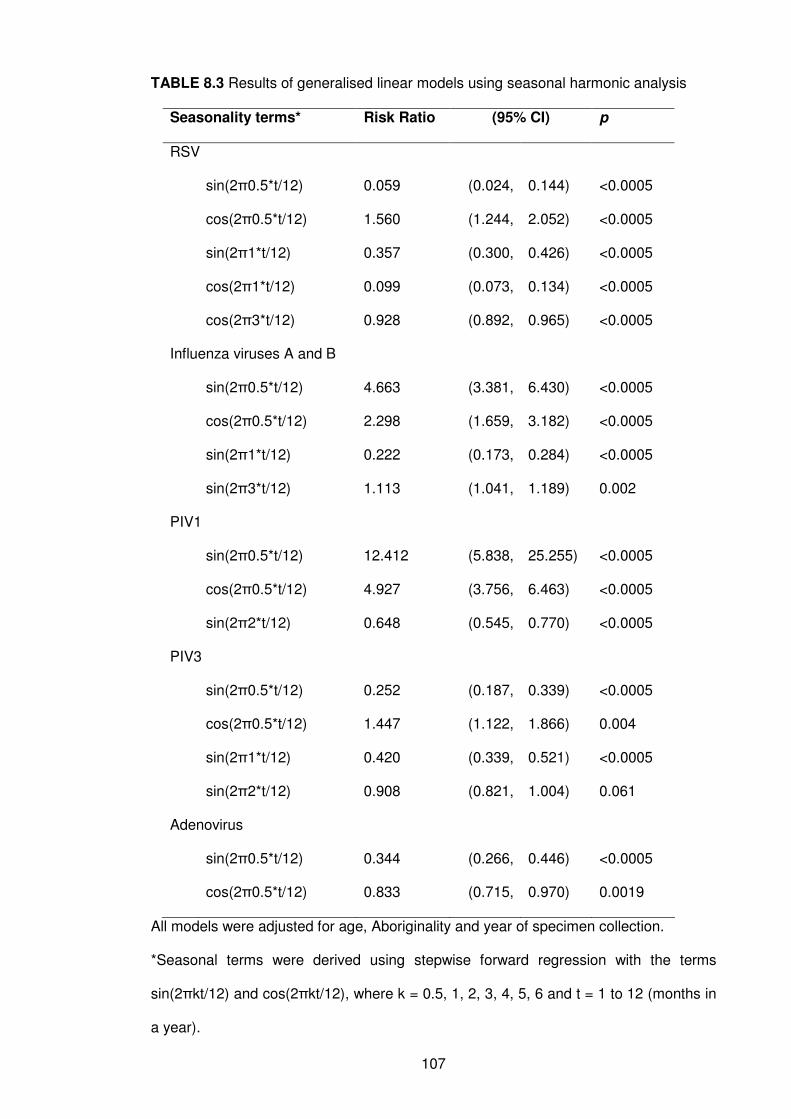
107
TABLE 8.3 Results of generalised linear models using seasonal harmonic analysis
Seasonality terms* Risk Ratio (95% CI) p
RSV
sin(2π0.5*t/12) 0.059 (0.024, 0.144) <0.0005
cos(2π0.5*t/12) 1.560 (1.244, 2.052) <0.0005
sin(2π1*t/12) 0.357 (0.300, 0.426) <0.0005
cos(2π1*t/12) 0.099 (0.073, 0.134) <0.0005
cos(2π3*t/12) 0.928 (0.892, 0.965) <0.0005
Influenza viruses A and B
sin(2π0.5*t/12) 4.663 (3.381, 6.430) <0.0005
cos(2π0.5*t/12) 2.298 (1.659, 3.182) <0.0005
sin(2π1*t/12) 0.222 (0.173, 0.284) <0.0005
sin(2π3*t/12) 1.113 (1.041, 1.189) 0.002
PIV1
sin(2π0.5*t/12) 12.412 (5.838, 25.255) <0.0005
cos(2π0.5*t/12) 4.927 (3.756, 6.463) <0.0005
sin(2π2*t/12) 0.648 (0.545, 0.770) <0.0005
PIV3
sin(2π0.5*t/12) 0.252 (0.187, 0.339) <0.0005
cos(2π0.5*t/12) 1.447 (1.122, 1.866) 0.004
sin(2π1*t/12) 0.420 (0.339, 0.521) <0.0005
sin(2π2*t/12) 0.908 (0.821, 1.004) 0.061
Adenovirus
sin(2π0.5*t/12) 0.344 (0.266, 0.446) <0.0005
cos(2π0.5*t/12) 0.833 (0.715, 0.970) 0.0019
All models were adjusted for age, Aboriginality and year of specimen collection.
*Seasonal terms were derived using stepwise forward regression with the terms
sin(2πkt/12) and cos(2πkt/12), where k = 0.5, 1, 2, 3, 4, 5, 6 and t = 1 to 12 (months in
a year).
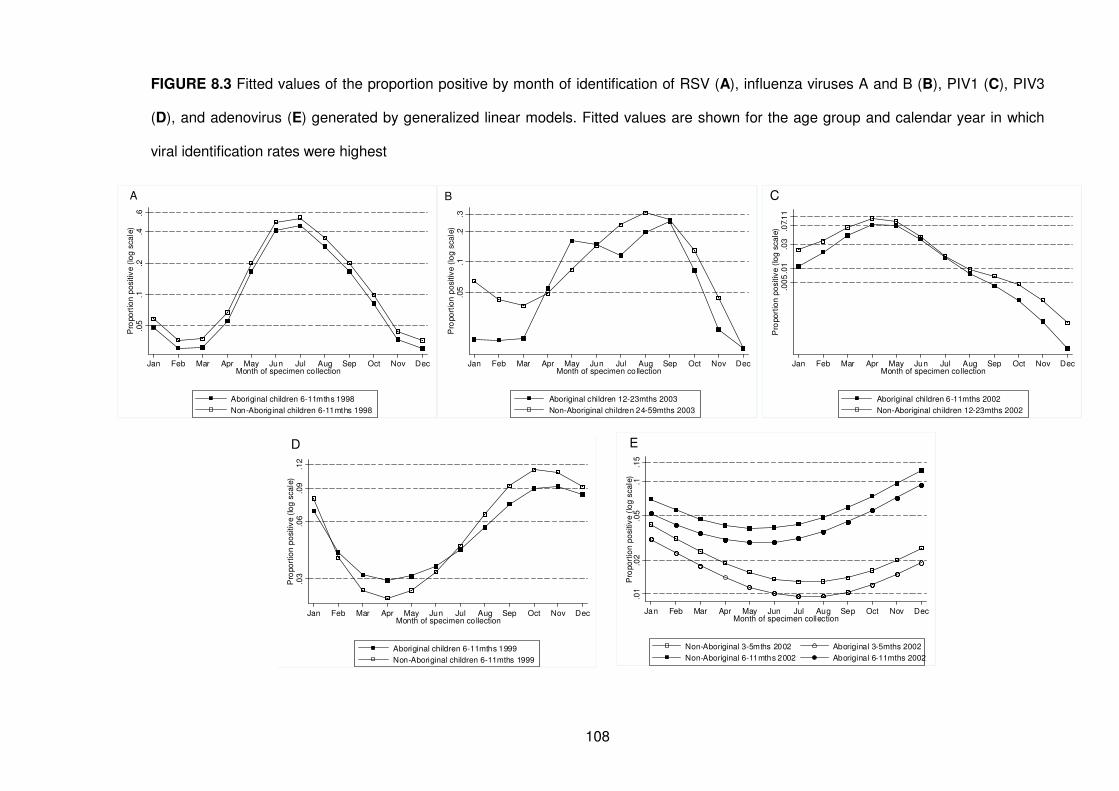
108
FIGURE 8.3 Fitted values of the proportion positive by month of identification of RSV (A), influenza viruses A and B (B), PIV1 (C), PIV3
(D), and adenovirus (E) generated by generalized linear models. Fitted values are shown for the age group and calendar year in which
viral identification rates were highest
.05
.1.1
5.0
1.0
2P
ropo
rtio
n p
ositiv
e (
log
sca
le)
Jan Feb Mar Apr May Jun Jul Aug Sep Oct Nov DecMonth of specimen collection
Non-Aboriginal 3-5mths 2002
Non-Aboriginal 6-11mths 2002
Aboriginal 3-5mths 2002
Aboriginal 6-11mths 2002
E
.03
.07.
11
.01
.00
5P
ropo
rtio
n p
ositiv
e (
log
sca
le)
Jan Feb Mar Apr May Jun Jul Aug Sep Oct Nov DecMonth of specimen collection
Aboriginal children 6-11mths 2002
Non-Aboriginal children 12-23mths 2002
C
.2.4
.6.1
.05
Pro
po
rtio
n p
ositiv
e (
log
sca
le)
Jan Feb Mar Apr May Jun Jul Aug Sep Oct Nov DecMonth of specimen collection
Aboriginal children 6-11mths 1998
Non-Aboriginal children 6-11mths 1998
A
.1.2
.3.0
5P
ropo
rtio
n p
ositiv
e (
log
sca
le)
Jan Feb Mar Apr May Jun Jul Aug Sep Oct Nov DecMonth of specimen collection
Aboriginal children 12-23mths 2003
Non-Aboriginal children 24-59mths 2003
B
.03
.06
.09
.12
Pro
po
rtio
n p
ositiv
e (
log
sca
le)
Jan Feb Mar Apr May Jun Jul Aug Sep Oct Nov DecMonth of specimen collection
Aboriginal children 6-11mths 1999
Non-Aboriginal children 6-11mths 1999
D
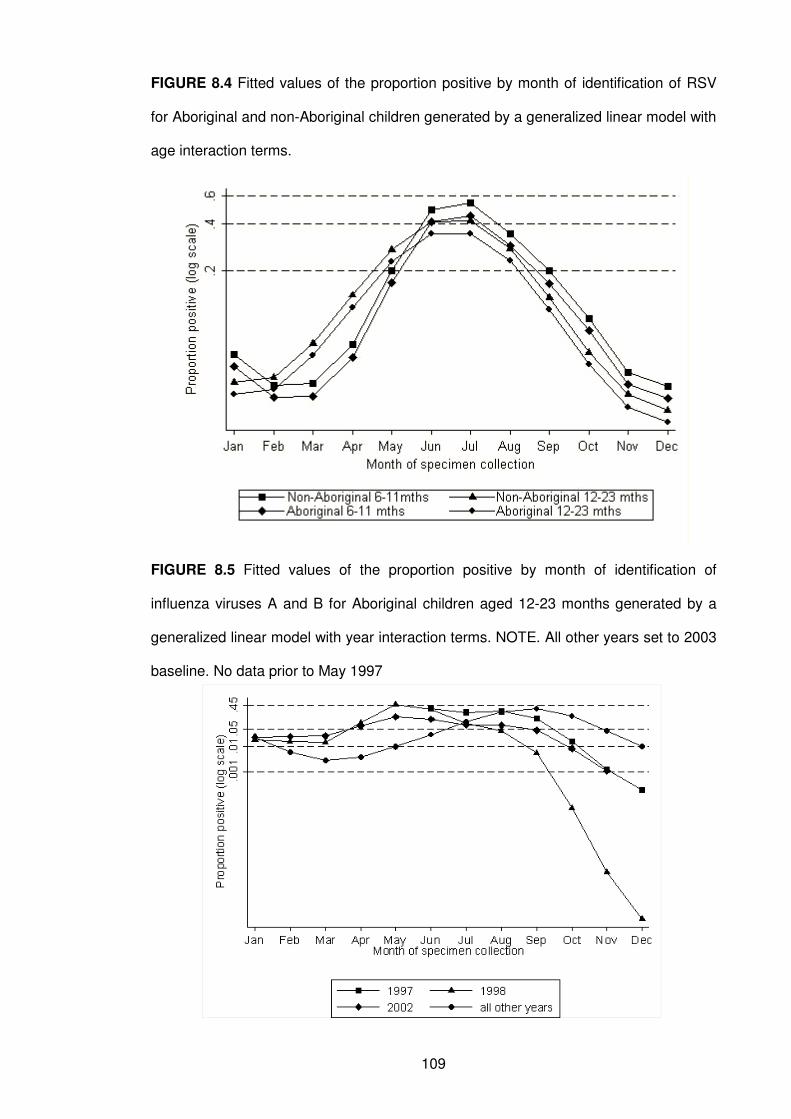
109
FIGURE 8.4 Fitted values of the proportion positive by month of identification of RSV
for Aboriginal and non-Aboriginal children generated by a generalized linear model with
age interaction terms.
FIGURE 8.5 Fitted values of the proportion positive by month of identification of
influenza viruses A and B for Aboriginal children aged 12-23 months generated by a
generalized linear model with year interaction terms. NOTE. All other years set to 2003
baseline. No data prior to May 1997
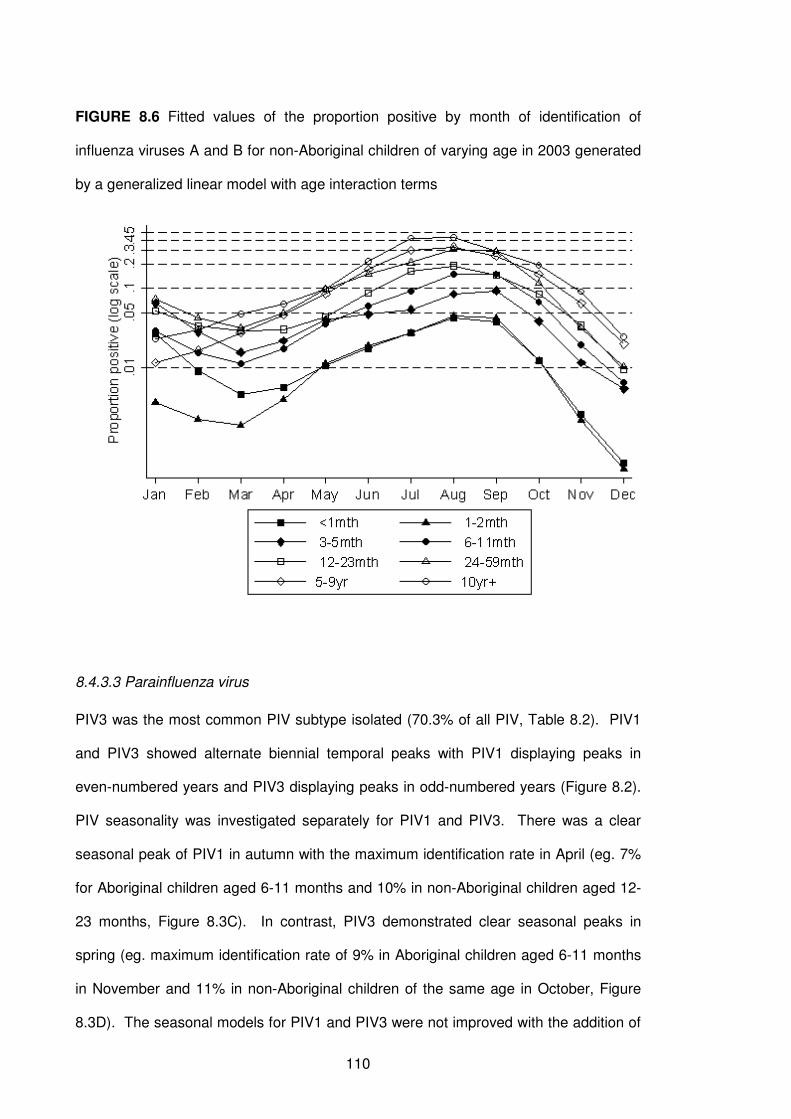
110
FIGURE 8.6 Fitted values of the proportion positive by month of identification of
influenza viruses A and B for non-Aboriginal children of varying age in 2003 generated
by a generalized linear model with age interaction terms
8.4.3.3 Parainfluenza virus
PIV3 was the most common PIV subtype isolated (70.3% of all PIV, Table 8.2). PIV1
and PIV3 showed alternate biennial temporal peaks with PIV1 displaying peaks in
even-numbered years and PIV3 displaying peaks in odd-numbered years (Figure 8.2).
PIV seasonality was investigated separately for PIV1 and PIV3. There was a clear
seasonal peak of PIV1 in autumn with the maximum identification rate in April (eg. 7%
for Aboriginal children aged 6-11 months and 10% in non-Aboriginal children aged 12-
23 months, Figure 8.3C). In contrast, PIV3 demonstrated clear seasonal peaks in
spring (eg. maximum identification rate of 9% in Aboriginal children aged 6-11 months
in November and 11% in non-Aboriginal children of the same age in October, Figure
8.3D). The seasonal models for PIV1 and PIV3 were not improved with the addition of
111
interaction terms between Aboriginality (p = 0.78 for PIV1, p = 0.74 for PIV3) or age (p
= 0.20 for PIV1, p = 0.07 for PIV3) and seasonality (all p >0.05).
8.4.3.4 Adenovirus
Annual adenovirus identification rates showed only minor fluctuations between 1997
and 2005 (Figure 8.2). The inclusion of interactions terms for Aboriginality did not
improve the model (p = 0.77). However, the model was improved by the addition of
age interaction terms (p = 0.004). For all children aged 3-5 months, there was a clear
seasonal peak in January, the middle of summer, with the maximum proportion positive
of 0.04 for non-Aboriginal children and 0.03 for Aboriginal children, whereas in older
children, the seasonal peak was a month earlier in December (eg. 0.09 for Aboriginal
and 0.13 for non-Aboriginal children aged 6-11 months, Figure 8.3E).
8.5 Discussion
This is the first time that differences in seasonality of influenza viruses between
Aboriginal and non-Aboriginal children have been reported. Furthermore, seasonality of
RSV, influenza viruses and adenoviruses varied with age. In the absence of routine
testing for rhinoviruses, RSV accounted for over half of all virus-positive specimens,
highlighting the continuing importance of this respiratory pathogen in children.
In Aboriginal children, peak influenza virus identification rates occurred earlier in three
of the nine years of study, highlighting the irregular seasonal pattern in Aboriginal
children compared with consistent annual peaks in non-Aboriginal children.
Interestingly, annual data for the period 1996-2001 from the Tropical Influenza
Surveillance System in the NT showed similar bimodal seasonality to what we noted in
our aggregated data.164 Reasons for variability in influenza virus seasonal patterns
between Aboriginal and non-Aboriginal children in WA are as yet unclear.
Geographical differences in specimen collection cannot explain the variability as 90%
112
of specimens were from the metropolitan area. However, the transient nature of the
Aboriginal population165 and the resultant increased contact between Aboriginal
families in metropolitan and non-metropolitan areas could result in earlier transmission
if seasonal peaks are earlier in northern WA as reported in the NT. In addition,
Aboriginal children have a much higher incidence of hospitalisation due to respiratory
infections7 and are perhaps more susceptible to contracting an infection when low
levels of influenza viruses are circulating in the community. The earlier peak we have
seen in Aboriginal children for some years has implications for timing of influenza virus
vaccination. Aboriginal children should be offered an influenza virus vaccination as
soon as it is available given their earlier peak period. This could pose problems if there
is a waning of protective antibody after 6 months as reported for other high-risk
paediatric groups166 and influenza viruses circulate late in that year. Optimal
surveillance as is now being established in WA will assist in determining the benefit of
such an intervention.
RSV and influenza viruses were the only viruses that displayed peak viral activity in
winter when Perth has the lowest temperatures and highest rainfall.77 PIV1, the agent
most commonly responsible for croup,167 displayed peak activity in autumn whereas
PIV3 displayed peak activity in spring. A Canadian study of the seasonality of croup
hospitalisations over a 14-year period168 showed peaks in autumn which is consistent
with our findings. In a study in Argentina, a country with a similar climate to Australia,
adenoviruses did not display any seasonality52 while we found a distinct peak in
summer, and the timing of peaks varying with age.
Our finding of varying age-specific rates for different viruses is not unique. Median age
of RSV identification is also lower than for PIV1-3, influenza viruses A and B and
adenovirus in Iran32 and Germany.169 Our finding of high identification rates of RSV,
but low influenza virus identification rates in young children and the opposite in older
children is consistent with reports from the USA.170
113
The median age of viral identification was lower in Aboriginal than non-Aboriginal
children. In Aboriginal children nasopharyngeal bacterial carriage of S. pneumoniae,
M. catarrhalis and non-typeable H. influenzae is more common and starts at a younger
age than in non-Aboriginal children.46 It is not clear whether Aboriginal children suffer
more serious illness and are more likely to be hospitalised for a respiratory virus-
associated infection than non-Aboriginal children as a result of concomitant bacterial
infection (as suggested by pneumococcal conjugate vaccine trials in South Africa67), or
whether viral detection at a young age simply reflects high exposure to pathogens due
to overcrowding or other risk factors such as passive smoking or poor nutrition.
Comparing seasonality across age groups assists in understanding how an infection
spreads through a community. A group in Boston reported that children aged 3-4 years
are the sentinels of influenza virus infection and signal the consequent burden of
illness.121 In our study, non-Aboriginal children aged 5-9 years had the earliest
seasonal influenza virus peak. This suggests that in our setting, preschool and early
school-age children are the sentinels of influenza virus infection in the non-Aboriginal
population.
The importance of investigating seasonality must not be overlooked. An understanding
of seasonality enhances the accuracy of surveillance systems aimed at early detection
of epidemics.50 Using harmonic analysis, we were able to test for seasonal patterns
from a large number of specimens by the inclusion of sine and cosine terms in
regression models. The ability to assess variability in seasonality with respect to age
and Aboriginality adds to the strength of this method and our study. Effective
measures to prevent respiratory viral infections will centre on vaccination programs and
immunoprophylaxis. The optimum benefit from these interventions will occur during
peak viral activity. Therefore knowledge of the timing and duration of seasonal
114
patterns in the populations where the preventive measures are to be implemented is
crucial to their success.171
Our study has some limitations. We were only able to include data on respiratory
viruses identified by cell culture and direct immunofluorescence. We could not
investigate seasonality of rhinovirus or hMPV as those molecular diagnostic methods
are not routinely carried out. Rhinoviruses are an important pathogen172, 173 with higher
identification rates than RSV174 in community-based studies.175 It will be important to
document seasonality of rhinoviruses, hMPV, coronaviruses and bocavirus,37, 155 as
well as co-infection by multiple viruses or viruses and bacteria. We could not relate the
seasonality of viruses to severity of disease or clinical diagnoses. WA covers a large
geographical area and climate ranges from temperate in the southern part of the state
to tropical in the far north. Viral activity in northern remote areas may peak at different
times to that seen in the metropolitan temperate area (as is the case for bronchiolitis
hospitalisations as seen in Chapter 5). Therefore, it will be important to determine
whether the seasonal and temporal patterns seen in the Aboriginal children in Perth, in
particular for influenza viruses, are found in other areas of WA.
This study has highlighted the importance of investigating seasonality of common
respiratory viruses and, importantly, the need to disaggregate data and investigate the
variability within seasonality. An appropriate public health response would be to offer
influenza vaccine to Aboriginal children as soon as the vaccine is available.
Furthermore, children aged 5-9 years may be a more appropriate target age group for
influenza vaccination to prevent spread in the community. However, further
investigation of state-wide seasonality trends is needed following introduction of routine
influenza vaccine for young children in WA in 2008. The varying seasonal peaks for
adenoviruses and RSV across different age groups also have implications in the timing
and selection of target groups for future vaccination programs. Our data provide an
important baseline to measure the effectiveness of future public health interventions.
115
CHAPTER 9
Aetiology of ALRI Part II:
The interaction between respiratory viruses and pathogenic
bacteria in the upper respiratory tract of asymptomatic
Aboriginal and non-Aboriginal children
116
9.1 Preamble
This chapter addressing objective 3 describes the identification of respiratory viruses in
healthy Aboriginal and non-Aboriginal children in a rural area of WA. This chapter also
investigates the interactions between respiratory viruses and pathogenic bacteria
known to cause otitis media (OM). To aid in understanding the role of viruses in the
aetiology of ALRI, it is meaningful to know the patterns of viral identification in the
absence of an active infection. Asymptomatic identification of viruses may indicate the
period before an active infection, and therefore the period before symptoms occur, or it
could indicate prolonged viral shedding following an active infection. It is also
meaningful to know if viruses identified in asymptomatic children are associated with
simultaneous carriage of bacteria. Addressing these research questions was
achievable by analysing data from the Kalgoorlie Otitis Media Research Project
(KOMRP) with a focus on respiratory viral identification. I was not involved in data
collection for KOMRP but conducted all statistical analyses presented here.
This chapter was published in the Pediatric Infectious Disease Journal in June in 2010
and is presented here in its entirety. A copy of the published paper is in Appendix 4.
9.2 Introduction
OM is a common childhood illness accounting for a significant proportion of doctor
consultations and antibiotic prescriptions.176-178 In industrialised countries 10-20% of
children will suffer more than 3 episodes of OM during the first year of life.179 Aboriginal
Australian children experience exceptionally high rates of OM and its complications, in
particular hearing loss.180 The peak prevalence of OM in the KOMRP was 72% in
Aboriginal children aged 5-9 months and 40% in non-Aboriginal children aged 10-14
months.83 S. pneumoniae, H. influenzae and M. catarrhalis are the 3 most common
bacterial pathogens associated with OM in both Indigenous and non-Indigenous
populations in Australia and elsewhere46, 180, 181 and early onset of upper respiratory
117
tract carriage of these pathogens is associated with increased risk of OM.180, 182 In the
KOMRP carriage rates for S. pneumoniae, H. influenzae and M. catarrhalis were 2-3
times higher in Aboriginal children than in non-Aboriginal children.46
RSV, influenza viruses A and B, coronaviruses, adenoviruses, PIV types 1-3,
rhinoviruses, enteroviruses and mumps viruses have been associated with OM183-191
and several studies suggest that viruses predispose to acute OM.184, 192, 193
Furthermore, rhinoviruses have been associated with carriage of M. catarrhalis and S.
pneumoniae in otitis-prone children194 and synergism has been described between
influenza viruses and S. pneumoniae.195
In order to understand the role of viruses in the aetiology and pathogenesis of OM, it is
necessary to know the prevalence of viruses in asymptomatic children. This is
particularly relevant with increasing use of PCR techniques which have generally
resulted in higher detection rates in both symptomatic and asymptomatic subjects.196,
197 In the only small study to date in Aboriginal Australian infants, viruses were
generally identified after bacterial colonisation and onset of OM.180 However the study
was conducted before more sensitive PCR technology became available. There have
been no studies reporting on viral identification rates in asymptomatic Australian
children.
Using data collected in the KOMRP, we now describe the respiratory viruses identified
in asymptomatic Aboriginal and non-Aboriginal children and the relationships between
respiratory viruses and bacterial OM pathogens. We hypothesise that Aboriginal
children have higher rates of asymptomatic viral identification than non-Aboriginal
children and that both rhinoviruses and adenoviruses are associated with increased
risk of nasopharyngeal carriage of bacterial OM pathogens in Aboriginal and non-
Aboriginal children at the microbe level.
118
9.3 Materials and Methods
9.3.1 Study population
Kalgoorlie-Boulder is the largest town in the Goldfields region of WA, located 600km
east of Perth in a semi-arid zone. The KOMRP has been described in detail
elsewhere.46, 83 In brief, between April 1999 and January 2003, 100 Aboriginal and 180
non-Aboriginal children living within a one-hour drive of Kalgoorlie-Boulder were
enrolled at birth and followed up regularly to age 2 years. Multiple births and children
with severe congenital abnormalities or birthweight <2000g were excluded. A total of
1559 NPAs were collected during routine follow-up visits at 1-3 weeks, 6-8 weeks and
again at 4, 6, 12, 18 and 24 months. To identify viruses in the nasopharynx, we
selected all NPAs from children who had at least four specimens collected during the
study. Thus, 1006 NPAs from asymptomatic Aboriginal and non-Aboriginal children
were available for virology testing. We tested the first 396 specimens that we collected
for rhinoviruses, adenoviruses, RSV, influenza viruses A and B, coronaviruses, PIV
and hMPV. Because of financial constraints we restricted virology testing of the
remaining 610 specimens to rhinoviruses, adenoviruses, RSV and influenza A and B
viruses.
9.3.2 Laboratory methods
NPAs were collected at each visit. One mL of saline was then added to the specimen
which was stored for viral identification. For bacterial culture, a 0.5 mL volume of
mucus plug, or if no visible plug, the gently mixed specimen, was pipetted into 1 mL of
skim milk-tryptone-glucose-glycerol broth. All samples were stored at -20°C until sent
to the study laboratory in Perth on dry ice, usually within 72 hours, for long-term
storage at -70°C. Methods used for primary isolation and identification of bacterial
pathogens in NPA specimens have been described previously.46 Primary inocula were
made on selective media and organisms of interest were subcultured and subjected to
confirmatory tests using standard methods.198 To identify viruses, nucleic acid was
119
extracted from samples using the QIAmp Viral RNA kit (QIAGen Sciences,
Maryland,USA) in accordance with the manufacturer’s protocol. In-house modified
nested or semi-nested PCR amplification was performed for rhinoviruses,
adenoviruses, RSV, hMPV, influenza viruses A and B, coronaviruses and PIV types 1–
3. Amplicons were detected by ethidium bromide agarose gel electrophoresis.
9.3.3 Statistical analysis
NPA specimens were grouped into seven age categories (<1, 1-2, 3-4, 5-9, 10-14, 15-
19 and ≥ 20 months), based on the timing of scheduled follow-up visits. The viral
identification rate was defined as the proportion of specimens positive for a particular
virus. Chi-square tests were used to compare viral identification rates between
Aboriginal and non-Aboriginal children. Adenoviruses and rhinoviruses were the only
viruses identified in sufficient numbers for further analysis. We used logistic regression
models incorporating generalized estimating equations (GEE) adjusted for age, gender
and the proportion of virus-positive samples for the virus under investigation for each
child to examine associations between rhinoviruses or adenoviruses and simultaneous
carriage of S. pneumoniae, M. catarrhalis or H. influenzae. This method was used as
our study consisted of correlated longitudinal data, with children having multiple
specimens collected over the duration of the study. A GEE model accounts for
correlated observations and therefore produces more accurate standard errors.199
Separate models were used for Aboriginal and non-Aboriginal children. These semi-
adjusted models were investigating the overall interactions between viruses and
bacteria at the microbe level in Aboriginal and non-Aboriginal children. To investigate
independent effects between rhinoviruses or adenoviruses and pathogenic bacteria,
further models were developed adjusting for the same factors as the semi-adjusted
models as well as for the presence of other bacteria and rhinoviruses or adenoviruses.
In both semi-adjusted and fully-adjusted models we determined OR with 95%
120
confidence intervals to indicate the strength of the associations. An OR >1 represents a
positive association between the identification of the virus and bacteria under
investigation and an OR <1 represents a negative association. All analyses were
performed using Stata version 9.0 and SPSS version 15.0.
9.3.4 Ethical approval
The study design and protocol for the KOMRP were approved by the Western
Australian Aboriginal Health and Information Ethics Committee, the Northern Goldfields
Health Service and Nursing Education Ethics Committee in Kalgoorlie, Princess
Margaret Hospital for Children Ethics Committee and the Confidentiality of Health
Information Committee of the Health Department of WA.
9.4 Results
9.4.1 Nasopharyngeal specimens
The 1006 specimens tested for the presence of respiratory viruses were from 79
Aboriginal children (436 specimens, average 5.5 per child) and 88 non-Aboriginal
children (570 specimens, average 6.5 per child). In Aboriginal children, 262 (60.1%)
specimens were from boys and in non-Aboriginal children 305 (53.5%) were from boys.
Generally, specimens were equally distributed across the seven age groups, but there
were fewer specimens from Aboriginal children aged ≥ 20 months (10.8%, n=47) than
younger Aboriginal children (eg. 5-9 months 16.3%, n=71; p = 0.56).
9.4.2 Viruses identified in nasopharyngeal specimens
In the 396 samples that were tested for all 7 viruses, one or more viruses were
identified in 42.1% of samples from Aboriginal children and 31.5% of samples from
non-Aboriginal children. Overall, rhinoviruses were the most frequently identified
viruses (19.6%), followed by adenoviruses, coronaviruses, PIV, hMPV, RSV and
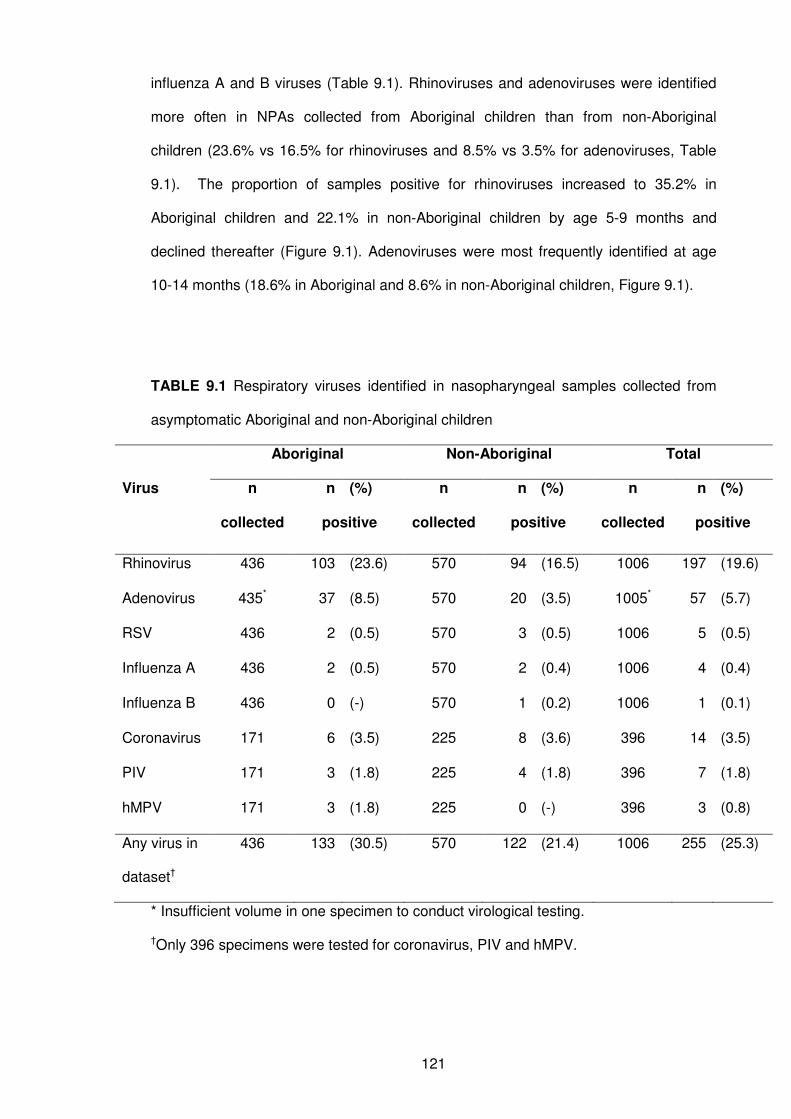
121
influenza A and B viruses (Table 9.1). Rhinoviruses and adenoviruses were identified
more often in NPAs collected from Aboriginal children than from non-Aboriginal
children (23.6% vs 16.5% for rhinoviruses and 8.5% vs 3.5% for adenoviruses, Table
9.1). The proportion of samples positive for rhinoviruses increased to 35.2% in
Aboriginal children and 22.1% in non-Aboriginal children by age 5-9 months and
declined thereafter (Figure 9.1). Adenoviruses were most frequently identified at age
10-14 months (18.6% in Aboriginal and 8.6% in non-Aboriginal children, Figure 9.1).
TABLE 9.1 Respiratory viruses identified in nasopharyngeal samples collected from
asymptomatic Aboriginal and non-Aboriginal children
Aboriginal Non-Aboriginal Total
n n (%) n n (%) n n (%) Virus
collected positive collected positive collected positive
Rhinovirus 436 103 (23.6) 570 94 (16.5) 1006 197 (19.6)
Adenovirus 435* 37 (8.5) 570 20 (3.5) 1005* 57 (5.7)
RSV 436 2 (0.5) 570 3 (0.5) 1006 5 (0.5)
Influenza A 436 2 (0.5) 570 2 (0.4) 1006 4 (0.4)
Influenza B 436 0 (-) 570 1 (0.2) 1006 1 (0.1)
Coronavirus 171 6 (3.5) 225 8 (3.6) 396 14 (3.5)
PIV 171 3 (1.8) 225 4 (1.8) 396 7 (1.8)
hMPV 171 3 (1.8) 225 0 (-) 396 3 (0.8)
Any virus in
dataset†
436 133 (30.5) 570 122 (21.4) 1006 255 (25.3)
* Insufficient volume in one specimen to conduct virological testing.
†Only 396 specimens were tested for coronavirus, PIV and hMPV.
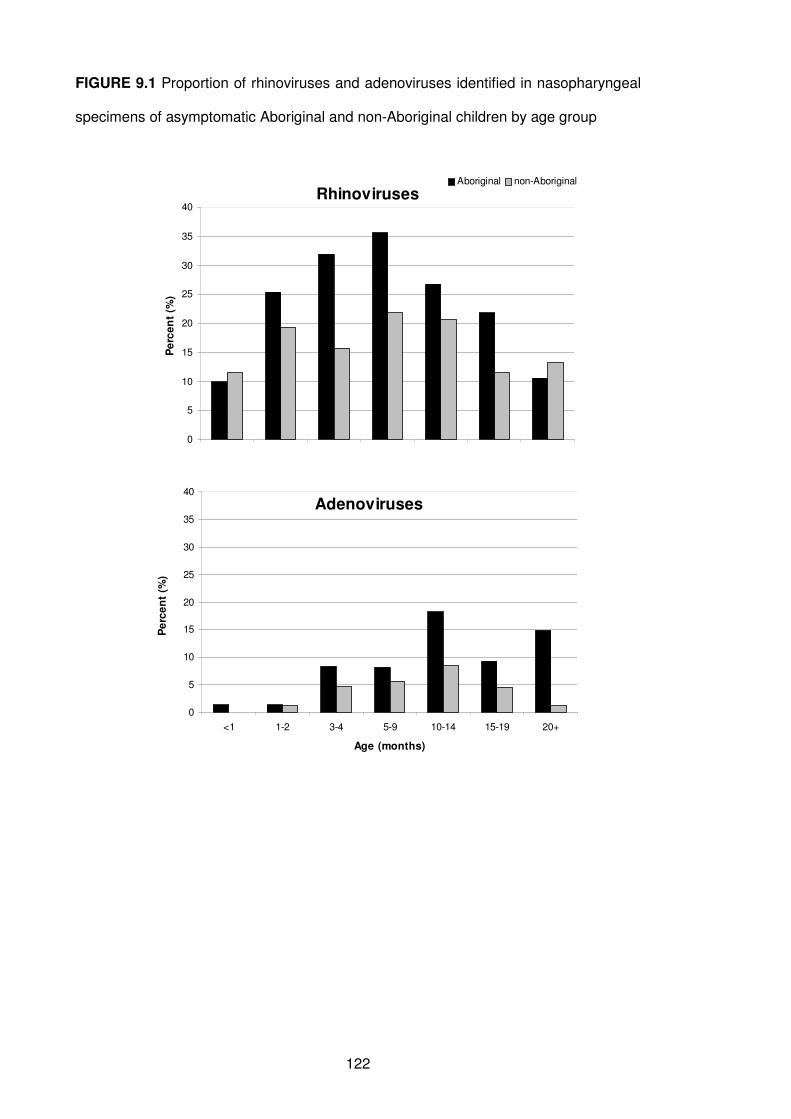
122
FIGURE 9.1 Proportion of rhinoviruses and adenoviruses identified in nasopharyngeal
specimens of asymptomatic Aboriginal and non-Aboriginal children by age group
Rhinoviruses
0
5
10
15
20
25
30
35
40
Pe
rce
nt
(%)
Aboriginal non-Aboriginal
Adenoviruses
0
5
10
15
20
25
30
35
40
<1 1-2 3-4 5-9 10-14 15-19 20+
Age (months)
Pe
rce
nt
(%)
123
9.4.3 Associations between viruses and bacterial OM pathogens
Table 9.2 shows the co-occurrence of S. pneumoniae, H. influenzae or M. catarrhalis
and adenoviruses or rhinoviruses in Aboriginal and non-Aboriginal children. Overall,
one or more of the bacterial OM pathogens co-occurred with one or more viruses in
70% (307/436) of specimens from Aboriginal children and 45% (259/570) of specimens
from non-Aboriginal children. When rhinoviruses or adenoviruses were not identified, a
higher proportion of specimens also had no OM bacteria identified compared with
rhinovirus- and adenovirus-positive specimens. For example, in Aboriginal children,
37% of rhinovirus-negative specimens had no bacterial pathogens compared with 7%
of rhinovirus-positive specimens. In Aboriginal children, all 3 bacterial OM pathogens
were isolated from 42% of rhinovirus-positive specimens and from 49% of adenovirus-
positive specimens (Table 9.2). In non-Aboriginal children, co-occurrence of bacteria
and viruses was less frequent than among Aboriginal children. In 44% of rhinovirus-
positive specimens from non-Aboriginal children and in 20% of adenovirus-positive
specimens, none of the 3 bacterial OM pathogens were isolated. All 3 bacterial OM
pathogens were isolated from 6% (n=6) of rhinovirus-positive specimens and 10%
(n=2) of adenovirus-positive specimens (Table 9.2). Two-thirds (n=4) of coronavirus-
positive specimens in Aboriginal children also grew all 3 bacterial OM pathogens, but
none of the coronavirus-positive specimens in non-Aboriginal children grew all 3; rather
62.5% (n=5) of coronavirus-positive specimens grew no OM bacteria.
In regression models adjusting for age, gender and the proportion of rhinovirus-positive
specimens per child, the presence of rhinoviruses significantly increased the odds of
identifying each of the 3 bacterial OM pathogens in Aboriginal children (Table 9.3). The
strongest association was between rhinoviruses and H. influenzae (OR 2.91, 95% CI
1.76-4.83). When these models were further adjusted for the presence of other
bacteria and adenoviruses, all positive associations remained significant except for that
with S. pneumoniae. While there was a positive association between rhinoviruses and
124
the 3 bacterial OM pathogens in non-Aboriginal children, none of the associations
reached statistical significance (Table 9.3).
Isolation of H. influenzae was also strongly associated with adenoviruses in Aboriginal
children (OR 3.29, 95% CI 2.19-8.40) and this remained significant after adjusting for
the presence of rhinoviruses and the other bacterial OM pathogens (Table 9.4). In the
semi-adjusted model, no significant association was seen between adenoviruses and
S. pneumoniae in Aboriginal children but in the model adjusting for the presence of
other bacteria and rhinoviruses there was a significant negative association between
these pathogens. The identification of adenoviruses resulted in a 61% reduction in the
odds of S. pneumoniae isolation (OR 0.39, 95% CI 0.18-0.84, Table 9.4). There was a
strong positive association between adenoviruses and M. catarrhalis in non-Aboriginal
children, both in the semi-adjusted (OR 5.71, 95%CI 1.67-19.61) and the fully-adjusted
models (OR 5.75, 95% CI 1.74-19.23, Table 9.4).
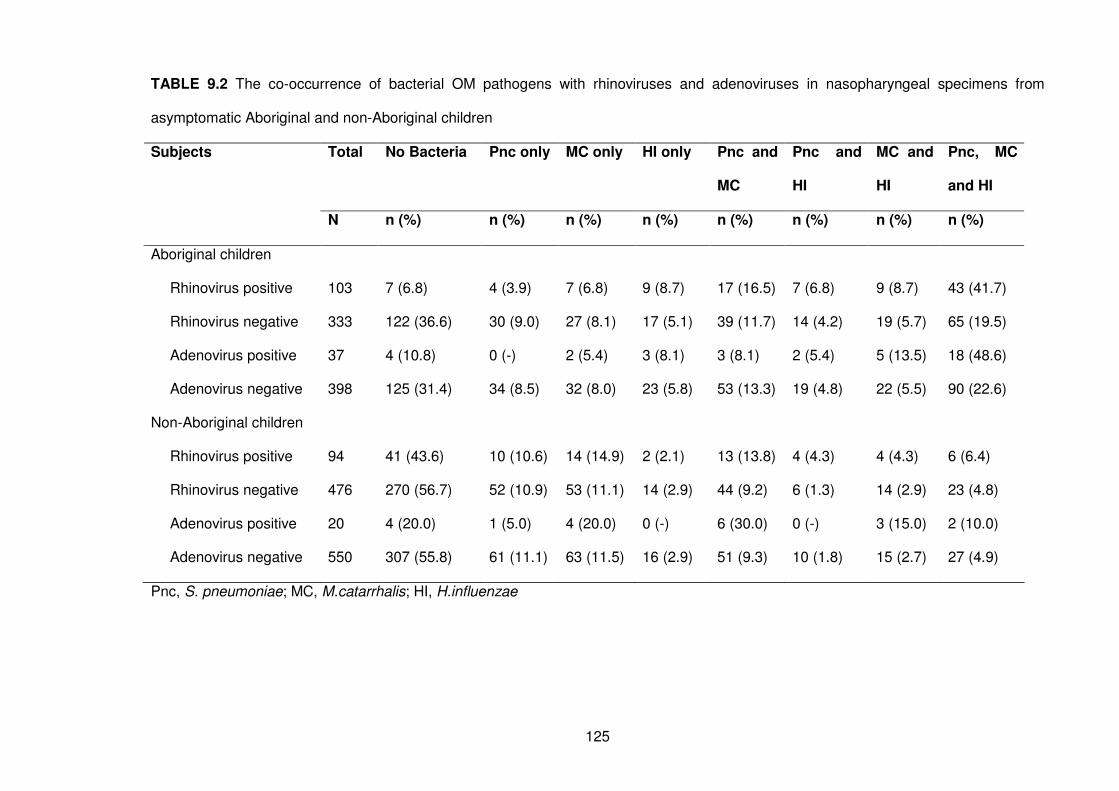
125
TABLE 9.2 The co-occurrence of bacterial OM pathogens with rhinoviruses and adenoviruses in nasopharyngeal specimens from
asymptomatic Aboriginal and non-Aboriginal children
Total No Bacteria Pnc only MC only HI only Pnc and
MC
Pnc and
HI
MC and
HI
Pnc, MC
and HI
Subjects
N n (%) n (%) n (%) n (%) n (%) n (%) n (%) n (%)
Aboriginal children
Rhinovirus positive 103 7 (6.8) 4 (3.9) 7 (6.8) 9 (8.7) 17 (16.5) 7 (6.8) 9 (8.7) 43 (41.7)
Rhinovirus negative 333 122 (36.6) 30 (9.0) 27 (8.1) 17 (5.1) 39 (11.7) 14 (4.2) 19 (5.7) 65 (19.5)
Adenovirus positive 37 4 (10.8) 0 (-) 2 (5.4) 3 (8.1) 3 (8.1) 2 (5.4) 5 (13.5) 18 (48.6)
Adenovirus negative 398 125 (31.4) 34 (8.5) 32 (8.0) 23 (5.8) 53 (13.3) 19 (4.8) 22 (5.5) 90 (22.6)
Non-Aboriginal children
Rhinovirus positive 94 41 (43.6) 10 (10.6) 14 (14.9) 2 (2.1) 13 (13.8) 4 (4.3) 4 (4.3) 6 (6.4)
Rhinovirus negative 476 270 (56.7) 52 (10.9) 53 (11.1) 14 (2.9) 44 (9.2) 6 (1.3) 14 (2.9) 23 (4.8)
Adenovirus positive 20 4 (20.0) 1 (5.0) 4 (20.0) 0 (-) 6 (30.0) 0 (-) 3 (15.0) 2 (10.0)
Adenovirus negative 550 307 (55.8) 61 (11.1) 63 (11.5) 16 (2.9) 51 (9.3) 10 (1.8) 15 (2.7) 27 (4.9)
Pnc, S. pneumoniae; MC, M.catarrhalis; HI, H.influenzae
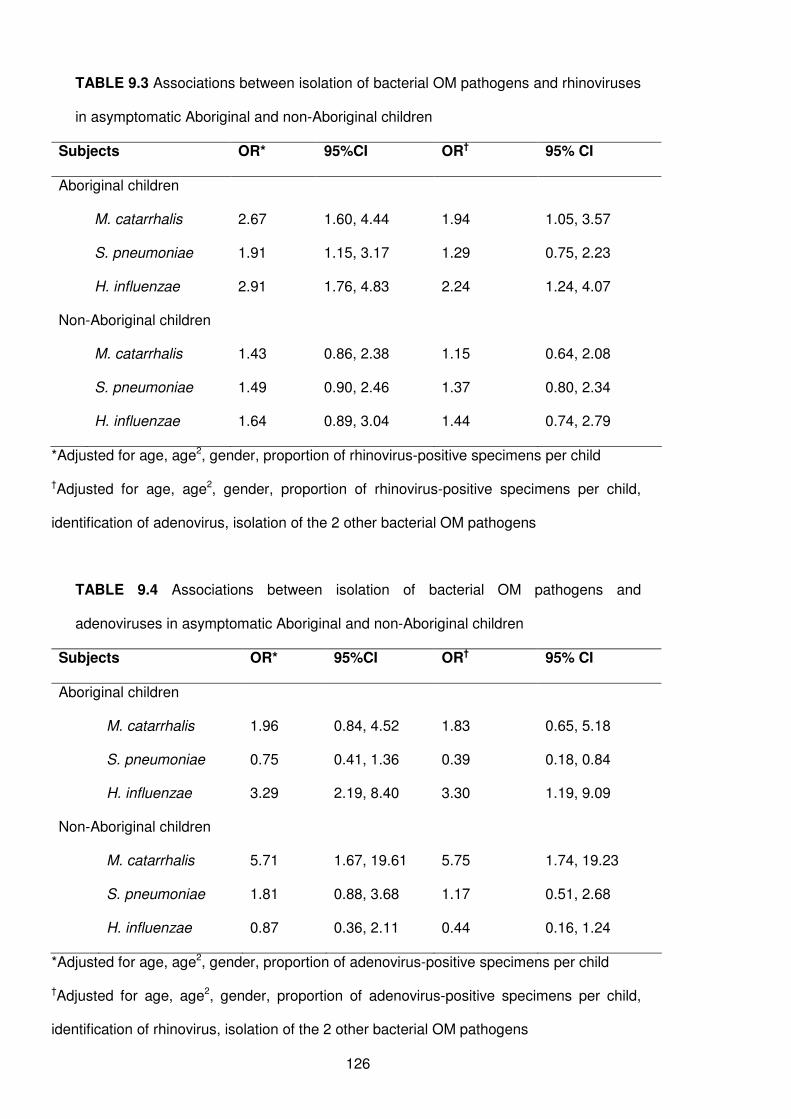
126
TABLE 9.3 Associations between isolation of bacterial OM pathogens and rhinoviruses
in asymptomatic Aboriginal and non-Aboriginal children
Subjects OR* 95%CI OR† 95% CI
Aboriginal children
M. catarrhalis 2.67 1.60, 4.44 1.94 1.05, 3.57
S. pneumoniae 1.91 1.15, 3.17 1.29 0.75, 2.23
H. influenzae 2.91 1.76, 4.83 2.24 1.24, 4.07
Non-Aboriginal children
M. catarrhalis 1.43 0.86, 2.38 1.15 0.64, 2.08
S. pneumoniae 1.49 0.90, 2.46 1.37 0.80, 2.34
H. influenzae 1.64 0.89, 3.04 1.44 0.74, 2.79
*Adjusted for age, age2, gender, proportion of rhinovirus-positive specimens per child
†Adjusted for age, age2, gender, proportion of rhinovirus-positive specimens per child,
identification of adenovirus, isolation of the 2 other bacterial OM pathogens
TABLE 9.4 Associations between isolation of bacterial OM pathogens and
adenoviruses in asymptomatic Aboriginal and non-Aboriginal children
Subjects OR* 95%CI OR† 95% CI
Aboriginal children
M. catarrhalis 1.96 0.84, 4.52 1.83 0.65, 5.18
S. pneumoniae 0.75 0.41, 1.36 0.39 0.18, 0.84
H. influenzae 3.29 2.19, 8.40 3.30 1.19, 9.09
Non-Aboriginal children
M. catarrhalis 5.71 1.67, 19.61 5.75 1.74, 19.23
S. pneumoniae 1.81 0.88, 3.68 1.17 0.51, 2.68
H. influenzae 0.87 0.36, 2.11 0.44 0.16, 1.24
*Adjusted for age, age2, gender, proportion of adenovirus-positive specimens per child
†Adjusted for age, age2, gender, proportion of adenovirus-positive specimens per child,
identification of rhinovirus, isolation of the 2 other bacterial OM pathogens
127
9.4.4 Simultaneous identification of viruses
More than one virus was simultaneously identified in 32 specimens (12.5% of all virus-
positive specimens), 22 (16.5% of all virus-positive specimens) from Aboriginal children
and 10 (8.2% of all virus-positive specimens) from non-Aboriginal children.
Adenoviruses and rhinoviruses were identified simultaneously in 23 of these 32
specimens, 15 from Aboriginal children and 8 from non-Aboriginal children. In 1
specimen from an Aboriginal child, 3 viruses were identified simultaneously (rhinovirus,
adenovirus and coronavirus). The remaining 9 specimens with multiple viruses (7 of
which were from Aboriginal children) involved either a rhinovirus or an adenovirus
identified simultaneously with a coronavirus on 4 occasions, hMPV on 2 occasions,
RSV on 2 occasions and PIV on 1 occasion.
9.5 Discussion
This is the first report to describe nasopharyngeal carriage of respiratory viruses and
their associations with respiratory bacteria in asymptomatic Indigenous and non-
Indigenous children. In our study in rural WA, Aboriginal children have a higher rate of
respiratory viruses identified in the nasopharynx than non-Aboriginal children and are
more likely to have viruses identified in conjunction with bacterial OM pathogens. We
found positive associations between identification of rhinoviruses and each of the 3
bacterial OM pathogens in all children, between adenoviruses and M. catarrhalis in
non-Aboriginal children, between adenoviruses and H. influenzae in Aboriginal
children, but a negative association between adenoviruses and S. pneumoniae in
Aboriginal children.
There are no similar Australian studies apart from one small study with Aboriginal
infants conducted before availability of PCR.180 In addition, few studies elsewhere have
128
investigated the presence of viruses in asymptomatic children and hence comparisons
between our study and others are difficult. In a review comparing the identification of
viruses by PCR and conventional diagnostic methods in asymptomatic subjects, Jartti
and colleagues196 reported similar PCR viral detection rates to those seen in non-
Aboriginal children in our study for rhinoviruses (15.1% vs our 16.5%), adenoviruses
(5.3% vs 3.5%), coronaviruses (2.5% vs 3.6%) and PIV (0.5% vs 1.8%). A Dutch study
identified rhinoviruses in 28% of specimens at age 12 months and in 14% of specimens
at age 24 months from asymptomatic children at routine health checks42 with results
similar to ours, although influenza viruses, coronaviruses and PIV were identified less
often than in our study. Johnston and colleagues200 reported a lower rate of detection of
rhinoviruses (12%) from asymptomatic samples than our study. Another Dutch study
identified viruses in 68% of asymptomatic children aged under 4 years attending
general practitioners for non-respiratory illnesses,201 with rhinoviruses being the most
commonly identified pathogen, although unlike our study, no adenoviruses were
identified. There are no data available in Indigenous populations from other parts of the
world to compare with our findings. Australian Aboriginal children could be considered
“otitis-prone” since they have a high burden of OM.46, 83 A prospective Finnish study of
otitis-prone children194 identified rhinoviruses in 39% of specimens collected from
asymptomatic children compared with our 24% in Aboriginal children, but did not
identify enough adenoviruses to warrant analysis. From the limited comparisons that
can be made, our study suggests a high prevalence of rhinoviruses and adenoviruses
in the community.
There is a growing awareness of the need to characterize interactions between
respiratory bacteria and viruses.202, 203 Asymptomatic carriage of viruses may occur
shortly before symptoms develop or represent prolonged viral shedding after an illness
and may increase the risk of secondary bacterial infections and disease including OM,
especially in Aboriginal children. Additionally, it is important to know the relative
contributions of viruses and bacteria to the burden of OM in different populations to
129
ensure appropriate case management and the development of preventive strategies.
Viral vaccines, in particular influenza vaccines,48, 49 might play a role in preventing
secondary bacterial infection and subsequent diseases such as OM.
Previously, we used multivariate random effects models192 with the KOMRP data to
differentiate between host-level (which takes into account impaired immunity and
environmental factors such as crowding) and microbe-level correlations between
bacterial and viral pathogens. We found associations primarily at the microbe-level for
rhinoviruses, though in Aboriginal children there was also an association at the host-
level for rhinoviruses and S. pneumoniae.192 The viral-bacterial interactions at the
microbe-level support the hypothesis that viruses predispose to bacterial adherence
and colonization. In our current analysis, by adjusting for the proportion of rhinovirus- or
adenovirus-positive specimens in the appropriate models, we are looking at
associations only at the microbe-level. In our semi-adjusted models, our results are
similar to those of the earlier modelling analysis. By further adjusting for the presence
of other bacteria and either rhinoviruses or adenoviruses as appropriate, we have
extended this analysis to investigate independent effects between a single virus and a
single bacterium.
We have now found independent associations between rhinoviruses and both M.
catarrhalis and H. influenzae in Aboriginal children, adenoviruses and H. influenzae in
Aboriginal children and adenoviruses and M. catarrhalis in non-Aboriginal children. Our
findings suggest synergism between both rhinoviruses and adenoviruses and these
two bacterial OM pathogens regardless of other pathogens that may be involved on a
causal pathway. A Finnish study found that rhinoviruses were positively associated with
M. catarrhalis and a trend towards a positive association was seen with S. pneumoniae
but no association with H. influenzae,194 which is partly consistent with our results.
Previous studies in humans have not identified adenoviruses in sufficient numbers to
conduct analyses for rates of co-occurrence with bacterial pathogens;194 however in the
130
chinchilla model, some synergism has been found as OM was most severe when
animals were inoculated with adenovirus 7 days prior to inoculation of non-typeable H.
influenzae.204
Of particular interest is the competitive interaction we found between S. pneumoniae
and adenoviruses in Aboriginal children. This suggests that the presence of
adenoviruses inhibits the growth of S. pneumoniae independent of whether M.
catarrhalis and H. influenzae are present or not. This has not been previously reported
and warrants further investigation. In-vitro studies have shown that while there is a
complex effect of respiratory viruses on bacterial adhesion to respiratory epithelia cells,
these have generally shown an enhancing effect of viral infection,205 including
adenoviruses and S. pneumoniae.126 In contrast, an in vivo study in the chinchilla
model adenoviruses did not enhance colonization by S. pneumoniae, contrary to the
enhancing effect of influenza A virus,206 and our earlier modelling analysis found a
negative association, albeit insignificant, between adenoviruses and S. pneumoniae192
giving further weight to our finding. From our study, we cannot determine whether viral
infection preceded, followed or coincided with the bacterial infection, but our results
support the hypothesis that rhinoviruses and adenoviruses are independently
associated with increased, or in the case of adenoviruses and S. pneumoniae,
decreased bacterial carriage in the nasopharynx of Aboriginal and non-Aboriginal
children.
Our study does have some other limitations. We were only able to test for the 7
respiratory viruses under investigation on a restricted set of specimens. While
specimens were collected during routine follow-up visits, it is possible that some
children may have been experiencing mild upper respiratory symptoms at the time, but
not severe enough to be classified as an illness episode. This could have resulted in
falsely high viral identification rates. However, specimens from children who were ill at
the time of collection were excluded from our analysis.
131
Despite these small limitations, our data provide a platform on which to determine the
role of rhinoviruses and adenoviruses and bacteria in the aetiology and severity of OM
and ALRI. The high identification rate of adenoviruses and rhinoviruses and concurrent
pathogenic OM bacteria in asymptomatic Aboriginal children may relate to larger family
sizes, more crowded living conditions than in non-Aboriginal households and higher
transmission rates83, 207 Improved housing and promotion of frequent handwashing for
Aboriginal people are needed to reduce carriage and transmission of respiratory
pathogens. Our findings have implications for prevention strategies targeting individual
pathogens and there is now a need to characterise these associations between viruses
and bacteria in times of active acute respiratory infection. Such investigations are
possible through our state-wide population-based data linkage system and we are in
the process of linking respiratory pathogen data with demographic, hospitalisation,
emergency department presentation data in a cohort of 245,000 births (see Chapters
10 and 11).
132
CHAPTER 10
Aetiology of ALRI Part III:
Acquisition, cleaning and coding of statewide laboratory
data
133
10.1 Preamble
In the previous two chapters I explored the seasonality of viruses identified in Perth
(Chapter 8) and identification of viruses and bacteria in children with no active ALRI in
rural WA (Chapter 9). The next two chapters explore the aetiology of ALRI on a
statewide basis. In order to do this, and also to assess the pathogen-specific burden of
ALRI and in the future validate hospital International Classification of Diseases (ICD)
diagnosis codes, state-wide pathology data are needed. Such data are available in the
PathWest Laboratory Database managed by the government-funded laboratory
service, PathWest Laboratory Medicine WA (PathWest). PathWest consists of all public
pathology laboratories in WA including five located at the metropolitan teaching
hospitals and many others located at metropolitan and non-metropolitan government
non-teaching hospitals. PathWest carries out a full range of diagnostic testing for
infectious diseases. A large scale data extraction from PathWest has never before
been attempted. The aim of this chapter is to describe the data acquisition, cleaning
and coding process of state-wide microbiology data. The following chapter will provide
details of linking these data to hospital morbidity data to investigate the aetiology of
ALRI in young children. This addresses objective 1d of the thesis. This chapter has not
been submitted for publication.
10.2 Introduction
The PathWest Laboratory Database comprises two separate data systems, the
Metropolitan Corporate Laboratory Information System, also known as ULTRA, and the
Branch Laboratory Information System (BLIS). There are a few private laboratories in
WA that conduct microbiology testing such as Western Diagnostics and Clinipath
Pathology, but these laboratories would predominantly conduct testing on samples
collected from the community in general practice surgeries. The format of ULTRA and
BLIS differs. Therefore in order to obtain data for the years relevant to the birth cohort
134
under study (births between 1996 and 2005), separate extractions were needed from
each data system. Data were only available from the year 2000 and therefore the data
extraction consisted of 6 years of data from 2000 to 2005 for children in the birth
cohort.
10.2.1 Metropolitan Corporate Laboratory Information System (ULTRA)
The ULTRA database contains information on all pathology testing conducted in the
metropolitan region on specimens collected at over 50 PathWest specimen collection
centres and all public hospitals. However all PCR testing, all virology testing and all
serology from specimens collected throughout WA is conducted at the central
PathWest site at Queen Elizabeth II Medical Centre in metropolitan Perth. Therefore
although ULTRA primarily contains records from metropolitan Perth, it also contains
PCR, serology and virus identification records from all metropolitan, rural and remote
locations in WA.
10.2.2 Branch Laboratory Information System
BLIS is historically the database used to store pathology records from rural and remote
locations in WA and contains data from numerous PathWest laboratories in remote and
rural areas (Figure 10.1). Several BLIS archival databases from each regional
collection centre were integrated into one BLIS dataset for the purposes of this project.
The data we extracted from the BLIS dataset only included information on bacterial
culture collected from children in rural and remote locations of WA.
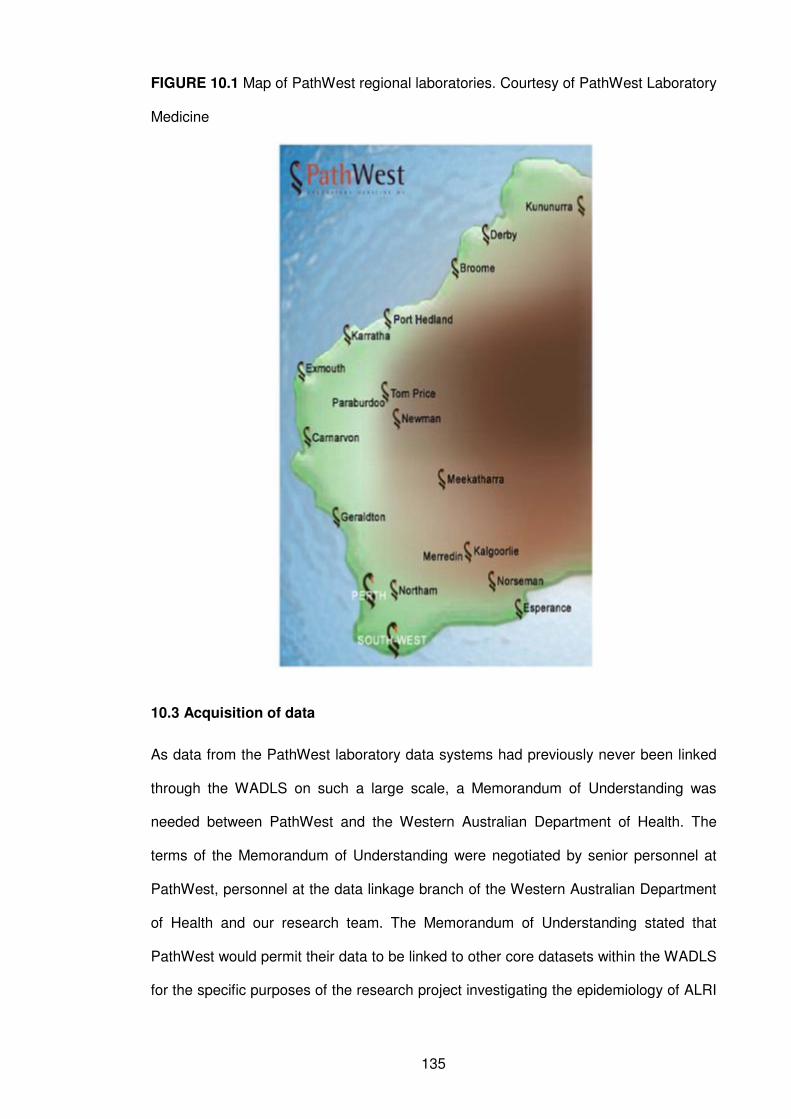
135
FIGURE 10.1 Map of PathWest regional laboratories. Courtesy of PathWest Laboratory
Medicine
10.3 Acquisition of data
As data from the PathWest laboratory data systems had previously never been linked
through the WADLS on such a large scale, a Memorandum of Understanding was
needed between PathWest and the Western Australian Department of Health. The
terms of the Memorandum of Understanding were negotiated by senior personnel at
PathWest, personnel at the data linkage branch of the Western Australian Department
of Health and our research team. The Memorandum of Understanding stated that
PathWest would permit their data to be linked to other core datasets within the WADLS
for the specific purposes of the research project investigating the epidemiology of ALRI
136
in WA children born 1996-2005. Once the Memorandum of Understanding was signed
off, the process of extracting and linking data could commence.
Data personnel at PathWest identified the laboratory records of interest from the
relevant ULTRA and BLIS data systems through a combination of test name and
specimen description. This included all investigations for respiratory infections from
NPAs, nasal washes, nasal swabs, throat swabs, bronchial washings, blood, sputum,
cerebrospinal fluid, lung tissue and pleural fluid. Once these records were identified,
the demographic details were extracted and sent to the WA data linkage branch for
linkage to the other datasets as outlined in Chapter 4, using the well-established best-
practice linkage approach.208 After linkage, a unique identifier key was added to the
demographic data. This unique identifier key would allow matching of laboratory
records to records from the birth cohort datasets and the hospital morbidity dataset that
have been used in Chapters 5, 6 and 7. Details of the outcomes of this linkage are
provided in Chapter 11.
The unique identifier key was then added to the records extracted by the data manager
at PathWest and the identifying demographic details, such as name and address were
removed. The resultant de-identified dataset containing data from the UTLRA and BLIS
data systems was then given to me in Microsoft Access format.
10.4 Data cleaning
10.4.1 Description of data
The data cleaning process is shown in Figure 10.2. Records were selected from
children born in WA between 1st January 1996 and 31st December 2005 in order to
represent laboratory records from the retrospective birth cohort. The ULTRA data
consisted of a combination of free text fields and alpha numeric codes with multiple
records per specimen collection. As each new line of text was written on a medical
137
laboratory report, a new record was generated. Several fields contained information
relating to what specimen was collected, the laboratory detection method used and the
pathogen that was identified. These fields were:
• panel code indicating the main grouping test code (eg “JTC” for viral culture)
• panel description detailing the name or description of the panel code
• item description which detailed the specific test item
• alpha result which was either an organism identifier code or free text to indicate
if an organism in the item description field had been detected or not detected
• alpha description which was a free text description of the alpha result code
There was also a numeric result field in which a numeric value would be entered if
required. This dataset also contained records for antibiotic susceptibilities. As these
data were beyond the scope of this research project, these records were removed from
the dataset (Figure 10.2).
The BLIS data also consisted of a combination of alpha numeric codes and free text
fields with multiple records per specimen collection. Each record had a lab number
which was unique for each specimen collection. For each lab number there were
multiple records with result information. In each set of records there were details of
antibiotic susceptibilities, specimen description and type, appearance of the specimen,
location of where the specimen was collected, which was usually a hospital code, and
details of any bacterial organisms that were isolated by culture.
10.4.2 Episodes
As there were multiple records per specimen collection, the ULTRA data were
aggregated to form data “episodes” (Figure 10.2). This was to gather information
pertaining to the one specimen in order to code one grouped result from the numerous
result records. Initially these episodes were grouped if records had the same child
138
unique identifier (ie were from the same child), same collection date, same collection
time and same specimen location (ie hospital or PathWest centre from where specimen
was collected). This reduced the dataset from 435,285 individual records to 45,402
episodes. The average number of records per episode was 6.6 with the range of
records per episode from 1 to 102 records.
10.4.3 Development of coding guidelines
Although the format differed between the ULTRA and BLIS systems, the same principal
of developing coding guidelines applied. After the exclusion of antibiotic susceptibility
records, records containing result information were given a flag from 1 to 4 according to
the format of the result and how the result was entered across the various result and
specimen fields. Approximately 30% of the records contained provisional result
information or a cancelled test. However most of these records were contained in
episodes that had records with result information and a flag indicator so the chance of
missing any results was small. Each flag was then examined separately to develop
coding rules for that flag. Any one data episode in the ULTRA dataset could contain
records from the same flags or different flags. Predominantly, the different flags
separated records through the panel codes for the type of record, for example, those
with serology records, those with PCR records or those with an alpha result code. The
specimen type was then coded across all four different flags.
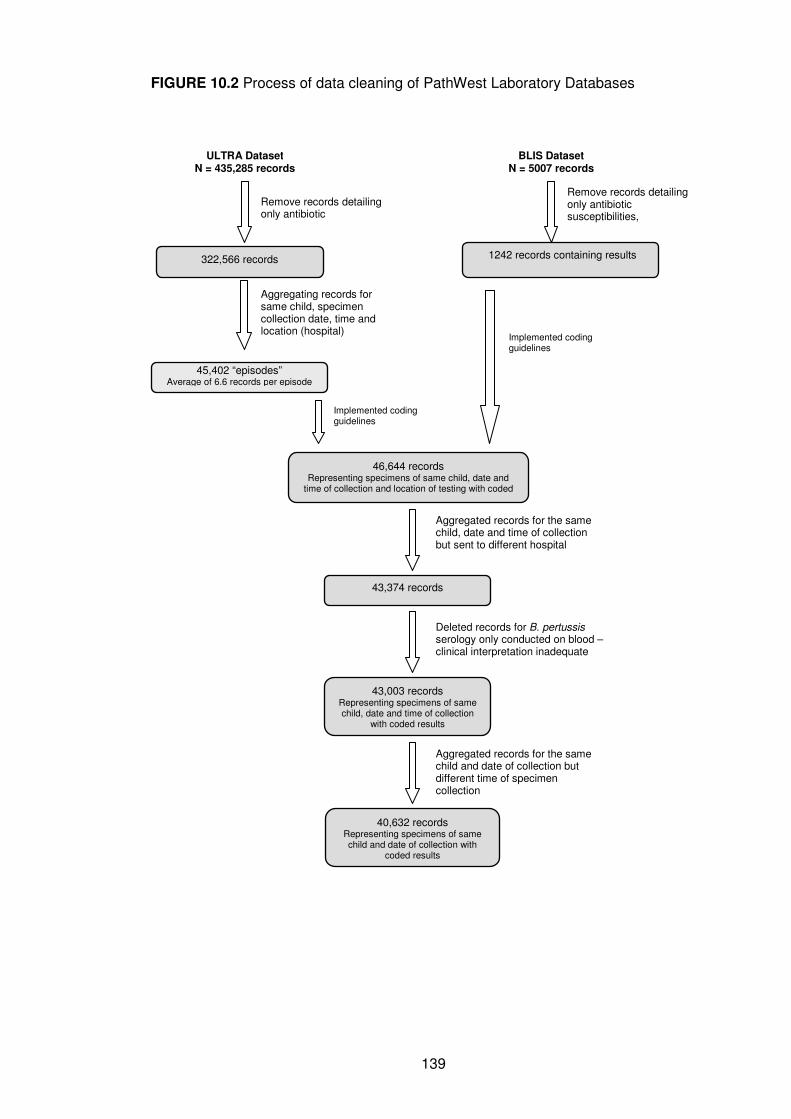
139
FIGURE 10.2 Process of data cleaning of PathWest Laboratory Databases
1242 records containing results
BLIS Dataset N = 5007 records
322,566 records
ULTRA Dataset N = 435,285 records
45,402 “episodes” Average of 6.6 records per episode
Aggregating records for same child, specimen collection date, time and location (hospital)
46,644 records Representing specimens of same child, date and
time of collection and location of testing with coded results
Remove records detailing only antibiotic
Remove records detailing only antibiotic susceptibilities, microscopy
43,374 records
Aggregated records for the same child, date and time of collection but sent to different hospital
43,003 records Representing specimens of same child, date and time of collection
with coded results
Deleted records for B. pertussis serology only conducted on blood – clinical interpretation inadequate
40,632 records Representing specimens of same child and date of collection with
coded results
Aggregated records for the same child and date of collection but different time of specimen collection
Implemented coding guidelines
Implemented coding guidelines
140
10.4.3.1 Flag 1: Serology
These records were serology results for Bordetella pertussis-specific serum
immunoglobulin A (IgA) and Chlamydia pneumoniae-specific immunoglobulin G (IgG)
and accounted for less than 2% of all the records. The numeric result field contained
the titre of IgA or IgG antibodies that were detected. Laboratory personnel at PathWest
supplied the numeric cut-off points for a positive identification and assisted in the
interpretation of these results. These cut-off points varied according to the year of
specimen collection as laboratory techniques and tests changed between 2000 and
2005. Only those results that were above the cut-off points were coded as a positive
identification while those below the cut-off points were coded as negative. Very few
results fell into an indeterminate range (ie between the two cut-off points) and therefore
were not coded.
It was later determined that B. pertussis identification from serology in a blood
specimen was not an accurate measure of active B. pertussis infection. Therefore,
records coded only for B. pertussis serology from a blood specimen were removed
from the dataset as shown in Figure 10.2. Identification of B. pertussis from serology
through an upper respiratory specimen, such as an NPA, was deemed appropriate for
accurate identification and therefore those records remained in the dataset.
10.4.3.2 Flag 2: Complement Fixation Testing
These records accounted for 2% of all the records in the database. The item
description contained the name of the pathogen under investigation, eg “Adeno CFT”
and the alpha result field contained either the text “NOT Detected” or a numeric result
representing antibody titres. If the numeric result was 160 or above, the pathogen was
coded as identified. If the numeric result was less than 160, the pathogen was coded
as not identified.
141
10.4.3.3 Flag 3: Viral PCR
These records accounted for approximately 9% of all the records and were the most
straightforward of results to code. The item description field indicated the record was a
PCR result and what pathogen was being investigated, eg “Influenza A RNA PCR”.
The alpha result code for these records was either “Detected” if there was positive
identification or “NOT Detected” if there was no positive identification.
10.4.3.4 Flag 4: Alpha result code
These records accounted for over 50% of the records in the ULTRA dataset and were
the most complex records to code. These records were predominantly results of culture
and direct immunofluorescence. The alpha result field contained a code which
indicated whether an organism was identified or whether groups of organisms were not
identified. The alpha description field in some cases gave an interpretation of the alpha
code but this was not consistently entered. These alpha codes also indicated the
method of laboratory detection. For positive identifications, the alpha code only
indicated one pathogen, eg “GFPI2” to indicate a positive identification of parainfluenza
virus type 2 by direct immunofluorescence. However if there was not a positive
identification, the alpha code grouped results together according the standard panel of
testing. For example, alpha code “GCNV” is interpreted as no RSV, parainfluenza type
1, 2 or 3, influenza type A or B, adenovirus or cytomegalovirus identified by direct
immunofluorescence. Similarly for the alpha codes for culture, a positive alpha code
indicated only one pathogen, eg “GBOPT” for B. pertussis identified by culture, while a
negative code indicated groups of pathogens that were not identified, eg “GNP48”
meaning no Haemophilus influenzae, Moraxella catarrhalis, Streptococcus
pneumoniae, Pseudomonas aeruginosa or Stenotrophomonas maltophilia identified by
culture. Alpha codes differed across the two main laboratory sites at Princess Margaret
Hospital for Children Department of Microbiology and the central PathWest laboratory
142
at QEII Medical Centre. A total of 139 alpha codes were interpreted and were coded as
positive or negative identification for numerous viral and bacterial pathogens.
The BLIS dataset contained bacterial culture records in a similar format to the records
in Flag 4 except that free text was used instead of alpha codes to identify the original
organism. As there were fewer records in this dataset (approximately 1242), all the
possible entries of the free text field were examined and coded. Group negative results
were coded in a similar fashion, eg “Pathogenic organisms not isolated” was
interpreted as no identification of S. pneumoniae, M. catarrhalis, H. influenzae and
Staphylococcus aureus by culture.
10.4.3.5 Specimen
Information concerning the specimen that was collected for each laboratory record was
contained in several fields across both datasets and therefore extensive data
manipulation was required. There were a total of 5177 different variations in spelling for
specimen type. Each of these unique entries for specimen were coded and grouped
into 10 specimen groupings as shown in Table 10.1. Records relating to postmortem
specimens, liver specimens, gastric aspirates, mouth swabs, bone marrow, intestines
and eyelid swabs were removed from the dataset. Some episodes contained records
from two different specimens. For these episodes, it was noted what results came from
what specimen. Specimens that were not related to respiratory infections such as
postmortem samples, heart, liver, urine, bone marrow, gastric aspirates, eyelid swabs,
ear fluid, mouth swab and salivary gland were removed from the dataset along with
their result information as they were deemed not appropriate for the aims of the
research project.
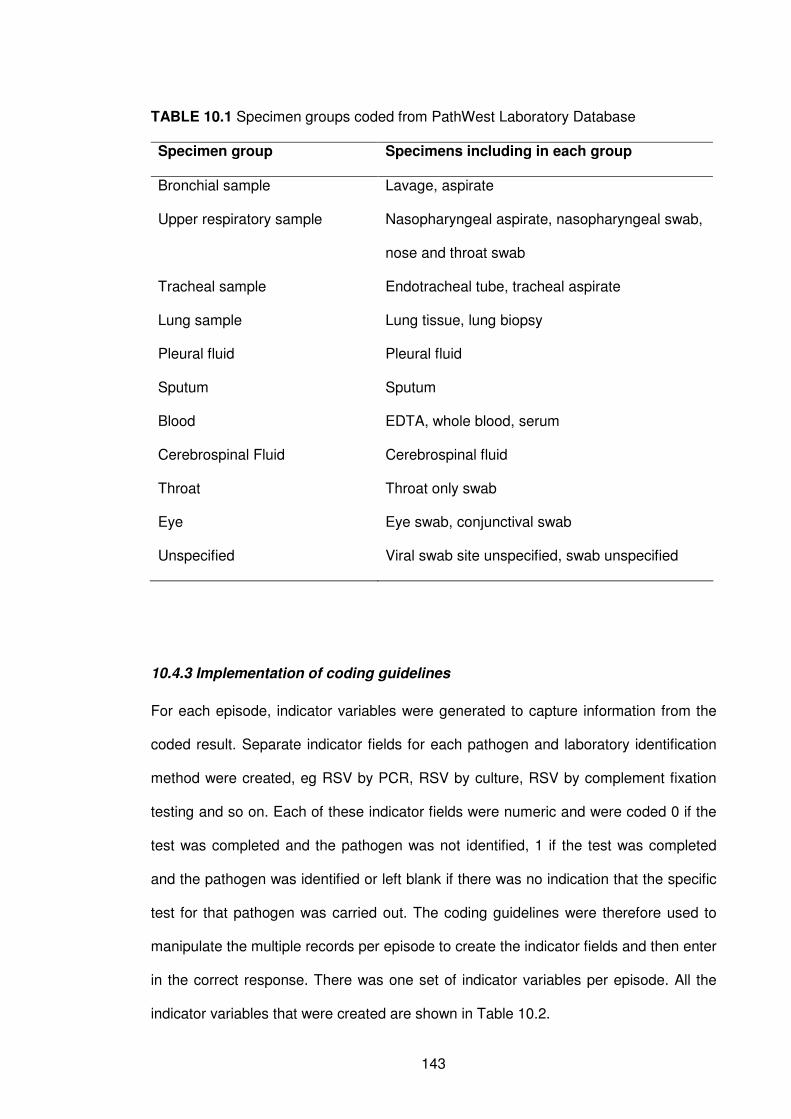
143
TABLE 10.1 Specimen groups coded from PathWest Laboratory Database
Specimen group Specimens including in each group
Bronchial sample Lavage, aspirate
Upper respiratory sample Nasopharyngeal aspirate, nasopharyngeal swab,
nose and throat swab
Tracheal sample Endotracheal tube, tracheal aspirate
Lung sample Lung tissue, lung biopsy
Pleural fluid Pleural fluid
Sputum Sputum
Blood EDTA, whole blood, serum
Cerebrospinal Fluid Cerebrospinal fluid
Throat Throat only swab
Eye Eye swab, conjunctival swab
Unspecified Viral swab site unspecified, swab unspecified
10.4.3 Implementation of coding guidelines
For each episode, indicator variables were generated to capture information from the
coded result. Separate indicator fields for each pathogen and laboratory identification
method were created, eg RSV by PCR, RSV by culture, RSV by complement fixation
testing and so on. Each of these indicator fields were numeric and were coded 0 if the
test was completed and the pathogen was not identified, 1 if the test was completed
and the pathogen was identified or left blank if there was no indication that the specific
test for that pathogen was carried out. The coding guidelines were therefore used to
manipulate the multiple records per episode to create the indicator fields and then enter
in the correct response. There was one set of indicator variables per episode. All the
indicator variables that were created are shown in Table 10.2.
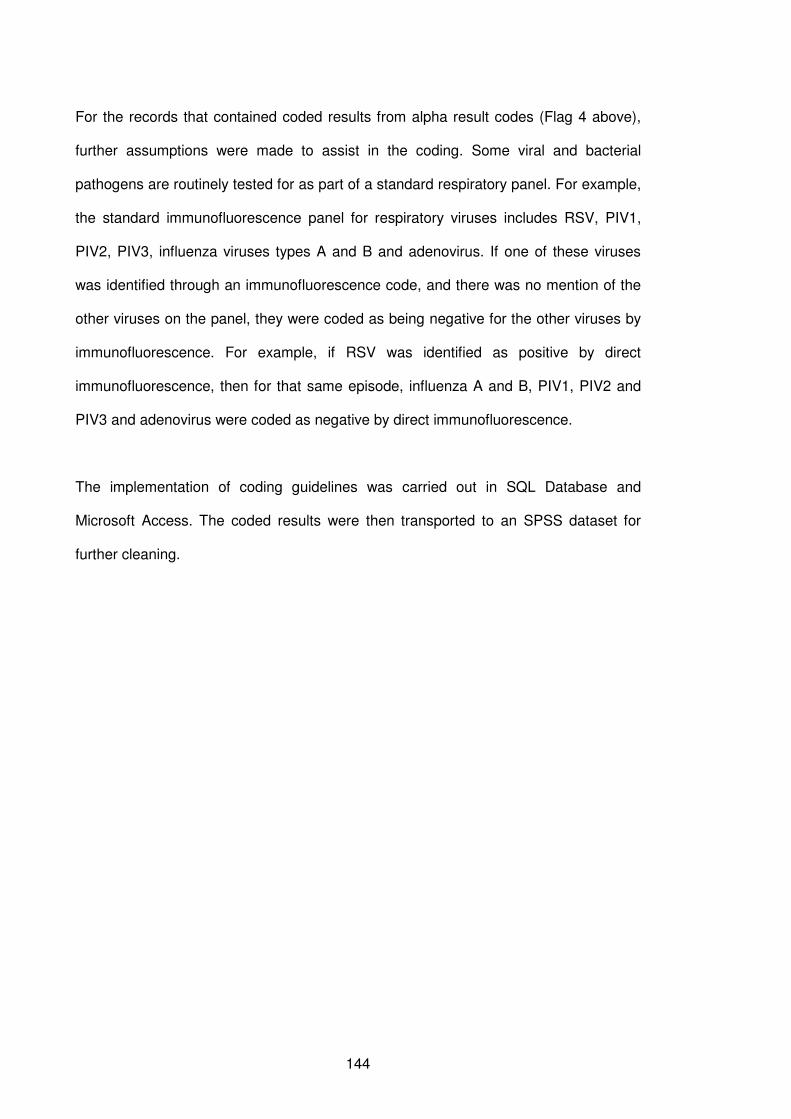
144
For the records that contained coded results from alpha result codes (Flag 4 above),
further assumptions were made to assist in the coding. Some viral and bacterial
pathogens are routinely tested for as part of a standard respiratory panel. For example,
the standard immunofluorescence panel for respiratory viruses includes RSV, PIV1,
PIV2, PIV3, influenza viruses types A and B and adenovirus. If one of these viruses
was identified through an immunofluorescence code, and there was no mention of the
other viruses on the panel, they were coded as being negative for the other viruses by
immunofluorescence. For example, if RSV was identified as positive by direct
immunofluorescence, then for that same episode, influenza A and B, PIV1, PIV2 and
PIV3 and adenovirus were coded as negative by direct immunofluorescence.
The implementation of coding guidelines was carried out in SQL Database and
Microsoft Access. The coded results were then transported to an SPSS dataset for
further cleaning.
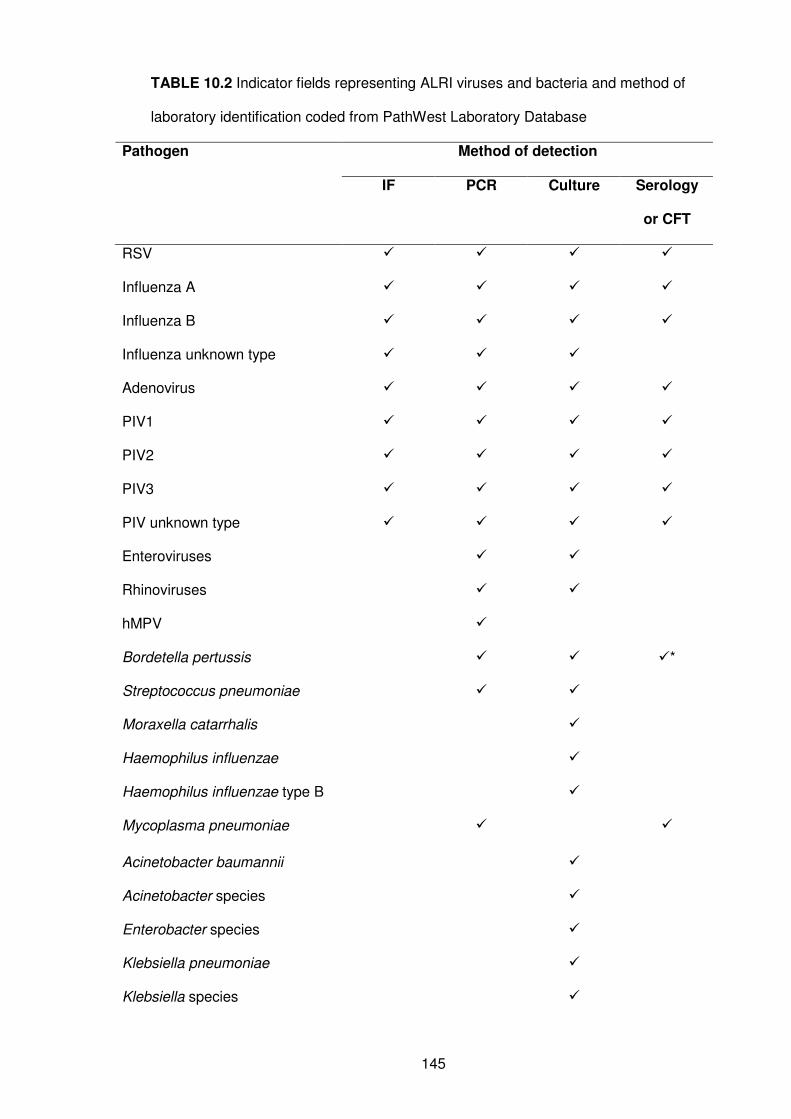
145
TABLE 10.2 Indicator fields representing ALRI viruses and bacteria and method of
laboratory identification coded from PathWest Laboratory Database
Method of detection Pathogen
IF PCR Culture Serology
or CFT
RSV � � � �
Influenza A � � � �
Influenza B � � � �
Influenza unknown type � � �
Adenovirus � � � �
PIV1 � � � �
PIV2 � � � �
PIV3 � � � �
PIV unknown type � � � �
Enteroviruses � �
Rhinoviruses � �
hMPV �
Bordetella pertussis � � �*
Streptococcus pneumoniae � �
Moraxella catarrhalis �
Haemophilus influenzae �
Haemophilus influenzae type B �
Mycoplasma pneumoniae � �
Acinetobacter baumannii �
Acinetobacter species �
Enterobacter species �
Klebsiella pneumoniae �
Klebsiella species �
146
Method of detection Pathogen
IF PCR Culture Serology
or CFT
Staphylococcus aureus �
Group A Streptococcus �
Group B Streptococcus �
Group C Streptococcus �
Group G Streptococcus �
Beta-haemolytic or Alpha-
haemolytic Streptococcus
�
Other Streptococcus �
Pseudomonas aeruginosa �
Stenotrophomonas maltophilia �
Coagulase-negative
Staphylococcus
�
IF, direct immunofluorescence; PCR, Polymerase chain reaction; CFT, Complement
fixation testing
*B. pertussis serology only from NPA
10.5 Results
After implementation of the coding guidelines, the coded results from the ULTRA
dataset and BLIS dataset were merged to form a dataset of 46,644 records. These
records represented laboratory specimens and results that were collected from a child
with the same date and time of collection and location of testing. An NPA collected at a
specific time could be sent to the microbiology department at Princess Margaret
Hospital for immunofluorescence testing and then an aliquot of the specimen could be
147
sent to the central PathWest laboratory at QEII Medical Centre for PCR testing. These
were represented as two episodes in the dataset but clearly represent only one
episode. Data manipulation was then conducted to merge these records together to
form one comprehensive record per specimen collected from a particular child at a
particular time and date. This reduced the records from 46, 644 to 43,374 (Figure
10.1). After removal of B. pertussis serology records from blood specimens, 43,003
records remained.
Of these records 89.7% had at least one entry for one of the indicator fields
representing a coded result. This left 10.3% of records which did not have a coded
result for the viruses and bacteria listed in Table 10.2 and considered to be important
ALRI pathogens. These records are most likely laboratory tests that were ordered but
were then cancelled or the result was indeterminate and therefore could not be coded.
Of the 38,559 records with a coded result, 18,611 (48.3%) consisted of results from
one test (eg. one direct immunofluorescence test) and 13,837 (35.9%) consisted of
results from two tests (eg. direct immunofluorescence and PCR test) while the
remaining 6111 records consisted of results from more than two tests.
As bacterial culture results could mean nasopharyngeal carriage if bacteria were
identified from an upper respiratory sample or invasive disease if identified from a
normally sterile site such as blood, pleural fluid or cerebrospinal fluid, further cleaning
of results was required. Taking into account the laboratory identification method used
and the specimen type, sterile and non-sterile sites for bacterial culture were
determined and for most of the bacterial pathogens, additional indicator variables were
created to identify if the specimen came from a sterile site or not. A result from a sterile
site was indicated if the result was derived from a blood culture, PCR on blood, any test
of pleural fluid and any test on cerebrospinal fluid. Of the 43,003 records in the dataset,
515 (1.2%) of records were from a sterile site. This was lower than expected. Possible
reasons for this low number of records are discussed in Chapter 11.
148
10.6 Conclusions
Data extraction, cleaning and coding was a lengthy process which required a
multidisciplinary effort. This process involved consultation with data programmers,
senior personnel within PathWest and the Western Australian Department of Health,
and laboratory personnel from both the Princess Margaret Hospital site and central
PathWest site at QEII Medical Centre. As this was the first time such a task had been
undertaken, care was taken in the cleaning process to document procedures and
therefore the creation of coding guidelines and their implementation took considerable
time to develop and validate. For future data extractions and linkages from PathWest
laboratory databases, it is hoped that the lessons learnt here and the coding guidelines
developed will expedite the process and will be of considerable value to other students,
clinicians and researchers.
149
CHAPTER 11
Aetiology of ALRI Part III:
Use of data linkage to investigate the aetiology of acute
lower respiratory infection hospitalisations in children
150
11.1 Preamble
In this chapter I link the statewide PathWest cleaned and coded laboratory data
discussed in Chapter 10 to the hospital admissions dataset discussed in Chapters 4, 5,
6 and 7 to provide a general overview of the aetiology of ALRI hospitalisations in WA
children. This addresses objective 1d of the thesis. Hospitalisation data for ALRI
admissions from 2000 to 2005 were linked to the laboratory data and the predictors of
successful linkage were examined. Subsequent analyses documenting the proportion
of ALRI hospitalisations tested and found positive for a range of respiratory pathogens
were completed on the linked dataset.
This chapter has been submitted for publication to the Journal of Paediatrics and Child
Health.
11.2 Introduction
As outlined in earlier chapters, it is known that respiratory viruses are important
contributors to ALRI and while RSV is the most common virus detected in children
aged under 5 years hospitalised for ALRI in both developed and developing
countries,30-32, 38, 39 a range of other viruses have also been implicated. These include
influenza viruses, PIV1-3, adenoviruses and more recently, hMPV.25, 26, 30-32, 37, 38 In
addition, there is increasing recognition of the potential for rhinoviruses28 and the newly
discovered coronaviruses209 to cause ALRI.
Most of the data on viral pathogens in ALRI arises from a small number of
geographically-limited prospective hospital-based studies performed over restricted
time periods, usually a single season. The number and extent of the studies is limited
by the cost and logistical problems of collecting and analysing the data. As a result, we
have a lack of information about the longer term impact of these viruses on paediatric
health in many countries, including Australia. Furthermore, there is a lack of population-
151
based studies documenting the aetiology of ALRI, particularly in indigenous
populations. This is despite the fact that large amounts of administrative health data
are collected routinely. Developing systems to extract, accumulate and analyse these
data has the potential to provide retrospective and prospective data over long periods
of time, over wide geographical areas, and for diverse population groups.
As demonstrated throughout this thesis, in WA we have the opportunity to link
population-based administrative health datasets using the WADLS. We now aim firstly
to examine the feasibility of linking a statewide laboratory dataset of routine respiratory
pathogen testing with statewide hospital admissions for ALRI between 2000 and 2005
in young Aboriginal and non-Aboriginal children. Secondly, we aim to provide an
overview of ALRI aetiology by documenting the proportion of ALRI-coded hospital
admissions tested for specific pathogens that have a positive identification of a
respiratory pathogen.
11.3 Methods
In WA, there is one dedicated tertiary level paediatric teaching hospital, Princess
Margaret Hospital for Children (PMH), located in the state capital Perth, where
approximately 72% of WA’s population resides. At PMH, it is standard practice to
collect nasopharyngeal aspirates (NPA) for respiratory virus detection on all children
admitted with ALRI. A similar practice occurs at many smaller metropolitan and non-
metropolitan hospitals.
11.3.1 Hospital morbidity data
For this chapter, I used data on hospital admissions for ALRI between January 2000
and December 2005 inclusive as those were the years where laboratory data were
available for linkage. Similar to chapters 5, 6 and 7, using the International
152
Classification of Diseases, 10th revision,81 a hierarchical diagnosis algorithm was
developed using the principal diagnosis (first-listed diagnosis) and 20 secondary
diagnoses ranking ALRI episodes in the following order of disease severity: whooping
cough (ICD10 A37), pneumonia (J12-J18, B59, B05.2, B37.1, B01.2), bronchiolitis
(J21), influenza (J10-J11), unspecified ALRI (J22) and bronchitis (J20).
11.3.2 Laboratory data
As explained in Chapter 10, the PathWest Laboratory Database comprises two
separate data systems: the Metropolitan Corporate Laboratory Information System, or
ULTRA, and the Branch Laboratory Information System (BLIS). The ULTRA database
contains information on all pathology testing conducted in the metropolitan region and
information concerning specimens collected for PCR testing, virology testing and
serology throughout WA. BLIS contains bacteriology data from rural and remote
PathWest laboratories in WA. Data were extracted from both the ULTRA and BLIS
systems for all children in the birth cohort who had samples collected to identify any
respiratory pathogen between 2000 and 2005. Specimens were classified as bronchial
specimens, upper respiratory specimens (NPAs and nose swabs), tracheal specimens,
pleural fluid, sputum, blood specimens, cerebrospinal fluid, throat and eye swab.
At PathWest respiratory samples received for viral testing are normally investigated for
RSV, influenza viruses A and B, adenoviruses and PIV1-3. At PMH, if a specimen is
negative for this standard respiratory panel, the specimen is then investigated for
picornaviruses and hMPV. At the central PathWest laboratory, respiratory samples
received for viral testing are routinely investigated for picornaviruses and hMPV.
Therefore, information on the identification of the following viruses were extracted:
RSV, influenza viruses A and B, adenoviruses, PIV1-3, picornaviruses (enteroviruses
and rhinoviruses only) and hMPV. Positive and negative results for virology were
recorded. Respiratory viruses were identified using one or more of the following: direct
153
immunofluorescence (all viruses except picornaviruses and hMPV), polymerase chain
reaction (PCR, all viruses) and viral culture (all viruses except hMPV). PCR testing
commenced in 2002 for picornaviruses and in 2003 for hMPV. Prior to those dates
rhinoviruses were identified by cell culture, while hMPV could not be detected.
Enteroviruses and rhinoviruses were combined as picornaviruses as the PCR methods
in use did not accurately distinguish between the two groups.
Following request by the treating clinician for bacterial culture, pathogens including
Streptococcus pneumoniae, Streptococcus pyogenes, Moraxella catarrhalis,
Haemophilus influenzae, Staphylococcus aureus, Pseudomonas aeruginosa, and
Enterobacteriaceae were isolated and identified.198 As explained in the previous
chapter, positive bacterial identifications were coded separately if identified from a
sterile site and only bacterial cultures from a sterile site were included in analysis
documenting the aetiology of ALRI. S. pneumoniae was also detected by PCR from a
sterile specimen, such as blood, pleural fluid or cerebrospinal fluid. PCR, or the
detection of Bordetella pertussis-specific IgA in nasal secretions or culture were used
to detect B. pertussis.210 These diagnostic methods have been consistently performed
between 2000 and 2005. Mycoplasma pneumoniae was detected by PCR from NPA.
However, tests for these two bacterial species were only performed when specifically
requested.
11.3.3 Data linkage and statistical analysis
Hospital and laboratory data were linked through a unique child identifier key provided
by WADLS. Records pertaining to the same child were linked if the specimen collection
date on the laboratory record was within 48 hours of the hospital admission date. This
was to ensure that we included specimens collected as an outpatient or in emergency
departments before admission as well as those collected shortly after admission.
Samples collected more than 48 hours after admission were not included as positive
results may have been due to nosocomial infection.
154
We investigated the proportion of successfully linked hospital and laboratory records
for various demographic characteristics and used a logistic regression model to
determine the factors that predicted successful linkage between laboratory episodes
and hospital admissions. We report on odds ratios (ORs) with 95% confidence intervals
(CIs). Further analyses were then conducted on the dataset that only contained linked
hospital and laboratory records. Laboratory data indicated whether specimens were
tested for relevant pathogens and whether the pathogens were identified or not. To
account for different testing procedures at the various laboratories, we calculated the
proportion of samples tested that were positive for a particular pathogen. Proportions
were compared with the chi-squared test and 2-sided p-values are reported.
11.4 Results
11.4.1 Overall laboratory data linkage
A total of 19,857 hospital admissions for ALRI were identified between 2000 and 2005.
Just under half (n=8980; 45.2%) of these admissions could be linked to a laboratory
record. The characteristics of hospital admissions according to successful laboratory
linkage are shown in Table 11.1. The hospital admissions that linked to a laboratory
record had a longer length of stay in hospital (mean 4.3 days) than admissions that did
not link to a laboratory record (mean 3.2 days; z=5.94, p<0.001). In a multiple logistic
regression analysis adjusted for length of stay, Aboriginal children, males, admissions
to a private hospital, admissions from rural and remote areas and children aged 6
months or more were less likely to have a linked laboratory record. Linkage improved
over time with 40% of hospitalisations in 2000 linking to a laboratory record, compared
with 50% in 2005 (Table 11.1). The majority of admissions in the metropolitan area
were in non-Aboriginal children (89.0%) whereas hospital admissions in remote areas
were predominantly Aboriginal children (68.1%).
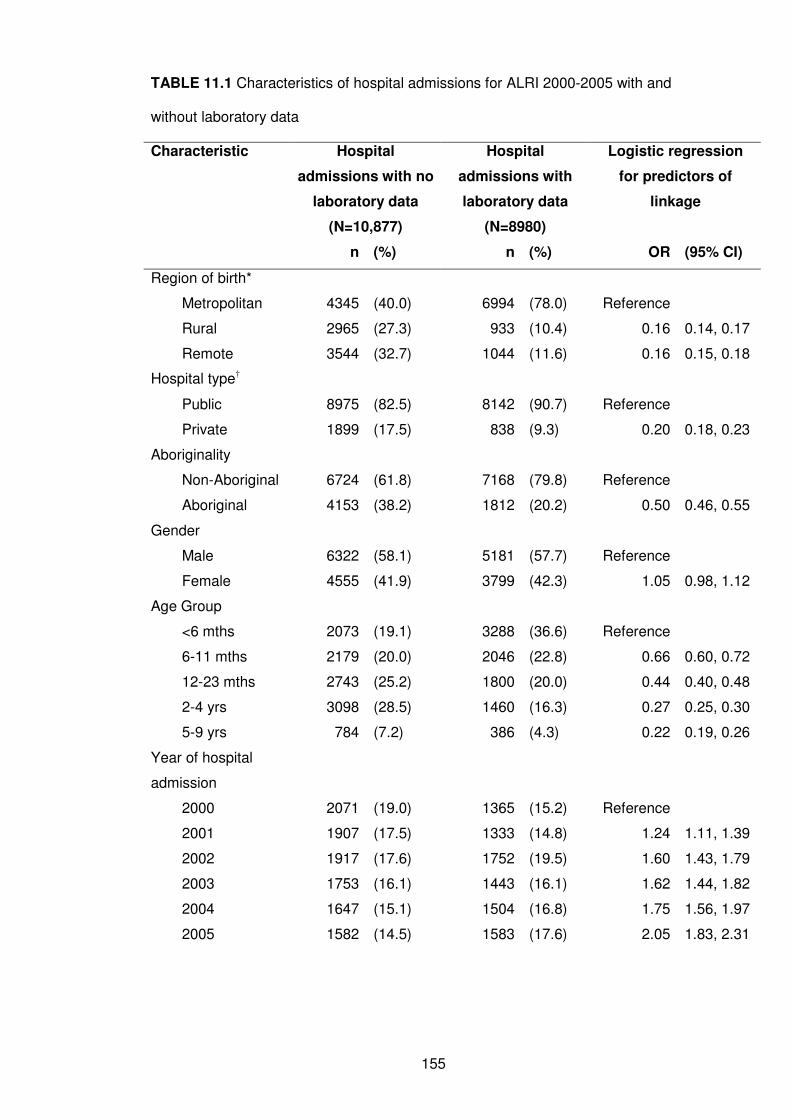
155
TABLE 11.1 Characteristics of hospital admissions for ALRI 2000-2005 with and
without laboratory data
Characteristic Hospital
admissions with no
laboratory data
(N=10,877)
Hospital
admissions with
laboratory data
(N=8980)
Logistic regression
for predictors of
linkage
n (%) n (%) OR (95% CI)
Region of birth*
Metropolitan 4345 (40.0) 6994 (78.0) Reference
Rural 2965 (27.3) 933 (10.4) 0.16 0.14, 0.17
Remote 3544 (32.7) 1044 (11.6) 0.16 0.15, 0.18
Hospital type†
Public 8975 (82.5) 8142 (90.7) Reference
Private 1899 (17.5) 838 (9.3) 0.20 0.18, 0.23
Aboriginality
Non-Aboriginal 6724 (61.8) 7168 (79.8) Reference
Aboriginal 4153 (38.2) 1812 (20.2) 0.50 0.46, 0.55
Gender
Male 6322 (58.1) 5181 (57.7) Reference
Female 4555 (41.9) 3799 (42.3) 1.05 0.98, 1.12
Age Group
<6 mths 2073 (19.1) 3288 (36.6) Reference
6-11 mths 2179 (20.0) 2046 (22.8) 0.66 0.60, 0.72
12-23 mths 2743 (25.2) 1800 (20.0) 0.44 0.40, 0.48
2-4 yrs 3098 (28.5) 1460 (16.3) 0.27 0.25, 0.30
5-9 yrs 784 (7.2) 386 (4.3) 0.22 0.19, 0.26
Year of hospital
admission
2000 2071 (19.0) 1365 (15.2) Reference
2001 1907 (17.5) 1333 (14.8) 1.24 1.11, 1.39
2002 1917 (17.6) 1752 (19.5) 1.60 1.43, 1.79
2003 1753 (16.1) 1443 (16.1) 1.62 1.44, 1.82
2004 1647 (15.1) 1504 (16.8) 1.75 1.56, 1.97
2005 1582 (14.5) 1583 (17.6) 2.05 1.83, 2.31
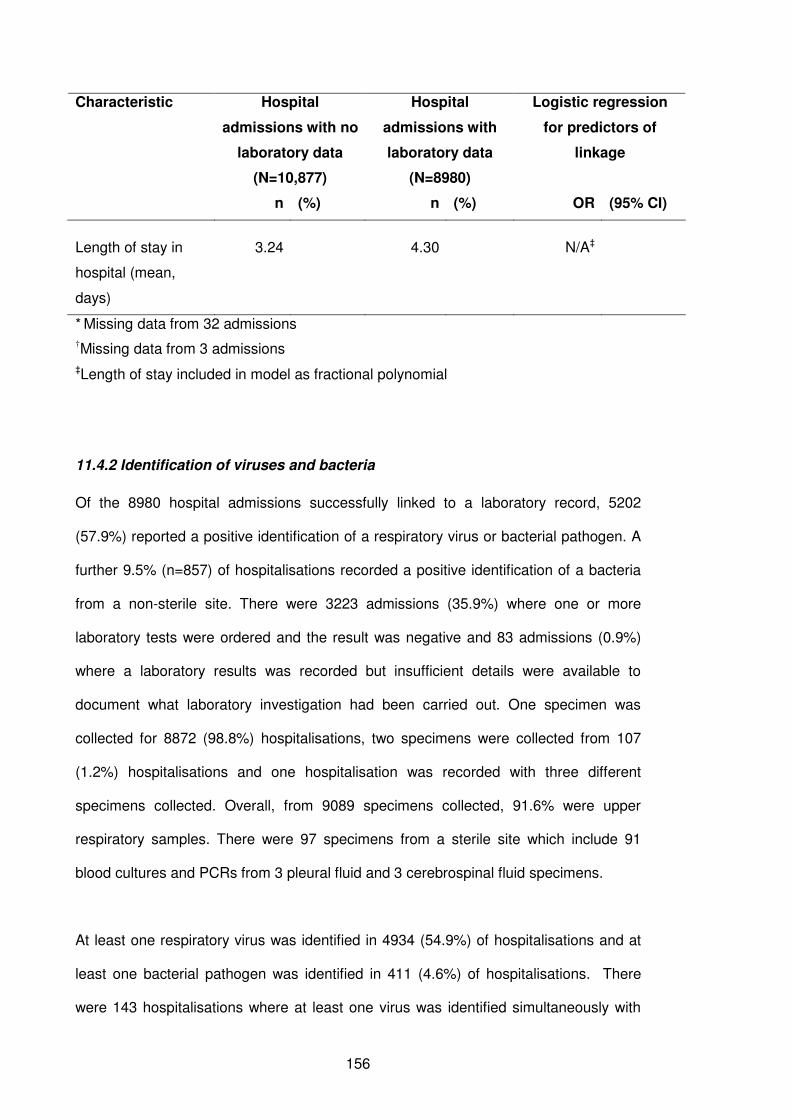
156
Characteristic Hospital
admissions with no
laboratory data
(N=10,877)
Hospital
admissions with
laboratory data
(N=8980)
Logistic regression
for predictors of
linkage
n (%) n (%) OR (95% CI)
Length of stay in
hospital (mean,
days)
3.24 4.30 N/A‡
* Missing data from 32 admissions
†Missing data from 3 admissions
‡Length of stay included in model as fractional polynomial
11.4.2 Identification of viruses and bacteria
Of the 8980 hospital admissions successfully linked to a laboratory record, 5202
(57.9%) reported a positive identification of a respiratory virus or bacterial pathogen. A
further 9.5% (n=857) of hospitalisations recorded a positive identification of a bacteria
from a non-sterile site. There were 3223 admissions (35.9%) where one or more
laboratory tests were ordered and the result was negative and 83 admissions (0.9%)
where a laboratory results was recorded but insufficient details were available to
document what laboratory investigation had been carried out. One specimen was
collected for 8872 (98.8%) hospitalisations, two specimens were collected from 107
(1.2%) hospitalisations and one hospitalisation was recorded with three different
specimens collected. Overall, from 9089 specimens collected, 91.6% were upper
respiratory samples. There were 97 specimens from a sterile site which include 91
blood cultures and PCRs from 3 pleural fluid and 3 cerebrospinal fluid specimens.
At least one respiratory virus was identified in 4934 (54.9%) of hospitalisations and at
least one bacterial pathogen was identified in 411 (4.6%) of hospitalisations. There
were 143 hospitalisations where at least one virus was identified simultaneously with
157
one bacterial pathogen, representing 2.7% of hospitalisations with a positive result.
Overall, a higher proportion of hospitalisations for ALRI in non-Aboriginal children had a
positive laboratory result than Aboriginal children (χ2 =12.23, 2 d.f., p=0.02; Table
11.2). There was also a significant decline in the proportion of specimens found
positive with age (χ2 =402.56, 8 d.f., p <0.001). Of children aged less than 6 months,
75.4% had a positive result from the laboratory record compared to 61.8% of children
aged 6-11 months and 55.3% of children aged 12-23 months at the time of
hospitalisation (Table 11.2).
The number of specimens tested for each pathogen and found positive is shown in
Figure 11.1. For all ALRI admissions, the most frequently identified respiratory
pathogens were RSV (n=3226), influenza viruses (n=664), B. pertussis (n=354), PIV3
(n=348) and picornaviruses (n=292; Figure 11.1 and Table 11.3). Overall, RSV was
identified more often in non-Aboriginal children than Aboriginal children hospitalised for
ALRI for whom a test was requested (41.4% vs 32.0%; χ2=48.5, 1 d.f., p<0.001). This
was also noted for hMPV (14.4% vs 8.8%; χ2=8.41, 1 d.f., p=0.003). However a higher
proportion of adenoviruses and picornaviruses were identified in hospitalisations from
Aboriginal children (adenovirus: 5.0% vs 2.2% in non-Aboriginal children; χ2=36.7, 1
d.f., p<0.001 and picornaviruses: 26.0% vs 20.5% in non-Aboriginal children; χ2=5.05,
1 d.f., p=0.03). B. pertussis was identified in 21.3% of hospitalisations where B.
pertussis testing was requested and the proportion identified was higher in non-
Aboriginal children than in Aboriginal children (23.6% vs 14.9%; χ2 =14.9, 1 d.f.,
p<0.001).
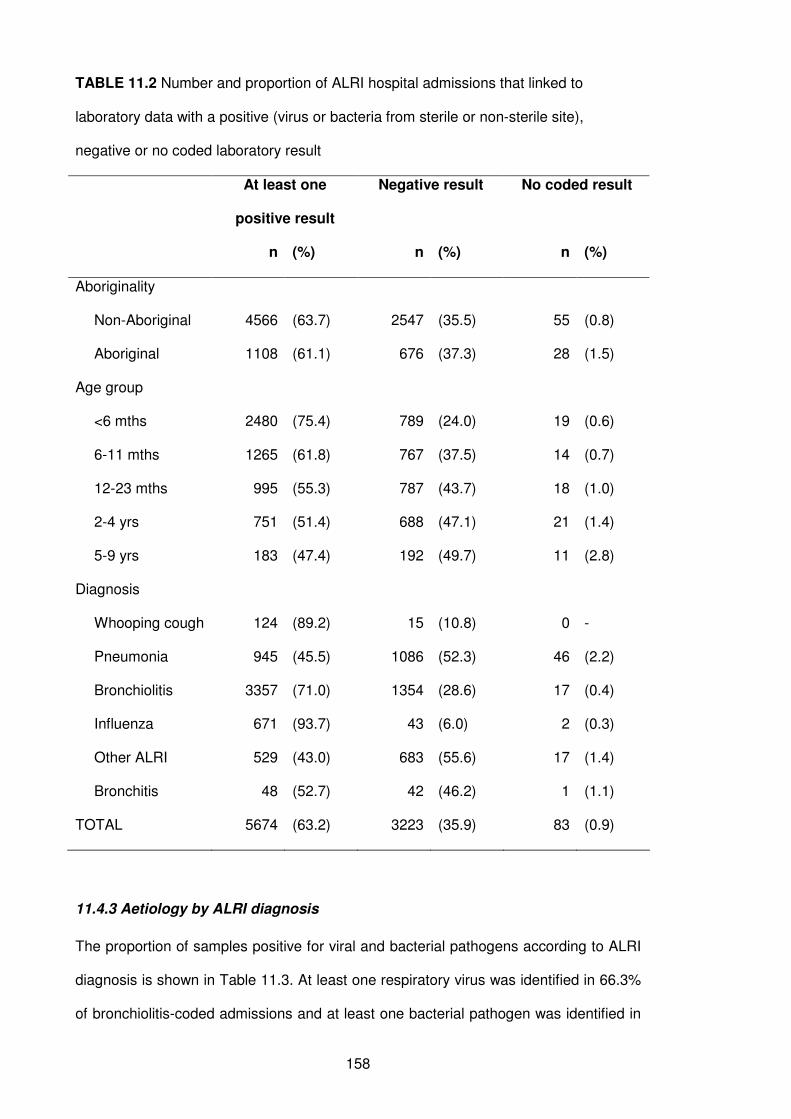
158
TABLE 11.2 Number and proportion of ALRI hospital admissions that linked to
laboratory data with a positive (virus or bacteria from sterile or non-sterile site),
negative or no coded laboratory result
At least one
positive result
Negative result No coded result
n (%) n (%) n (%)
Aboriginality
Non-Aboriginal 4566 (63.7) 2547 (35.5) 55 (0.8)
Aboriginal 1108 (61.1) 676 (37.3) 28 (1.5)
Age group
<6 mths 2480 (75.4) 789 (24.0) 19 (0.6)
6-11 mths 1265 (61.8) 767 (37.5) 14 (0.7)
12-23 mths 995 (55.3) 787 (43.7) 18 (1.0)
2-4 yrs 751 (51.4) 688 (47.1) 21 (1.4)
5-9 yrs 183 (47.4) 192 (49.7) 11 (2.8)
Diagnosis
Whooping cough 124 (89.2) 15 (10.8) 0 -
Pneumonia 945 (45.5) 1086 (52.3) 46 (2.2)
Bronchiolitis 3357 (71.0) 1354 (28.6) 17 (0.4)
Influenza 671 (93.7) 43 (6.0) 2 (0.3)
Other ALRI 529 (43.0) 683 (55.6) 17 (1.4)
Bronchitis 48 (52.7) 42 (46.2) 1 (1.1)
TOTAL 5674 (63.2) 3223 (35.9) 83 (0.9)
11.4.3 Aetiology by ALRI diagnosis
The proportion of samples positive for viral and bacterial pathogens according to ALRI
diagnosis is shown in Table 11.3. At least one respiratory virus was identified in 66.3%
of bronchiolitis-coded admissions and at least one bacterial pathogen was identified in
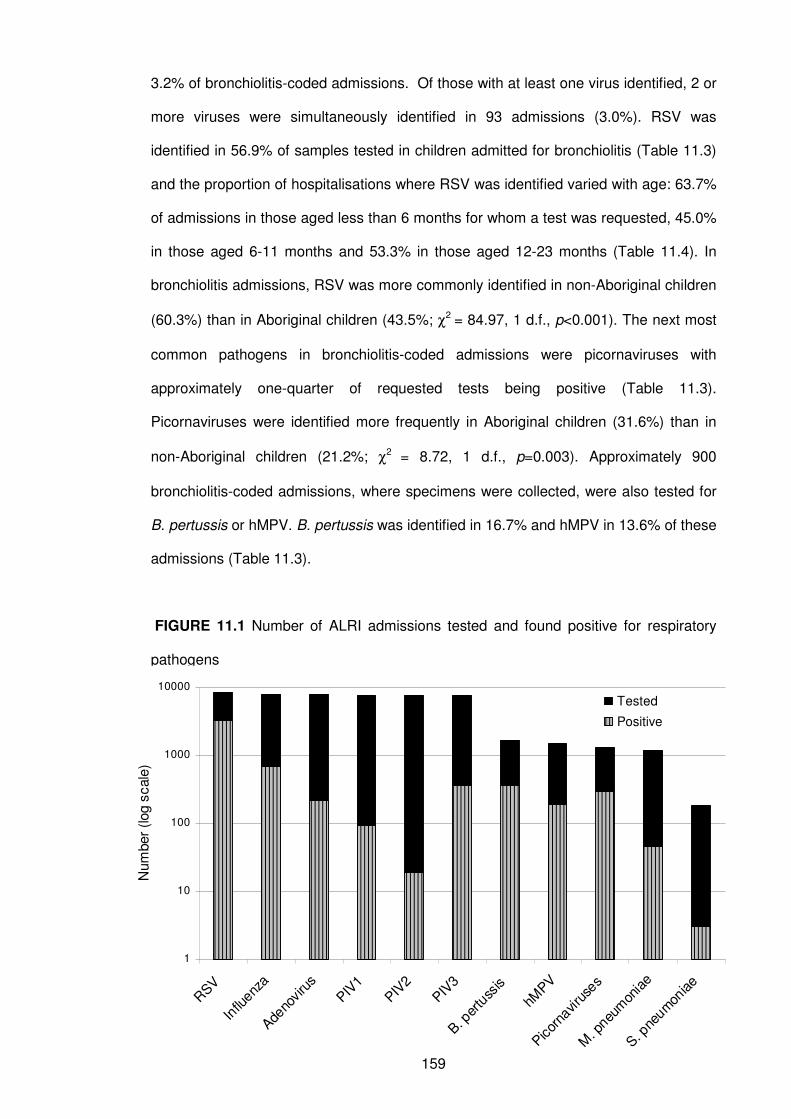
159
3.2% of bronchiolitis-coded admissions. Of those with at least one virus identified, 2 or
more viruses were simultaneously identified in 93 admissions (3.0%). RSV was
identified in 56.9% of samples tested in children admitted for bronchiolitis (Table 11.3)
and the proportion of hospitalisations where RSV was identified varied with age: 63.7%
of admissions in those aged less than 6 months for whom a test was requested, 45.0%
in those aged 6-11 months and 53.3% in those aged 12-23 months (Table 11.4). In
bronchiolitis admissions, RSV was more commonly identified in non-Aboriginal children
(60.3%) than in Aboriginal children (43.5%; χ2 = 84.97, 1 d.f., p<0.001). The next most
common pathogens in bronchiolitis-coded admissions were picornaviruses with
approximately one-quarter of requested tests being positive (Table 11.3).
Picornaviruses were identified more frequently in Aboriginal children (31.6%) than in
non-Aboriginal children (21.2%; χ2 = 8.72, 1 d.f., p=0.003). Approximately 900
bronchiolitis-coded admissions, where specimens were collected, were also tested for
B. pertussis or hMPV. B. pertussis was identified in 16.7% and hMPV in 13.6% of these
admissions (Table 11.3).
FIGURE 11.1 Number of ALRI admissions tested and found positive for respiratory
pathogens
1
10
100
1000
10000
RSV
Influ
enza
Adeno
viru
s
PIV1
PIV2
PIV3
B. per
tuss
is
hMPV
Picor
naviru
ses
M. p
neum
onia
e
S. pne
umon
iae
Num
ber
(log s
cale
)
Tested
Positive
160
At least one virus was identified in one third of pneumonia admissions and at least one
bacterial pathogen in 4.1%, RSV being the predominant pathogen (25.8%; Table 11.3).
The proportion positive of different pathogens identified in pneumonia-coded
admissions varied with age, however RSV was the most commonly identified pathogen
across all age groups (Table 11.5). In those aged 12-23 months, S. pneumoniae from a
sterile site was identified in 8.8% of admissions (all of which were in Aboriginal
children) where a test was ordered, but there were no positive bacterial identifications
in other age groups. Adenoviruses were identified more frequently in pneumonia
admissions in Aboriginal children than in non-Aboriginal children (5.0% vs 2.8%; χ2 =
4.04, 1 d.f., p=0.04).
An influenza virus was identified in 81.6% of influenza-coded admissions across all age
groups. Influenza virus A was more commonly identified than influenza virus B (Table
11.3). A small proportion of influenza-coded admissions (9%) were tested for B.
pertussis and found positive in 22.2% of these admissions. PIV3 was identified in 8.6%
of influenza-coded admissions (Table 11.3). B. pertussis was identified in 86.8% of
whooping cough admissions tested for B. pertussis (93% of whooping cough
admissions). Other pathogens identified in whooping cough-coded admissions were
picornaviruses, RSV and PIV3. The most common pathogens identified in unspecified
ALRIs and bronchitis for which tests were requested were RSV, PIV3, picornaviruses
and adenoviruses.
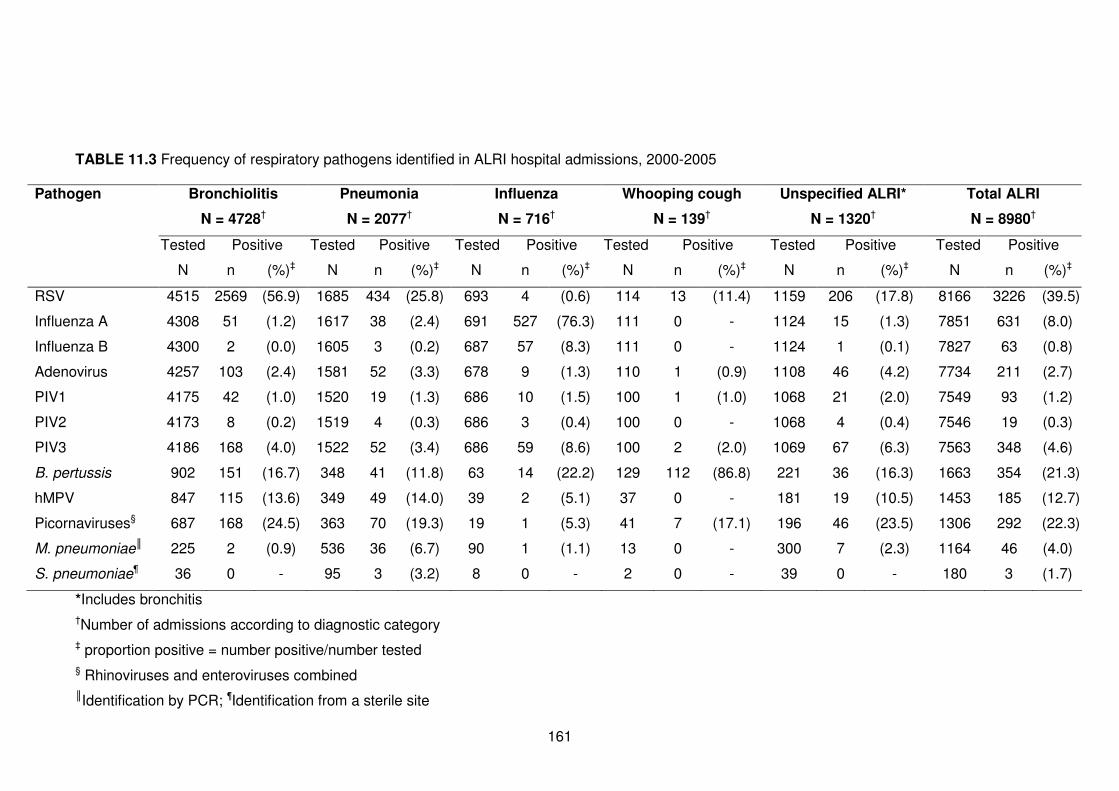
161
TABLE 11.3 Frequency of respiratory pathogens identified in ALRI hospital admissions, 2000-2005
Pathogen Bronchiolitis
N = 4728†
Pneumonia
N = 2077†
Influenza
N = 716†
Whooping cough
N = 139†
Unspecified ALRI*
N = 1320†
Total ALRI
N = 8980†
Tested Positive Tested Positive Tested Positive Tested Positive Tested Positive Tested Positive
N n (%)‡ N n (%)‡ N n (%)‡ N n (%)‡ N n (%)‡ N n (%)‡
RSV 4515 2569 (56.9) 1685 434 (25.8) 693 4 (0.6) 114 13 (11.4) 1159 206 (17.8) 8166 3226 (39.5)
Influenza A 4308 51 (1.2) 1617 38 (2.4) 691 527 (76.3) 111 0 - 1124 15 (1.3) 7851 631 (8.0)
Influenza B 4300 2 (0.0) 1605 3 (0.2) 687 57 (8.3) 111 0 - 1124 1 (0.1) 7827 63 (0.8)
Adenovirus 4257 103 (2.4) 1581 52 (3.3) 678 9 (1.3) 110 1 (0.9) 1108 46 (4.2) 7734 211 (2.7)
PIV1 4175 42 (1.0) 1520 19 (1.3) 686 10 (1.5) 100 1 (1.0) 1068 21 (2.0) 7549 93 (1.2)
PIV2 4173 8 (0.2) 1519 4 (0.3) 686 3 (0.4) 100 0 - 1068 4 (0.4) 7546 19 (0.3)
PIV3 4186 168 (4.0) 1522 52 (3.4) 686 59 (8.6) 100 2 (2.0) 1069 67 (6.3) 7563 348 (4.6)
B. pertussis 902 151 (16.7) 348 41 (11.8) 63 14 (22.2) 129 112 (86.8) 221 36 (16.3) 1663 354 (21.3)
hMPV 847 115 (13.6) 349 49 (14.0) 39 2 (5.1) 37 0 - 181 19 (10.5) 1453 185 (12.7)
Picornaviruses§ 687 168 (24.5) 363 70 (19.3) 19 1 (5.3) 41 7 (17.1) 196 46 (23.5) 1306 292 (22.3)
M. pneumoniae║ 225 2 (0.9) 536 36 (6.7) 90 1 (1.1) 13 0 - 300 7 (2.3) 1164 46 (4.0)
S. pneumoniae¶ 36 0 - 95 3 (3.2) 8 0 - 2 0 - 39 0 - 180 3 (1.7)
*Includes bronchitis
†Number of admissions according to diagnostic category
‡ proportion positive = number positive/number tested
§ Rhinoviruses and enteroviruses combined
║Identification by PCR; ¶Identification from a sterile site
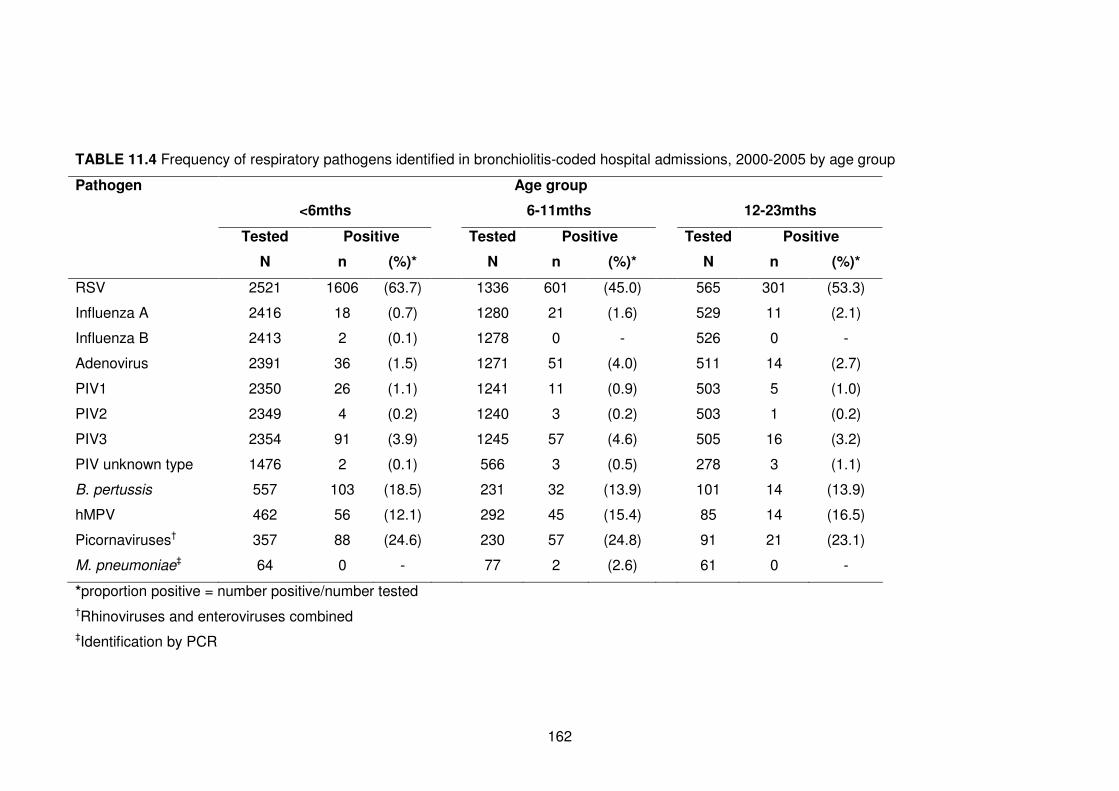
162
TABLE 11.4 Frequency of respiratory pathogens identified in bronchiolitis-coded hospital admissions, 2000-2005 by age group
Pathogen Age group
<6mths 6-11mths 12-23mths
Tested Positive Tested Positive Tested Positive
N n (%)* N n (%)* N n (%)*
RSV 2521 1606 (63.7) 1336 601 (45.0) 565 301 (53.3)
Influenza A 2416 18 (0.7) 1280 21 (1.6) 529 11 (2.1)
Influenza B 2413 2 (0.1) 1278 0 - 526 0 -
Adenovirus 2391 36 (1.5) 1271 51 (4.0) 511 14 (2.7)
PIV1 2350 26 (1.1) 1241 11 (0.9) 503 5 (1.0)
PIV2 2349 4 (0.2) 1240 3 (0.2) 503 1 (0.2)
PIV3 2354 91 (3.9) 1245 57 (4.6) 505 16 (3.2)
PIV unknown type 1476 2 (0.1) 566 3 (0.5) 278 3 (1.1)
B. pertussis 557 103 (18.5) 231 32 (13.9) 101 14 (13.9)
hMPV 462 56 (12.1) 292 45 (15.4) 85 14 (16.5)
Picornaviruses† 357 88 (24.6) 230 57 (24.8) 91 21 (23.1)
M. pneumoniae‡ 64 0 - 77 2 (2.6) 61 0 -
*proportion positive = number positive/number tested
†Rhinoviruses and enteroviruses combined
‡Identification by PCR
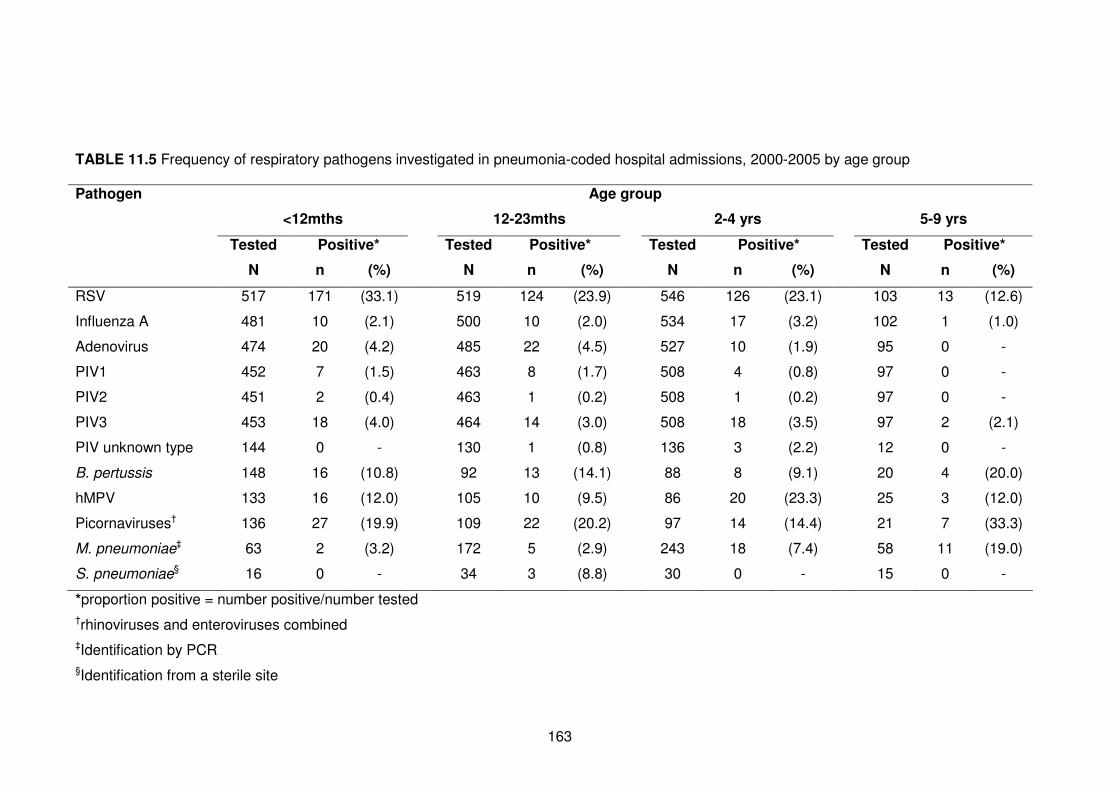
163
TABLE 11.5 Frequency of respiratory pathogens investigated in pneumonia-coded hospital admissions, 2000-2005 by age group
Pathogen Age group
<12mths 12-23mths 2-4 yrs 5-9 yrs
Tested Positive* Tested Positive* Tested Positive* Tested Positive*
N n (%) N n (%) N n (%) N n (%)
RSV 517 171 (33.1) 519 124 (23.9) 546 126 (23.1) 103 13 (12.6)
Influenza A 481 10 (2.1) 500 10 (2.0) 534 17 (3.2) 102 1 (1.0)
Adenovirus 474 20 (4.2) 485 22 (4.5) 527 10 (1.9) 95 0 -
PIV1 452 7 (1.5) 463 8 (1.7) 508 4 (0.8) 97 0 -
PIV2 451 2 (0.4) 463 1 (0.2) 508 1 (0.2) 97 0 -
PIV3 453 18 (4.0) 464 14 (3.0) 508 18 (3.5) 97 2 (2.1)
PIV unknown type 144 0 - 130 1 (0.8) 136 3 (2.2) 12 0 -
B. pertussis 148 16 (10.8) 92 13 (14.1) 88 8 (9.1) 20 4 (20.0)
hMPV 133 16 (12.0) 105 10 (9.5) 86 20 (23.3) 25 3 (12.0)
Picornaviruses† 136 27 (19.9) 109 22 (20.2) 97 14 (14.4) 21 7 (33.3)
M. pneumoniae‡ 63 2 (3.2) 172 5 (2.9) 243 18 (7.4) 58 11 (19.0)
S. pneumoniae§ 16 0 - 34 3 (8.8) 30 0 - 15 0 -
*proportion positive = number positive/number tested
†rhinoviruses and enteroviruses combined
‡Identification by PCR
§Identification from a sterile site
164
11.5 Discussion
This is the first report in Australia of population-based data linkage between a state-
wide laboratory dataset and hospital morbidity records to investigate the aetiology of
ALRI in Aboriginal and non-Aboriginal children. Just less than half of all hospital
admissions linked to a laboratory record and of those, we were able to record a result
from 99.1% of hospital records. A viral or bacterial pathogen was found in 58% of ALRI
hospitalisations. Each ALRI diagnosis had a varied aetiology but overall the most
commonly identified pathogens were RSV, influenza viruses, picornaviruses and B.
pertussis.
We were only able to link approximately half of all hospital admissions to a laboratory
record and admissions to public or metropolitan hospitals were more likely to link. In
particular, the number of blood cultures that linked to a hospital record was very low. It
is likely that blood cultures are not being routinely collected from all children admitted
with ALRI. One possibility is that we are missing laboratory data from some rural and
remote areas as there were separate BLIS data systems during the period of the study
that needed to be combined prior to analysis. A second possibility is the limited ability
to collect blood cultures from patients in rural and remote areas as we have shown that
children from the metropolitan area who were hospitalised were more likely to have a
linked laboratory record. This requires further investigation to obtain a good estimate of
the burden of invasive bacterial infection. We are, however, confident that all
specimens tested for respiratory viruses are included in our dataset. The third
possibility for the low number of blood cultures is that as approximately half of ALRI
admissions are bronchiolitis, managing clinicians may view a blood culture as
unnecessary.
It is important to note that in our study not all tests were completed on all specimens.
Although it is recommended standard practice at PMH to collect a specimen for
165
respiratory pathogen testing for a standard panel of respiratory viruses, this may not be
conducted routinely in other non-metropolitan or private hospitals. Again, this is
reflected in our findings where linkage to a laboratory record was less likely among
those admissions to a private hospital or a hospital outside the metropolitan area. Our
data include information from several laboratories over a period of five years where
tests and standard procedures may differ or change over time. However, as we have
been able to document what tests were conducted for a certain pathogen and
specimen, our proportions of positive identification combined with absolute numbers of
pathogens identified are useful in terms of documenting the aetiology of ALRI
hospitalisations.
While the vast majority of influenza-coded admissions were associated with influenza
viruses and whooping cough with B. pertussis, the aetiology of admissions coded as
pneumonia, bronchiolitis or other ALRIs was more varied. In these admissions, there
were four or more different pathogens each with the proportion positive greater than
10%. In particular pneumonia admissions has a varied aetiology with no clear pathogen
dominating, which has been reported in numerous prospective studies in developing
countries.33, 35, 211 Data regarding the aetiology of pneumonia and other ALRIs in
developed countries are scarce but the contribution of RSV, influenza viruses, PIV and
S. pneumoniae and M. pneumoniae has been noted.212 When picornaviruses were
tested for, high identification rates were noted for all categories of ALRI. However, the
rate of identification of rhinoviruses in asymptomatic children is similar (Chapter 9) so
the pathogenicity of rhinoviruses in ALRI still remains unclear.
There was a high proportion of laboratory-confirmed B. pertussis identified not only in
whooping cough admissions but also in admissions coded for bronchiolitis, pneumonia
and influenza for which a test was requested. These rates need to be interpreted with
caution as B. pertussis investigations are not routinely requested and might be
indicative of an atypical clinical picture. Nevertheless, the number of B. pertussis
166
notifications has been increasing in Australia with peak activity recorded for 2001 and
2005.213 In WA, 2004 was an epidemic year for B. pertussis214 which might have led to
more testing and therefore an increase in the proportion positive. The potential role of
B. pertussis in bronchiolitis has also been noted in a Finnish study where 8.5% of
infants hospitalised for bronchiolitis, and all tested for B. pertussis before age 6
months, recorded a positive identification.215 The identification of B. pertussis was
higher in our study, albeit in a small proportion of children tested for B. pertussis.
Additionally, hospitalisations where B. pertussis has been identified may have been
misdiagnosed as bronchiolitis, indicating that studies based on hospital discharge
diagnosis alone may not accurately measure the burden of pertussis. Until B. pertussis
can be investigated routinely in children hospitalised with ALRI, the true burden of this
pathogen and its role in the aetiology of ALRI will remain unknown.
In this chapter, I have shown that linkage between statewide laboratory data and
hospital morbidity data is possible. The number of studies utilising population-based
data linkage are growing in Australia and it is likely to be a powerful resource to
document the pathogen-specific burden of ALRI and more accurately determine the
impact of intervention programs such as vaccination. From 2007, all laboratory data
systems within the PathWest laboratory database were rolled into one central ULTRA
database. This will allow future linkages with hospital morbidity data through the
WADLS to be more streamlined and the possibility of missing laboratory records for
linkage will be reduced. Further analyses of these linked data will also allow calculation
of sensitivity and specificity of ICD diagnosis codes for various ALRI diagnoses. We are
also planning to validate a subset of linked records against their medical records and
laboratory request forms. Despite the limitations that have been mentioned, these
population-based data cover a range of different tests and pathogens over a five year
period and provide estimates of the aetiology of ALRI hospitalisation in Australian
Aboriginal and non-Aboriginal children.
167
Further analyses of these data will involve the investigation of co-infection and viral-
viral and viral-bacterial interactions, seasonality of viruses identified in different regions
of WA and further characterisation of bacteria identified in non-sterile sites. We have
reiterated that ALRI is predominantly viral in young children and RSV is the
predominant pathogen. However, picornaviruses and B. pertussis should be
investigated routinely in children hospitalised with ALRI so the true burden of these
pathogens can also be determined. Additionally, testing in remote areas needs to be
promoted and more sensitive diagnostic techniques are needed to improve the
detection of invasive bacterial pathogens.

168
CHAPTER 12
Discussion
169
12.1 Summary of findings
This thesis has provided new data regarding the epidemiology of ALRI in Aboriginal
and non-Aboriginal children of WA. The findings from this body of work confirm that
ALRIs cause considerable paediatric morbidity and the burden is greater among
younger children, especially those in their first year of life, and Aboriginal children. One
in 15 non-Aboriginal children and one in 4 Aboriginal children were admitted to hospital
for ALRI before their fifth birthday, with bronchiolitis and pneumonia accounting for 76%
of all ALRI admissions.
Despite this considerable burden and disparity between Aboriginal and non-Aboriginal
children, we have seen some improvements in WA for ALRI with the reduction in the
incidence of hospitalisation for pneumonia. Between 1996-2000 and 2001-2005, all
cause pneumonia hospitalisations fell by 28-44% in Aboriginal children aged 6-35
months with no equivalent decline in non-Aboriginal children, an encouraging finding in
the context of pneumonia initiatives such as the GAPP.85 As a result, the disparity
between Aboriginal and non-Aboriginal children for pneumonia hospitalisations has
declined by a third, a positive step towards closing the gap in health inequalities
between Aboriginal and non-Aboriginal Australians.94, 95
This thesis has also highlighted the risk factors and potential causal pathways to
hospitalisation with ALRI and for the first time, has highlighted differences in risk
patterns between Aboriginal and non-Aboriginal children. ALRI has a multi-factorial
causal pathway: male gender, being born in autumn (ie aged 1-5 months in winter),
gestational age less than 33 weeks and being born to a mother who has had multiple
previous pregnancies are significant risk factors for ALRI for both Aboriginal and non-
Aboriginal children. Being born in a remote location and classified in the lowest socio-
economic group are considerable risk factors for ALRI in Aboriginal children,
contributing 30% of the population attributable fraction (PAF) to ALRI before age 2
170
years. Improvements in socio-economic indicators are therefore likely to have a major
impact on the incidence of ALRI. As such, I have partly attributed the declines in
pneumonia hospitalisation seen in Aboriginal children to improvements in socio-
economic indicators. As well as confirming known risk factors, this thesis has also
provided new evidence for additional risk factors. In particular I have shown an
independent association between elective caesarean delivery and repeated
hospitalisations for bronchiolitis in non-Aboriginal children.
The aetiology of ALRI in children of WA is predominantly of viral origin and RSV is the
most important pathogen, as shown by the high identification rates in children
hospitalised with ALRI and low rates found in children showing no symptoms. While
RSV is mainly associated with bronchiolitis, in young children it is also associated with
hospitalisations for pneumonia, whooping cough and other ALRIs including bronchitis.
Other important viruses investigated in this thesis were influenza viruses A and B,
PIV1-3, rhinoviruses and adenoviruses. The seasonality differs between RSV,
influenza, PIV1, PIV3 and adenoviruses in children living in Perth and also varies with
age. The seasonality of influenza viruses differs between Aboriginal and non-Aboriginal
children in Perth, a novel finding which indicates that future targeted influenza
interventions are needed for different sub-groups. The seasonality of ALRI is likely to
vary between different climatic regions as I have shown for bronchiolitis in the northern
tropical areas of WA compared with the temperate climatic area of Perth.
I have explored viral identification in healthy Aboriginal and non-Aboriginal children in a
rural area of WA and reported high rates of rhinoviruses and adenoviruses found in the
nasopharynx of children, more so in Aboriginal children. This may be indicative of
prolonged excretion of rhinoviruses after an initial infection. These findings highlight
that, although rhinoviruses may be a common virus found in children hospitalised with
ALRI, it may not always be pathogenic or causal. However, there are significant
associations between rhinoviruses and pathogenic bacteria, and thus the importance of
171
rhinoviruses in ALRI and other respiratory infections such as OM must not be
underestimated.
Finally I have shown that it is feasible to link statewide laboratory data to hospital
morbidity data to gain an overview of the aetiology of ALRI hospitalisations. By linking
bacteriology and virology data, this has also highlighted that burden of pathogen-
specific disease cannot be reliably determined by hospital admission ICD diagnosis
codes alone. For example, B. pertussis was commonly found (identification rate of
>10%) when a test was requested across all ALRI diagnoses and not just whooping
cough-coded admissions. Linkages of statewide laboratory data to other health
datasets will be improved in the future as laboratory data systems have now become
integrated into a central database, paving the way for future research projects utilising
population-based data linkage for further investigations of ALRI and other infectious
diseases.
12.2 Strengths
This thesis has provided baseline data on which to evaluate current and future
interventions for ALRI. The use of population-based linked data, used in all but one
chapter is the greatest strength of this body of work. Through using population-based
linked data, every individual in a population is included without the need for individual
consent or the need for name-identified data. Data linkage conserves privacy while
allowing information from multiple datasets to be linked for detailed analyses. Since the
introduction of the WADLS in 1995, research projects requiring name-identified data
has decreased from 94% in 1994 to 36% in 2003.216
Population-based data linkage allows data on high-risk and remote populations to be
included in analyses. In conventional prospective studies, these hard-to-reach
populations from vast geographical areas are often missed. We have shown
172
differences according to geographical areas for seasonality of hospitalisations for
bronchiolitis, in particular in the remote tropical area of the Kimberley and Pilbara-
Gascoyne regions of WA. Without data linkage, this analysis would not be possible.
WA is a relatively closed population due to its isolation and low rates of migration.84
Therefore incidence rates calculated using person-time-at-risk from relevant birth and
death data as done in this thesis can be accurately calculated and are not likely to be
affected by over or under estimation of population denominators. Using total
population-based data also allows for adequate numbers for analysis, especially when
analyses are stratified by subgroups such as Aboriginality, ALRI diagnosis or
respiratory pathogen and age group, and still provides large numbers for sufficient
statistical power to conduct meaningful analyses.
The WADLS allows linkages between various datasets and therefore this thesis has
been able to combine data on a broad range of factors such as demographic, maternal,
obstetric, socioeconomic, seasonality, hospital morbidity including length of stay and
data regarding all 21 recorded diagnosis codes and routine laboratory investigations to
allow a holistic investigation into the epidemiology of ALRI in children. In turn this has
allowed analysis to cover many aspects of the causal pathways to ALRI.
The Midwives’ Notification System is considered the most accurate for Aboriginal
status. The identification of Aboriginal status in data collections in WA is considered
better quality than those of other states, in particular New South Wales and Victoria. In
an Australian Institute of Health and Welfare report, it was recommended that data
prior to 2005 regarding Aboriginal identification from hospital morbidity datasets only be
used in WA, Queensland, NT and South Australia.217 Since at the present time, the
only other states with capabilities of population-based data linkage are NT (due to the
completeness of data in the NT Immunisation Register and the NT Hospital Discharge
Dataset70) and New South Wales,218 WA is in a unique position to provide accurate
population-based data regarding Aboriginal Australians to guide future interventions.
173
Population-based data linkage is highly relevant to clinical care policy. Of particular
note is that clinicians at PMH from 2009 onwards started to administer RSV
immunoprophylaxis treatment earlier in the season for high-risk children in the
Kimberley and Pilbara-Gascoyne regions as a direct consequence of the results
showing differing seasonal patterns of bronchiolitis hospitalisations in northern tropical
areas of WA compared to metropolitan Perth (Figure 5.4; AD Keil, personal
communication). Population-based data allowed calculation of PAFs or population
attributable risk. For these calculations to be made, the exposure level of the risk factor
under investigation in the total population needs to be known,110 which is only possible
using population-based data. There has been limited use of PAFs in guiding public
health policies for ALRI prevention. However, using data from the recent influenza
H1N1 pandemic which commenced in April 2009,219 PAFs have been used to guide
pandemic influenza vaccination policy in reference to clinical risk factor groups for fatal
pandemic influenza.220 Future epidemiological studies using population-based data
should report PAFs as they are meaningful in addition to adjusted ORs in guiding
public health prevention measures.
The ability to assess the variability in seasonality of pathogens and disease according
to age and Aboriginality is another strength of the research in this thesis. An
understanding of seasonality enhances the accuracy of surveillance systems aimed at
early detection of epidemics. Through stratification of data, I have shown important
differences in seasonality of hospitalisations and of viral identification rates with respect
to Aboriginal and non-Aboriginal children and between different age groups.
12.3 Limitations
Despite the many benefits of population-based linked data, there are also limitations.
There may be misclassification of important covariate data such as Aboriginal status,
174
gestational age, mode of delivery, pregnancy complications and maternal factors such
as maternal smoking and maternal asthma. To limit underreporting of Aboriginal status,
I used the approach of recording a child as being Aboriginal if any record from
midwives, birth, death or hospital morbidity database was recorded as Aboriginal. For
Chapter 9, where prospectively collected data were analysed, Aboriginal identification
data were collected at recruitment by the research team which included Aboriginal
health workers.83 However a limitation of Chapter 9 using community based data was
the small numbers used for certain sub-group analyses.
Other covariates from the Midwives’ Notification System used in Chapters 6 and 7 are
considered to have high specificity but low sensitivity (E Blair, personal
communication). This would result in an underestimation of the associations between
certain risk factors investigated here and the risk of ALRI; however these estimates are
the only data available on a population scale.
There are inherent difficulties in relying on hospital diagnosis codes to classify hospital
episodes. There may be misclassification of diagnoses and these may vary slightly
across metropolitan and rural areas of the state. Indeed in our previous work, we noted
a diagnostic shift between asthma and bronchiolitis admissions, especially in children
aged 12-23 months.7 However, clinical coders, who only code what is documented in
the medical records, are trained specifically for translating medical discharge
summaries to ICD codes and this training is standardised across Australia.24 In
addition, without laboratory data, some clinical data and measures for pathogen-
specific burden may not be reliable. For example, as I have shown in Chapter 11, not
all hospitalisations where B. pertussis was identified were coded as whooping cough.
Further linkages with statewide pathology data as we have initiated here and
demonstrated to be feasible will help address this limitation in the future.
175
Due to the considerable breadth and depth of data obtained through the WADLS, there
are strict privacy and confidentiality policies which must be adhered to in addition to
ethics committee approvals and requirements. Unfortunately, these privacy and
confidentiality policies have also prevented us from acquiring certain variables such as
full date of birth and hospital identification code. The full date of birth, as opposed to
the month and year of birth as I have been given here and used throughout this thesis
(with the exception of Chapter 9), is essential in order to calculate accurate age-
specific admission rates, especially for those aged less than one month. I have had to
estimate incidence rates in those aged less than one month and in stratified analysis,
small changes in the numerator can have a significant change in incidence rates. In
addition, without having access to hospital identification codes, I have been unable to
investigate what hospital morbidity records failed to link to a laboratory record to
decipher if there are certain jurisdictions where specimens have not been routinely
collected from patients for identification of respiratory pathogens. These limitations
have since been discussed with personnel at the Western Australian Data Linkage
Branch and for future data extractions, full date of birth will be provided if it is
accompanied by a strong justification at the time of the data request.
Additionally, with respect to laboratory data, not all specimens were tested for all
respiratory pathogens, across all our aetiology investigations from the metropolitan
sample of respiratory viruses, the viruses and bacteria investigated in healthy children
in the Kalgoorlie Otitis Media Research Project (KOMRP) and the statewide laboratory
data from PathWest. Therefore, we were missing information on the newly identified
pathogens in ALRI such as bocavirus, coronavirus,37, 154, 155 and, where not specified,
rhinoviruses. Blood cultures practices may not be standardised throughout the state
and as such we are most likely underestimating the importance of bacterial pathogens
identified from sterile sites in children admitted with ALRI. For example, from our
enhanced surveillance of invasive pneumococcal disease in WA in children under the
age of 5 years between 2000 to 2007,68 it seems the population-based linked data are

176
missing some cases where enhanced surveillance identified S. pneumoniae in a sterile
site of a young child who was hospitalised. However, for the majority of respiratory viral
pathogens, the statewide linked data should be considered complete and population-
based as all virology from specimens collected from children throughout WA is
conducted at the central PathWest laboratory in Perth and therefore included in the
databases analysed in this thesis.
Apart from the asymptomatic viral and bacterial identification from Aboriginal and non-
Aboriginal children from the Kalgoorlie area, we are lacking data on community-level
burden of ALRI. Within the WADLS, there is the possibility to extract information from
nine emergency departments in metropolitan Perth. However, as there is only one ICD
diagnostic code given with emergency department data and many records have
missing data, this dataset has been deemed to be of limited value so far (O’Donnell et
al, unpublished data). There is also the lack of nation-wide general practitioner data
through the WADLS on which to base community-level studies. Instead, this thesis has
focused on severe ALRIs resulting in hospitalisation. The Bettering the Evaluation and
Care of Health program, or BEACH, is a continuous national study of general practice
activity from a random selection of general practitioners that commenced in 1998.221
This may provide data on the community-level burden of ALRI but these data have not
yet been incorporated into the WADLS.
We have also so far been unable to obtain individual level data on immunisation which
is a limitation when trying to attribute declines in pneumonia to a specific vaccination
campaign. Such data are available through the Australian Childhood Immunisation
Register, governed by Medicare Australia; however large-scale studies outside the
National Centre for Immunisation Research and Surveillance have not yet been able to
access data.
177
12.4 Originality
This thesis has several original contributions to ALRI epidemiology. Firstly, this is the
first time PAFs have been reported for risk factors in ALRI separately for Aboriginal and
non-Aboriginal children. These PAFs should help guide future public health prevention
policies (see Table 12.1). Secondly, this is the first time that viral identification rates
have been reported in a healthy Indigenous population. These data, which were from a
prospective cohort study as opposed to population-based data linkage study, provide a
platform on which to determine the role of adenoviruses and rhinoviruses and bacteria
in the aetiology and severity of ALRI.
Thirdly, due to the work in this thesis around laboratory data linkage, the linkage
process will become more streamlined in the future as we have now shown it is
feasible and meaningful to link these datasets. I have also established good
collaborations with PathWest and the health department which will help in the
development of future projects. Due to the extensive data cleaning and coding
developed as part of this thesis, future extractions will be more timely and efficient.
Furthermore since 2007, ULTRA has incorporated data from non-metropolitan
government hospitals and will therefore contain more samples from rural and remote
WA. I have demonstrated to stakeholders and data custodians within PathWest the
importance of data linkage, and have therefore made a unique contribution to research
and will enable future research projects to be done.
12.5 Implications and recommendations for policy
As a result of the major findings in this body of work, there are several
recommendations for policy (Table 12.1). The unique Australian pneumococcal
vaccination program is likely to have reduced pneumonia hospitalisations but
improvements and changes in socio-economic indicators have also contributed to the
178
declines. The high rates of adenoviruses, rhinoviruses and pathogenic bacteria found
in Aboriginal children in the absence of ALRI symptoms could very well be related to
poor indicators of socio-economic status such overcrowding in households, and higher
transmission rates through poor hygiene practices (ie limited hand washing).207 Indeed,
in our population analysis, remote location at birth and low socio-economic status were
significant risk factors for ALRI hospitalisation. There needs to be a commitment from
governments, public health practitioners and researchers at all levels to continue to
improve the socio-economic wellbeing and access to health services for Aboriginal
children and their families in WA. Initially, efforts to improve housing for rural and
remote Aboriginal families should be high on the agenda. Interventions should also
continue to reduce rates of maternal smoking in pregnancy. Further improvements are
likely to have a significant impact on the burden of ALRI. Continuing to monitor the
incidence of ALRI, and the levels of disparity between Aboriginal and non-Aboriginal
children could serve as an indicator to monitor the progress of these socioeconomic
changes.
The detailed investigation of seasonality of respiratory viruses and the variability in that
seasonality between Aboriginality and age, highlights the importance of knowing the
seasonal distribution of different pathogens in specific geographical areas for maximum
impact of intervention programs such as vaccination. In particular, the irregular
seasonal pattern noted for influenza viruses in the Aboriginal population has
implications for the timing of future vaccination programs. Since 2008, children in WA
aged between 6 and 59 months have been offered seasonal influenza vaccine free of
charge, unlike any other state.66 Initial analyses of a case-control study to measure the
effectiveness of this program suggested a vaccine effectiveness of 83% against
laboratory-confirmed influenza in hospitalised children, although this estimate was not
significant due to the small number of cases recruited in the first year of the study.222
The recommendations from this body of work would be to provide seasonal influenza
vaccine to Aboriginal children as soon as the vaccine becomes available each year.
179
Also, it would be worth considering altering the target age group to those aged 5-9
years, as the peak in identification occurred earlier in the season than in younger
children and it appears that children in this age group are the sentinels of influenza
virus infection in the non-Aboriginal population (Table 12.1).
I have shown an independent risk of elective caesarean delivery and recurrent
bronchiolitis in children, possibly through effects of immune maturation with the lack of
labour compared to a normal spontaneous vaginal delivery. This relationship may also
partly explain the association between elective caesarean delivery and increased
asthma risk in children as recurrent bronchiolitis is also a risk factor for asthma.4, 5, 139
Expectant mothers and their health care providers, including obstetricians need to be
made aware of this association through education campaigns and sharing of
knowledge. This is especially important as rates of elective caesarean deliveries are
increasing not only in WA and throughout Australia, but in many other countries around
the world.129-131
RSV is an important pathogen and is commonly identified in children hospitalised with
ALRI. It is the most common respiratory pathogen identified through routine laboratory
testing from a selection of outpatients and inpatients and is not found commonly in
asymptomatic children, indicating that it plays a major role in the causality of ALRI. In
addition, bronchiolitis, most often caused by RSV has the highest incidence rates in
WA compared to all other ALRI diagnoses. Examination of bronchiolitis seasonality,
conducted in this thesis also proved useful. Immunoprophylaxis with RSV monoclonal
antibody, palivizumab,71, 104 is expensive but for high risk children in the northern areas
of WA where bronchiolitis seasonality is different to that in metropolitan areas, the
immunoprophylaxis schedule needs to be lengthened in order to provide full coverage.
Development of a safe and effective RSV vaccine should be an urgent area for vaccine
research. There have been previous challenges in developing a vaccine for RSV due to
the failure of natural infection to induce immunity that prevents reinfection, lack of an

180
accurate animal model to mimic the pathogenesis of human RSV infection, and
previous failings of whole virus vaccines that enhanced disease.223 However, as
vaccine technologies have continued to evolve, vaccine development has progressed.
In fact, Phase 1 and 2 trials of an attenuated intranasal RSV/PIV3 vaccine (MEDI-534)
are currently underway in infants and young children224, 225 in several international
vaccine research centres, including the Vaccine Trials Group
(www.ichr.uwa.edu.au/vtg) in Perth.
To further understand the role of other pathogens, routine testing should be established
for a wider range of respiratory viruses and bacteria. Rhinoviruses and B. pertussis are
emerging as important pathogens in ALRI, but currently, rhinoviruses, hMPV and B.
pertussis are only investigated if the test is specifically requested by the managing
clinician, or if that particular specimen is negative for other pathogens on the standard
respiratory panel, or if the patient has an atypical clinical picture. Additionally, the PCR
for rhinoviruses and hMPV was only introduced in PathWest in 2003, so data from only
two years could be used in this thesis. Until these pathogens are investigated in all
patients presenting with respiratory or ALRI symptoms, the true burden of disease due
to these pathogens will remain unclear. There is also a need for further studies to
include healthy controls to document the levels of asymptomatic carriage of bacteria
and identification of viruses. Routine investigations would be possible through the use
of multiplex PCR which has been shown to be able to detect a greater range of
respiratory viruses compared to direct immunofluorescence and culture methods. It is
more cost and time efficient than culture methods and yields higher viral detection rates
than direct immunofluorescence.226
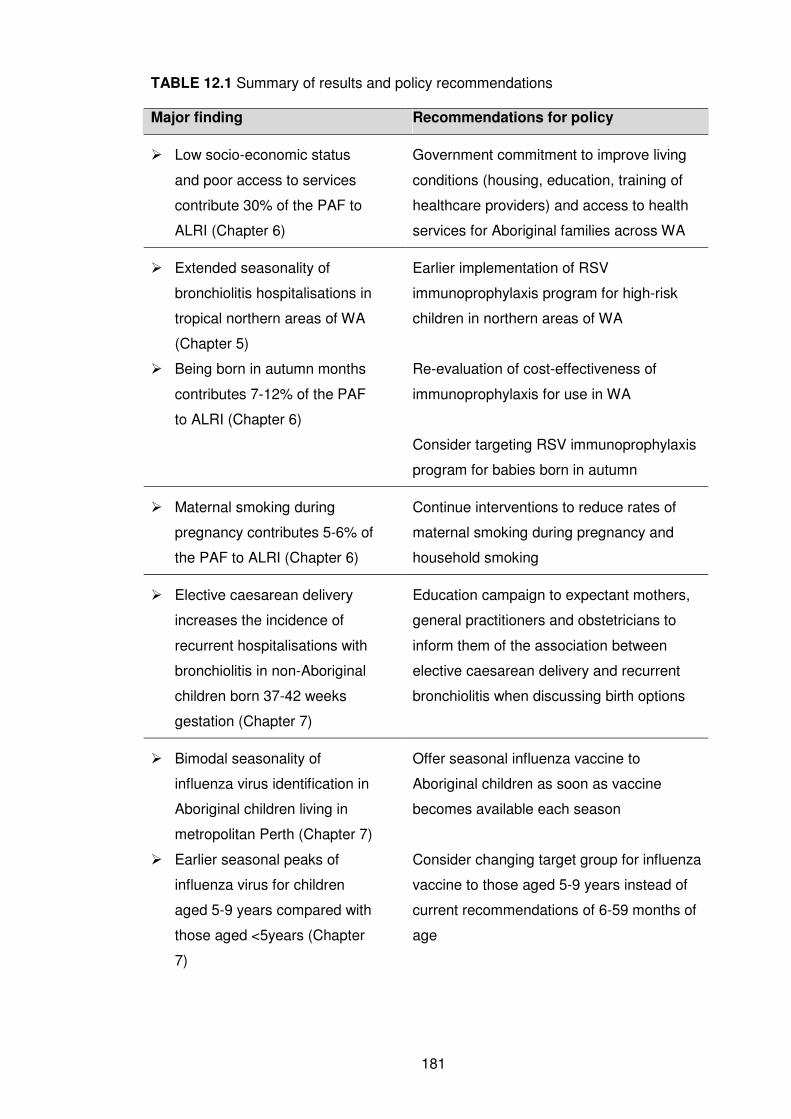
181
TABLE 12.1 Summary of results and policy recommendations
Major finding Recommendations for policy
� Low socio-economic status
and poor access to services
contribute 30% of the PAF to
ALRI (Chapter 6)
Government commitment to improve living
conditions (housing, education, training of
healthcare providers) and access to health
services for Aboriginal families across WA
� Extended seasonality of
bronchiolitis hospitalisations in
tropical northern areas of WA
(Chapter 5)
� Being born in autumn months
contributes 7-12% of the PAF
to ALRI (Chapter 6)
Earlier implementation of RSV
immunoprophylaxis program for high-risk
children in northern areas of WA
Re-evaluation of cost-effectiveness of
immunoprophylaxis for use in WA
Consider targeting RSV immunoprophylaxis
program for babies born in autumn
� Maternal smoking during
pregnancy contributes 5-6% of
the PAF to ALRI (Chapter 6)
Continue interventions to reduce rates of
maternal smoking during pregnancy and
household smoking
� Elective caesarean delivery
increases the incidence of
recurrent hospitalisations with
bronchiolitis in non-Aboriginal
children born 37-42 weeks
gestation (Chapter 7)
Education campaign to expectant mothers,
general practitioners and obstetricians to
inform them of the association between
elective caesarean delivery and recurrent
bronchiolitis when discussing birth options
� Bimodal seasonality of
influenza virus identification in
Aboriginal children living in
metropolitan Perth (Chapter 7)
� Earlier seasonal peaks of
influenza virus for children
aged 5-9 years compared with
those aged <5years (Chapter
7)
Offer seasonal influenza vaccine to
Aboriginal children as soon as vaccine
becomes available each season
Consider changing target group for influenza
vaccine to those aged 5-9 years instead of
current recommendations of 6-59 months of
age
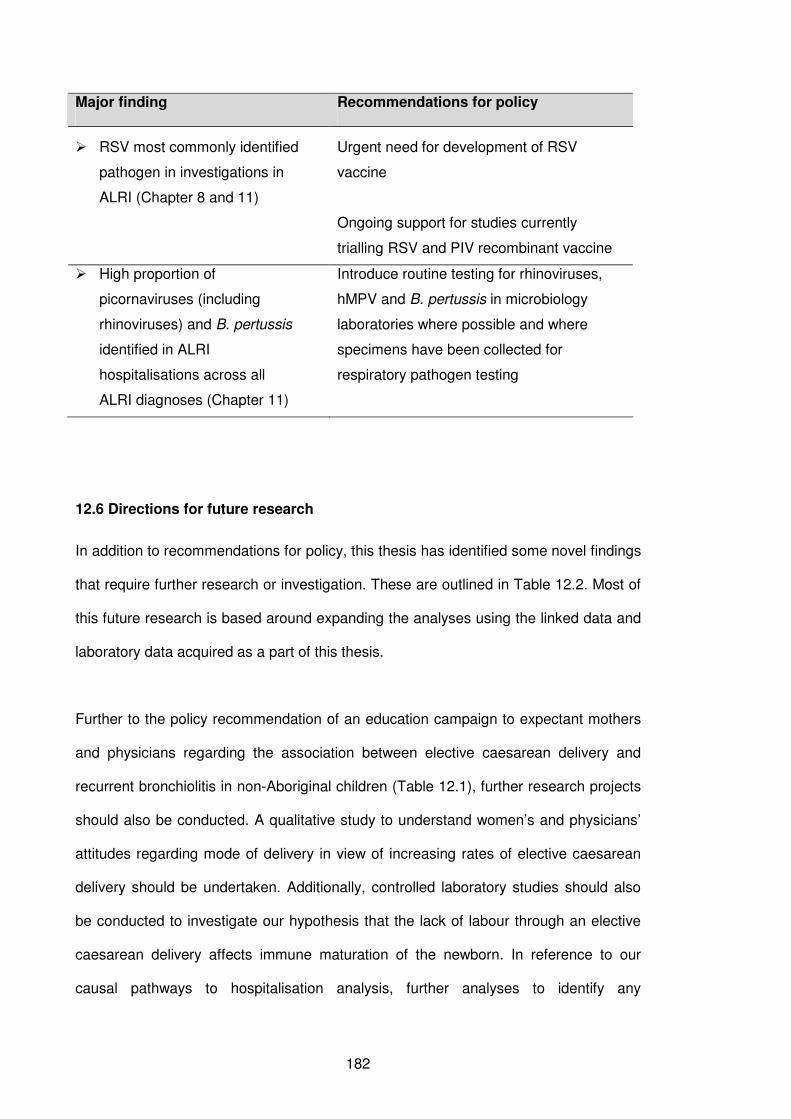
182
Major finding Recommendations for policy
� RSV most commonly identified
pathogen in investigations in
ALRI (Chapter 8 and 11)
Urgent need for development of RSV
vaccine
Ongoing support for studies currently
trialling RSV and PIV recombinant vaccine
� High proportion of
picornaviruses (including
rhinoviruses) and B. pertussis
identified in ALRI
hospitalisations across all
ALRI diagnoses (Chapter 11)
Introduce routine testing for rhinoviruses,
hMPV and B. pertussis in microbiology
laboratories where possible and where
specimens have been collected for
respiratory pathogen testing
12.6 Directions for future research
In addition to recommendations for policy, this thesis has identified some novel findings
that require further research or investigation. These are outlined in Table 12.2. Most of
this future research is based around expanding the analyses using the linked data and
laboratory data acquired as a part of this thesis.
Further to the policy recommendation of an education campaign to expectant mothers
and physicians regarding the association between elective caesarean delivery and
recurrent bronchiolitis in non-Aboriginal children (Table 12.1), further research projects
should also be conducted. A qualitative study to understand women’s and physicians’
attitudes regarding mode of delivery in view of increasing rates of elective caesarean
delivery should be undertaken. Additionally, controlled laboratory studies should also
be conducted to investigate our hypothesis that the lack of labour through an elective
caesarean delivery affects immune maturation of the newborn. In reference to our
causal pathways to hospitalisation analysis, further analyses to identify any
183
confounding relationships between teenage pregnancies in the Aboriginal population
and the risk of ALRI should be carried out.
Further analysis is needed to understand what asymptomatic identification of viruses
means and if it acts as a prelude to an active infection that has not yet produced clinical
symptoms or if it signifies prolonged shedding of a virus following an active viral
infection, or a combination of the two. I identified high rates of both rhinoviruses and
adenoviruses in asymptomatic children and now have the opportunity to compare these
rates of identification in children hospitalised with ALRI through the linkage of state-
wide laboratory data. Furthermore I found higher rates of picornaviruses and
adenoviruses in Aboriginal children than in non-Aboriginal children both in healthy
children and in those hospitalised for ALRI, which could mean that asymptomatic
identification is related to identification in children with ALRI symptoms. The next
logical step is to investigate the occurrence of viral and bacterial co-infection during
active ALRI infections; in particular the negative association between adenoviruses and
identification of S. pneumoniae needs to be characterised in terms of the presence of
adenovirus during an active infection. Additionally, this association requires further
investigation through laboratory analyses and animal studies determining what factors
can explain the inhibition of S. pneumoniae growth in the presence of adenoviruses.
Unfortunately, there were very few positive identifications of S. pneumoniae from sterile
sites. There were only 3 identifications in children aged between 12 and 23 months
hospitalised with pneumonia between 2000 and 2005, compared to 44 cases between
2002 and 2004 of invasive pneumococcal disease with a clinical focus of pneumonia
identified through enhanced surveillance in WA. The cause of this discrepancy, most
likely through missing bacterial culture records in the linked laboratory data will need
further investigation. The proportion of ALRI hospitalisations with a bacterial pathogen
identified by blood culture (Chapter 11) should therefore be interpreted with caution.
184
The investigation of respiratory virus seasonality (Chapter 8) should now be replicated
utilising the statewide population linked data covering all geographical regions of WA.
In particular, an investigation of influenza seasonality in northern WA may shed light on
the reasons behind the differing seasonal patterns of influenza for Aboriginal and non-
Aboriginal children in metropolitan Perth. This can be achieved through utilising the
mathematical modelling techniques of virus transmission dynamics.227 These models
aim to mathematically model the flow of individuals in a population through a pre-
infectious (susceptible) state, infectious state and then recovered or immune state and
as such can model seasonal epidemics of pathogens and determine the characteristics
of those epidemics. This approach has been successfully utilised to model respiratory
virus outbreaks such as pandemic influenza, where they were used to predict the
transmissibility of the circulating virus strain and the case fatality ratio.228 Models can
also be used to measure the likely impact of intervention programs such as vaccination
or school closures and determine the proportion of the population that needs to be
vaccinated in order to reach the herd immunity threshold and the optimum timing of
interventions.229 Models for other respiratory viruses such as RSV or PIV have been
underutilised. To date, models for RSV transmission dynamics have been constructed
from data from The Gambia, Singapore, Florida, and Finland,230 and Spain.231 As I
have highlighted throughout this thesis, RSV displays distinct seasonality with
variations between age groups. It would be important to replicate these RSV
transmission models using data from WA. Models are only as good as the data that
they are based on. The extensive linked data gathered through my thesis will allow the
construction of respiratory virus models appropriate for Aboriginal and non-Aboriginal
children of WA. They could be used to help determine the likely impact of interventions
for RSV and other respiratory viral and bacterial pathogens, the ideal target groups and
the most appropriate timing for interventions.
185
In addition to these future research projects, further analyses can be conducted on the
statewide laboratory data targeting specific research questions. These research areas
include but are not limited to:
• infections in the neonatal period where bacterial pathogens such as S.
pneumoniae can cause neonatal sepsis.232 Other pathogens would also be
important in neonatal infections. Linked data in WA would enable an
investigation of the aetiology of infections in newborns admitted to neonatal
intensive care units.
• causal pathways to laboratory-confirmed outcomes; eg, the infant and
maternal risk factors to laboratory-confirmed RSV infection.
• descriptive analysis of blood culture practices over time comparing different
health regions in WA, using all the laboratory data and not just those
records that have linked to a hospitalisation record.
Finally, to address the inability to access immunisation data for population-based
studies, progress should be made to link individual-level immunisation data from the
Australian Childhood Immunisation Register to hospitalisation data for ALRI. This will
enable a more accurate examination of the impact of certain vaccination programs,
such as the pneumococcal vaccination program on age-specific incidence rates of
hospitalisation for pneumonia and other ALRIs. This can be achieved by investigating
hospitalisation rates in those children who are fully vaccinated, partially vaccinated or
not vaccinated.
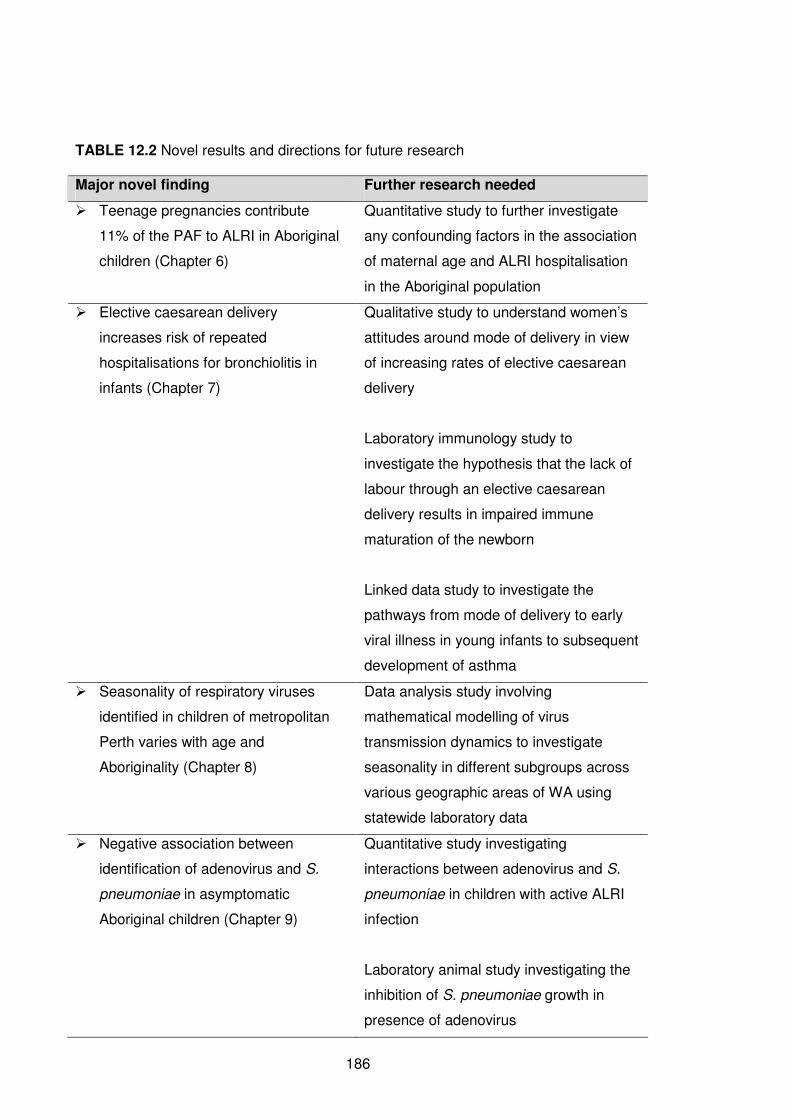
186
TABLE 12.2 Novel results and directions for future research
Major novel finding Further research needed
� Teenage pregnancies contribute
11% of the PAF to ALRI in Aboriginal
children (Chapter 6)
Quantitative study to further investigate
any confounding factors in the association
of maternal age and ALRI hospitalisation
in the Aboriginal population
� Elective caesarean delivery
increases risk of repeated
hospitalisations for bronchiolitis in
infants (Chapter 7)
Qualitative study to understand women’s
attitudes around mode of delivery in view
of increasing rates of elective caesarean
delivery
Laboratory immunology study to
investigate the hypothesis that the lack of
labour through an elective caesarean
delivery results in impaired immune
maturation of the newborn
Linked data study to investigate the
pathways from mode of delivery to early
viral illness in young infants to subsequent
development of asthma
� Seasonality of respiratory viruses
identified in children of metropolitan
Perth varies with age and
Aboriginality (Chapter 8)
Data analysis study involving
mathematical modelling of virus
transmission dynamics to investigate
seasonality in different subgroups across
various geographic areas of WA using
statewide laboratory data
� Negative association between
identification of adenovirus and S.
pneumoniae in asymptomatic
Aboriginal children (Chapter 9)
Quantitative study investigating
interactions between adenovirus and S.
pneumoniae in children with active ALRI
infection
Laboratory animal study investigating the
inhibition of S. pneumoniae growth in
presence of adenovirus
187
Linking immunisation data to hospital morbidity data can also allow the investigation of
timeliness of vaccination in relation to impact on disease outcomes as there are a
significant proportion of children who are not receiving scheduled vaccinations in a
timely manner.233, 234 Federal and state government bodies need to understand the
potential for data linkage and provide the necessary support to enable linkage between
immunisation data and other administrative datasets. Additionally, an immunisation
register covering all age groups should be established as the Australian Childhood
Immunisation Register only records immunisations up to the age of 7 years.
12.7 Conclusions
ALRI remains an important cause of paediatric morbidity, although some improvements
have been seen. This thesis has broadened the knowledge of ALRI epidemiology and
has given rise to new areas of research, not just in epidemiology, but also in
microbiology and immunology around the research area of infection and immunity. I
have demonstrated the feasibility and practicality of data linkage and in the future these
data can be enhanced with more data linkage studies including data beyond the year
2005. This thesis has also shed some light on the relationship between ALRI and
asthma and through doing so has helped broaden the scope of respiratory infection
investigations to build an area of multidisciplinary research. As data linkage becomes
more commonplace, it will be important to continue to monitor the burden of ALRI and
measure the impact of current and future interventions.

188
CHAPTER 13
References
189
1. Carville K, Lehmann D, Hall G, et al. Infection is the major component of the
disease burden in Aboriginal and non-Aboriginal Australian children: a population-
based study. Pediatr Infect Dis J. 2007;26(3):210-16.
2. Black RE, Morris SS, Bryce J. Where and why are 10 million children dying
every year? Lancet. 2003;361(9376):2226-34.
3. Fitzgerald DA. Viral bronchiolitis for the clinician. J Paediatr Child Health.
2010;no. doi: 10.1111/j.1440-1754.2010.01735.x.
4. Sly PD, Kusel M, Holt PG. Do early-life viral infections cause asthma? J Allergy
Clin Immunol. 2010;125(6):1202-05.
5. Stensballe LG, Simonsen JB, Thomsen SF, et al. The causal direction in the
association between respiratory syncytial virus hospitalization and asthma. J Allergy
Clin Immunol. 2009;123(1):131-37.e1.
6. Peck AJ, Holman RC, Curns AT, et al. Lower respiratory tract infections among
American Indian and Alaska Native children and the general population of U.S.
children. Pediatr Infect Dis J. 2005;24(4):342-51.
7. Moore H, Burgner D, Carville K, et al. Diverging trends for lower respiratory
infections in non-Aboriginal and Aboriginal children. J Paediatr Child Health.
2007;43(6):451-57.
8. Bjor O, Braback L. A retrospective population based trend analysis on hospital
admissions for lower respiratory illness among Swedish children from 1987 to 2000.
BMC Public Health. 2003;3(1):22.
9. van Woensel JB, van Aalderen WM, Kneyber MC, et al. Bronchiolitis
hospitalisations in the Netherlands from 1991 to 1999. Arch Dis Child. 2002;86(5):370-
1.
10. Langley JM, LeBlanc JC, Smith B, et al. Increasing incidence of hospitalization
for bronchiolitis among Canadian children, 1980-2000. J Infect Dis. 2003;188(11):1764-
7.
190
11. Alaghehbandan R, Gates KD, MacDonald D. Hospitalization due to pneumonia
among Innu, Inuit and non-Aboriginal communities, Newfoundland and Labrador,
Canada. Int J Infect Dis. 2007;11(1):23-28.
12. Grant CC, Scragg R, Tan D, et al. Hospitalization for pneumonia in children in
Auckland, New Zealand. J Paediatr Child Health. 1998;34(4):355-9.
13. Australian Bureau of Statistics. The health and welfare of Australia's Aboriginal
and Torres Strait Islander Peoples 2008. Cat 4704.0. Canberra: Australian Bureau of
Statistics 2008.
14. O'Grady KA, Torzillo PJ, Chang AB. Hospitalisation of Indigenous children in
the Northern Territory for lower respiratory illness in the first year of life. Med J Aust.
2010;192(10):586-90.
15. Bailey EJ, Maclennan C, Morris PS, et al. Risks of severity and readmission of
Indigenous and non-Indigenous children hospitalised for bronchiolitis. J Paediatr Child
Health. 2009;45(10):593-7.
16. Deshpande SA, Northern V. The clinical and health economic burden of
respiratory syncytial virus disease among children under 2 years of age in a defined
geographical area. Arch Dis Child. 1065;88(12):1065-9.
17. Dede A, Isaacs D, Torzillo PJ, et al. Respiratory syncytial virus infections in
Central Australia. J Paediatr Child Health. 2010;46(1-2):35-9. Epub 2009 Nov 23.
18. Banerji A, Bell A, Mills EL, et al. Lower respiratory tract infections in Inuit infants
on Baffin Island. Can Med Assoc J. 2001;164(13):1847-50.
19. Lambert SB, Allen KM, Druce JD, et al. Community epidemiology of human
metapneumovirus, human coronavirus NL63, and other respiratory viruses in healthy
preschool-aged children using parent-collected specimens. Pediatrics.
2007;120(4):e929-e37.
20. Ingarfield SL, Celenza A, Jacobs IG, et al. Acute upper respiratory infections in
Western Australian emergency departments, 2000-2003. Aust Health Rev.
2008;32(4):691-9.
191
21. Izurieta HS, Thompson WW, Kramarz P, et al. Influenza and the rates of
hospitalization for respiratory disease among infants and young children. N Engl J Med.
2000;342(4):232-9.
22. Nicholson KG, McNally T, Silverman M, et al. Rates of hospitalisation for
influenza, respiratory syncytial virus and human metapneumovirus among infants and
young children. Vaccine. 2006;24(1):102-8.
23. Keren R, Wheeler A, Zaoutis T, et al. ICD-9 codes for identifying influenza
hospitalizations in children. Emerg Infect Dis. 2006;12(10):1603-04.
24. Roberts RF, Innes KC, Walker SM. Introducing ICD-10-AM in Australian
hospitals. Med J Aust. 1998;169(Suppl):S32-5.
25. Navarro-Mari JM, Palacios Del Valle E, Perez-Ruiz M, et al. The impact of
influenza viruses on hospitalizations in infants younger than two years old during
epidemics of respiratory syncytial virus infection. Clin Microbiol Infect. 2003;9(9):959-
63.
26. Jennings LC, Anderson TP, Werno AM, et al. Viral etiology of acute respiratory
tract infections in children presenting to hospital: role of polymerase chain reaction and
demonstration of multiple infections. Pediatr Infect Dis J. 2004;23(11):1003-7.
27. Calvo C, Pozo F, Garcia-Garcia M, et al. Detection of new respiratory viruses in
hospitalized infants with bronchiolitis: a three-year prospective study. Acta Paediatr.
2010;99:883-87.
28. Miron D, Srugo I, Kra-Oz Z, et al. Sole pathogen in acute bronchiolitis: is there a
role for other organisms apart from respiratory syncytial virus? Pediatr Infect Dis J.
2010;29(1):e7-e10.
29. Stempel HE, Martin ET, Kuypers J, et al. Multiple viral respiratory pathogens in
children with bronchiolitis. Acta Paediatr. 2009;98(1):123-6.
30. Bharaj P, Sullender WM, Kabra SK, et al. Respiratory viral infections detected
by multiplex PCR among pediatric patients with lower respiratory tract infections seen
at an urban hospital in Delhi from 2005 to 2007. Virol J. 2009;6:89.
192
31. Iwane MK, Edwards KM, Szilagyi PG, et al. Population-based surveillance for
hospitalizations associated with respiratory syncytial virus, influenza virus, and
parainfluenza viruses among young children. Pediatrics. 2004;113(6):1758-64.
32. Naghipour M, Cuevas LE, Bakhshinejad T, et al. Contribution of viruses,
Chlamydia spp. and Mycoplasma pneumoniae to acute respiratory infections in Iranian
children. J Trop Pediatr. 2007;53(3):179-84.
33. Nascimento-Carvalho CM, Ribeiro CT, Cardoso MRA, et al. The role of
respiratory viral infections among children hospitalized for community-acquired
pnuemonia in a developing country. Pediatr Infect Dis J. 2008;27(10):939-41.
34. Sung RYT, Chan PKS, Tsen T, et al. Identification of viral and atypical bacterial
pathogens in children hospitalized with acute respiratory infections in Hong Kong by
multiplex PCR assays. J Med Virol. 2009;81(1):153-59.
35. Berkley JA, Munywoki P, Ngama M, et al. Viral etiology of severe pneumonia
among Kenyan infants and children. JAMA. 2010;303(20):2051-7.
36. Torzillo P, Dixon J, Manning K, et al. Etiology of acute lower respiratory tract
infection in Central Australian Aboriginal children. Pediatr Infect Dis J. 1999;18(8):714-
21.
37. Sloots TP, McErlean P, Speicher DJ, et al. Evidence of human coronavirus
HKU1 and human bocavirus in Australian children. J Clin Virol. 2006;35(1):99-102.
38. Forster J, Ihorst G, Rieger CH, et al. Prospective population-based study of viral
lower respiratory tract infections in children under 3 years of age (the PRI.DE study).
Eur J Pediatr. 2004;163(12):709-16.
39. Noyola DE, Zuviri-Gonzalez A, Castro-Garcia JA, et al. Impact of respiratory
syncytial virus on hospital admissions in children younger than 3 years of age. J Infect.
2007;54(2):180-4.
40. Louie JK, Roy-Burman A, Guardia-Labar L, et al. Rhinovirus associated with
severe lower respiratory tract infections in children. Pediatr Infect Dis J.
2009;28(4):337-9.
193
41. Bizzintino J, Lee WM, Laing IA, et al. Association between human rhinovirus C
and severity of acute asthma in children. Eur Respir J. 2010;6 Aug(Epub ahead of
print).
42. van Benten I, Koopman L, Niesters B, et al. Predominance of rhinovirus in the
nose of symptomatic and asymptomatic infants. Pediatr Allergy Immunol.
2003;14(5):363-70.
43. Scott JAG, English M. What are the implications for childhood pneumonia of
successfully introducing Hib and pneumococcal vaccines in developing countries?
PLoS Med. 2008;5(4):e86.
44. Kusel M, Sly PD. Acute respiratory tract infections in childhood. Med Today.
2006;7(9):14-21.
45. Kelly H, Grant K. Interim analysis of pandemic influenza (H1N1) 2009 in
Australia: surveillance trends, age of infection and effectiveness of seasonal
vaccination. Euro Surveillance: Bulletin Europeen sur les Maladies Transmissibles =
European Communicable Disease Bulletin. 2009;14(31).(pii):19288.
46. Watson K, Carville K, Bowman J, et al. Upper respiratory tract bacterial carriage
in Aboriginal and non-Aboriginal children in a semi-arid area of Western Australia.
Pediatr Infect Dis J. 2006;25(9):782-90.
47. Kilbourne ED. Influenza pandemics of the 20th century. Emerg Infect Dis.
2006;12(1):9-14.
48. Hambidge SJ, Glanz JM, France EK, et al. Safety of trivalent inactivated
influenza vaccine in children 6 to 23 months old. JAMA. 2006;296(16):1990-7.
49. Harper S, Fukuda K, Uyeki T, et al. Prevention and control of influenza:
recommendations of the Advisory Committee on Immunization Practices (ACIP).
MMWR Recomm Rep. 2005;54(RR-8):1-40.
50. Fisman DN. Seasonality of infectious diseases. Annu Rev Public Health.
2007;28:127-43.
194
51. Watson M, Gilmour R, Menzies R, et al. The association of respiratory viruses,
temperature, and other climatic parameters with the incidence of invasive
pneumococcal disease in Sydney, Australia. Clin Infect Dis. 2006;42(2):211-5.
52. Viegas M, Barrero PR, Maffey AF, et al. Respiratory viruses seasonality in
children under five years of age in Buenos Aires, Argentina: a five-year analysis. J
Infect. 2004;49(3):222-8.
53. Tchidjou HK, Vescio F, Boros S, et al. Seasonal pattern of hospitalization from
acute respiratory infections in Yaounde, Cameroon. J Trop Pediatr. 2010;56(5):317-20.
54. Blair E, de Klerk N. Causal pathways: Implications for aetiological analysis.
Australiasian Epidemiologist. 2004;11(1):3-6.
55. Flores P, Rebelo-de-Andrade H, Goncalves P, et al. Bronchiolitis caused by
respiratory syncytial virus in an area of Portugal: epidemiology, clinical features, and
risk factors. Eur J Clin Microbiol Infect Dis. 2004;23(1):39-45.
56. Grimwood K, Cohet C, Rich FJ, et al. Risk factors for respiratory syncytial virus
bronchiolitis hospital admission in New Zealand. Epidemiol Infect. 2008;136(10):1333-
41.
57. Cilla G, Sarasua A, Montes M, et al. Risk factors for hospitalization due to
respiratory syncytial virus infection among infants in the Basque Country, Spain.
Epidemiol Infect. 2006;134(3):506-13.
58. Halasa NB, Williams JV, Wilson GJ, et al. Medical and economic impact of a
respiratory syncytial virus outbreak in a neonatal intensive care unit. Pediatr Infect Dis
J. 2005;24(12):1040-4.
59. Read AW, Gibbins J, Stanley FJ. Hospital admissions for lower respiratory tract
illness before the age of two years in western Australia. Paediatr Perinat Epidemiol.
1996;10(2):175-85.
60. Blair EM, Liu Y, de Klerk NH, et al. Optimal fetal growth for the Caucasian
singleton and assessment of appropriateness of fetal growth: an analysis of a total
population perinatal database. BMC Pediatrics. 2005;5(1):13.
195
61. Yuan W, Basso O, Sorensen HT, et al. Maternal prenatal lifestyle factors and
infectious disease in early childhood: A follow-up study of hospitalization within a
Danish birth cohort. Pediatrics. 2001;107(2):357-62.
62. Savitha MR, Nandeeshwara SB, Pradeep Kumar MJ, et al. Modifiable risk
factors for acute lower respiratory tract infections. Indian J Pediatr. 2007;74(5):477-82.
63. Crighton EJ, Elliott SJ, Moineddin R, et al. A spatial analysis of the
determinants of pneumonia and influenza hospitalizations in Ontario (1992-2001). Soc
Sci Med. 2007;64(8):1636-50.
64. Reeve CA, Whitehall JS, Buettner PG, et al. Predicting respiratory syncytial
virus hospitalisation in Australian children. J Paediatr Child Health. 2006;42(5):248-52.
65. National Health and Medical Research Council. The Australian Immunisation
Handbook. 9th ed. Canberra: Australian Government Department of Health and
Ageing; 2008.
66. Department of Health. Paediatric Influenza Immunisation: The 2008
metropolitan trial. Disease WAtch. 2008:1-4.
67. Madhi SA, Klugman KP. A role for Streptococcus pneumoniae in virus-
associated pneumonia. Nat Med. 2004;10(8):811-3.
68. Lehmann D, Willis J, Moore HC, et al. The changing epidemiology of invasive
pneumococcal disease in Aboriginal and non-Aboriginal Western Australians from 1997
to 2007 and emergence of non-vaccine serotypes. Clin Infect Dis. 2010;50(11):1477-
86.
69. Jardine A, Menzies RI, McIntyre PB. Reduction in hospitalizations for
pneumonia associated with the introduction of a pneumococcal conjugate vaccination
schedule without a booster dose in Australia. Pediatr Infect Dis J. 2010;29(7):607-12.
70. O'Grady KA F, Lee K, Carlin J, et al. Increased risk of hospitalization for acute
lower respiratory tract infection among Australian Indigenous infants 5-23 months of
age following pneumococcal vaccination: A cohort study. Clin Infect Dis.
2010;50(7):970-78.
196
71. The IMpact-RSV Study Group. Palivizumab, a humanized respiratory syncytial
virus monoclonal antibody, reduces hospitalization from respiratory syncytial virus
infection in high-risk infants. Pediatrics. 1998;102(3):531-37.
72. Bell DM, World Health Organization Writing Group. Non-pharmaceutical
interventions for pandemic influenza, national and community measures. Emerg Infect
Dis. 2006;12(1):88-94.
73. Luby SP, Agboatwalla M, Feikin DR, et al. Effect of handwashing on child
health: a randomised controlled trial. Lancet. 2005;366(9481):225-33.
74. Rabie T, Curtis V. Handwashing and risk of respiratory infections: a quantitative
systematic review. Trop Med Int Health. 2006;11(3):258-67.
75. Holman CD, Bass AJ, Rouse IL, et al. Population-based linkage of health
records in Western Australia: development of a health services research linked
database. Aust N Z J Public Health. 1999;23(5):453-9.
76. Australian Bureau of Statistics. 3101.0 Australian Demographic Statistics.
Canberra: Australian Bureau of Statistics 2009.
77. Bureau of Meteorology. Climate statistics for Australian locations 2008
[Accessed 25 March 2008]; Available from:
http://www.bom.gov.au/climate/averages/tables/cw_009225.shtml.
78. Downey F, Gee V. Guidelines for completion of the notification of case attended
health act (Notification by Midwife) regulations form No. 2: Department of Health
Western Australia 2006.
79. Department of Health WA. Hospital Morbidity Data System Reference Manual
Perth, Western Australia 2010.
80. The Australian version of the International Classification of Diseases, 9th
revision, Clinical Modification (ICD-9-CM). Sydney: National Coding Centre; 1996.
81. The International Statistical Classification of Diseases and Related Health
Problems, 10th revision, Australian modification. 2nd ed. Sydney: National Centre for
Classification in Health; 2000.
197
82. The ICD-9-CM/ICD-10-AM Mapping Tables: National Centre for Classification in
Health; 1998 [updated June 1998; Accessed on:2003 Dec 2003]; Available from:
<http://www2.cchs.usyd.edu.au/ncch/>.
83. Lehmann D, Arumugaswamy A, Elsbury D, et al. The Kalgoorlie Otitis Media
Research Project: rationale, methods, population characteristics and ethical
considerations. Paediatr Perinat Epidemiol. 2008;22(1):60-71.
84. Sibma K. Migration in Western Australia: a recent economic history:
Department of Treasury and Finance, Goverment of Western Australia 2006.
85. Greenwood B. A global action plan for the prevention and control of pneumonia.
Bull World Health Organ. 2008;86(5):322-2A.
86. Anderson I, Crengle S, Kamaka ML, et al. Indigenous health in Australia, New
Zealand, and the Pacific. Lancet. 2006;367(9524):1775-85.
87. Gracey M, King M. Indigenous health part 1: determinants and disease
patterns. Lancet. 2009;374(9683):65-75.
88. Menzies R, Turnour C, Chiu C, et al. Vaccine preventable diseases and
vaccination coverage in Aboriginal and Torres Strait Islander people, Australia, 2003 to
2006. Commun Dis Intell. 2008;32(Supplement).
89. Black S, Shinefield H, Baxter R, et al. Impact of the use of heptavalent
pneumococcal conjugate vaccine on disease epidemiology in children and adults.
Vaccine. 2006;24(Suppl 2):S2-79-80.
90. Hennessy TW, Singleton RJ, Bulkow LR, et al. Impact of heptavalent
pneumococcal conjugate vaccine on invasive disease, antimicrobial resistance and
colonization in Alaska Natives: progress towards elimination of a health disparity.
Vaccine. 2005;23(48-49):5464-73.
91. Klugman KP, Madhi SA, Huebner RE, et al. A trial of a 9-valent pneumococcal
conjugate vaccine in children with and those without HIV infection. N Engl J Med.
2003;349(14):1341-8.
92. Lucero MG, Nohynek H, Williams G, et al. Efficacy of an 11-valent
pneumococcal conjugate vaccine against radiologically confirmed pneumonia among
198
children less than 2 years of age in the Philippines: a randomized, double-blind,
placebo-controlled trial. Pediatr Infect Dis J. 2009;28(6):455-62.
93. Pavia M, Bianco A, Nobile CGA, et al. Efficacy of pneumococcal vaccination in
children younger than 24 months: a meta-analysis. Pediatrics. 2009;123(6):e1103-10.
94. Close The Gap. Indigenous Health Equality Summit. Statement of intent 2008
[updated 20 March 2008; Accessed 31 August 2009]; Available from:
http://www.humanrights.gov.au/social_justice/health/statement_intent.pdf.
95. Hoy WE. "Closing the gap" by 2030: aspiration versus reality in Indigenous
health. Med J Aust. 2009;190(10):542-4.
96. De Wals P, Robin E, Fortin E, et al. Pneumonia after implementation of the
pneumococcal conjugate vaccine program in the province of Quebec, Canada. Pediatr
Infect Dis J. 2008;27(11):963-8.
97. Grijalva CG, Nuorti JP, Arbogast PG, et al. Decline in pneumonia admissions
after routine childhood immunisation with pneumococcal conjugate vaccine in the USA:
a time-series analysis. Lancet. 2007;369(9568):1179-86.
98. Zhou F, Kyaw MH, Shefer A, et al. Health care utilization for pneumonia in
young children after routine pneumococcal conjugate vaccine use in the United States.
Arch Pediatr Adolesc Med. 2007;161(12):1162-68.
99. Australian Bureau of Statistics. 3235.0 - Population by Age and Sex, Australia,
2006. Canberra: Australian Bureau of Statistics 2006. Report No.: 3235.0.
100. Australian Bureau of Statistics. 3238.0 - Experimental Estimates and
Projections, Aboriginal and Torres Strait Islander Australians, 1991 to 2021. Canberra:
Australian Bureau of Statistics 2006. Report No.: 3238.0.
101. Jardine A, Menzies R, McIntyre P. The impact of pneumococcal conjugate
vaccination on hospitalisation for respiratory infections in the Australian Indigenous
population. 7th International Symposium on Pneumococci and Pneumococcal
Diseases; 14-18 March; Tel Aviv, Israel 2010.
102. Department of Indigenous Affairs. Overcoming Indigenous Disadvantage in
Western Australia Report 2005. Perth: Department of Indigenous Affairs 2005.
199
103. Bower C, Ramsay JM. Congenital heart disease: a 10 year cohort. J Paediatr
Child Health. 1994;30(5):414-18.
104. Bolisetty S, Wheaton G, Chang AB. Respiratory syncytial virus infection and
immunoprophylaxis for selected high-risk children in Central Australia. Aust J Rural
Health. 2005;13(5):265-70.
105. Panozzo CA, Fowlkes AL, Anderson LJ. Variation in timing of respiratory
syncytial virus outbreaks: lessons from national surveillance. Pediatr Infect Dis J.
2007;26(11 Suppl):S41-5.
106. Prietsch SOM, Fischer GB, Cesar JA, et al. Acute lower respiratory illness in
under-five children in Rio Grande, Rio Grande do Sul State, Brazil: prevalence and risk
factors. Cad Saude Publica. 2008;24(6):1429-38.
107. Koch A, Molbak K, Homoe P, et al. Risk factors for acute respiratory tract
infections in young Greenlandic children. Am J Epidemiol. 2003;158(4):374-84.
108. Rockhill B, Newman B, Weinberg C. Use and misuse of population attributable
fractions.[erratum appears in Am J Public Health. 2008 Dec;98(12):2119]. Am J Public
Health. 1998;88(1):15-9.
109. Rothman K, Greenland S. Modern Epidemiology 2nd Edition. Philadelphia:
Lippincott Williams & Wilkins; 1998.
110. Northridge ME. Public health methods--attributable risk as a link between
causality and public health action. Am J Public Health. 1995;85(9):1202-4.
111. Banerji A, Greenberg D, White LF, et al. Risk factors and viruses associated
with hospitalization due to lower respiratory tract infections in Canadian Inuit children :
a case-control study. Pediatr Infect Dis J. 2009;28(8):697-701.
112. Bueving HJ, van der Wouden JC, Berger MY, et al. Incidence of influenza and
associated illness in children aged 0-19 years: a systematic review. Rev Med Virol.
2005;15(6):383-91.
113. Karevold G, Kvestad E, Nafstad P, et al. Respiratory infections in school
children: co-morbidity and risk factors. Arch Dis Child. 2006;91(5):391-5.
200
114. Conde-Agudelo A, Belizan JM, Lindmark G. Maternal morbidity and mortality
associated with multiple gestations. Obstet Gynecol. 2000;95(6 Pt 1):899-904.
115. Australian Bureau of Statistics. Technical Paper: Census of population and
housing: Socio-Economic Indexes for Area's (SEIFA). Cat 2039.0.55.001. Canberra:
Australian Bureau of Statistics 2001.
116. Australian Bureau of Statistics. Information Paper: 1996 Census of population
and housing - socio-economic indexes for areas. Cat 2039.0. Canberra: Australian
Bureau of Statistics 1996.
117. Australian Bureau of Statistics. Census of Population and Housing: Selected
Social and Housing Characteristics for Statistical Local Areas: Western Australia, Cat
No. 2015.5. Canberra: Australian Bureau of Statistics 2001.
118. GISCA. Accessibility/Remoteness Index of Australia Plus Version 1.1:
Methodology. Adelaide: GISCA - The national centre for social applications of
geographic information systems 2004.
119. Greenland S, Drescher K. Maximum likelihood estimation of the attributable
fraction from logistic models. Biometrics. 1993;49(3):865-72.
120. Boyce TG, Mellen BG, Mitchel EF, Jr., et al. Rates of hospitalization for
respiratory syncytial virus infection among children in medicaid. J Pediatr.
2000;137(6):865-70.
121. Brownstein JS, Kleinman KP, Mandl KD. Identifying pediatric age groups for
influenza vaccination using a real-time regional surveillance system. Am J Epidemiol.
2005;162(7):686-93.
122. Broughton S, Roberts A, Fox G, et al. Prospective study of healthcare utilisation
and respiratory morbidity due to RSV infection in prematurely born infants. Thorax.
2005;60(12):1039-44.
123. Kimberlin DF, Hauth JC, Owen J, et al. Indicated versus spontaneous preterm
delivery: An evaluation of neonatal morbidity among infants weighing <= 1000 grams at
birth. Am J Obstet Gynecol. 1999;180(3):683-89.
201
124. Hansen AK, Wisborg K, Uldbjerg N, et al. Elective caesarean section and
respiratory morbidity in the term and near-term neonate. Acta Obstet Gynecol Scand.
2007;86(4):389-94.
125. Carroll KN, Gebretsadik T, Griffin MR, et al. Maternal asthma and maternal
smoking are associated with increased risk of bronchiolitis during infancy. Pediatrics.
2007;119(6):1104-12.
126. Hakansson A, Kidd A, Wadell G, et al. Adenovirus infection enhances in vitro
adherence of Streptococcus pneumoniae. Infect Immun. 1994;62(7):2707-14.
127. Mooney G, Houston S. An alternative approach to resource allocation: weighted
capacity to benefit plus MESH infrastructure. Appl Health Econ Health Policy.
2004;3(1):29-33.
128. Sorensen TK, Dempsey JC, Xiao R, et al. Maternal asthma and risk of preterm
delivery. Ann Epidemiol. 2003;13(4):267-72.
129. Stjernholm YV, Petersson K, Eneroth E. Changed indications for cesarean
sections. Acta. 2010;89(1):49-53.
130. Joseph KS, Young DC, Dodds L, et al. Changes in maternal characteristics and
obstetric practice and recent increases in primary cesarean delivery. Obstet Gynecol.
2003;102(4):791-800.
131. O'Leary CM, de Klerk N, Keogh J, et al. Trends in mode of delivery during
1984-2003: can they be explained by pregnancy and delivery complications? BJOG.
2007;114(7):855-64. Epub 2007 May 15.
132. Moczygemba CK, Paramsothy P, Meikle S, et al. Route of delivery and
neonatal birth trauma. Am J Obstet Gynecol. 2010;202(361):e1-e6.
133. Hansen AK, Wisborg K, Uldbjerg N, et al. Risk of respiratory morbidity in term
infants delivered by elective caesarean section: cohort study. BMJ. 2008;336(7635):85-
7. Epub 2007 Dec 11.
134. Gerten KA, Coonrod DV, Bay RC, et al. Cesarean delivery and respiratory
distress syndrome: does labor make a difference? Am J Obstet Gynecol. 2005;193(3
Pt 2):1061-4.
202
135. Fogelson NS, Menard MK, Hulsey T, et al. Neonatal impact of elective repeat
cesarean delivery at term: a comment on patient choice cesarean delivery. Am J
Obstet Gynecol. 2005;192(5):1433-6.
136. Nunes C, Ladeira S. Caesarean delivery could be a risk factor for asthma? J
Allergy Clin Immunol. 2007;119(1):S164.
137. Thavagnanam S, Fleming J, Bromley A, et al. A meta-analysis of the
association between caesarean section and childhood asthma. Clin Exp Allergy.
2008;38(4):629-33.
138. Baizhuang X, Juha P, Anna-Liisa H, et al. Caesarean section and risk of
asthma and allergy in adulthood. The Journal of allergy and clinical immunology.
2001;107(4):732-33.
139. Holt PG, Rowe J, Kusel M, et al. Toward improved prediction of risk for atopy
and asthma among preschoolers: a prospective cohort study. J Allergy Clin Immunol.
2010;125(3):653-9.
140. Hamilton BE, Martin JA, Ventura SJ, et al. Births: preliminary data for 2007:
National Centre for Health Statistics 2009.
141. Kusel MMH, de Klerk NH, Kebadze T, et al. Early-life respiratory viral infections,
atopic sensitization, and risk of subsequent development of persistent asthma. J
Allergy Clin Immunol. 2007;119(5):1105-10.
142. Malamitsi-Puchner A, Protonotariou E, Boutsikou T, et al. The influence of the
mode of delivery on circulating cytokine concentrations in the perinatal period. Early
Hum Dev. 2005;81(4):387-92.
143. Schulpis KH, Vlachos GD, Karikas GA, et al. The effect of the mode of delivery
on maternal-neonatal interleukin-6, biogenic amine and their precursor amino acid
concentrations. Clin Chem Lab Med. 2008;46(11):1624-30.
144. Macaubas C, de Klerk NH, Holt BJ, et al. Association between antenatal
cytokine production and the development of atopy and asthma at age 6 years. Lancet.
2003;362(9391):1192-7.
203
145. Gronlund MM, Lehtonen OP, Eerola E, et al. Fecal microflora in healthy infants
born by different methods of delivery: permanent changes in intestinal flora after
cesarean delivery. J Pediatr Gastroenterol Nutr. 1999;28(1):19-25.
146. Howell S, Johnston T, Macleod SL. Trends and determinants of caesarean
sections births in Queensland, 1997-2006. Aust N Z J Obstet Gynaecol.
2009;49(6):606-11.
147. Palencia R, Gafni A, Hannah ME, et al. The costs of planned cesarean versus
planned vaginal birth in the Term Breech Trial. CMAJ. 2006;174(8):1109-13.
148. Henderson J, Petrou S. The economic case for planned cesarean section for
breech presentation at term. CMAJ. 2006;174(8):1118-9.
149. Lydon-Rochelle M, Holt VL, Martin DP, et al. Association between method of
delivery and maternal rehospitalization. JAMA. 2000;283(18):2411-6.
150. Druzin ML, El-Sayed YY. Cesarean delivery on maternal request: wise use of
finite resources? A view from the trenches. Semin Perinatol. 2006;30(5):305-08.
151. Homer CS. Private health insurance uptake and the impact on normal birth and
costs: a hypothetical model. Aust Health Rev. 2002;25(2):32-37.
152. Noyola DE, Arteaga-Dominguez G. Contribution of respiratory syncytial virus,
influenza and parainfluenza viruses to acute respiratory infections in San Luis Potosi,
Mexico. Pediatr Infect Dis J. 2005;24(12):1049-52.
153. Tsai HP, Kuo PH, Liu CC, et al. Respiratory viral infections among pediatric
inpatients and outpatients in Taiwan from 1997 to 1999. J Clin Microbiol.
2001;39(1):111-8.
154. Ordas J, Boga JA, Alvarez-Arguelles M, et al. Role of metapneumovirus in viral
respiratory infections in young children. J Clin Microbiol. 2006;44(8):2739-42.
155. Pozo F, Garcia-Garcia ML, Calvo C, et al. High incidence of human bocavirus
infection in children in Spain. J Clin Virol. 2007;40(3):224-8.
156. Girard MP, Cherian T, Pervikov Y, et al. A review of vaccine research and
development: human acute respiratory infections. Vaccine. 2005;23(50):5708-24.
204
157. Neuzil KM, Zhu Y, Griffin MR, et al. Burden of interpandemic influenza in
children younger than 5 years: a 25-year prospective study. J Infect Dis.
2002;185(2):147-52.
158. Stensballe LGM, Devasundaram JKMM, Simoes EAFMD, et al. Respiratory
syncytial virus epidemics: the ups and downs of a seasonal virus. Pediatr Infect Dis J.
2003;22(2)(Supplement):S21-S32.
159. Vicente D, Montes M, Cilla G, et al. Hospitalization for respiratory syncytial virus
in the paediatric population in Spain. Epidemiol Infect. 2003;131(2):867-72.
160. Monto AS. Epidemiology of viral respiratory infections. Am J Med. 2002;112(6,
Supplement 1):4-12.
161. Fry AM, Curns AT, Harbour K, et al. Seasonal trends of human parainfluenza
viral infections: United States, 1990-2004. Clin Infect Dis. 2006;43(8):1016-22.
162. Baron EJ, editor. Manual of Clinical Microbiology 7th Edition. Washington, D.C.:
American Society for Microbiology; 1999.
163. Stolwijk AM, Straatman H, Zielhuis GA. Studying seasonality by using sine and
cosine functions in regression analysis. J Epidemiol Community Health.
1999;53(4):235-8.
164. Armstrong PK. Bound volume for the degree of Master of Applied Epidemiology
[MAE]. Canberra: Australian National University; 2003.
165. Taylor J, Bell M. Changing places: Indigenous population movement in the
1990s: Centre for Aboriginal Economic Policy Research, The Australian National
University 1999.
166. Zuccotti G, Amendola A, Vigano A, et al. Long-term immunogenicity of a
virosomal subunit inactivated influenza vaccine in children with asthma. Vaccine.
2007;25(37-38):6692-8.
167. Monto AS. Occurrence of respiratory virus: time, place and person. Pediatr
Infect Dis J. 2004;23(1)(Supplement):S58-S64.
168. Segal AO, Crighton EJ, Moineddin R, et al. Croup hospitalizations in Ontario: a
14-year time-series analysis. Pediatrics. 2005;116(1):51-5.
205
169. Weigl JAI, Puppe W, Meyer CU, et al. Ten years' experience with year-round
active surveillance of up to 19 respiratory pathogens in children. Eur J Pediatr.
2007;166(9):957-66.
170. Bourgeois FT, Valim C, Wei JC, et al. Influenza and other respiratory virus-
related emergency department visits among young children. Pediatrics.
2006;118(1):e1-e8.
171. Meissner H. Summary: seasonal and geographic variation in respiratory
syncytial virus outbreaks across the United States. Pediatr Infect Dis J.
2007;26(11):S60.
172. Brownlee JW, Turner RB. New developments in the epidemiology and clinical
spectrum of rhinovirus infections. Curr Opin Pediatr. 2008;20(1):67-71.
173. Calvo C, Garcia-Garcia M, Blanco C, et al. Role of rhinovirus in hospitalized
infants with respiratory tract infections in Spain. Pediatr Infect Dis J. 2007;26(10):904-
08.
174. Kusel M, de Klerk N, Holt P, et al. Role of respiratory viruses in acute upper and
lower respiratory tract illness in the first year of life - a birth cohort study. Pediatr Infect
Dis J. 2006;25(8):680-86.
175. Souza LS, Ramos EA, Carvalho FM, et al. Viral respiratory infections in young
children attending day care in urban Northeast Brazil. Pediatr Pulmonol.
2003;35(3):184-91.
176. Freid VM, Makuc DM, Rooks RN. Ambulatory health care visits by children:
principal diagnosis and place of visit. Vital Health Stat 13. 1998;13(137):1-23.
177. Otters HB, van der Wouden JC, Schellevis FG, et al. Trends in prescribing
antibiotics for children in Dutch general practice. J Antimicrob Chemother.
2004;53(2):361-6.
178. Pan Y, Henderson J, Britt H. Antibiotic prescribing in Australian general
practice: how has it changed from 1990-91 to 2002-03? Respir Med.
2006;100(11):2004-11.
206
179. Rovers MM, Schilder AG, Zielhuis GA, et al. Otitis media. Lancet.
2004;363(9407):465-73.
180. Leach AJ, Boswell JB, Asche V, et al. Bacterial colonization of the nasopharynx
predicts very early onset and persistence of otitis media in Australian Aboriginal infants.
Pediatr Infect Dis J. 1994;13(11):983-9.
181. Kilpi T, Herva E, Kaijalainen T, et al. Bacteriology of acute otitis media in a
cohort of Finnish children followed for the first two years of life. Pediatr Infect Dis J.
2001;20(7):654-62.
182. Faden H, Duffy L, Wasielewski R, et al. Relationship between nasopharyngeal
colonization and the development of otitis media in children. J Infect Dis.
1997;175(6):1440-5.
183. Alper CM, Winther B, Mandel EM, et al. Rate of concurrent otitis media in upper
respiratory tract infections with specific viruses. Arch Otolaryngol Head Neck Surg.
2009;135(1):17-21.
184. Buchman CA, Brinson GM. Viral otitis media. Curr Allergy Asthma Rep.
2003;3(4):335-40.
185. Chantzi FM, Papadopoulos NG, Bairamis T, et al. Human rhinoviruses in otitis
media with effusion. Pediatr Allergy Immunol. 2006;17(7):514-8.
186. Chonmaitree T, Revai K, Grady JJ, et al. Viral upper respiratory tract infection
and otitis media complication in young children. Clin Infect Dis. 2008;46(6):815-23.
187. Heikkinen T. The role of respiratory viruses in otitis media. Vaccine. 2000;19
Suppl 1:S51-5.
188. Koivunen P, Kontiokari T, Niemela M, et al. Time to development of acute otitis
media during an upper respiratory tract infection in children. Pediatr Infect Dis J.
1999;18(3):303-5.
189. Peltola V, Waris M, Hyypia T, et al. Respiratory viruses in children with invasive
pneumococcal disease. Clin Infect Dis. 2006;43(2):266-8.
207
190. Vesa S, Kleemola M, Blomqvist S, et al. Epidemiology of documented viral
respiratory infections and acute otitis media in a cohort of children followed from two to
twenty-four months of age. Pediatr Infect Dis J. 2001;20(6):574-81.
191. Yano H, Okitsu N, Hori T, et al. Detection of respiratory viruses in
nasopharyngeal secretions and middle ear fluid from children with acute otitis media.
Acta Otolaryngol (Stockh). 2009;129(1):19-24.
192. Jacoby P, Watson K, Bowman J, et al. Modelling the co-occurrence of
Streptococcos pneumoniae with other bacterial and viral pathogens in the upper
respiratory tract. Vaccine. 2007;25(13):2458-64.
193. Nokso-Koivisto J, Hovi T, Pitkaranta A. Viral upper respiratory tract infections in
young children with emphasis on acute otitis media. Int J Pediatr Otorhinolaryngol.
2006;70(8):1333-42.
194. Pitkaranta A, Roivainen M, Blomgren K, et al. Presence of viral and bacterial
pathogens in the nasopharynx of otitis-prone children: A prospective study. Int J
Pediatr Otorhinolaryngol. 2006;70(4):647-54.
195. McCullers JA. Insights into the interaction between influenza virus and
pneumococcus. Clin Microbiol Rev. 2006;19(3):571-82.
196. Jartti T, Jartti L, Peltola V, et al. Identification of respiratory viruses in
asymptomatic subjects: asymptomatic respiratory viral infections. Pediatr Infect Dis J.
2008;27(12):1103-7.
197. Leven M, Goossens H. Relevance of nucleic acid amplification techniques for
diagnosis of respiratory tract infections in the clinical laboratory. Clin Microbiol Rev.
1997;10(2):242-56.
198. Murray PR, Baron EJ, Jorgensen JH, et al., editors. Manual of Clinical
Microbiology. 8th ed. Washington: ASM Press; 2003.
199. Hanley JA, Negassa A, Edwardes MDd, et al. Statistical analysis of correlated
data using generalized estimating equations: an orientation. Am J Epidemiol.
2003;157(4):364-75.
208
200. Johnston SL, Sanderson G, Pattemore PK, et al. Use of polymerase chain
reaction for diagnosis of picornavirus infection in subjects with and without respiratory
symptoms. J Clin Microbiol. 1993;31(1):111-7.
201. van Gageldonk-Lafeber AB, Heijnen ML, Bartelds AI, et al. A case-control study
of acute respiratory tract infection in general practice patients in The Netherlands. Clin
Infect Dis. 2005;41(4):490-7.
202. Brundage JF. Interactions between influenza and bacterial respiratory
pathogens: implications for pandemic preparedness. Lancet Infect Dis. 2006;6(5):303-
12.
203. Peltola VT, McCullers JA. Respiratory viruses predisposing to bacterial
infections: role of neuraminidase. Pediatr Infect Dis J. 2004;23(1 Suppl):S87-S97.
204. Suzuki K, Bakaletz LO. Synergistic effect of adenovirus type 1 and nontypeable
Haemophilus influenzae in a chinchilla model of experimental otitis media. Infect
Immun. 1994;62(5):1710-18.
205. Avadhanula V, Rodriguez CA, Devincenzo JP, et al. Respiratory viruses
augment the adhesion of bacterial pathogens to respiratory epithelium in a viral
species- and cell type-dependent manner. J Virol. 2006;80(4):1629-36.
206. Tong HH, Fisher LM, Kosunick GM, et al. Effect of adenovirus type 1 and
influenza A virus on Streptococcus pneumoniae nasopharyngeal colonization and otitis
media in the chinchilla. Ann Otol Rhinol Laryngol. 2000;109(11):1021-7.
207. Jacoby P, Carville KS, Hall G, et al. Bacteria associated with otitis media in
Australian Aboriginal and non-Aboriginal children: effect of crowding and concurrent
bacterial carriage. Pediatr Infect Dis J. 2011;in press.
208. Kelman CW, Bass AJ, Holman CD. Research use of linked health data--a best
practice protocol. Aust N Z J Public Health. 2002;26(3):251-5.
209. Canducci F, Debiaggi M, Sampaolo M, et al. Two-year prospective study of
single infections and co-infections by respiratory syncytial virus and viruses identified
recently in infants with acute respiratory disease. J Med Virol. 2008;80(4):716-23.
209
210. Campbell PB, Masters PL, Rohwedder E. Whooping cough diagnosis: a clinical
evaluation of complementing culture and immunofluorescence with enzyme-linked
immunosorbent assay of pertussis immunoglobulin A in nasopharyngeal secretions. J
Med Microbiol. 1988;27(4):247-54.
211. Mathisen M, Strand TA, Valentiner-Branth P, et al. Respiratory viruses in
Nepalese children with and without pneumonia: a case-control study. Pediatr Infect Dis
J. 2010;29(8):731-5.
212. Muller-Pebody B, Edmunds WJ, Zambon MC, et al. Contribution of RSV to
bronchiolitis and pneumonia-associated hospitalizations in English children, April 1995-
March 1998. Epidemiol Infect. 2002;129(1):99-106.
213. Spokes PJ, Quinn HE, McAnulty JM. Review of the 2008-2009 pertussis
epidemic in NSW: notifications and hospitalisations. N S W Public Health Bull.
2010;21(7-8):167-73.
214. Brotherton J, Wang H, Schaffer A, et al. Vaccine preventable diseases and
vaccination coverage in Australia, 2003 to 2005. Commun Dis Intell. 2007;31 Suppl:S1-
152.
215. Nuolivirta K, Koponen P, He Q, et al. Bordetella pertussis infection is common
in nonvaccinated infants admitted for bronchiolitis. Pediatr Infect Dis J.
2010;29(11):1013-5.
216. Trutwein B, Holman CD, Rosman DL. Health data linkage conserves privacy in
a research-rich environment. Ann Epidemiol. 2006;16(4):279-80.
217. Australian Institute of Health and Welfare. Indigenous identification in hospital
separations data—quality report. Canberra 2010 Contract No.: Cat. HSE 85.
218. The Centre for Health Record Linkage. Centre for Health Record Linkage - The
first three years 2006–07 to 2008–09. Sydney: Cancer Institute NSW 2009.
219. Devaux I, Kreidl P, Penttinen P, et al. Initial surveillance of 2009 influenza
A(H1N1) pandemic in the European Union and European Economic Area, April-
September 2009. Euro Surveill. 2010;15(49):19740.
210
220. Pebody RG, McLean E, Zhao H, et al. Pandemic Influenza A (H1N1) 2009 and
mortality in the United Kingdom: risk factors for death, April 2009 to March 2010. Euro
Surveill. 2010;15(20):19571.
221. Britt H, Miller G, Bayram C. The quality of data on general practice - a
discussion of BEACH reliability and validity. Aust Fam Physician. 2007;36(1-2):36-40.
222. Dixon GA, Moore HC, Kelly H, et al. Lessons from the first year of the WAIVE
study investigating the protective effect of influenza vaccine against laboratory-
confirmed influenza in hospitalised children aged 6-59 months. Influenza Other Respi
Viruses. 2010;4(4):231-34.
223. Graham BS. Biological challenges and technological opportunities for
respiratory syncytial virus vaccine development. Immunol Rev. 2011;239(1):149-66.
doi: 10.1111/j.600-065X.2010.00972.x.
224. ClinicalTrials.gov. A study to evaluate the safety, tolerability, immunogenicity
and vaccine-like viral shedding of MEDI-534, against respiratory syncytial virus (RSV)
and parainfluenza virus type 3 (PIV3), in healthy 6 to < 24 month-old children and in 2
month old infants: US National Institutes of Health; 2011 [Accessed 14 Feb 2011];
Available from: http://www.clinicaltrials.gov/ct2/show/NCT00686075?intr=%22MEDI-
534%22&rank=1.
225. Gomez M, Mufson MA, Dubovsky F, et al. Phase-I study MEDI-534, of a live,
attenuated intranasal vaccine against respiratory syncytial virus and parainfluenza-3
virus in seropositive children. Pediatr Infect Dis J. 2009;28(7):655-8.
226. Freymuth F, Vabret A, Cuvillon-Nimal D, et al. Comparison of multiplex PCR
assays and conventional techniques for the diagnostic of respiratory virus infections in
children admitted to hospital with an acute respiratory illness. J Med Virol.
2006;78(11):1498-504.
227. Vynnycky E, WHite RG. An introduction to infectious diseases modelling.
Oxford: Oxford University Press; 2010.
228. Fraser C, Donnelly CA, Cauchemez S, et al. Pandemic potential of a strain of
influenza A (H1N1): early findings. Science. 2009;324(5934):1557-61.
211
229. Milne GJ, Kelso JK, Kelly HA, et al. A small community model for the
transmission of infectious diseases: comparison of school closure as an intervention in
individual-based models of an influenza pandemic. PLoS One. 2008;3(12):e4005.
230. Weber A, Weber M, Milligan P. Modeling epidemics caused by respiratory
syncytial virus (RSV). Math Biosci. 2001;172(2):95-113.
231. Acedo L, Diez-Domingo J, Morano JA, et al. Mathematical modelling of
respiratory syncytial virus (RSV): vaccination strategies and budget applications.
Epidemiol Infect. 2010;138(6):853-60.
232. Malhotra A, Hunt RW, Doherty RR. Streptococcus pneumoniae sepsis in the
newborn. J Paediatr Child Health. 2010;doi: 10.1111/j.1440-1754.2010.01929.x.
233. Bailie RS, Si D, Dowden MC, et al. A systems approach to improving timeliness
of immunisation. Vaccine. 2009;27(27):3669-74.
234. O'Grady KA, Krause V, Andrews R. Immunisation coverage in Australian
Indigenous children: Time to move the goal posts. Vaccine. 2009;27(2):307-12.
212
APPENDIX
Note: Appendices 1-4 are not available in digital format due to copyright.