Embed Size (px)
Citation preview
Epidemiological Highlights Week 7, 2019
1 |
Epidemiological Highlights
Week 7, 2019
Epidemiological Highlights Week 7, 2019
2 |
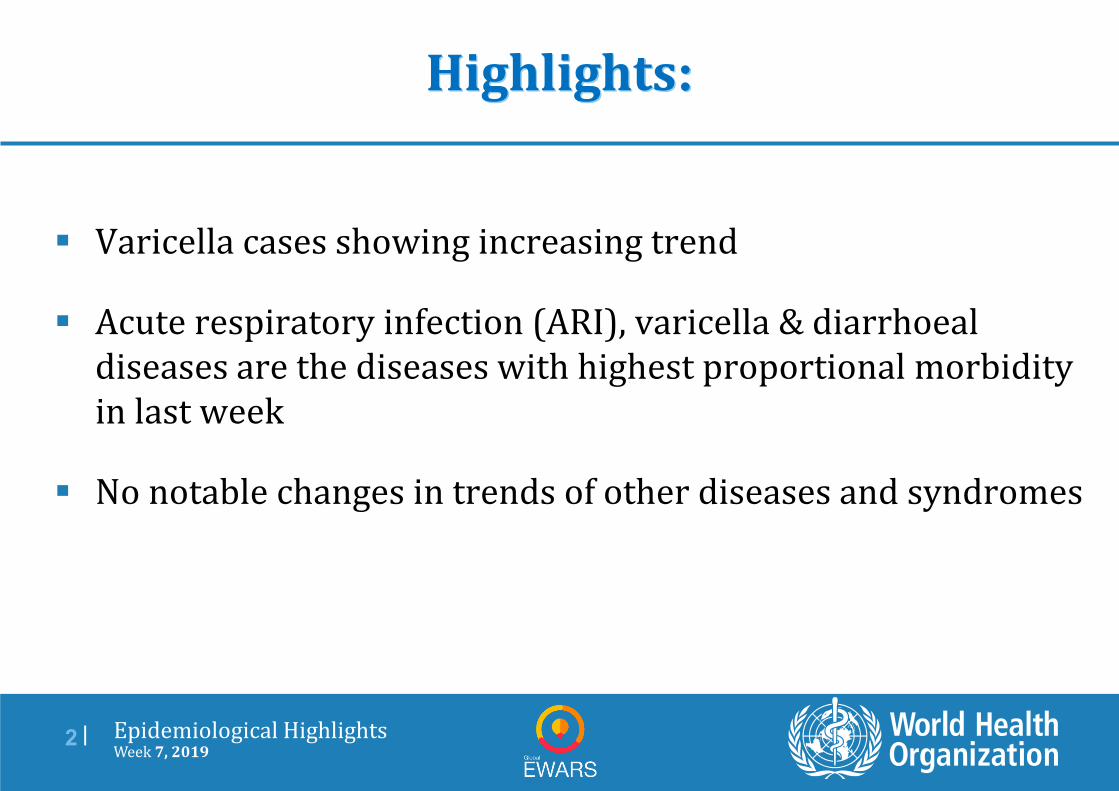
Highlights:
Varicella cases showing increasing trend
Acute respiratory infection (ARI), varicella & diarrhoeal diseases are the diseases with highest proportional morbidity in last week
No notable changes in trends of other diseases and syndromes
Epidemiological Highlights Week 7, 2019
3 |
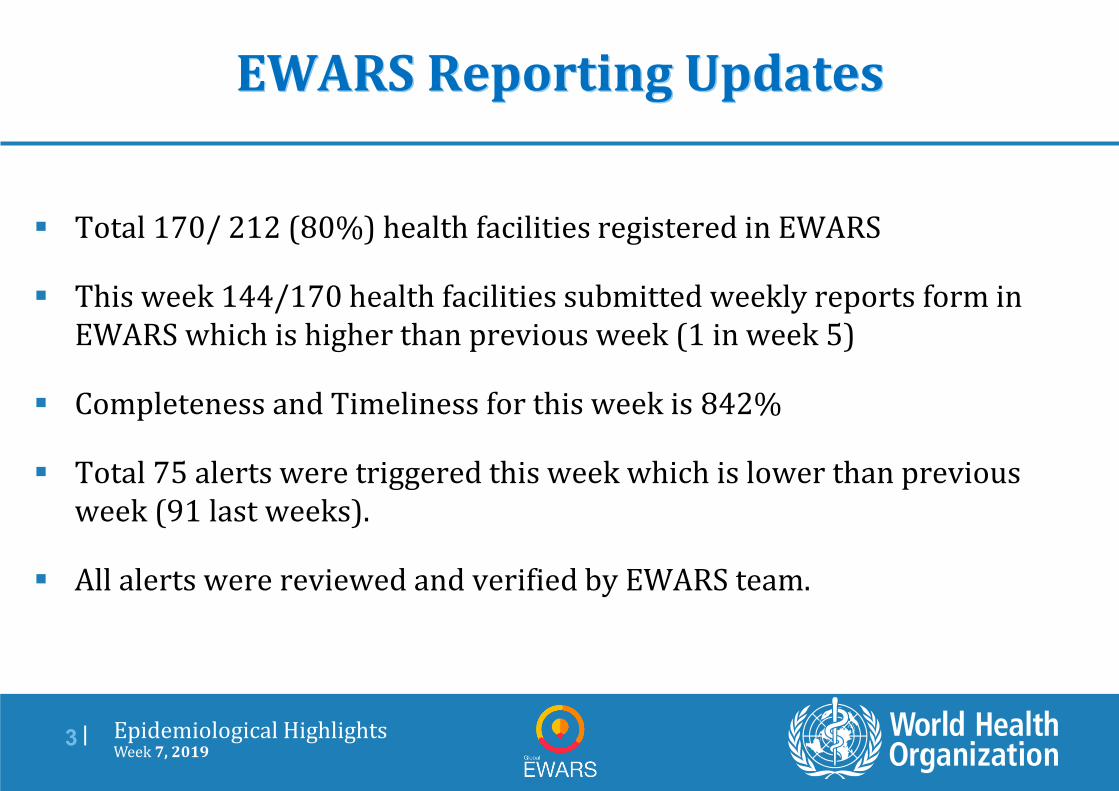
EWARS Reporting Updates
Total 170/ 212 (80%) health facilities registered in EWARS
This week 144/170 health facilities submitted weekly reports form in EWARS which is higher than previous week (1 in week 5)
Completeness and Timeliness for this week is 842%
Total 75 alerts were triggered this week which is lower than previous week (91 last weeks).
All alerts were reviewed and verified by EWARS team.
Epidemiological Highlights Week 7, 2019
4 |
Varicella
This week we received 9 232 varicella cases via weekly report form which in more than previous week (7 285 in week 6, 6 090 in week 5 & 5 376 cases in week 4).
A total 114 Facilities reported Varicella cases in EWARS which is less than previous week (110 facilities in week 6).
No complicated varicella case report this week.
Epidemiological Highlights Week 7, 2019
5 |
Diphtheria
No new diphtheria case-patient was reported this week which might be a reporting delay in EWARS.
Total case-patients reported = 8 442 – Confirmed case = 293
– Probable case = 2 719
– Suspected case = 5 430
The last confirmed case was reported on 31 December 2018 (Epi week 1 2019).
Total number of deaths reported till now is 45. Last death was reported on 15 January 2019.
No death reported from host community
Epidemiological Highlights Week 7, 2019
6 |
Measles
14 new suspected case reported via weekly reporting this week less than previous week (29 cases in week 6).
A total of 133 cases were reported in first 7 weeks of 2019 out of which only 60 reported with case report form.
All cases reported with cases report form were being traced by WHO-IVD team.
WHO is supporting ministry of health (MoH) in routine measles surveillance in FDMN population
BangladeshRohingya Emergency Response
Ministry of Health and FamilyWelfare Bangladesh Printed: 02:49 Wednesday, 20 February 2019 UTC
Early Warning, Alert and Response System (EWARS)Epidemiological Bulletin W7 2019
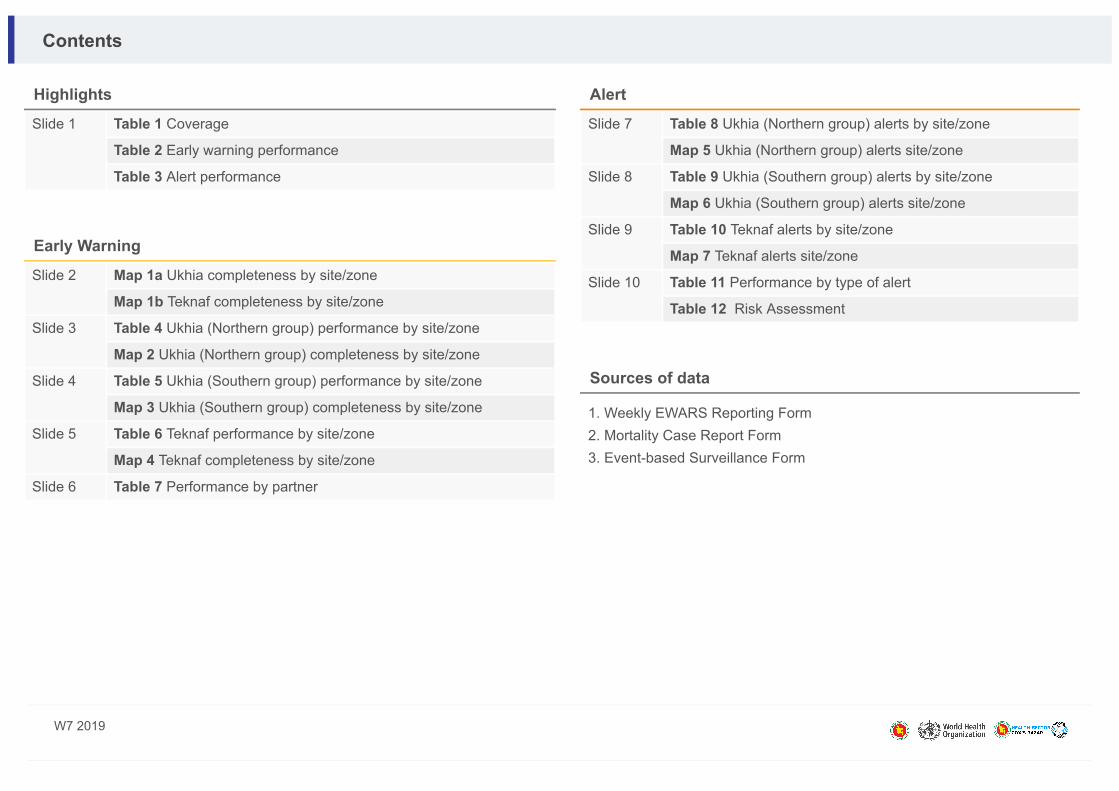
Highlights
Slide 1 Table 1 Coverage
Table 2 Early warning performance
Table 3 Alert performance
Early Warning
Slide 2 Map 1a Ukhia completeness by site/zone
Map 1b Teknaf completeness by site/zone
Slide 3 Table 4 Ukhia (Northern group) performance by site/zone
Map 2 Ukhia (Northern group) completeness by site/zone
Slide 4 Table 5 Ukhia (Southern group) performance by site/zone
Map 3 Ukhia (Southern group) completeness by site/zone
Slide 5 Table 6 Teknaf performance by site/zone
Map 4 Teknaf completeness by site/zone
Slide 6 Table 7 Performance by partner
Alert
Slide 7 Table 8 Ukhia (Northern group) alerts by site/zone
Map 5 Ukhia (Northern group) alerts site/zone
Slide 8 Table 9 Ukhia (Southern group) alerts by site/zone
Map 6 Ukhia (Southern group) alerts site/zone
Slide 9 Table 10 Teknaf alerts by site/zone
Map 7 Teknaf alerts site/zone
Slide 10 Table 11 Performance by type of alert
Table 12 Risk Assessment
Sources of data
1. Weekly EWARS Reporting Form 2. Mortality Case Report Form 3. Event-based Surveillance Form
Contents
W7 2019
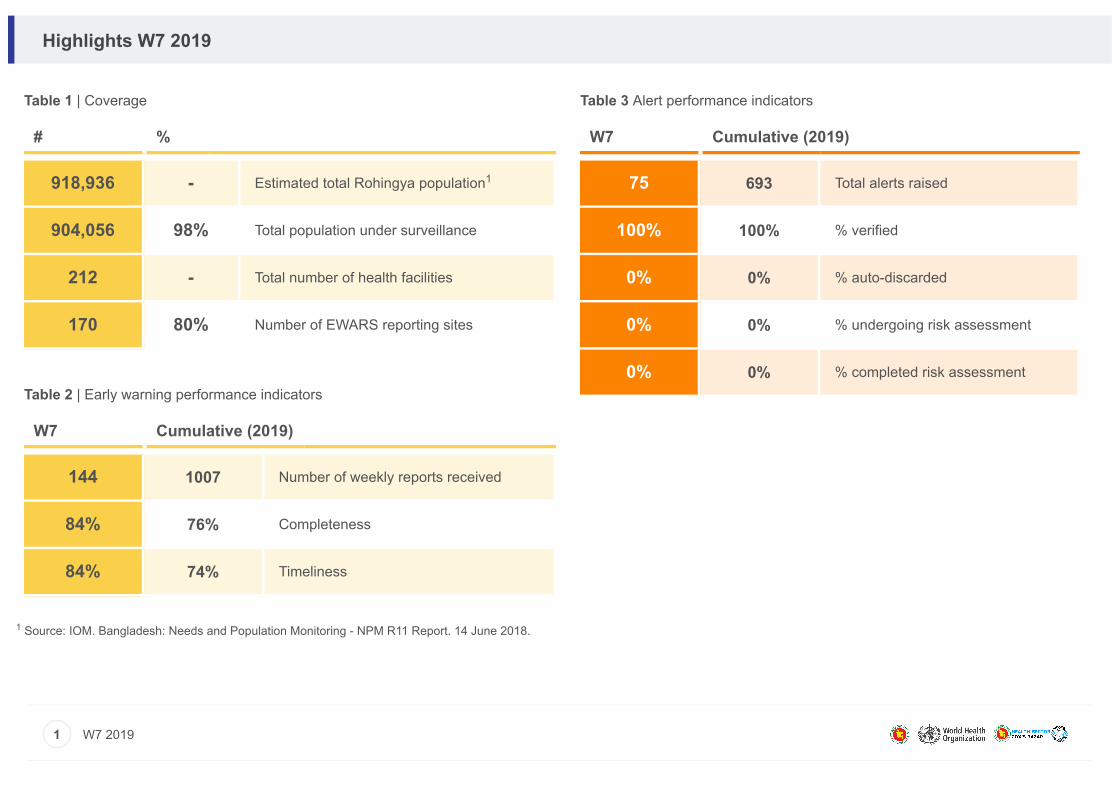
Table 1 | Coverage
# %
918,936 - Estimated total Rohingya population
904,056 98% Total population under surveillance
212 - Total number of health facilities
170 80% Number of EWARS reporting sites
Table 2 | Early warning performance indicators
W7 Cumulative (2019)
144 1007 Number of weekly reports received
84% 76% Completeness
84% 74% Timeliness
Table 3 Alert performance indicators
W7 Cumulative (2019)
75 693 Total alerts raised
100% 100% % verified
0% 0% % auto-discarded
0% 0% % undergoing risk assessment
0% 0% % completed risk assessment
Source: IOM. Bangladesh: Needs and Population Monitoring - NPM R11 Report. 14 June 2018.
Highlights W7 2019
1 W7 2019
1
1
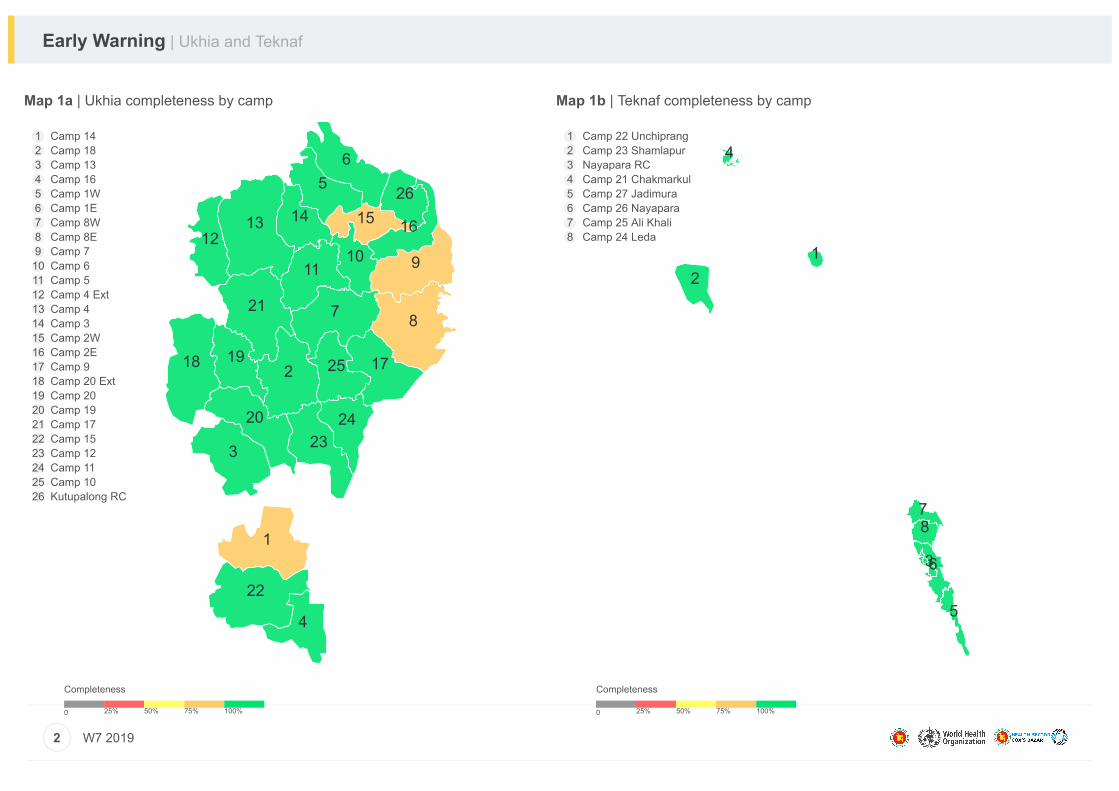
Map 1a | Ukhia completeness by camp
Completeness 0 25% 50% 75% 100%
Map 1b | Teknaf completeness by camp
Completeness 0 25% 50% 75% 100%
Early Warning | Ukhia and Teknaf
2 W7 2019
1
2
3
4
56
7 8
91011
1213 14 15 16
1718 19
20
21
22
2324
25
26
1 Camp 142 Camp 183 Camp 134 Camp 165 Camp 1W6 Camp 1E7 Camp 8W8 Camp 8E9 Camp 710 Camp 611 Camp 512 Camp 4 Ext13 Camp 414 Camp 315 Camp 2W16 Camp 2E17 Camp 918 Camp 20 Ext19 Camp 2020 Camp 1921 Camp 1722 Camp 1523 Camp 1224 Camp 1125 Camp 1026 Kutupalong RC
12
3
4
5
6
78
1 Camp 22 Unchiprang2 Camp 23 Shamlapur3 Nayapara RC4 Camp 21 Chakmarkul5 Camp 27 Jadimura6 Camp 26 Nayapara7 Camp 25 Ali Khali8 Camp 24 Leda
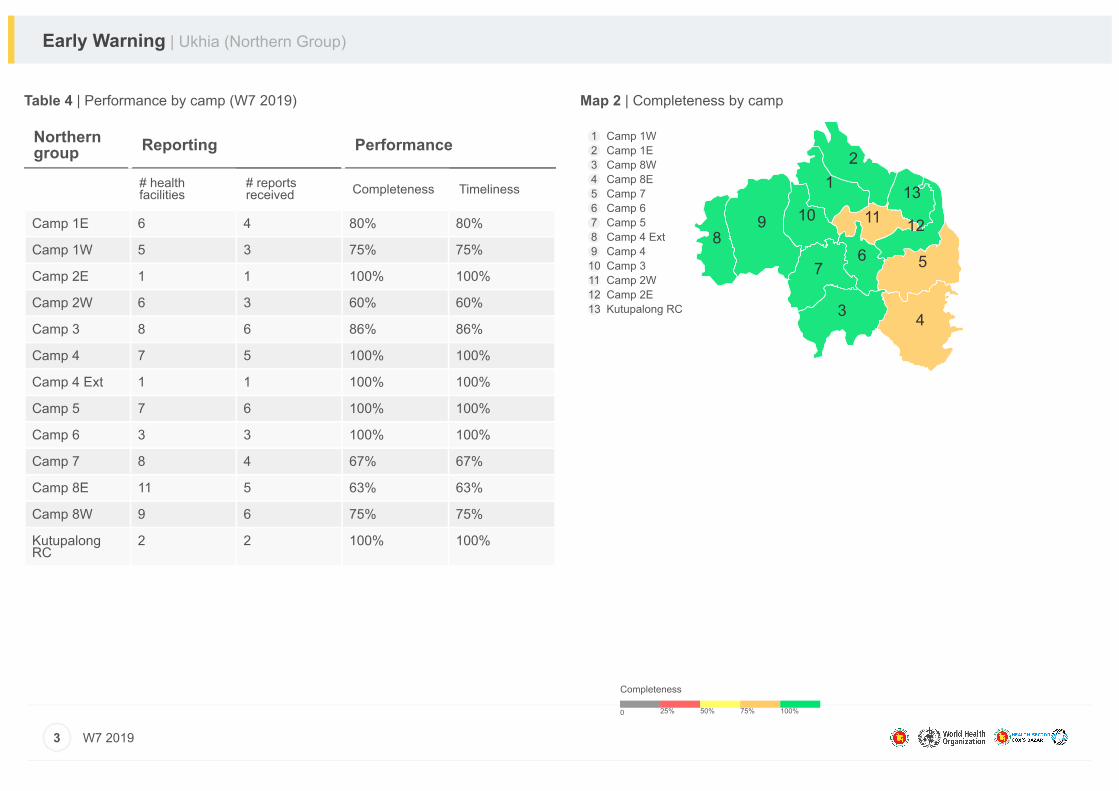
Northerngroup Reporting Performance
# healthfacilities
# reportsreceived Completeness Timeliness
Table 4 | Performance by camp (W7 2019) Map 2 | Completeness by camp
Completeness 0 25% 50% 75% 100%
Early Warning | Ukhia (Northern Group)
3 W7 2019
Camp 1E 6 4 80% 80%
Camp 1W 5 3 75% 75%
Camp 2E 1 1 100% 100%
Camp 2W 6 3 60% 60%
Camp 3 8 6 86% 86%
Camp 4 7 5 100% 100%
Camp 4 Ext 1 1 100% 100%
Camp 5 7 6 100% 100%
Camp 6 3 3 100% 100%
Camp 7 8 4 67% 67%
Camp 8E 11 5 63% 63%
Camp 8W 9 6 75% 75%
KutupalongRC
2 2 100% 100%
12
3 4
567
89 10 11 12
13
1 Camp 1W2 Camp 1E3 Camp 8W4 Camp 8E5 Camp 76 Camp 67 Camp 58 Camp 4 Ext9 Camp 410 Camp 311 Camp 2W12 Camp 2E13 Kutupalong RC
Southerngroup Reporting Performance
# healthfacilities
# reportsreceived Completeness Timeliness
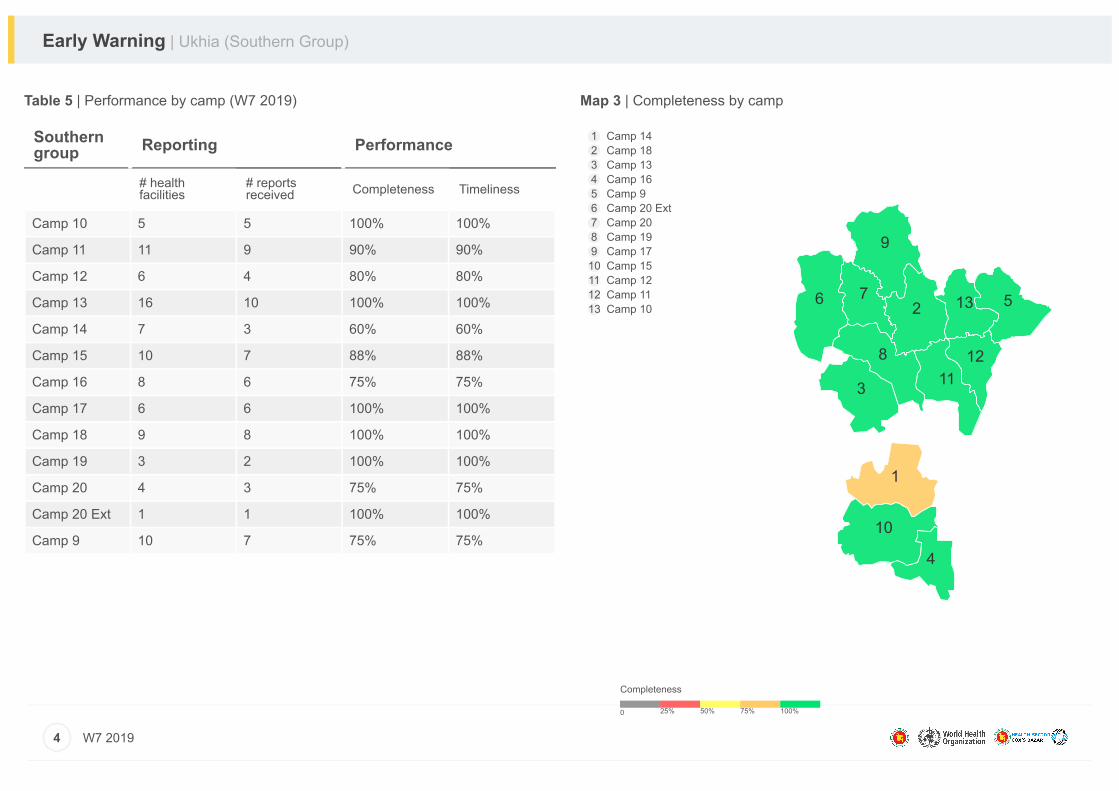
Table 5 | Performance by camp (W7 2019) Map 3 | Completeness by camp
Completeness 0 25% 50% 75% 100%
Early Warning | Ukhia (Southern Group)
4 W7 2019
Camp 10 5 5 100% 100%
Camp 11 11 9 90% 90%
Camp 12 6 4 80% 80%
Camp 13 16 10 100% 100%
Camp 14 7 3 60% 60%
Camp 15 10 7 88% 88%
Camp 16 8 6 75% 75%
Camp 17 6 6 100% 100%
Camp 18 9 8 100% 100%
Camp 19 3 2 100% 100%
Camp 20 4 3 75% 75%
Camp 20 Ext 1 1 100% 100%
Camp 9 10 7 75% 75%
1
2
3
4
56 7
8
9
10
1112
13
1 Camp 142 Camp 183 Camp 134 Camp 165 Camp 96 Camp 20 Ext7 Camp 208 Camp 199 Camp 1710 Camp 1511 Camp 1212 Camp 1113 Camp 10
Teknaf Reporting Performance
# healthfacilities
# reportsreceived Completeness Timeliness
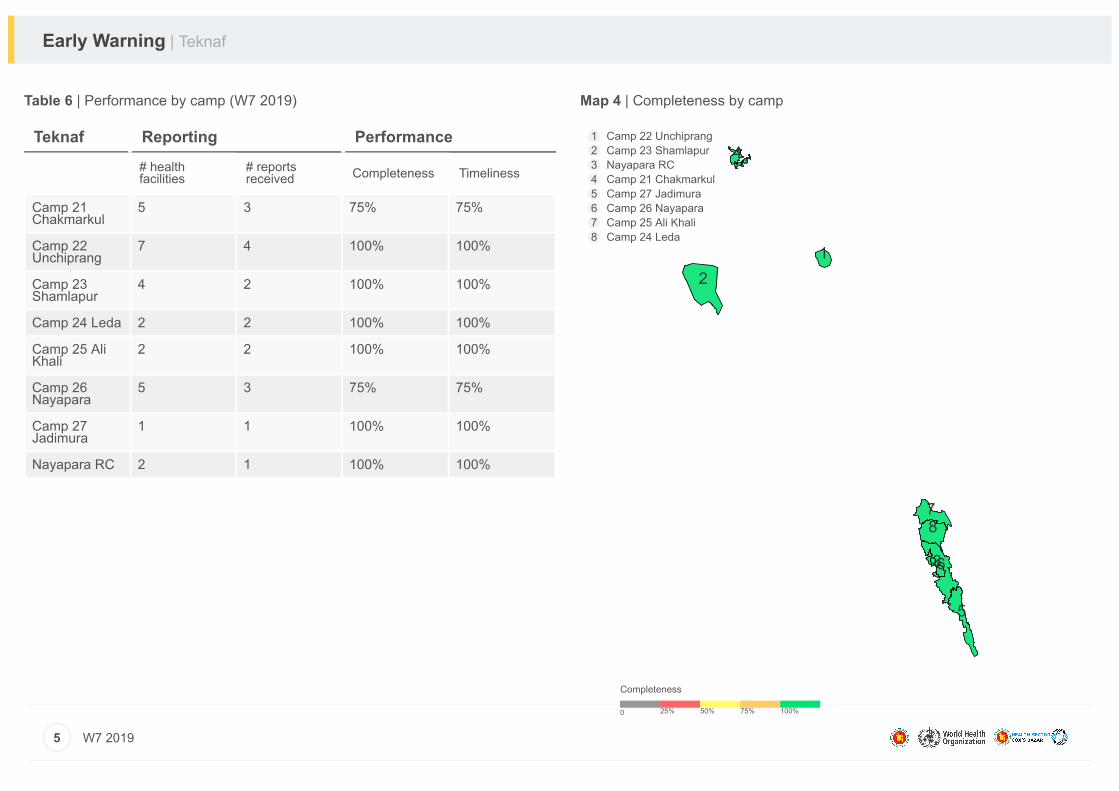
Table 6 | Performance by camp (W7 2019) Map 4 | Completeness by camp
Completeness 0 25% 50% 75% 100%
Early Warning | Teknaf
5 W7 2019
Camp 21Chakmarkul
5 3 75% 75%
Camp 22Unchiprang
7 4 100% 100%
Camp 23Shamlapur
4 2 100% 100%
Camp 24 Leda 2 2 100% 100%
Camp 25 AliKhali
2 2 100% 100%
Camp 26Nayapara
5 3 75% 75%
Camp 27Jadimura
1 1 100% 100%
Nayapara RC 2 1 100% 100%
12
3
4
5
6
78
1 Camp 22 Unchiprang2 Camp 23 Shamlapur3 Nayapara RC4 Camp 21 Chakmarkul5 Camp 27 Jadimura6 Camp 26 Nayapara7 Camp 25 Ali Khali8 Camp 24 Leda
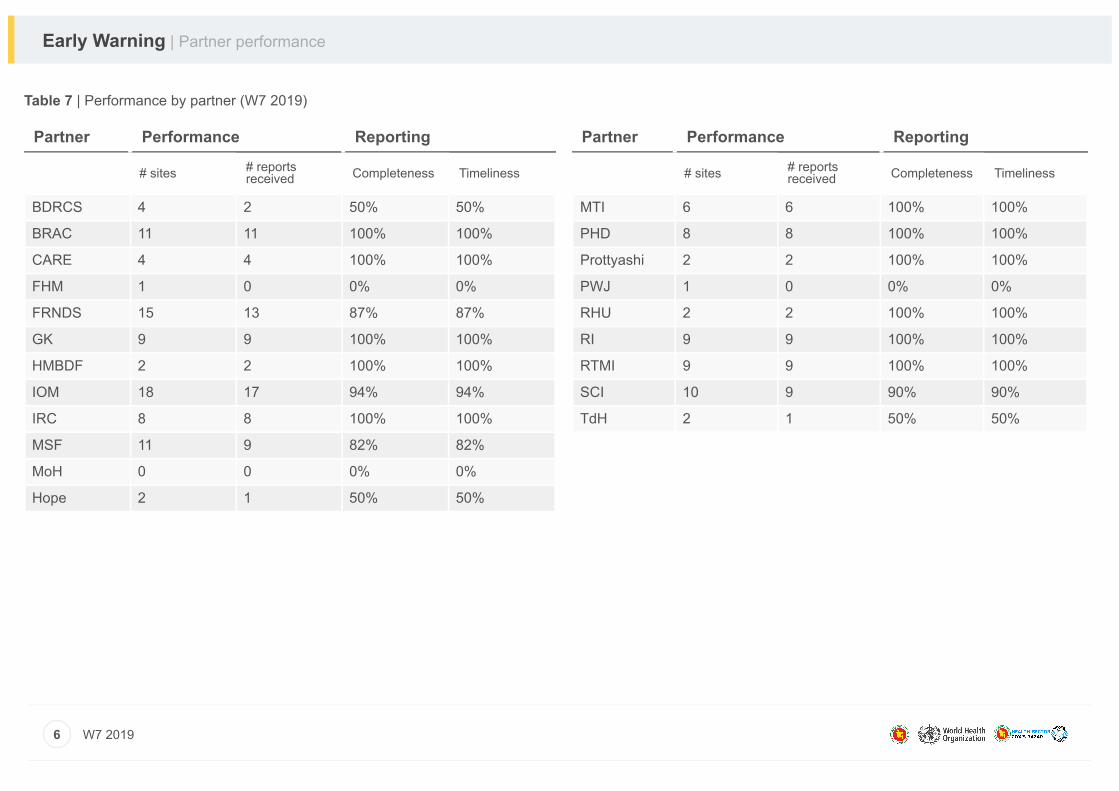
Partner Performance Reporting
# sites # reportsreceived Completeness Timeliness
BDRCS 4 2 50% 50%
BRAC 11 11 100% 100%
CARE 4 4 100% 100%
FHM 1 0 0% 0%
FRNDS 15 13 87% 87%
GK 9 9 100% 100%
HMBDF 2 2 100% 100%
IOM 18 17 94% 94%
IRC 8 8 100% 100%
MSF 11 9 82% 82%
MoH 0 0 0% 0%
Hope 2 1 50% 50%
Table 7 | Performance by partner (W7 2019)
Partner Performance Reporting
# sites # reportsreceived Completeness Timeliness
MTI 6 6 100% 100%
PHD 8 8 100% 100%
Prottyashi 2 2 100% 100%
PWJ 1 0 0% 0%
RHU 2 2 100% 100%
RI 9 9 100% 100%
RTMI 9 9 100% 100%
SCI 10 9 90% 90%
TdH 2 1 50% 50%
Early Warning | Partner performance
6 W7 2019
Northerngroup W7 Cumulative (2019)
# alerts % verif. # alerts % verif.
Northerngroup W7 Cumulative (2019)
# alerts % verif. # alerts % verif.
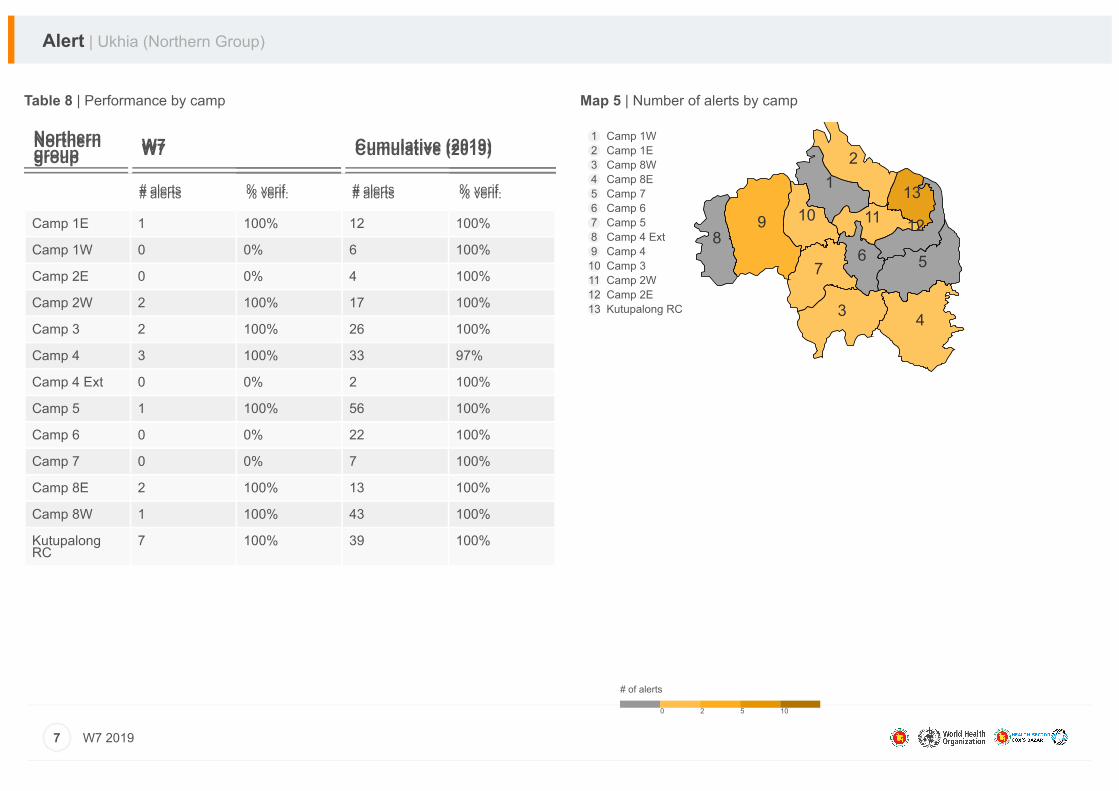
Table 8 | Performance by camp Map 5 | Number of alerts by camp
# of alerts 0 2 5 10
Alert | Ukhia (Northern Group)
7 W7 2019
Camp 1E 1 100% 12 100%
Camp 1W 0 0% 6 100%
Camp 2E 0 0% 4 100%
Camp 2W 2 100% 17 100%
Camp 3 2 100% 26 100%
Camp 4 3 100% 33 97%
Camp 4 Ext 0 0% 2 100%
Camp 5 1 100% 56 100%
Camp 6 0 0% 22 100%
Camp 7 0 0% 7 100%
Camp 8E 2 100% 13 100%
Camp 8W 1 100% 43 100%
KutupalongRC
7 100% 39 100%
12
3 4
567
89 10 11 12
13
1 Camp 1W2 Camp 1E3 Camp 8W4 Camp 8E5 Camp 76 Camp 67 Camp 58 Camp 4 Ext9 Camp 410 Camp 311 Camp 2W12 Camp 2E13 Kutupalong RC
Southerngroup W7 Cumulative (2019)
# alerts % verif. # alerts % verif.
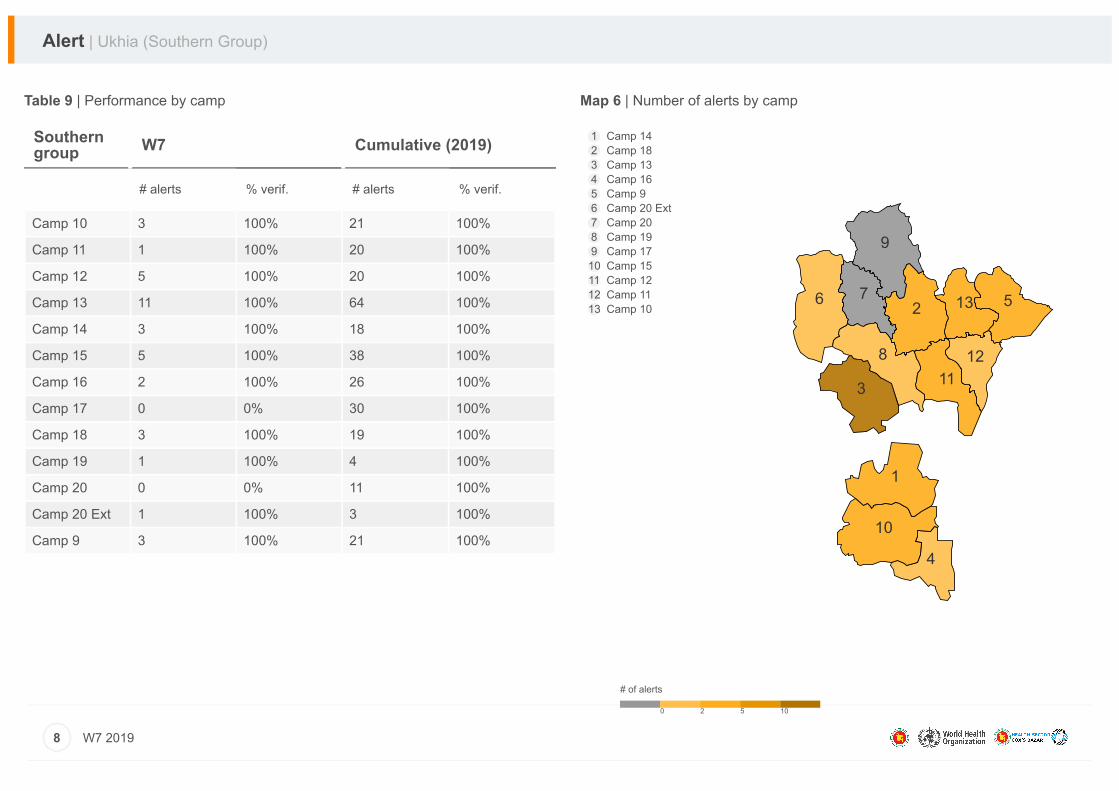
Table 9 | Performance by camp Map 6 | Number of alerts by camp
# of alerts 0 2 5 10
Alert | Ukhia (Southern Group)
8 W7 2019
Camp 10 3 100% 21 100%
Camp 11 1 100% 20 100%
Camp 12 5 100% 20 100%
Camp 13 11 100% 64 100%
Camp 14 3 100% 18 100%
Camp 15 5 100% 38 100%
Camp 16 2 100% 26 100%
Camp 17 0 0% 30 100%
Camp 18 3 100% 19 100%
Camp 19 1 100% 4 100%
Camp 20 0 0% 11 100%
Camp 20 Ext 1 100% 3 100%
Camp 9 3 100% 21 100%
1
2
3
4
56 7
8
9
10
1112
13
1 Camp 142 Camp 183 Camp 134 Camp 165 Camp 96 Camp 20 Ext7 Camp 208 Camp 199 Camp 1710 Camp 1511 Camp 1212 Camp 1113 Camp 10
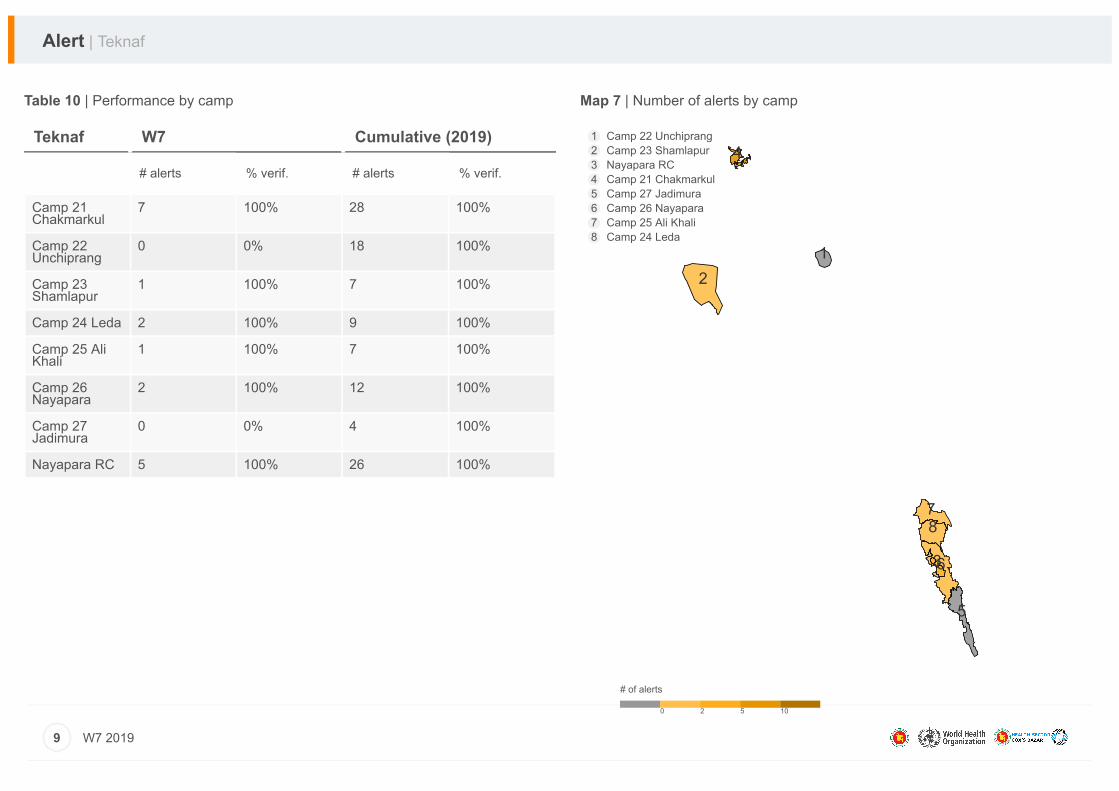
Teknaf W7 Cumulative (2019)
# alerts % verif. # alerts % verif.
Table 10 | Performance by camp Map 7 | Number of alerts by camp
# of alerts 0 2 5 10
Alert | Teknaf
9 W7 2019
Camp 21Chakmarkul
7 100% 28 100%
Camp 22Unchiprang
0 0% 18 100%
Camp 23Shamlapur
1 100% 7 100%
Camp 24 Leda 2 100% 9 100%
Camp 25 AliKhali
1 100% 7 100%
Camp 26Nayapara
2 100% 12 100%
Camp 27Jadimura
0 0% 4 100%
Nayapara RC 5 100% 26 100%
12
3
4
5
6
78
1 Camp 22 Unchiprang2 Camp 23 Shamlapur3 Nayapara RC4 Camp 21 Chakmarkul5 Camp 27 Jadimura6 Camp 26 Nayapara7 Camp 25 Ali Khali8 Camp 24 Leda
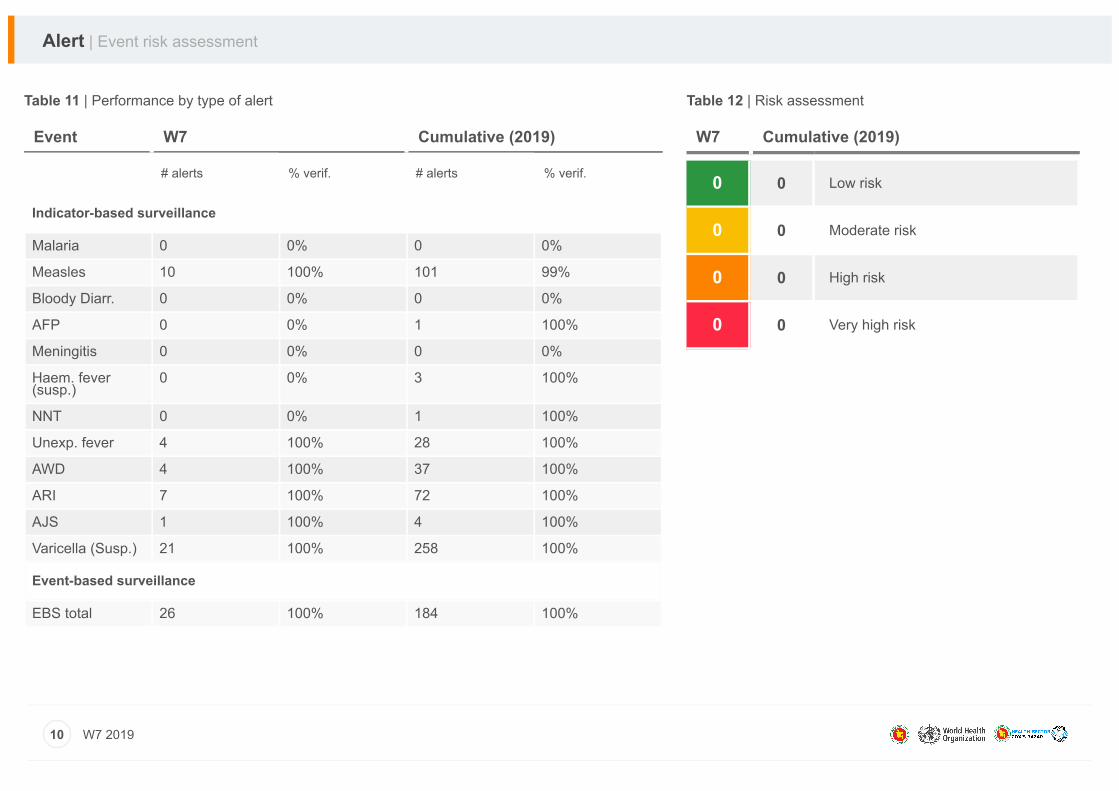
Event W7 Cumulative (2019)
# alerts % verif. # alerts % verif.
Indicator-based surveillance
Malaria 0 0% 0 0%
Measles 10 100% 101 99%
Bloody Diarr. 0 0% 0 0%
AFP 0 0% 1 100%
Meningitis 0 0% 0 0%
Haem. fever(susp.)
0 0% 3 100%
NNT 0 0% 1 100%
Unexp. fever 4 100% 28 100%
AWD 4 100% 37 100%
ARI 7 100% 72 100%
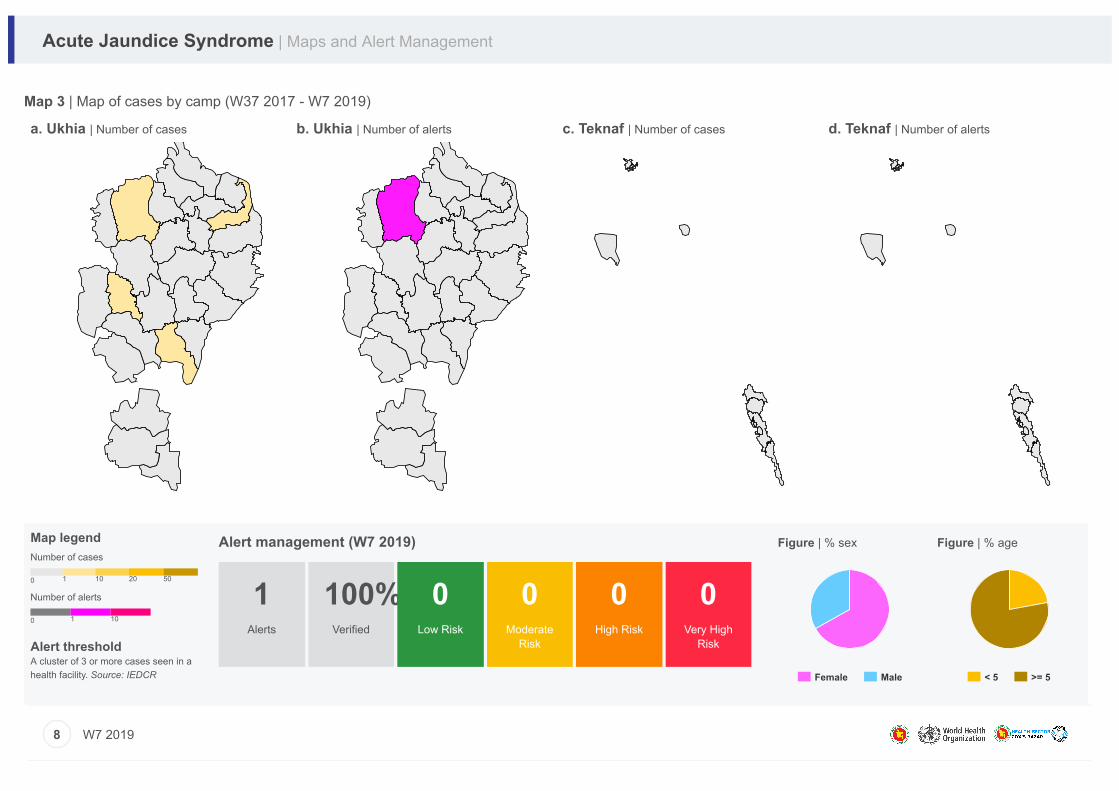
AJS 1 100% 4 100%
Varicella (Susp.) 21 100% 258 100%
Event-based surveillance
EBS total 26 100% 184 100%
Table 11 | Performance by type of alert Table 12 | Risk assessment
W7 Cumulative (2019)
0 0 Low risk
0 0 Moderate risk
0 0 High risk
0 0 Very high risk
Alert | Event risk assessment
10 W7 2019
For more help and support, please contact:
Dr. Md. Alamgir Medical Officer Civil Surgeon Office Ministry of Health and Family Welfare Cox's Bazar, Bangladesh
Telephone: +88 018 1961 4952
Dr. Md Khadimul Anam Mazhar Surveillance and Outbreak Response Officer World Health Organization Cox's Bazar, Bangladesh
Telephone: +88 017 0120 8845
Email: [email protected]
NotesWHO and the Ministry of Health and Family Welfare gratefully acknowledge all partners who havereported the data used in this bulletin. The data been collected with support from the EWARS project. This is an initiative to strengthen earlywarning, alert and response in emergencies. It includes an online, desktop and mobile application thatcan be rapidly configured and deployed in the field. It is designed with frontline users in mind, and builtto work in difficult and remote operating environments. This bulletin has been automatically publishedfrom the EWARS application. More information can be found at http://ewars-project.org Sign-up for an account with EWARS Bangladesh at http://bd.ewars.ws
Ministry ofHealth andFamilyWelfare Bangladesh
BangladeshRohingya Emergency Response
Ministry of Health and FamilyWelfare Bangladesh Printed: 02:49 Wednesday, 20 February 2019 UTC
Early Warning, Alert and Response System (EWARS)Annex W7 2019
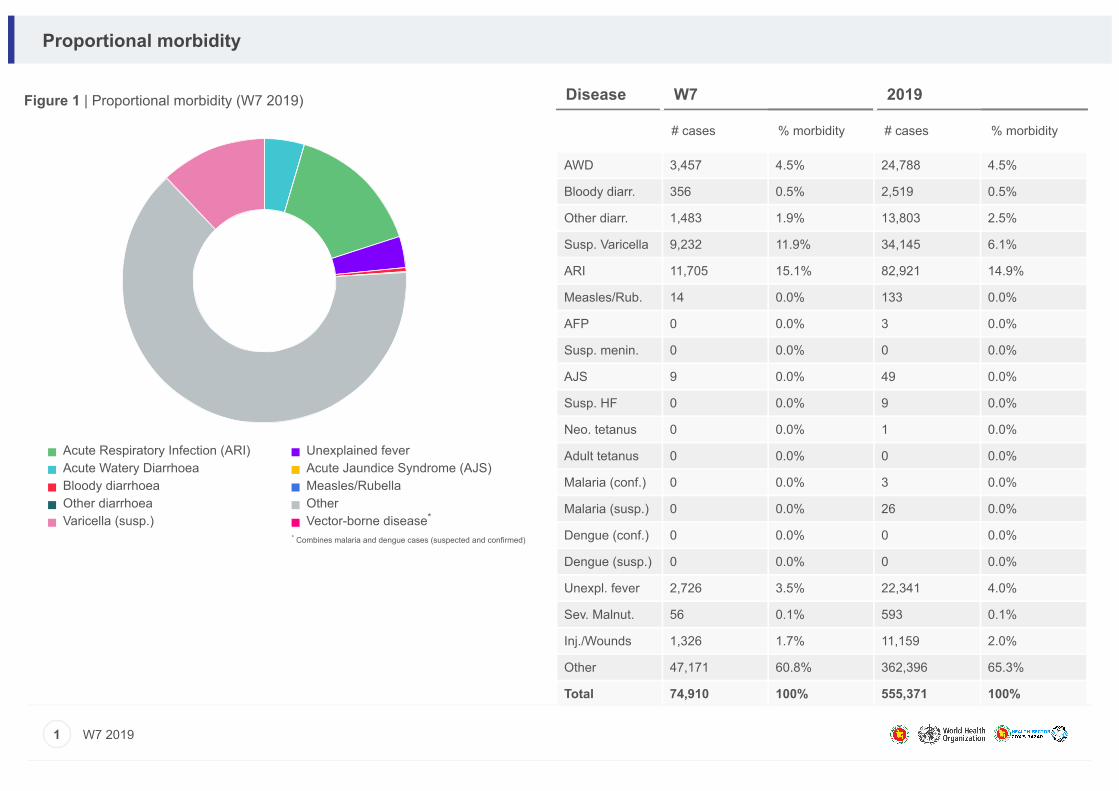
Figure 1 | Proportional morbidity (W7 2019)
Acute Respiratory Infection (ARI) Acute Watery Diarrhoea Bloody diarrhoea Other diarrhoea Varicella (susp.)
Unexplained fever Acute Jaundice Syndrome (AJS) Measles/Rubella Other Vector-borne disease Combines malaria and dengue cases (suspected and confirmed)
Disease W7 2019
# cases % morbidity # cases % morbidity
AWD 3,457 4.5% 24,788 4.5%
Bloody diarr. 356 0.5% 2,519 0.5%
Other diarr. 1,483 1.9% 13,803 2.5%
Susp. Varicella 9,232 11.9% 34,145 6.1%
ARI 11,705 15.1% 82,921 14.9%
Measles/Rub. 14 0.0% 133 0.0%
AFP 0 0.0% 3 0.0%
Susp. menin. 0 0.0% 0 0.0%
AJS 9 0.0% 49 0.0%
Susp. HF 0 0.0% 9 0.0%
Neo. tetanus 0 0.0% 1 0.0%
Adult tetanus 0 0.0% 0 0.0%
Malaria (conf.) 0 0.0% 3 0.0%
Malaria (susp.) 0 0.0% 26 0.0%
Dengue (conf.) 0 0.0% 0 0.0%
Dengue (susp.) 0 0.0% 0 0.0%
Unexpl. fever 2,726 3.5% 22,341 4.0%
Sev. Malnut. 56 0.1% 593 0.1%
Inj./Wounds 1,326 1.7% 11,159 2.0%
Other 47,171 60.8% 362,396 65.3%
Total 74,910 100% 555,371 100%
Proportional morbidity
1 W7 2019
*
*
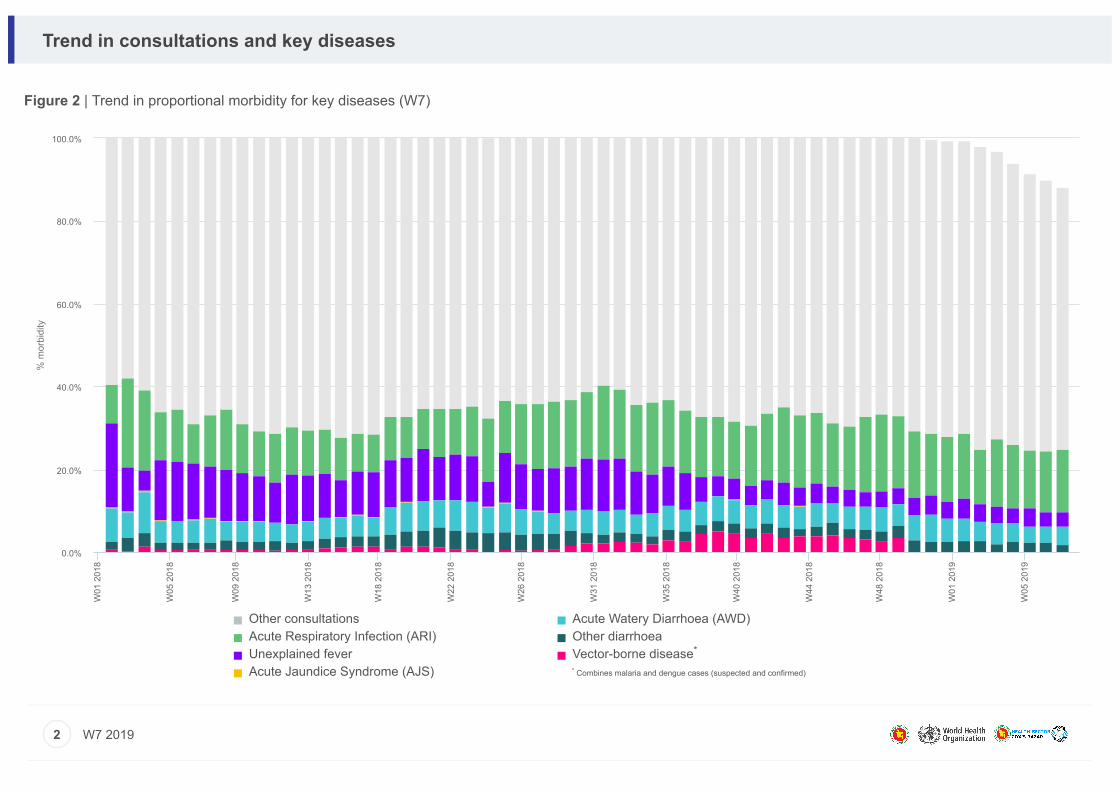
Figure 2 | Trend in proportional morbidity for key diseases (W7)
Other consultations Acute Respiratory Infection (ARI) Unexplained fever Acute Jaundice Syndrome (AJS)
Acute Watery Diarrhoea (AWD) Other diarrhoea Vector-borne disease Combines malaria and dengue cases (suspected and confirmed)
Trend in consultations and key diseases
2 W7 2019
% m
orbi
dity
W01
201
8
W05
201
8
W09
201
8
W13
201
8
W18
201
8
W22
201
8
W26
201
8
W31
201
8
W35
201
8
W40
201
8
W44
201
8
W48
201
8
W01
201
9
W05
201
9
0.0%
20.0%
40.0%
60.0%
80.0%
100.0%
*
*
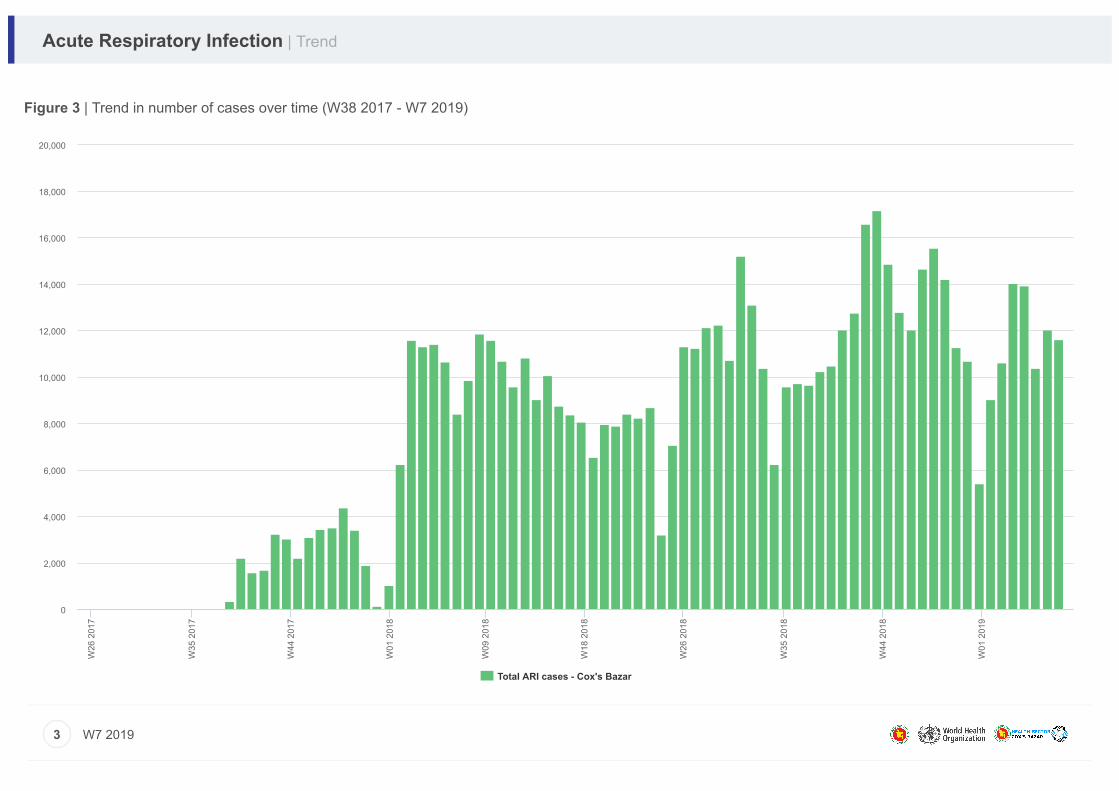
Acute Respiratory Infection | Trend
3 W7 2019
Total ARI cases - Cox's Bazar
W26
201
7
W35
201
7
W44
201
7
W01
201
8
W09
201
8
W18
201
8
W26
201
8
W35
201
8
W44
201
8
W01
201
9
0
2,000
4,000
6,000
8,000
10,000
12,000
14,000
16,000
18,000
20,000
Figure 3 | Trend in number of cases over time (W38 2017 - W7 2019)
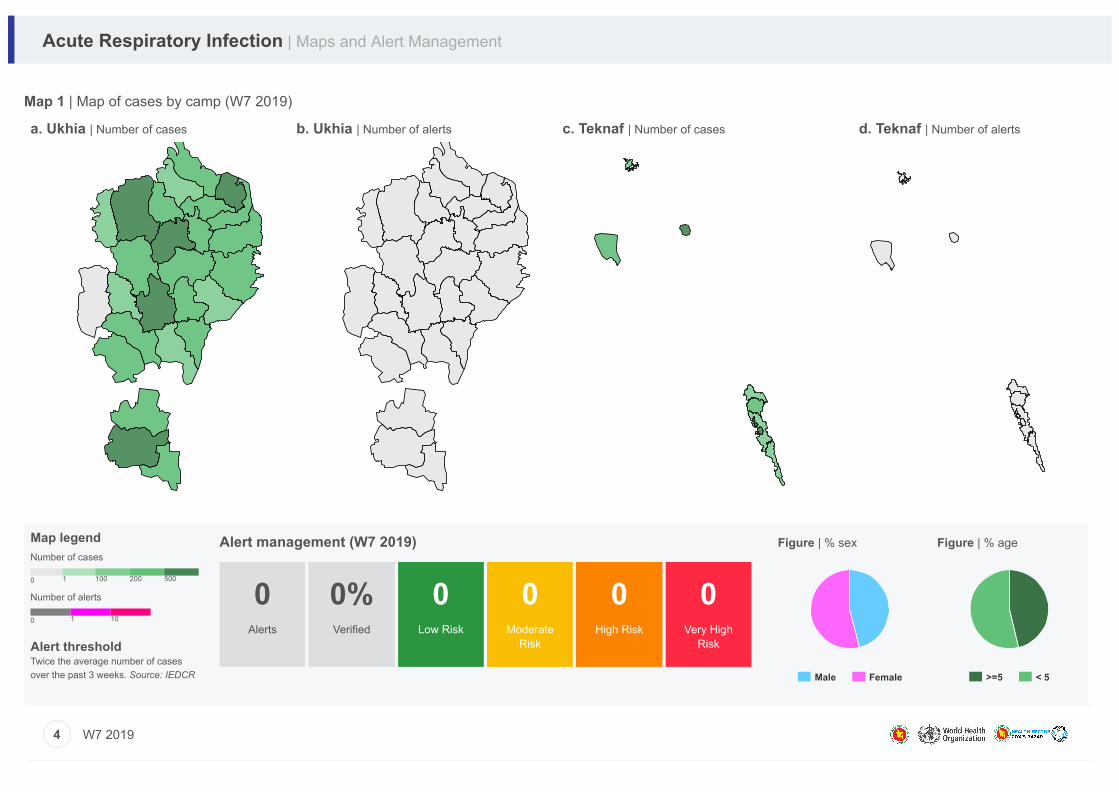
a. Ukhia | Number of cases b. Ukhia | Number of alerts c. Teknaf | Number of cases d. Teknaf | Number of alerts
Acute Respiratory Infection | Maps and Alert Management
Map 1 | Map of cases by camp (W7 2019)
4 W7 2019
Map legendNumber of cases 0 1 100 200 500
Number of alerts 0 1 10
Alert thresholdTwice the average number of casesover the past 3 weeks. Source: IEDCR
0Alerts
0%Verified
0Low Risk
0Moderate
Risk
0High Risk
0Very High
Risk
Alert management (W7 2019) Figure | % sex Figure | % age
Male Female >=5 < 5
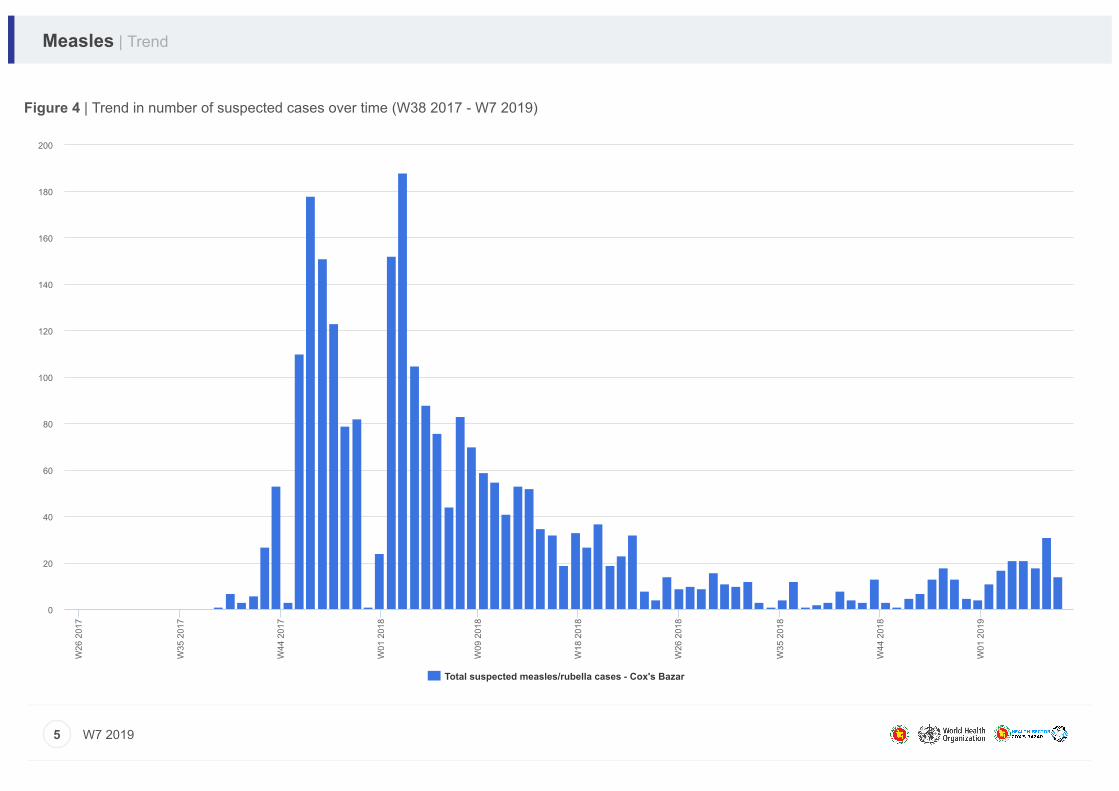
Measles | Trend
5 W7 2019
Total suspected measles/rubella cases - Cox's Bazar
W26
201
7
W35
201
7
W44
201
7
W01
201
8
W09
201
8
W18
201
8
W26
201
8
W35
201
8
W44
201
8
W01
201
9
0
20
40
60
80
100
120
140
160
180
200
Figure 4 | Trend in number of suspected cases over time (W38 2017 - W7 2019)
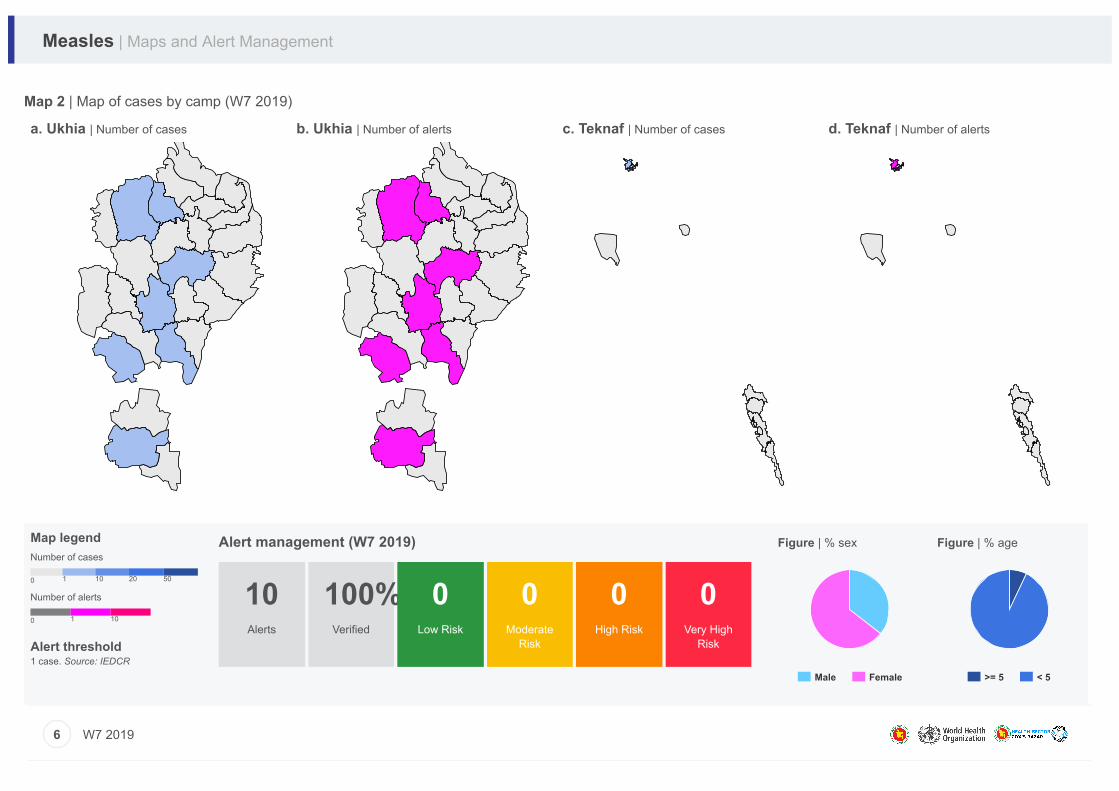
a. Ukhia | Number of cases b. Ukhia | Number of alerts c. Teknaf | Number of cases d. Teknaf | Number of alerts
Measles | Maps and Alert Management
Map 2 | Map of cases by camp (W7 2019)
6 W7 2019
Map legendNumber of cases 0 1 10 20 50
Number of alerts 0 1 10
Alert threshold1 case. Source: IEDCR
10Alerts
100%Verified
0Low Risk
0Moderate
Risk
0High Risk
0Very High
Risk
Alert management (W7 2019) Figure | % sex Figure | % age
Male Female >= 5 < 5
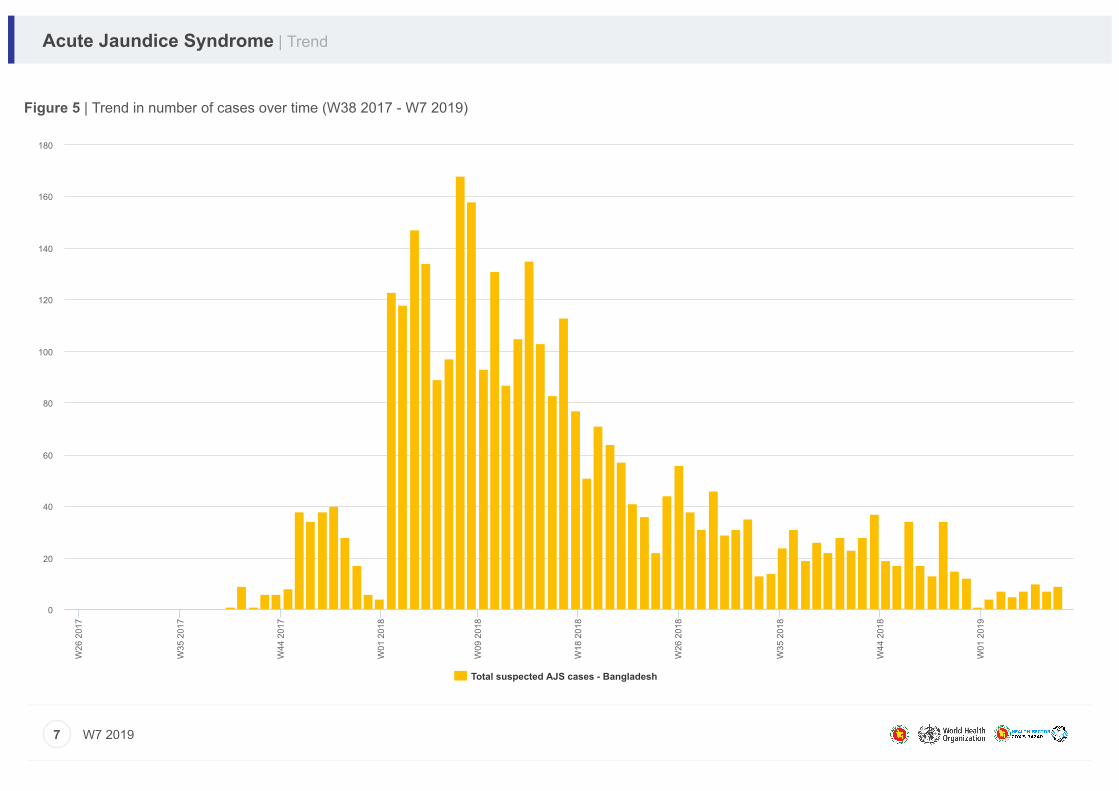
Acute Jaundice Syndrome | Trend
7 W7 2019
Total suspected AJS cases - Bangladesh
W26
201
7
W35
201
7
W44
201
7
W01
201
8
W09
201
8
W18
201
8
W26
201
8
W35
201
8
W44
201
8
W01
201
9
0
20
40
60
80
100
120
140
160
180
Figure 5 | Trend in number of cases over time (W38 2017 - W7 2019)
a. Ukhia | Number of cases b. Ukhia | Number of alerts c. Teknaf | Number of cases d. Teknaf | Number of alerts
Acute Jaundice Syndrome | Maps and Alert Management
Map 3 | Map of cases by camp (W37 2017 - W7 2019)
8 W7 2019
Map legendNumber of cases 0 1 10 20 50
Number of alerts 0 1 10
Alert thresholdA cluster of 3 or more cases seen in ahealth facility. Source: IEDCR
1Alerts
100%Verified
0Low Risk
0Moderate
Risk
0High Risk
0Very High
Risk
Alert management (W7 2019) Figure | % sex Figure | % age
Female Male < 5 >= 5
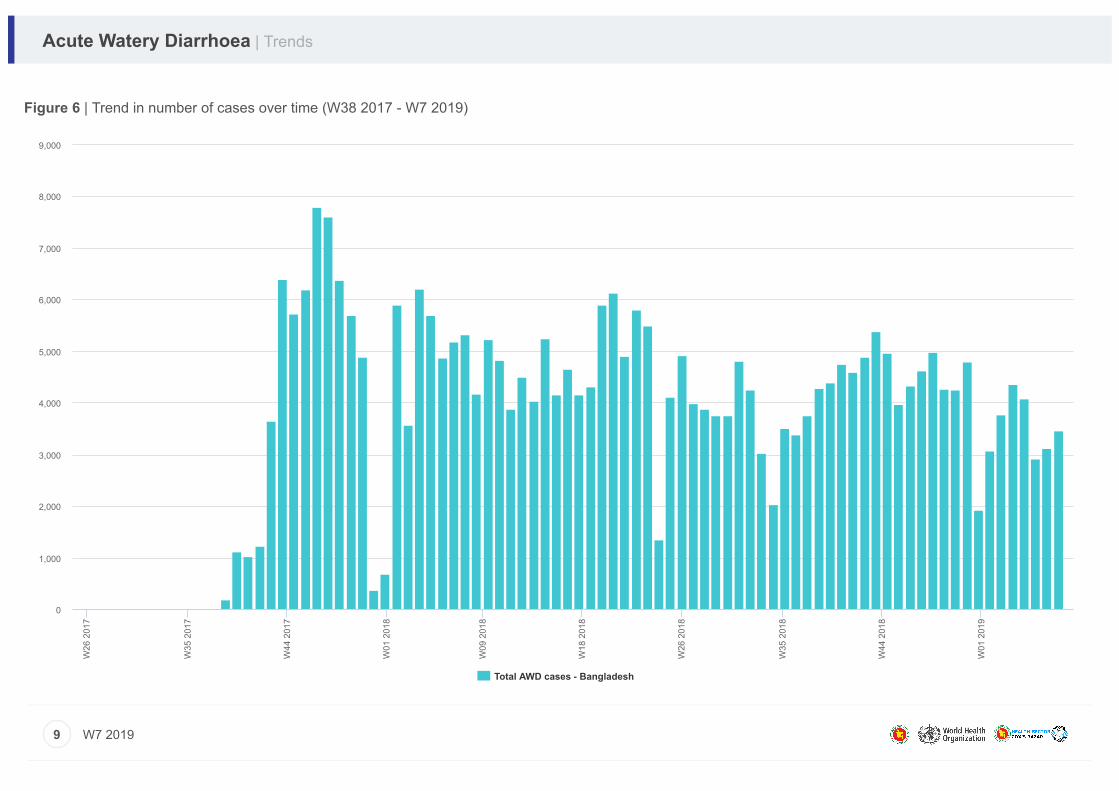
Acute Watery Diarrhoea | Trends
9 W7 2019
Total AWD cases - Bangladesh
W26
201
7
W35
201
7
W44
201
7
W01
201
8
W09
201
8
W18
201
8
W26
201
8
W35
201
8
W44
201
8
W01
201
9
0
1,000
2,000
3,000
4,000
5,000
6,000
7,000
8,000
9,000
Figure 6 | Trend in number of cases over time (W38 2017 - W7 2019)
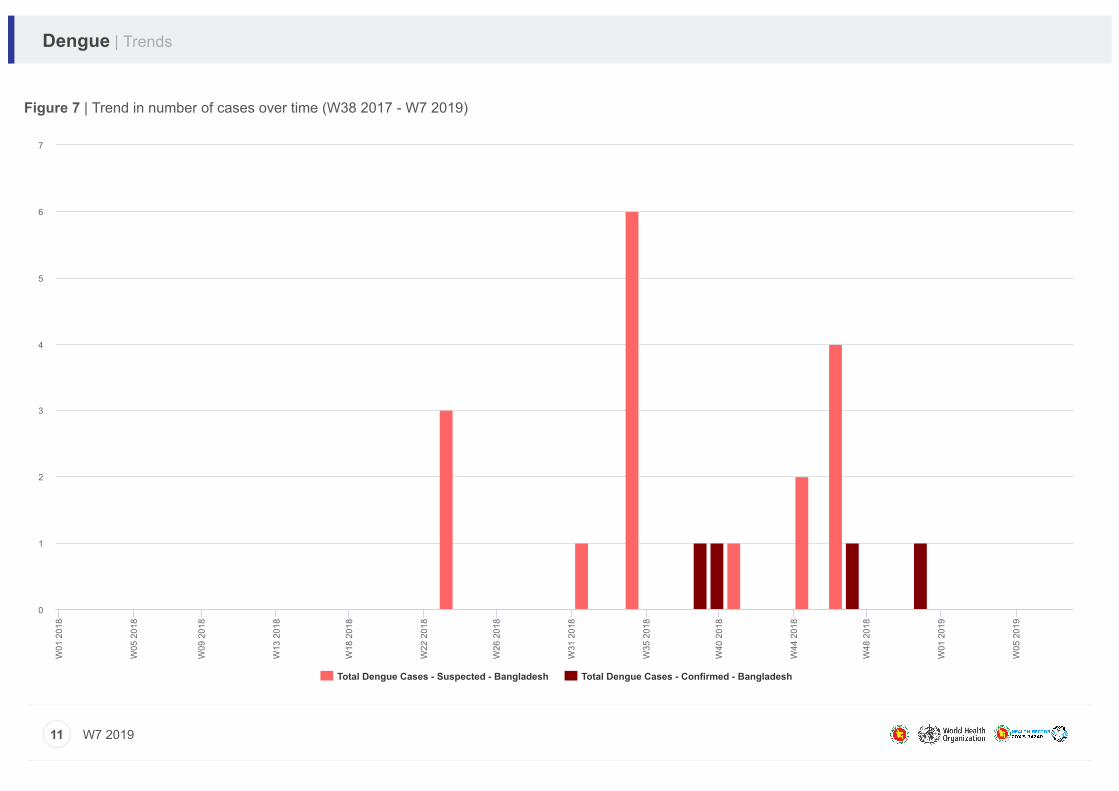
Dengue | Trends
11 W7 2019
Total Dengue Cases - Suspected - Bangladesh Total Dengue Cases - Confirmed - Bangladesh
W01
201
8
W05
201
8
W09
201
8
W13
201
8
W18
201
8
W22
201
8
W26
201
8
W31
201
8
W35
201
8
W40
201
8
W44
201
8
W48
201
8
W01
201
9
W05
201
9
0
1
2
3
4
5
6
7
Figure 7 | Trend in number of cases over time (W38 2017 - W7 2019)
a. Ukhia | Number of cases b. Ukhia | Number of alerts c. Teknaf | Number of cases d. Teknaf | Number of alerts
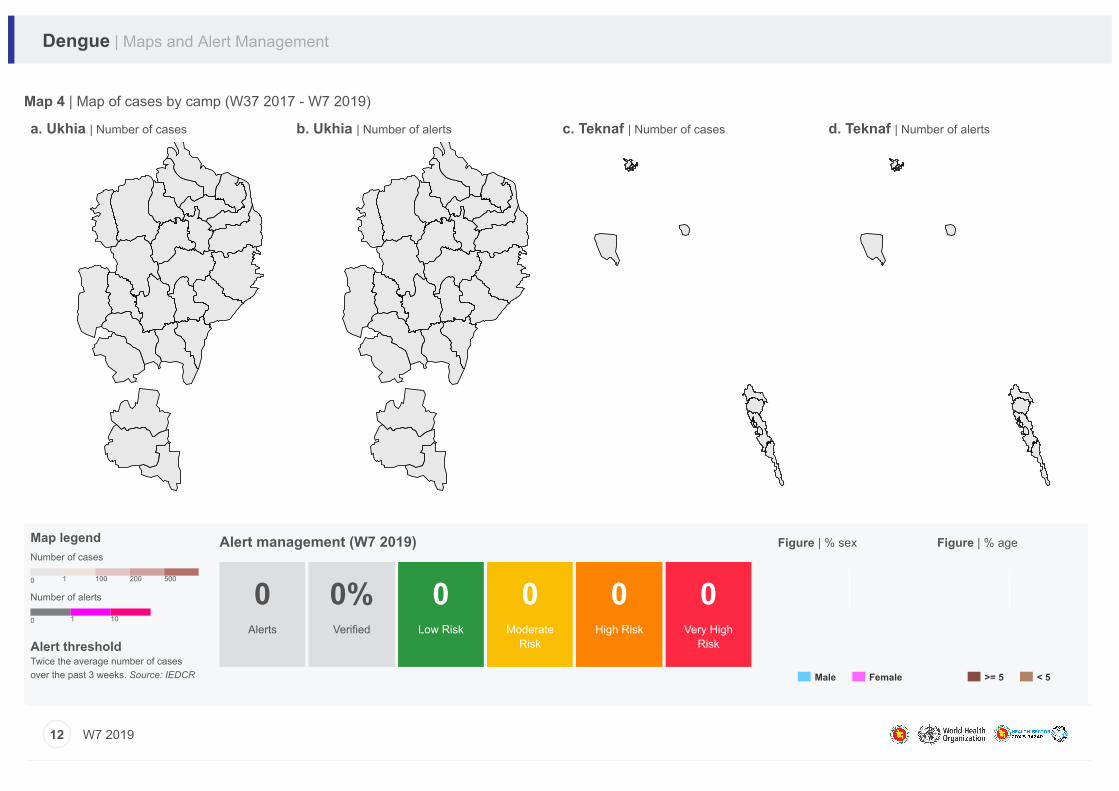
Dengue | Maps and Alert Management
Map 4 | Map of cases by camp (W37 2017 - W7 2019)
12 W7 2019
Map legendNumber of cases 0 1 100 200 500
Number of alerts 0 1 10
Alert thresholdTwice the average number of casesover the past 3 weeks. Source: IEDCR
0Alerts
0%Verified
0Low Risk
0Moderate
Risk
0High Risk
0Very High
Risk
Alert management (W7 2019) Figure | % sex Figure | % age
Male Female >= 5 < 5
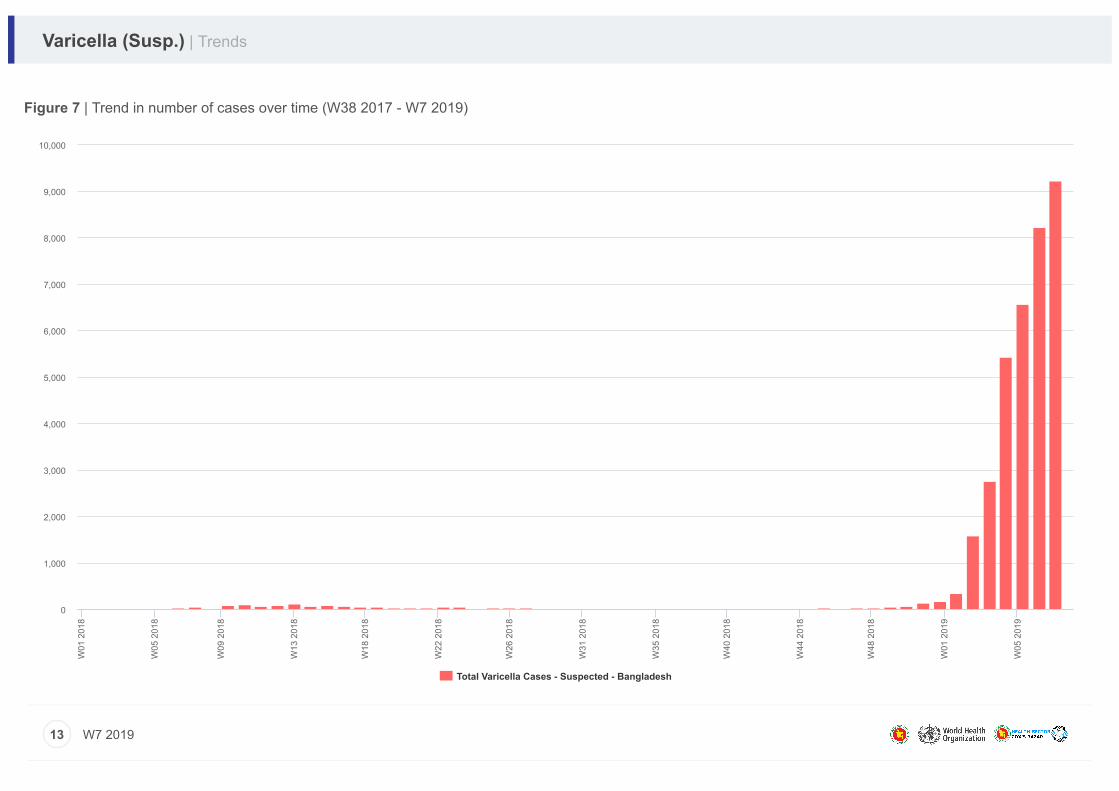
Varicella (Susp.) | Trends
13 W7 2019
Total Varicella Cases - Suspected - Bangladesh
W01
201
8
W05
201
8
W09
201
8
W13
201
8
W18
201
8
W22
201
8
W26
201
8
W31
201
8
W35
201
8
W40
201
8
W44
201
8
W48
201
8
W01
201
9
W05
201
9
0
1,000
2,000
3,000
4,000
5,000
6,000
7,000
8,000
9,000
10,000
Figure 7 | Trend in number of cases over time (W38 2017 - W7 2019)
a. Ukhia | Number of cases c. Teknaf | Number of cases
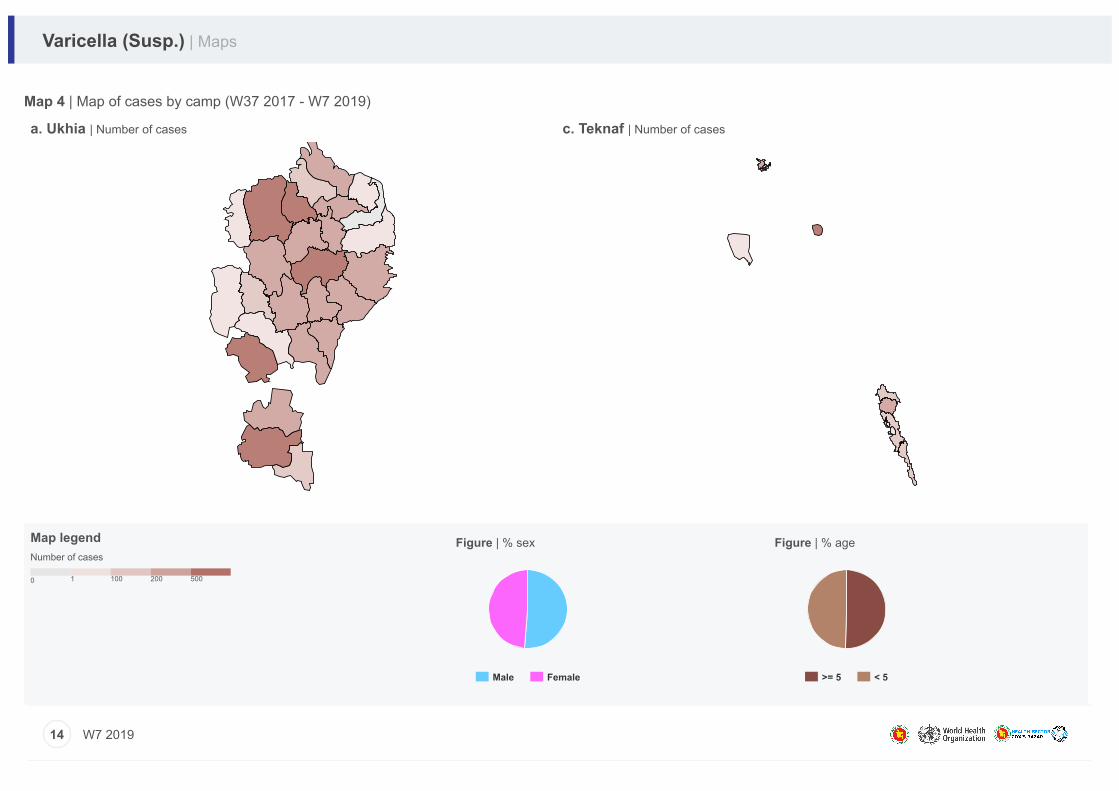
Varicella (Susp.) | Maps
Map 4 | Map of cases by camp (W37 2017 - W7 2019)
14 W7 2019
Map legendNumber of cases 0 1 100 200 500
Figure | % sex Figure | % age
Male Female >= 5 < 5
For more help and support, please contact:
Dr. Md. Alamgir Medical Officer Civil Surgeon Office Ministry of Health and Family Welfare Cox's Bazar, Bangladesh
Telephone: +88 018 1961 4952
Dr. Md Khadimul Anam Mazhar Surveillance and Outbreak Response Officer World Health Organization Cox's Bazar, Bangladesh
Telephone: +88 017 0120 8845
Email: [email protected]
NotesWHO and the Ministry of Health and Family Welfare gratefully acknowledge all partners who havereported the data used in this bulletin. The data been collected with support from the EWARS project. This is an initiative to strengthen earlywarning, alert and response in emergencies. It includes an online, desktop and mobile application thatcan be rapidly configured and deployed in the field. It is designed with frontline users in mind, and builtto work in difficult and remote operating environments. This bulletin has been automatically publishedfrom the EWARS application. More information can be found at http://ewars-project.org Sign-up for an account with EWARS Bangladesh at http://bd.ewars.ws
Ministry ofHealth andFamilyWelfare Bangladesh


![1. Diphtheria [Difteri]](https://img.pdfslide.us/doc/110x75/56d6be451a28ab3016916524/1-diphtheria-difteri.jpg)