Embed Size (px)
Citation preview
8/7/2019 Epidemiological approaches
http://slidepdf.com/reader/full/epidemiological-approaches 1/26
Epidemiological Approaches
8/7/2019 Epidemiological approaches
http://slidepdf.com/reader/full/epidemiological-approaches 2/26
Teaching Objectives
By the end of this session you will be able to:
� Describe sampling procedures
� Have an understanding of sampling
procedures
� List biases in epidemiological studies
� Describe in detail various types of epidemiological approaches along with their
strength and weaknesses.
8/7/2019 Epidemiological approaches
http://slidepdf.com/reader/full/epidemiological-approaches 3/26
Epidemiological Approaches� Sample: Subset from human groupings
selected to represent the population.
� Sampling Procedures: Probability and Non-Probability
� Probability: Each element has same chanceof being included in the sample
� Non Probability: No assurance that eachelement has same chance of being includedin the sample
8/7/2019 Epidemiological approaches
http://slidepdf.com/reader/full/epidemiological-approaches 4/26
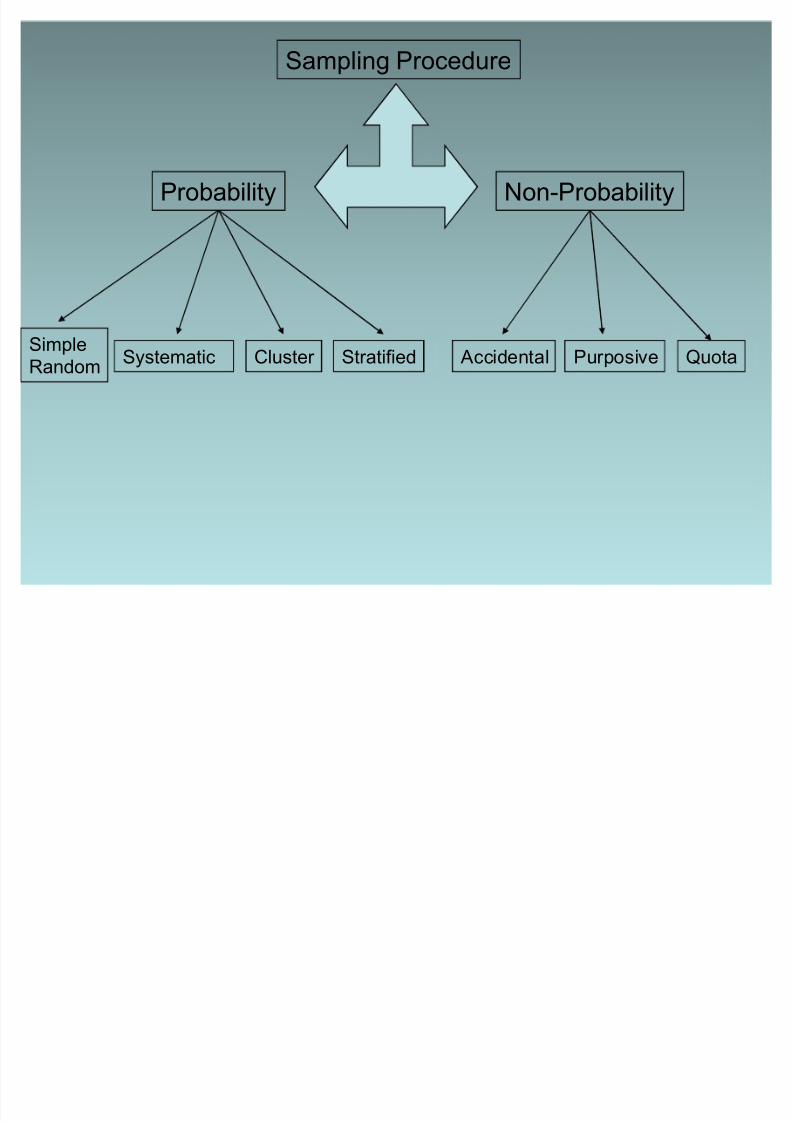
Sampling Procedure
Probability Non-Probability
QuotaAccidental PurposiveStratifiedCluster SystematicSimple
Random
8/7/2019 Epidemiological approaches
http://slidepdf.com/reader/full/epidemiological-approaches 5/26
Simple Random Sampling
� Law of chance
� Prepare sampling frame
� Decide number to be selected� Can be done by:
± Lottery method
± Random digit tables (computer or manual)
8/7/2019 Epidemiological approaches
http://slidepdf.com/reader/full/epidemiological-approaches 6/26
Systematic Sampling� Have total number of units in population
� Calculate sample size
� Calculate sampling ratio e.g 400 out of
1600. 1:4. 4th is the kth unit
� Select randomly the first unit and
interview every kth
8/7/2019 Epidemiological approaches
http://slidepdf.com/reader/full/epidemiological-approaches 7/26
Cluster Sampling� Selection made up of groups e.g apartment
buildings, mohallas, UC
� When list of entire area is unavailable and notpossible to visit entire area (country).
� Divide area into several equal size clusters.
� Randomly select a few clusters� Draw random or systematic sample from
each cluster
8/7/2019 Epidemiological approaches
http://slidepdf.com/reader/full/epidemiological-approaches 8/26
Stratified Sampling� To compare different strata.
� Divide population into subgroups
(strata) according to one or more
characteristics. (e.g age,sex,
socioeconomic status etc)
� Follow random or systematic procedure.
8/7/2019 Epidemiological approaches
http://slidepdf.com/reader/full/epidemiological-approaches 9/26
Accidental Sampling� Also known as convenience sampling
� Less costly, convenient
� Unlikely to be representative
� Purpose is exploratory I.e to get a feel
� E.g First 10 pts in clinicLast 5 roll numbers in classroom
8/7/2019 Epidemiological approaches
http://slidepdf.com/reader/full/epidemiological-approaches 10/26
Purposive Sampling� Sampling done on basis of some
predetermined idea. (e.g samples from
selected group, Clinical condition such
as diabetes etc)
� Results not generalisable
8/7/2019 Epidemiological approaches
http://slidepdf.com/reader/full/epidemiological-approaches 11/26
Quota Sampling� Strata identified and researcher determines
proportion of elements from each segment.
� Quota decided for a predetermined purpose
� Not generalisable
� If in population 40% males and 60% females,
researcher may decide on having sameproportion of males and females in sample
size
8/7/2019 Epidemiological approaches
http://slidepdf.com/reader/full/epidemiological-approaches 12/26
Sample Size estimation
� Four considerations:Variability in population
Amount of accuracy desired
Resources available
T
ype of study design� Calculation depends on:
Type of study
Type of statistical analysis required
� Formula depends on:
Prevalence of attribute of interestAlpha error (Described in Hypothesis testing)
Beta error
� Should be large enough to yield significant results
� Very large sample size will show significant result for a verysmall difference
8/7/2019 Epidemiological approaches
http://slidepdf.com/reader/full/epidemiological-approaches 13/26
Bias� Occurance of an event by chance
� Selection and Information or measurement bias
� Selection bias: Systematic errors introduced byselection of study participants or allocation of
individuals to different study groups. E.g subjectsallowed to choose drugs, cases not representativeof all cases in population or controls notrepresentative of population which produced thecases, exposed and unexposed groups not
comparable (comparing occupational cohort withgeneral population healthy worker effect ), follow updifferences
8/7/2019 Epidemiological approaches
http://slidepdf.com/reader/full/epidemiological-approaches 14/26
Bias (contd)
� Information bias: Inaccurate measurement or classification of an outcome of interest I.e
individuals assigned to wrong exposure or
outcome category. E.g Exposure makes individuals
more or less likely to be classified as having
disease (Cohort study), Cases more likely to be
classified as being exposed than controls (Case-
control study)
� Can be introduced by observer (observer bias),
study participant (recall bias) or by measurement
tools such as weighing scales or questionnaires.
8/7/2019 Epidemiological approaches
http://slidepdf.com/reader/full/epidemiological-approaches 15/26
Cross-sectional Study
� Prevalence study� Survey of a population at a single point in time
� Descriptive CS Study: Collects information on frequencyand distribution of health related exposures or outcomes indefined population. Outcome measure is Prevalence of that
outcome (Point prevalence, Period prevalence). E.gSurveys
� Analytical CS Study: Investigates association netweenexposure to risk factor and outcome of interest. Causalitycannot be shown as for this exposure must have occurred
before outcome.� Can be used to test hypothesis if there are constant risk
factors e.g Blood group, genetic factors
� Life style changes, diet can change
8/7/2019 Epidemiological approaches
http://slidepdf.com/reader/full/epidemiological-approaches 16/26
Cross-sectional Study (contd)� ethods of data collection: Direct (Questionnaires,
interviews)and Indirect (medical records, census data)
� Data collection tools should be standardised and methodsshould be validated (measuring what they are supposed tomeasure)
� Strengths: Quick and easy to perform
Repeated studies can show changes over time
� Weakness: Recall bias, Non-response bias, biased towardspatients with chronic illnesses
� Uses:
Determine prevalence of diseases and risk factors in a definedpopulation (descriptive)
Measure association between disease and risk factors, bymeans of prevalence ratio (analytical)
Generating research question
Health service planning
Unsuitable for causal hypothesis as carried out at a single pointin time e.g hypertension & hyperuricemia association
8/7/2019 Epidemiological approaches
http://slidepdf.com/reader/full/epidemiological-approaches 17/26
Cohort Study� Incidence, longitudinal or followup study
� Cohort: group of individuals who share samecharacteristics (e.g workers in a factory, children born in thesame year, individuals diagnosed with same disease)
� Individuals selected on basis of being exposed to a riskfactor and should be free of outcome of interest (morbidity,
mortality or survival) at the start of study.� Prospective Cohort study: Identify participant and follow
till end of study (Causal relationship can be established)
� Retrospective Cohort Study: Use pre-existing data onexposures and outcomes e.g from medical or hospitalrecords. No need to followup over time.
� May combine both PCS and RCS e.g occupational or workforce cohort. Identification of participants starting workin same year and following till retirement, but may use data
on previous work history and medical records for exposuredata.
8/7/2019 Epidemiological approaches
http://slidepdf.com/reader/full/epidemiological-approaches 18/26
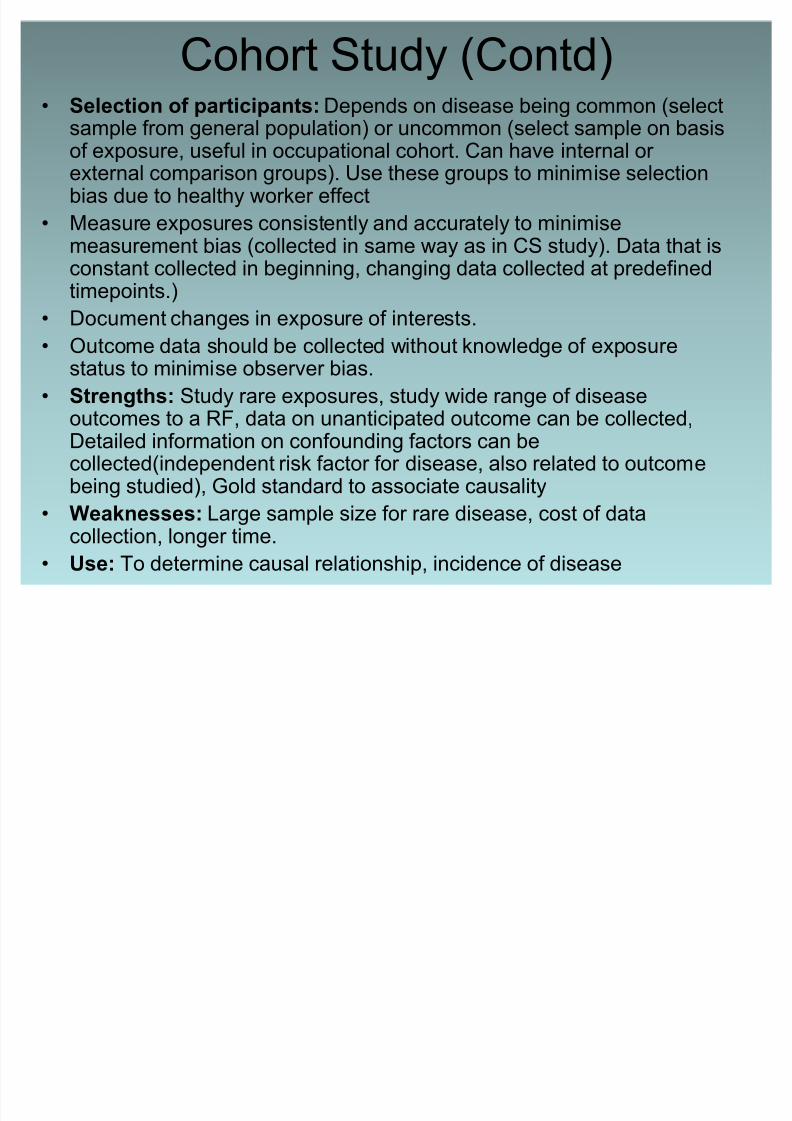
Cohort Study (Contd)� Selection of participants: Depends on disease being common (select
sample from general population) or uncommon (select sample on basisof exposure, useful in occupational cohort. Can have internal or external comparison groups). Use these groups to minimise selectionbias due to healthy worker effect
� Measure exposures consistently and accurately to minimisemeasurement bias (collected in same way as in CS study). Data that is
constant collected in beginning, changing data collected at predefinedtimepoints.)
� Document changes in exposure of interests.
� Outcome data should be collected without knowledge of exposurestatus to minimise observer bias.
� Strengths: Study rare exposures, study wide range of disease
outcomes to a RF, data on unanticipated outcome can be collected,Detailed information on confounding factors can becollected(independent risk factor for disease, also related to outcomebeing studied), Gold standard to associate causality
� Weaknesses: Large sample size for rare disease, cost of datacollection, longer time.
� Use: To determine causal relationship, incidence of disease

8/7/2019 Epidemiological approaches
http://slidepdf.com/reader/full/epidemiological-approaches 19/26
Case-control Study
� Study group defined by outcome and not byexposure.
� Should have disease at the beginning of thestudy.
� Useful in hypothesis testing� Should have a precise definition of case.
� Should have set inclusion and exclusion
criteria� Individual or group matching of control to
cases.
� Can use nested case control study in cohort
study
8/7/2019 Epidemiological approaches
http://slidepdf.com/reader/full/epidemiological-approaches 20/26
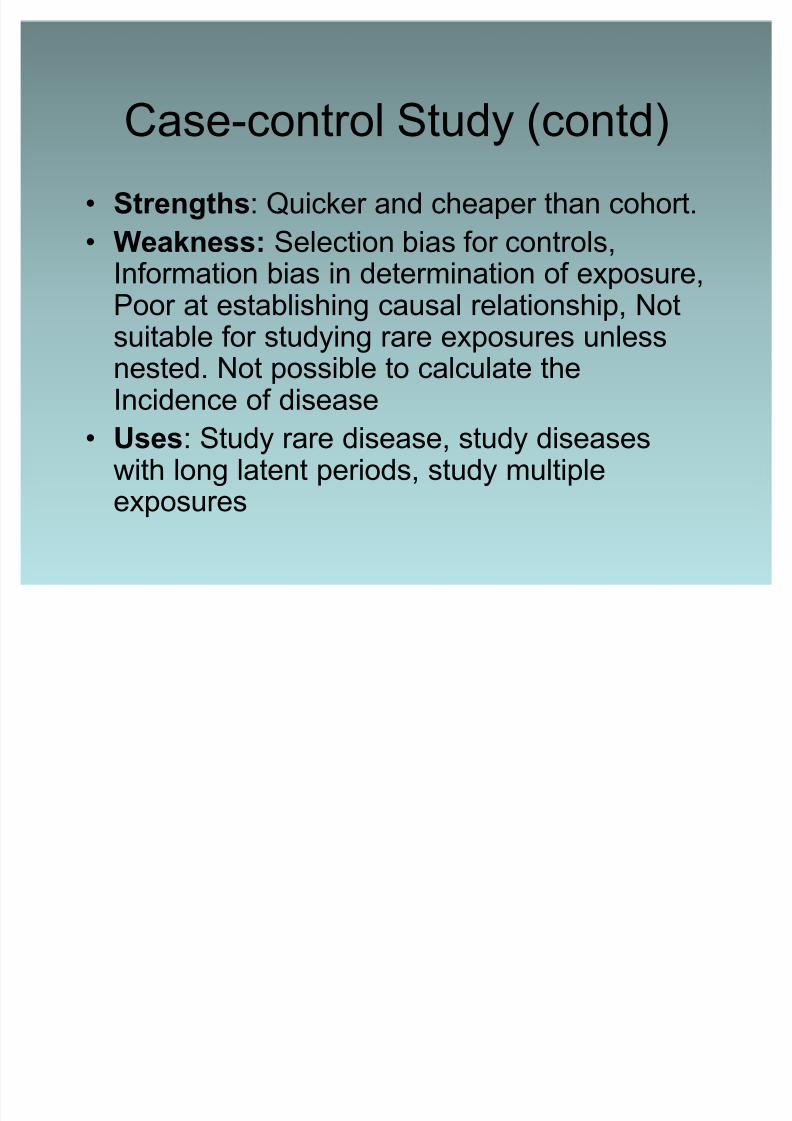
Case-control Study (contd)� Strengths: Quicker and cheaper than cohort.
� Weakness: Selection bias for controls,
Information bias in determination of exposure,Poor at establishing causal relationship, Notsuitable for studying rare exposures unlessnested. Not possible to calculate theIncidence of disease
� Uses: Study rare disease, study diseaseswith long latent periods, study multipleexposures
8/7/2019 Epidemiological approaches
http://slidepdf.com/reader/full/epidemiological-approaches 21/26
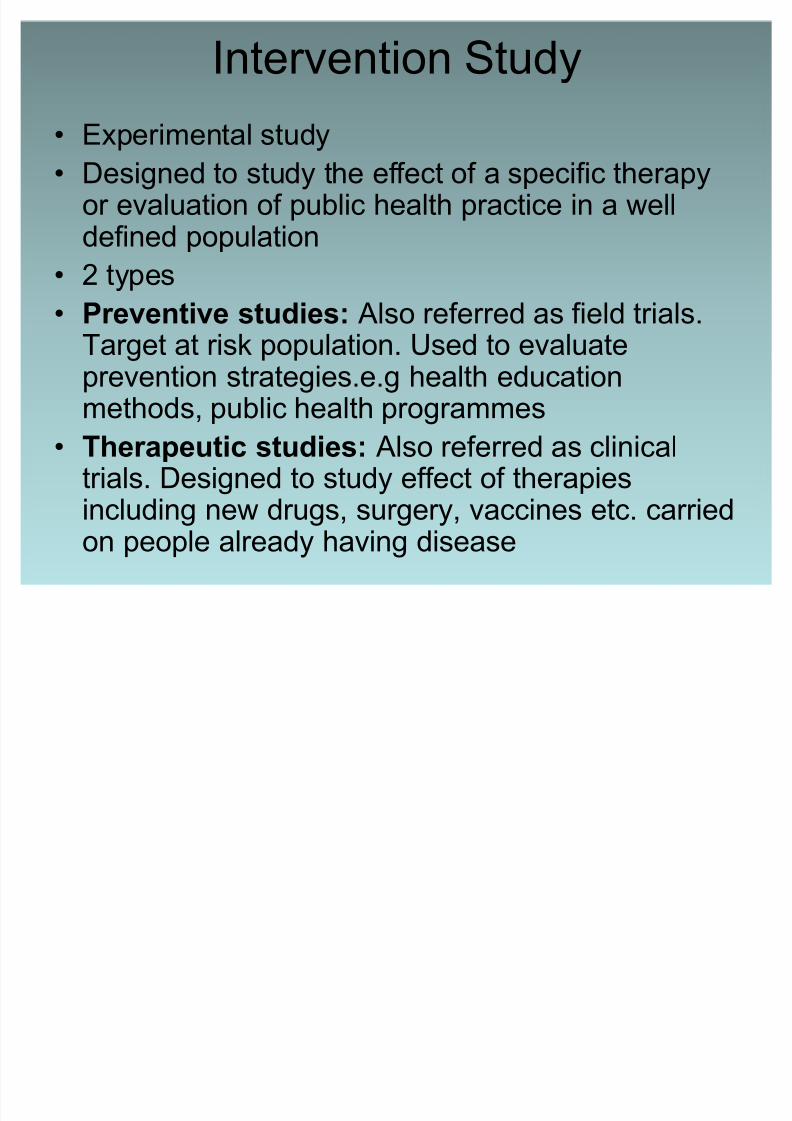
Intervention Study
� Experimental study� Designed to study the effect of a specific therapy
or evaluation of public health practice in a welldefined population
� 2 types� Preventive studies: Also referred as field trials.Target at risk population. Used to evaluateprevention strategies.e.g health education
methods, public health programmes� Therapeutic studies: Also referred as clinical
trials. Designed to study effect of therapiesincluding new drugs, surgery, vaccines etc. carried
on people already having disease
8/7/2019 Epidemiological approaches
http://slidepdf.com/reader/full/epidemiological-approaches 22/26
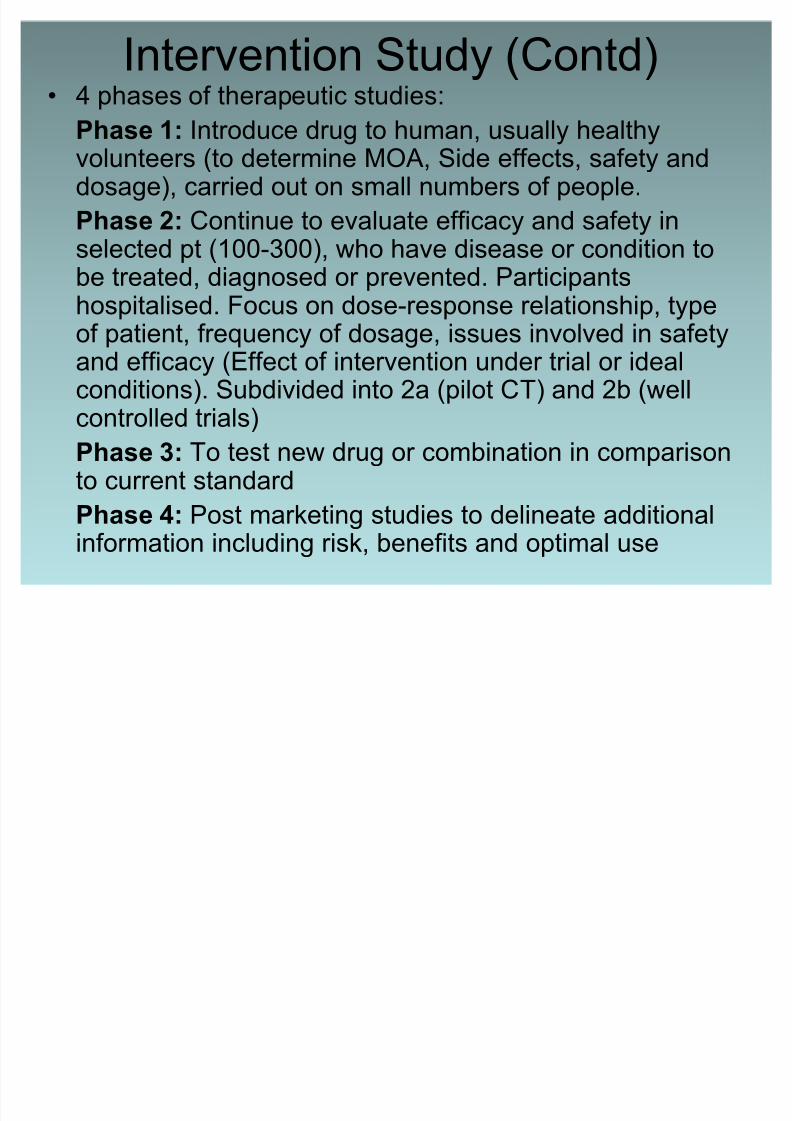
Intervention Study (Contd)� 4 phases of therapeutic studies:
Phase 1: Introduce drug to human, usually healthyvolunteers (to determine MOA, Side effects, safety anddosage), carried out on small numbers of people.
Phase 2: Continue to evaluate efficacy and safety inselected pt (100-300), who have disease or condition to
be treated, diagnosed or prevented. Participantshospitalised. Focus on dose-response relationship, typeof patient, frequency of dosage, issues involved in safetyand efficacy (Effect of intervention under trial or idealconditions). Subdivided into 2a (pilot CT) and 2b (well
controlled trials)Phase 3: To test new drug or combination in comparisonto current standard
Phase 4: Post marketing studies to delineate additional
information including risk, benefits and optimal use
8/7/2019 Epidemiological approaches
http://slidepdf.com/reader/full/epidemiological-approaches 23/26
Intervention Study (Contd)
� Selection of study population: Should be representative of populationreceiving the benefit of trial intervention. Study often criticised for
generalisability.� Allocation of treatment regimens: Divided into intervention and
control groups.
� Gold standard intervention study: Randomised double-blind placebo-controlled trial. Bias is controlled by following methods:
Selection bias reduced by true randomisation (Systematicrandomisation to be avoided, inclination to give drugs to more seriouspts)
Measurement or reporting bias reduced by blinding
Placebo
Allocation concealment: To ensure no manipulation on part of
investigator. In single centre study, it is done by sealed envelopes. For multicenter sites, by telephone, internet, Interactive voice responsesystem
Stratified randomisation: Ensure that characteristics equallydistributed in both groups e.g if effectiveness influenced by age or gender, it would ensure that these characteristics are in equalproportion in each group. After randomisation, compare both groups
8/7/2019 Epidemiological approaches
http://slidepdf.com/reader/full/epidemiological-approaches 24/26
Other types of Intervention
studies� Previously described on individual level
� At group level cluster randomised trials
conducted� Feasible to study effect at group level
e.g intervention to control air pollution
� Contamination prevented by grouplevels e.g schools
� Needs larger sample size
8/7/2019 Epidemiological approaches
http://slidepdf.com/reader/full/epidemiological-approaches 25/26
Ethical issues� Group of participants being denied an
intervention which can be benefical to them
� Need to address qs of sufficient importance towarrant study in first place
� Participants should be fully aware about thestudy and potential risk and benefits
� Informed consent need to be sought� Participants are allowed to refuse to be a part
of the study and have the option to drop outat any time
8/7/2019 Epidemiological approaches
http://slidepdf.com/reader/full/epidemiological-approaches 26/26
Intervention study (Contd)� Strengths: Gold standard, less risk of bias
and confoundings, strong evidence of causal
relationship between intervention andoutcome,
� Weakness: Expensive, may be impossible to
carry out due to ethical concerns.
� If conflicting evidence, meta analysis carried
out. Possible that no definitive answer
reached on available evidence