Embed Size (px)
Citation preview
C & U & S FOR DISEASE CONTROL August 10, 1984 / Vol. 33 / No. 3 t
M O R B ID ITY A N D MORTALITY WEEKLY REPORT
445 Acute Schistosomiasis with Transverse Myelitis in American Students Returning from Kenya
448 Work-Related Allergies in Insect-Raising Facilities
455 Influenza Virus Activity—Texas, 1983-1984 Season
Epidemiologic Notes and Reports\1 Acute Schistosomiasis with Transverse Myelitis
in American Students Returning from Kenya
In early May 1984, CDC received reports that 15 (83%) of 18 American students partici- pating in a travel/study program in Kenya had acquired Schistosoma mansoni infections. Two of these students developed flaccid paraplegia. Although data are incomplete on all 18 students, no unusual attributes could be identified in these two students that might explain why their infections were associated with severe neurologic disease. General background information and the case histories of these students follow.
All 18 students arrived in Kenya on February 13, 1984. From March 5 to March 25, they shared housing in the Machakos district. To provide a place for bathing, the students dammed a small stream; two of the infected students recalled experiencing an itchy rash shortly after bathing at this site. Subsequently, the group separated, as the students took individual assignments in various regions of the country. Between April 26 and May 12, 14 of the 15 infected individuals became acutely ill with fever, diarrhea, malaise, and weight loss.
Student 1: This 21 -year-old white male was in good health and had never traveled outside the United States. He was immunized against tetanus, typhoid, cholera, and yellow fever, and received an injection of immune globulin before arriving in Kenya. While in Kenya, he took weekly chloroquine and Fansidar® for malaria prophylaxis. In early April, he complained of fever, abdominal pain, and diarrhea without blood or mucus, all of which resolved without therapy. He became ill again on April 26, with fever, chills, sweats, anorexia, mild nonbloody diarrhea, and abdominal pain. There was no hematuria or cough. He was treated orally with chloroquine for a presumptive diagnosis of malaria. On April 28, he developed severe lumbar back pain without tenderness or radiation and had associated numbness, without weakness, in both feet. On May 1, he had difficulty recognizing the position of his feet and had extreme proximal lower extremity weakness. On May 2, he became ataxic and developed urinary retention. A diagnosis of transverse myelitis secondary to schistosomiasis was made when stool examinations showed ova of S. mansoni. The patient was treated with praziquantel and prednisone. He was transported to the United States on May 5.
On evaluation in the United States, the student had no rash, fever, lymphadenopathy, hepatosplenomegaly, or point tenderness on palpation of the spinal column. Neurologic examination revealed a flaccid paraplegia at and below the level of T -1 0. There was marked sensory loss, including loss of vibratory sensation. Superficial and deep tendon reflexes could not be elicited.
A white blood cell count revealed moderate eosinophilia. A myelogram showed no obstruction or mass, but a CAT scan showed the lumbar cord to be slightly enlarged, without focal abnormalities. Examination of cerebrospinal fluid (CSF) showed pleocytosis and elevated protein; however, eosinophilic pleocytosis was not present. Fecal examination showed 500
U.S. DEPARTMENT OF HEALTH AND HUMAN SERVICES / PUBLIC HEALTH SERVICE
August 10, 1984Acute Schistosomiasis — Continued S. mansoni eggs per gram of stool; no other helminthic or protozoal pathogens were observed. Serologic tests for antibody to mycoplasma, Epstein Barr virus (EBV), and other viral agents were negative.
On May 15, the patient was transferred to a spinal cord rehabilitation center. His neurologic condition remains unchanged.
Student 2: A 20-year-old white female was in good health and had not previously traveled overseas. She received similar immunizations as Student 1 and took chloroquine and Fansi- dar® weekly for malaria prophylaxis. On April 29, she developed fever, abdominal pain, and nonbloody diarrhea. A Gram stain of her urine showed gram-positive cocci, and she was treated with ampicillin. She also received metronidazole, although it was unclear whether amoebae were found by stool examination. On May 3, she developed severe back pain without radiation, weakness, or urinary symptoms. From May 7 to May 9, she rapidly lost the ability to ambulate. She complained of difficulty initiating her urine stream. On May 9, after a stool examination showed many ova of S. mansoni, she was diagnosed as having schistosomal transverse myelitis and treated with oxamniquine. She was transported to the United States on May 11.
Evaluation in the United States was unremarkable except for a flaccid paralysis and severely decreased sensation to temperature and touch in the lower extremities. Deep tendon reflexes could not be elicited. The level of the lesion was placed at L1-L2.
There was moderate eosinophilia. CSF examination showed pleocytosis and elevated protein; however, eosinophilic pleocytosis was not present. A myelogram showed no obstruction, but a CAT scan of the spine suggested some swelling of the conus medullaris. Stool examination showed only S. mansoni (1,100 eggs per gram of feces). Serologic tests for antibody to mycoplasma, EBV, and other viral agents were negative.
Because the dose of oxamniquine given in Kenya was considered inadequate, the patient was treated with praziquantel. Large doses of dexamethasone were also given. The patient's motor function and sensation improved by the second treatment day. On May 1 5, she began moving both extremities against gravity. On June 8, the patient was ambulating with assistance at a spinal rehabilitation center.Reported by J Houpis, MD, Brattleboro, Vermont; J Oexmann, MD, J Martin, MD, G Jacobi, MD, Depts o f Neurology and Infectious Diseases, Massachusetts General Hospital, Boston; J Reardon, MD, Assistant Director, Div o f Communicable and Venereal Diseases, G Waterman, MD, Acting State Epidemiologist, Massachusetts Dept o f Health; Helminthic Diseases Br, Div o f Parasitic Diseases, Center for Infectious Diseases, CDC.Editorial Note: Although S. mansoni and S. haematobium are endemic to the Machakos district of Kenya ( 1 ), no infections with S. haematobium occurred among any of the 18 students. Schistosomiasis of the central nervous system (CNS) was first recognized in the late 19th century and has been most commonly reported as a cerebral granulomatous disease resulting from ectopically located S. japonicum eggs (2 ). Schistosomal transverse myelitis is rare and has been observed most frequently in infections with S. mansoni (3). Since S. mansoni transverse myelitis (SMTM) was first reported in 1930, about 32 tissue-proven cases and over 28 presumed cases have been reported. When autopsy or surgical biopsy is not performed, a presumptive diagnosis of SMTM is based on the following considerations: (1) the finding of low thoracic/upper lumbar neurological symptoms; (2) demonstration of exposure to schistosomes through parasitologic or serologic techniques; and (3) the exclusion of other known causes of transverse myelitis (5,6). In contrast to schistosomal transverse myelitis, other causes of transverse myelitis commonly affect the mid-thoracic cord (4). Eosinophilic pleocytosis in the CSF is suggestive of schistosomiasis of the CNS but is often not observed, as in the cases reported here.
446 MMWR

MMWRVol. 33/No. 31 MMWR 447Acute Schistosomiasis — Continued
Other disorders that have been associated with transverse myelitis include numerous viral, bacterial, and fungal infections (especially with enterovirus, EBV, tuberculosis, syphilis, and coccidioidomycosis), postvaccinal reactions, collagen vascular diseases, toxin exposures, and vascular disease. Conditions that can mimic transverse myelitis include tumor, Guillan-Barre syndrome, and multiple sclerosis (4). All of these, including SMTM, are rare, and the observed attack rate of 13% (2/15) in this group of students is unusual, regardless of etiology.
Schistosomal myelopathy results from the inflammatory reaction accompanying the deposition of eggs in the venules located in and around the spinal cord (2,3). How eggs, which are normally oviposited in the venules of the inferior mesenteric vein of the portal system, reach the spinal vascular system is unknown. Several hypotheses have been proposed (2,3,6).
Praziquantel or oxamniquine are the antischistosomal agents available to treat SMTM. Treatment destroys the adult worms and thereby prevents further oviposition. Praziquantel is effective against all schistosomes; however, oxamniquine is only effective against S. mansoni. The dosage of oxamniquine needed varies according to the geographic location where the infection was acquired (7 ). Steroids are used to suppress the host response around the ectopic eggs (5,6). Myelography may identify discrete granulomatous masses that may be amenable to surgical removal (8). In 50% of reported cases, there is little or no return of neurologic function (2,3,5,6), and intensive rehabilitative care is indicated. When evaluating persons for infection with schistosomes, interpretation of negative tests may be difficult, since extremely mild infections or ectopic localization of worms may preclude detection of eggs with stool or urine examinations. Because of the potential benefit of the recommended therapy, presumptive treatment of patients with diagnoses of transverse myelitis and histories of water exposure in endemic areas should be initiated while awaiting results of parasitologic or serologic tests.
The severity of illness in this group should reemphasize the need for travelers visiting areas endemic for schistosomiasis to be aware of precautions that may decrease the risk of infection. Since there is no practicable way to distinguish infested from noninfested water, it is prudent to avoid fresh-water swimming. Heating bathing water to 50 C (1 22 F) for 5 minutes or treating it with iodine or chlorine in a manner similar to the precautions recommended for preparing drinking water will destroy cercaria. Filtering water with a tightly woven cloth or with paper coffee filters may also be effective in removing cercaria from bathing water. If these measures are not feasible, allowing bathing water to stand for 3 days is advisable, since cercaria survive only 48 hours. If accidental exposure to suspected water occurs, immediate and vigorous towel drying or rapid application of rubbing alcohol to the exposed areas may reduce the risk of infection. The effectiveness of available antischistosomal drugs as chemo- prophylactic agents has not been evaluated (9).References1. Arap Siongok TK, Mahmoud AAF, Ouma JH, et al. Morbidity in Schistosomiasis mansoni in relation
to intensity of infection: study of a community in Machakos, Kenya. Am J Trop Med and Hyg 1976; 25:273-84.
2. Faust EC. Inquiry into ectopic lesions in schistosomiasis. Am J Trop Med Hyg 1948 28:1 75-99.3. Marcial-Rojas RA, Fiol RE. Neurologic complications of schistosomiasis. Review of the literature and
report of two cases of transverse meyelitis due to S. mansoni. Ann Intern Med 1963 ;59 :215 -30.4. Wyngaarden JB, Smith LH, eds. In: Cecil-Loeb textbook of medicine, 16th ed. Philadelphia: WB
Saunders, 1982:2106-8.5. Neves J, Marinho RP, De Araujo PK, Raso P. Spinal cord complications of acute Schistosomiasis man
soni. Transactions Royal Society Trop Med Hyg 1973;67:782-92.6. Lechtenberg R, Vaida GA. Schistosomiasis of the spinal cord. Neurology 1 977;27:55-9.7. The Medical Letter. Drugs for parasitic infections. The Medical Letter 1984:26;27-32.8. Cohen J, Capildeo R, Rose FC, et al. Schistosomal myelopathy. Br Med J 1977; 1 :1258.9. Istre G, Fontaine RE, Tarr J, et. al. Acute schistosomiasis among Americans rafting the Omo River,
Ethiopia. JAMA 1 984;251:508-10.

448 MMWR August 10, 1984
Work-Related Allergies in Insect-Raising Facilities
Complaints of skin and respiratory allergies have frequently been reported by employees in facilities that raise insects for entomologic research. In 1980, the U.S. Department of Agriculture asked the National Institute for Occupational Safety and Health (NIOSH) to conduct a health hazard evaluation among employees of the Agricultural Research Service (ARS). For this study, NIOSH used a mailed, self-administered questionnaire. This questionnaire was designed to assess the prevalence of symptoms possibly related to allergenic airborne particulates associated with raising colonies of insects in confined spaces; the frequency of insect bites or stings was not of major concern in the study.
The following case reports are representative of those elicited by the survey.Case 1: A worker had onset of burning eyes and nasal and sinus “stuffiness" after working
for about 2 years with various moth species. These symptoms typically began approximately an hour after exposure to the moths and would last up to 1 day after exposure ceased. Use of
(Continued on page 453)
TABLE I. Summary—cases specified notifiable diseases, United States
Disease31 st Week Ending Cumulative, 31 st Week Ending
Aug. 4, 1984
Aug. 6 1983
Median197 9 -19 8 3
Aug. 4, 1984
Aug. 6 1983
Median1979-1983
Acquired Immunodeficiency Syndrome (AIDS) 84 N N 2,397 N NAseptic meningitisEncephalitis: Primary (arthropod-borne
283 4 34 290 3,017 4 ,1 1 0 3,507
& unspec.) 25 67 43 529 710 608Post-infectious 2 2 2 65 60 60
Gonorrhea: Civilian 16,069 17,992 2 0 ,6 15 479 ,330 5 2 4 ,1 7 0 571,771Military 657 502 574 12,548 14,093 16,103
Hepatitis: Type A 380 369 548 12,232 12,346 15,134Type B 602 4 84 442 14,691 13,908 12,013Non A, Non B 70 72 N 2,175 2 ,039 NUnspecified 122 137 202 3,470 4 ,257 5 ,946
Legionellosis 12 23 N 337 4 2 0 NLeprosy 5 6 5 131 152 126Malaria 20 14 16 496 4 43 609Measles. Total* 46 15 33 2,117 1,174 2,438
Indigenous 43 12 N 1,881 9 79 NImported 3 3 N 236 195 N
Meningococcal infections: Total 49 39 39 1,852 1,875 1,875Civilian 49 39 39 1,848 1 ,859 1,859Military - - 4 16 13
Mumps 20 33 49 2,045 2 ,2 9 9 4 ,084Pertussis 44 67 51 1,138 1,265 785Rubella (German measles) 6 10 33 491 726 1,862Syphilis (Primary & Secondary): Civilian 498 721 596 16,406 19,060 1 7,749
Military 5 6 5 207 2 48 230Toxic Shock syndrome 9 4 N 253 277 NTuberculosis 415 442 492 12,581 13,652 15,737Tularemia 14 11 9 164 1 65 131Typhoid fever 4 11 12 177 220 258Typhus fever, tick-borne (RMSF) 35 57 49 468 6 99 691Rabies, animal 94 107 111 2,967 3 ,825 3,825
TABLE II. Notifiable diseases of low frequency, United States
Anthrax
Cum. 1984
1 Plague
Cum. 1 984
16Botulism: Foodborne (Wash. 1) 7 Poliomyelitis: Total 2
Infant (Calif. 2) 59 Paralytic 2Other 4 Psittacosis (Oreg. 1, Calif. 1) 49
Brucellosis (Upstate N Y. 1, Mo. 1) 62 Rabies, human33Cholera - Tetanus (Upstate N Y. 1, Ga. 1)
Congenital rubella syndrome 3 Trichinosis 56Diphtheria 1 Typhus fever, flea-borne (endemic, murine) (N.C. 1, 12Leptospirosis 10 Tex. 1)
'Tw o of the 46 reported cases for this week were imported from a foreign country or can be directly traceable to a known internationally imported case within two generations.
Vol. 33/No. 31 MMWR 449
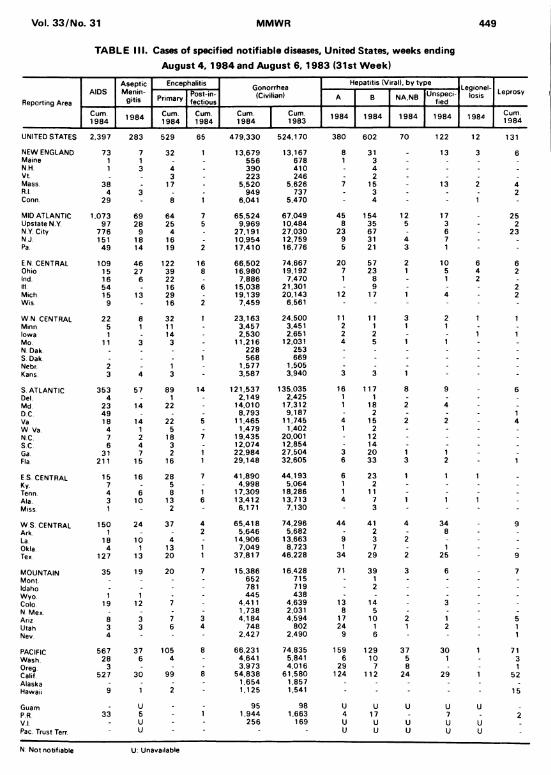
TABLE III. Cases of specified notifiable diseases. United States, weeks ending August 4, 1984 and August 6, 1983 (31st Week)
Reporting AreaAIDS
AsepticMenin
gitis
Encephalitis Gonorrhea(Civilian)
Hepatitis (Viral), by typeLegionel-
losis LeprosyPrimary Post-in
fectiousA B NA.NB Unspeci
fied
Cum.1984 1 984 Cum.
1984Cum.1984
Cum.1984
Cum.1983
1984 1984 1 984 1984 1984 Cum.1984
UNITED STATES 2.397 283 529 65 4 79 .33 0 524,170 380 602 70 122 12 131
NEW ENGLAND 73 7 32 1 13.679 13,167 8 31 _ 13 3 6Maine 1 1 . 556 678 1 3N.H. 1 3 4 390 410 - 4 -Vt. . 3 223 246 2 .Mass. 38 . 17 5 ,520 5,626 7 15 - 13 2 4R.l. 4 3 . 949 737 3 - - 2Conn. 29 - 8 1 6.041 5.470 4 - 1 -
MID ATLANTIC 1.073 69 64 7 6 5,524 67,049 45 154 12 17 25Upstate N Y. 97 28 25 5 9,969 10.484 8 35 5 3 2N Y. City 776 9 4 27.191 27,030 23 67 - 6 23N J. 151 18 16 . 10,954 12,759 9 31 4 7 .Pa 49 14 19 2 17.410 16,776 5 21 3 1 -
E N. CENTRAL 109 46 122 16 66.502 74.667 20 57 2 10 6 6Ohio 15 27 39 8 16.980 19,192 7 23 1 5 4 2Ind. 16 6 22 . 7,886 7,470 1 8 - 1 2 -Ill 54 16 6 15,038 21,301 - 9 - 2Mich 15 13 29 19.139 20.143 12 17 1 4 2Wis 9 - 16 2 7 ,459 6,561 - - -
W N CENTRAL 22 8 32 1 23.163 24,500 11 11 3 2 1 1Minn. 5 1 11 - 3.457 3,451 2 1 1 1Iowa 1 . 14 2 ,530 2,651 2 2 - 1 1Mo 11 3 3 - 11,216 12,031 4 5 1 1N Dak . 228 253 - - - -
S. Dak. . 1 568 669 - - - -
Nebr. 2 . 1 1.577 1,505 - - - - -
Kans 3 4 3 - 3,587 3,940 3 3 1 -
S ATLANTIC 353 57 89 14 121.537 135,035 16 117 8 9 6Del. 4 1 - 2 .149 2,425 1 1 - -
Md 23 14 22 - 14,010 17,312 1 18 2 4DC 49 . 8 .793 9,187 - 2 - - 1Va 18 14 22 5 11,465 11,745 4 15 2 2 4W Va 4 1 5 1.479 1,402 1 2 - - -
NC 7 2 18 7 19,435 20,001 12 - - -
SC 6 4 3 12.074 12,854 14 - .
Ga 31 7 2 1 22,984 27,504 3 20 1 1 .
Fla. 211 15 16 1 29.148 32.605 6 33 3 2 1
E S CENTRAL 15 16 28 7 41 ,8 90 44,193 6 23 1 1 1 .
Ky. 7 5 4 ,998 5,064 1 2 - - -
Tenn. 4 6 8 1 17.309 18,286 1 11 - - -
Ala. 3 10 13 6 13.412 13,713 4 7 1 1 1 -
Miss. 1 - 2 6.171 7,130 3 - -
W S. CENTRAL 150 24 37 4 65.4 18 74,296 44 41 4 34 9Ark. 1 . 2 5.646 5,682 2 8 .
La. 18 10 4 - 14,906 13,663 9 3 2 .
Okla 4 1 13 1 7.049 8.723 1 7 - 1 .
Tex. 127 13 20 1 37,817 46,228 34 29 2 25 9
MOUNTAIN 35 19 20 7 15.386 16.428 71 39 3 6 7Mont. - - 652 715 1 - -
Idaho 781 719 2 - -
Wyo 1 1 4 45 438 - - - -
Colo. 19 12 7 4,411 4,639 13 14 - 3 -
N Mex . - 1,738 2,031 8 5 -
Ariz 8 3 7 3 4 .184 4,594 17 10 2 1 5Utah 3 3 6 4 748 802 24 1 1 2 1Nev. 4 - 2 ,427 2,490 9 6 - 1
PACIFIC 567 37 105 8 66,231 74,835 159 129 37 30 1 71Wash. 28 6 4 4,641 5,841 6 10 5 1 3Oreg. 3 . - 3,973 4,016 29 7 8 1Calif 527 30 99 8 54.838 61,580 124 112 24 29 1 52Alaska - - 1 ,654 1,857 - -Hawaii 9 1 2 1,125 1,541 - - - 15
Guam . U . 95 98 U U U U UPR 33 5 - 1 1,944 1,663 4 17 - 7 2VI. - U 256 169 U U u U UPac. Trust Terr. U - * - U U u u u
N: Not notifiable U: Unavailable
450 MMWR August 10, 1984
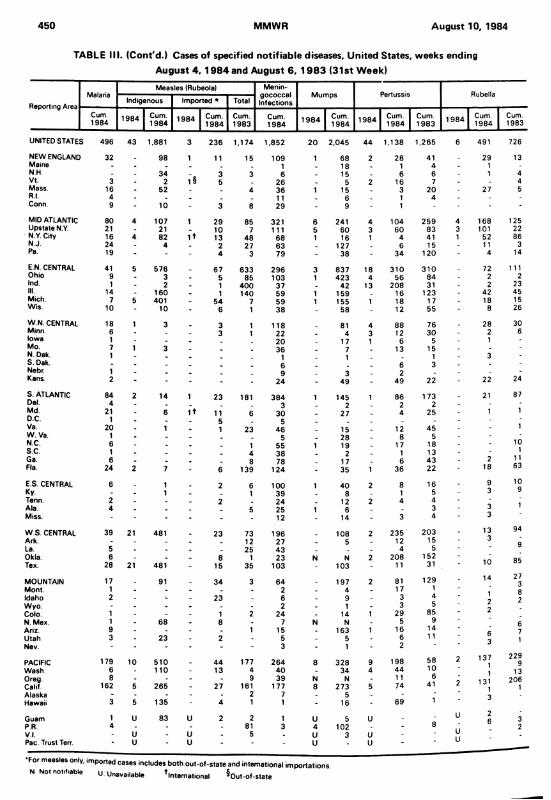
TABLE III. (Cont'd.) Cases of specified notifiable diseases, United States, weeks endingAugust 4, 1984 and August 6, 1983 (31st Week)
Reporting AreaMalaria
Measles (Rubeola) Menin-gococcalInfections
Mumps Pertussis RubellaIndigenous Imported * Total
Cum.1984 1984 Cum.
1984 1984 Cum.1984
Cum.1983
Cum.1984 1 98 4 Cum.
1984 1984 Cum.1984
Cum.1983
1984 Cum.1984
Cum.1983
UNITED STATES 496 43 1,881 3 236 1,174 1,852 20 2,045 44 1,138 1,265 6 491 726
NEW ENGLAND 32 . 98 1 11 15 109 1 68 2 28 41 29 13Maine . . . . 1 18 1 4 1N.H. - - 34 . 3 3 6 . 15 . 6 6 1 4Vt. 3 . 2 1§ 5 26 . 5 2 16 7 4Mass. 16 - 52 . . 4 36 1 15 . 3 20 27 5R.l. 4 . . . . . 11 . 6 1 4 -Conn. 9 - 10 - 3 8 29 - 9 1 -
MID ATLANTIC 80 4 107 1 29 85 321 6 241 4 104 2 59 4 168 125Upstate N.Y. 21 - 21 _ 10 7 111 5 60 3 60 83 3 101 22N Y. City 16 4 82 I t 13 48 68 1 16 1 4 41 1 52 86N.J. 24 - 4 . 2 27 63 . 127 . 6 15 11 3Pa. 19 ' - - 4 3 79 - 38 - 34 120 4 14
E.N. CENTRAL 41 5 576 _ 67 633 296 3 837 18 310 3 10 72 111Ohio 9 - 3 - 5 85 103 1 423 4 56 84 2 2Ind. 1 - 2 - 1 400 37 . 42 13 208 31 2 23III. 14 - 160 - 1 140 59 1 159 . 16 123 42 45Mich. 7 5 401 _ 54 7 59 1 155 1 18 17 18 15Wis. 10 - 10 - 6 1 38 58 - 12 55 8 26
W.N. CENTRAL 18 1 3 3 1 118 81 4 88 76 28 30Minn. 6 - . . 3 1 22 _ 4 3 12 30 2 6Iowa 1 - - . 20 . 17 1 6 5 1Mo. 7 1 3 . _ . 36 . 7 13 15N. Dak. 1 _ ■j 1 3S. Dak. . _ . _ 6 6 3Nebr. 1 . . _ 9 3 2Kans. 2 - • - - - 24 - 49 - 49 22 22 24
S. ATLANTIC 84 2 14 1 23 181 3 84 1 145 1 86 173 21 87Del. 4 - . . 3 2 2 2Md. 21 - 6 1 + 11 6 30 . 27 . 4 25 1 1D.C. 1 - . . 5 5 . _ .Va. 20 - 1 . 1 23 46 _ 15 . 12 45 - 1W . Va. 1 - . _ . 5 . 28 8 5N.C. 6 - . . . 1 55 1 19 . 17 18 10s.c. 1 - . _ . 4 38 2 1 13 1Ga 6 - . . . 8 78 . 17 6 43 2 11Fla. 24 2 7 - 6 139 124 - 35 1 36 22 18 63
E.S. CENTRAL 6 . 1 2 6 100 1 40 2 8 16 9 10Ky. - . 1 . 1 39 8 1 5 3 9Tenn. 2 - . 2 . 24 _ 12 2 4 4 'Ala. 4 . . 5 25 1 6 . 3 3 1Miss. - - - - 12 14 - 3 4 3
W.S. CENTRAL 39 21 481 . 23 73 196 108 2 235 2 03 13 94
Ark. - . . 12 27 . 5 . 12 15 3g
La. 5 . . . 25 43 . . . 4 5Okla. 6 - . - 8 1 23 N N 2 208 152 1 A 85Tex. 28 21 481 - 15 35 103 - 103 - 11 31 1 U
MOUNTAIN 17 . 91 . 34 3 64 . 197 2 81 129 14 273
Mont. 1 - - - . 2 . 4 17 1 8Idaho 2 - - - 23 6 . 9 . 3 4 2Wyo. - - - - . - 2 . 1 - 3 5 2
9Colo. 1 - - - 1 2 24 . 14 1 29 85 t.
N. Mex. 1 - 68 . 8 - 7 N N - 5 9 6Ariz. 9 . - - . 1 15 . 163 1 16 14 c 7Utah 3 - 23 - 2 5 - 5 - 6 1 1 o
3 1Nev. - - - - - 3 - 1 - 2
PACIFIC 179 10 510 . 44 177 264 8 328 9 198 58 2 1371
2299
Wash. 6 - 110 - 13 4 40 . 34 4 44 10 1 13Oreg. 8 - - - - 9 39 N N - 11 6 ' 131 206Calif. 162 5 265 - 27 161 177 8 273 5 74 41 1 1Alaska - - - - - 2 7 - 5 - - • 3Hawaii 3 5 135 - 4 1 1 - 16 - 69 1
Guam 1 U 83 U 2 2 1 u 5 U - U 26 3
PR. 4 - - - - 81 3 4 102 - - 8 1 1 2V I. - U - u - 5 - U 3 u - UPac. Trust Terr.
'u " u * ' • U * u ■ U
•For measles only, imported cases includes both out-of-state and international importations.
N Not notifiable U: Unavailable ^International ^Out-of-state

Vol. 33/No. 31 MMWR 451
TABLE III. (Cont'd.) Cases of specified notifiable diseases. United States, weeks ending
August 4, 1984 and August 6, 1983 (31st Week)
Reporting Area
Syphilis (Civilian) (Primary & Secondary)
Toxic-shock
SyndromeTuberculosis Tula
remiaTyphoid
Fever
Typhus Fever (Tick-borne)
(RMSF)
Rabies.Animal
Cum.1984
Cum.1983 1984 Cum.
1984Cum1983
Cum.1984
Cum1984
Cum.1984
Cum.1984
UNITED STATES 16,406 1 9 ,060 9 12,581 13,652 164 177 4 6 8 + ' 2 ,967
NEW ENGLAND 314 4 10 1 364 401 4 9 2 26Maine 3 11 18 26 . . 10N.H. 10 16 1 23 28 . . 6Vt. 1 1 8 6 - . . -Mass. 185 257 196 205 4 7 2 5R.l. 11 14 28 31 . - -Conn. 104 111 91 105 2 - 5
MID ATLANTIC 2,231 2 ,404 2.275 2,431 26 8 204Upstate N Y 157 199 393 371 10 3 28N Y. City 1,396 1,417 922 1,002 6 1N J 399 4 64 497 524 6 3 5Pa. 279 324 463 534 4 1 171 ;
E.N. CENTRAL 752 1,040 6 1,697 1,767 2 23 27 127Ohio 153 274 6 322 277 4 21 14Ind. 85 74 186 181 2 4 13III. 249 509 703 765 2 8 - 52Mich. 218 138 380 455 3 2 14Wis. 47 45 106 89 6 34
W N. CENTRAL 236 227 375 445 59 6 28 - 507Minn. 69 92 67 87 2 - 52Iowa 10 11 42 - 44 - - 1 100Mo 117 84 183 226 31 3 5 40N Dak r 6 2 9 5 - 105S Dak 2 9 13 30 26 - 4 133Nebr. 11 11 18 16 - 2 34Kans. 21 18 43 37 2 1 16 43
S. ATLANTIC 4 .887 4 ,996 2 ,617 2.726 4 22 235 " 825Del 31 20 32 24 - - 4Md 302 326 275 219 - 1 26 438DC 191 219 97 110 6 -
Va 246 339 255 277 - 5 34 140W Va 11 18 82 86 - 6 23NC 4 88 464 399 389 1 1 89 13SC 4 46 311 318 . 249 1 55 30Ga 832 914 371 490 3 1 23 108Fla 2 ,340 2.385 788 882 - 7 2 64
E S CENTRAL 1.111 1,303 1,153 1,251 3 5 43 148Ky 63 85 303 - 2 7 43Tenn 302 373 355 375 3 2 23 60Ala 354 523 343 325 - 1 7 45Miss 392 322 178 248 - 6 *
W S. CENTRAL 4 .043 5,026 1 1,442 1,632 71 10 113 — 627Ark 109 123 1 153 188 49 - 18 64La 719 1,036 182 271 6 1 1 34Okla. 134 130 151 126 15 2 7 4 - 73Tex 3,081 3,737 956 1,047 1 7 20 456
MOUNTAIN 367 404 1 322 384 15 10 10 154Mont. 2 5 14 34 1 8 80Idaho 14 6 20 21 4 - 1 2Wyo 4 9 10 - 1 4
Colo 86 91 30 50 5 2 25N Mex. 50 121 61 77 1 3 9Ariz. 137 96 1 152 143 2 3 26Utah 12 13 29 28 2 1Nev. 62 63 16 21 1 1 ' 7
PACIFIC 2,465 3,250 2 ,336 2,615 6 66 2 349
Wash. 83 116 119 133 2 - 1Oreg. 71 74 96 113 2 1 1 1Calif. 2,261 3,013 1,961 2,187 4 58 341
Alaska 3 7 33 36 1 1 6Hawaii 47 40 127 146 4 ■
Guam U 5 4 - -34PR. 482 598 2 44 290 3
VI. 8 12 U 2 1 - 3Pac. Trust Terr. U
U Unavailable
452 MMWR August 10, 1984
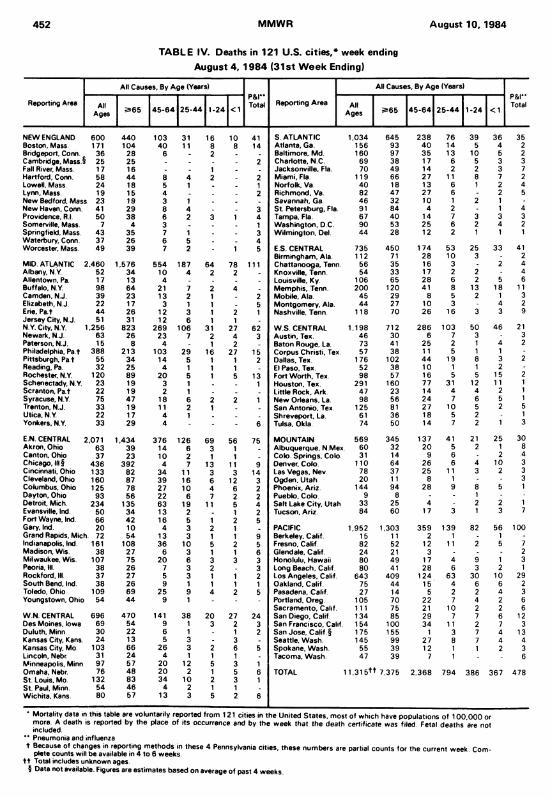
TABLE IV. Deaths in 121 U.S. cities,* week ending August 4, 1984 (31st W eek Ending)
Reporting Area
All Causes, By Age (Years)p&rTotal Reporting Area
All Causes, By Age (Years)p & rTotalAll
Ages 2*65 4 5 -6 4 2 5 -4 4 1-24 <1 AltAges 2=65 4 5 -6 4 2 5 -4 4 1 -24 <1
NEW ENGLAND 600 4 40 103 31 16 10 41 S ATLANTIC 1,034 645 2 38 76 39 36 35Boston, Mass. 171 104 40 11 8 8 14 Atlanta, Ga. 156 93 4 0 14 5 4 2Bridgeport, Conn. 36 28 6 . 2 . . Baltimore, Md. 160 97 35 13 10 5 2Cambridge, Mass.9 25 25 . . . . 2 Charlotte, N.C. 69 38 17 6 5 3 3Fall River, Mass. 17 16 . . 1 . Jacksonville. Fla. 70 49 14 2 2 3 7Hartford, Conn. 58 44 8 4 2 . 2 Miami, Fla. 119 66 27 11 8 7 2Lowell, Mass 24 18 5 1 . . 1 Norfolk, Va. 40 18 13 6 1 2 4Lynn, Mass 19 15 4 . . . 2 Richmond, Va. 82 47 27 6 2 5New Bedford, Mass 23 19 3 1 . _ Savannah. Ga. 46 32 10 1 2 1New Haven, Conn. 41 29 8 4 . 3 St. F*etersburg, Fla. 91 84 4 2 - 1 4Providence, R.l. 50 38 6 2 3 1 4 Tampa, Fla. 67 40 14 7 3 3 3Somerville, Mass. 7 4 3 . . _ 1 Washington, D C. 90 53 25 6 2 4 2Springfield, Mass. 43 35 7 1 . - 3 Wilmington, Del. 44 28 12 2 1 1 1Waterbury, Conn. 37 26 6 5 - 4Worcester, Mass. 49 39 7 2 . 1 5 E.S. CENTRAL 735 450 174 53 25 33 41
Birmingham, Ala. 112 71 28 10 3 2MID. ATLANTIC 2,460 1,576 554 187 64 78 111 Chattanooga. Tenn. 56 35 16 3 - 2 4Albany, N Y. 52 34 10 4 2 2 . Knoxville, Tenn. 54 33 17 2 2 - 4Allentown, Pa. 17 13 4 . _ . Louisville, Ky. 106 65 28 6 2 5 6Buffalo. N Y. 98 64 21 7 2 4 _ Memphis, Tenn. 200 120 41 8 13 18 11Camden, N.J. 39 23 13 2 1 . 2 Mobile. Ala 45 29 8 5 2 1 3Elizabeth, N.J. 22 17 3 1 1 . 5 Montgomery, Ala. 44 27 10 3 - 4 2Erie. Pa t 44 26 12 3 1 2 1 Nashville, Tenn 118 70 26 16 3 3 9Jersey City, N.J. 51 31 12 6 1 1 .N Y. City, N Y. 1,256 823 269 106 31 27 62 W.S. CENTRAL 1,198 712 2 86 103 50 46 21Newark, N.J. 63 26 23 7 2 4 3 Austin. Tex. 46 30 6 7 3 3Paterson, N.J. 15 8 4 - 1 2 . Baton Rouge, La. 73 41 25 2 1 4 2Philadelphia, Pa t 388 213 103 29 16 27 15 Corpus Christi, Tex 57 38 11 5 1 1 -Pittsburgh, Pa t 55 34 14 5 1 1 2 Dallas, Tex. 176 102 44 19 8 3 2Reading, Pa. 32 25 4 1 1 1 El Paso, Tex. 52 38 10 1 1 2Rochester, N.Y. 120 89 20 5 1 5 13 Fort Worth. Tex. 98 57 16 5 5 15 2Schenectady, N.Y. 23 19 3 1 1 Houston, Tex. 291 160 77 31 12 1 1 1Scranton, P at 22 19 2 1 . . Little Rock. Ark. 47 23 14 4 4 2 1Syracuse, N.Y. 75 47 18 6 2 2 1 New Orleans. La. 98 56 24 7 6 5 1Trenton, N.J. 33 19 11 2 1 . San Antonio. Tex 125 81 27 10 5 2 5Utica, N.Y. 22 17 4 1 . . Shreveport, La. 61 36 18 5 2 1Yonkers. N.Y. 33 29 4 - * - 6 Tulsa, Okla. 74 50 14 7 2 1 3
E.N. CENTRAL 2,071 1,434 376 126 i69 56 75 MOUNTAIN 569 345 137 41 21 25 30Akron, Ohio 63 39 14 6 3 1 Albuquerque, N.Mex 60 32 20 5 2 1 8Canton. Ohio 37 23 10 2 1 1 . Colo. Springs, Colo 31 14 9 6 2 4Chicago, III § 436 392 4 7 13 11 9 Denver, Colo. 110 64 26 6 4 10 3Cincinnati. Ohio 133 82 34 11 3 3 14 Las Vegas, Nev 78 37 25 11 3 2 3Cleveland, Ohio 160 87 39 16 6 12 3 Ogden, Utah 20 11 8 1 - 3Columbus, Ohio 125 78 27 10 4 6 2 Phoenix, Ariz. 144 94 28 9 8 5 1Dayton, Ohio 93 56 22 6 7 2 2 Pueblo, Colo. 9 8 - - 1Detroit, Mich. 234 135 63 19 11 5 4 Salt Lake City, Utah 33 25 4 2 2 1Evansville, Ind. 50 34 13 2 . 1 2 Tucson, Ariz. 84 60 17 3 1 3 7Fort Wayne, Ind. 66 42 16 5 1 2 5Gary. Ind. 20 10 4 3 2 1 . PACIFIC 1,952 1,303 359 139 82 56 100Grand Rapids, Mich. 72 54 13 3 1 1 9 Berkeley, Calif. 15 11 2 1 1Indianapolis, Ind. 161 108 36 10 5 2 5 Fresno, Calif. 82 52 12 11 2 5 7Madison. Wis. 38 27 6 3 1 1 6 Glendale. Calif 24 21 3 - 2Milwaukee, Wis. 107 75 20 6 3 3 3 Honolulu, Hawaii 80 49 17 4 9 1 3Peoria, III. 38 26 7 3 2 . 3 Long Beach, Calif. 80 41 28 6 3 2 1Rockford, III. 37 27 5 3 1 1 2 Los Angeles, Calif 643 409 124 63 30 10 29South Bend, Ind. 38 26 9 1 1 1 1 Oakland, Calif. 75 44 15 4 6 6 2Toledo, Ohio 109 69 25 9 4 2 5 Pasadena, Calif 27 14 5 2 2 4 3Youngstown, Ohio 54 44 9 1 - - Portland, Oreg. 105 70 22 7 4 2 6
Sacramento, Calif 111 75 21 10 2 2 6W.N. CENTRAL 696 4 70 141 38 20 27 24 San Diego, Calif. 134 85 29 7 7 6 12Des Moines, Iowa 69 54 9 1 3 2 3 San Francisco, Calif. 154 100 34 11 2 7 3Duluth, Minn 30 22 6 1 1 2 San Jose, Calif. § 175 155 1 3 7 4 13Kansas City, Kans. 24 13 5 3 - 3 - Seattle, Wash. 145 99 27 8 7 4 4Kansas City, Mo. 103 66 26 3 2 6 5 Spokane. Wash. 55 39 12 1 1 2 3Lincoln, Nebr 31 24 4 1 1 1 - Tacoma, Wash. 47 39 7 1 . 6Minneapolis, Minn 97 57 20 12 5 3 1Omaha, Nebr. 76 48 20 2 1 5 6 TOTAL 11.315TT 7 375 2 ,368 794 386 367 478St. Louis, Mo. 132 83 34 10 2 3 1St. Paul, Mirin. 54 46 4 2 1 1Wichita. Kans. 80 57 13 3 5 2 6
* Mortality data in this table are voluntarily reported from 121 cities in the United States, most of which have populations of 1 00 ,000 or more. A death is reported by the place of its occurrence and by the week that the death certificate was filed Fetal deaths are not included.
'* Pneumonia and influenzat Because of changes in reporting methods in these 4 Pennsylvania cities, these numbers are partial counts for the current week Com
plete counts will be available in 4 to 6 weeks, t t Total includes unknown ages.
§ Data not available. Figures are estimates based on average of past 4 weeks.
MMWR 453
Allergies - Continueda battery-powered, air-purifying respirator prevented their occurrence. Serologic testing for antibodies to standard fungal antigens was negative. Skin tests for allergies to house dust, house-dust mite, molds, moth scales, and adult and larval stages of the screwworm fly were also negative. An extract of the larval stage of the He/iothis moth caused a positive skin reaction. The employee stopped working with He/iothis species, and the symptoms did not recur.
Case 2: A worker experienced nasal irritation and congestion, cough, and episodes of shortness of breath with chest tightness within one-half hour after exposure to scales and "frass" (debris or excrement) from several insects. After working for 2 years with Antho- nomus grandis (boll weevil), the worker, because of these symptoms, was transferred to a job that involved working with He/iothis species. The symptoms recurred within 3 years of working with moths, and resolved after transfer to a job involving work with Musca domestica (housefly). The symptoms occurred again within 2 years' work with this insect. Symptoms recurred within 5 months after another job change to work with Cochliomyia homonivorax (screwworm) species. The worker's serum immunoglobulin E level was markedly elevated to 2,060 (normal less than 780), and eosinophil counts were elevated. Chest x-ray and pulmonary-function tests, including methacholine challenge, were normal. Allergy skin testing was positive for housefly and moth extracts and for extracts from the adult and larval stages of the screwworm fly. When the employee transferred to a job that did not involve insect- related work, the symptoms finally disappeared.
In November 1983, NIOSH reported results of the survey ( 1). Employees at 87% (85/98) of the ARS insect-raising facilities participated, representing 37 states; the overall response rate was 71% (753 /1 ,062). Of those responding, 25% (190/753) reported current or past symptoms consistent with allergic reactions related to work. The most prevalent symptoms reported included sneezing or runny nose (73%), eye irritation (68%), skin irritation or skin rash (41%), cough (38%), wheezing (26%), and shortness of breath (24%). At 61% (52/85) of the respondent facilities, at least one employee reported current or past symptoms suggestive of work-related allergy; at five of the facilities, 10 or more employees reported such symptoms.
Of the entomologists and laboratory technicians who worked directly with insects, 33% (168/507) reported symptoms suggestive of work-related allergy, compared with 9% (22/246) of workers who had little or no direct contact with insects (p < 0.001).
Symptoms began within half an hour after arriving at work in 48% (92/1 90) of the affected employees and between one-half and 4 hours after arrival in another 30% (57/1 90). Sixty-six percent of workers (125/190) reported improvement in the evening after going home; improvement or complete resolution on weekends was reported by 74% (141 /190 ) and on vacations by 82% (155/190). Forty-four percent (83/190) consulted physicians because of symptoms; treatment was prescribed for 83% (69/83). Twenty-two percent (41/190) of those reporting symptoms suggestive of work-related allergy either discontinued working with the insect thought responsible for their symptoms or transferred to another work area or job.
Respondents identified the cause of their symptoms as airborne insect material (83% [157/190]), direct contact with an insect or insect part (52% [99 /190]), insect stings (6% [12/190]), and insect bites (4% [7/190]). The most frequently implicated insects were in the Lepidoptera order (moths and butterflies) (66% of 282 multiple responses). No work-related symptoms of allergy was reported in areas of one insectary that was specially constructed of waterproof concrete blocks so that all surfaces could be thoroughly cleaned three times a week with a pressurized wet-spray, wash-down method.Reported by Div o f Respiratory Disease Studies, National Institute for Occupational Safety and Health CDC.
Vol. 33/No. 31

August 10, 1984454 MMWRAllergies — ContinuedEditorial Note: For many years, entomologists have recognized allergies associated with raising insects in confined spaces. Watery eyes, sneezing, and asthma were reported in 1918 by an entomologist raising the New Mexico range caterpillar (2 ); in 1965, symptoms of inhalant allergy were described by workers at a screwworm facility (3); in 1972, "terrible fits of asthma and itching eruptions of hands" were reported by entomologists working with cockroaches (4); investigation of allergic sensitivity in workers exposed to gypsy moths was reported in 1982 (5 ); and a case of hypersensitivity pneumonitis attributed to Penicillium mold was reported by an entomologist working at an insect-raising facility (6).
Employees in insect-raising facilities can be exposed to various potentially sensitizing airborne particulates, such as insect parts or excrement, components of culture media, and airborne bacteria or fungi. The relative importance of these agents in sensitizing the worker is not clear.
The symptoms observed in the NIOSH survey are consistent with results of a pilot survey- conducted by the Insect Allergy Committee of the Entomological Society of America (7) and with other reports in the medical literature. Such reports indicate that eye irritation, respiratory symptoms (sneezing, cough, chest tightness), and skin irritation or rash are the major symptoms of insect allergy in these facilities (8 ,9). The findings are also consistent with results of outbreak investigations of allergic reactions occurring in the general population when the number of insects markedly increases (5,9).
Several measures are recommended to prevent sensitizing exposures of workers in insectraising facilities: (1) segregating insect colonies in one building or in one part of a building; (2) designing facilities so that all surfaces can be readily washed down; (3) establishing a "single pass" air-handling system for insect-raising rooms independent of systems circulating air to the general laboratory area and office space; (4) equipping the independent air-handling system with high-efficiency particulate air filters; (5) substituting vertical laminar flow biologic safety cabinets for the horizontal laminar flow cabinets that cause air to pass across the insects toward the workers' faces; and (6) using laboratory coats and disposable gloves at all cabinets and insect-handling work stations. Protective devices—such as battery-powered, air-purifying, full-face respirators—may reduce the potential for contact of airborne allergens with mucous membranes but are considered less effective than environmental controls. Transfer to other jobs may be the only satisfactory alternative for hypersensitive workers with severe symptoms.
References1. NIOSH. Health hazard evaluation report no. GHETA 81-121. Morgantown, West Virginia: National In
stitute for Occupational Safety and Health, 1983.2. Caffrey DJ. Notes on the poisonous urticating spines of Hemi/euca o/iviae larvae. J Econ Entomol
1918;11:363-7.3. Gibbons HL, Dille JR, Cowley RG. Inhalant allergy to the screwworm fly. Preliminary report. Arch Envi
ron Health 1965;10:424-30.4. Bernton HS, McMahon TF, Brown H. Cockroach asthma. Br J Dis Chest 1 972;66:61 -6.5. Etkind PH, O'Dell TM, Canada AT, Shama SK, Finn AM, Tuthill R. The gypsy moth caterpillar: a signifi
cant new occupational and public health problem. J Occup Med 1982;24:659-62.6. Solley GO, Hyatt RE. Hypersensitivity pneumonitis induced by Penicillium species. J Allergy Clin Im
munol 1980;65:65-70.7. Wirtz RA. Occupational allergies to arthropods—documentation and prevention. Bull Entomol Soc
America 1980;26:356-60.8. Burge PS, Edge G, O'Brien IM, Harries MG, Hawkins R, Pepys J. Occupational asthma in a research
centre breeding locusts. Clin Allergy 1980; 10:355-63.9. Bellas TE. Insects as a cause of inhalant allergies: a bibliography. Division of Entomology Report No.
25. 2nd ed. Canberra City, Australia: Commonwealth Scientific and Industrial Research Organization, 1982.

Vol. 33 /No. 31 MMWR 455
Current Trends
Influenza Virus Activity — Texas, 1983-1984 Season
Analyses of reported cases of influenza, school absentee levels, and influenza virus isolates indicate that Texas experienced intense influenza activity in January and February 1 984. The influenza epidemic was more severe, when measured by number of reported cases, than epidemics during the 1981 -1982 and 1 9 8 2 -1 9 8 3 seasons.
Cases of influenza are reported weekly by numeric totals to the Bureau of Epidemiology, Texas Department of Health, through a morbidity reporting system. This system encompasses over 500 reporting sources, including physicians, city and county health departments, and hospitals. Influenza viruses isolated in the state are reported through a virus surveillance system with 18 participating laboratories. A telephone surveillance system was used to ascertain levels of school absenteeism and operated from January through March 1 984. Public school districts randomly chosen from an alphabetic listing were telephoned to determine total number of schools in the district, total enrollment at each school, and number absent at each school for each day of the epidemic. An absentee level of 10% or greater for any school on any day was considered positive evidence of influenza activity.
A total of 102,437 influenza cases were reported in February compared with fewer than 22,000 in February for each of the preceding 2 years. These 102,437 reported cases are the highest number of influenza cases reported to the Bureau of Epidemiology for any month since record collection began in 1920.
A total of 1,039 influenza viruses were isolated in Texas from November 1, 1983, through April 30, 1 984. Seventy-two percent of these were isolated from specimens collected from January 22 through February 18 (weeks 4 -7 of the epidemic). Influenza type A(H1N1) virus represented 50% of all influenza viruses reported. Influenza B and influenza A(H3N2) comprised 48% and 2%, respectively. In March, 82% of the influenza viruses reported were type B.
Two hundred forty-two districts, representing 903 schools in 209 counties, were contacted between January 2 and March 30. Over 40% of the 315 schools surveyed during January 22-February 18 experienced absentee levels greater than 10%; 9% had absentee levels greater than 20%. During January 29-February 4, 70% of the 79 schools surveyed had absentee levels above 10%. No districts contacted after March 11 reported a school with an absentee level of 10% or greater.Reported by WP Glezen, MD, Influenza Research Center, Baylor College o f Medicine, Houston, JP Taylor, MPH, JN Perdue, Bureau o f Epidemiology, CE Alexander, MD, State Epidemiologist, Texas Dept o f Health. Editorial Note: This information from Texas documents the unusually high rate of influenza morbidity in association with widespread increases in school absenteeism in January and February and highlights at the state level the trends seen regionally and nationally during the past influenza season ( 1 ).Reference1. CDC. Influenza-United States, 1983-1984 season. MMWR 1984;33:41 7-21.
456 MMWR August 10, 1984
Errata: Vol. 33 , No. 29
p. 421. In the article, "Mumps Outbreak—New Jersey," the last sentence of the first paragraph of the Editorial Note on page 429 should read: "Cases in 1982 decreased by 38% from 1982 (5,270 cases) and by 98% from 1967." The 5 ,310 cases given was the provisional total for 1982.
Vol. 33, No. 28
p. 408. In the article, "Chromosomally Mediated Resistant Neisseria gonorrhoeae— United States," the third sentence of the third paragraph should read: Gonococcal isolates that grew on media containing 1.6 /ig/m l of penicillin or produced a zone of inhibition less than 26 mm, with a 10-Unit penicillin disk, were submitted to CDC for confirmation of resistance.
The Morbidity and M ortality Weekly Report is prepared by the Centers for Disease Control. Atlanta, Georgia, and available on a paid subscription basis from the Superintendent of Documents, U.S. Government Printing Office. Washington, D.C. 20402. (202) 783-3238.
The data in this report are provisional, based on weekly reports to CDC by state health departments. The reporting week concludes at close of business on Friday; compiled data on a national basis are officially released to the public on the succeeding Friday.
The editor welcomes accounts of interesting cases, outbreaks, environmental hazards, or other public health problems of current interest to health officials. Such reports and any other m atters pertaining to editorial or other textual considerations should be addressed to: ATTN: Editor, Morbidity and Mortality Weekly Report. Centers for Disease Control, Atlanta. Georgia 30333.
Director, Centers for Disease Control Editor Pro TemJames O. Mason, M.D., Dr.P.H. Walter W. Williams, M.D., M.P.H.
Director, Epidemiology Program Office Assistant EditorCarl W. Tyler, Jr., M.D. Karen L. Foster, M.A. ^
DEPARTMENT OF HEALTH & HUMAN SERVICESPublic Health Service Centers for Disease Control Atlanta GA 30333
Official BusinessPenalty for Private Use $300
S *HCRH NEWV75 8129 DR VERNE F NEWHCUSE VIROLOGY DIVISION C ID 7-B14
Postage and Fees Paid U.S. Dept, of H.H.S. HHS 396
X
HHS Publication No. (CDC) 84-8017 Redistribution using indicia is illegal.