Embed Size (px)
Citation preview
Epidemiologic evidence –
Energy balance-related factors and
pre- and postmenopausal breast cancer risk
World Obesity and WCRF International
Hot Topic Conference
1st September, 2016
Doris Chan
No conflict of interest
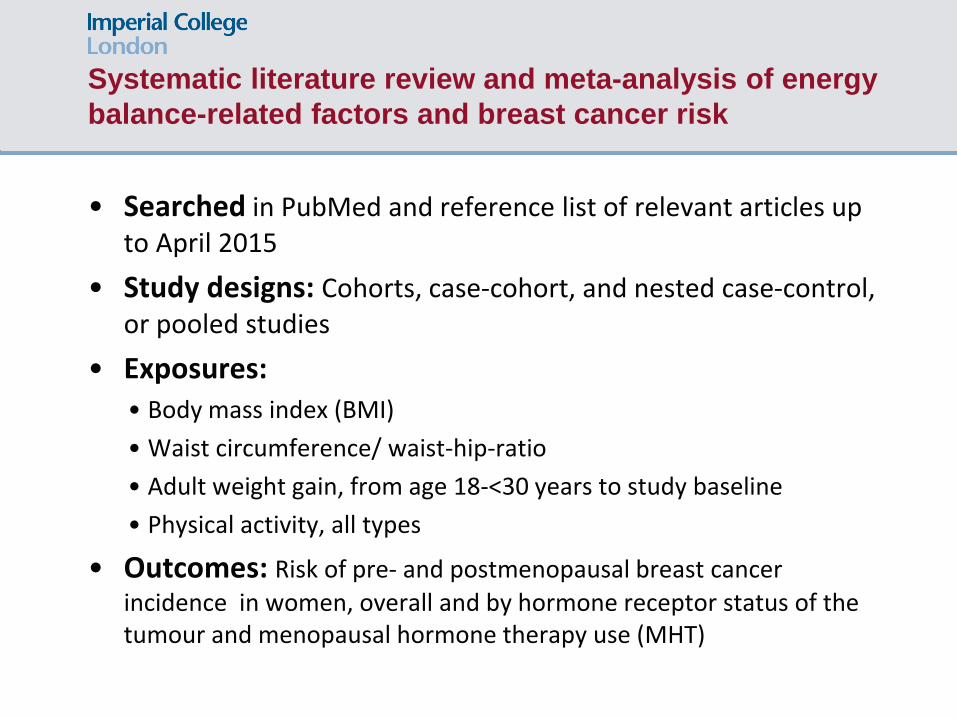
Systematic literature review and meta-analysis of energy
balance-related factors and breast cancer risk
• Searched in PubMed and reference list of relevant articles up to April 2015
• Study designs: Cohorts, case-cohort, and nested case-control, or pooled studies
• Exposures: • Body mass index (BMI)
• Waist circumference/ waist-hip-ratio
• Adult weight gain, from age 18-<30 years to study baseline
• Physical activity, all types
• Outcomes: Risk of pre- and postmenopausal breast cancer
incidence in women, overall and by hormone receptor status of the tumour and menopausal hormone therapy use (MHT)
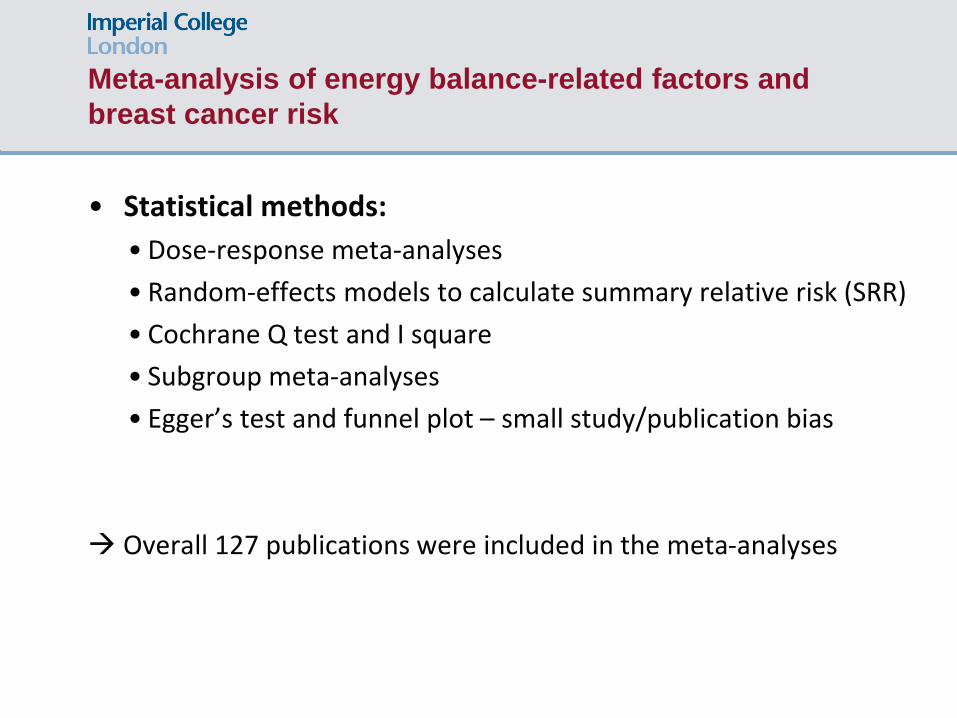
• Statistical methods:
• Dose-response meta-analyses
• Random-effects models to calculate summary relative risk (SRR)
• Cochrane Q test and I square
• Subgroup meta-analyses
• Egger’s test and funnel plot – small study/publication bias
Overall 127 publications were included in the meta-analyses
Meta-analysis of energy balance-related factors and
breast cancer risk
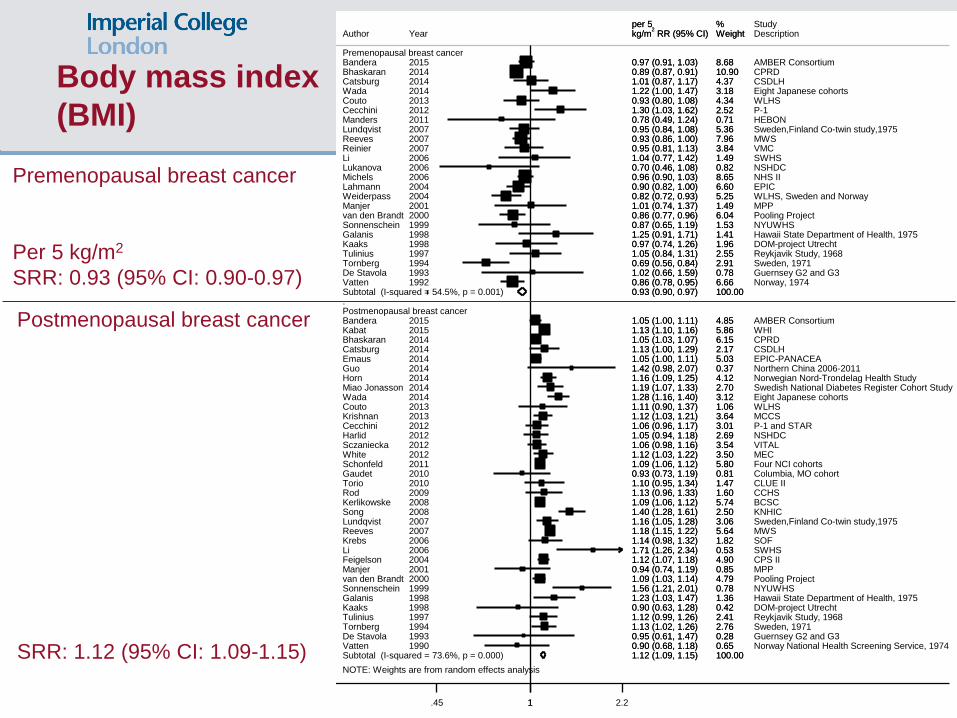
Body mass index
(BMI)
NOTE: Weights are from random effects analysis
.
.
Premenopausal breast cancerBanderaBhaskaranCatsburgWadaCoutoCecchiniMandersLundqvistReevesReinierLiLukanovaMichelsLahmannWeiderpassManjervan den BrandtSonnenscheinGalanisKaaksTuliniusTornbergDe StavolaVattenSubtotal (I-squared = 54.5%, p = 0.001)
Postmenopausal breast cancerBanderaKabatBhaskaranCatsburgEmausGuoHornMiao JonassonWadaCoutoKrishnanCecchiniHarlidSczanieckaWhiteSchonfeldGaudetTorioRodKerlikowskeSongLundqvistReevesKrebsLiFeigelsonManjervan den BrandtSonnenscheinGalanisKaaksTuliniusTornbergDe StavolaVattenSubtotal (I-squared = 73.6%, p = 0.000)
Author
201520142014201420132012201120072007200720062006200620042004200120001999199819981997199419931992
20152015201420142014201420142014201420132013201220122012201220112010201020092008200820072007200620062004200120001999199819981997199419931990
Year
0.97 (0.91, 1.03)0.89 (0.87, 0.91)1.01 (0.87, 1.17)1.22 (1.00, 1.47)0.93 (0.80, 1.08)1.30 (1.03, 1.62)0.78 (0.49, 1.24)0.95 (0.84, 1.08)0.93 (0.86, 1.00)0.95 (0.81, 1.13)1.04 (0.77, 1.42)0.70 (0.46, 1.08)0.96 (0.90, 1.03)0.90 (0.82, 1.00)0.82 (0.72, 0.93)1.01 (0.74, 1.37)0.86 (0.77, 0.96)0.87 (0.65, 1.19)1.25 (0.91, 1.71)0.97 (0.74, 1.26)1.05 (0.84, 1.31)0.69 (0.56, 0.84)1.02 (0.66, 1.59)0.86 (0.78, 0.95)0.93 (0.90, 0.97)
1.05 (1.00, 1.11)1.13 (1.10, 1.16)1.05 (1.03, 1.07)1.13 (1.00, 1.29)1.05 (1.00, 1.11)1.42 (0.98, 2.07)1.16 (1.09, 1.25)1.19 (1.07, 1.33)1.28 (1.16, 1.40)1.11 (0.90, 1.37)1.12 (1.03, 1.21)1.06 (0.96, 1.17)1.05 (0.94, 1.18)1.06 (0.98, 1.16)1.12 (1.03, 1.22)1.09 (1.06, 1.12)0.93 (0.73, 1.19)1.10 (0.95, 1.34)1.13 (0.96, 1.33)1.09 (1.06, 1.12)1.40 (1.28, 1.61)1.16 (1.05, 1.28)1.18 (1.15, 1.22)1.14 (0.98, 1.32)1.71 (1.26, 2.34)1.12 (1.07, 1.18)0.94 (0.74, 1.19)1.09 (1.03, 1.14)1.56 (1.21, 2.01)1.23 (1.03, 1.47)0.90 (0.63, 1.28)1.12 (0.99, 1.26)1.13 (1.02, 1.26)0.95 (0.61, 1.47)0.90 (0.68, 1.18)1.12 (1.09, 1.15)
kg/m2 RR (95% CI)
per 5
8.6810.904.373.184.342.520.715.367.963.841.490.828.656.605.251.496.041.531.411.962.552.910.786.66100.00
4.855.866.152.175.030.374.122.703.121.063.643.012.693.543.505.800.811.471.605.742.503.065.641.820.534.900.854.790.781.360.422.412.760.280.65100.00
Weight%
AMBER ConsortiumCPRDCSDLHEight Japanese cohortsWLHSP-1HEBONSweden,Finland Co-twin study,1975MWSVMCSWHSNSHDCNHS IIEPICWLHS, Sweden and NorwayMPPPooling ProjectNYUWHSHawaii State Department of Health, 1975DOM-project UtrechtReykjavik Study, 1968Sweden, 1971Guernsey G2 and G3Norway, 1974
AMBER ConsortiumWHICPRDCSDLHEPIC-PANACEANorthern China 2006-2011Norwegian Nord-Trondelag Health StudySwedish National Diabetes Register Cohort StudyEight Japanese cohortsWLHSMCCSP-1 and STARNSHDCVITALMECFour NCI cohortsColumbia, MO cohortCLUE IICCHSBCSCKNHICSweden,Finland Co-twin study,1975MWSSOFSWHSCPS IIMPPPooling ProjectNYUWHSHawaii State Department of Health, 1975DOM-project UtrechtReykjavik Study, 1968Sweden, 1971Guernsey G2 and G3Norway National Health Screening Service, 1974
DescriptionStudy
0.97 (0.91, 1.03)0.89 (0.87, 0.91)1.01 (0.87, 1.17)1.22 (1.00, 1.47)0.93 (0.80, 1.08)1.30 (1.03, 1.62)0.78 (0.49, 1.24)0.95 (0.84, 1.08)0.93 (0.86, 1.00)0.95 (0.81, 1.13)1.04 (0.77, 1.42)0.70 (0.46, 1.08)0.96 (0.90, 1.03)0.90 (0.82, 1.00)0.82 (0.72, 0.93)1.01 (0.74, 1.37)0.86 (0.77, 0.96)0.87 (0.65, 1.19)1.25 (0.91, 1.71)0.97 (0.74, 1.26)1.05 (0.84, 1.31)0.69 (0.56, 0.84)1.02 (0.66, 1.59)0.86 (0.78, 0.95)0.93 (0.90, 0.97)
1.05 (1.00, 1.11)1.13 (1.10, 1.16)1.05 (1.03, 1.07)1.13 (1.00, 1.29)1.05 (1.00, 1.11)1.42 (0.98, 2.07)1.16 (1.09, 1.25)1.19 (1.07, 1.33)1.28 (1.16, 1.40)1.11 (0.90, 1.37)1.12 (1.03, 1.21)1.06 (0.96, 1.17)1.05 (0.94, 1.18)1.06 (0.98, 1.16)1.12 (1.03, 1.22)1.09 (1.06, 1.12)0.93 (0.73, 1.19)1.10 (0.95, 1.34)1.13 (0.96, 1.33)1.09 (1.06, 1.12)1.40 (1.28, 1.61)1.16 (1.05, 1.28)1.18 (1.15, 1.22)1.14 (0.98, 1.32)1.71 (1.26, 2.34)1.12 (1.07, 1.18)0.94 (0.74, 1.19)1.09 (1.03, 1.14)1.56 (1.21, 2.01)1.23 (1.03, 1.47)0.90 (0.63, 1.28)1.12 (0.99, 1.26)1.13 (1.02, 1.26)0.95 (0.61, 1.47)0.90 (0.68, 1.18)1.12 (1.09, 1.15)
kg/m2 RR (95% CI)
per 5
8.6810.904.373.184.342.520.715.367.963.841.490.828.656.605.251.496.041.531.411.962.552.910.786.66100.00
4.855.866.152.175.030.374.122.703.121.063.643.012.693.543.505.800.811.471.605.742.503.065.641.820.534.900.854.790.781.360.422.412.760.280.65100.00
Weight%
1.45 1 2.2
Premenopausal breast cancer
Per 5 kg/m2
SRR: 0.93 (95% CI: 0.90-0.97)
Postmenopausal breast cancer
SRR: 1.12 (95% CI: 1.09-1.15)
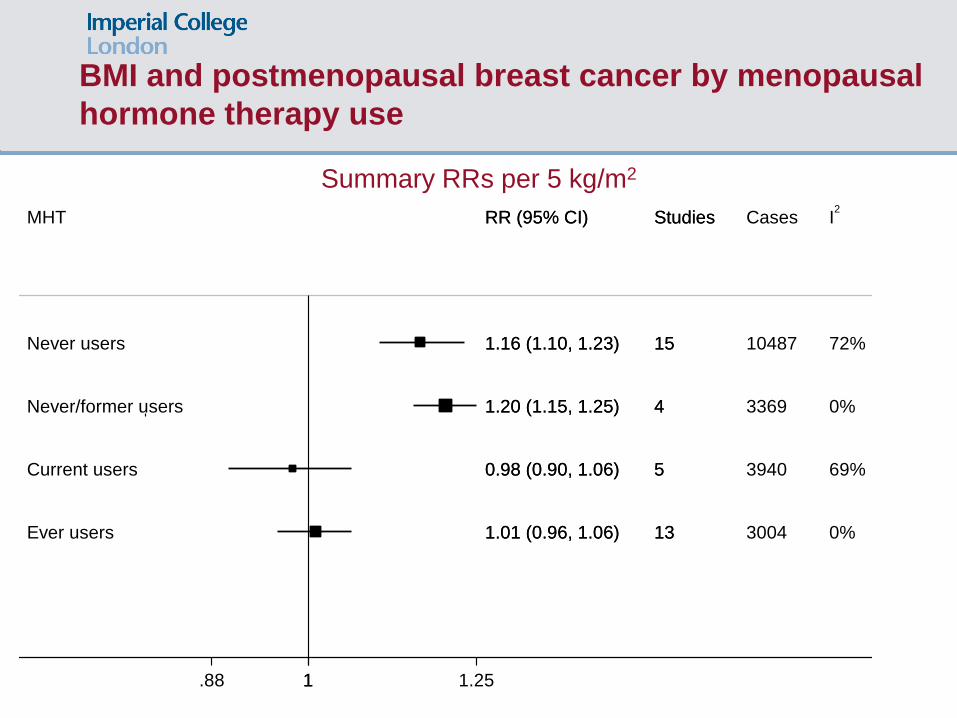
Summary RRs per 5 kg/m2
BMI and postmenopausal breast cancer by menopausal
hormone therapy use
Never users
Never/former users
Current users
Ever users
MHT
1.16 (1.10, 1.23)
1.20 (1.15, 1.25)
0.98 (0.90, 1.06)
1.01 (0.96, 1.06)
RR (95% CI)
15
4
5
13
Studies
10487
3369
3940
3004
Cases
72%
0%
69%
0%
I2
1.16 (1.10, 1.23)
1.20 (1.15, 1.25)
0.98 (0.90, 1.06)
1.01 (0.96, 1.06)
RR (95% CI)
15
4
5
13
Studies
1.88 1 1.25
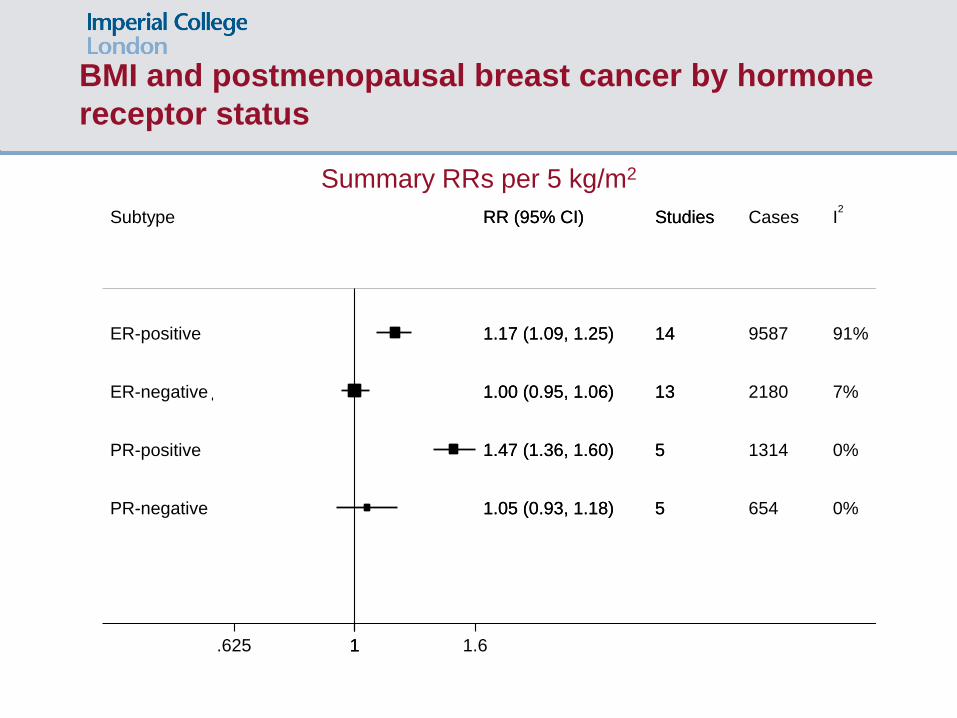
Summary RRs per 5 kg/m2
BMI and postmenopausal breast cancer by hormone
receptor status
ER-positive
ER-negative
PR-positive
PR-negative
Subtype
1.17 (1.09, 1.25)
1.00 (0.95, 1.06)
1.47 (1.36, 1.60)
1.05 (0.93, 1.18)
RR (95% CI)
14
13
5
5
Studies
9587
2180
1314
654
Cases
91%
7%
0%
0%
I2
1.17 (1.09, 1.25)
1.00 (0.95, 1.06)
1.47 (1.36, 1.60)
1.05 (0.93, 1.18)
RR (95% CI)
14
13
5
5
Studies
1.625 1 1.6
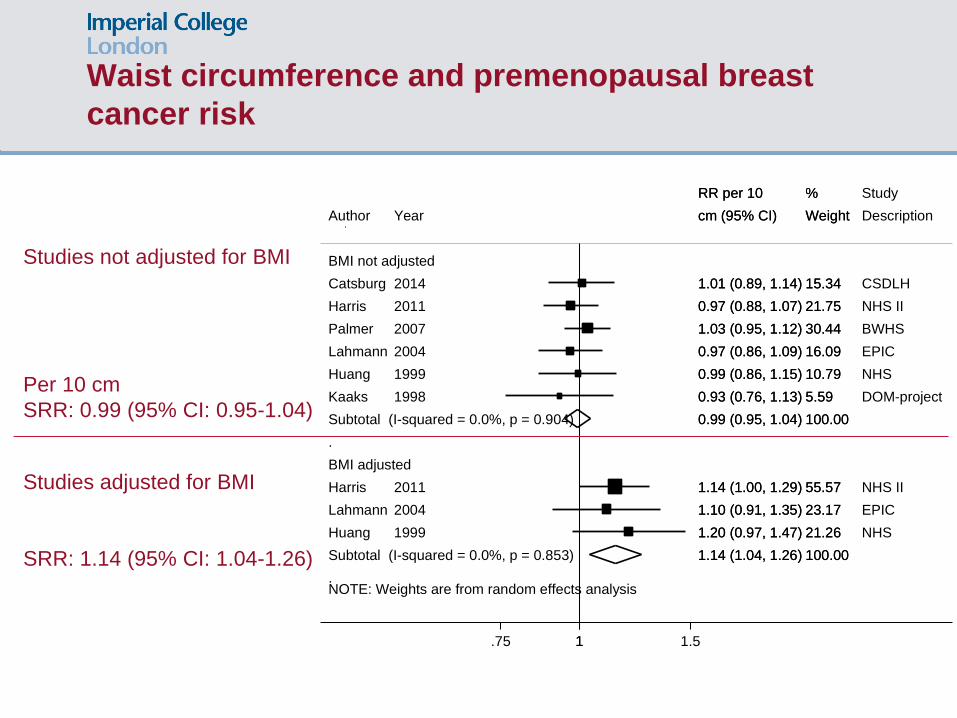
Waist circumference and premenopausal breast
cancer risk
Studies not adjusted for BMI
Per 10 cm
SRR: 0.99 (95% CI: 0.95-1.04)
Studies adjusted for BMI
SRR: 1.14 (95% CI: 1.04-1.26)
NOTE: Weights are from random effects analysis
.
.
BMI not adjusted
Catsburg
Harris
Palmer
Lahmann
Huang
Kaaks
Subtotal (I-squared = 0.0%, p = 0.904)
BMI adjusted
Harris
Lahmann
Huang
Subtotal (I-squared = 0.0%, p = 0.853)
Author
2014
2011
2007
2004
1999
1998
2011
2004
1999
Year
1.01 (0.89, 1.14)
0.97 (0.88, 1.07)
1.03 (0.95, 1.12)
0.97 (0.86, 1.09)
0.99 (0.86, 1.15)
0.93 (0.76, 1.13)
0.99 (0.95, 1.04)
1.14 (1.00, 1.29)
1.10 (0.91, 1.35)
1.20 (0.97, 1.47)
1.14 (1.04, 1.26)
cm (95% CI)
RR per 10
15.34
21.75
30.44
16.09
10.79
5.59
100.00
55.57
23.17
21.26
100.00
Weight
%
CSDLH
NHS II
BWHS
EPIC
NHS
DOM-project
NHS II
EPIC
NHS
Description
Study
1.01 (0.89, 1.14)
0.97 (0.88, 1.07)
1.03 (0.95, 1.12)
0.97 (0.86, 1.09)
0.99 (0.86, 1.15)
0.93 (0.76, 1.13)
0.99 (0.95, 1.04)
1.14 (1.00, 1.29)
1.10 (0.91, 1.35)
1.20 (0.97, 1.47)
1.14 (1.04, 1.26)
cm (95% CI)
RR per 10
15.34
21.75
30.44
16.09
10.79
5.59
100.00
55.57
23.17
21.26
100.00
Weight
%
1.75 1 1.5
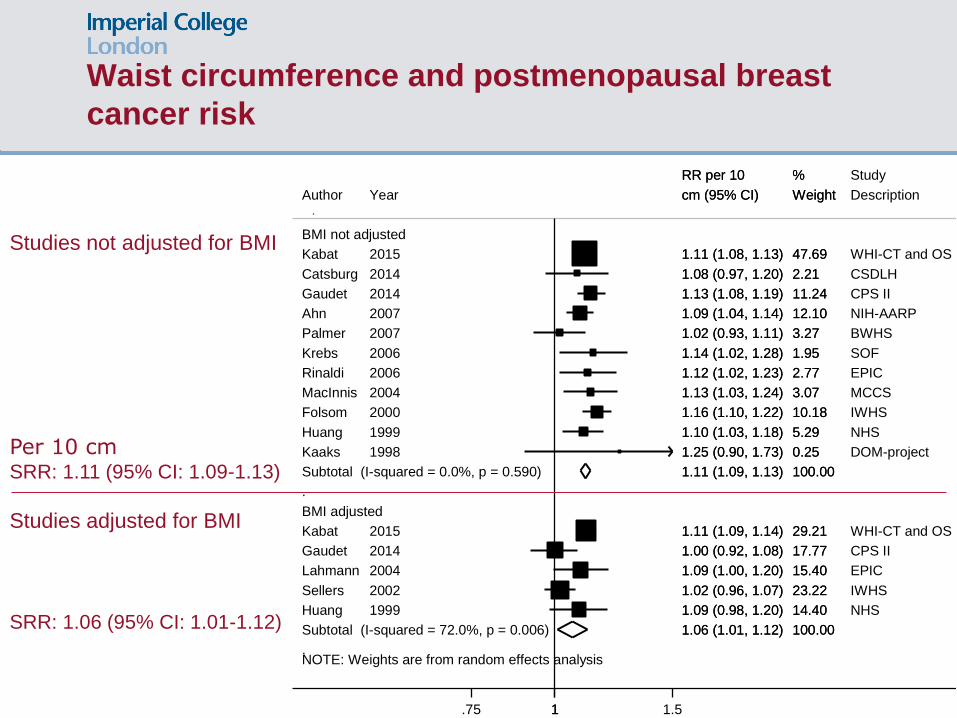
Waist circumference and postmenopausal breast
cancer risk
Studies not adjusted for BMI
Per 10 cm SRR: 1.11 (95% CI: 1.09-1.13)
Studies adjusted for BMI
SRR: 1.06 (95% CI: 1.01-1.12)
NOTE: Weights are from random effects analysis
.
.
BMI not adjusted
Kabat
Catsburg
Gaudet
Ahn
Palmer
Krebs
Rinaldi
MacInnis
Folsom
Huang
Kaaks
Subtotal (I-squared = 0.0%, p = 0.590)
BMI adjusted
Kabat
Gaudet
Lahmann
Sellers
Huang
Subtotal (I-squared = 72.0%, p = 0.006)
Author
2015
2014
2014
2007
2007
2006
2006
2004
2000
1999
1998
2015
2014
2004
2002
1999
Year
1.11 (1.08, 1.13)
1.08 (0.97, 1.20)
1.13 (1.08, 1.19)
1.09 (1.04, 1.14)
1.02 (0.93, 1.11)
1.14 (1.02, 1.28)
1.12 (1.02, 1.23)
1.13 (1.03, 1.24)
1.16 (1.10, 1.22)
1.10 (1.03, 1.18)
1.25 (0.90, 1.73)
1.11 (1.09, 1.13)
1.11 (1.09, 1.14)
1.00 (0.92, 1.08)
1.09 (1.00, 1.20)
1.02 (0.96, 1.07)
1.09 (0.98, 1.20)
1.06 (1.01, 1.12)
cm (95% CI)
RR per 10
47.69
2.21
11.24
12.10
3.27
1.95
2.77
3.07
10.18
5.29
0.25
100.00
29.21
17.77
15.40
23.22
14.40
100.00
Weight
%
WHI-CT and OS
CSDLH
CPS II
NIH-AARP
BWHS
SOF
EPIC
MCCS
IWHS
NHS
DOM-project
WHI-CT and OS
CPS II
EPIC
IWHS
NHS
Description
Study
1.11 (1.08, 1.13)
1.08 (0.97, 1.20)
1.13 (1.08, 1.19)
1.09 (1.04, 1.14)
1.02 (0.93, 1.11)
1.14 (1.02, 1.28)
1.12 (1.02, 1.23)
1.13 (1.03, 1.24)
1.16 (1.10, 1.22)
1.10 (1.03, 1.18)
1.25 (0.90, 1.73)
1.11 (1.09, 1.13)
1.11 (1.09, 1.14)
1.00 (0.92, 1.08)
1.09 (1.00, 1.20)
1.02 (0.96, 1.07)
1.09 (0.98, 1.20)
1.06 (1.01, 1.12)
cm (95% CI)
RR per 10
47.69
2.21
11.24
12.10
3.27
1.95
2.77
3.07
10.18
5.29
0.25
100.00
29.21
17.77
15.40
23.22
14.40
100.00
Weight
%
1.75 1 1.5
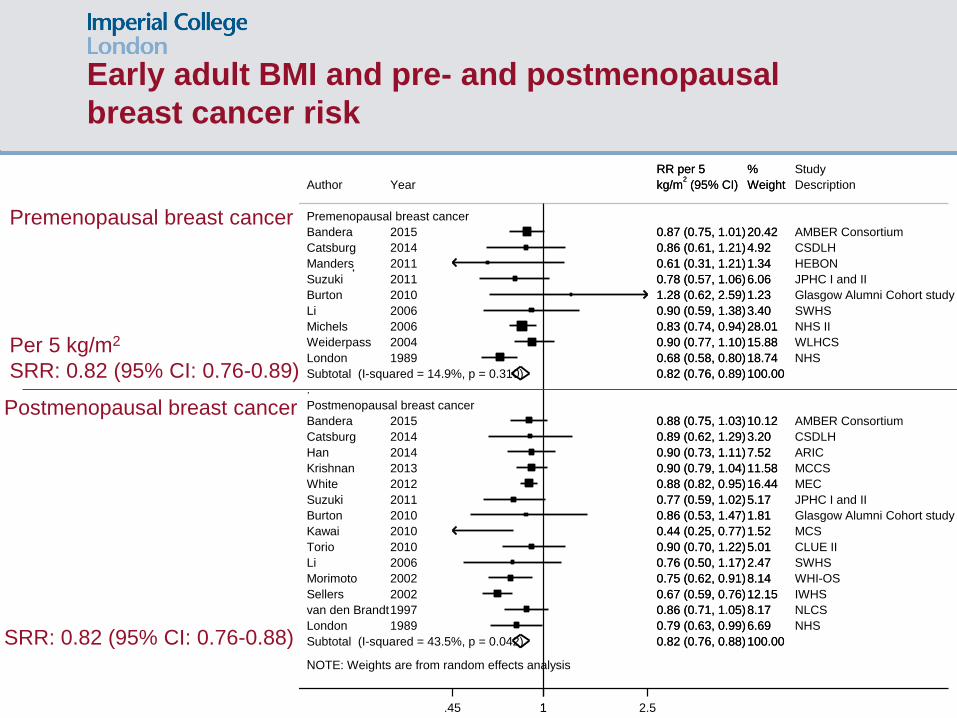
Early adult BMI and pre- and postmenopausal
breast cancer risk
NOTE: Weights are from random effects analysis
.
.
Premenopausal breast cancer
Bandera
Catsburg
Manders
Suzuki
Burton
Li
Michels
Weiderpass
London
Subtotal (I-squared = 14.9%, p = 0.310)
Postmenopausal breast cancer
Bandera
Catsburg
Han
Krishnan
White
Suzuki
Burton
Kawai
Torio
Li
Morimoto
Sellers
van den Brandt
London
Subtotal (I-squared = 43.5%, p = 0.042)
Author
2015
2014
2011
2011
2010
2006
2006
2004
1989
2015
2014
2014
2013
2012
2011
2010
2010
2010
2006
2002
2002
1997
1989
Year
0.87 (0.75, 1.01)
0.86 (0.61, 1.21)
0.61 (0.31, 1.21)
0.78 (0.57, 1.06)
1.28 (0.62, 2.59)
0.90 (0.59, 1.38)
0.83 (0.74, 0.94)
0.90 (0.77, 1.10)
0.68 (0.58, 0.80)
0.82 (0.76, 0.89)
0.88 (0.75, 1.03)
0.89 (0.62, 1.29)
0.90 (0.73, 1.11)
0.90 (0.79, 1.04)
0.88 (0.82, 0.95)
0.77 (0.59, 1.02)
0.86 (0.53, 1.47)
0.44 (0.25, 0.77)
0.90 (0.70, 1.22)
0.76 (0.50, 1.17)
0.75 (0.62, 0.91)
0.67 (0.59, 0.76)
0.86 (0.71, 1.05)
0.79 (0.63, 0.99)
0.82 (0.76, 0.88)
kg/m2 (95% CI)
RR per 5
20.42
4.92
1.34
6.06
1.23
3.40
28.01
15.88
18.74
100.00
10.12
3.20
7.52
11.58
16.44
5.17
1.81
1.52
5.01
2.47
8.14
12.15
8.17
6.69
100.00
Weight
%
AMBER Consortium
CSDLH
HEBON
JPHC I and II
Glasgow Alumni Cohort study
SWHS
NHS II
WLHCS
NHS
AMBER Consortium
CSDLH
ARIC
MCCS
MEC
JPHC I and II
Glasgow Alumni Cohort study
MCS
CLUE II
SWHS
WHI-OS
IWHS
NLCS
NHS
Description
Study
0.87 (0.75, 1.01)
0.86 (0.61, 1.21)
0.61 (0.31, 1.21)
0.78 (0.57, 1.06)
1.28 (0.62, 2.59)
0.90 (0.59, 1.38)
0.83 (0.74, 0.94)
0.90 (0.77, 1.10)
0.68 (0.58, 0.80)
0.82 (0.76, 0.89)
0.88 (0.75, 1.03)
0.89 (0.62, 1.29)
0.90 (0.73, 1.11)
0.90 (0.79, 1.04)
0.88 (0.82, 0.95)
0.77 (0.59, 1.02)
0.86 (0.53, 1.47)
0.44 (0.25, 0.77)
0.90 (0.70, 1.22)
0.76 (0.50, 1.17)
0.75 (0.62, 0.91)
0.67 (0.59, 0.76)
0.86 (0.71, 1.05)
0.79 (0.63, 0.99)
0.82 (0.76, 0.88)
kg/m2 (95% CI)
RR per 5
20.42
4.92
1.34
6.06
1.23
3.40
28.01
15.88
18.74
100.00
10.12
3.20
7.52
11.58
16.44
5.17
1.81
1.52
5.01
2.47
8.14
12.15
8.17
6.69
100.00
Weight
%
1.45 1 2.5
Premenopausal breast cancer
Per 5 kg/m2
SRR: 0.82 (95% CI: 0.76-0.89)
Postmenopausal breast cancer
SRR: 0.82 (95% CI: 0.76-0.88)
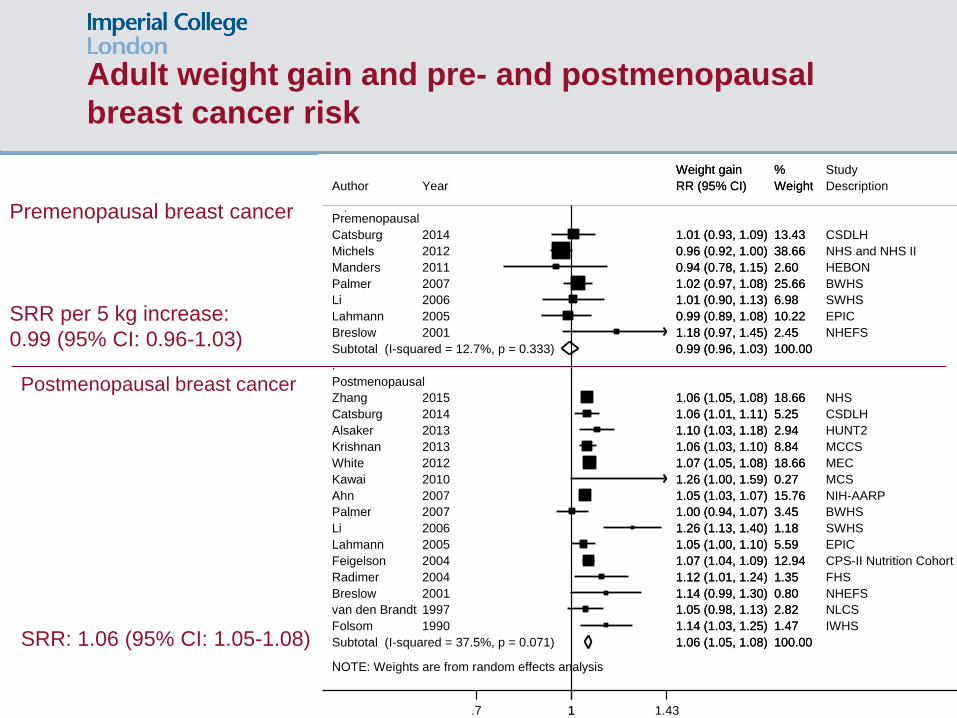
Adult weight gain and pre- and postmenopausal
breast cancer risk
Premenopausal breast cancer
SRR per 5 kg increase:
0.99 (95% CI: 0.96-1.03)
Postmenopausal breast cancer
SRR: 1.06 (95% CI: 1.05-1.08)
NOTE: Weights are from random effects analysis
.
.
Premenopausal
Catsburg
Michels
Manders
Palmer
Li
Lahmann
Breslow
Subtotal (I-squared = 12.7%, p = 0.333)
Postmenopausal
Zhang
Catsburg
Alsaker
Krishnan
White
Kawai
Ahn
Palmer
Li
Lahmann
Feigelson
Radimer
Breslow
van den Brandt
Folsom
Subtotal (I-squared = 37.5%, p = 0.071)
Author
2014
2012
2011
2007
2006
2005
2001
2015
2014
2013
2013
2012
2010
2007
2007
2006
2005
2004
2004
2001
1997
1990
Year
1.01 (0.93, 1.09)
0.96 (0.92, 1.00)
0.94 (0.78, 1.15)
1.02 (0.97, 1.08)
1.01 (0.90, 1.13)
0.99 (0.89, 1.08)
1.18 (0.97, 1.45)
0.99 (0.96, 1.03)
1.06 (1.05, 1.08)
1.06 (1.01, 1.11)
1.10 (1.03, 1.18)
1.06 (1.03, 1.10)
1.07 (1.05, 1.08)
1.26 (1.00, 1.59)
1.05 (1.03, 1.07)
1.00 (0.94, 1.07)
1.26 (1.13, 1.40)
1.05 (1.00, 1.10)
1.07 (1.04, 1.09)
1.12 (1.01, 1.24)
1.14 (0.99, 1.30)
1.05 (0.98, 1.13)
1.14 (1.03, 1.25)
1.06 (1.05, 1.08)
RR (95% CI)
Weight gain
13.43
38.66
2.60
25.66
6.98
10.22
2.45
100.00
18.66
5.25
2.94
8.84
18.66
0.27
15.76
3.45
1.18
5.59
12.94
1.35
0.80
2.82
1.47
100.00
Weight
%
CSDLH
NHS and NHS II
HEBON
BWHS
SWHS
EPIC
NHEFS
NHS
CSDLH
HUNT2
MCCS
MEC
MCS
NIH-AARP
BWHS
SWHS
EPIC
CPS-II Nutrition Cohort
FHS
NHEFS
NLCS
IWHS
Description
Study
1.01 (0.93, 1.09)
0.96 (0.92, 1.00)
0.94 (0.78, 1.15)
1.02 (0.97, 1.08)
1.01 (0.90, 1.13)
0.99 (0.89, 1.08)
1.18 (0.97, 1.45)
0.99 (0.96, 1.03)
1.06 (1.05, 1.08)
1.06 (1.01, 1.11)
1.10 (1.03, 1.18)
1.06 (1.03, 1.10)
1.07 (1.05, 1.08)
1.26 (1.00, 1.59)
1.05 (1.03, 1.07)
1.00 (0.94, 1.07)
1.26 (1.13, 1.40)
1.05 (1.00, 1.10)
1.07 (1.04, 1.09)
1.12 (1.01, 1.24)
1.14 (0.99, 1.30)
1.05 (0.98, 1.13)
1.14 (1.03, 1.25)
1.06 (1.05, 1.08)
RR (95% CI)
Weight gain
13.43
38.66
2.60
25.66
6.98
10.22
2.45
100.00
18.66
5.25
2.94
8.84
18.66
0.27
15.76
3.45
1.18
5.59
12.94
1.35
0.80
2.82
1.47
100.00
Weight
%
1.7 1 1.43
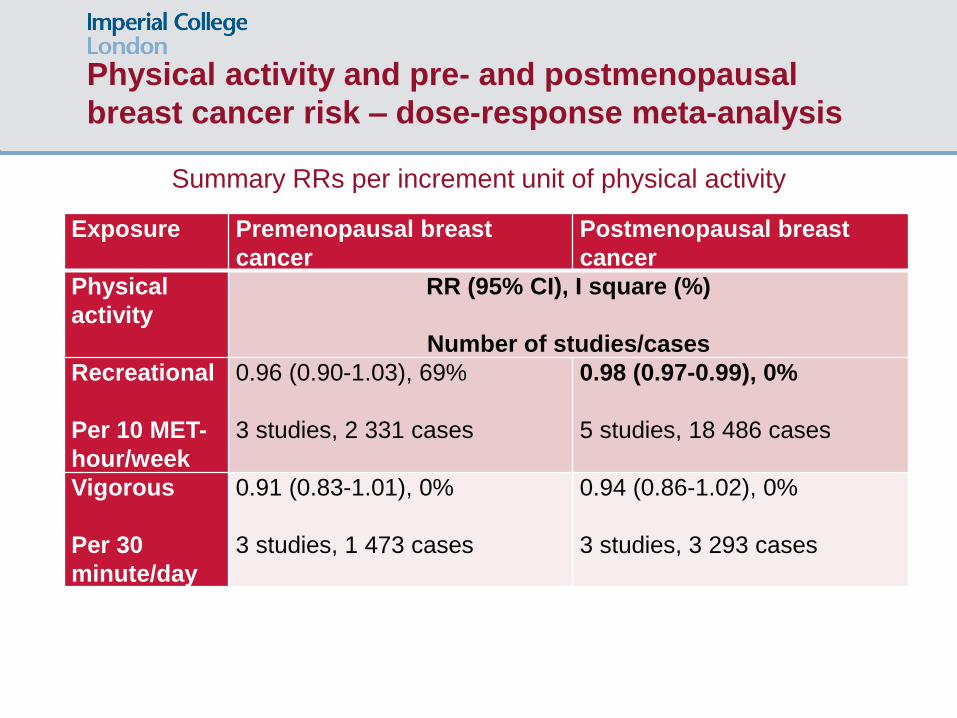
Physical activity and pre- and postmenopausal
breast cancer risk – dose-response meta-analysis
Exposure Premenopausal breast
cancer
Postmenopausal breast
cancer
Physical
activity
RR (95% CI), I square (%)
Number of studies/cases
Recreational
Per 10 MET-
hour/week
0.96 (0.90-1.03), 69%
3 studies, 2 331 cases
0.98 (0.97-0.99), 0%
5 studies, 18 486 cases
Vigorous
Per 30
minute/day
0.91 (0.83-1.01), 0%
3 studies, 1 473 cases
0.94 (0.86-1.02), 0%
3 studies, 3 293 cases
Summary RRs per increment unit of physical activity
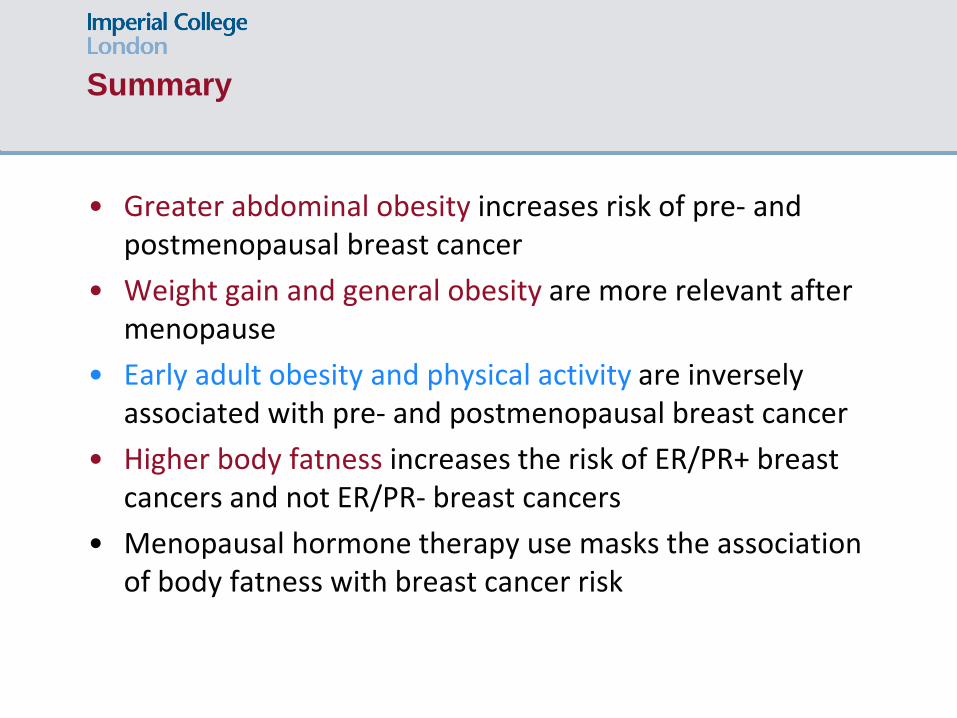
Summary
• Greater abdominal obesity increases risk of pre- and postmenopausal breast cancer
• Weight gain and general obesity are more relevant after menopause
• Early adult obesity and physical activity are inversely associated with pre- and postmenopausal breast cancer
• Higher body fatness increases the risk of ER/PR+ breast cancers and not ER/PR- breast cancers
• Menopausal hormone therapy use masks the association of body fatness with breast cancer risk
Epidemiologic evidence – energy balance-related factors and
pre- and postmenopausal breast cancer risk
Thank you
Acknowledgements WCRF International
CUP Principal Investigator:
Dr Teresa Norat
CUP teammates (past and present):
Leila Abar, Dagfinn Aune, Rosa Lau
Elli Polemiti, Deborah Navarro Rosenblatt,
Christophe Stevens, Ana Rita Vieire, Rui Vieira
Snieguole Vingeliene
http://www.wcrf.org/int/research-we-fund/continuous-update-project-cup