Embed Size (px)
Citation preview
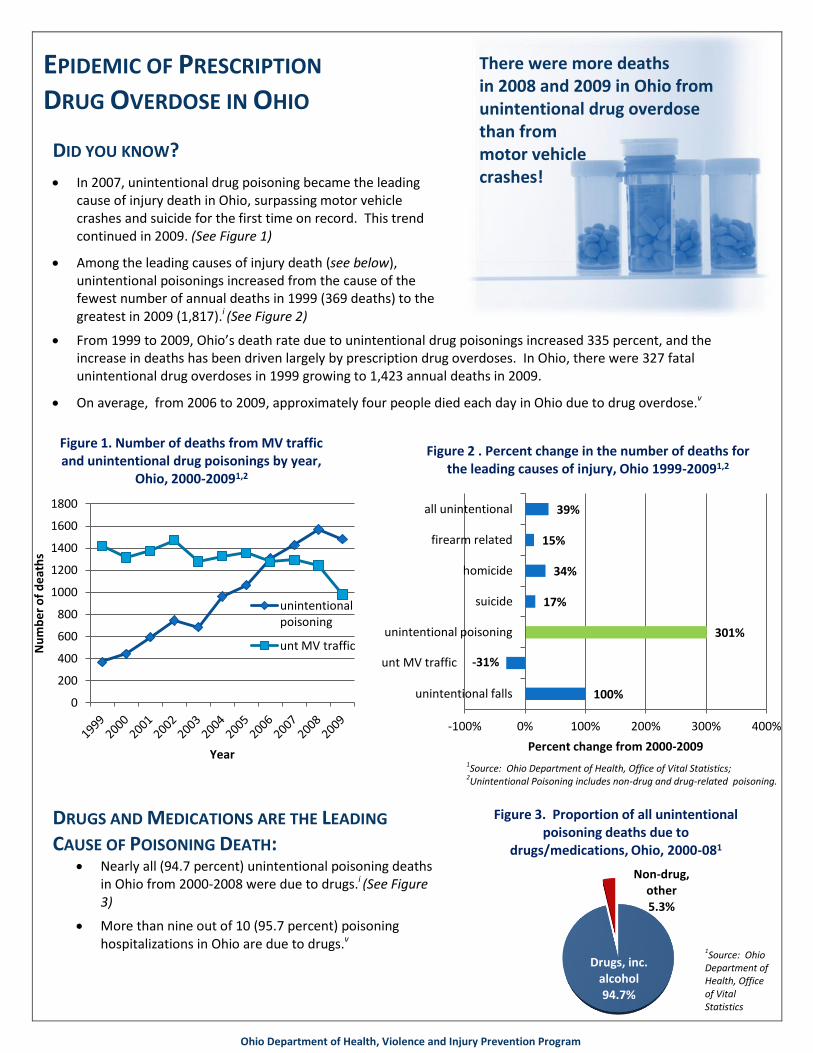
Drugs, inc. alcohol 94.7%
Non-drug, other 5.3%
Figure 3. Proportion of all unintentional poisoning deaths due to
drugs/medications, Ohio, 2000-081
DID YOU KNOW?
In 2007, unintentional drug poisoning became the leading cause of injury death in Ohio, surpassing motor vehicle crashes and suicide for the first time on record. This trend continued in 2009. (See Figure 1)
Among the leading causes of injury death (see below), unintentional poisonings increased from the cause of the fewest number of annual deaths in 1999 (369 deaths) to the greatest in 2009 (1,817).i (See Figure 2)
From 1999 to 2009, Ohio’s death rate due to unintentional drug poisonings increased 335 percent, and the increase in deaths has been driven largely by prescription drug overdoses. In Ohio, there were 327 fatal unintentional drug overdoses in 1999 growing to 1,423 annual deaths in 2009.
On average, from 2006 to 2009, approximately four people died each day in Ohio due to drug overdose.v
DRUGS AND MEDICATIONS ARE THE LEADING
CAUSE OF POISONING DEATH:
Nearly all (94.7 percent) unintentional poisoning deaths in Ohio from 2000-2008 were due to drugs.i (See Figure 3)
More than nine out of 10 (95.7 percent) poisoning hospitalizations in Ohio are due to drugs.v
There were more deaths in 2008 and 2009 in Ohio from unintentional drug overdose than from motor vehicle crashes!
EPIDEMIC OF PRESCRIPTION DRUG OVERDOSE IN OHIO
1Source: Ohio Department of Health, Office of Vital Statistics
Ohio Department of Health, Violence and Injury Prevention Program
0
200
400
600
800
1000
1200
1400
1600
1800
Nu
mb
er
of
de
ath
s
Year
Figure 1. Number of deaths from MV traffic and unintentional drug poisonings by year,
Ohio, 2000-20091,2
unintentional poisoning
unt MV traffic
100%
-31%
301%
17%
34%
15%
39%
-100% 0% 100% 200% 300% 400%
unintentional falls
unintentional poisoning
suicide
homicide
firearm related
all unintentional
Percent change from 2000-2009
Figure 2 . Percent change in the number of deaths for the leading causes of injury, Ohio 1999-20091,2
1Source: Ohio Department of Health, Office of Vital Statistics; 2Unintentional Poisoning includes non-drug and drug-related poisoning.
unt MV traffic

ROLE OF PRESCRIPTION PAIN MEDICATIONS:
Prescription opioids (pain medications) are associated with more overdoses than any other prescription or illegal drug including cocaine and heroin.
Opioids are largely responsible for this alarming increase in drug poisoning death rates.ii,iii
Opioids were involved in at least 37 percent of all drug poisoning deaths in the Ohio in 2008 (See Figure 4).i
The opioids most associated with overdose are methadone, oxycodone (e.g., OxyContin), hydrocodone (e.g., Vicodin) and fentanyl.
Opioids with a long half life (e.g., methadone stays in the body 8 to 60 hours but only relieves pain for 4 to 8 hours) and/or a controlled-release mechanism (e.g., OxyContin, Duragesic <fentanyl transdermal>, Opana ER) have been especially associated with fatal overdoses.
Prescription opioids were involved in more unintentional overdoses (40 percent) than heroin and cocaine combined (33 percent) in Ohio in 2008.
There is a strong relationship between increases in sales of prescription opioids and fatal unintentional drug poisoning rates.
From 1999 to 2007 in Ohio, there were increases of 304 percent and 325 percent, respectively in the unintentional drug poisoning death rate and total grams of prescription opioids distributed per 100,000 population. (See Figure 5)
0%
1%
10%
12%
16%
17%
32%
75%
37%
barbiturates
hallucinogens
benzodiazepines
alcohol
heroin
cocaine
other unspecified only*
other unspec multiple substances**
prescription opioids***
Figure 4. Proportion of all unintentional drug poisoning deaths involving selected drugs, Ohio, 20081
1Source: Ohio Department of Health, Office of Vital Statistics
* ”other/unspecified” includes only cases where no specific drug is identified; includes multiple drug involvement
** includes all instances where “other/unspecified' is listed amongst contributing causes of death
***Prescription opioids include methadone, other opioids, other synthetic narcotics and other/unspecified narcotics.
-
2
4
6
8
10
12
14
0
10,000
20,000
30,000
40,000
50,000
60,000
70,000
80,000
1997 1998 1999 2000 2001 2002 2003 2004 2005 2006 2007
Dea
th r
ate
per
10
0,0
00
po
pu
lati
on
op
ioid
an
alge
sic
gram
s d
istr
ibu
ted
p
er 1
00
,00
0 p
op
ula
tio
n
Year
Figure 5. Unintentional fatal drug poisoning rates1 and distribution rates of prescription opioids2,3 in grams per 100,000 population4
by year, Ohio, 1997 -20075
opioid analgesics distributed
Unintentional drug poisoning death rates
Ohio Department of Health, Violence and Injury Prevention Program

Sources: 1Ohio Vital Statistics; 2DEA, ARCOS Reports, Retail Drug Summary Reports by State, Cumulative Distribution Reports (Report 4) Ohio, 1997-2007 http://www.deadiversion.usdoj.gov/arcos/retail_drug_summary/index.html3Calculation of oral morphine equivalents used the following assumptions: (1) All drugs other than fentanyl are taken orally; fentanyl is applied transdermally. 2) These doses are approximately equianalgesic: morphine: 30 mg; codeine 200 mg; oxycodone and hydrocodone: 30 mg; hydromorphone; 7.5 mg; methadone: 4 mg; fentanyl: 0.4 mg; meperidine: 300 mg ; 4US Census Bureau, Ohio population estimates 1997-2007. 5preliminary data for 2007
MULTIPLE DRUG USE:
Use of multiple drugs, especially multiple depressants, is a risk factor for unintentional overdose.
Most “other/unspecified” drug deaths are associated with multiple drug use.
In 2008, at least 75 percent of all unintentional drug poisoning deaths involved multiple drugs (See Figure 4).
ROLE OF OTHER DRUGS AND RISK FACTORS:
Ten percent of the unintentional drug poisoning deaths in 2008 in Ohio involved benzodiazepines (sedative/anti-anxiety) and twelve percent involved alcohol. Only one percent involved hallucinogens and less than one percent involved barbiturates (Figure 4).
About the same proportion of drug poisoning deaths involved cocaine (17 percent), including crack cocaine, and heroin (16 percent) in 2008.
At this point, nearly all substances including anti-depressants, cardiovascular drugs, antihistamines, muscle relaxants and anticonvulsants have been involved in fatal overdoses.
WHO IS AFFECTED?
Death rates from unintentional drug/medication-related poisoning are highest for Ohioans ages 45-54, with rates for males 1.5 times greater than the rates for females.i (See Figure 6)
White males have the highest death rates from unintentional opioid poisoning; however, females represent the fastest growing group at risk.i
In 2007, 26.5 percent of high school students reported using a prescription drug without a doctor’s prescription one or more times during their life.vi
CONTRIBUTING FACTORS AND CURRENT TRENDS:
According to the Institute for Safe Medication Practices, half of the prescriptions taken each year in the United States are used improperly. In addition, changing medical and advertising practices have contributed to widespread use of prescription drugs across all levels of the population. Many of these prescription drugs may be misused or abused.
Societal and medical trends that lead to this problem include changes in clinical prescribing practices for pain medication, changes in marketing of medications directly to consumers, overmedication and mixing medications, substance abuse, widespread diversion of medications, deception of providers including doctor shopping and prescription fraud, illegal online “pharmacies,” unscrupulous providers (e.g., “pill mills”), medication errors and improper storage and disposal of excess medications.vii, viii
0
5
10
15
20
25
30
35
40
0-14 15-24 25-34 35-44 45-54 55-64 65-74 75+
Rat
e p
er
10
0,0
00
Age Group
Figure 6. Average annual unintentional drug/medication poisoning rate1 by sex, age
group, Ohio 2006-2008*
Females Males
*Source: ODH: Office of Vital Statistics
Ohio Department of Health, Violence and Injury Prevention Program

DOCTOR SHOPPING AND DIVERSION:
Sixteen percent of 2008 unintentional poisoning decedents had a history doctor shopping (filled prescriptions from at least 5 different prescribers per year). More than one-quarter of female decedents age 25-44 exhibited doctor shopping behavior. (See Figure 7)
Among 2008 drug poisoning decedents with a prescription opioid listed on their death certificate, 25 percent obtained the opioid through diversion (no record of filling a prescription for opioid in Ohio within two years prior to death). (See Figure 8)
0
5
10
15
20
25
30
35
40
15-24 25-34 35-44 45-54 55-64
Per
cen
t o
f D
eced
ents
Age (years)
Figure 7. Percent of 2008 unintentional poisoning decedents who doctor shopped between 2006-2008 by
age and gender 1-6
Males (n=606) Females (n=441)
1Average 5 prescribers per year from 1/1/06 to 12/31/08. 2No doctor shoppers over age 65 for males or females 3Prescriptions filled outside of Ohio not included 4Included decedents with at least one script filled in OARRS 1/1/06-12/31/08 Sources: 5Ohio Vital Statistics; 6Ohio Automated Rx Reporting System database, Ohio State Board of Pharmacy, Columbus, Ohio (August 12, 2009).
0
10
20
30
40
50
60
70
15-24 25-34 35-44 45-54 55-64 65+
Per
cen
t o
f D
eced
ents
Age (years)
Figure 8. Percent of 2008 unintentional poisoning decedents with prescription opioid on death certificate
and no opioid prescription filled from 2006 to 2008 by age and gender1-4
Males (n=334) Females (n=174)
1Analysis confined to decedents 15 years and older 2Prescriptions filled outside of Ohio not included Sources: 5Ohio Vital Statistics; 6Ohio Automated Rx Reporting System database, Ohio State Board of Pharmacy, Columbus, Ohio (August 12, 2009).
Ohio Department of Health, Violence and Injury Prevention Program
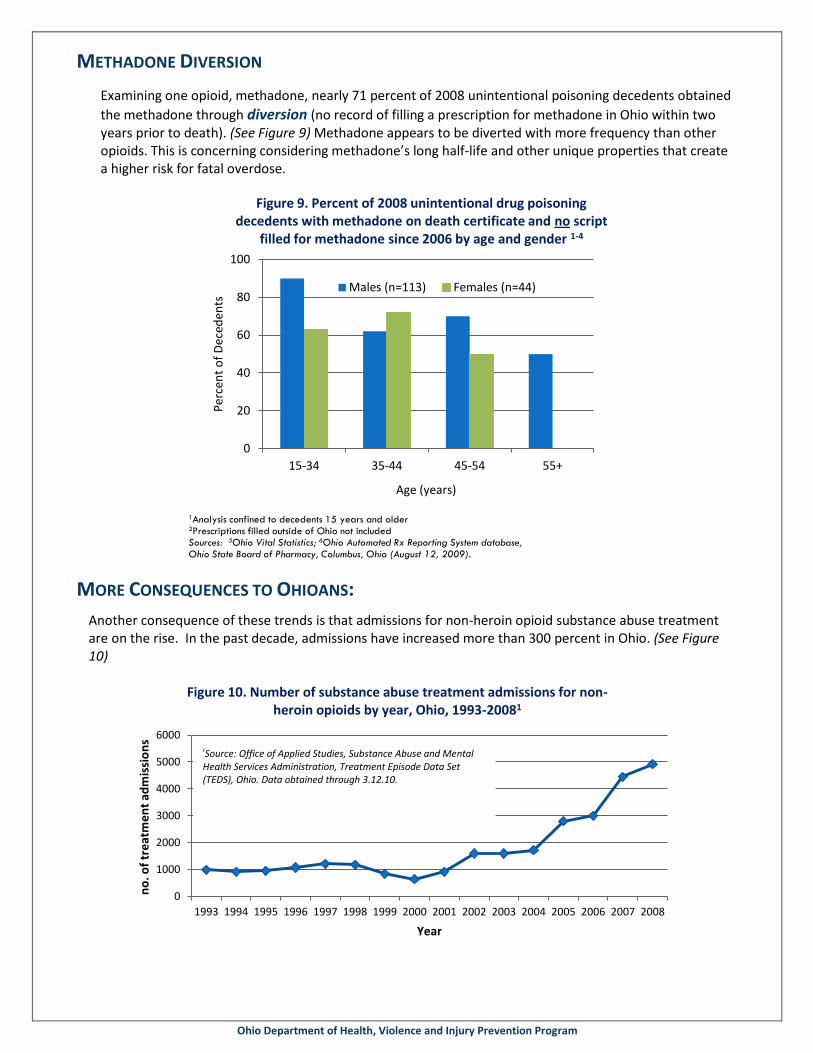
METHADONE DIVERSION
Examining one opioid, methadone, nearly 71 percent of 2008 unintentional poisoning decedents obtained
the methadone through diversion (no record of filling a prescription for methadone in Ohio within two years prior to death). (See Figure 9) Methadone appears to be diverted with more frequency than other opioids. This is concerning considering methadone’s long half-life and other unique properties that create a higher risk for fatal overdose.
MORE CONSEQUENCES TO OHIOANS:
Another consequence of these trends is that admissions for non-heroin opioid substance abuse treatment are on the rise. In the past decade, admissions have increased more than 300 percent in Ohio. (See Figure 10)
0
20
40
60
80
100
15-34 35-44 45-54 55+
Per
cen
t o
f D
eced
ents
Age (years)
Figure 9. Percent of 2008 unintentional drug poisoning decedents with methadone on death certificate and no script
filled for methadone since 2006 by age and gender 1-4
Males (n=113) Females (n=44)
1Analysis confined to decedents 15 years and older 2Prescriptions filled outside of Ohio not included Sources: 5Ohio Vital Statistics; 6Ohio Automated Rx Reporting System database, Ohio State Board of Pharmacy, Columbus, Ohio (August 12, 2009).
0
1000
2000
3000
4000
5000
6000
1993 1994 1995 1996 1997 1998 1999 2000 2001 2002 2003 2004 2005 2006 2007 2008
no
. of
tre
atm
en
t ad
mis
sio
ns
Year
Figure 10. Number of substance abuse treatment admissions for non-heroin opioids by year, Ohio, 1993-20081
Ohio Department of Health, Violence and Injury Prevention Program
1Source: Office of Applied Studies, Substance Abuse and Mental Health Services Administration, Treatment Episode Data Set (TEDS), Ohio. Data obtained through 3.12.10.

COSTS TO OHIOANS:
In addition to the tragic loss of human life, drug overdoses are associated with high direct and indirect
costs. Unintentional fatal poisonings cost Ohioans $3.5 billion on average each year; while non-fatal,
hospital-admitted poisonings cost an additional $31.9 million. These costs include medical, work loss and quality-of-life loss.
Estimated average annual costs of fatal and non-fatal,
hospital-admitted unintentional drug overdose in Ohio1
Type of Costs Fatal Costs2
Non-fatal, hospital
admitted costs3
Medical $4.9 million $19.1 million
Work loss $1.2 billion $5.2 million
Quality-of-Life loss $2.2 billion $7.6 million
Total $3.5 Billion $31.9 Million
1Source: Children's Safety Network Economics & Data Analysis Resource Center, at Pacific Institute for
Research and Evaluation, 2005; 2Year 2004 Dollars, Based on 2004-2007 average Ohio incidence
3Year 2005
Dollars, Based on Year 2003 Ohio incidence
WHAT CAN BE DONE TO ADDRESS THIS ISSUE?
AT THE LOCAL LEVEL…
Form a poisoning/overdose coalition to address the problem at the county or regional level.
o Members should include local leadership from health departments, coroners, health care professionals, alcohol and drug addiction treatment centers, law enforcement agencies, health professional associations, mental health agencies, hospitals, pharmacists, private citizens, businesses, media, and other interested and relevant organizations or agencies.
Work with local partners to implement social marketing campaigns to educate the public about prescription drug abuse and misuse.
Conduct education campaigns specifically for local populations particularly at risk.
Develop training programs for use in reaching adults in a variety of settings (e.g. places of employment, professional conferences/meetings, doctor’s offices, dentists’ offices, etc.)
Conduct proper prescription drug storage and disposal programs such as Drug Take Back programs.
Establish county Poison Death Review (PDR) committees to identify the circumstances surrounding drug poisoning/overdose deaths to provide insight into prevention.
Ohio Department of Health, Violence and Injury Prevention Program

AT THE STATE LEVEL…
Fund social marketing campaigns to educate the public about prescription drug abuse and misuse.
Identify and/or develop model education campaigns specifically for populations particularly at risk.
Develop training programs for use at the local level in reaching adults in a variety of settings (e.g. places of employment, professional conferences/meetings, doctor’s offices, dentists’ offices, etc.)
Provide support and information to local organizations and coalitions for conducting Drug Take Back programs.
Encourage health care and allied medical professional organizations and state boards to initiate education campaigns for their members regarding the problem of unintentional overdose deaths.
Develop a tool kit for use by health care providers to educate all patients being prescribed pain medication.
Adopt a Screening Brief Intervention Referral Treatment (SBIRT) protocol within health care and workplace settings to screen for misuse and/or abuse of prescribed medications.
Initiate efforts to increase the capacity for treatment for opioid addiction.
Promote collaborative efforts among law enforcement agencies to enforce prescription drug fraud statutes currently in effect in Ohio.
Promote the coordination of investigations of fraud committed by individuals or pain clinics among local law enforcement, state regulating agencies, and state and federal investigative agencies.
Improve linkage of data systems among state agencies (e.g. ODH, BOP, Medicaid/ODJFS, ODADAS, Ohio Department of Insurance, etc.)
Collaborate with other states on drug monitoring systems.
Provide funding for a statewide coroner reporting system.
Create a data action group to review current surveys and data collection methods and identify gaps in knowledge and develop specific questions to address these needs.
Explore the feasibility and potential benefits of legislation/regulations to: o Create licensing standards for pain management clinics. o Institute mandatory continuing education credits in pain management for health care
professionals for licensure renewal. o Require course work in substance use disorders, prevention and treatment in the college
curriculum for any medical professional or allied health care degree. o Require all physicians and other prescribers to register with and use the OARRS administered by
the Board of Pharmacy (BOP). o Implement E-prescribing in Ohio. o Allow for reimbursement of SBIRT interventions from Medicaid and insurance companies. o Ensure the development, adoption, and implementation of pain management guidelines in all
health care systems. o Create 911 Good Samaritan Immunity Laws that legalize the use of naloxone by lay persons and
protects them from prosecution. o Increase the use of “Drug Courts” as an alternative to incarceration for illegal use/abuse of
prescription drugs. o Require photo ID when picking up prescriptions for controlled substances.
Support these and other initiatives that are identified in the attached recommendations from the Poison Action Group (PAG)/New and Emerging Drug Trends Work Group (NEDTW). The PAG/NEDTW was convened by the Ohio Injury Prevention Partnership in conjunction with the Ohio Department of Alcohol and Drug Addiction Services and the Ohio Department of Health.
Ohio Department of Health, Violence and Injury Prevention Program

RESOURCES: Injury Prevention Program, Ohio Department of Health:
http://www.odh.ohio.gov/odhPrograms/hprr/injprev/OVIPP.aspx
National Poison Help: http://poisonhelp.hrsa.gov/index.htm
Food and Drug Administration, Center for Drug Evaluation and Research: http://www.fda.gov/cder/indes.html
Office of National Drug Control Policy, Proper Disposal of Medications Factsheet: http://whitehousedrugpolicy.gov/drugfact/factsht/proper_disposal.html
National Safety Council Poison Prevention Information: http://www.nsc.org/resources/issues/poison.aspx
Poison Prevention Week Council web site: http://www.poisonprevention.org/ Rx Use Only as Directed – Utah Department of Health: http://www.useonlyasdirected.org/
“A Guide to Safe Use of Pain Medicine”: http://www.fda.gov/consumer/updates/painmeds022309.html
Sources:
i. Ohio Department of Health, Office of Vital Statistics, Analysis by Injury Prevention Program
ii. Centers for Disease Control and Prevention, National Center for Health Statistics. Compressed Mortality File 1999-2005.
iii. Paulozzi, LJ, Budnitz, DS, Xi, Y. Increasing deaths from opioid analgesics in the United States. Pharmacoepidemiology and Drug Safety. 2006; 15:618-627.
iv. Dasgupta N, Jonsson, FM, Brownstein JS. Accidental opioid poisoning mortality, United States, 1999-2004.
v. Ohio Hospital Association. Hospital discharge data. (2002-2007)
vi. Ohio Department of Health. (2007). Tobacco-alcohol-drugs. 2007 Ohio Youth Risk Behavior Survey. http://www.odh.ohio.gov/odhPrograms/chss/ad_hlth/YouthRsk/youthrsk1.aspx
vii. Hall AJ, Logan JE, Toblin RL, et al. Patterns of abuse among unintentional pharmaceutical overdose fatalities. JAMA 2008;300(22):2613-20. http://jama.ama-assn.org/cgi/content/full/300/22/2613
viii. Food and Drug Administration. FDA Public Health Advisory, Methadone Use for Pain Control May Result in Death and Life-Threatening Changes in Breathing and Heart Beat. Bethesda, MD: Center for Drug Evaluation and Research; 2007 November 27. http://www.fda.gov/cder/drug/advisory/methadone.htm
ix. Sanford K. Findings and Recommendations of the Task Force to Prevent Deaths from Unintentional Drug Overdoses in North Carolina, 2003. In: N.C. Injury and Violence Prevention Branch - North Carolina Department of Health and Human Services, ed.: http://www.ncpublichealth.com;/>2004.
x. Centers for Disease Control and Prevention. Unintentional poisoning deaths--United States, 1999-2004. MMWR Morb Mortal Wkly Rep 2007;56(5):93-6. http://www.cdc.gov/mmwr/preview/mmwrhtml/mm5605a1.htm
xi. Food and Drug Administration. FDA Public Health Advisory, Important Information for the Safe Use of Fentora (fentanyl buccal tablets). Bethesda, MD: Center for Drug Evaluation and Research; 2007 September 26. http://www.fda.gov/cder/drug/infopage/fentanyl/default.htm
xii. Centers for Disease Control and Prevention. Nonpharmaceutical fentanyl-related deaths--multiple states, April 2005-March 2007. MMWR Morb Mortal Wkly Rep 2008;57(29):793-6. http://www.cdc.gov/mmwr/preview/mmwrhtml/mm5729a1.htm
xiii. Alarming Rise in Unintentional Drug/Medication-related Poisoning Deaths in Ohio. Injury Prevention Program, Ohio Department of Health.
Produced by the Violence and Injury Prevention Program, Ohio Department of Health. For more information contact Judi Moseley, Injury Prevention Program at 614‐728‐8016 or [email protected]
Ohio Department of Health, Violence and Injury Prevention Program