Embed Size (px)
Citation preview
Epidemic AlgorithmsEpidemic Algorithms
byby
David KjerrumgaardDavid Kjerrumgaard
IntroductionIntroduction
• A new class of networked systems is emerging A new class of networked systems is emerging that involve very large numbers of small, low-that involve very large numbers of small, low-powered, wireless devices.powered, wireless devices.
• The sheer number of devices involved in such The sheer number of devices involved in such networks as well as the resource constraints of networks as well as the resource constraints of the nodes in terms of energy, storage, and the nodes in terms of energy, storage, and processing necessitate the development of processing necessitate the development of extremely simple algorithms for discovery, extremely simple algorithms for discovery, routing, multicast, and aggregation.routing, multicast, and aggregation.
• While these algorithms are easy to build, they While these algorithms are easy to build, they often exhibit complex and unexpected often exhibit complex and unexpected behavior when they are utilized in real world behavior when they are utilized in real world scenarios; making them difficult to simulate scenarios; making them difficult to simulate accurately.accurately.
• In their paper, Ganesan et. al., provide a In their paper, Ganesan et. al., provide a wealth of detailed empirical data from a wealth of detailed empirical data from a network involving over 150 such nodes.network involving over 150 such nodes.
• This data is intended to serve as the basis for This data is intended to serve as the basis for algorithm design in the wireless space.algorithm design in the wireless space.
• Instrumentation in the experiment focused on Instrumentation in the experiment focused on various levels of the protocol stack in an effort various levels of the protocol stack in an effort to isolate the various factors influencing the to isolate the various factors influencing the global behavior of the system.global behavior of the system.
• At the Physical / Link Layer, they measuredAt the Physical / Link Layer, they measured– Packet LossPacket Loss– Effective Communication RangeEffective Communication Range– Link AsymmetryLink Asymmetry
• At the MAC Layer, they capturedAt the MAC Layer, they captured– ContentionsContentions– CollisionsCollisions– LatencyLatency
• At the Network / Application Layer the At the Network / Application Layer the structure of the trees constructed was structure of the trees constructed was analyzed.analyzed.
Epidemic AlgorithmsEpidemic Algorithms
• Refers to network protocols that allow Refers to network protocols that allow rapid dissemination of information from rapid dissemination of information from a source through purely local a source through purely local interactions.interactions.
• Messages initiated from the source are Messages initiated from the source are rebroadcast by neighboring nodes, rebroadcast by neighboring nodes, extending outward hop by hop until the extending outward hop by hop until the entire network is reached.entire network is reached.
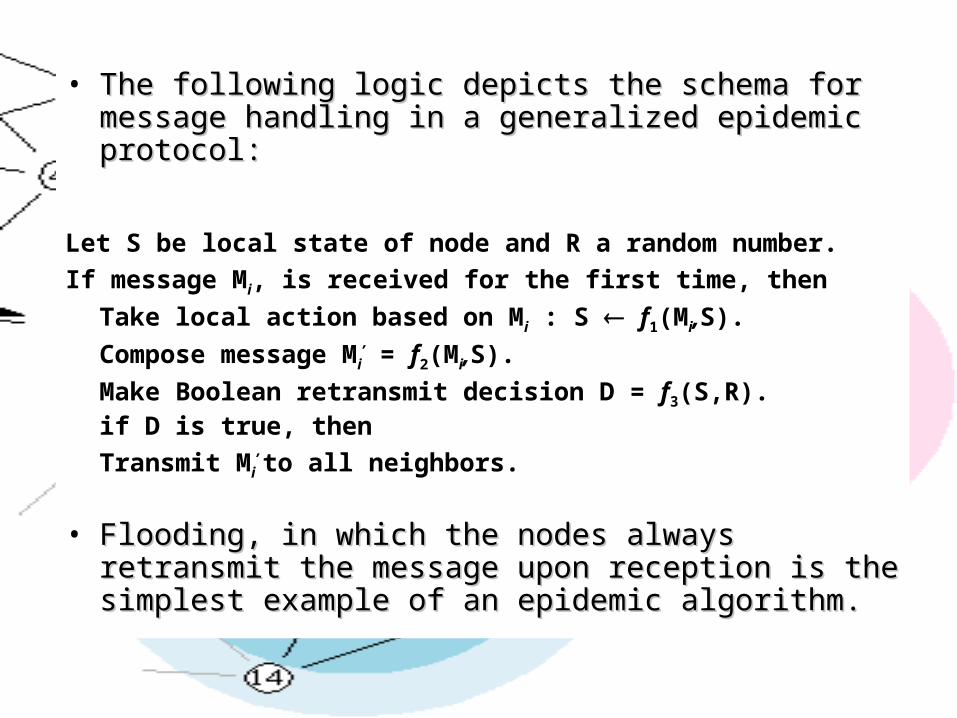
• The following logic depicts the schema for The following logic depicts the schema for message handling in a generalized epidemic message handling in a generalized epidemic protocol:protocol:
Let S be local state of node and R a random number.
If message Mi, is received for the first time, then
Take local action based on Mi : S f1(Mi,S).
Compose message Mi’ = f2(Mi,S).
Make Boolean retransmit decision D = f3(S,R).if D is true, then
Transmit Mi’ to all neighbors.
• Flooding, in which the nodes always retransmit Flooding, in which the nodes always retransmit the message upon reception is the simplest the message upon reception is the simplest example of an epidemic algorithm.example of an epidemic algorithm.
• More sophisticated forms of flooding More sophisticated forms of flooding algorithms exist, including probabilistic, algorithms exist, including probabilistic, counter-based, distance-based, and cluster-counter-based, distance-based, and cluster-based techniques that seek to minimize the based techniques that seek to minimize the amount of redundant packet transmissions.amount of redundant packet transmissions.
• This study employed a simple retransmit This study employed a simple retransmit flooding protocol, which under ideal conditions flooding protocol, which under ideal conditions would ripple outward uniformly from the the would ripple outward uniformly from the the source.source.
• When a node first receives the message, it When a node first receives the message, it immediately rebroadcasts once, and squelches immediately rebroadcasts once, and squelches further retransmissions.further retransmissions.
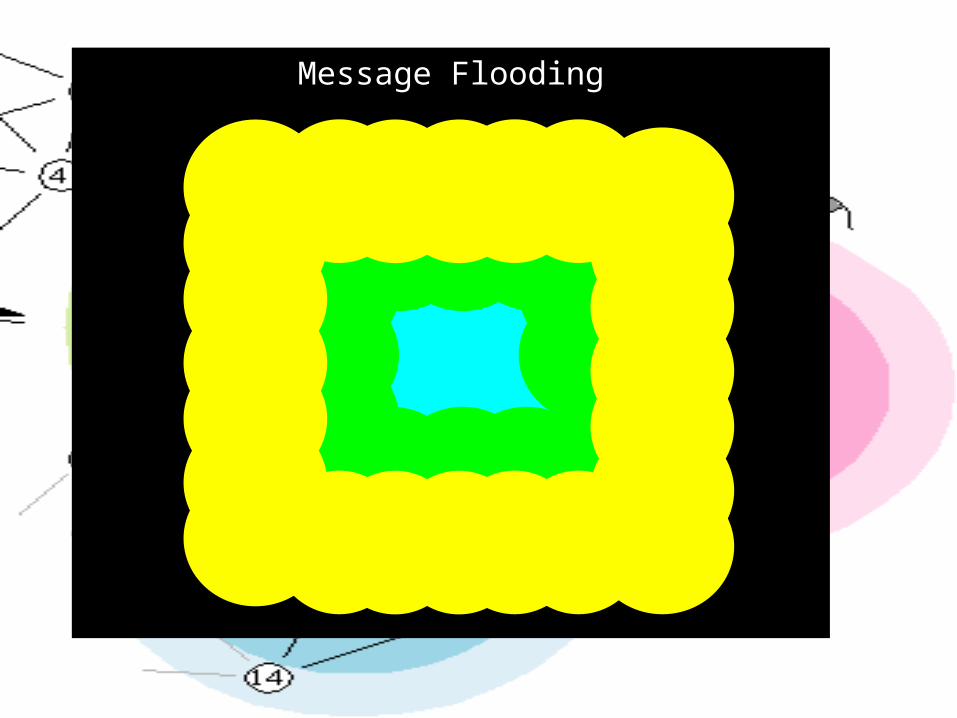
Message Flooding
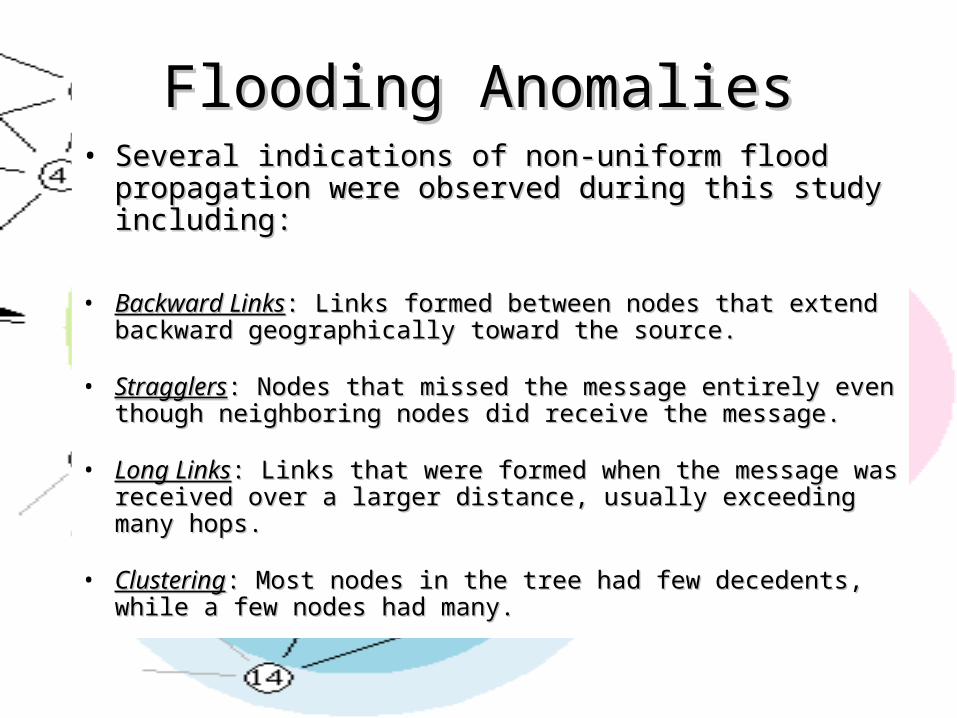
Flooding AnomaliesFlooding Anomalies• Several indications of non-uniform flood Several indications of non-uniform flood
propagation were observed during this study propagation were observed during this study including:including:
• Backward LinksBackward Links: Links formed between nodes that extend : Links formed between nodes that extend backward geographically toward the source.backward geographically toward the source.
• StragglersStragglers: Nodes that missed the message entirely even : Nodes that missed the message entirely even though neighboring nodes did receive the message.though neighboring nodes did receive the message.
• Long LinksLong Links: Links that were formed when the message : Links that were formed when the message was received over a larger distance, usually exceeding was received over a larger distance, usually exceeding many hops.many hops.
• ClusteringClustering: Most nodes in the tree had few decedents, : Most nodes in the tree had few decedents, while a few nodes had many.while a few nodes had many.
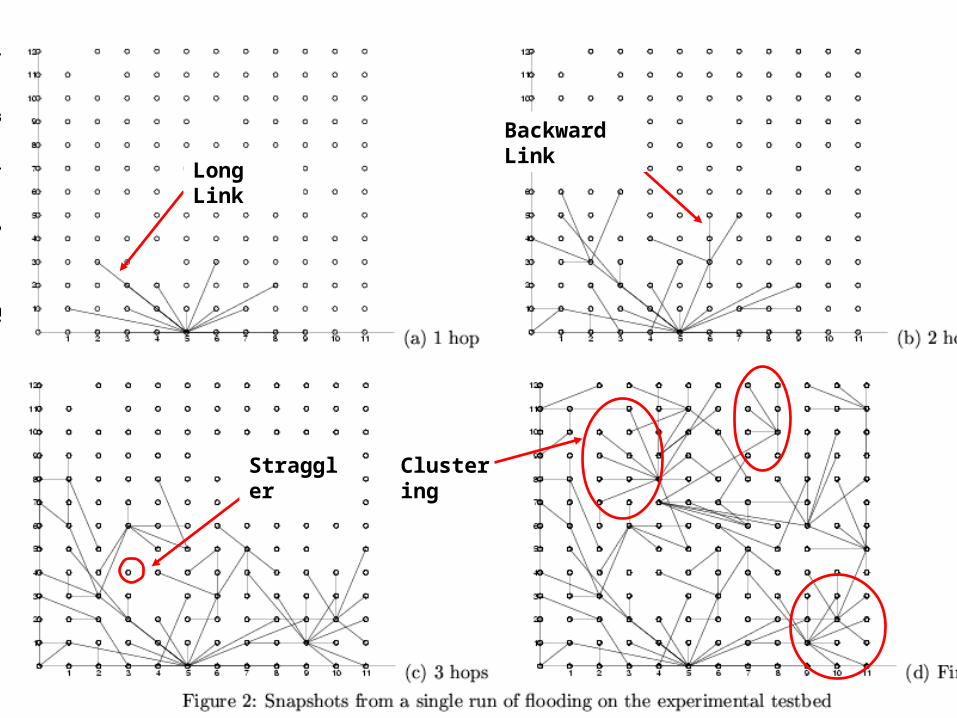
Backward Link
Long Link
Straggler Clustering
Related WorkRelated Work
• Prior experimental studies in this area Prior experimental studies in this area have tended to focus on routing in have tended to focus on routing in wireless Ad Hoc networks without wireless Ad Hoc networks without addressing scaling due to a lack of addressing scaling due to a lack of infrastructure.infrastructure.
• These studies were comprised of fewer These studies were comprised of fewer than a dozen nodes and therefore did than a dozen nodes and therefore did not address issues of scale.not address issues of scale.
• The other tool used in analyzing the The other tool used in analyzing the behavior of routing protocols in large-behavior of routing protocols in large-scale multi-hop wireless networks is scale multi-hop wireless networks is simulation.simulation.
• The results of such studies were The results of such studies were discounted due in large part to the discounted due in large part to the difficulty in simulating physical a link difficulty in simulating physical a link layer characteristics in a accurate layer characteristics in a accurate fashion.fashion.
• Ultimately, a protocol’s performance Ultimately, a protocol’s performance must be validated in the real world.must be validated in the real world.
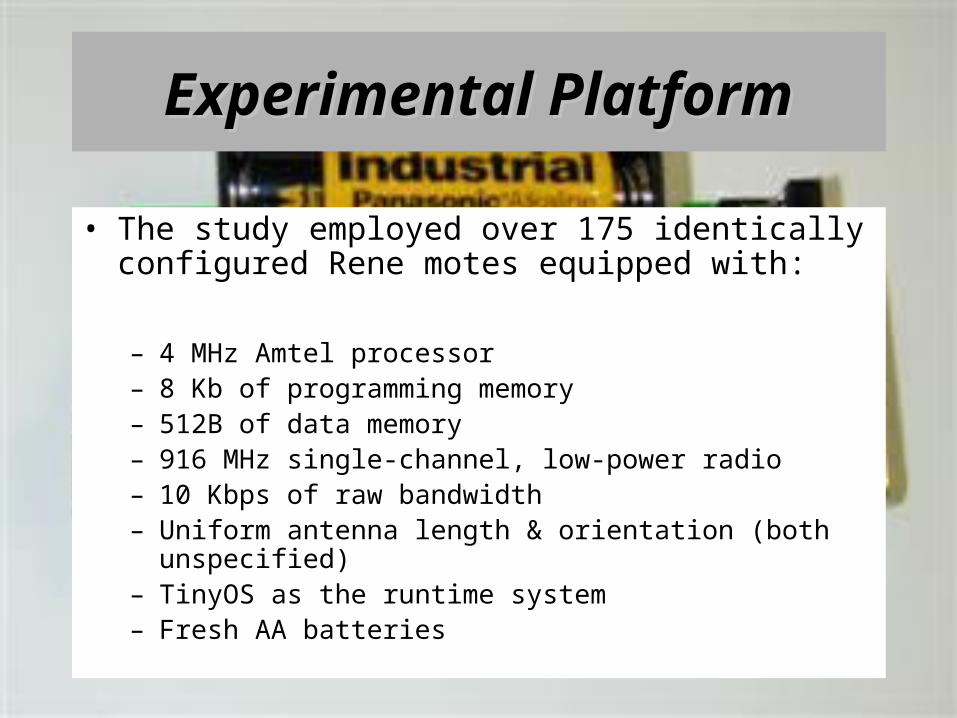
Experimental PlatformExperimental Platform
• The study employed over 175 identically configured Rene motes equipped with:
– 4 MHz Amtel processor– 8 Kb of programming memory– 512B of data memory– 916 MHz single-channel, low-power radio– 10 Kbps of raw bandwidth– Uniform antenna length & orientation (both
unspecified)– TinyOS as the runtime system– Fresh AA batteries
• Each node uses a variation of the Carrier Sense Multiple Access (CSMA) protocol with a random backoff duration between 6ms and 100ms
• During the backoff period, the radio is powered off in order to conserve energy, effectively blocking all communication during this time.
• The MAC protocol keeps trying to deliver packets until a clear channel is found. (No dropped packets)
Testing MethodologyTesting Methodology
Two separate sets of experiments were Two separate sets of experiments were conducted for this study. The first set conducted for this study. The first set focused on the characteristics of links focused on the characteristics of links among all nodes in a large test bed, among all nodes in a large test bed, while the second set focused on the while the second set focused on the dynamics of the flooding.dynamics of the flooding.
Experiment # 1Experiment # 1
169 nodes were arranged in a 13x13 grid on an open parking structure, with a grid spacing of 2 feet.
The goal of this experiment was to map the connectivity characteristics between all nodes at 16 different radio transmit power settings between 60 W and 72 W.
The base station periodically issued commands to all nodes to control the experiment, this ensured that only one node would transmit at a time thereby eliminating the possibility of collisions.
The receiving nodes transmitted in sequence in response to the commands sent by the base station.
At each power setting, each node was instructed to transmit 20 packets, 100 ms apart. Thus, a total of 54,000 ( 16 x 20 x 169 ) messages were sent during the four hour test.
Upon receipt of a message, the following information was extracted from the packet and logged in the receiver’s data memory:
Transmitter ID ( 1 – 169 ) Sequence number of the message ( 1- 54000 ) Transmit power setting ( 60 – 72 )
Analysis of Experiment # 1Analysis of Experiment # 1 The analysis from the first set of experimental The analysis from the first set of experimental
data focused on the physical and link layers.data focused on the physical and link layers.
The goals of the analysis were:The goals of the analysis were: Explore packet loss statistics over distance.Explore packet loss statistics over distance.
Attempt to quantitatively define and measure the Attempt to quantitatively define and measure the
effective communication radius at each transmit effective communication radius at each transmit
power setting in a real-world scenario.power setting in a real-world scenario.
Establish a definition of what constitutes a bi-Establish a definition of what constitutes a bi-
directional link and an asymmetric link, and measure directional link and an asymmetric link, and measure
the effects of each link type on communication.the effects of each link type on communication.
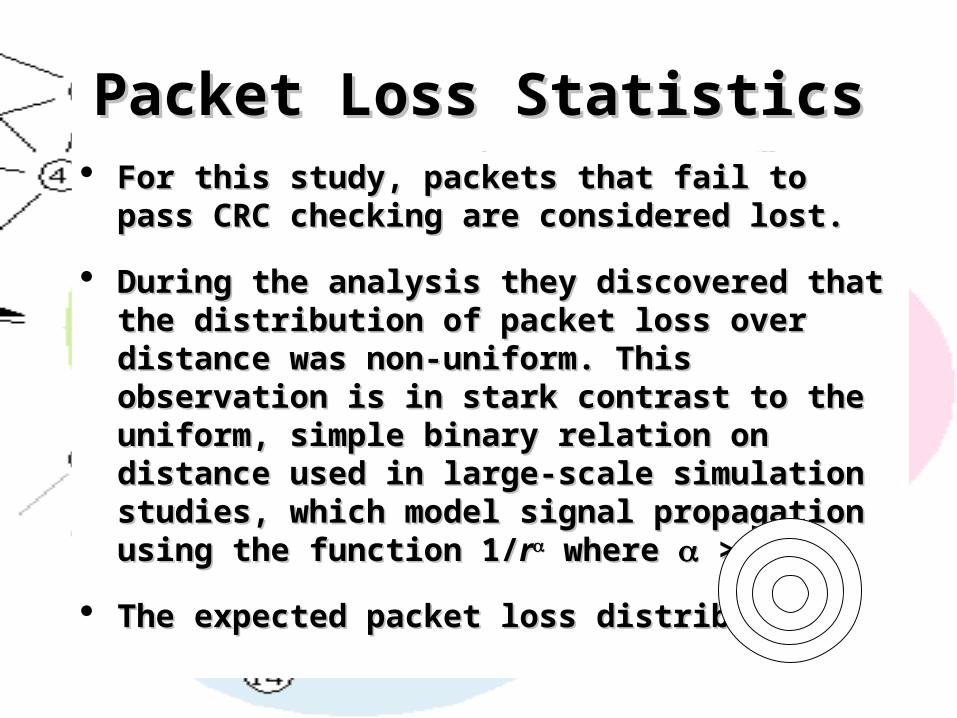
Packet Loss StatisticsPacket Loss Statistics For this study, packets that fail to pass CRC For this study, packets that fail to pass CRC
checking are considered lost.checking are considered lost.
During the analysis they discovered that the During the analysis they discovered that the distribution of packet loss over distance was non-distribution of packet loss over distance was non-uniform. This observation is in stark contrast to the uniform. This observation is in stark contrast to the uniform, simple binary relation on distance used in uniform, simple binary relation on distance used in large-scale simulation studies, which model signal large-scale simulation studies, which model signal propagation using the function 1/propagation using the function 1/rr where where > 2. > 2.
The expected packet loss distribution:The expected packet loss distribution:
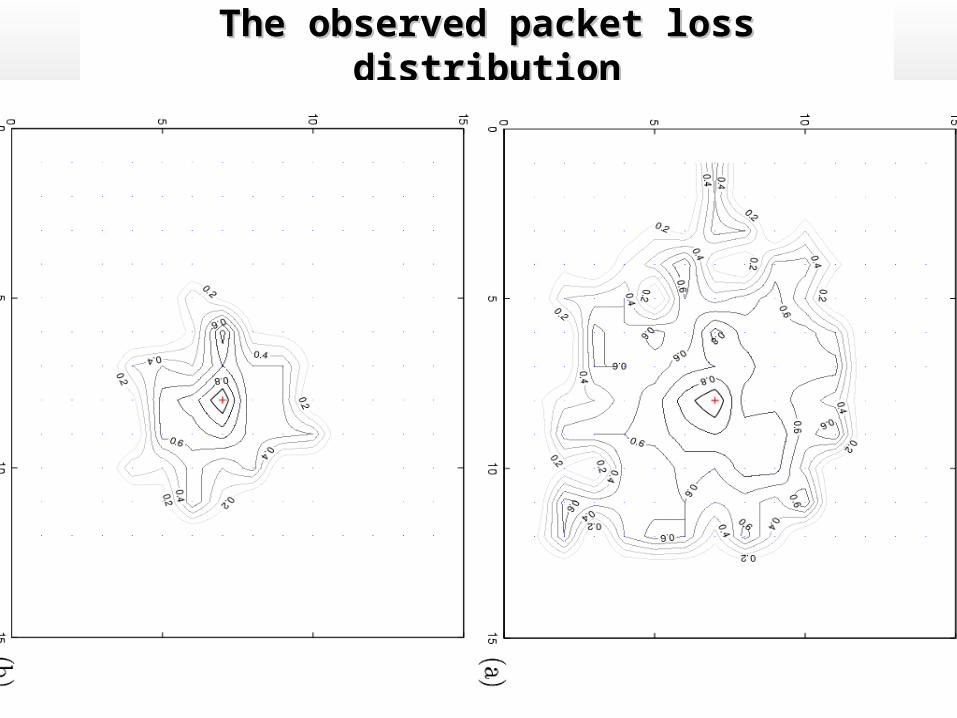
The observed packet loss distributionThe observed packet loss distribution
Radio RangeRadio Range
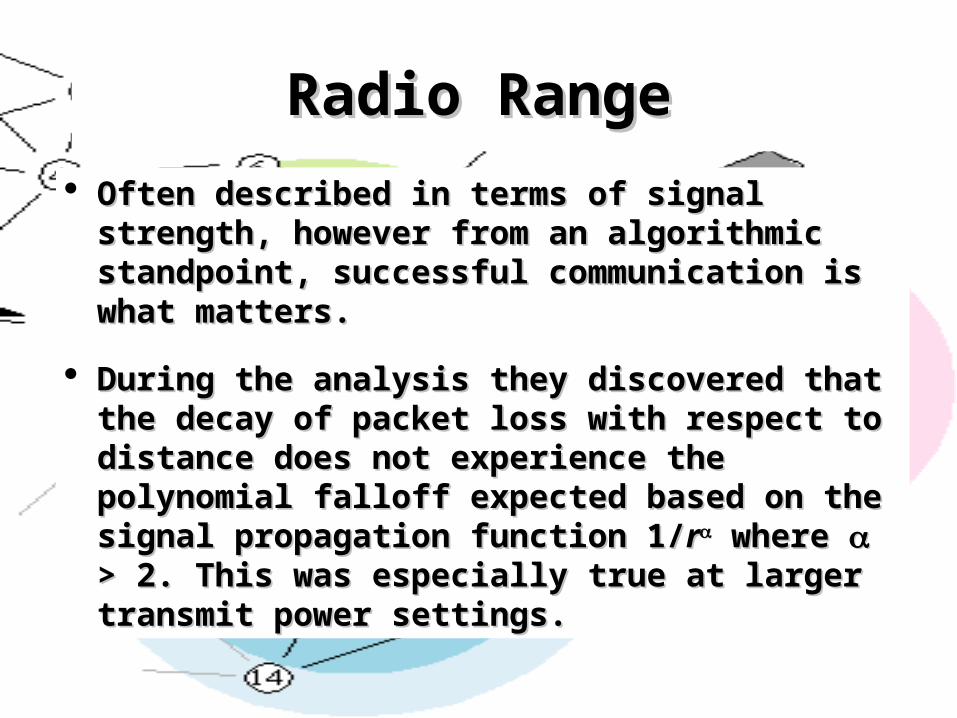
Often described in terms of signal strength, Often described in terms of signal strength, however from an algorithmic standpoint, however from an algorithmic standpoint, successful communication is what matters.successful communication is what matters.
During the analysis they discovered that the During the analysis they discovered that the decay of packet loss with respect to decay of packet loss with respect to distance does not experience the polynomial distance does not experience the polynomial falloff expected based on the signal falloff expected based on the signal propagation function 1/propagation function 1/rr where where > 2. This > 2. This was especially true at larger transmit power was especially true at larger transmit power settings.settings.
During the analysis they discovered that During the analysis they discovered that the throughput never reached 100%, even the throughput never reached 100%, even at short distances from the transmitter. at short distances from the transmitter. They attributed this phenomenon to two They attributed this phenomenon to two factors:factors:
Increased fading rate due to deployment on Increased fading rate due to deployment on the ground.the ground.
Insufficient signal processing and forward Insufficient signal processing and forward error correction due to the limited error correction due to the limited computational and energy resources available computational and energy resources available on this computing platform.on this computing platform.
Measuring the Connectivity Measuring the Connectivity RadiusRadius
Conceptually, the connectivity radius is Conceptually, the connectivity radius is thought of in terms of a circular cell. This thought of in terms of a circular cell. This approach simplifies algorithm analysis approach simplifies algorithm analysis and allows a geometric approach.and allows a geometric approach.
We have already seen that this We have already seen that this conceptualization does not fit the conceptualization does not fit the empirical data collected from this study. empirical data collected from this study. However, packet loss does decrease However, packet loss does decrease monotonically with distance.monotonically with distance.
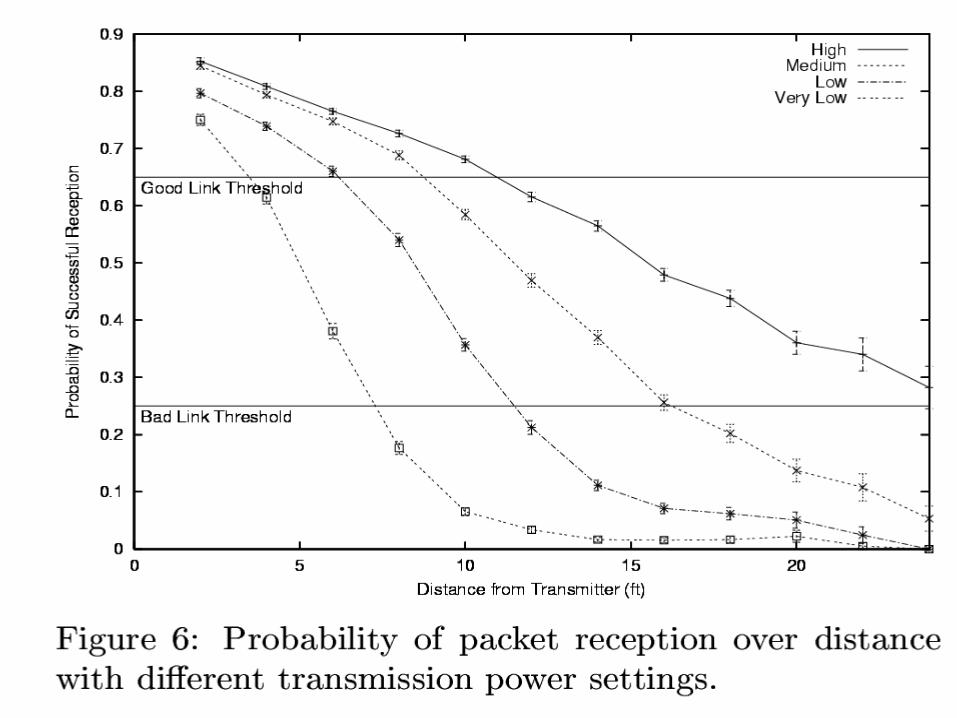
The definition of connectivity radius is typically based The definition of connectivity radius is typically based on a packet loss threshold, which, in turn, is based on on a packet loss threshold, which, in turn, is based on the ratio of “good links” to “bad links”the ratio of “good links” to “bad links”
Good Links: Those communication links in which we can use Good Links: Those communication links in which we can use forward error correction (FEC) and other techniques to forward error correction (FEC) and other techniques to improve the raw packet throughput to adequate levels. The improve the raw packet throughput to adequate levels. The packet reception probability of such a link is typically above packet reception probability of such a link is typically above 65%.65%.
Bad Links : Those communication links in which we the use Bad Links : Those communication links in which we the use of forward error correction (FEC) and other techniques of forward error correction (FEC) and other techniques cannot be employed to boost the throughput to acceptable cannot be employed to boost the throughput to acceptable levels. The packet reception probability of such a link is levels. The packet reception probability of such a link is typically below 25%.typically below 25%.
Given the previous definitions, we can Given the previous definitions, we can define the connectivity radius of a node define the connectivity radius of a node NN to be the radius to be the radius RR of the smallest circle of the smallest circle that encompasses 75% of the nodes that encompasses 75% of the nodes having a good link with having a good link with NN..
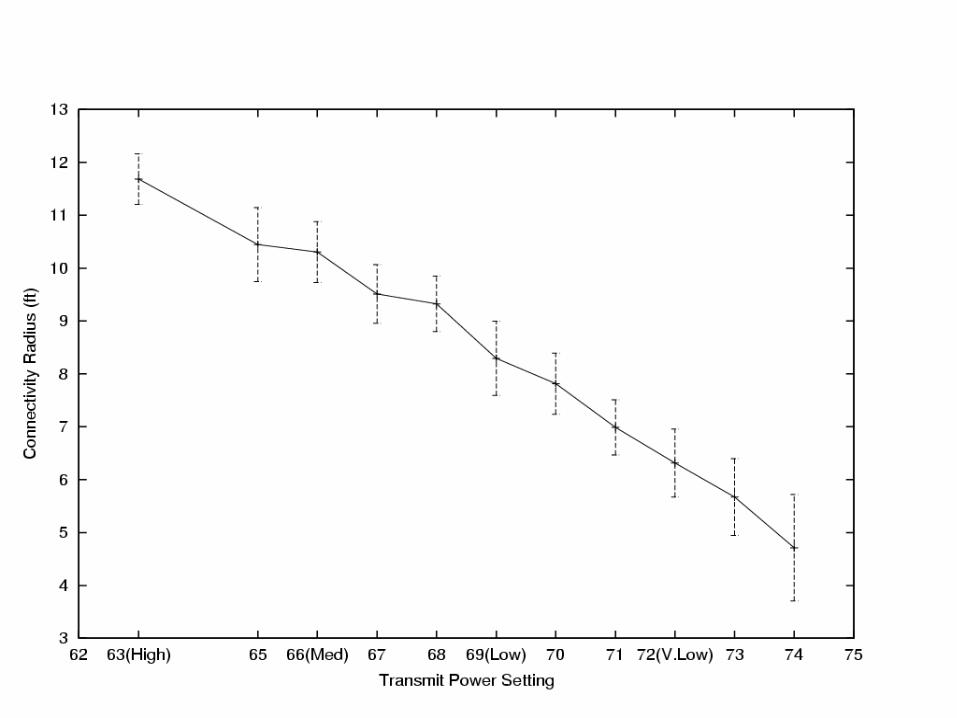
• During the analysis they observed a linear During the analysis they observed a linear variation of the connectivity radius with variation of the connectivity radius with the transmit power setting on the motethe transmit power setting on the mote.
Measure the Effects of Asymmetric Measure the Effects of Asymmetric and Bi-directional Links on and Bi-directional Links on
CommunicationCommunication
Asymmetric Links: Those communication Asymmetric Links: Those communication links that are “good” in one direction and links that are “good” in one direction and “bad” in the other.“bad” in the other.
Bi-directional Links: Those Bi-directional Links: Those communication links that are “good” in communication links that are “good” in both directions.both directions.
While asymmetric links arise While asymmetric links arise relatively infrequently in spare relatively infrequently in spare wireless networks, they are very wireless networks, they are very common within a field of low-power common within a field of low-power wireless nodes.wireless nodes.
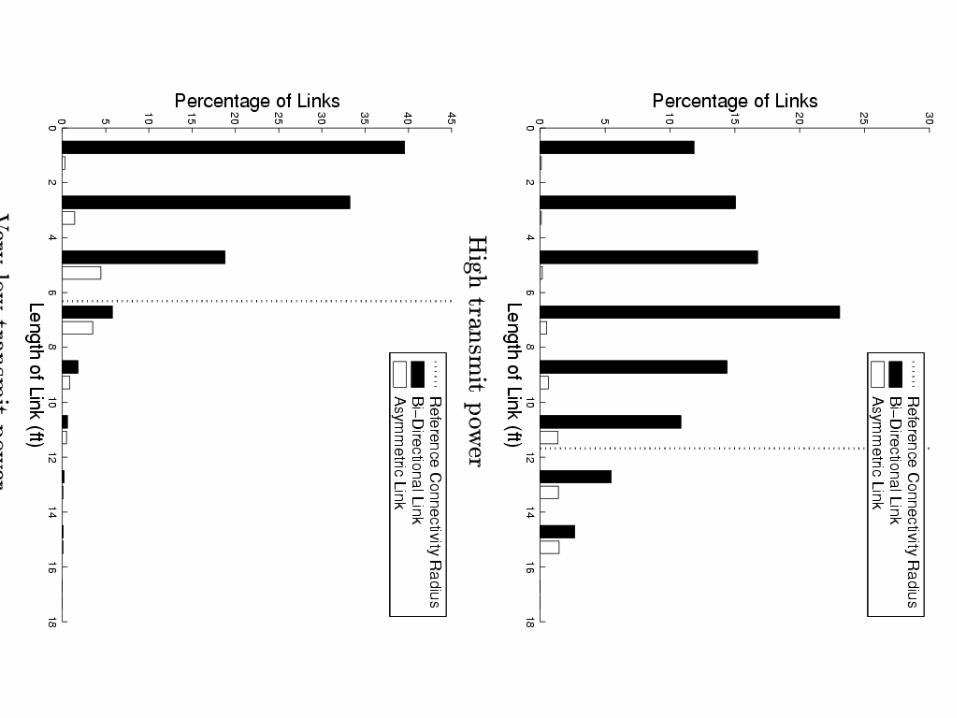
• The distribution of asymmetric links The distribution of asymmetric links over the entire test network is shown over the entire test network is shown below.below.
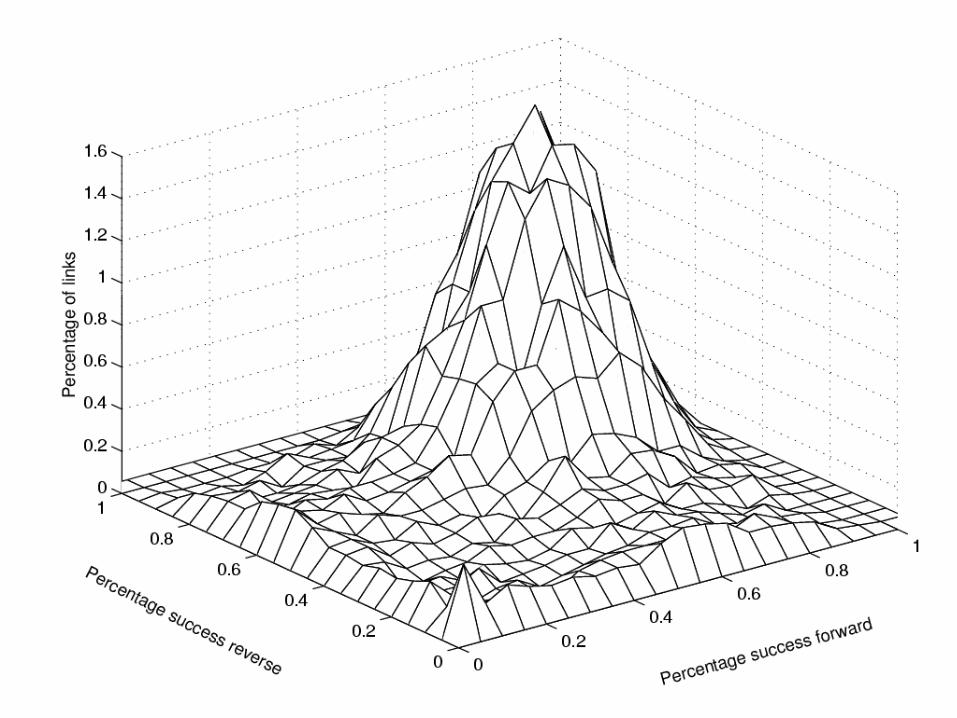
The analysis of the data collected during the first The analysis of the data collected during the first experiment reveals that for the range of transmit experiment reveals that for the range of transmit power settings studied, approximately 5-15% of power settings studied, approximately 5-15% of all links are asymmetric with the percentage all links are asymmetric with the percentage increasing inversely with the power setting.increasing inversely with the power setting.
At short distances from the transmitter, a At short distances from the transmitter, a negligible percentage of links are asymmetric, negligible percentage of links are asymmetric, but this percentage grows significantly with but this percentage grows significantly with increasing distance, especially at lower power increasing distance, especially at lower power settings.settings.
The distribution of bi-directional and asymmetric The distribution of bi-directional and asymmetric links over distance is shown below:links over distance is shown below:
Experiment # 2Experiment # 2 156 nodes were arranged in a 13x12 grid on an 156 nodes were arranged in a 13x12 grid on an
open parking structure, with a grid spacing of open parking structure, with a grid spacing of 2 feet.2 feet.
The base station was placed in the middle of The base station was placed in the middle of the base of the grid and initiated flooding the base of the grid and initiated flooding periodically, with each period lasting long periodically, with each period lasting long enough to allow the flood to settle down.enough to allow the flood to settle down.
Each receiving node rebroadcast the message Each receiving node rebroadcast the message immediately upon receipt of the flood message immediately upon receipt of the flood message and then squelches all further broadcasts.and then squelches all further broadcasts.
Eight different transmit power settings were Eight different transmit power settings were studied and 10 non-overlapping floods were studied and 10 non-overlapping floods were issued at each of these settings.issued at each of these settings.
Upon receipt of a message, the following Upon receipt of a message, the following information was extracted from the packet and information was extracted from the packet and logged in the receiver’s data memory:logged in the receiver’s data memory:
Transmitter ID ( 1 – 156 ), which was used to reconstruct Transmitter ID ( 1 – 156 ), which was used to reconstruct the propagation tree.the propagation tree.
Two locally generated timestamps, each with a Two locally generated timestamps, each with a granularity of 16 granularity of 16 s.s.
The first timestamp recorded the total amount of time The first timestamp recorded the total amount of time that a message was stored on a node before being that a message was stored on a node before being retransmitted.retransmitted.
The second timestamp recorded the interval for which The second timestamp recorded the interval for which the node was in backoff mode.the node was in backoff mode.
Analysis of Experiment # 2Analysis of Experiment # 2 The analysis from the second set of The analysis from the second set of
experimental data focused on the MAC experimental data focused on the MAC and application layers.and application layers.
The goals of the analysis were:The goals of the analysis were:
Capture different aspects of the message Capture different aspects of the message propagation including; maximum backoff propagation including; maximum backoff interval, reception latency, settling time, interval, reception latency, settling time, useless broadcasts, and collisions.useless broadcasts, and collisions.
Analyze the routing tree construction of the Analyze the routing tree construction of the epidemic algorithm.epidemic algorithm.
Medium Access Layer AnalysisMedium Access Layer Analysis
Maximum Backoff IntervalMaximum Backoff Interval
A metric that captures the contention level within an A metric that captures the contention level within an interference cell, is the maximum backoff interval, which interference cell, is the maximum backoff interval, which reflects the time till contention subsides in each cell.reflects the time till contention subsides in each cell.
The distribution of backoff intervals in the network indicates The distribution of backoff intervals in the network indicates the extent of contention that each node perceives in the the extent of contention that each node perceives in the channel.channel.
As transmit power increases, contention grows as a result of As transmit power increases, contention grows as a result of interference cell growth.interference cell growth.
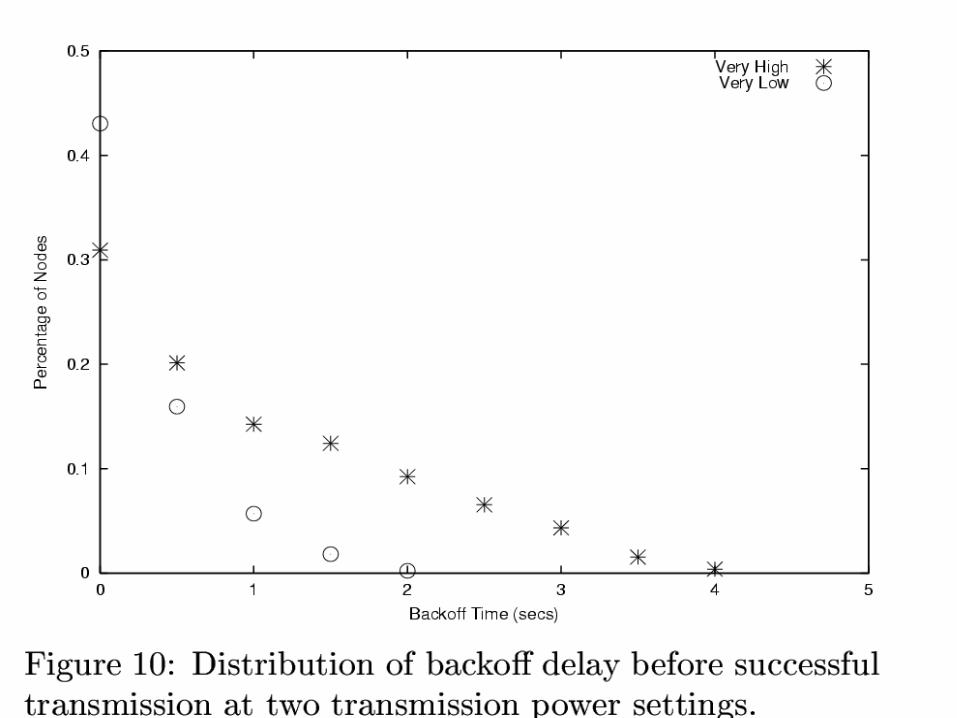
• As contention increases, nodes are forced to backoff As contention increases, nodes are forced to backoff for increasingly longer intervals as shown below:for increasingly longer intervals as shown below:
During the analysis they observed During the analysis they observed that the transmit power setting and that the transmit power setting and the 95% backoff interval threshold the 95% backoff interval threshold were directly proportional to one were directly proportional to one another.another.
Insert Table 3 hereInsert Table 3 here
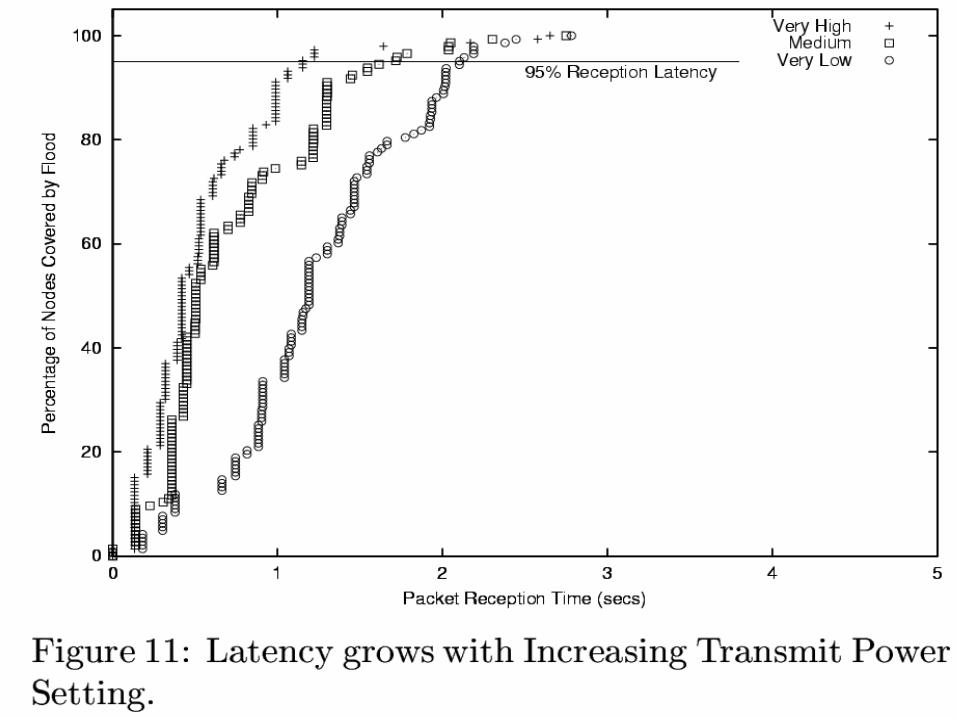
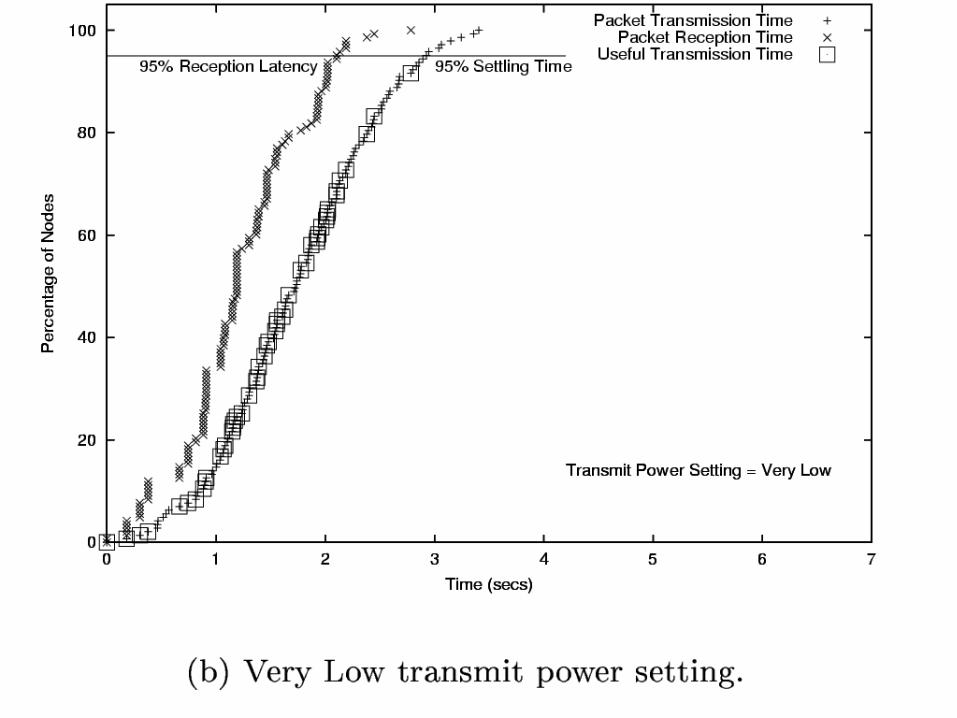
Reception LatencyReception Latency Defined to be the total amount of time required by Defined to be the total amount of time required by
nodes in the network to receive an epidemic broadcast nodes in the network to receive an epidemic broadcast packet.packet.
As expected, for higher transmit power settings the As expected, for higher transmit power settings the reception latency decreased proportionally with the reception latency decreased proportionally with the network diameter.network diameter.
• An interesting observation is that a significant fraction An interesting observation is that a significant fraction of the total propagation time was taken to reach the of the total propagation time was taken to reach the last few nodes in each plot.last few nodes in each plot.
The following figure shows the relationship between The following figure shows the relationship between the reception latency and the network diameter, which the reception latency and the network diameter, which refers to the maximum number of hops from the refers to the maximum number of hops from the source to any node in the network.source to any node in the network.
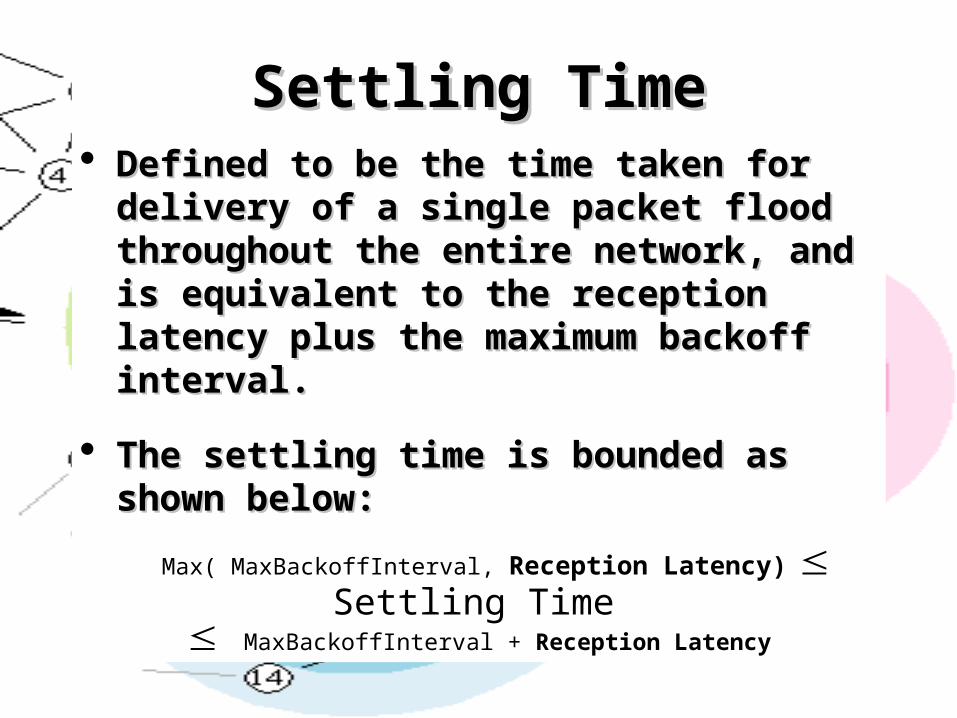
Settling TimeSettling Time Defined to be the time taken for delivery of Defined to be the time taken for delivery of
a single packet flood throughout the entire a single packet flood throughout the entire network, and is equivalent to the reception network, and is equivalent to the reception latency plus the maximum backoff latency plus the maximum backoff interval.interval.
The settling time is bounded as shown The settling time is bounded as shown below:below:
Max( MaxBackoffInterval, Reception Latency) Settling Time
MaxBackoffInterval + Reception Latency
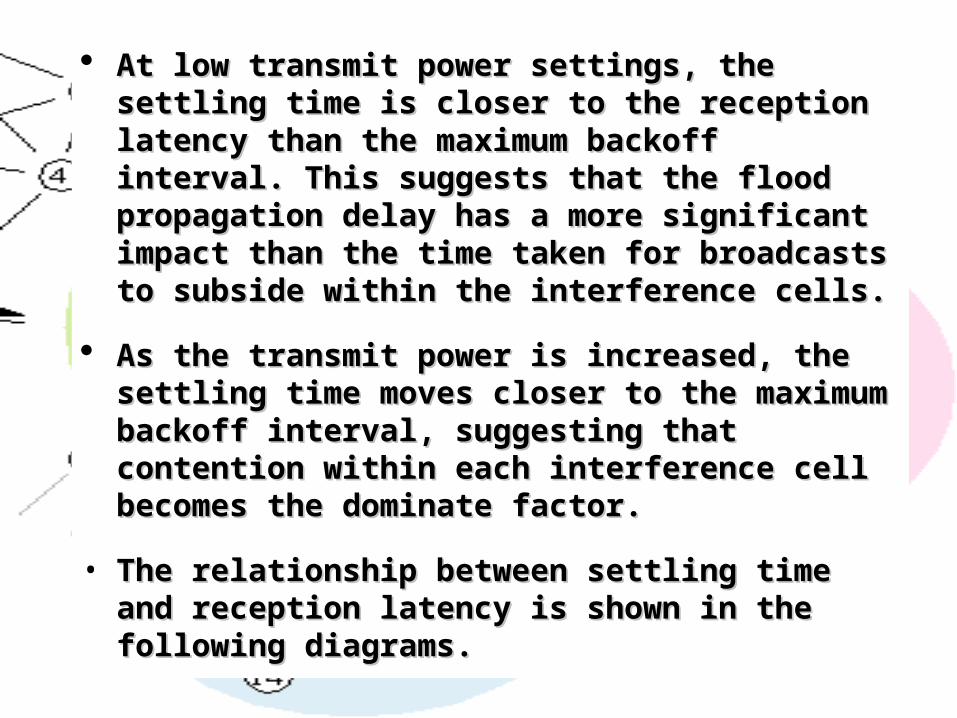
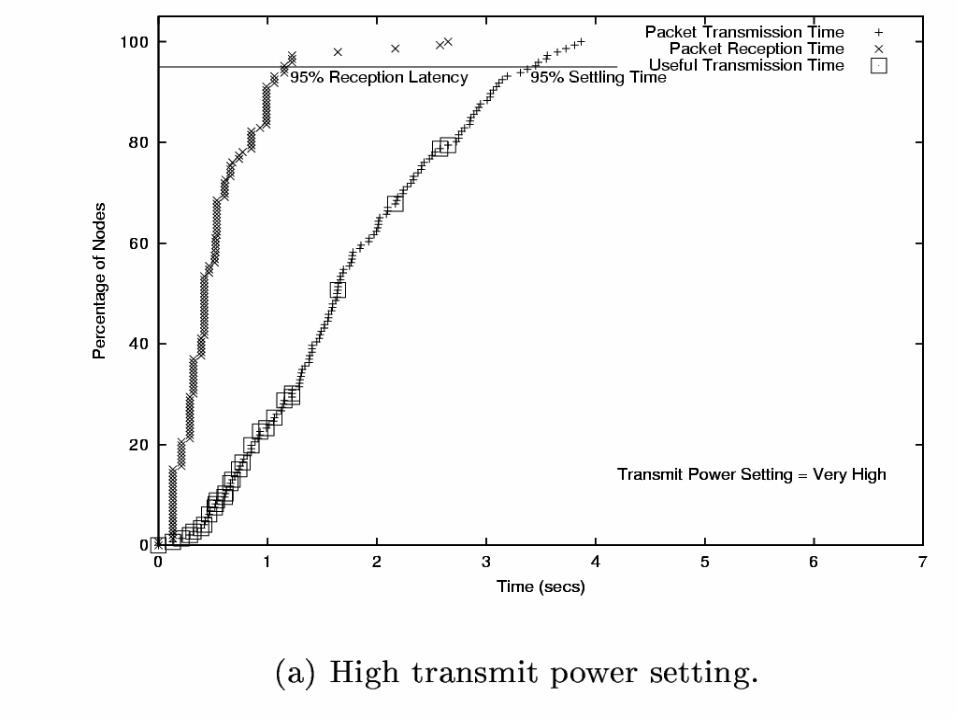
At low transmit power settings, the settling time is At low transmit power settings, the settling time is closer to the reception latency than the maximum closer to the reception latency than the maximum backoff interval. This suggests that the flood backoff interval. This suggests that the flood propagation delay has a more significant impact propagation delay has a more significant impact than the time taken for broadcasts to subside than the time taken for broadcasts to subside within the interference cells.within the interference cells.
As the transmit power is increased, the settling As the transmit power is increased, the settling time moves closer to the maximum backoff time moves closer to the maximum backoff interval, suggesting that contention within each interval, suggesting that contention within each interference cell becomes the dominate factor.interference cell becomes the dominate factor.
• The relationship between settling time and The relationship between settling time and reception latency is shown in the following reception latency is shown in the following diagrams.diagrams.
Useless BroadcastsUseless Broadcasts Defined to be the percentage of rebroadcasts that Defined to be the percentage of rebroadcasts that
deliver a message only to nodes that have already deliver a message only to nodes that have already received one. Typical causes for such broadcasts received one. Typical causes for such broadcasts include:include:
All neighbors have already received the messageAll neighbors have already received the message
The rebroadcast suffers packet loss or collisionThe rebroadcast suffers packet loss or collision
Analysis of the experimental data revealed that at Analysis of the experimental data revealed that at higher transmit power settings, nodes in the higher transmit power settings, nodes in the network keep retransmitting the message long network keep retransmitting the message long after 95% of the nodes already received it.after 95% of the nodes already received it.
Conversely, the lowest transmit power setting Conversely, the lowest transmit power setting examined had only a 60% useless broadcast rate.examined had only a 60% useless broadcast rate.
CollisionsCollisions During the analysis they observed that for all power settings, During the analysis they observed that for all power settings,
the time required for all nodes to receive the flood is nearly the time required for all nodes to receive the flood is nearly identical.identical.
At very high transmit power, the last 5% of the nodes take as At very high transmit power, the last 5% of the nodes take as much time to receive their packets as the first 95%. This much time to receive their packets as the first 95%. This phenomenon can be attributed to stragglers and backward phenomenon can be attributed to stragglers and backward links.links.
In broadcast-style epidemic transmission, a packet does not In broadcast-style epidemic transmission, a packet does not have an intended recipient, so CSMA without RTS/CTS is used. have an intended recipient, so CSMA without RTS/CTS is used. However, we are able to combine the global ordering the packet However, we are able to combine the global ordering the packet transmissions and link layer estimates of the communication transmissions and link layer estimates of the communication cell to infer the impact of collisions.cell to infer the impact of collisions.
The following charts show the relation between the number of The following charts show the relation between the number of colliding transmitters, stragglers, and backward links.colliding transmitters, stragglers, and backward links.
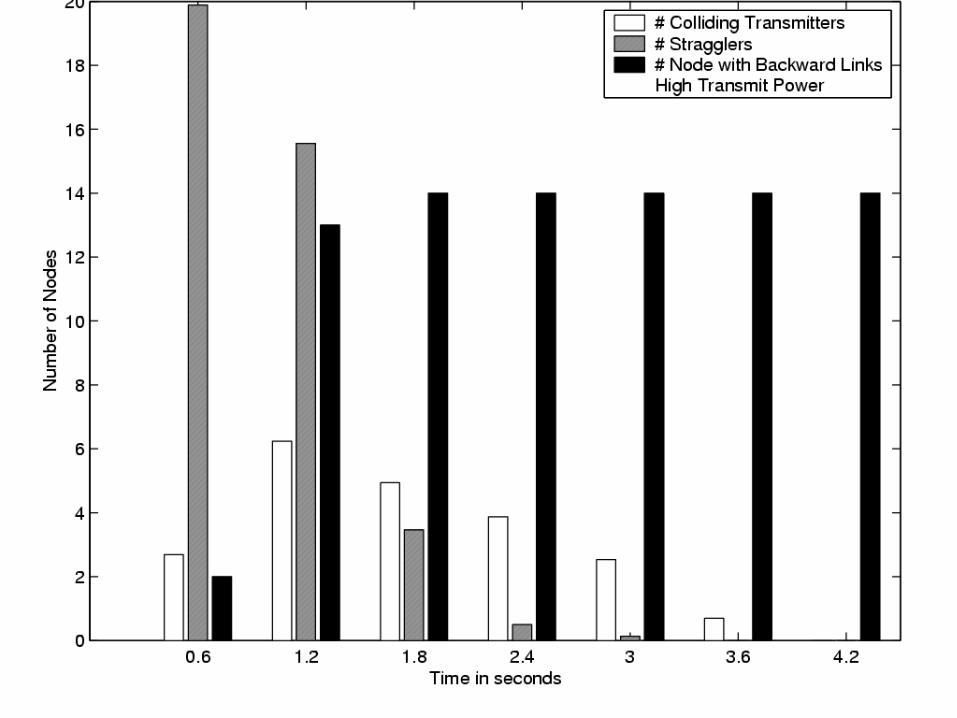
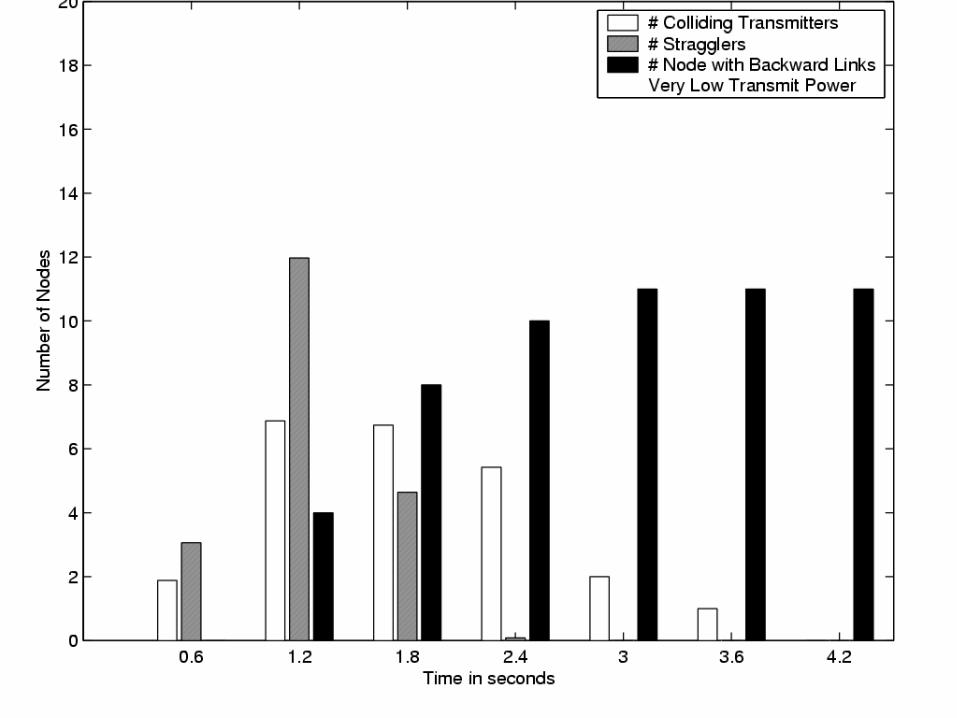
Timestamps generated at the MAC level were used to Timestamps generated at the MAC level were used to estimate the number of colliding nodes. Using the estimate the number of colliding nodes. Using the connectivity radius established in the first experiment connectivity radius established in the first experiment allowed them to detect intersecting communication allowed them to detect intersecting communication cells for each set of colliding transmitters.cells for each set of colliding transmitters.
This provides an estimate for the number of nodes that This provides an estimate for the number of nodes that should receive the packet, but do not as a result of should receive the packet, but do not as a result of collisions.collisions.
Collisions result in the creation of Collisions result in the creation of stragglersstragglers , which , which miss the propagation in the early stage of the flood and miss the propagation in the early stage of the flood and eventually form backward links from a later reception.eventually form backward links from a later reception.
At higher transmit power settings, communication At higher transmit power settings, communication cells grow, resulting in a larger number of stragglers, cells grow, resulting in a larger number of stragglers, and consequently backward links.and consequently backward links.
Network and Application Layer Network and Application Layer AnalysisAnalysis
The reverse routing tree was constructed from The reverse routing tree was constructed from the information collected at the Network layer the information collected at the Network layer during the experiment. Analysis of the reverse during the experiment. Analysis of the reverse routing tree has greater relevance in the routing tree has greater relevance in the majority of algorithms developed for this majority of algorithms developed for this computing platform, such as:computing platform, such as:
Data gathering applicationsData gathering applications
Reactive mobile ad hoc routing algorithms with Reactive mobile ad hoc routing algorithms with cachingcaching
Multicast algorithmsMulticast algorithms
Link Layer analysis has shown that long Link Layer analysis has shown that long links have a greater potential for asymmetry links have a greater potential for asymmetry and therefore are less appropriate for use and therefore are less appropriate for use as the reverse path to draw data back to the as the reverse path to draw data back to the source.source.
Similarly, backward links in the tree are Similarly, backward links in the tree are sub-optimal since data flows away from the sub-optimal since data flows away from the base station rather than towards it on the base station rather than towards it on the reverse path.reverse path.
The following figure depicts the various The following figure depicts the various factors affecting tree structuresfactors affecting tree structures
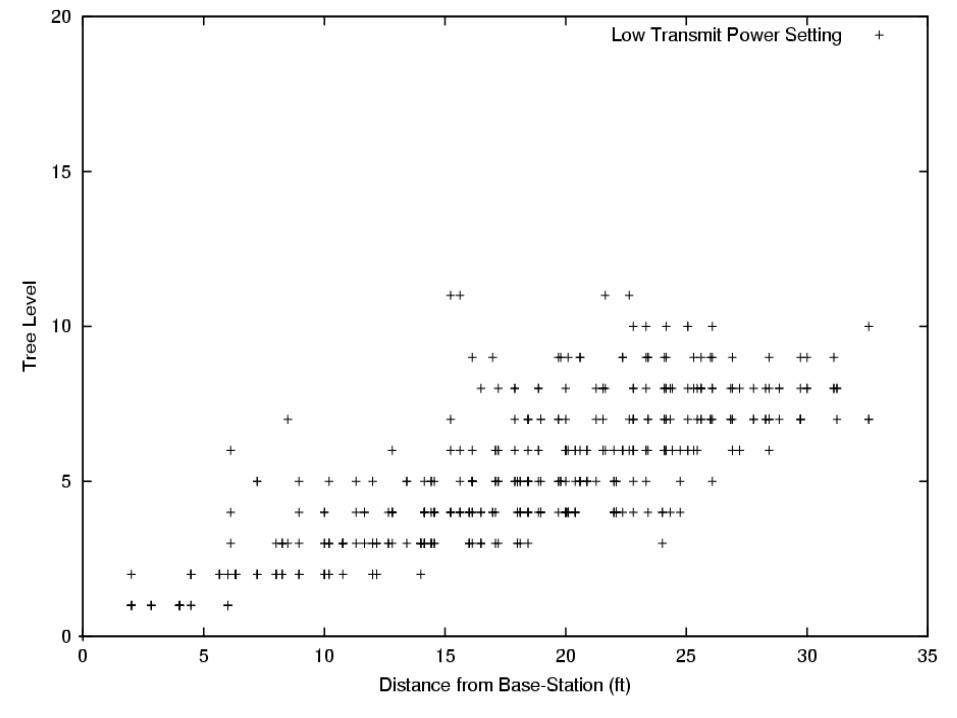
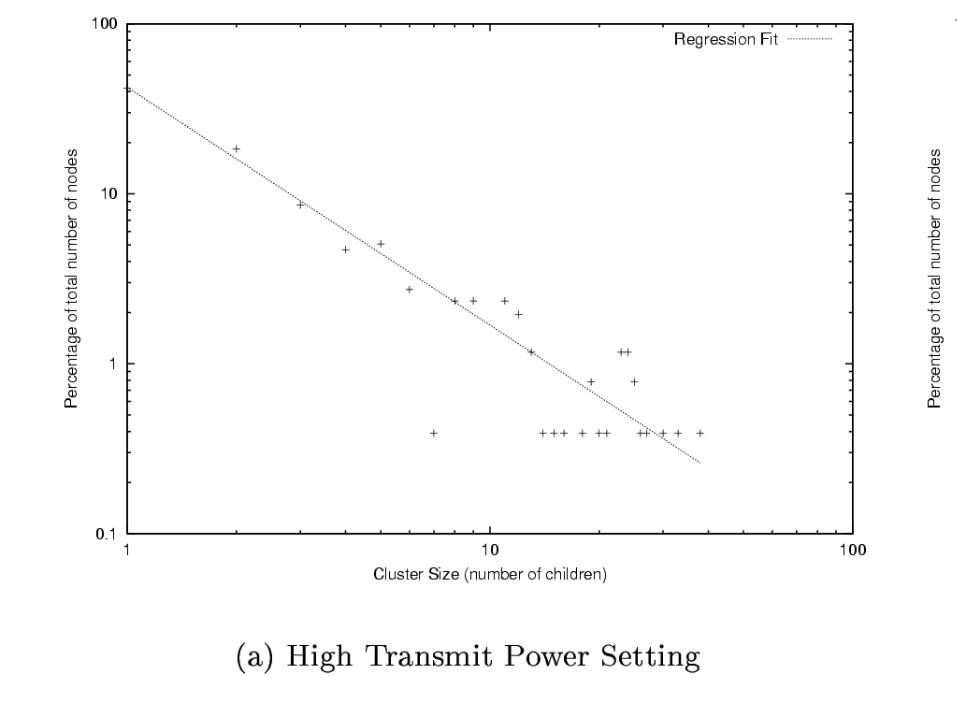
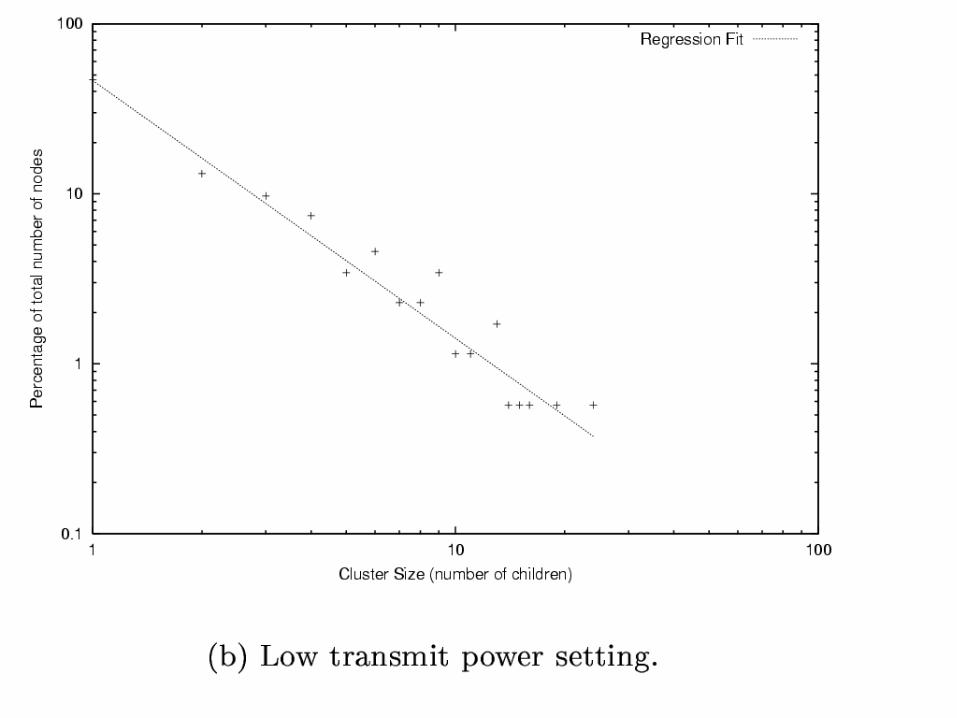
The parent selection mechanism has a large role in influencing The parent selection mechanism has a large role in influencing the tree structure. In fact, the opportunistic, earliest-first parent the tree structure. In fact, the opportunistic, earliest-first parent selection mechanism used in this study resulted in highly selection mechanism used in this study resulted in highly clustered trees, with most nodes being leaves and only a small clustered trees, with most nodes being leaves and only a small number of parent nodes, each with a large number of children.number of parent nodes, each with a large number of children.
Large clusters were observed across all eight of the transmit Large clusters were observed across all eight of the transmit power settings being studied and this behavior was power settings being studied and this behavior was exacerbated by the presence of long links for the following exacerbated by the presence of long links for the following reason;reason;
Nodes at the end of long links have a greater probability of seeing Nodes at the end of long links have a greater probability of seeing less interference and typically have many neighbors who have not less interference and typically have many neighbors who have not received the flood packet. received the flood packet.
Consequently, these nodes retransmit the packet faster due to an Consequently, these nodes retransmit the packet faster due to an absence of any backoff interval, and reach more uncovered nodes, absence of any backoff interval, and reach more uncovered nodes, resulting in the highly clustered behavior observed in the study.resulting in the highly clustered behavior observed in the study.
Key Observations & Key Observations & RecommendationsRecommendations
Much of the literature has assumed a circular disc model for Much of the literature has assumed a circular disc model for the cell regions. The data gathered in this study implies that the cell regions. The data gathered in this study implies that a probabilistic view of modeling is a more realistic approach.a probabilistic view of modeling is a more realistic approach.
The fact that asymmetry manifests itself more on long links The fact that asymmetry manifests itself more on long links is significant to many ad-hoc routing protocols that use is significant to many ad-hoc routing protocols that use shortest reverse hop-count as a method for setting up shortest reverse hop-count as a method for setting up routing paths. These protocols naturally select links that are routing paths. These protocols naturally select links that are long in nature, thereby increasing the probability of selecting long in nature, thereby increasing the probability of selecting a poor reverse end-to-end route.a poor reverse end-to-end route.
The empirical data from this study suggests that asymmetric The empirical data from this study suggests that asymmetric links are indeed likely to be significant in large scale, links are indeed likely to be significant in large scale, multihop networks and robust protocol must deal multihop networks and robust protocol must deal appropriately with asymmetric links through mechanisms appropriately with asymmetric links through mechanisms such as filtering.such as filtering.
Reducing the transmission power in an epidemic Reducing the transmission power in an epidemic broadcast reduces the number of useless broadcasts. broadcast reduces the number of useless broadcasts. Therefore, energy can be conserved by reducing the Therefore, energy can be conserved by reducing the transmit power setting.transmit power setting.
Rebroadcasts that are transmitted after a large backoff Rebroadcasts that are transmitted after a large backoff delay relative to the elapsed time are likely to be delay relative to the elapsed time are likely to be useless. Therefore, dropping these rebroadcasts if useless. Therefore, dropping these rebroadcasts if tight estimates of the reception latency are available to tight estimates of the reception latency are available to nodes can save energy.nodes can save energy.
In order to maximize throughput, it is useful to pipeline In order to maximize throughput, it is useful to pipeline transmissions from the base-station, such that two transmissions from the base-station, such that two successive transmissions are separated by the successive transmissions are separated by the amount of time it takes to propagate two transmission amount of time it takes to propagate two transmission cells.cells.
Settling time gives a lower bound on achievable Settling time gives a lower bound on achievable multicast throughput, of 1 / Settling time.multicast throughput, of 1 / Settling time.
Implications on Algorithm Implications on Algorithm DesignDesign
Simple protocols with very few states can exhibit Simple protocols with very few states can exhibit unanticipated global complexity due to their unanticipated global complexity due to their interaction with the complex physical world.interaction with the complex physical world.
Algorithm designs should use a probabilistic Algorithm designs should use a probabilistic abstraction to model connectivityabstraction to model connectivity
Asymmetry is to be expected, and certain protocol Asymmetry is to be expected, and certain protocol choices may exacerbate this effect. Robustness to choices may exacerbate this effect. Robustness to asymmetry is a crucial part of protocol design in these asymmetry is a crucial part of protocol design in these systems.systems.