Embed Size (px)
Citation preview

16-17 May 2011
EPG presentation
Patrick Kron, CEO
P 2
Agenda
1. Our activities
3. Conclusion
4. Appendices
2. Recent developments
P 3
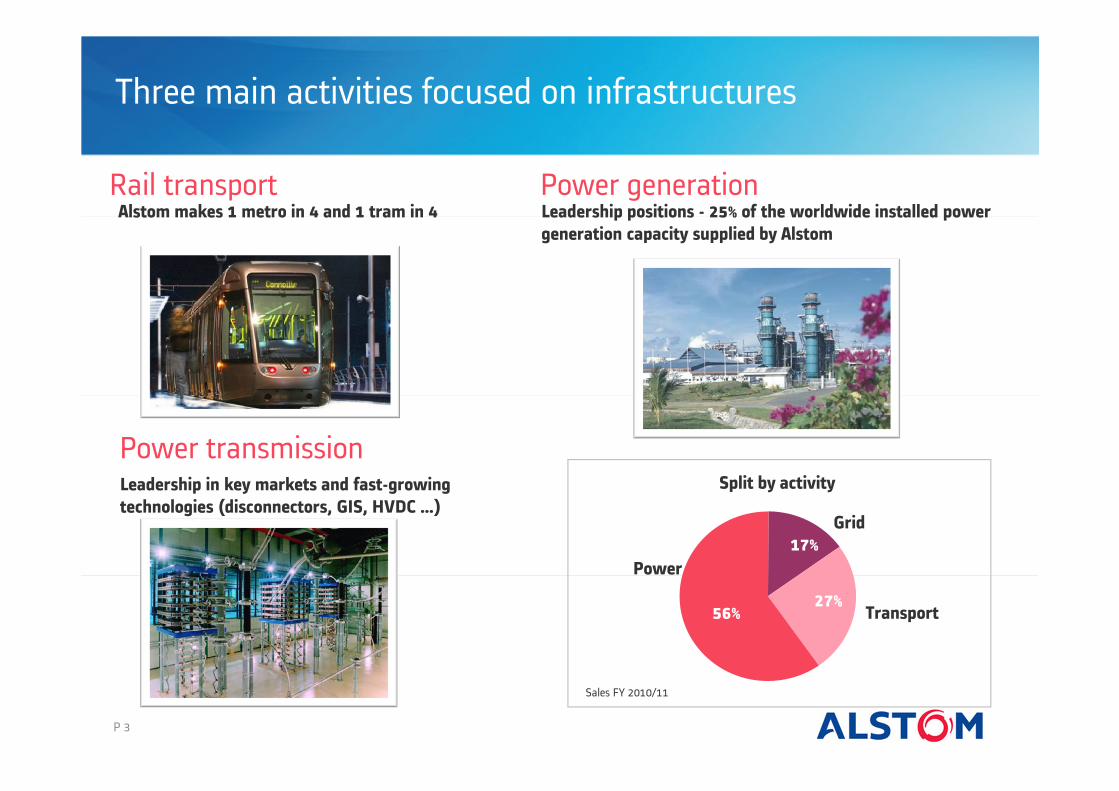
Rail transport
Three main activities focused on infrastructures
Power generationLeadership positions - 25% of the worldwide installed power
generation capacity supplied by Alstom
Alstom makes 1 metro in 4 and 1 tram in 4
Power transmissionLeadership in key markets and fast-growing
technologies (disconnectors, GIS, HVDC …)
Split by activity
Sales FY 2010/11
27%
17%
56% Transport
Grid
Power

P 4
Power Offering
Leading positions in all major power generation markets
Gas
N°3
Coal
N°1*
Hydro Nuclear (conventional part) Wind
Plant integrator for thermal applications Strong portfolio of CO2 free technologies
* Excluding Chinese and Indian suppliers
N°1 Recent small position
Solar Geothermal Biomass
N°1
Presence in
P 5
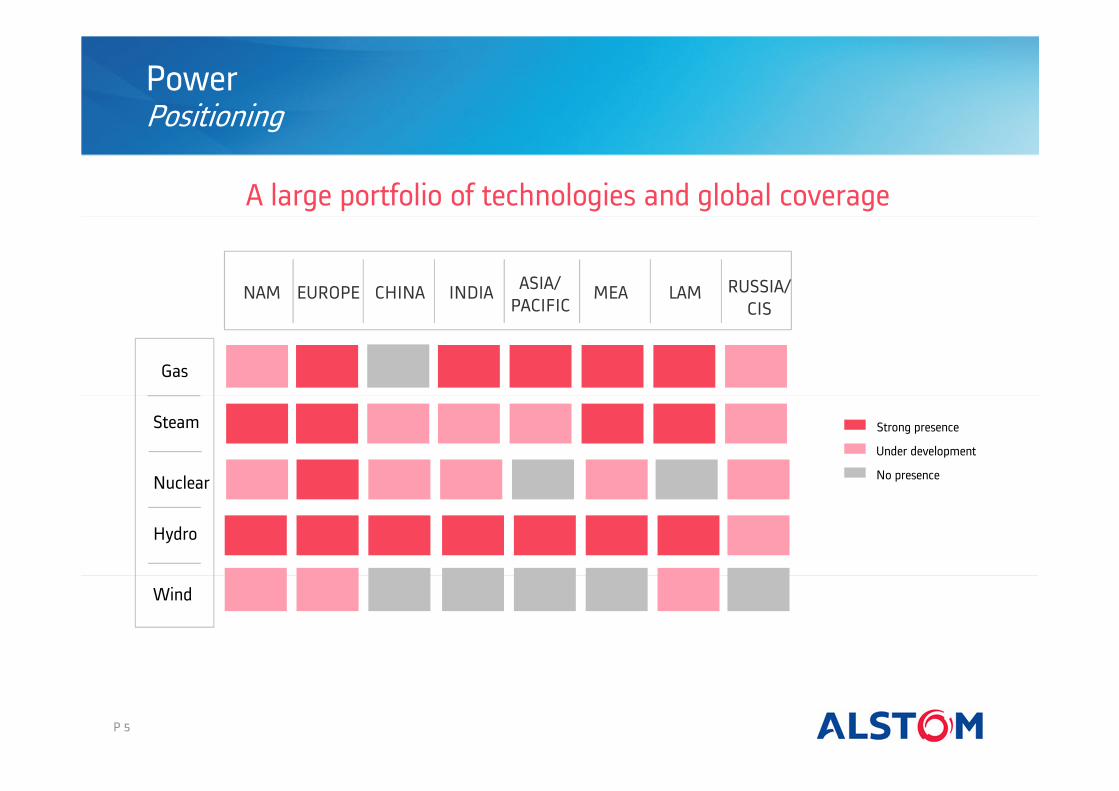
PowerPositioning
A large portfolio of technologies and global coverage
Strong presence
Under development
No presence
Gas
NAM EUROPE CHINA INDIAASIA/
PACIFICMEA LAM RUSSIA/
CIS
Steam
Nuclear
Hydro
Wind

P 6
Strong service & retrofit activities
New build
After-market (incl. retrofit)
Contribution to sales
FY2010/11 data
Power Offering
OEM supplied at least the turbine, the generator or the steam generator
Source: ALSTOM, UDI (2009)
Total World Installed Base: ~4,800 GW
25%
18%
6%
Contribution to income from operations
15%

P 7
Power Drivers
Economic growth
Economic outlook improving alongside renewed growth in electricity consumption,particularly in emerging countries
Ageing of power plants
Rising modernisation, service and replacement needs
Environmental regulations
Trend of energy mix diversification(CO2 free technologies), efficiency improvement, CCS…
Long-term growing market

P 8
TransportOffering
A worldwide leader
Split by activities
InfrastructureRolling stockServices
Signalling
Metro
Regional
LocomotivesVery high speed
Tram-Train
Tram
High speed
Interurban

P 9
Transport Drivers
Urbanisation
Mobility constantly growing
Environmental concerns
Necessity of clean and efficient transport modes
Infrastructure saturation
Congestion in road and air; increasing development of rail networks
A solid market
Increase in worldwide
population
Today 2025
3.54.6
6.87.8
Urban
Rural
P 10
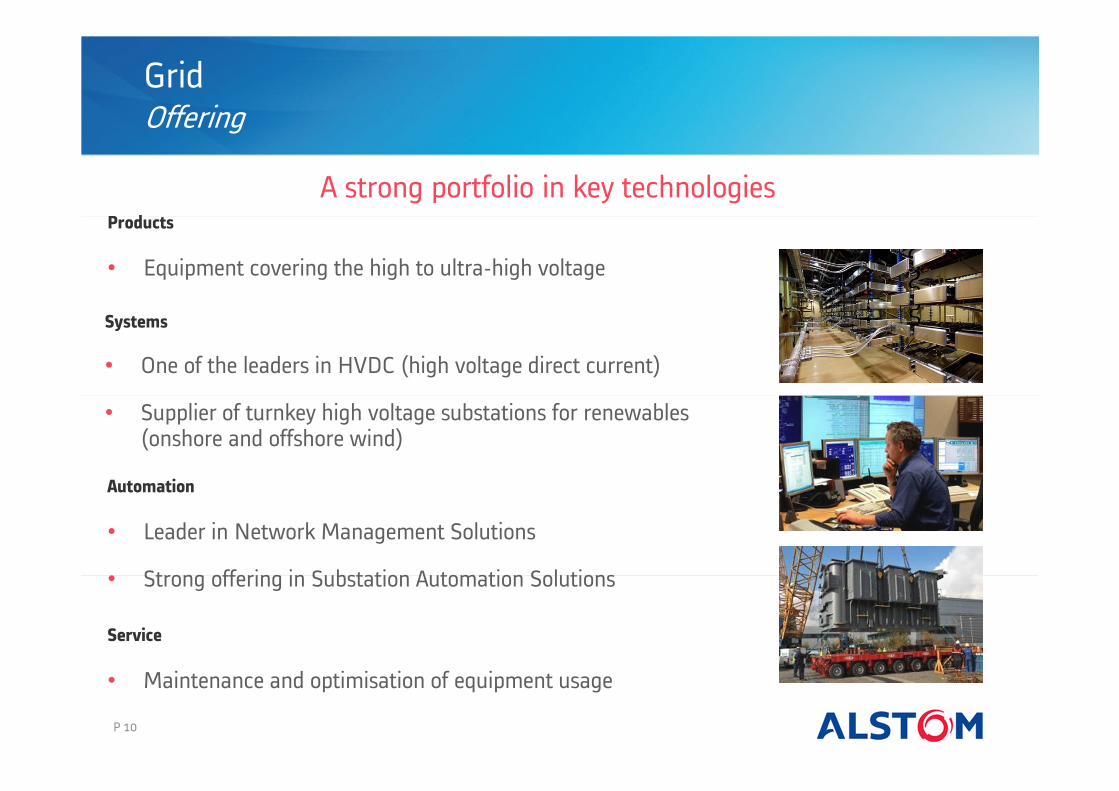
GridOffering
Products
• Equipment covering the high to ultra-high voltage
Systems
• One of the leaders in HVDC (high voltage direct current)
• Supplier of turnkey high voltage substations for renewables (onshore and offshore wind)
Automation
• Leader in Network Management Solutions
• Strong offering in Substation Automation Solutions
Service
• Maintenance and optimisation of equipment usage
A strong portfolio in key technologies

P 11
GridDrivers
Increasing complexity of networks, need for energy efficiency
Increase of demand for electricity
and ageing of networks
Race for a low carbon energy mix
(renewables especially)
Need for efficient and safe networks
P 12
Agenda
1. Our activities
3. Conclusion
4. Appendices
2. Recent developments
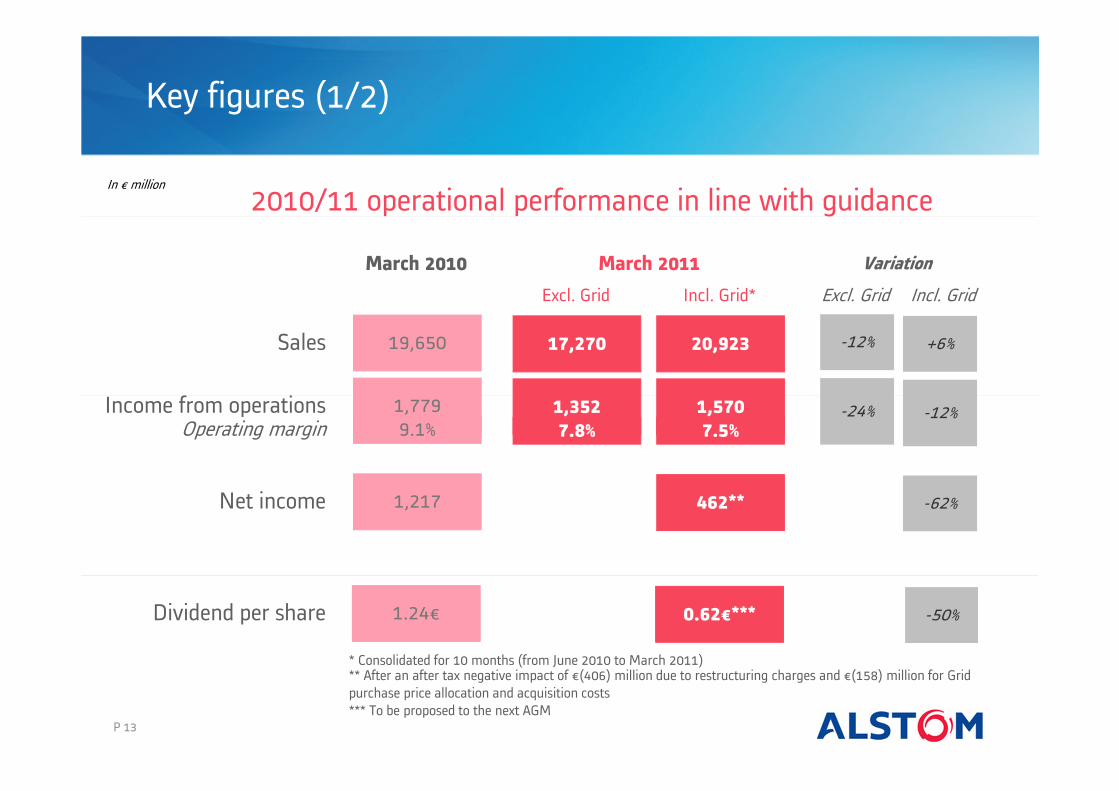
Key figures (1/2)
March 2010 March 2011 Variation
Income from operations -24%Operating margin
Sales -12%
Net income
*** To be proposed to the next AGM
In € million
Dividend per share
1,7799.1%
19,650
1,217
1.24€
1,3527.8%
17,270
Excl. Grid Incl. Grid* Excl. Grid Incl. Grid
1,5707.5%
20,923
462**
0.62€***
-12%
+6%
-62%
-50%
2010/11 operational performance in line with guidance
* Consolidated for 10 months (from June 2010 to March 2011)** After an after tax negative impact of €(406) million due to restructuring charges and €(158) million for Grid
purchase price allocation and acquisition costs
P 13

P 14
Key figures (2/2)
March 2010 March 2011 Variation
-2%
+5%
In € million
42,561
14,919
185
41,685
15,620
Excl. Grid Incl. Grid* Excl. Grid Incl. Grid
46,816
19,054
(516)
+10%
+28%Orders received
Free cash flow
Backlog
Orders pick up in the second half of 2010/11
* Consolidated for 10 months (from June 2010 to March 2011)
H1 2010/11 H2 2010/11
7, 038
12,016
H1 2010/11 H2 2010/11
(963)
447
Orders received Free cash flow
P 15
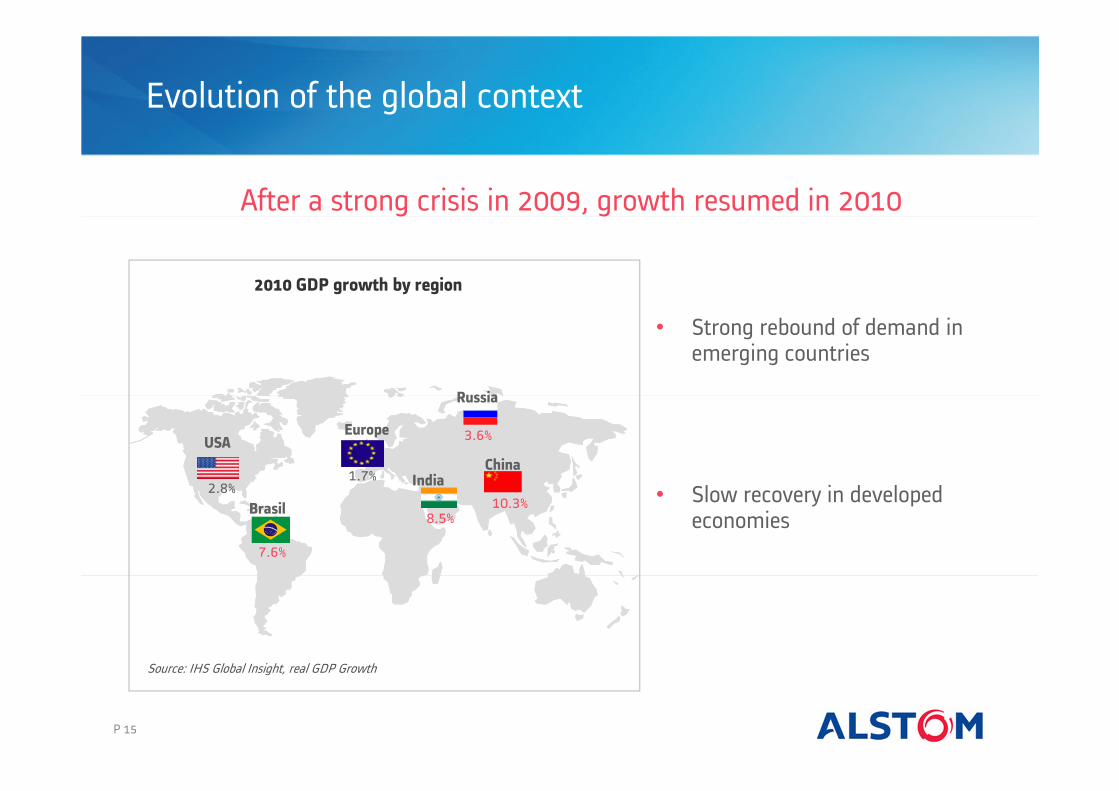
Evolution of the global context
After a strong crisis in 2009, growth resumed in 2010
• Strong rebound of demand in emerging countries
• Slow recovery in developed economies
2010 GDP growth by region
1.7%2.8%
8.5%10.3%
ChinaIndia
EuropeUSA
7.6%
3.6%
Russia
Brasil
Source: IHS Global Insight, real GDP Growth
P 16
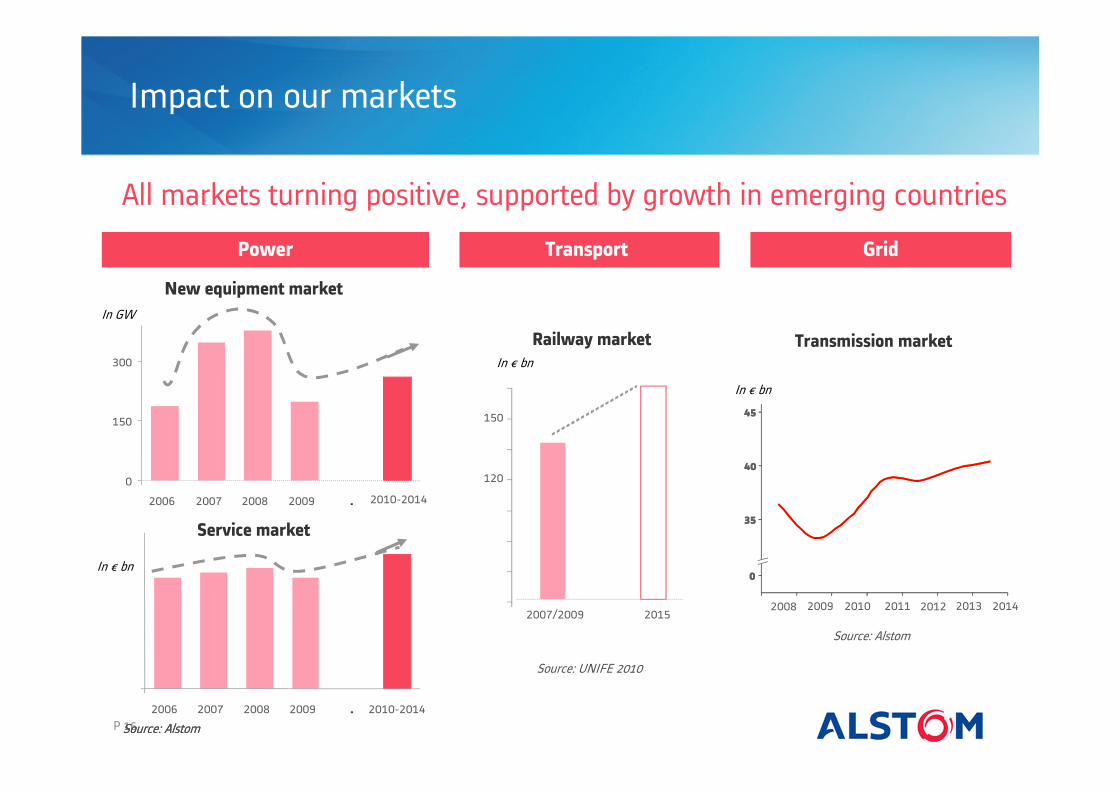
Impact on our markets
All markets turning positive, supported by growth in emerging countries
Grid
201420132008 2012201120102009
45
40
35
0
45
40
35
0
Transport
Railway market
Source: UNIFE 2010
2007/2009 2015
Source: Alstom
In € bn
Transmission market
Source: Alstom
120
In € bn
Power
Source: Alstom
0
2006 2007 2008 2009 . 2010-2014
0
150
300
2006 2007 2008 2009 . 2010-2014
150
In GW
In € bn
New equipment market
Service market
P 17
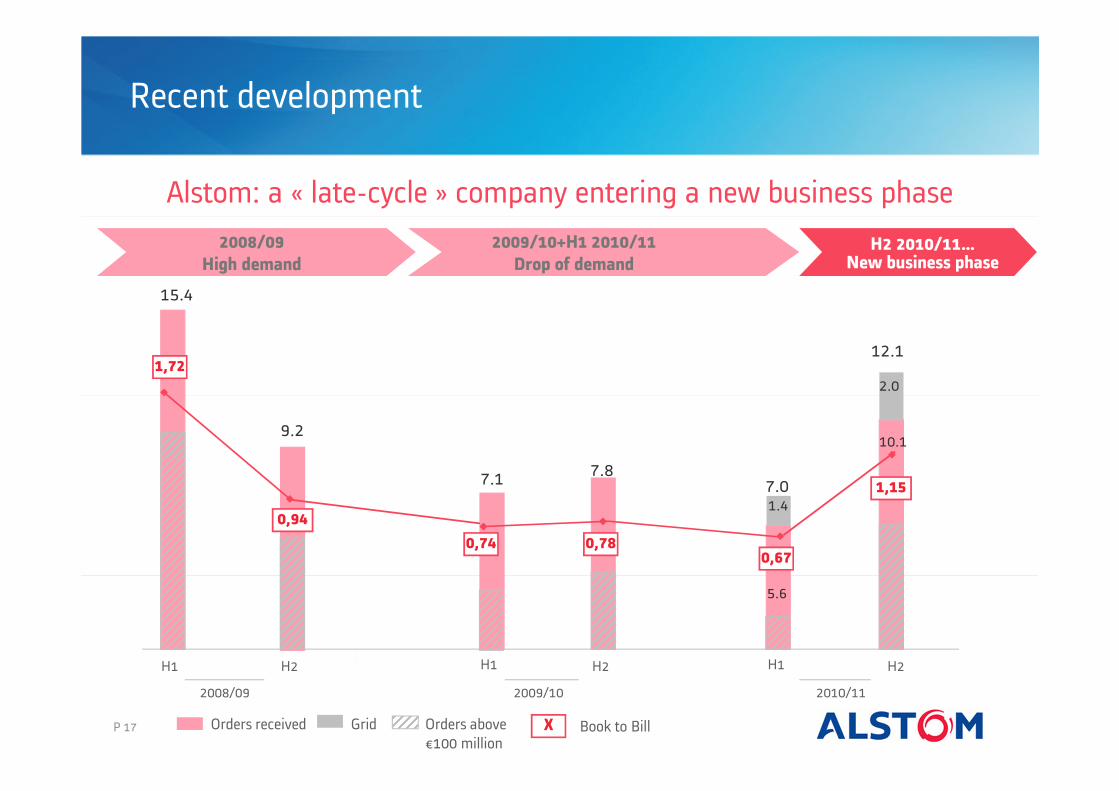
Recent development
Alstom: a « late-cycle » company entering a new business phase
H2 2010/11…New business phase
2008/09
High demand
2009/10+H1 2010/11
Drop of demand
15.4
9.2
7.1 7.8
5.6
10.1
1.4
2.0
7.0
12.1
H1 H2 H2
2008/09 2009/10 2010/11
H1 H1H2
Book to BillGridOrders received Orders above
€100 million
1,72
0,94
0,740,67
1,15
0,78
X
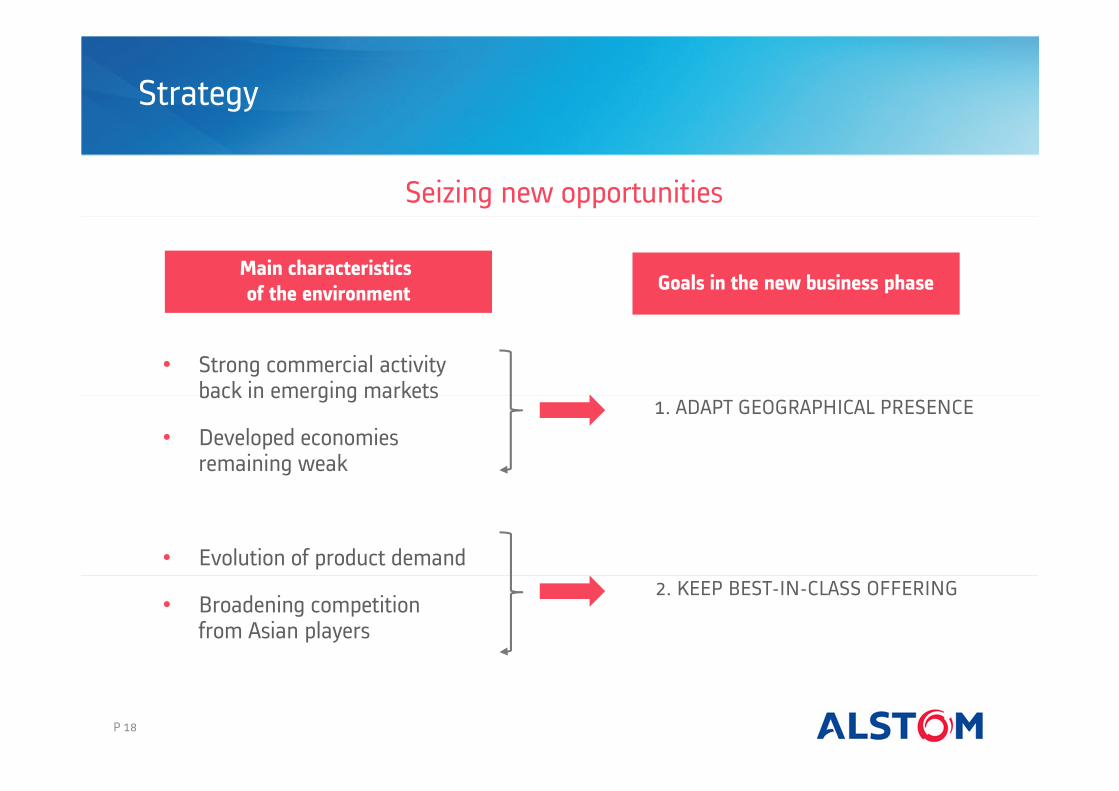
Strategy
Seizing new opportunities
• Strong commercial activity back in emerging markets
• Developed economies remaining weak
• Evolution of product demand
• Broadening competition from Asian players
Main characteristics
of the environment
1. ADAPT GEOGRAPHICAL PRESENCE
Goals in the new business phase
2. KEEP BEST-IN-CLASS OFFERING
P 18
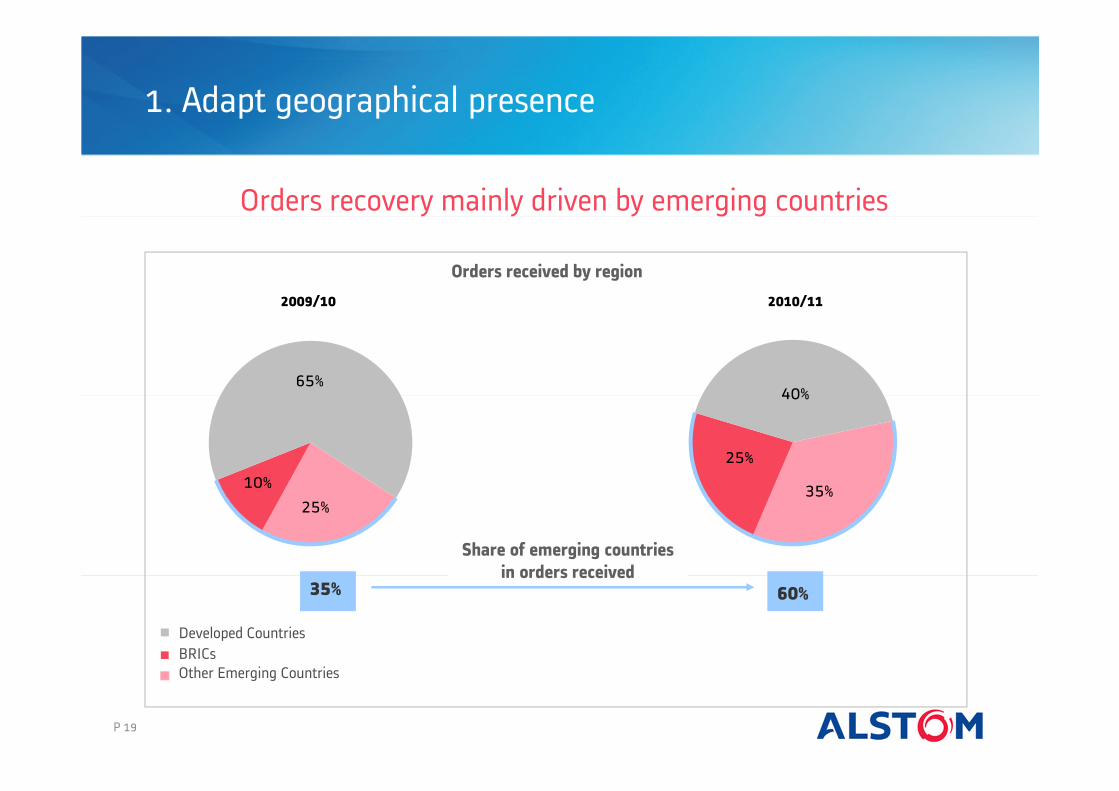
1. Adapt geographical presence
Orders recovery mainly driven by emerging countries
Orders received by region
Other Emerging Countries
Developed Countries
BRICs
2009/10 2010/11
60%35%
Share of emerging countries
in orders received
40%
25%
35%
65%
10%
25%
P 19

P 20
Footprint
Grid
Power
Transport
New partnership in India
under discussion
1. Adapt geographical presence
Strengthening presence in BRICs
JV with Atomenergomash
JV with Transmasholding
New partnership in Kazakhstan
Partnerships signed in
2010/11
Existing partnerships
New partnerships in Russia
INTER RAOUES
Rostechnologies
&JV with Bharat Forge
Cooperation agreement with BHEL
JV with NTPC in Service
Grid n°1 in India
JV with Bardella
5 JV Transport + partnerships for EMUs
and locomotives
3 JV Power + partnership in nuclear
9 JV Grid
New partnerships in China
MOR
Global partnership
with SEC in boilers*
* April 2011
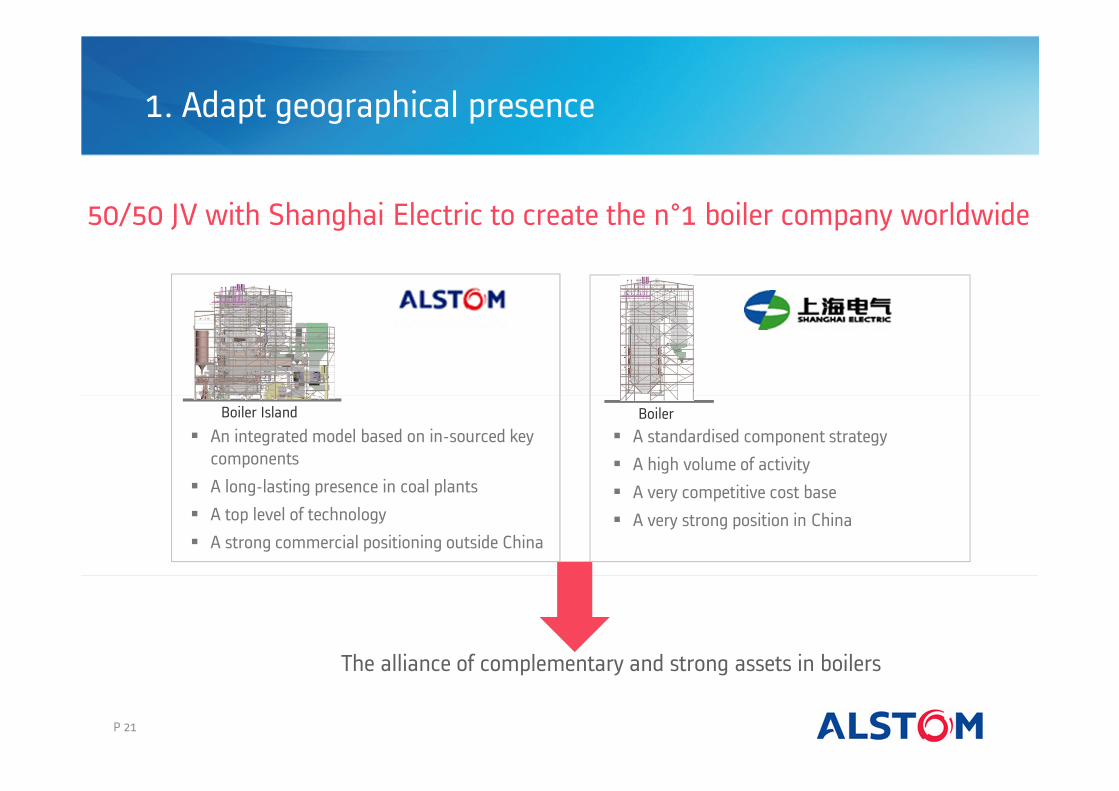
P 21
The alliance of complementary and strong assets in boilers
� An integrated model based on in-sourced key
components
� A long-lasting presence in coal plants
� A top level of technology
� A strong commercial positioning outside China
� A standardised component strategy
� A high volume of activity
� A very competitive cost base
� A very strong position in China
50/50 JV with Shanghai Electric to create the n°1 boiler company worldwide
Boiler Boiler Island
1. Adapt geographical presence
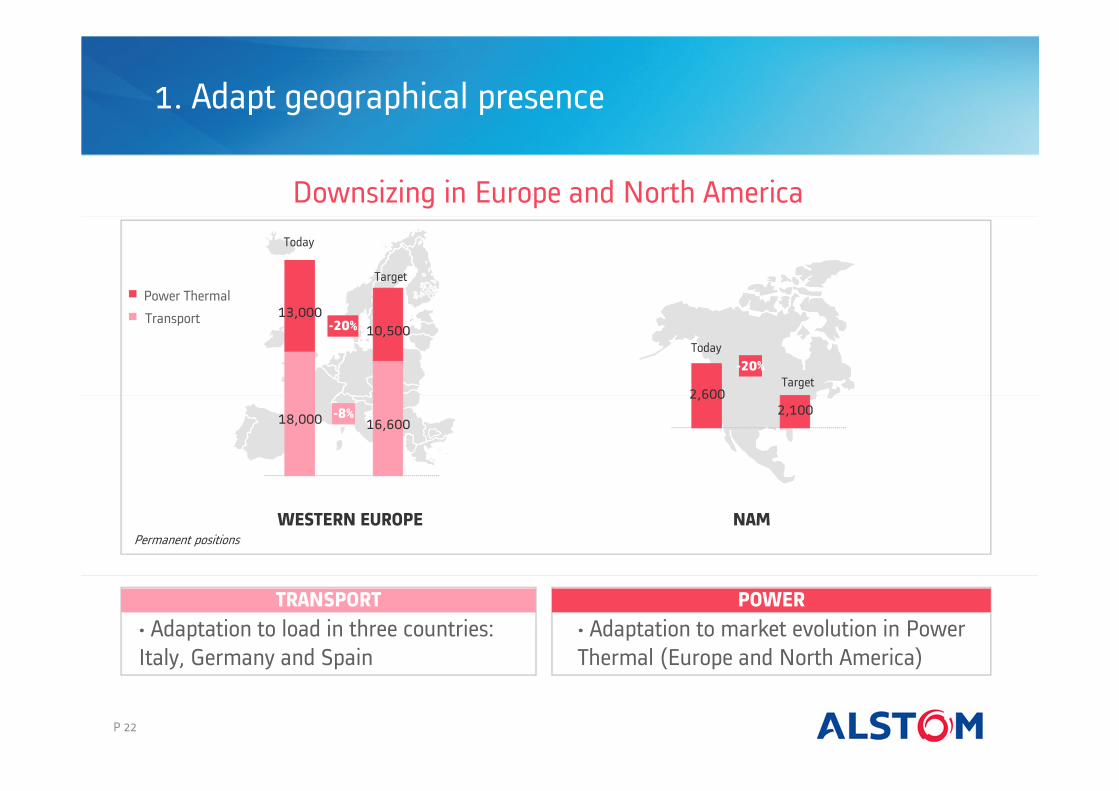
Downsizing in Europe and North America
-20%
18,000 16,600
13,00010,500
-8%
WESTERN EUROPE
POWERTRANSPORT
• Adaptation to market evolution in Power
Thermal (Europe and North America)
• Adaptation to load in three countries:
Italy, Germany and Spain
Transport
Power Thermal
Permanent positions
NAM
2,6002,100
-20%
1. Adapt geographical presence
Today
Target
Today
Target
P 22
P 23
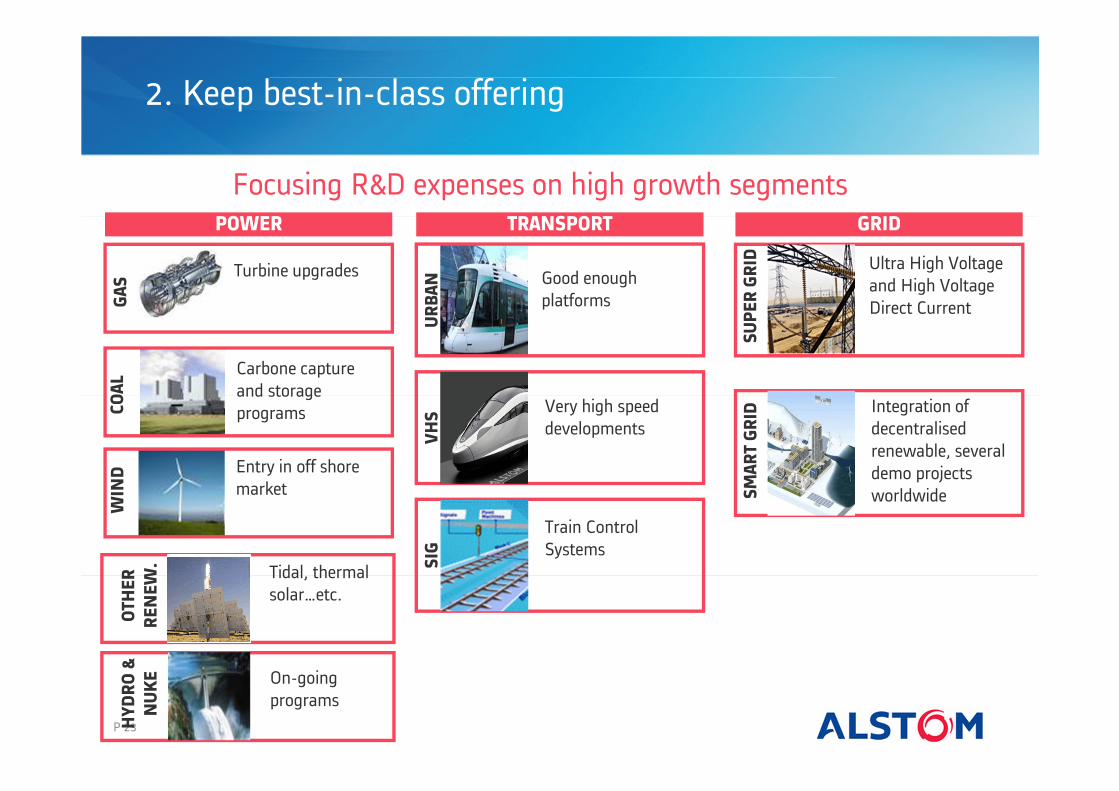
2. Keep best-in-class offering
POWER TRANSPORT
GAS
CO
AL
WIN
D
UR
BAN
VH
SSIG
Focusing R&D expenses on high growth segments
Turbine upgrades
OTH
ER
REN
EW
.
Carbone capture
and storage
programs
Entry in off shore
market
Tidal, thermal
solar…etc.
Good enough
platforms
HYD
RO
&
NU
KE On-going
programs
Very high speed
developments
Train Control
Systems
GRID
SU
PER
GR
IDSM
AR
T G
RID
Ultra High Voltage
and High Voltage
Direct Current
Integration of
decentralised
renewable, several
demo projects
worldwide

Strong assets to differentiate from competition
• Strong service activity
• Over 35% of Power’s sales
• 20% of Transport’s sales
• Modest in Grid
• Systems/turnkey capabilities
• Quality and experience
2. Keep best-in-class offering
Coal Boiler
Steam turbineand Turbogenerator
Dust collector
Combustionsystem
Desulphurisationsystem
Denitrificationsystem
P 24
P 25
Agenda
1. Our activities
3. Conclusion
4. Appendices
2. Recent developments
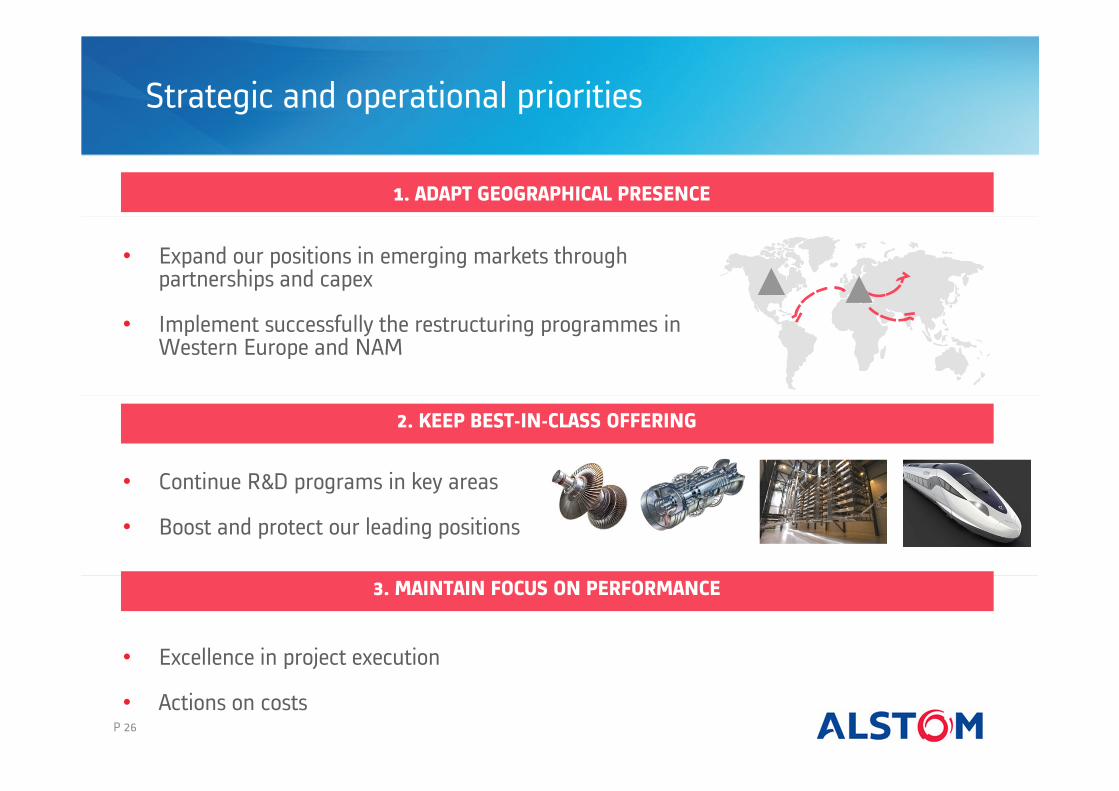
Strategic and operational priorities
• Continue R&D programs in key areas
• Boost and protect our leading positions
• Expand our positions in emerging markets through partnerships and capex
• Implement successfully the restructuring programmes in Western Europe and NAM
1. ADAPT GEOGRAPHICAL PRESENCE
2. KEEP BEST-IN-CLASS OFFERING
3. MAINTAIN FOCUS ON PERFORMANCE
• Excellence in project execution
• Actions on costs P 26
P 27
Outlook
• On-going recovery of orders
• Operating margin guidance confirmed: between 7% and 8%
Outlook for 2011/12

P 28
Agenda
1. Our activities
3. Conclusion
4. Appendices
2. Recent developments
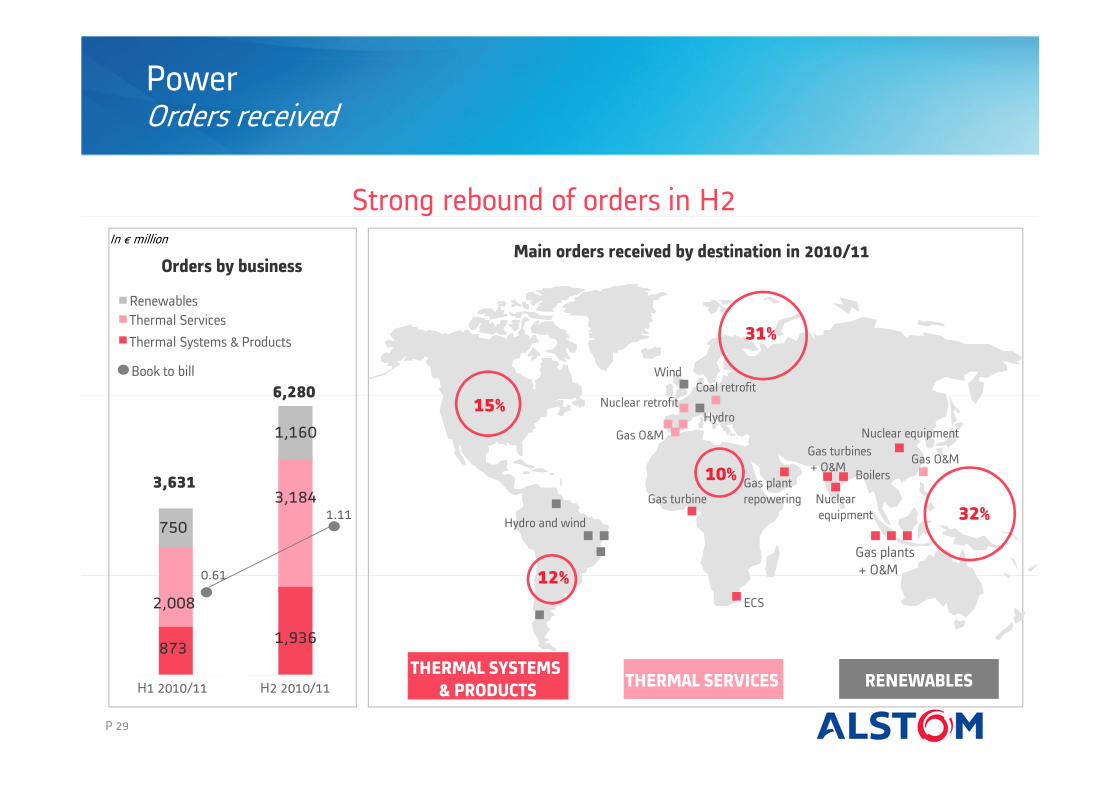
PowerOrders received
Strong rebound of orders in H2
H1 2010/11 H2 2010/11
Renewables
Thermal Services
Thermal Systems & Products
Book to bill
0.61
1.11
2,008
873
750
Orders by business
P 29
Main orders received by destination in 2010/11
Wind
Gas O&M
Nuclear retrofit Coal retrofit
Gas plant
repowering
Nuclear equipment
Gas plants
+ O&M
ECS
Gas O&M
Hydro and wind
THERMAL SERVICESTHERMAL SYSTEMS
& PRODUCTSRENEWABLES
1,936
1,160
3,184
6,280
3,631 10%
32%
31%
15%
12%
Gas turbines
+ O&M Boilers
Nuclear
equipment
Hydro
Gas turbine
In € million
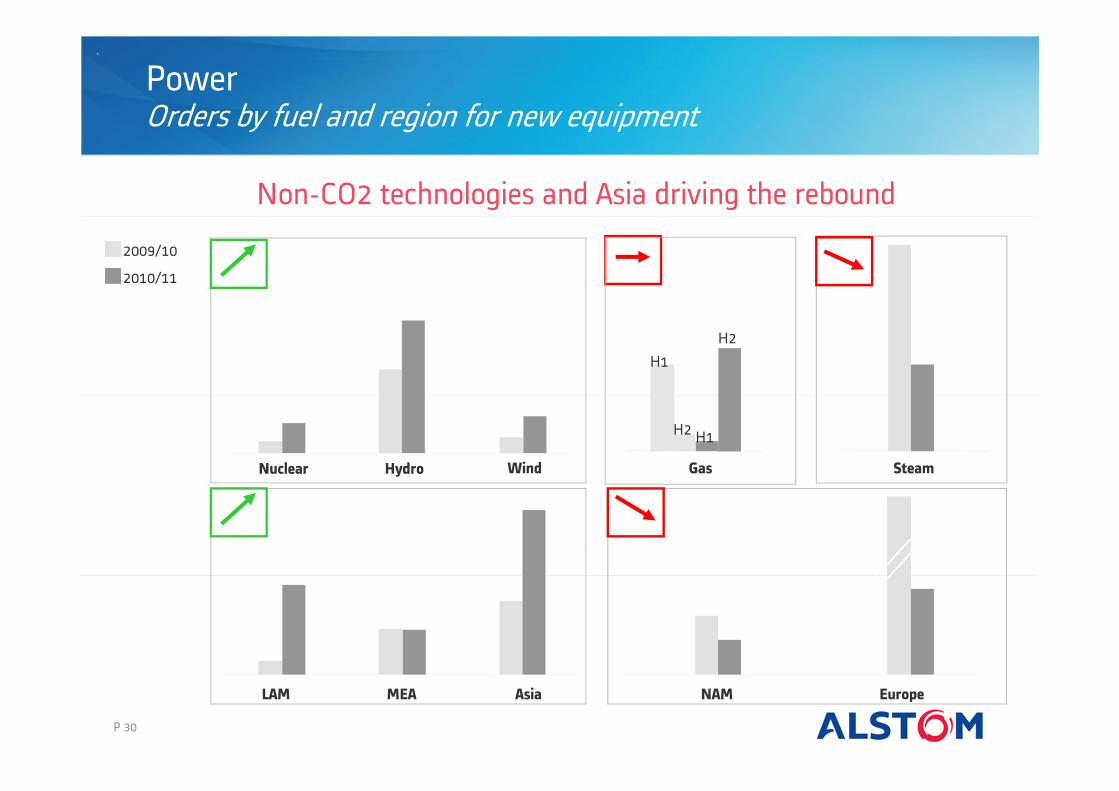
PowerOrders by fuel and region for new equipment
Non-CO2 technologies and Asia driving the rebound
P 30
2009/10
2010/11
HydroNuclear Wind Gas Steam
NAM EuropeAsiaMEALAM
H1
H2H1
H2

PowerService orders
Breakdown of Thermal Services orders
Service orders all time high in 2010/11
In € million
Q1 Q2 Q3 Q4
Regular service
2010/11
1 Bn€
Operation & Maintenance contracts
Retrofit
1,203
805
1,5641,620
2009/10 2010/11
Thermal Systems & Products and Renewables
Thermal Services
4,018
5,192
In € million
Evolution of Power orders
P 31
P 32
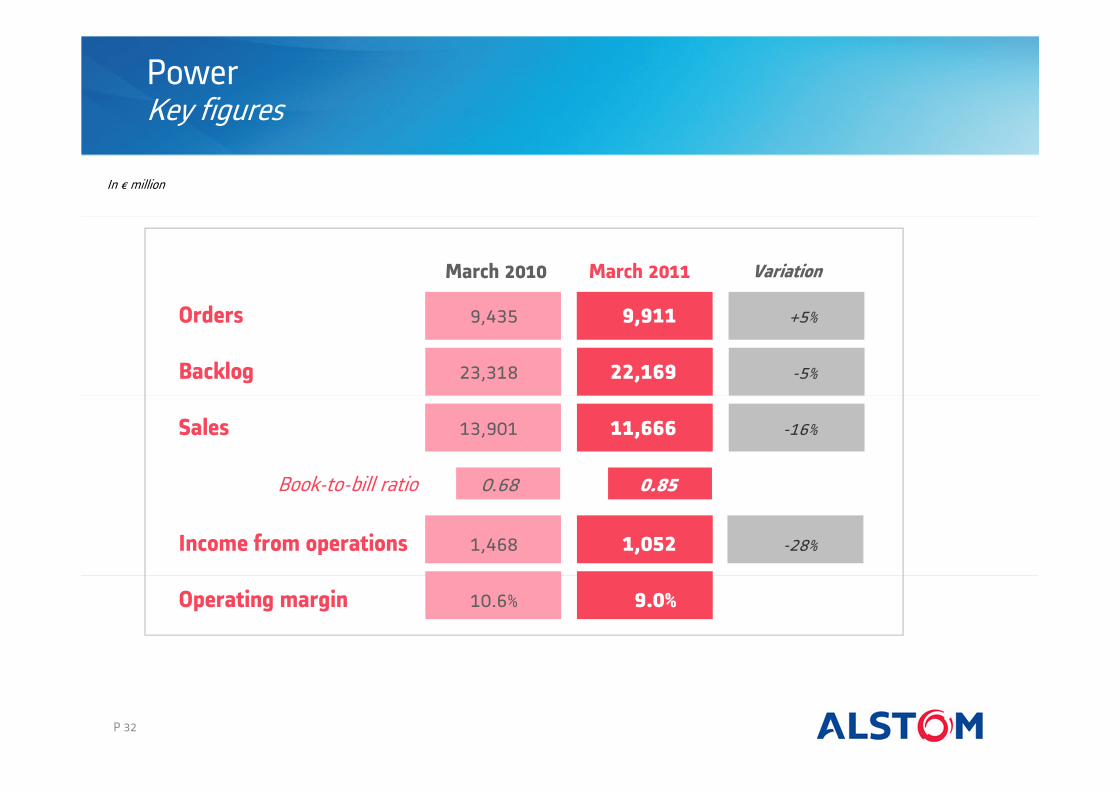
In € million
March 2010 March 2011 Variation
PowerKey figures
Orders 9,435 9,911 +5%
Backlog 23,318 22,169 -5%
Sales 13,901 11,666 -16%
Book-to-bill ratio 0.68 0.85
Income from operations 1,468 1,052 -28%
Operating margin 10.6% 9.0%

P 33
PowerMain events: technology
Focus on Renewables and Services
• Exclusive agreement with EDF Energies Nouvelles for offshore development in France
WIND THERMAL SOLAR
TIDAL
• Investment in Brightsource Energy
• Centre set up in Nantes (France)
• Tidal turbine prototype to be tested
SERVICE / RETROFIT
• Strengthening protfolio

P 34
PowerMain events: capex
Capex programmes
314
In € million
2009/10 2010/11
Investments in BRICs
HYDRO WIND STEAM
Extension of hydro power
factory in China
Construction of a wind
assembly facility in Brazil
Erection of a steam
turbines plant in India,
together with Bharat Forge
222
Capex
P 35
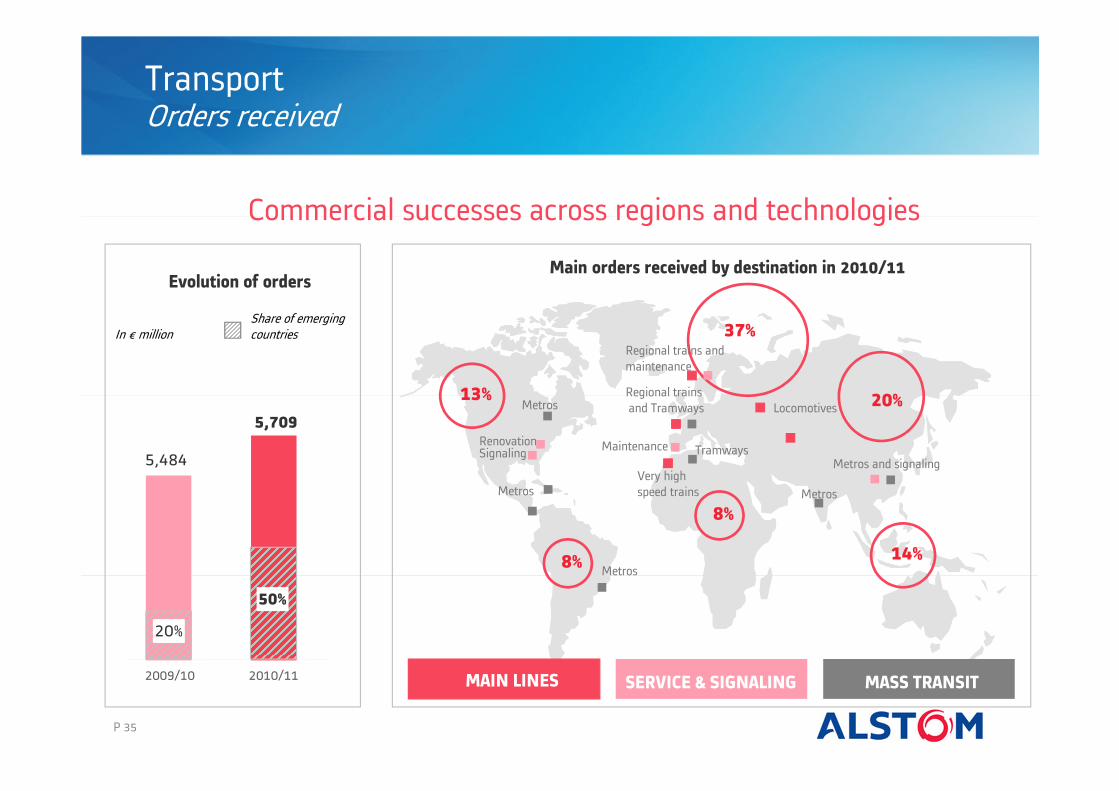
TransportOrders received
Evolution of ordersMain orders received by destination in 2010/11
5,484
2009/10 2010/11
In € million
Commercial successes across regions and technologies
Share of emerging countries
Metros
Very high
speed trains
Locomotives
Metros and signaling
SERVICE & SIGNALINGMAIN LINES
Metros
MASS TRANSIT
5,709
8%
14%
13%
8%
37%
Maintenance
Regional trains and
maintenance
Signaling
Regional trains
and Tramways
50%
20%
20%
Renovation
Metros
Metros
Tramways
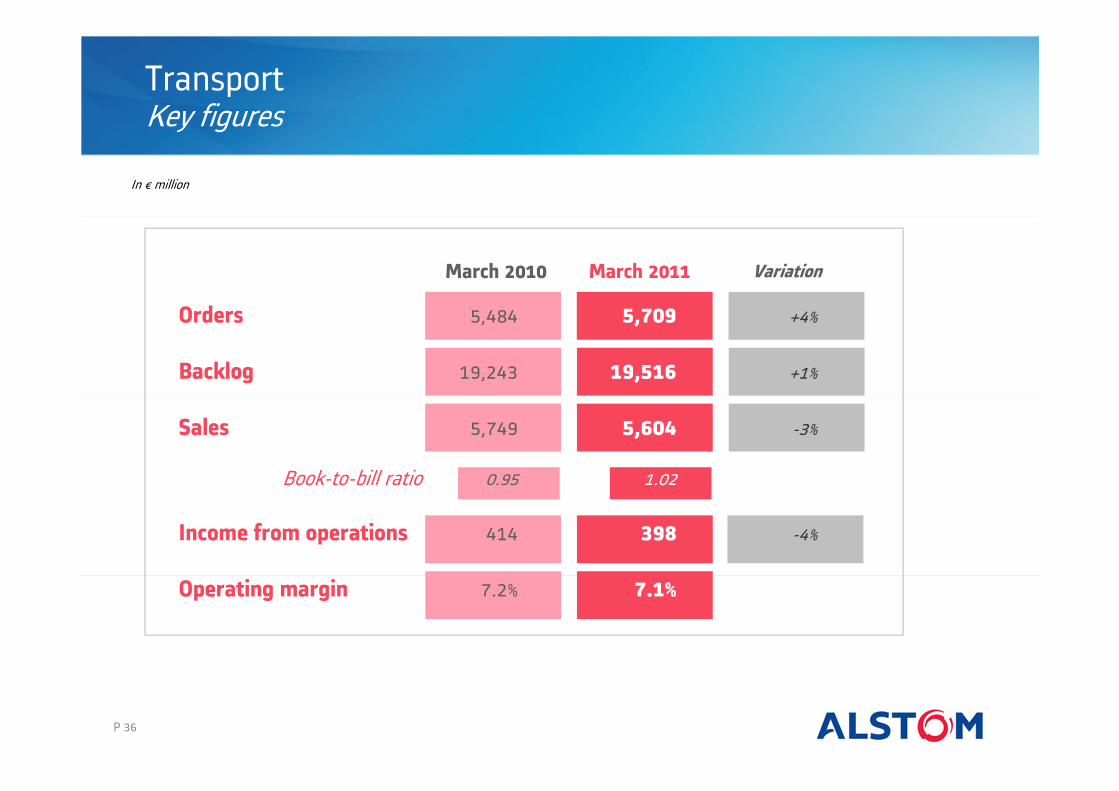
TransportKey figures
March 2010 March 2011 Variation
In € million
Orders 5,484 5,709 +4%
Backlog 19,243 19,516 +1%
Sales 5,749 5,604 -3%
Book-to-bill ratio 0.95 1.02
Income from operations 414 398 -4%
Operating margin 7.2% 7.1%
P 36
P 37
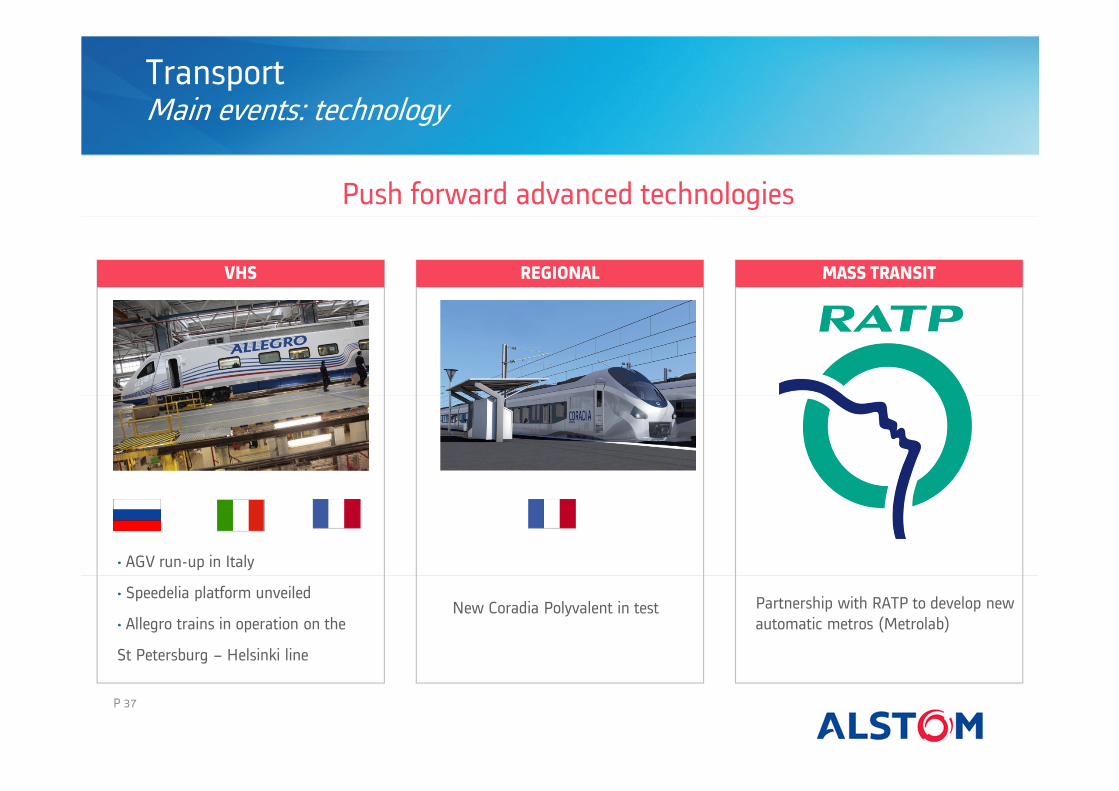
TransportMain events: technology
Push forward advanced technologies
REGIONAL
Partnership with RATP to develop new
automatic metros (Metrolab)New Coradia Polyvalent in test
MASS TRANSIT
• AGV run-up in Italy
• Speedelia platform unveiled
• Allegro trains in operation on the
St Petersburg – Helsinki line
VHS
P 38
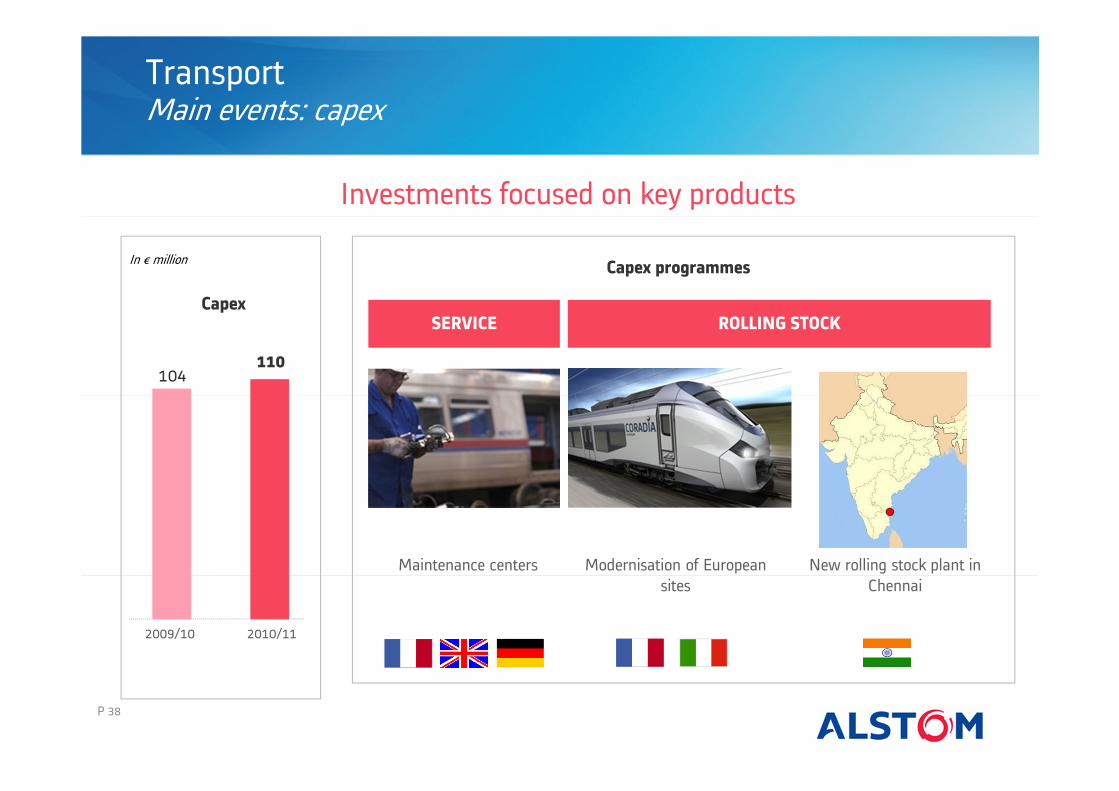
TransportMain events: capex
104
In € million
2009/10 2010/11
Investments focused on key products
Capex programmes
SERVICE ROLLING STOCK
New rolling stock plant in
Chennai
Modernisation of European
sites
Maintenance centers
Capex
110
P 39
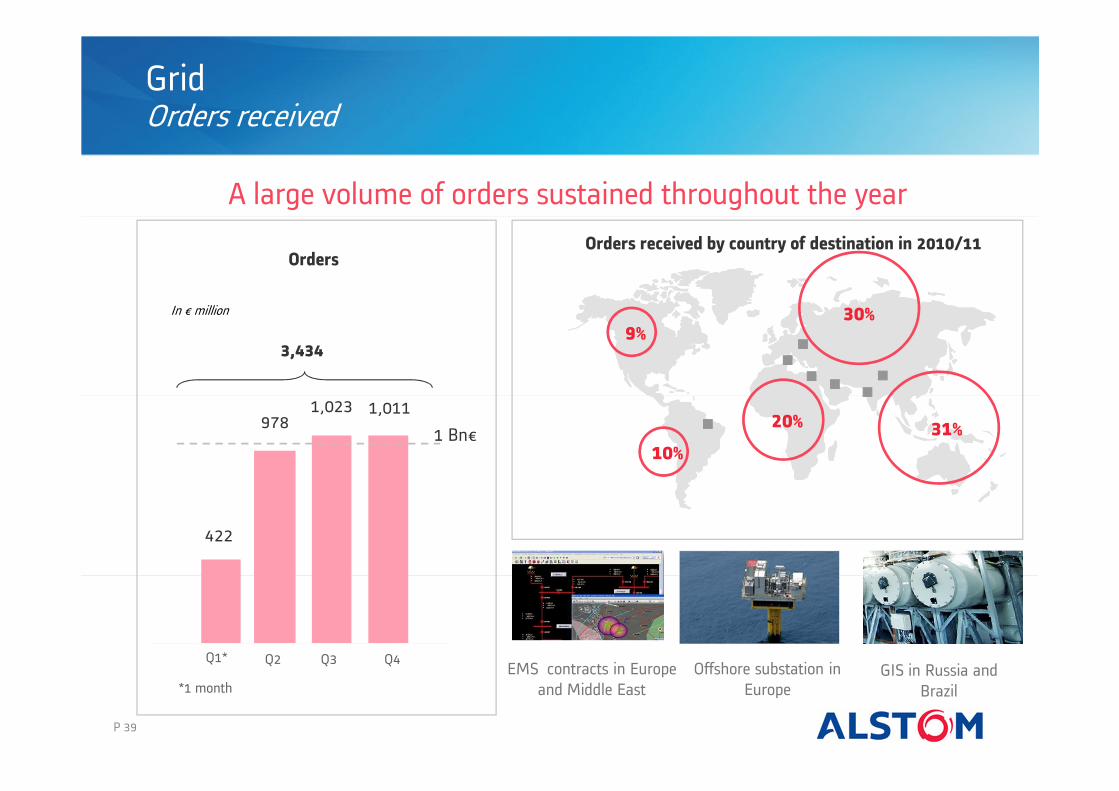
GridOrders received
OrdersOrders received by country of destination in 2010/11
Q1*
In € million
A large volume of orders sustained throughout the year
Q2 Q3 Q4
1 Bn€
GIS in Russia and
Brazil
EMS contracts in Europe
and Middle East*1 month
Offshore substation in
Europe
1,0111,023978
422
30%
31%20%
9%
10%
3,434

GridKey figures
March 2011
In € million
Orders 3,434
Backlog 5,131
Sales 3,653
Book-to-bill ratio 0.94
Income from operations 218
Operating margin 6.0%
P 40

GridMain events: technology
Acquisitions and partnerships focused on smarter grid management
Creation with Bouygues of Embix, JV to
develop energy management services
for eco-districts
Partnership with Microsoft for the
Smart Management of Renewable
Energy Sources
Acquisition of Uisol, a supplier of
software platform for demand
response management
Acquisition of Psymetrix, a specialist in
Smart Grid applications
P 41

P 42
GridMain events: capex
In € million
2010/11
Capex programmes
Ultra High Voltage Technology
Centre Shanghai, China
Power transformer facilities
upgrades
UHVPOWER
TRANSFORMERS
GAS INSULATED
SWITCHGEARS
Expansion of industrial footprint
125
GIS facilities extension
Capex
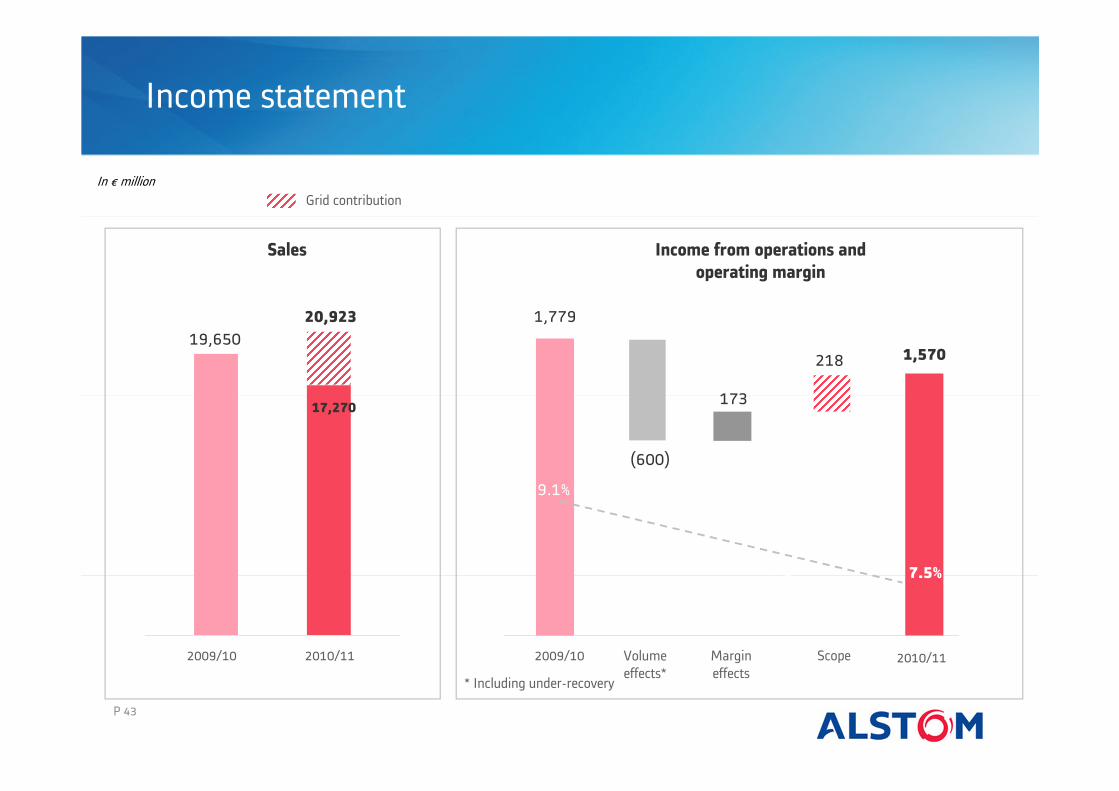
P 43
Income statement
Sales Income from operations and
operating margin
In € million
2009/10 2010/11
19,650
17,270
20,923
Volume
effects*
Margin
effects
Scope 2010/11 2009/10
Grid contribution
* Including under-recovery
1,779
1,570
9.1%
7.5%
218
(600)
173
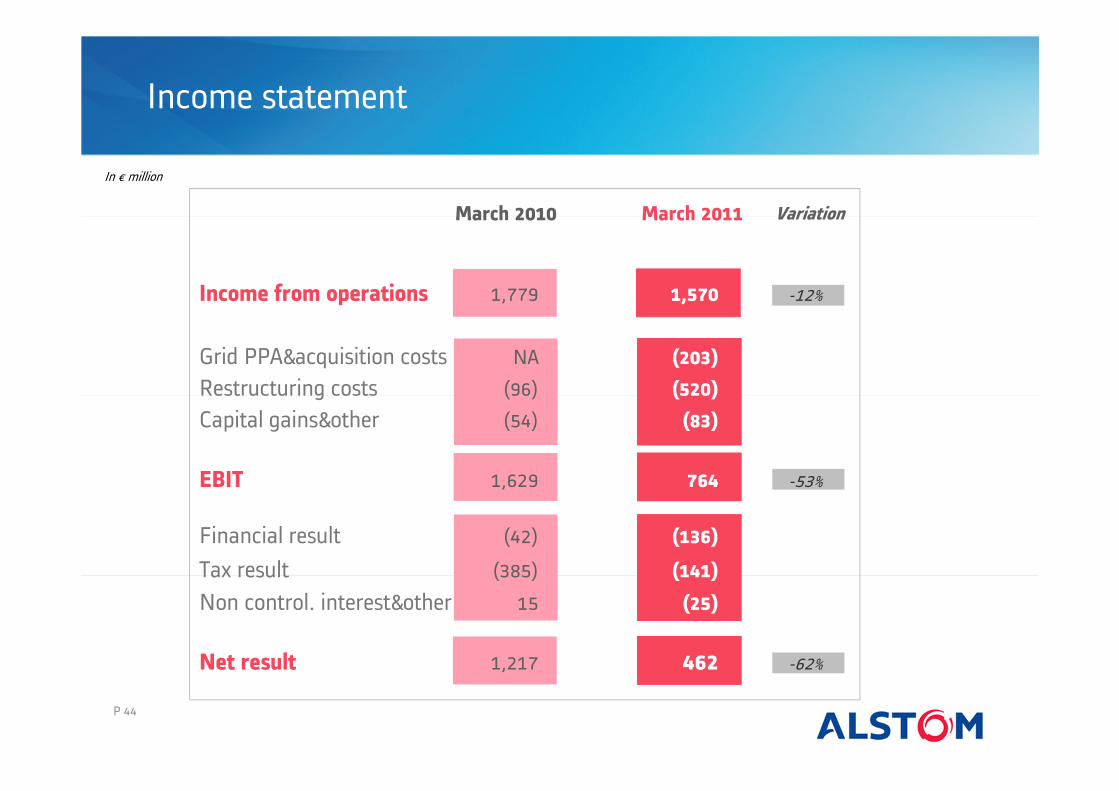
Income statement
P 44
In € million
March 2010 March 2011 Variation
Income from operations 1,779 1,570 -12%
Grid PPA&acquisition costs NA (203)
Restructuring costs (96) (520)
Capital gains&other (54) (83)
EBIT 1,629 764 -53%
Financial result (42) (136)
Tax result (385) (141)
Non control. interest&other 15 (25)
Net result 1,217 462 -62%

P 45
Free cash flow
In € million
March 2010 March 2011
Income from operations 1,779 1,570
Restructuring cash out (112) (106)
Depreciation 278 353
Capital expenditure (470) (504)
R&D cap. & amort. of acq. Techno. (56) (121)
Pensions (63) (120)
Change in working capital (953) (1,157)
Tax cash out (191) (248)
Financial cash out (18) (121)
Other (9) (62)
Free cash flow 185 (516)
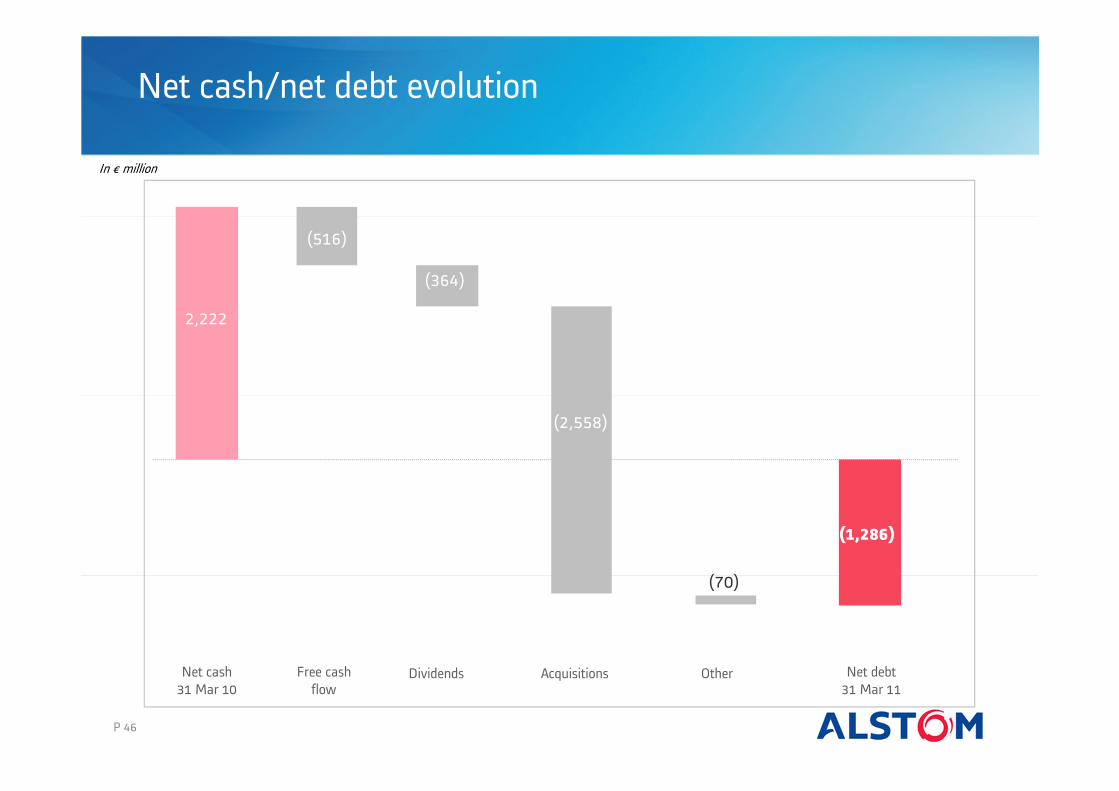
Net cash/net debt evolution
In € million
Net cash
31 Mar 10
Free cash
flowDividends Acquisitions Other Net debt
31 Mar 11
2,222
(516)
(364)
(2,558)
(70)
(1,286)
P 46
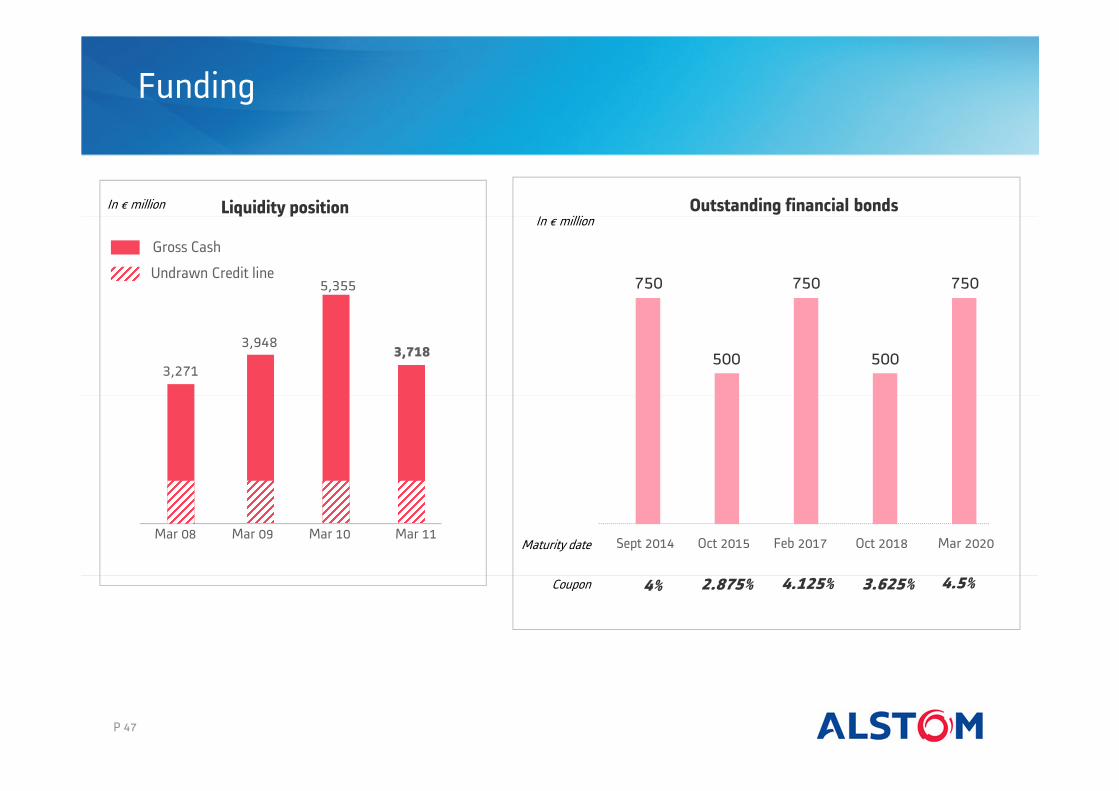
Undrawn Credit line
Gross Cash
Mar 11Mar 08 Mar 09 Mar 10
3,271
3,948
5,355
Liquidity position
3,718
Outstanding financial bondsIn € million
Oct 2015 Feb 2017 Mar 2020
4% 4.125% 4.5%
Maturity date Sept 2014 Oct 2018
2.875% 3.625%Coupon
In € million
750
500500
750750
Funding
P 47
P 48
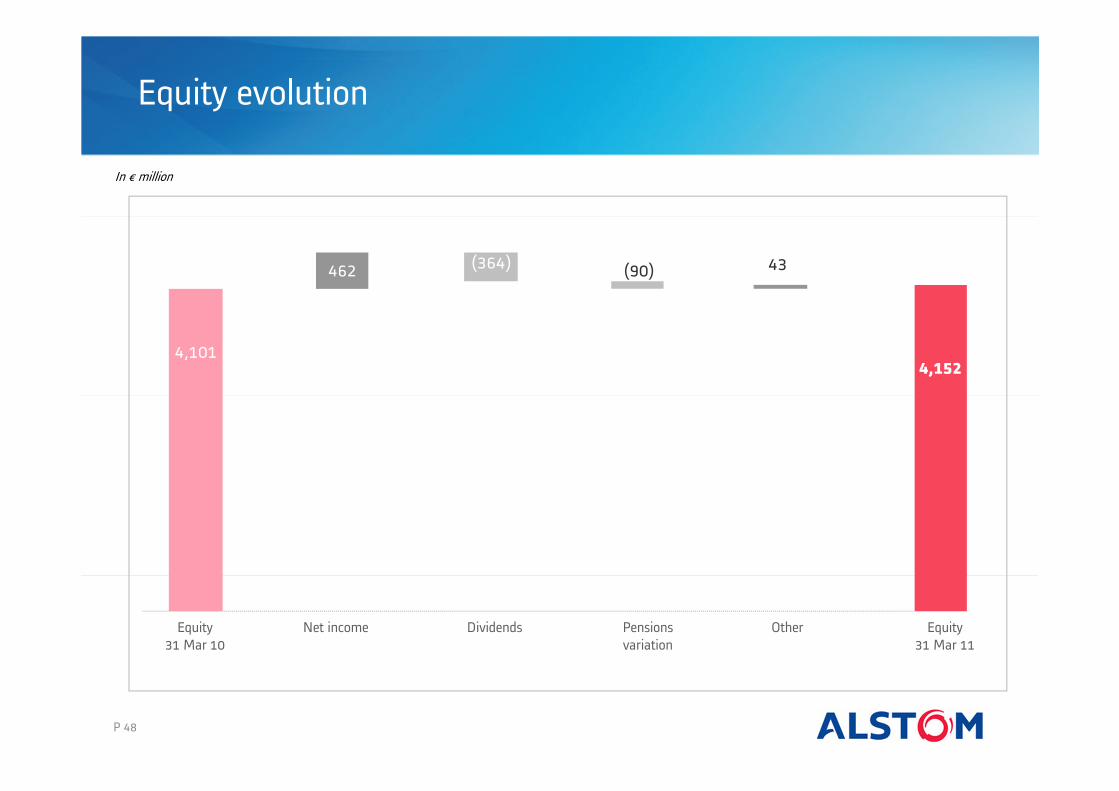
Equity evolution
In € million
Equity
31 Mar 10
Net income Dividends Pensions
variation
Other Equity
31 Mar 11
4,101
462 (364) (90) 43
4,152

P 49
Pensions
In € million
Opening
1 Apr 10
Fair value of assets
Return
on assetsNet cash
out
FX
& other
Closing
31 Mar 11
In € million Defined benefit obligations
Service
costs
Discounting
& actuarial losses
FX
& other
Closing
31 Mar 11Net cash
out
Underfunding status
(917)
In € million
Opening
1 Apr 10
Closing
31 Mar 11
3,334
(1,129)
3,7633,334190
(47)
82 3,763
4,25174
382
(258)
61 4,892
Opening
1 Apr 10
Grid
opening
204
Grid(178)
Grid
opening
382

P 50
In € per share
Evolution of dividend
0% 25% 27%
Dividend
Pay-out ratio
2006/07* 2007/08* 2008/09 2009/10
1.121.24
2005/06
29% 30%
(*) Adjusted from the split
(**) To be proposed to the next AGM
0.80
0.40
Annual General Meeting: 28 June 2011
Ex-date: 30 June 2011
Record date: 4 July 2011
Payment date: 5 July 2011
2010/11
40%
0.62**

P 51
Contacts & agenda
• 28/06/2011 Annual General Meeting
• 20/07/2011 Orders and sales for the first quarter of FY2011/12
• Emmanuelle Châtelain - VP Investor Relations
+33 (0)1 41 49 37 38
• Juliette Langlais - Deputy VP Investor Relations
+33 (0)1 41 49 21 36
• Emmanuelle Douëzy - Individual Shareholders
+33 (0)1 41 49 37 59
• Dymphna Hawksley, Christel Cillard - Logistics
+33 (0)1 41 49 37 22/35 24
P 52
Disclaimer
This presentation contains forward-looking statements which are based on currentplans and forecasts of Alstom’s management. Such forward-looking statements areby their nature subject to a number of important risk and uncertainty factors (suchas those described in the documents filed by Alstom with the French AMF) thatcould cause actual results to differ from the plans, objectives and expectationsexpressed in such forward-looking statements. These such forward-lookingstatements speak only as of the date on which they are made, and Alstomundertakes no obligation to update or revise any of them, whether as a result ofnew information, future events or otherwise.

www.alstom.com